Embed Size (px)
Citation preview

HANDBOOK FOR THE
POST-EARTHQUAKE SAFETY EVALUATION OF
BRIDGES AND ROADS
Prepared for the Indiana Department of Transportation, INDOT
by
Julio A. RAMIREZ, Robert J. FROSCH, Mete A. SOZEN, A. Murat TURK
School of Civil Engineering, Purdue University under the
JTRP Contract No. 2377
March 2000

ii

iii
DISCLAIMER
While the information presented in this handbook is believed to be correct, authors and the
sponsoring agencies assume no responsibility for its accuracy or for the opinions expressed
herein. The material presented in this publication should not be used or relied upon for any
specific application without competent examination and verification of its accuracy, suitability,
and applicability by qualified professionals. Users of information from this publication assume
all liability arising from such use.

iv

v
PREFACE
In 1999, the Indiana Department of Transportation contracted, through the Joint Transportation
Research Program at the School of Civil Engineering in Purdue University, with Professor’s
Julio A. Ramirez, Robert J. Frosch and Mete A. Sozen to develop a training program for post-
earthquake safety evaluation of highway bridges.
Professor’s Julio A. Ramirez, Robert. J. Frosch, Mete A. Sozen, and Dr. A. Murat Turk, post-
doctoral research associate, prepared this manual and an accompanying training video that was
produced by the Center of Instructional Services of Purdue University. Overall view and
guidance for the project was provided by B. Rinard, W. Dittelberger and J. Thompson of the
Indiana Department of Transportation.
The principal investigators gratefully acknowledge the participation of Prof. Marc Eberhard from
University of Washington, Seattle in the preparation of this material.
Bridge damage examples and pictures were reproduced from; EQIIS Image Database,
Earthquake Engineering Research Center (EERC, University of California at Berkeley), Kandilli
Observatory and Earthquake Research Institute (KOERI, Bogazici University, Istanbul),
National Center for Research on Earthquake Engineering, Taiwan.

vi
vii
TABLE OF CONTENTS
Page
DISCLAIMER ………………………………………………………………………………….iii
PREFACE ……………..………………………………………………………………………....v
TABLE OF CONTENTS ……………………………………………………………………vii
LIST OF FIGURES …………………………………………………………………………..xi
1. INTRODUCTION …………………………………………………………………………….1
1.1. Object and Scope ….……………………………………………………………………… 1
1.2. Level 1 Inspection ……………………………………………………………………………3
1.3. Level 2 Inspection ……………………………………………………………………………3
2. EARTHQUAKE ENGINEERING PRINCIPLES …………………………………………7
2.1. Earthquakes…………………………………………………………………………………...7
2.2. The Structure of the Earth.………………………………………………………………
2.3. Seismic Waves ………………………………………………………………………………9
2.4. Bridge Behavior under Earthquake Excitation ……………………………………………14
3. SEISMICITY OF INDIANA ……………………………………………………………17
3.1. General ……………………………………………………………………………………17
3.2. Earthquake History of Indiana …………………………………………………………….20
4. INDIANA BRIDGE STRUCTURES ………………………………………………………25
5. POSSIBLE TYPES OF BRIDGE AND ROADWAY DAMAGE ……………………….33
5.1. General …………………………………………………………………………………….33
5.2. Classification of Damage …………………………………………………………………..33
5.3. Level 1 Examples of Bridge and Roadway Damage ……………………………………….35
5.4. Level 2 Behavior of Bridges under Earthquake Excitation …………………………………46

viii

ix
6. POST-EARTHQUAKE SAFETY EVALUATION PRACTICE FOR HIGHWAY
BRIDGES ……………………………………………………………………………………...55
6.1. Level 1 Inspection …………………………………………………………………………..55
6.2. Level 2 Inspection ………………………………………………………………………….59
6.3. Suggested Tools for the Evaluation Procedure …………………………………………….63
6.3.1. Suggested tools to perform Level 1 inspection ………………………………………63
6.3.2 Suggested tools to perform a detailed evaluation for Level 2 ……………………….64
6.4. Bridge Closing Procedure …………………………………………………………………66
7. TEMPORARY REPAIRS AND LONG TERM MONITORING TECHNIQUES ……..67
7.1. Temporary Repairs …………………………………………………………………………67
7.1.1. Transition Repair ……………………………………………………………………..68
7.1.2. Shoring ……………………………………………………………………………….69
7.2. Long Term Monitoring ……………………………………………………………………..74
7.2.1. Deflections ………………………………………………………………………….74
7.2.2. Cracks ………………………………………………………………………………..75
7.2.3. Strain …………………………………………………………………………………76
8. EVALUATION EXAMPLES ………………………………………………………………79
8.1. Level 1 Examples …………………………………………………………………………..79
8.1.1. Example 1 ……………………………………………………………………………79
8.1.2. Example 2 ……………………………………………………………………………85
8.1.3. Example 3 ……………………………………………………………………………87
8.2. Level 2 Examples …………………………………………………………………………..90
8.2.1. Example 1 ……………………………………………………………………………90
8.2.2. Example 2 ……………………………………………………………………………94
9. REFERENCES …………………………………………………………………………….101
APPENDIX …………………………………………………………………………………..103

x
xi
LIST OF FIGURES
Page
FIGURE 1.1 Flow-chart of Post-Earthquake Response Assessment …………………………….5
FIGURE 2.1 View of the layers of the Earth (20) ……………………………………………….10
FIGURE 2.2. The thickness of the layers of the Earth (20) …………………………………….10
FIGURE 2.3 The map of the plates on the Earth (21) ………………………………………….11
FIGURE 2.4 The cross section that illustrates the main types of plate boundaries (22) ………..11
FIGURE 2.5 The illustration of the seismic waves (24) ……………………………………….12
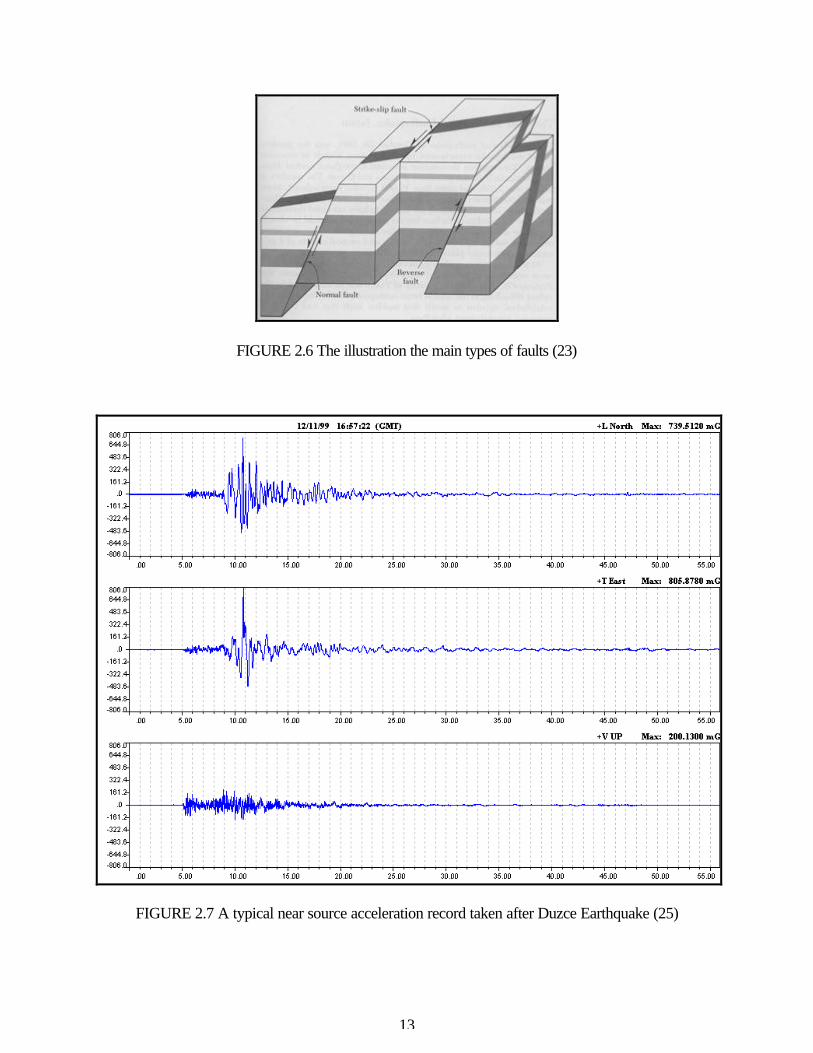
FIGURE 2.6 The illustration the main types of faults (23) ……………………………………..13
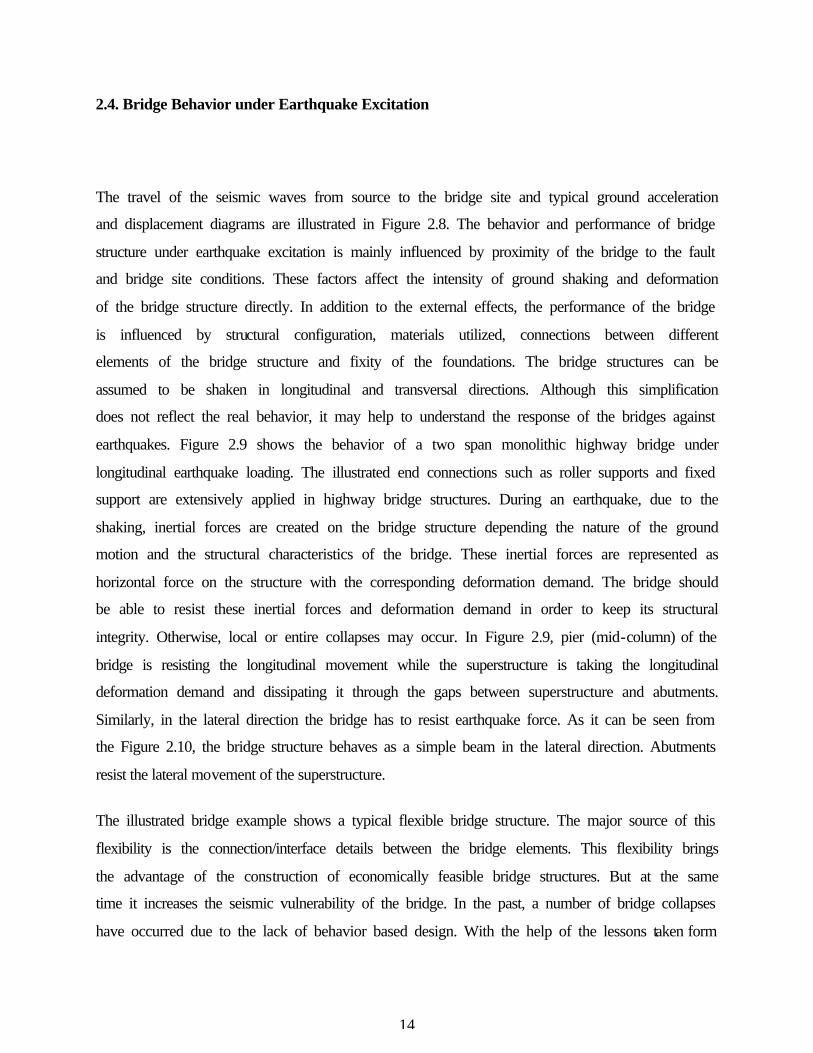
FIGURE 2.7 A typical near source acceleration record taken after Duzce Earthquake (25) ……13
FIGURE 2.8 The occurrence of the earthquake and traveling of the waves to the bridge site (1) 15
FIGURE 2.9 Typical longitudinal earthquake loading and deflected shape of a bridge (1) ……15
FIGURE 2.10 Typical lateral earthquake loading and deflected shape of a bridge (1) …………16
FIGURE 3.1 The view of the liquefaction mechanism and the map of Southern Indiana regions
where ancient sand blows have been found due to prehistoric earthquakes (28) ………………18
FIGURE 3.2 Approximate Epicenters Powerful Earthquakes since 1811-1812 (3) …………….19
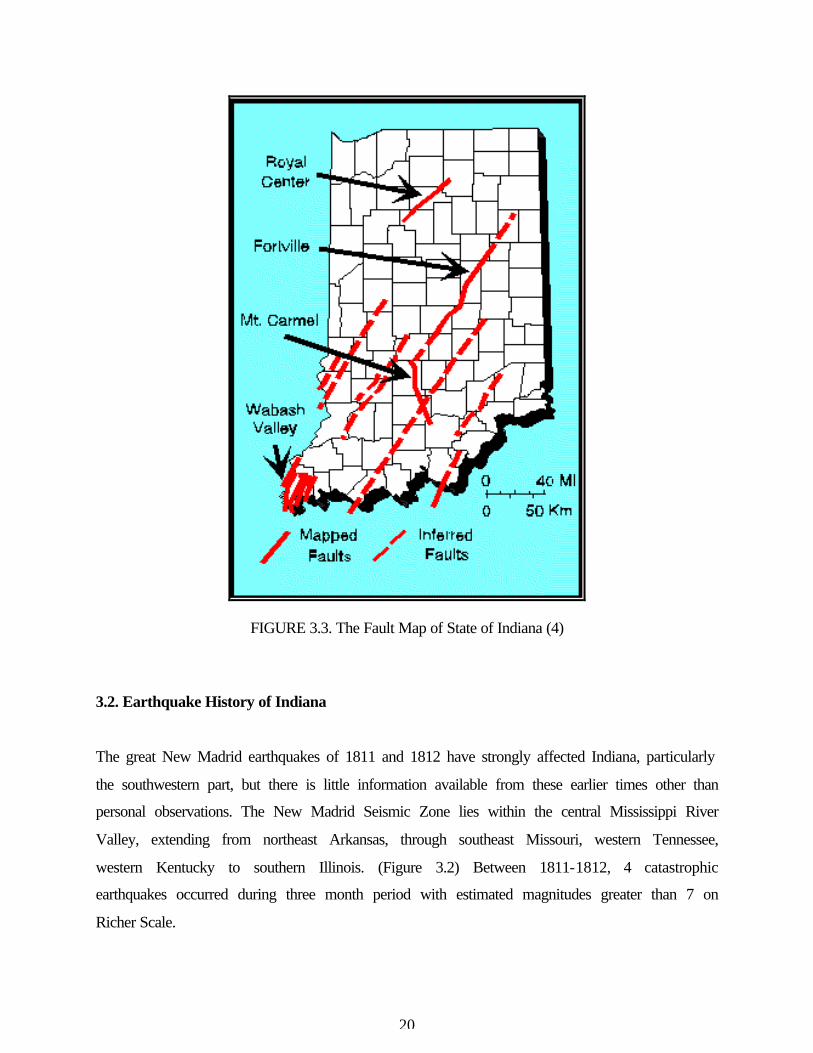
FIGURE 3.3. The Fault Map of State of Indiana (4) ……………………………………………20
FIGURE 3.4 The peak acceleration map with 10% probability of exceedance in 50 years. (5) ..24
FIGURE 3.5. Estimated MM intensity map for 6.5 magnitude earthquake in NMFZ (6) ………24
FIGURE 5.1 View of different structural parts of a typical highway bridge ……………………33
FIGURE 5.2. Damage classification tables for bridges …………………………………………34
FIGURE 5.3 Collapse of roadway due to slope failure after Duzce EQ 1999 (10) ……………..35
FIGURE 5.4 Collapse of roadway due to fault rupture after Izmit EQ 1999 (10) ……………..36
FIGURE 5.5 Failure of a prestressed concrete box beam bridge after Izmit EQ 1999 (10) …….36
FIGURE 5.6. Collapse of deck and piers after Taiwan Earthquake 1999 (15) …………………36
FIGURE 5.7. Failure of a monolithic RC girder bridge after Loma Prieta EQ 1989 (11) ………36
FIGURE 5.8 Collapse of RC girder bridge after Loma Prieta EQ 1989 (11) …………………..36
FIGURE 5.9 Collapse of bridge deck after Northridge 1994 (11) ………………………………36
FIGURE 5.10 Collapse of steel deck bridge after Kobe 1995 Earthquake (12) ……………….37
FIGURE 5.11 Excessive longitudinal movement of the bridge deck (15) ……………………..37

xii
FIGURE 5.12 The excessive transversal movement of bridge after Izmit EQ (10) …………….38
FIGURE 5.13 Excessive longitudinal movement of steel box girder bridge (11) ………………38
FIGURE 5.14 Excessive differential settlement of the backfill (1) …………………………….38
FIGURE 5.15 Lateral movement of prestressed RC box girders (10) …………………………..38
FIGURE 5.16 Longitudinal movement of RC box girders after Duzce EQ 1999 (10) ………….38
FIGURE 5.17 Vertical offset between decks after Northridge EQ 1994 (11) …………………39
FIGURE 5.18 Excessive movement of expansion joints after Taiwan EQ 1999 (15) …………..39
FIGURE 5.19 The expansion of the joints Taiwan EQ 1999 (15) ……………………………..39
FIGURE 5.20 The expansion of the joints after Loma Prieta Earthquake 1989 (11)……………39
FIGURE 5.21 Vertical and horizontal offset on a bridge after Northridge EQ. 1994 (11) ……..39
FIGURE 5.22 Settlement of Bridge (26) ………………………………………………………..40
FIGURE 5.23 Column failure (11) ……………………………………………………………40
FIGURE 5.24 Failure of RC e column (11) …………………………………………………….40
FIGURE 5.25 Failure of the bottom of the RC bridge column (11) ……………………………40
FIGURE 5.26 Failed RC bridge column (11) …………………………………………………..41
FIGURE 5.27 View of damaged RC bridge pier after Kobe Earthquake 1995 (13) ……………41
FIGURE 5.28 Heavy damage in RC bridge piers after Kobe Earthquake 1995 (14) ……………41
FIGURE 5.29 Shear crack in bents after Northridge Earthquake 1994 (11) ……………………41
FIGURE 5.30. Shear key failure of a bridge after Northridge Earthquake 1994 (11) …………..41
FIGURE 5.31 Buckling of steel girders (11) ……………………………………………………42
FIGURE 5.32 Movement of an abutment after Northridge Earthquake 1994 (11) ……………..42
FIGURE 5.33 Separation of abutment (11) ……………………………………………………..42
FIGURE 5.34 Transversal movement of abutment (11) ………………………………………..42
FIGURE 5.35 Pounding damage at abutment (11) ………………………………………………42
FIGURE 5.36 Failure of two anchor bolts for a girder after Northridge EQ 1994 (11) …………43
FIGURE 5.37 Failure of an elastomeric bearing due to longitudinal movement of girder (10)…43
FIGURE 5.38 Failure of elastomeric bearing and cracking of girder beam (10) ……………….43
FIGURE 5.39 View of a failed elastomeric bearing pad after Izmit EQ 1999 (10) ……………..43
FIGURE 5.40 Spalling near location of anchor bolts after Northridge Earthquake 1994 (11) ….43
FIGURE 5.41 Separation of soil at column base of a pier after Northridge EQ 1994 (11) …….44
FIGURE 5.42 Separation of column from the surrounding soil after Northridge EQ1994 (11) ..44
xiii
FIGURE 5.43 Disturbed soil at the base of column after Northridge EQ 1994 (11) ……………44
FIGURE 5.44 Barrier cracking after Northridge Earthquake 1994 (11) ……………………….44
FIGURE 5.45 Minor damage on the deck of a bridge after Northridge EQ 1994 (11) ………….45
FIGURE 5.46 Curb separation after Northridge Earthquake 1994 (11) ………………………..45
FIGURE 5.47 Collapse of asphalt pavement due to washout after Northridge EQ 1994 (11) ….45
FIGURE 5.48 Surface damage to highway pavement after Northridge EQ 1994 (11) ………….45
FIGURE 5.49 Settlement damage on approaches after Northridge EQ 1994 (11) ……………..45
FIGURE 5.50 The cracking of pavement due to pounding and settlement the bridge (15) …….46
FIGURE 5.51 Transversal movement of bridge deck after Taiwan EQ (15) ……………………46
FIGURE 5.52 View of RC bridge deck spalling after Taiwan EQ 1999 (11) …………………..46
FIGURE 5.53 Bearing movement and concrete spalling on the pier (11) ………………………46
FIGURE 5.54 Tilted rocker bearings (9) ………………………………………………………..47
FIGURE 5.55 Shift of bearings after collapse (11) ……………………………………………..47
FIGURE 5.56 Bearing movement (11) ………………………………………………………….47
FIGURE 5.57 Elastomeric bearing movement and spalling of girder concrete (10) ……………47
FIGURE 5.58 Sliding of elastomeric bearing (10) ………………………………………………47
FIGURE 5.59 Yield at pin support (in red color) (11) …………………………………………48
FIGURE 5.60 Buckling of web near lower flange and crack in pedestal (11) …………………..48
FIGURE 5.61 Local buckling of beam web near haunch (11) ………………………………….48
FIGURE 5.62 Damage at the bottom of the RC collector beam (11) ……………………………48
FIGURE 5.63 Buckling in the girder due to pounding (11) ……………………………………49
FIGURE 5.64 Steel box girder movement and collapse of bearings (11) ………………………49
FIGURE 5.65 Heavy damage in RC box girder bridge (15) …………………………………….49
FIGURE 5.66 Yielding at bolted connector beam (11) ………………………………………….49
FIGURE 5.67 Twisted steel braces (11) …………………………………………………………50
FIGURE 5.68 Shear cracks at the RC bridge girder near support (26) ………………………….50
FIGURE 5.69 Abutment slumping after Taiwan EQ 1999 (26) …………………………………50
FIGURE 5.70 Large cracks at abutment wing wall and slope (26) ……………………………50
FIGURE 5.71 Separation of the RC superstructure and the abutment (11) ……………………..50
FIGURE 5.72 Pounding of steel girder to the abutment (11) ……………………………………50

xiv
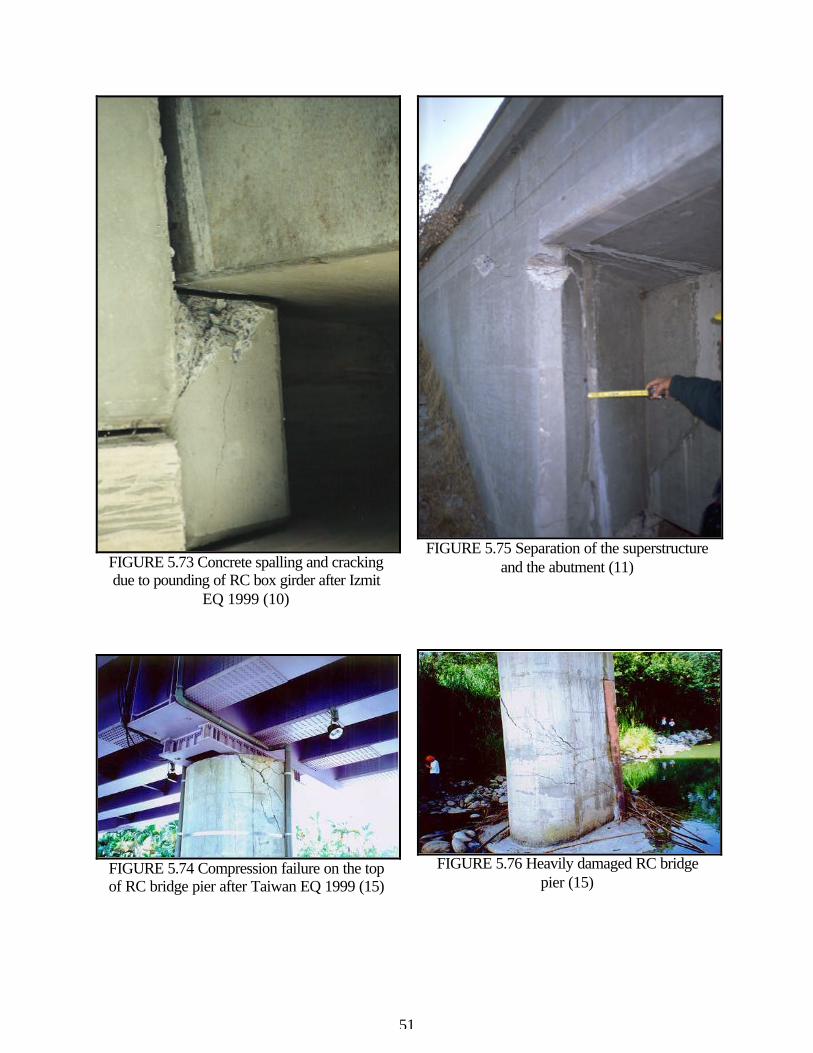
FIGURE 5.73 Concrete spalling and cracking due to pounding of RC box girder after Izmit EQ
1999 (10) ………………………………………………………………………………………..51
FIGURE 5.74 Compression failure on the top of RC bridge pier after Taiwan EQ 1999 (15) ….51
FIGURE 5.75 Separation of the superstructure and the abutment (11) ………………………….51
FIGURE 5.76 Heavily damaged RC bridge pier (15)……………………………………………51
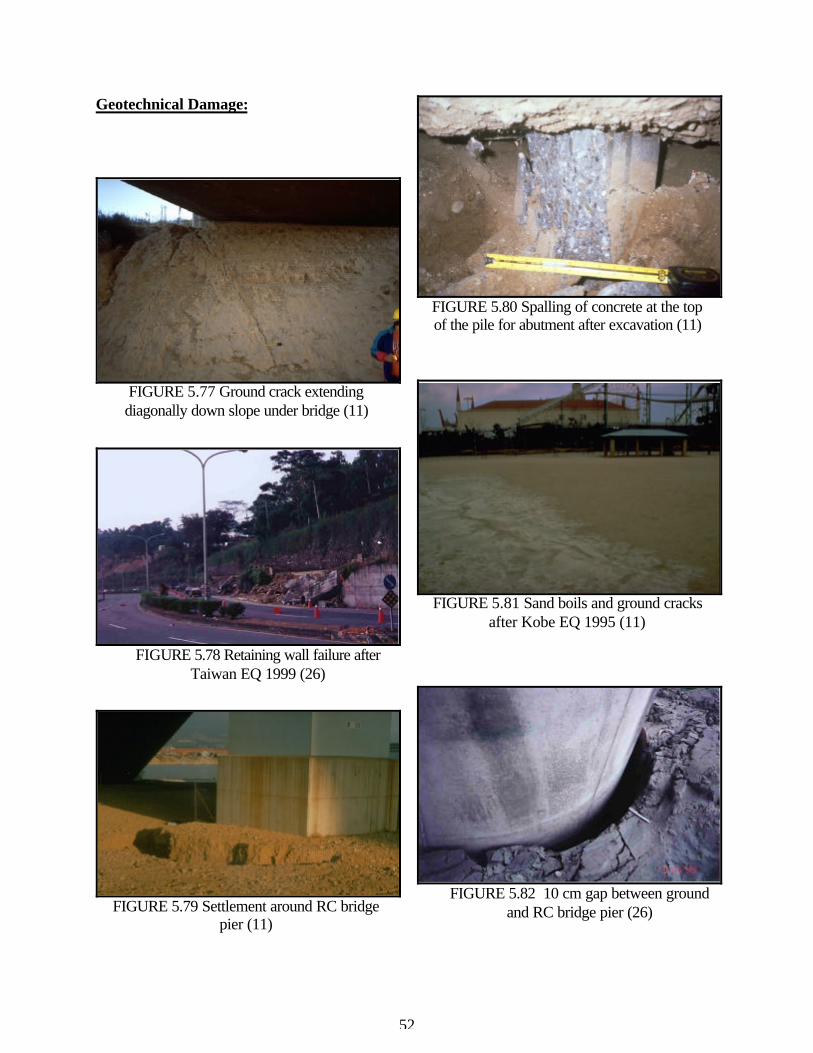
FIGURE 5.77 Ground crack extending diagonally down slope under bridge (11) ……………..52
FIGURE 5.78 Retaining wall failure after Taiwan EQ 1999 (26) ………………………………52
FIGURE 5.79 Settlement around RC bridge pier (11) …………………………………………..52
FIGURE 5.80 Spalling of concrete at the top of the pile for abutment after excavation (11) …..52
FIGURE 5.81 Sand boils and ground cracks after Kobe EQ 1995 (11) …………………………52
FIGURE 5.82 10 cm gap between ground and RC bridge pier (26)…………………………….52
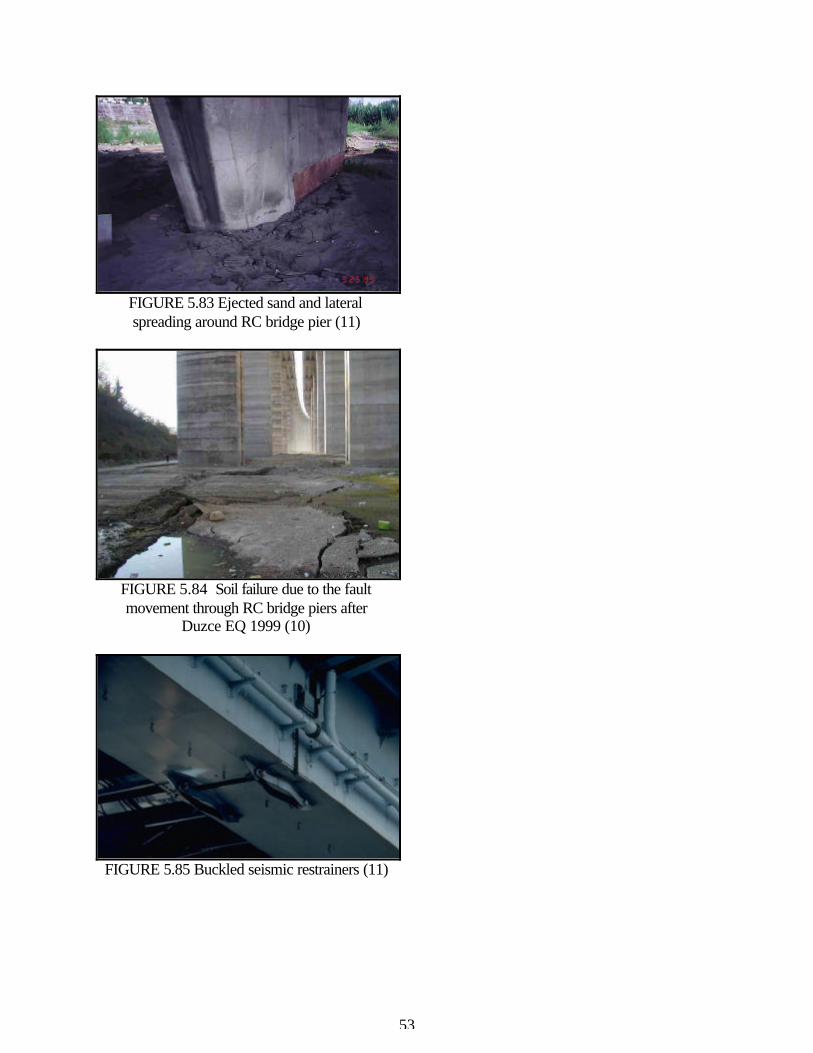
FIGURE 5.83 Ejected sand and lateral spreading around RC bridge pier (11) …………………53
FIGURE 5.84 Soil failure due to the fault movement through RC bridge piers after Duzce EQ
1999 (10) ………………………………………………………………………………………..53
FIGURE 5.85 Buckled seismic restrainers (11) …………………………………………………53
FIGURE 6.1 Level 1 inspection form …………………………………………………………..58
FIGURE 6.2 Level 1 inspection scheme ………………………………………………………..59
FIGURE 6.3 Level 2 inspection form ………………………………………………………….62
FIGURE 6.4 Road closure sign …………………………………………………………………66
FIGURE 7.1 Different bridge damage cases that steel plates can be used (11) …………………68
FIGURE 7.2 Different bridge damage cases that fill can be used (15,11) ……………………..69
FIGURE 7.3 Temporary shoring of bridge after Taiwan Earthquake 1999 (11) ………………..70
FIGURE 7.4 Another view of temporary shoring after Taiwan Earthquake 1999 (11) …………70
FIGURE 7.5 View of temporary shoring to maintain access after Kobe Earthquake 1995 (27) ..71
FIGURE 7.6 View of temporary shoring to prevent total collapse of bridge (27) ………………71
FIGURE 7.7 View of temporary shoring to prevent total collapse of steel bridge (27) …………71
FIGURE 7.8 View of temporary shoring to prevent total collapse of steel bridge (27) …………72
FIGURE 7.9 View of temporary shoring to support RC bridge (15) ……………………………72
FIGURE 7.10 View of temporary shoring to prevent total collapse of bridge (27) ……………..72
FIGURE 7.11 View of temporary support to prevent total collapse of steel bridge (27) ……….73
FIGURE 7.12 View of temporary support to prevent total collapse of steel girder bridge (15) ...73

xv
FIGURE 7.13 View of temporary support to prevent total collapse of steel girder bridge (11) ..73
FIGURE 7.14 Deflection measurement …………………………………………………………75
FIGURE 7.15. Crack comparator (CTL, Inc.) …………………………………………………..76
FIGURE 7.16. Crack monitor (Avonguard) …………………………………………………….76
FIGURE 7.17. Portable strain indicator (Measurements Group, Inc.) …………………………..77
FIGURE 8.1 View of bridge superstructure after the earthquake (11) ………………………….79
FIGURE 8.2 More damage to the bridge superstructure (11) …………………………………80
FIGURE 8.3 Different views of bridge superstructure (11) ……………………………………81
FIGURE 8.4 The Level 1 form, Bridge Example 1, Steps 1 and 2 ……………………………81
FIGURE 8.5 Damage to one of the bridge piers (11) …………………………………………..82
FIGURE 8.6 The Level 1 Form, Bridge Example 1, Step 3 …………………………………….82
FIGURE 8.7 Damage to the bridge bearings (11) ……………………………………………….83
FIGURE 8.8 The level 1 Form, Bridge Example 1, Step 4 ……………………………………84
FIGURE 8.9 View of substructure and soil of the bridge (11) ………………………………….84
FIGURE 8.10 Completed Level 1 Inspection Form for Example Bridge 1 ……………………..85
FIGURE 8.11 View of the Parkfield Highway Bridge after the earthquake (11) ……………….85
FIGURE 8.12 View of the damaged bridge components (11) ………………………………….86
FIGURE 8.13 Completed Level 1 form for Example Bridge 2 …………………………………87
FIGURE 8.14 Superstructure damage of the third example bridge after earthquake (11) ………88
FIGURE 8.15 Substructure damage of the bridge (11) …………………………………………89
FIGURE 8.16 Completed Level 1 Inspection form for bridge example 3……………………….90
FIGURE 8.17 Different views from the superstructure of the bridge (11)………………………91
FIGURE 8.18 Different views of damage from the damaged bridge (11) ………………………92
FIGURE 8.19 Completed Level 1 form for the example bridge (53-1620D) …………………93
FIGURE 8.20 Completed Level 2 Inspection Form, Bridge Example 1 (53-1620D) …………..94
FIGURE 8.21 Different views of the superstructure of the second example bridge (11) ………95
FIGURE 8.22 Different views of the superstructure of the bridge (11) ………………………..96
FIGURE 8.23 Different views of the superstructure of the bridge (11) ………………………..97
FIGURE 8.24 Different views of the second example bridge (11) ……………………………..98
FIGURE 8.25 Completed Level 2 Inspection Form, Bridge Example 2 ……………………….99
FIGURE 8.26 Completed Level 2 Inspection Form, Bridge Example 2 ………………………100

xvi
FIGURE A.1 Types of Road Closure sign and dimensions …………………………………..108
FIGURE A.2 The pictures of Road Closure sign, bridge signpost and emergency cabinet …..108
FIGURE A.3 The map of primary routes in Vincennes District ………………………………109

1
1. INTRODUCTION
1.1. Object and Scope
It is acknowledged that the most damaging earthquake within the state took place on September
27, 1909 near the Illinois border between Vincennes and Terre Haute. Both nonstructural and
structural damage occurred to the buildings in this area, and it was felt strongly in the southwest
of Indiana including Indianapolis. Other significant earthquakes have been felt in the state with
epicenters occurring in the southwestern corner. Indiana has also experienced damage from
earthquakes originating in neighboring states.
Unfortunately, due to the long recurrence interval of strong earthquakes in Mid-America, a large
inventory of structures has accumulated without explicit consideration of seismic resistance.
Highway bridges are a significant component of this inventory. The seismic vulnerability of
highway bridges constructed within the state, especially in southwestern portion of Indiana,
presents a problem of serious consequences.
The seismic history of the region, and the classification of the Southwestern portion of Indiana as
AASHTO Seismic Performance Zone 2, has resulted in an increased awareness regarding the
need to be prepared against the potential threat presented by earthquakes. As one of the first
steps in the development of seismic policy for the state, the Indiana Department of
Transportation has decided to prepare highway personnel for the post-earthquake safety
evaluation of bridges. Since the highway system is an essential component of the lifelines to a
community following an earthquake disaster, it is important to quickly assess its safety and
functionality, and provide temporary retrofits to quickly restore transportation routes. A post-
earthquake bridge inspection plan with properly trained personnel is a key component of the
disaster response plan to restore quickly the transportation routes in order to permit the access of
relief and reconstruction assistance.

2
The main purpose of this handbook is to provide INDOT personnel of various backgrounds with
a rapid and effective methodology for the post-earthquake safety inspection of bridges and roads
in Indiana. This methodology is intended to promote and maintain the uniformity of the
inspection as much as possible while assessing and rating bridge and road damage. It is likely
that the first personnel to be dispatched or that will reach damaged structures will not be
engineers. Furthermore, depending on the extent of the damage that may occur, it is possible that
there will not be an adequate number of experienced engineers to survey every structure.
This handbook contains the material necessary for a systematic safety evaluation of bridge
structures and roads for a wide range of INDOT personnel. In the handbook, the necessary
material is arranged according to two inspection levels. Level 1 inspection consists of the rapid
visual evaluation of the bridges and roads in the affected area to establish obviously unsafe
structures and roads. The Level 1 section of the handbook is intended for INDOT personnel with
a broad range of backgrounds. Level 2 inspection consists of a more in-depth safety evaluation of
bridges and roads, as well as temporary repair and long-term monitoring techniques. This
segment is designed specifically for INDOT engineers. The Level 2 inspection team will be
expected to make a more detailed structural and geotechnical post-earthquake condition
assessment of the bridge. The inspection team may choose to reduce the speed of incoming
vehicles as they approach the bridge, to restrict access only to emergency vehicles, or to close the
bridge entirely to traffic. The team may also consider, where appropriate, if temporary shoring or
other strengthening and long term monitoring measures are required.
The organization and the management of the post-earthquake inspections are under the
jurisdiction of INDOT, unless declared a State Disaster by the Governor and taken over by
SEMA, and it is outside the scope of this handbook

3
1.2. Level 1 Inspection
The main objective of the Level 1 Inspection section is to prepare INDOT personnel with a wide
range of backgrounds for the visual safety inspection of highway bridges and roads immediately
following an earthquake. The purpose of the Level 1 inspection is to restrict the traffic on unsafe
bridges (Red Tag) and roads, to identify those that are safe (Green Tag), and to indicate those in
need of further evaluation (Yellow Tag). The information gathered also will be used to develop
rough estimates of the extent of the damage. This information will be available to prioritize the
work of Level 2 teams. Level 1 inspection is deemed appropriate for all bridges and roads in the
affected area immediately after the earthquake. The Level 1 inspection consists of aerial view
and/or drive through. Appropriate actions should follow the inspection. Bridges deemed unsafe
must be red tagged and closed to traffic. Roads that cannot be traversed must be identified.
Finally, the geographical extent of the damage should be identified.
The outline of the Level 1 components of the handbook are:
q Brief description of the seismology of Indiana
q Illustration of typical Indiana bridges
q Examples of collapsed bridges and damaged roads
q Preparations necessary for Level 1 inspection
q Teams
q Description of bridge closing procedures
q Suggested equipment and inspection form
q Review/Assignments
1.3. Level 2 Inspection
The top priority of the Level 2 inspection should be the inspection of all the yellow tagged
bridges and roads identified during the Level 1 inspection. In addition to closing unsafe bridges
and identifying routes that cannot be traversed, the Level 2 inspection team will make a more
detailed assessment of the bridges in the affected area. The assessment should include

4
geotechnical and structural aspects. Teams must contain INDOT personnel under the supervision
of an experienced INDOT engineer. The main objective of the material related to the Level 2
inspection in this handbook is to prepare the team members to make a proper structural and
geotechnical assessment of the condition of bridges following an earthquake. These teams can
further refine the conclusions about the Level 1 inspection yellow tagged bridges, restrict their
use for only emergency vehicles, or open the bridge to traffic. At the same time, after completing
the inspection of Yellow tagged bridges, Level 2 teams should inspect the Red tagged bridges in
critical routes to determine if they may be put back into operation with in-house repairs. This
inspection team will also provide recommendations for short-term repair and whether it should
be conducted in house or a consultant is needed. It will also indicate if shoring and monitoring of
the damaged bridges is needed. This inspection will be conducted using ground transportation.
The following is an outline of the items in this handbook pertaining to the Level 2 inspection:
q Examples of damage to typical Indiana bridges
q Preparations necessary for Level 2 bridge assessment
q Teams
q Necessary equipment and inspection form
q Techniques for temporary repair and long-term monitoring techniques
q Review/Assignments

5
FIGURE 1.1 Flow-chart of Post-Earthquake Response Assessment
Earthquake
Level 1 Team
Red Tag Moderately Damaged
but Not Collapsed (Yellow)
Level 2 Team
Red Tag
Limited Entry (Yellow Tag)
Green Tag
Bridge in Service
Post Earthquake Detailed Investigation by Design Engineering Staff / Consultants
Repair or Rebuild
Temporary Repair and Monitoring
Green Tag
Critical Routes, Repair
In-House Possible

6

7
2. EARTHQUAKE ENGINEERING PRINCIPLES
2.1. Earthquakes
An earthquake is the movement of the ground (vibration, distortion, sliding) or Earth's surface
associated with a release of energy in the Earth's crust. This energy is generated by a sudden
movement of segments of the crust, by a volcanic eruption, or by manmade explosions. The
movement of the crust of the earth causes most of powerful earthquakes. The crust may first
bend and then, when the stress exceeds the strength of the rocks, rupture and settle to a new
position. In the process of rupture, vibrations called "seismic waves" are generated. These waves
travel outward from the source of the earthquake along the surface and through the Earth at
varying speeds depending on the material through which they move.
2.2. The Structure of the Earth
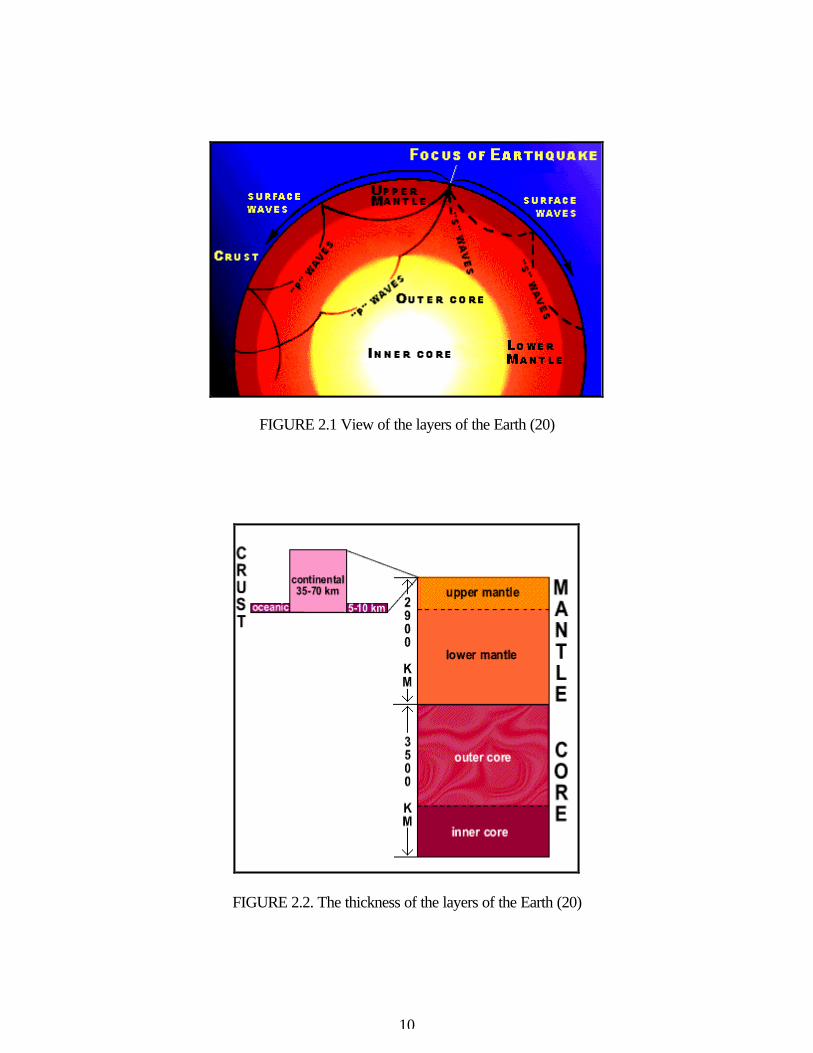
The idealized view of the earth, shows it like an egg with three different layers, it is helpful to
the people those who are interested in earthquake effects (Figure 2.1). These main three layers
have very different physical and chemical properties. The earth has a crust (shell), a mantle (egg
white) and a core (the yolk). The outer layer (shell), which averages about 70 kilometers in
thickness, consists of about a dozen large, irregularly shaped plates that slide over, under and
past each other on top of the partly molten inner layer (Figure 2.2). Most earthquakes occur at
the boundary zones where the plates meet. Plate boundaries are spreading zones, transform faults
and subduction zones (Figure 2.3). Along spreading zones or ridges, molten rock rises, pushing
two plates apart and adding new material at their edges. Most spreading zones are found on the
bottom of oceans such as North American and Eurasian plates that are spreading apart along the
Mid-Atlantic ridge. Ridges usually have earthquakes at shallow depths (within 30 kilometers of
the surface). Transform faults are found where plates slide past one another. An excellent
example of a transform-fault plate boundary is the San Andreas Fault, along the coast of
California and northwestern Mexico. Earthquakes at transform faults tend to occur at shallow

8
depths and form fairly straight linear patterns. Finally, subduction zones (trenches) are found
where one plate overrides, or subducts, another, pushing it downward into the mantle where it
melts. An example of a subduction-zone plate boundary is found along the northwest coast of the
United States, western Canada, and southern Alaska and the Aleutian Islands. Subduction zones
are characterized by deep-ocean trenches, shallow to deep earthquakes, and mountain ranges
containing active volcanoes (Figure 2.4).
Earthquakes can also occur within plates, although plate-boundary earthquakes are much more
common. Less than 10 percent of all earthquakes occur within plate interiors. As plates continue
to move and plate boundaries change over geologic time, weakened boundary regions become
part of the interiors of the plates. These zones of weakness within the continents can cause
earthquakes in response to stresses that originate at the edges of the plate or in the deeper crust.
The New Madrid earthquakes of 1811-1812 and the 1886 Charleston earthquake occurred within
the North American plate
Earthquakes are produced by sudden slip and rupture along the faults. A fault can be defined as a
roughly planar fracture in the Earth's crust along which slip, the relative movement of the two
sides has occurred. Faults can be active which means they currently hold the potential for
producing earthquakes or inactive which means they already have slipped once and produced
earthquakes but they are now "frozen" solid. If the tectonic environment of an area changes,
however, inactive faults can sometimes be reactivated.
In terms of size, faults can be anywhere from less than a meter to over a thousand kilometers in
length, with a width of a similar scale. The depth of very large faults is constrained by the
thickness of that portion of the crust and lithosphere in which brittle fracture can occur. In
southern California, this depth is roughly 15 to 25 kilometers. The kind of faults seismologists
study are generally at least a square kilometer in area, and typically more than a 100 km2 in area.
Faults of this size or greater can rupture violently enough to produce significant earthquakes.
There are approximately 200 faults in southern California that are considered major faults. Three
basic types of faults can be identified based on the relative movement. These are normal faults,
reverse faults and strike-slip faults. These fault types are illustrated in Figure 2.6.

9
2.3. Seismic Waves
After rupture of the fault, seismic waves or vibrations are generated. These waves are divided
into two main categories: Body waves (longitudinal P waves and transversal S waves), Surface
waves (Rayleigh Waves and Love waves). The first kind of body wave is the P wave (primary
wave). This is the fastest type of seismic wave. The P wave is able to move through solid rock
and fluids, like water or the liquid layers of the earth. Depending on the stiffness and the
medium, these waves travel at speeds in the range 3-8 km/sec. It pushes and pulls the rock it
moves through just like sound waves push and pull the air. The people only feel the bump and
rattle of these waves. The second type of body wave is the S wave (secondary wave), which is
the second wave people can feel in an earthquake. An S wave is slower than a P wave and can
only move through solid rock. This wave moves rock up and down, or side-to-side. Typically,
the speed of the S-wave is 1-4 km/sec.
The first type of surface wave is called a Love wave; it's the fastest surface wave and moves the
ground from side-to-side. The other kind of surface wave is the Rayleigh wave. A Rayleigh wave
rolls along the ground just like a wave rolls across a lake or an ocean. Because it rolls, it moves
the ground up and down, and side-to-side in the same direction that the wave is moving. Most of
the shaking felt from an earthquake is due to the Rayleigh wave, which can be much larger than
the other waves. Figure 2.5 gives a visual interpretation of these waves.
In a major earthquake, people near the epicenter can feel, and sometimes see, the earth move
strongly. People further away may feel the motion too, although less strongly. The movement
travels away from the epicenter, spreading out in waves and becoming smaller and weaker as
they travel. Seismometers are the main devices to detect and record these motions even when
they are far too small for humans to feel. In addition to seismometers, accelerometers are utilized
to measure the acceleration of the ground. Figure 2.7 shows a typical ground acceleration record
produced by the Duzce Earthquake (time vs. acceleration) plotted in three different directions,
transversal, lateral and vertical.
10
FIGURE 2.1 View of the layers of the Earth (20)
FIGURE 2.2. The thickness of the layers of the Earth (20)

11
FIGURE 2.3 The map of the plates on the Earth (21)
FIGURE 2.4 The cross section that illustrates the main types of plate boundaries (22)

12
FIGURE 2.5 The illustration of the seismic waves (24)
13
FIGURE 2.6 The illustration the main types of faults (23)
FIGURE 2.7 A typical near source acceleration record taken after Duzce Earthquake (25)
14
2.4. Bridge Behavior under Earthquake Excitation
The travel of the seismic waves from source to the bridge site and typical ground acceleration
and displacement diagrams are illustrated in Figure 2.8. The behavior and performance of bridge
structure under earthquake excitation is mainly influenced by proximity of the bridge to the fault
and bridge site conditions. These factors affect the intensity of ground shaking and deformation
of the bridge structure directly. In addition to the external effects, the performance of the bridge
is influenced by structural configuration, materials utilized, connections between different
elements of the bridge structure and fixity of the foundations. The bridge structures can be
assumed to be shaken in longitudinal and transversal directions. Although this simplification
does not reflect the real behavior, it may help to understand the response of the bridges against
earthquakes. Figure 2.9 shows the behavior of a two span monolithic highway bridge under
longitudinal earthquake loading. The illustrated end connections such as roller supports and fixed
support are extensively applied in highway bridge structures. During an earthquake, due to the
shaking, inertial forces are created on the bridge structure depending the nature of the ground
motion and the structural characteristics of the bridge. These inertial forces are represented as
horizontal force on the structure with the corresponding deformation demand. The bridge should
be able to resist these inertial forces and deformation demand in order to keep its structural
integrity. Otherwise, local or entire collapses may occur. In Figure 2.9, pier (mid-column) of the
bridge is resisting the longitudinal movement while the superstructure is taking the longitudinal
deformation demand and dissipating it through the gaps between superstructure and abutments.
Similarly, in the lateral direction the bridge has to resist earthquake force. As it can be seen from
the Figure 2.10, the bridge structure behaves as a simple beam in the lateral direction. Abutments
resist the lateral movement of the superstructure.
The illustrated bridge example shows a typical flexible bridge structure. The major source of this
flexibility is the connection/interface details between the bridge elements. This flexibility brings
the advantage of the construction of economically feasible bridge structures. But at the same
time it increases the seismic vulnerability of the bridge. In the past, a number of bridge collapses
have occurred due to the lack of behavior based design. With the help of the lessons taken form

15
past earthquake damages, bridges are constructed appropriately but a number of bridges
currently under use need modifications for earthquake resistance.
FIGURE 2.8 The occurrence of the earthquake and traveling of the waves to the bridge site (1)
FIGURE 2.9 Typical longitudinal earthquake loading and deflected shape of a bridge (1)

16
FIGURE 2.10 Typical lateral earthquake loading and deflected shape of a bridge (1)

17
3. SEISMICITY OF INDIANA
3.1. General
There has been increasing awareness about seismic hazard in the Midwest region of United
States due to the records of past earthquakes and the evidence of prehistoric earthquake activity.
Since 1875, Indiana has experienced at least 40 earthquakes that reportedly were felt by
residents. Recent studies have shown evidences of the occurrence of at least 6 major earthquakes
with epicenters in Indiana during the last 12,000 years with the help of the surveys of hundreds
of ancient sand blows (See Ref. 28). According to the results of these studies, an earthquake that
had a magnitude of more than 7.5 occurred about 6,000 years ago in the Wabash River Valley
near the Indiana-Illinois border. Numerous prehistoric earthquakes of magnitude 6 to 7 have
occurred in Southern Indiana and Illinois although the last two centuries earthquakes with
epicenters in Indiana have been relatively minor events. Geologic evidence of these earthquakes
is in the form of soil liquefaction that induced intrusions of sand and gravel in river sediments.
These types of formations have been discovered at more than 100 widespread sites in the
Wabash River Valley and along its tributaries (Figure 3.1). These intrusions permit the use of
geologic, archaeological, and engineering techniques to determine when the earthquakes
occurred, as well as their epicenters and approximate magnitudes.
The liquefaction occurs when violent shaking during strong earthquakes causes; loose, clean,
uniformly graded and saturated underground soil layers (sands, gravels and non-plastic silts) to
behave like a fluid under pressure (Figure 3.1). Occasionally, the pressure forces the liquefied
soil to move up through cracks in the overlying soil and flow out over the surface. Sand blow is a
good example of this situation (Figure 5.81). After the sand blow formed, generally it was
covered by layers of silt deposited during floods. When liquefaction occurs, the strength and
bearing capacity of soil decreases. The effects of liquefaction can range from massive landslides
to small slumps or spread of soil. Bridge sites particularly crossing over water can have tendency
to produce liquefaction by considering their general hydrologic and geologic conditions such as

18
the existence of intense fluvial and alluvial deposits. Concurrently, the susceptibility of a soil
layer to liquefaction does not mean that the liquefaction will occur in a given earthquake.
The earthquakes that occurred since 1811-1812 in and near the State can be seen on a Midwest
U.S. map (Figure 3.2). This figures shows that southern portion of State has an important
earthquake potential. In Figure 3.3, the mapped and assumed faults through the State are shown.
Beside the in-state faults, an earthquake that may happen on the New Madrid Fault, which is one
of the important earthquake zones throughout the U.S, may affect the State. Because of the active
portion of the New Madrid Fault Zone is covered by thick alluvial deposit layers, there is no
clear surface evidence that indicates the present fault movement. However, micro-earthquake
records allows the marking out of the active portions of the fault zone.
As an in-state fault zone, Wabash Valley fault zone lies in the southwestern part of the Indiana
(Figure 3.3). Three earthquakes of 4.5 ≤ mb ≤ 5.1 and five of 5.2 ≤ mb ≤ 5.8 have occurred in this
zone. The most important one occurred on November 9, 1968 with a magnitude of 5.5 (mb). A
possible strong earthquake that will occur in New Madrid Seismic zone has a strong damage
potential in most parts of Indiana. The probability for such an earthquake of magnitude 6.0 or
greater is given as significant in the near future, 90% chance by the year 2040. An earthquake
with a magnitude equal to that of the 1811- 1812 quakes could result in great loss of life and
property damage in the billions of dollars. Common belief between scientists is that the region
could be overdue for a large earthquake. Only intense research, preparation and public awareness
may be able to prevent such losses.
FIGURE 3.1 The view of the liquefaction mechanism and the map of Southern Indiana regions where ancient sand blows have been found due to prehistoric earthquakes (28)

19
FIGURE 3.2 Approximate Epicenters Powerful Earthquakes since 1811-1812 (3)
20
FIGURE 3.3. The Fault Map of State of Indiana (4)
3.2. Earthquake History of Indiana
The great New Madrid earthquakes of 1811 and 1812 have strongly affected Indiana, particularly
the southwestern part, but there is little information available from these earlier times other than
personal observations. The New Madrid Seismic Zone lies within the central Mississippi River
Valley, extending from northeast Arkansas, through southeast Missouri, western Tennessee,
western Kentucky to southern Illinois. (Figure 3.2) Between 1811-1812, 4 catastrophic
earthquakes occurred during three month period with estimated magnitudes greater than 7 on
Richer Scale.
21
On the basis of the damaged area (600,000 km2), the area of perceptibility (5 million km2) and
the complex geological and topographical changes ranked these earthquakes of 1811-1812 as the
largest in the United States. The area of strong shaking associated with these shocks is two to
three times larger than that of the 1964 Alaska Earthquake and 10 times larger than that of the
1906 San Francisco Earthquake. The New Madrid seismic zone is named after of the town of
New Madrid, Missouri that was the closest settlement to epicenters of 1811-1812 earthquakes.
At that time, St. Louis and other major cities in US were lightly settled. These series of
earthquakes were felt throughout US and Canada.
The magnitudes of the 1811-1812 New Madrid earthquakes varied considerably. The first and
second earthquakes occurred in Arkansas (December 16, 1811 - two big shocks on the same day-
mb=7.2, Ms= 8.6 and MM=VII-VIII) and the third and fourth in Missouri (January 23, 1812 mb=
7.1, Ms= 8.4 and February 7, 1812 mb=7.3 and Ms=8.7). The first earthquake caused only slight
damage to man-made structures, mainly because of the sparse population in the epicentral area.
The extent of the area that experienced damaging earth motion (MM intensity greater than or
equal to VII) is estimated to be 600,000 km2. However, shaking that was strong enough to alarm
the general population (MM intensity greater than or equal to V) occurred over an area of 2.5
million km2. Although the motion during the first shock was violent at New Madrid, Missouri, it
was not as heavy and destructive as that caused by two aftershocks about 6 hours later. Only one
life was lost in falling buildings at New Madrid, but chimneys tumbled and houses were thrown
down as far distant as Cincinnati, St. Louis and in many locations in Kentucky, Missouri, and
Tennessee. The intensity at the epicenter of this earthquake is thought to be at the MM intensity
X-XI level. The heavy damage imposed on the land by these devastating earthquakes led
Congress to pass in 1815 the first disaster relief act providing the landowners of destroyed
ground with an equal amount of land in unaffected regions.
In 1812 (January 23), almost a month later than the previous ground shaking, a third big shock
hit the region. The epicenter of this shock was at New Madrid, Missouri. Finally, the fourth and
largest earthquake of the 1811-1812 series occurred on February 7, 1812. Several destructive
shocks followed the main shock on February 7, the last of which equaled or surpassed the
magnitude of any previous event. The town of New Madrid was destroyed. In the city of St.

22
Louis, many houses were damaged severely and their chimneys were thrown down. The affected
area was characterized by general ground warping, ejections, fissuring, severe landslides, and
caving of stream banks.
In 1876, twin shocks were felt fifteen minutes apart each other over an area of 60,000 mi2. A
shock in 1887 centered near Vincennes was felt over 75,000 mi2 and shock damaged property
and frightened people in church at Evansville.
Another damaging earthquake originating in Indiana occurred on April 29, 1899 and rated
intensity as MM VI-VII on the Modified Mercalli Scale. It was strongest at Jeffersonville and
Shelbyville; at Vincennes, chimneys were thrown down and walls cracked. It was felt over an
area of 40,000 mi2.
The most destructive Indiana earthquake occurred on September 27, 1909 near the Illinois border
between Vincennes and Terre Haute. Some chimneys toppled, several building walls were
cracked, and light connections were severely damaged. It was felt in Indianapolis, Oakland City
and over an area of 30,000 mi2 including the southwestern half of Indiana, all of Illinois and
parts of Iowa, Kentucky, Missouri, Arkansas, and probably in parts of Kansas. In Terre Haute,
two chimneys were toppled and plasters were cracked. At Covington, north of Terre Haute in
Fountain County, a few chimneys were downed and windows were broken. The intensity of the
earthquake was rated as MM VII on the Modified Mercalli Scale.
On March 2, 1937, a shock centering near Anna, Ohio, threw objects from shelves at Fort Wayne
and some plaster fell. Plaster was also cracked at Indianapolis. Six days later, another shock
originating at Anna brought pictures crashing down and cracked plaster in Fort Wayne and was
strongly felt in Lafayette.
On November 7, 1958, an earthquake originating near Mt. Carmel, Illinois, caused plaster to fall
at Fort Branch. Roaring and whistling noises were heard at Central City and the residents of
Evansville thought there had been an explosion or plane crash. It was felt over 33,000 mi2 of
Illinois, Indiana, Missouri, and Kentucky.

23
The earthquakes originating in neighboring states have caused considerable damage in Indiana.
One of the worst occurred on November 9, 1968 and centered near Dale in southern Illinois. The
shock, a magnitude 5.5 (Mb), was felt over 580,000 mi2 and other states including all of Indiana.
Intensity VII was reported from Cynthiana where chimneys were cracked, twisted, and toppled.
Property damage in the area consisted mainly of fallen bricks from chimneys, broken windows,
toppled television aerials, and cracked or fallen plaster. In the epicentral area, near Dale,
Hamilton County, MM intensity VII was characterized by downed chimneys, cracked
foundations, overturned tombstones, and scattered instances of collapsed parapets. Most
buildings that sustained damage to chimneys were 30 to 50 years old. About 10 kilometers west
of Dale, near Tuckers Corners, a concrete and brick cistern collapsed. A large amount of
masonry damage occurred at the City Building at Henderson, Kentucky, 80 kilometers east-
southeast of the epicenter. Moderate damage to chimneys and walls occurred in several towns in
south-central Illinois, southwest Indiana, and northwest Kentucky. The earthquake had been felt
over all or parts of 23 States: from southeast Minnesota to central Alabama and Georgia and
from western North Carolina to central Kansas. People had also felt it in multistory buildings in
Boston, Massachusetts and southern Ontario, Canada.
More recently, Indiana was shaken in 1987 by a quake centered near Olney, Illinois, just west of
Vincennes.
In Figure 3.4, the peak acceleration rates as percent gravity (g) are shown with 10% probability
of exceedance in 50 years (3). Similarly, estimated MM intensity curves of a 6.5 magnitude
earthquake in New Madrid Fault can be seen from Figure 3.5.

24
FIGURE 3.4 The peak acceleration map with 10% probability of exceedance in 50 years. (5)
FIGURE 3.5. Estimated MM intensity map for 6.5 magnitude earthquake in NMFZ (6)
25
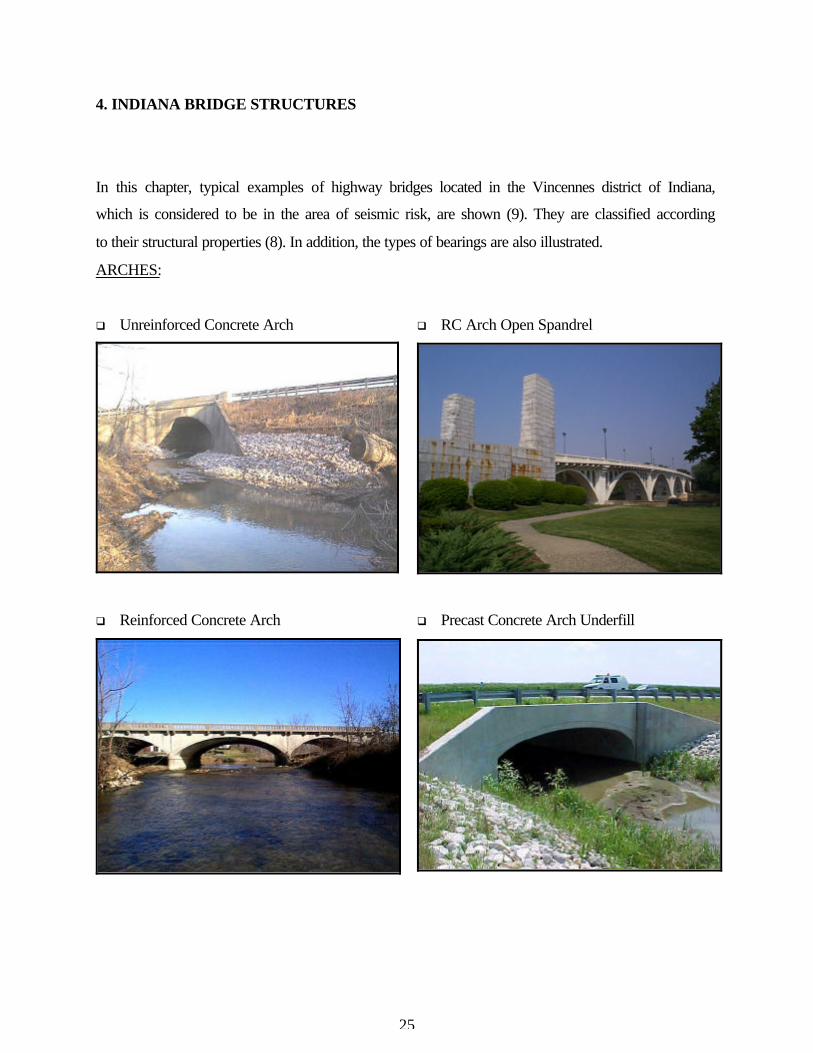
4. INDIANA BRIDGE STRUCTURES
In this chapter, typical examples of highway bridges located in the Vincennes district of Indiana,
which is considered to be in the area of seismic risk, are shown (9). They are classified according
to their structural properties (8). In addition, the types of bearings are also illustrated.
ARCHES:
q Unreinforced Concrete Arch
q Reinforced Concrete Arch
q RC Arch Open Spandrel
q Precast Concrete Arch Underfill

26
q Metal Pipe Arch
q Multi-Plate Arch
SLABS:
q Reinforced Concrete Slab Underfill
q Continuous Reinforced Concrete Slab

27
q Precast Concrete Slab Underfill
GIRDERS:
q Reinforced Concrete Girder
q Steel Girder

28
q Steel Box Girder
q Riveted Plate Girder
BEAMS:
q Prestressed Concrete Box Beam-Spread
Boxes
q Prestressed Concrete I-Beam

29
q Continuous Prestressed Concrete I-Beam
q Steel Beam
q Composite Continuous Steel Beam
TRUSSES:
q Steel Pony Truss
q Steel Through Truss

30
q Continuous Steel Tied Arch-Truss
BEARINGS:
q Integral
q Contact
q Rocker Bearing

31
q Elastomeric Bearing
RESTRAINER:
PIPELINES:

32

33
5. POSSIBLE TYPES OF BRIDGE AND ROADWAY DAMAGE
5.1. General
Highway bridges have a structural combination of superstructure, substructure and support
bearings. Superstructure consists of all the structural parts of the bridges that make the horizontal
span like slab, beams, girders or truss members. Substructures consist of structural parts of the
bridges that provide the support to the horizontal span like abutments, piers and columns.
Bearings are placed between the superstructure and substructure. Figure 5.1 shows all the key
components of a typical highway bridge.
FIGURE 5.1 View of different structural parts of a typical highway bridge
5.2. Classification of Damage
The Level 1 Inspection can be summarized as follows:
§ Green Tag - Safe for Traffic
§ Yellow Tag - Require Level 2 Evaluation (or quickly repairable)
§ Red Tag - Unsafe for traffic (must be closed)
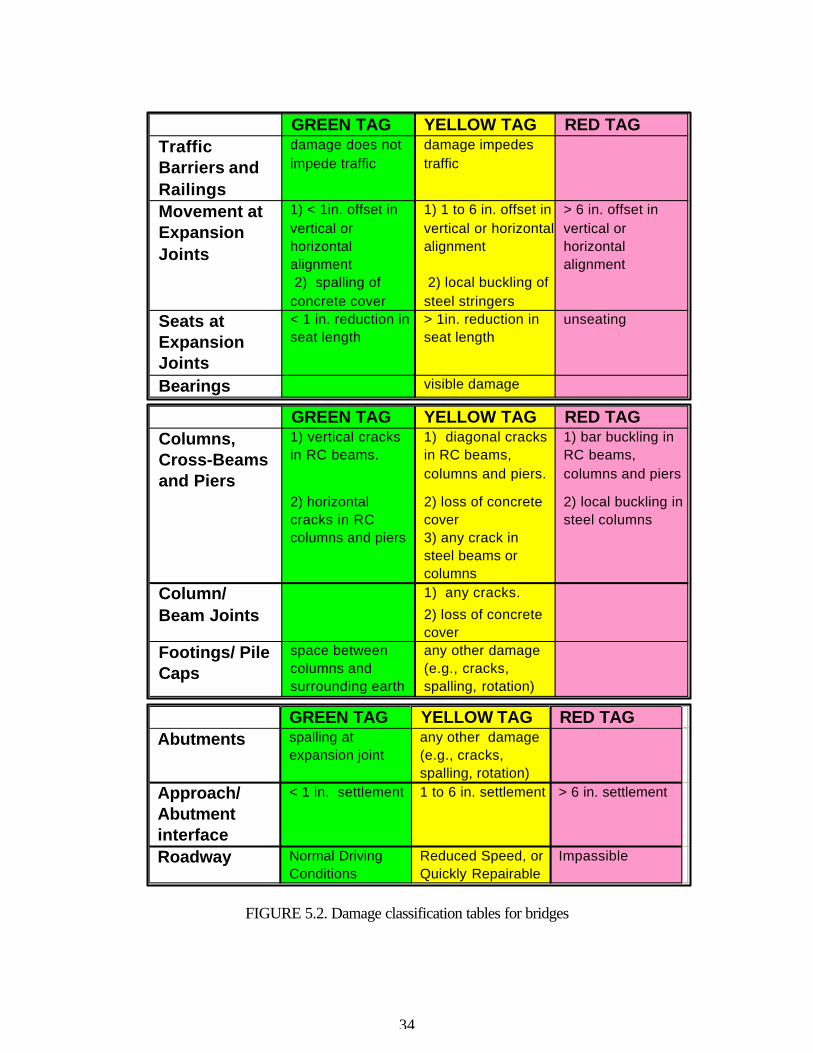
More detailed damage classification tables are given in the Figure 5.2 by considering the
different components of highway bridges.
34
FIGURE 5.2. Damage classification tables for bridges
GREEN TAG YELLOW TAG RED TAGTraffic Barriers and Railings
damage does not impede traffic
damage impedes traffic
Movement at Expansion Joints
1) < 1in. offset in vertical or horizontal alignment
1) 1 to 6 in. offset in vertical or horizontal alignment
> 6 in. offset in vertical or horizontal alignment
2) spalling of concrete cover
2) local buckling of steel stringers
Seats at Expansion Joints
< 1 in. reduction in seat length
> 1in. reduction in seat length
unseating
Bearings visible damage
GREEN TAG YELLOW TAG RED TAGColumns, Cross-Beams and Piers
1) vertical cracks in RC beams.
1) diagonal cracks in RC beams, columns and piers.
1) bar buckling in RC beams, columns and piers
2) loss of concrete cover
2) local buckling in steel columns
3) any crack in steel beams or columns
Column/ 1) any cracks.
Beam Joints 2) loss of concrete cover
Footings/ Pile Caps
space between columns and surrounding earth
any other damage (e.g., cracks, spalling, rotation)
2) horizontal cracks in RC columns and piers
GREEN TAG YELLOW TAG RED TAGAbutments spalling at
expansion jointany other damage (e.g., cracks, spalling, rotation)
Approach/ Abutment interface
< 1 in. settlement 1 to 6 in. settlement > 6 in. settlement
Roadway Normal Driving Conditions
Reduced Speed, or Quickly Repairable
Impassible
35
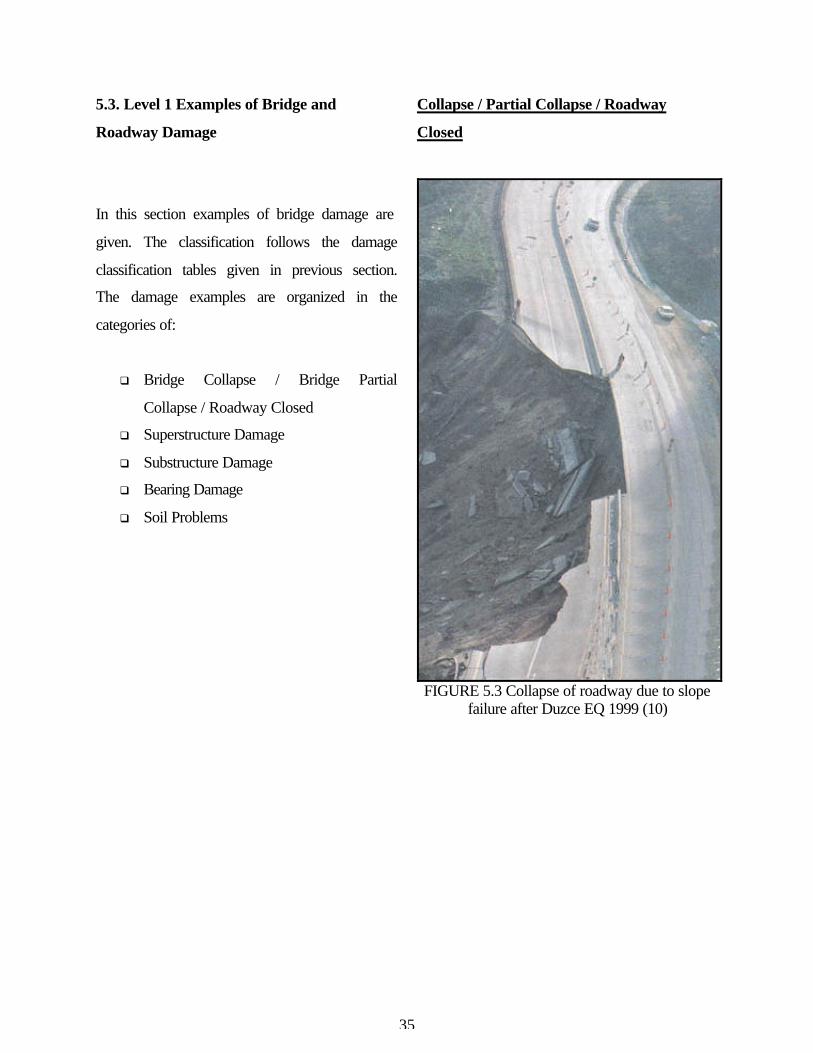
5.3. Level 1 Examples of Bridge and
Roadway Damage
In this section examples of bridge damage are
given. The classification follows the damage
classification tables given in previous section.
The damage examples are organized in the
categories of:
q Bridge Collapse / Bridge Partial
Collapse / Roadway Closed
q Superstructure Damage
q Substructure Damage
q Bearing Damage
q Soil Problems
Collapse / Partial Collapse / Roadway
Closed
FIGURE 5.3 Collapse of roadway due to slope failure after Duzce EQ 1999 (10)

36
FIGURE 5.4 Collapse of roadway due to fault rupture after Izmit EQ 1999 (10)
FIGURE 5.5 Failure of a prestressed concrete
box beam bridge after Izmit EQ 1999 (10)
FIGURE 5.6. Collapse of deck and piers after
Taiwan Earthquake 1999 (15)
FIGURE 5.7. Failure of a monolithic RC girder bridge after Loma Prieta EQ 1989 (11)
FIGURE 5.8 Collapse of RC girder bridge after Loma Prieta EQ 1989 (11)
FIGURE 5.9 Collapse of bridge deck after Northridge 1994 (11)

37
FIGURE 5.10 Collapse of steel deck bridge after Kobe 1995 Earthquake (12)
In the cases shown in the Figure 5.2 to 5.9,
there is no chance to permit traffic flow, it’s
physically impossible. Highway must be
closed immediately and barriers should be
placed and crisis center should be informed.
Walking on or passing under such kind of
collapsed bridge can be dangerous. This
situation is defined as Red Tag.
Superstructure Damage:
Superstructure damage can be classified as
lateral, longitudinal or vertical movement,
pounding, buckling, cracking, and failure. The
examples shown in Figures 5.11-5.22 are red
tagged bridges except for those shown in
Figures 5.17 - 5.21 considered yellow tagged
examples.
FIGURE 5.11 Excessive longitudinal movement of the bridge deck (15)

38
FIGURE 5.12 The excessive transversal movement of bridge after Izmit EQ (10)
FIGURE 5.13 Excessive longitudinal
movement of steel box girder bridge (11)
FIGURE 5.14 Excessive differential
settlement of the backfill (1)
FIGURE 5.15 Lateral movement of
prestressed RC box girders (10)
FIGURE 5.16 Longitudinal movement of RC
box girders after Duzce EQ 1999 (10)

39
FIGURE 5.17 Vertical offset between decks after Northridge EQ 1994 (11)
FIGURE 5.18 Excessive movement of
expansion joints after Taiwan EQ 1999 (15)
FIGURE 5.19 The expansion of the joints
Taiwan EQ 1999 (15)
FIGURE 5.20 The expansion of the joints after Loma Prieta Earthquake 1989 (11)
FIGURE 5.21 Vertical and horizontal offset on a bridge after Northridge EQ. 1994 (11)

40
FIGURE 5.22 Settlement of Bridge (26)
Substructure Damage:
Substructure damage can be classified as local
buckling, shear key damage, settlement,
tilting, sliding, rotation, cracking, and failure.
The following examples are red tagged bridges
except those shown in Figures 5.30 and
Figures 5.33- 5.35.
FIGURE 5.23 Column failure (11)
FIGURE 5.24 Failure of RC e column (11)
FIGURE 5.25 Failure of the bottom
of the RC bridge column (11)

41
FIGURE 5.26 Failed RC bridge column (11)
FIGURE 5.27 View of damaged RC bridge
pier after Kobe Earthquake 1995 (13)
FIGURE 5.28 Heavy damage in RC bridge
piers after Kobe Earthquake 1995 (14)
FIGURE 5.29 Shear crack in bents after
Northridge Earthquake 1994 (11)
FIGURE 5.30. Shear key failure of a bridge after Northridge Earthquake 1994 (11)

42
FIGURE 5.31 Buckling of steel girders (11)
FIGURE 5.32 Movement of an abutment after
Northridge Earthquake 1994 (11)
FIGURE 5.33 Separation of abutment (11)
FIGURE 5.34 Transversal movement of
abutment (11)
FIGURE 5.35 Pounding damage at abutment
(11)

43
Bearing Damage:
Bearing damages consist of failure, movement
of rocker/elastomeric bearings, shearing,
pullout or bearing of bolts for contact type of
bearings. The examples consist of red tagged
bridges except for the case shown in Figure
5.40.
FIGURE 5.36 Failure of two anchor bolts for a girder after Northridge EQ 1994 (11)
FIGURE 5.37 Failure of an elastomeric bearing due to longitudinal movement of
girder (10)
FIGURE 5.38 Failure of elastomeric bearing
and cracking of girder beam (10)
FIGURE 5.39 View of a failed elastomeric
bearing pad after Izmit EQ 1999 (10)
FIGURE 5.40 Spalling near location of anchor bolts after Northridge Earthquake 1994 (11)

44
Soil Problems:
Slope failures, soil liquefaction, soil fissures,
differential settlements can be generalized as
soil problems. The following examples can be
considered as yellow tagged bridges.
FIGURE 5.41 Separation of soil at column base of a pier after Northridge EQ 1994 (11)
FIGURE 5.42 Separation of column from the surrounding soil after Northridge EQ1994 (11)
FIGURE 5.43 Disturbed soil at the base of
column after Northridge EQ 1994 (11)
Secondary Structure Damage:
FIGURE 5.44 Barrier cracking after Northridge Earthquake 1994 (11)

45
FIGURE 5.45 Minor damage on the deck of a bridge after Northridge EQ 1994 (11)
FIGURE 5.46 Curb separation after Northridge Earthquake 1994 (11)
FIGURE 5.47 Collapse of asphalt pavement due to washout after Northridge EQ 1994 (11)
FIGURE 5.48 Surface damage to highway pavement after Northridge EQ 1994 (11)
FIGURE 5.49 Settlement damage on approaches after Northridge EQ 1994 (11)
46
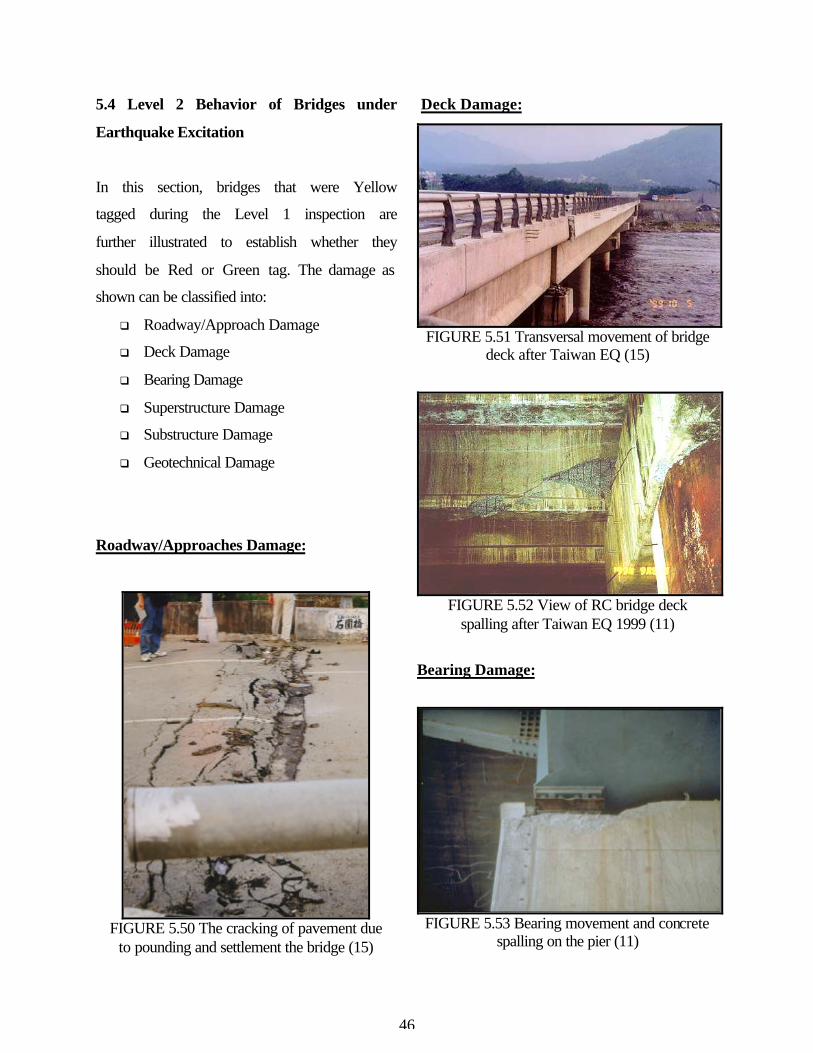
5.4 Level 2 Behavior of Bridges under
Earthquake Excitation
In this section, bridges that were Yellow
tagged during the Level 1 inspection are
further illustrated to establish whether they
should be Red or Green tag. The damage as
shown can be classified into:
q Roadway/Approach Damage
q Deck Damage
q Bearing Damage
q Superstructure Damage
q Substructure Damage
q Geotechnical Damage
Roadway/Approaches Damage:
FIGURE 5.50 The cracking of pavement due
to pounding and settlement the bridge (15)
Deck Damage:
FIGURE 5.51 Transversal movement of bridge
deck after Taiwan EQ (15)
FIGURE 5.52 View of RC bridge deck
spalling after Taiwan EQ 1999 (11)
Bearing Damage:
FIGURE 5.53 Bearing movement and concrete
spalling on the pier (11)

47
FIGURE 5.54 Tilted rocker bearings (9)
FIGURE 5.55 Shift of bearings after collapse
(11)
FIGURE 5.56 Bearing movement (11)
FIGURE 5.57 Elastomeric bearing movement
and spalling of girder concrete (10)
FIGURE 5.58 Sliding of elastomeric bearing
(10)

48
FIGURE 5.59 Yield at pin support (in red
color) (11)
FIGURE 5.60 Buckling of web near lower flange and crack in pedestal (11)
Superstructure Damage:
FIGURE 5.61 Local buckling of beam web
near haunch (11)
FIGURE 5.62 Damage at the bottom of the RC
collector beam (11)

49
FIGURE 5.63 Buckling in the girder due to
pounding (11)
FIGURE 5.64 Steel box girder movement and
collapse of bearings (11)
FIGURE 5.65 Heavy damage in RC box girder
bridge (15)
FIGURE 5.66 Yielding at bolted connector
beam (11)

50
FIGURE 5.67 Twisted steel braces (11)
FIGURE 5.68 Shear cracks at the RC bridge
girder near support (26)
Substructure Damage:
FIGURE 5.69 Abutment slumping after
Taiwan EQ 1999 (26)
FIGURE 5.70 Large cracks at abutment wing
wall and slope (26)
FIGURE 5.71 Separation of the RC superstructure and the abutment (11)
FIGURE 5.72 Pounding of steel girder to the
abutment (11)
51
FIGURE 5.73 Concrete spalling and cracking due to pounding of RC box girder after Izmit
EQ 1999 (10)
FIGURE 5.74 Compression failure on the top of RC bridge pier after Taiwan EQ 1999 (15)
FIGURE 5.75 Separation of the superstructure and the abutment (11)
FIGURE 5.76 Heavily damaged RC bridge
pier (15)
52
Geotechnical Damage:
FIGURE 5.77 Ground crack extending diagonally down slope under bridge (11)
FIGURE 5.78 Retaining wall failure after
Taiwan EQ 1999 (26)
FIGURE 5.79 Settlement around RC bridge pier (11)
FIGURE 5.80 Spalling of concrete at the top of the pile for abutment after excavation (11)
FIGURE 5.81 Sand boils and ground cracks after Kobe EQ 1995 (11)
FIGURE 5.82 10 cm gap between ground
and RC bridge pier (26)
53
FIGURE 5.83 Ejected sand and lateral spreading around RC bridge pier (11)
FIGURE 5.84 Soil failure due to the fault movement through RC bridge piers after
Duzce EQ 1999 (10)
FIGURE 5.85 Buckled seismic restrainers (11)

54

55
6. POST-EARTHQUAKE SAFETY EVALUATION PRACTICE FOR HIGHWAY
BRIDGES
6.1 Level 1 Inspection
The Rapid Assessment Bridge Inspection Form for the INDOT Level 1 teams is shown in Figure
6.1. This form is for multiple bridges, one bridge per line. Each line should be completed at the
conclusion of the inspection of each bridge site. If a given bridge is in imminent danger of
collapse, the inspection of the bridge shall follow the procedure outlined in this chapter.
Assigned unit personnel (normally two people for each route) should pick up their inspection kit
at their unit and inspect their pre-assigned primary route reporting back the condition of the
roadway and all bridges on that route. Primary routes are the road sections needed for access to
critical areas such as cities, hospitals, power stations, communication centers, schools, industries,
neighboring states. After primary routes are inspected, the supervisor should determine the
secondary routes to be inspected.
The Level 1 Inspection will consist of visual assessment of all bridges on the route. The main
goal for this inspection is to be able to make a quick and accurate conclusion about the post
earthquake situation of the bridges on the assigned route. The only time the inspectors can
interrupt their inspection is when they encounter a life or death situation. It is critical that the
inspection get done, so outside help can be requested and routed via open roads. As indicated by
the result of the inspection, traffic flow on the bridge should be either controlled or restricted or
unrestricted. The results of the inspection will be utilized to develop the inspection schedule of
the Level 2 teams. For each bridge that will be examined, the teams should complete the
information in a given row, after checking all bridge elements. Finally, they should indicate their
decision on the last three columns. If any suspicious situation exists or more detailed information
is collected, team members can use the back page of the forms to make detailed explanations.
Any major bridge and roadway closure should be reported to the Unit/ Subdistrict/ District
immediately. In the previous chapter, common types of damage in bridges similar to those in
Indiana were noted. It is recommended to complete a quick walk around the bridge then follow

56
with a more focused inspection keeping in mind the examples of damage as related to the type
bridge surveyed. A suggested general procedure for the Level 1 inspection can be summarized
as follows:
1. Begin the inspection of the assigned bridges on the previously determined route after
collecting the necessary tools for the inspection (See section 6.3 for information on
suggested equipments)
2. Minor roadway deficiencies should be recorded in the form including pavement damage,
earth embankment failure, road obstructions and failure of the traffic control devices. Unit/
Subdistrict/ District should be informed immediately of any road or bridge damage that
requires the closing of the roadway to traffic.
3. Complete Level 1 Inspection Form. The form is shown in Figure 6.1. It contains columns
and rows. Complete one row per bridge inspected. The suggested step-by-step procedure is
listed below.
4. Upon arrival to the bridge site, review and verify the bridge number.
5. Record the arrival time.
6. Check the traffic flow on the bridge. Although there may be traffic using the bridge that
does not indicate the bridge is safe. Inspect all bridges assuming they may be damaged.
7. Approach bridge with caution and never walk immediately upon arrival directly under or
over the bridge. Do not cross the bridge without first sighting down the curb/rail line and
checking the underside for structural damage.
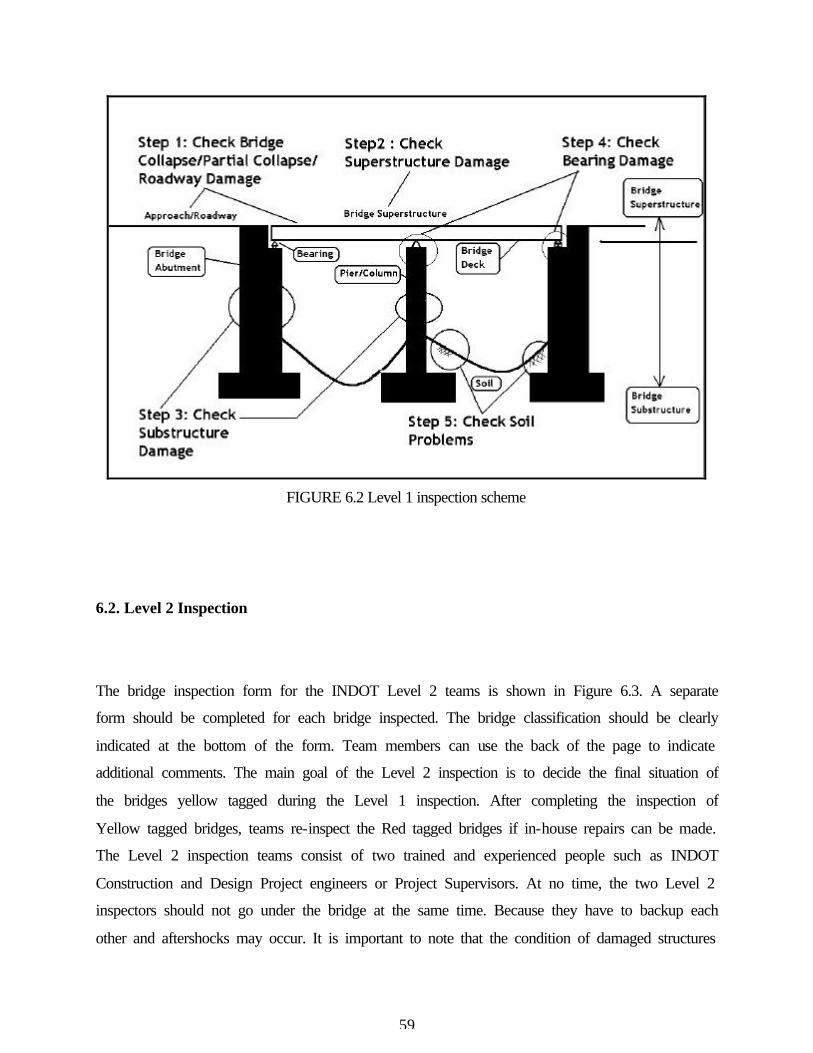
8. Prepare an inspection routine of the different components. Assign inspection tasks. Begin
by inspecting approaches and continue in the order listed in the inspection form (see Figure
6.2). Upon starting sub-structure inspection each inspector should go down a different side
of the bridge to provide safety by separation and to speed the inspection.
9. Discuss observation with the other members of the team and make the evaluation of the
condition.
10. After completing items 1 through 6 in the form with the comments YES, NO, or DRN
(Detailed Review Needed), the team should come to an agreement regarding the condition
of the bridge and enter in one of the last three columns of the form as appropriate. If a
bridge received at least one YES for the damage types 1 through 5, either a RED tag for
57
closure, or if a more detailed inspection is needed (Level 2) a YELLOW tag should be
entered. In case of no damage, a GREEN tag should be entered.
11. Additional recommendations and observations about the bridge and roadway can be
written in the box provided at the bottom of the form.
12. If the bridge is given a RED tag requiring barricades, the Unit, Subdistrict, and District
should be informed immediately and the disaster closure procedure outlined in Section 6.4
of the handbook should be followed. If the bridge can be traversed, but repairs are needed,
place a YELLOW ribbon, if it undamaged use a GREEN ribbon. Attach ribbons to the
bridge signpost and write time/date/inspector initials.
13. Record time on the form indicating the end of the inspection of the assigned bridges in the
space provided at the top of the form.

58
INDOT RAPID ASSESSMENT BRIDGE INSPECTION REPORT (LEVEL I) Route_______ Direction___________from Intersection___________ Page:____of _____ Date and Local Time: Post Earthquake Condition of the Bridge (Please write “YES, NO or DRN (Detailed Review Needed)” for items 1-6)
1. C
olla
pse
/ Par
tial
Col
laps
e/
Roa
dway
Clo
sed
2. S
uper
stru
ctur
e D
amag
e M
ovem
ent,
Poun
ding
, Buc
klin
g,
Cra
ckin
g, F
ailu
re
3. S
ubst
ruct
ure
Dam
age
Sh
ear K
ey D
amag
e, L
ocal
Buc
klin
g,
Settl
emen
t, T
iltin
g, S
lidin
g, R
otat
ion,
C
rack
ing,
Fai
lure
4. B
eari
ng D
amag
e
Failu
re, M
ovem
ent,
Shea
ring
or
pullo
ut o
f bol
ts
5. S
oil P
robl
ems
Sl
ope
Failu
re, S
oil L
ique
fact
ion,
Fi
ssur
e, D
iffe
rent
ial S
ettle
men
t
6. S
econ
dary
Str
uctu
re D
amag
e W
ing
wal
ls, P
arap
ets,
Pyl
ons
Bridge
Number
YES NO
DRN
YES NO
DRN
YES NO
DRN
YES NO
DRN
YES NO
DRN
YES NO
DRN 7. E
xpla
in O
ther
Pro
blem
s O
bser
ved
(D
amag
e in
Pip
elin
es o
r O
ther
Uti
litie
s et
c.)
RE
D T
AG
YE
LL
OW
TA
G
GR
EE
N T
AG
Roadway Problems Encountered and Comments:
Name of the Inspector(s)
FIGURE 6.1 Level 1 inspection form
59
FIGURE 6.2 Level 1 inspection scheme
6.2. Level 2 Inspection
The bridge inspection form for the INDOT Level 2 teams is shown in Figure 6.3. A separate
form should be completed for each bridge inspected. The bridge classification should be clearly
indicated at the bottom of the form. Team members can use the back of the page to indicate
additional comments. The main goal of the Level 2 inspection is to decide the final situation of
the bridges yellow tagged during the Level 1 inspection. After completing the inspection of
Yellow tagged bridges, teams re-inspect the Red tagged bridges if in-house repairs can be made.
The Level 2 inspection teams consist of two trained and experienced people such as INDOT
Construction and Design Project engineers or Project Supervisors. At no time, the two Level 2
inspectors should not go under the bridge at the same time. Because they have to backup each
other and aftershocks may occur. It is important to note that the condition of damaged structures

60
may worsen due to the additional earthquakes, traffic or simply gravity. When assessing the
bridges, one should assume that additional earthquakes would occur and consider what effect(s)
may have. Sometimes it may be necessary to establish a monitoring plan to detect any changes in
the condition of the damaged structures.
General procedure for the Level 2 inspection can be summarized as follows:
1. Start the inspection of the assigned bridge after collecting the necessary tools for the
inspection.
2. Record the arrival and departure times. Complete the necessary information about the
bridge, route and date/time. Note the difference between inspection day/time and the
day/time of the main shock.
3. Examine the data from Level 1 inspection report for the bridge.
4. Check the traffic flow through the bridge. This may help to reach a conclusion about the
condition of the bridge.
5. Prepare inspection plan for the different bridge components and prepare assignments for
the inspection.
6. Inspect the superstructure and substructure following the sequence given in the Level 2
form.
7. Note the observed damage by checking the necessary boxes. Fill out the form shown in
Figure 6.3. It contains 6 main damage type definitions for the different elements of the
bridge structures and comments and section to make specific recommendations. One form
must be used for each bridge inspected.
8. Discuss the observations with the members of the team and come to an agreement on the
condition.
9. The final rating should be written on the bottom of the form.
10. If the conclusion is that the bridge/road must be closed, or barricades are required, contact
the Unit, Subdistrict and District immediately.
11. Note any additional recommendations and conclusions in the box. The backside of the
form can be used for additional explanations or sketches.

61
12. Place appropriate marked ribbon on the bridge sign to inform later inspectors about its
condition.
Examples of the damage observed during previous earthquakes are summarized in Chapter 5.
During the inspection of the various types of bridge components, care must be taken to make the
correct assessment. All the structural elements, connections, supports, bearing elements and soil
conditions should be checked.
For the concrete elements, flexural and shear cracks should be examined carefully. It should be
considered that spalling of concrete and the exposure of reinforcing bars to open air may
complicate the assessment damage resulting from the earthquake. Observed cracks have to be
marked with paint and crack path and location should be recorded on a sketch with the note of
crack width.
It is important to note that some reinforced concrete elements such as box girders, footings, and
piles cannot be readily inspected. If damage of these elements is suspected, access must be
gained to inspect them. For example, excavating the soil around the footings, checking pile caps
may give better idea for the damage. For the box girder type of elements, opening holes on the
cells and confined space entry may be necessary.
For the steel components, inspection of the damage is often not readily apparent such as in the
concrete elements. All assemblies, plates, anchor bolts, restrainers, connections, hangers, welds
and other details should be carefully inspected. Sheared bolts, buckled or bent members, cracked
welds, shifted girders, anything out of order should be noted. For the composite elements, anchor
bolts to connect the steel parts to the concrete elements should be checked such as in steel
columns connected to abutments and pier caps.

62
INDOT DETAILED BRIDGE INSPECTION REPORT (LEVEL II) Route: Date and Local Time: Bridge ID: Bridge Location : DAMAGE OBSERVED: 1. ROADWAY/APPROACHES 4. SUPERSTRUCTURE
Reinforced Concrete Slab 1 Flexural Cracks 1 Shear Cracks 1 Connection Failure 1 No Damage 1 N/A
Culverts 1 Flexural Cracks 1 Shear Cracks 1 Local Buckling 1 Connection Failure 1 Metal Pipes Distortion & Deflection 1 No Damage 1 N/A
Tr Steel Truss Members, Floor Beams, Stringers 1 Local Buckling 1 Upper Chord 1 Lower Chord 1 Diagonals 1 Connection Failure 1 No Damage 1 N/A
Concrete Arches 1 Flexural Cracks 1 Shear Cracks 1 Connection Failure 1 Spandrel Wall Cracking/Collapse 1 No Damage 1 N/A
Steel/Concrete Girders, Beams 1 Flexural Cracks 1 Shear Cracks 1 Connection Failure 1 Local Buckling 1 No Damage 1 N/A
1 Not Operational 1 Roadway Settlement 1 Off Bridge Seat 1 Excessive Transversal Movement 1 No Damage 1 Other (explain)
2. DECK 5. SUBSTRUCTURE Abutments 1 Wall Movement/Rotation 1 Pounding Damage 1 Wing wall Movement 1 Wing wall Separation 1 Backfill Settlement 1 Foundation Movement 1 Abutment Pile Damage 1 Cracking on the Walls 1 No Damage 1 N/A
1 Longitudinal Joints Enlarged 1 Expansion Joints Enlarged 1 Wearing Surface Cracking 1 Wearing Surface Spalling 1 Deck Cracking/Spalling 1 Misalignment of Guard Rails, Curbs, Pavement Lines 1 No Damage
Piers 1 Joint Failure 1 Moment Failure 1 Shear Failure 1 Inadequate Splice Failure 1 Flexural Cracks 1 Shear Cracks 1 Local Buckling 1 Foundation Failure 1 No Damage 1 N/A
3. BEARINGS 6. GEOTECHNICAL 1 Failure of Bearings (Integral, Contact, Rocker, Elastomeric) 1 Movement of Bearings 1 Shearing or Pullout of Bolts 1 No Damage
1 Slope Failure 1 Settlement 1 Soil Liquefaction 1 Fault Movement 1 Other 1 No Damage 1 N/A
COMMENTS FOR REPAIR AND RECOMMENDATIONS: 1. BARRICADE NEEDED 2. IMMEDIATE SHORE AND BRACE 3. REPAIR
3a. In-House Repair Possible 3b. Outside Contractor Needed
4. EMERGENCY VEHICLE USE ONLY 5. MONITORING UNDER SERVICE NEEDED 6. OTHER (explain)
Overall Rating For the Bridge: SAFE (Green Tag):_______MORE REVIEW NEEDED (Yellow Tag) ________UNSAFE(Red Tag):__________ Name of the Inspector(s):
FIGURE 6.3 Level 2 inspection form

63
6.3. Suggested tools for the evaluation procedure
6.3.1. Suggested tools to perform Level 1 inspection
q Radio and cellular phone for communications
q Inspection procedures field guide
q Primary and county route maps, state maps
q List of bridges on the routes
q Clipboard, pen, pencil
q Waterproof marker
q Ribbons in three colors: Red ribbon to close, Yellow ribbon to identify open but repairs
or additional inspection needed and Green ribbon to denote undamaged with color
wording on ribbon
q Rope
q Safety vest
q Hardhat
q Flash light
q “Road Closed” signs, flashers and stands. (See section 6.4)
q Shovel
q Barrels
q Cones
q Traffic control paddles
q First aid kit
q Camera and film
q Fire extinguisher
q 100 ft tape
q Hammer
q Extra flashlight batteries
q Binoculars
q Chain saw

64
6.3.2 Suggested tools to perform a detailed evaluation for Level 2
The necessary resources for the Level 2 teams are:
q Level 1 inspection form data
q Bridge inventory book
q Primary and county route maps
q Radio and/or satellite phone for communications
q Water, food, clothes, blankets, tents, shelter and supplies for at least 3 days per person
q Inspection Form for each bridge, field book, sketchpad, paper, pencils, clipboard.
q 100-foot tape, pocket tape, and ruler.
q Testing hammer or geologist hammer
q Inspection mirror and flashlight for inaccessible areas
q Keel marker
q Camera and film
q Binoculars
q Tool belt, boots
q Wire brush, shovel, whisk broom
q Pocket knife
q Safety harness and lanyard
q Scraping toll
q Calipers
q Ladders
q Lead lines
q Hand level
q Thermometer
q Pocket or wrist watch
q Plumb bob
q Safety vest
q Hard hat
q Rope
65
q Axe
q Tape recorder and tape
q Tool box
q Life jacket
q Gloves, PVC coated and leather
q Ear plugs
q Eye wash
q First aid kit
q Cones, traffic safety
q Fire extinguisher
q Sign, flagman’s signal
For detailed inspection, following items may be required for the different type of bridges:
q Crack gage or comparator to measure the width of the cracks
q Piano wire or some other device for measuring the depth of cracks
q Screwdriver
q Pliers
q Wrench
q Magnifying glass
q Periscope, fluorescent tube light
q Hand drill, borer or ship auger
q Straight edge
q Flagging for marking damaged areas

66
6.4. Bridge Closing Procedure
INDOT has a formal procedure for the planned closing of a road or bridge that includes pre-
closure notification to the public (through the media and signs), marking a detour/approach and
signing the actual barricade closure. In a major disaster INDOT has a responsibility to take all
reasonable actions to notify and protect the public as soon as the need for a road closure is
known (see Appendix A, Indot Response Procedure for Major Disasters).
Each unit shall maintain a minimum of one set of “Road Closure” signs (Figure 6.4) with type B
flashers and sign supports for each primary disaster route in their unit. Level 1 inspectors shall
load one road closure setup (2 signs) onto their truck prior to starting their inspection. If there is
a need for closure during inspection, the signs will be put up on each approach and
unit/subdistrict/ district immediately notified so that the approach signing, barricading and a
detour can be placed in a timely manner by follow up personnel. Once this is done, Level 1
inspectors shall continue the inspection on their primary route using the state and county maps to
find a way around the closure. If additional closures are encountered that information is to be
relayed back to the unit/subdistrict for assistance. One inspector may have to remain at the
closure until relieved if no signing or other traffic control is available (try to use local law
enforcement if available
FIGURE 6.4 Road closure sign

67
7. TEMPORARY REPAIRS AND LONG TERM MONITORING TECHNIQUES
7.1. Temporary Repairs
Following an earthquake, many bridges may be damaged. It is important to identify if temporary
repairs can be made in order to provide emergency access or to open a lifeline for the recovery
effort. Temporary repairs may open a structure that would otherwise be closed for these
purposes. These repairs should be consider, as the name implies, only temporary measures and
should not be considered as the final repair or rehabilitation technique.
To identify if a temporary repair is feasible, the first step is to assess the condition of the
structure. Several questions should be considered:
q How widespread is the damage?
q Is this a safety issue?
q What is the cause of damage?
q What are the consequences of the damage?
q Are there similar problems elsewhere?
q Is intervention possible?
In considering these questions, is appropriate to consider the type of damage present. In general
there are two types of damage:
q Local – Damage incurs risks to the users but not to the structure.
q Global – Damage incurs risks to the stability of the structure and the safety of the users.
Local damage may lend itself to repair using quick, temporary measures while global damage
typically does not easily lend itself to quick repair. However, even global damage may be
repaired using temporary measures if this structure is essential to the transportation network.
Once it is determined that a repair may be needed or necessary, it is important to identify the
repair strategy or level of intervention required. The following are typical options to consider:

68
1. No Repair/Monitoring or Instrumentation Required
2. Partial Repair
3. Replace/Redesign Elements
4. Replace Structure
Temporary repair is covered under Options 1 and 2. Option 1 may provide an excellent
alternative to repair when local damage is present or there is doubt as to the performance of the
structure. Monitoring techniques are discussed in the second part of this chapter. Option 2 may
be used to repair local damage. The specific repair technique depends on the actual component
that is damaged. Options 3 and 4 are considered permanent repair procedures and are not
covered by this handbook. These repair techniques will require considerable resources for
design and construction.
Temporary repair procedures will be divided into several categories. The repairs listed provide
general information regarding the procedures that may be applicable for a given structure.
7.1.1. Transition Repair
Roadways and bridges may not provide a smooth riding surface after such an event. Bridge
superstructures may be displaced vertically due to bearing damage or settlement of approaches.
In addition, roadways may also be damaged producing discontinuities in the riding surface. In
these cases, simple solutions often work best. Several temporary repair procedures should be
considered:
Steel Plates: Steel plates that connect the riding surface can be used to bridge gaps and vertical
offsets in both bridges and roadways (See Figure 7.1).
FIGURE 7.1 Different bridge damage cases that steel plates can be used (11)
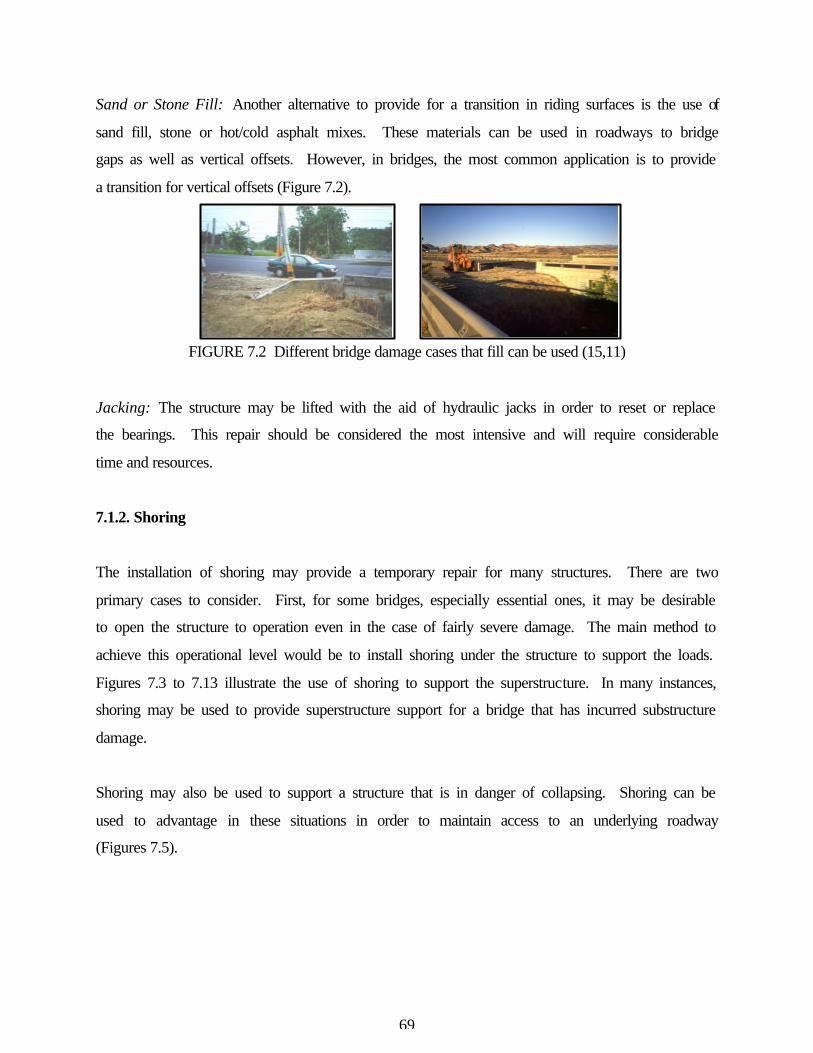
69
Sand or Stone Fill: Another alternative to provide for a transition in riding surfaces is the use of
sand fill, stone or hot/cold asphalt mixes. These materials can be used in roadways to bridge
gaps as well as vertical offsets. However, in bridges, the most common application is to provide
a transition for vertical offsets (Figure 7.2).
FIGURE 7.2 Different bridge damage cases that fill can be used (15,11)
Jacking: The structure may be lifted with the aid of hydraulic jacks in order to reset or replace
the bearings. This repair should be considered the most intensive and will require considerable
time and resources.
7.1.2. Shoring
The installation of shoring may provide a temporary repair for many structures. There are two
primary cases to consider. First, for some bridges, especially essential ones, it may be desirable
to open the structure to operation even in the case of fairly severe damage. The main method to
achieve this operational level would be to install shoring under the structure to support the loads.
Figures 7.3 to 7.13 illustrate the use of shoring to support the superstructure. In many instances,
shoring may be used to provide superstructure support for a bridge that has incurred substructure
damage.
Shoring may also be used to support a structure that is in danger of collapsing. Shoring can be
used to advantage in these situations in order to maintain access to an underlying roadway
(Figures 7.5).

70
FIGURE 7.3 Temporary shoring of bridge after Taiwan Earthquake 1999 (11)
FIGURE 7.4 Another view of temporary shoring after Taiwan Earthquake 1999 (11)

71
FIGURE 7.5 View of temporary shoring to maintain access after Kobe Earthquake 1995 (27)
FIGURE 7.6 View of temporary shoring to prevent total collapse of bridge (27)
FIGURE 7.7 View of temporary shoring to prevent total collapse of steel bridge (27)

72
FIGURE 7.8 View of temporary shoring to prevent total collapse of steel bridge (27)
FIGURE 7.9 View of temporary shoring to support RC bridge (15)
FIGURE 7.10 View of temporary shoring to prevent total collapse of bridge (27)

73
FIGURE 7.11 View of temporary support to prevent total collapse of steel bridge (27)
FIGURE 7.12 View of temporary support to prevent total collapse of steel girder bridge (15)
FIGURE 7.13 View of temporary support to prevent total collapse of steel girder bridge (11)
74
7.2. Long-Term Monitoring
In many cases, it may be appropriate to monitor the structure rather than conduct a repair.
Monitoring may indicate that the structure is not deteriorating beyond its current state. It may
also be used to support the assumption that the structure is performing adequately and does not
require closure. On the other hand, monitoring may indicate a potential safety problem with the
structure and support the need for bridge closure.
The primary measurements that will be of assistance in providing feedback from the structure
include deflections, crack widths, and strains. Several simple techniques are presented for each
of these measurements. For monitoring a structure following an earthquake, it is important to
consider that the simplest measurement method is often the best method.
7.2.1. Deflections
Deflection measurements may be used to determine if the structure is continuing to function
without a loss of stiffness. Increasing deflections over time would indicate that the bridge is not
adequately performing and is deteriorating. This measurement can provide information
regarding whether the structure should remain operational.
Deflections are often one of the most difficult measurements to obtain from a structure.
However, a very simple technique illustrated below provides a relatively easy deflection
measurement. As shown, a piano wire is stretched across the structure and attached at reference
points. In order to measure deflections in the span, it is common for the reference points to be
located at the supports. A scale is attached at the point of interest, and deflections can be
monitored at this location. This method is inexpensive, does not require significant materials,
and is reliable (Figure 7.14).

75
FIGURE 7.14 Deflection measurement
7.2.2. Cracks
Crack monitoring may be used to determine if damage is continuing to accumulate over time. It
may also be used to provide evidence of unstable crack growth that may be an indication of
unstable structural damage. There are several simple crack monitoring techniques that may be
used:
Plaster Cracks: If it is only required to determine if the cracks are moving, then simply applying
plaster or mortar over the cracks is appropriate. Cracking of the plaster indicates that further
cracking has occurred.
Crack Comparator: Taking measurement with a crack comparator and recording measurements
over time will provide evidence of crack growth (Figure 7.15).
Tape Measure: For some cracks, the widths may be larger than the range provided by the crack
comparator. For these cracks, a tape measure may prove suitable.
Avongard: A mechanical movement indicator available from Avongard can be attached to the
structure. This indicator provides a direct reading of crack displacement and rotation (Figure
7.16).
Piano Wire
ScaleReference Point

76
FIGURE 7.15. Crack comparator (CTL, Inc.)
FIGURE 7.16. Crack monitor (Avonguard)
7.2.3.Strain
In some instances, it may be helpful to obtain strain measurements. These measurements may
provide engineers with information regarding the overall structural performance or performance
of specific components that are questionable. The easiest method to obtain strain measurements
is by attaching an electrical resistance strain gage. Hand held bridge balancing boxes (Figure
7.17) are available to permit field monitoring without extensive electronic equipment. This

77
technique would only be applicable for a minimum number of gages at key interest locations. If
detailed information over a long-term period is required, gaging of the entire structure may be
required. However, extensive gaging lends itself to the use of a computer data acquisition
system and complete wiring of the structure.
FIGURE 7.17. Portable strain indicator (Measurements Group, Inc.)

78
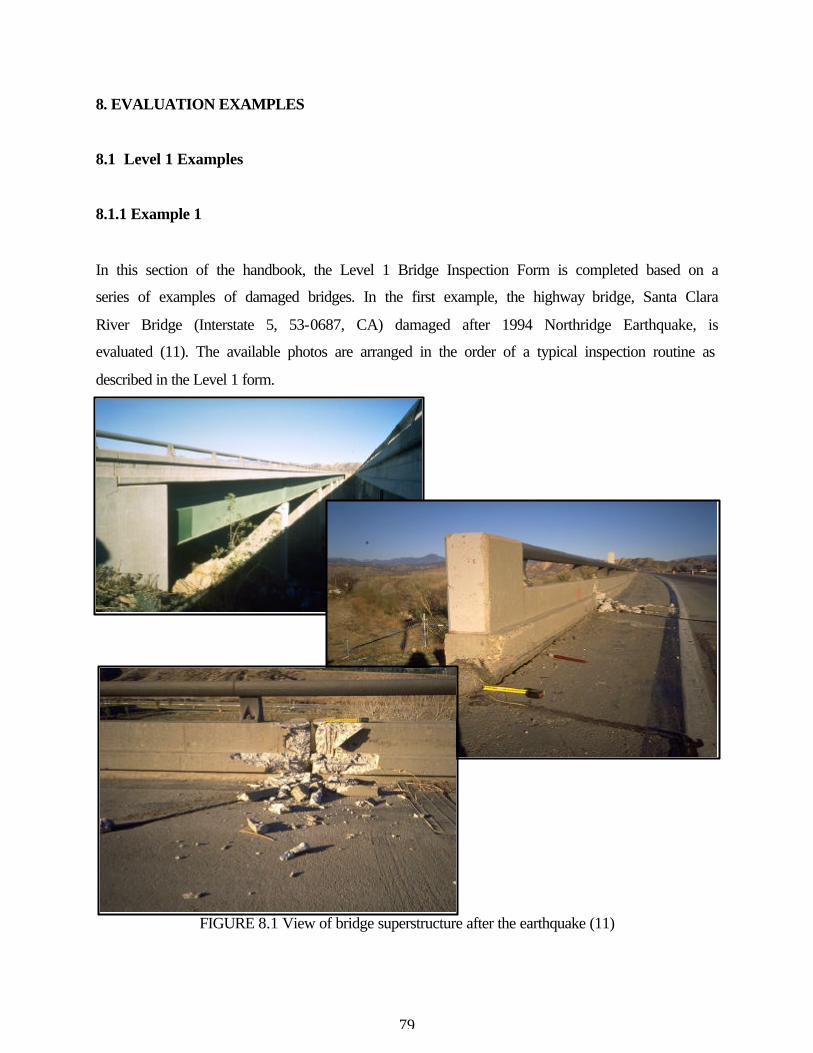
79
8. EVALUATION EXAMPLES
8.1 Level 1 Examples
8.1.1 Example 1
In this section of the handbook, the Level 1 Bridge Inspection Form is completed based on a
series of examples of damaged bridges. In the first example, the highway bridge, Santa Clara
River Bridge (Interstate 5, 53-0687, CA) damaged after 1994 Northridge Earthquake, is
evaluated (11). The available photos are arranged in the order of a typical inspection routine as
described in the Level 1 form.
FIGURE 8.1 View of bridge superstructure after the earthquake (11)

80
FIGURE 8.2 More damage to the bridge superstructure (11)
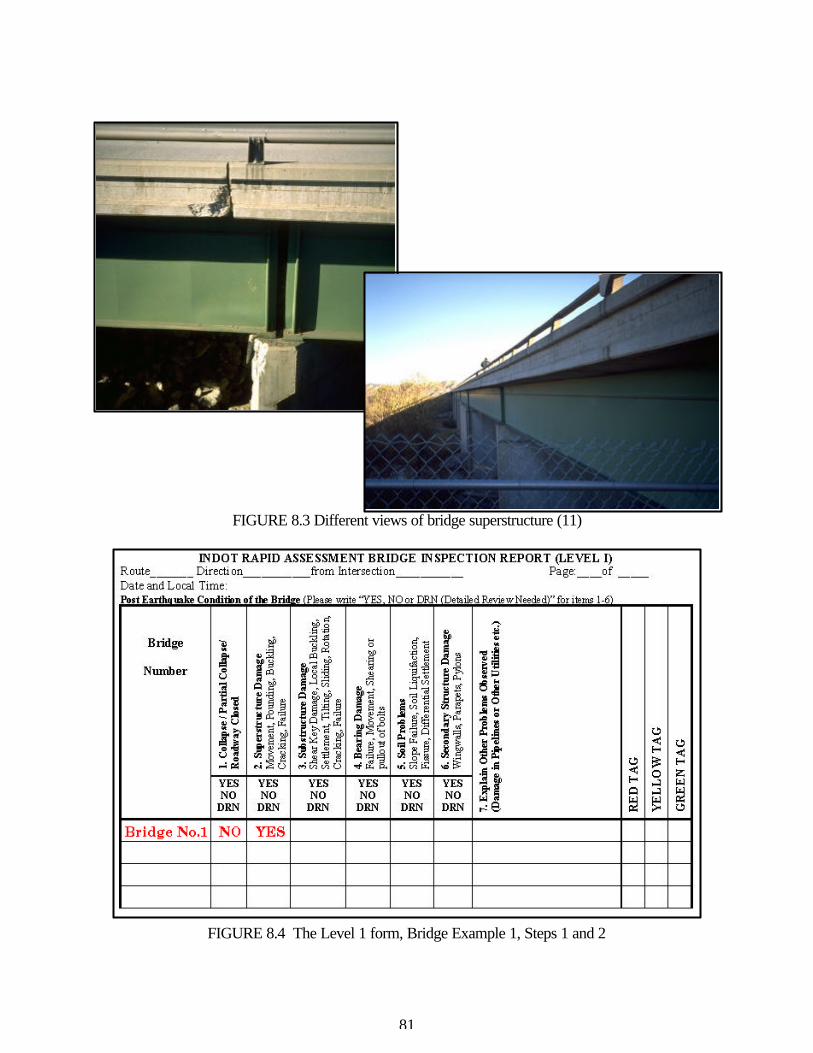
81
FIGURE 8.3 Different views of bridge superstructure (11)
FIGURE 8.4 The Level 1 form, Bridge Example 1, Steps 1 and 2

82
FIGURE 8.5 Damage to one of the bridge piers (11)
FIGURE 8.6 The Level 1 Form, Bridge Example 1, Step 3

83
FIGURE 8.7 Damage to the bridge bearings (11)

84
FIGURE 8.8 The level 1 Form, Bridge Example 1, Step 4
FIGURE 8.9 View of substructure and soil of the bridge (11)
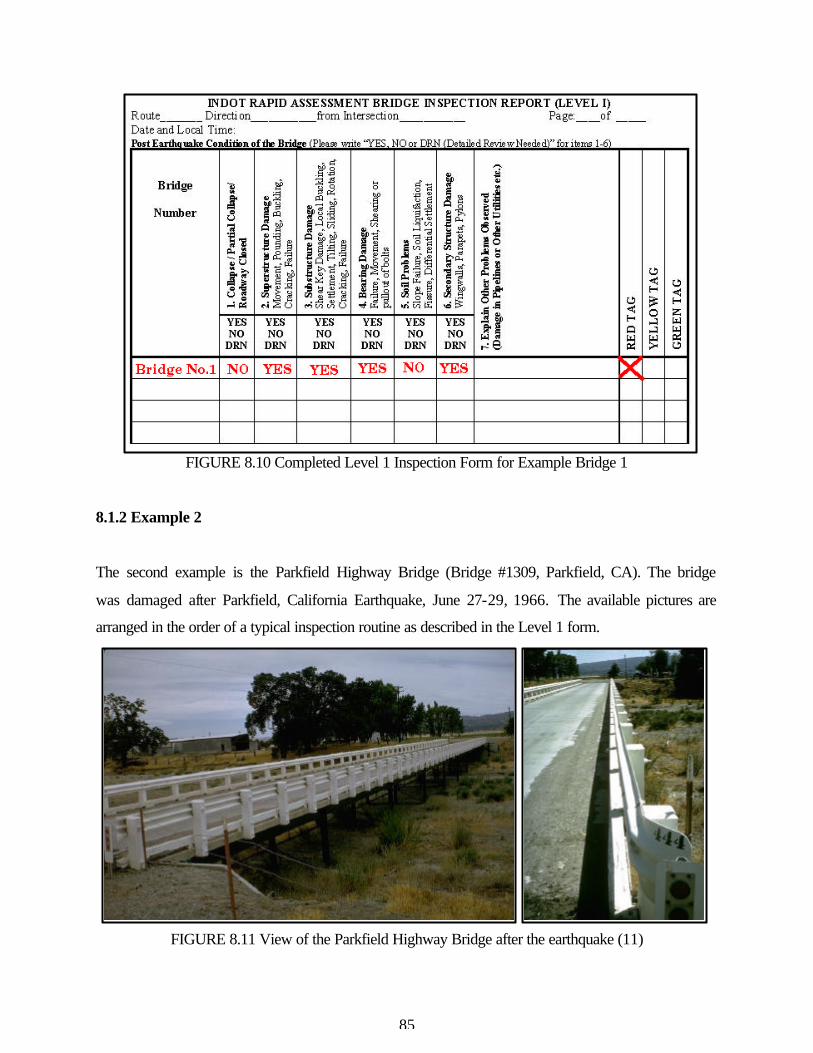
85
FIGURE 8.10 Completed Level 1 Inspection Form for Example Bridge 1
8.1.2 Example 2
The second example is the Parkfield Highway Bridge (Bridge #1309, Parkfield, CA). The bridge
was damaged after Parkfield, California Earthquake, June 27-29, 1966. The available pictures are
arranged in the order of a typical inspection routine as described in the Level 1 form.
FIGURE 8.11 View of the Parkfield Highway Bridge after the earthquake (11)

86
FIGURE 8.12 View of the damaged bridge components (11)

87
FIGURE 8.13 Completed Level 1 form for Example Bridge 2
8.1.3 Example 3
The Interchange Bridge between I-5 and I-210 (California), was damaged after San Fernando
EQ, 1971. The available pictures are arranged in the order of a typical inspection routine as
described in the Level 1 form. At the end, particular row in the Level 1 Inspection Form is
completed according to the damage scenes of the bridge.

88
FIGURE 8.14 Superstructure damage of the third example bridge after earthquake (11)

89
FIGURE 8.15 Substructure damage of the bridge (11)
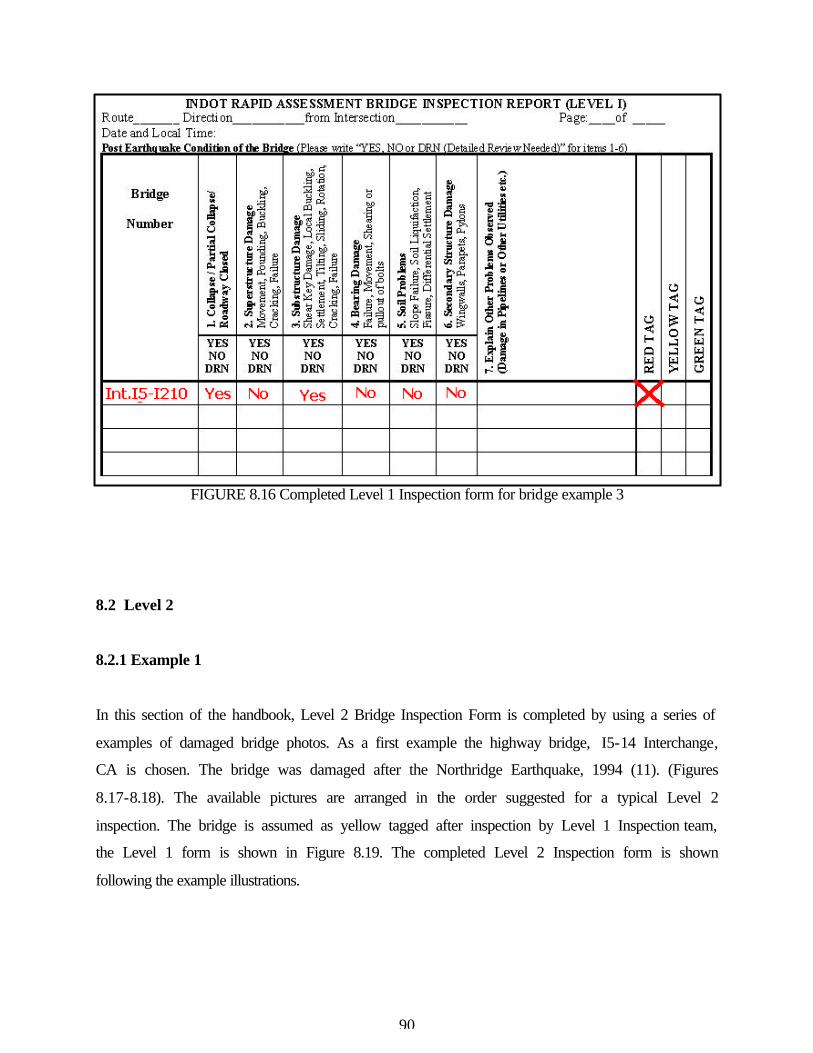
90
FIGURE 8.16 Completed Level 1 Inspection form for bridge example 3
8.2 Level 2
8.2.1 Example 1
In this section of the handbook, Level 2 Bridge Inspection Form is completed by using a series of
examples of damaged bridge photos. As a first example the highway bridge, I5-14 Interchange,
CA is chosen. The bridge was damaged after the Northridge Earthquake, 1994 (11). (Figures
8.17-8.18). The available pictures are arranged in the order suggested for a typical Level 2
inspection. The bridge is assumed as yellow tagged after inspection by Level 1 Inspection team,
the Level 1 form is shown in Figure 8.19. The completed Level 2 Inspection form is shown
following the example illustrations.

91
FIGURE 8.17 Different views from the superstructure of the bridge (11)

92
FIGURE 8.18 Different views of damage from the damaged bridge (11)

93
FIGURE 8.19 Completed Level 1 form for the example bridge (53-1620D)

94
FIGURE 8.20 Completed Level 2 Inspection Form, Bridge Example 1 (53-1620D)
8.2.2 Example 2
The I5-R216 Interchange Bridge (53-1626,CA) was damaged after the Northridge Earthquake,
1994 (11) (Figures 8.21- 8.24). The completed forms (Level 1 and 2) are shown following the
example photos those are arranged in order of a typical Level 2 inspection (Figures 8.25-26).
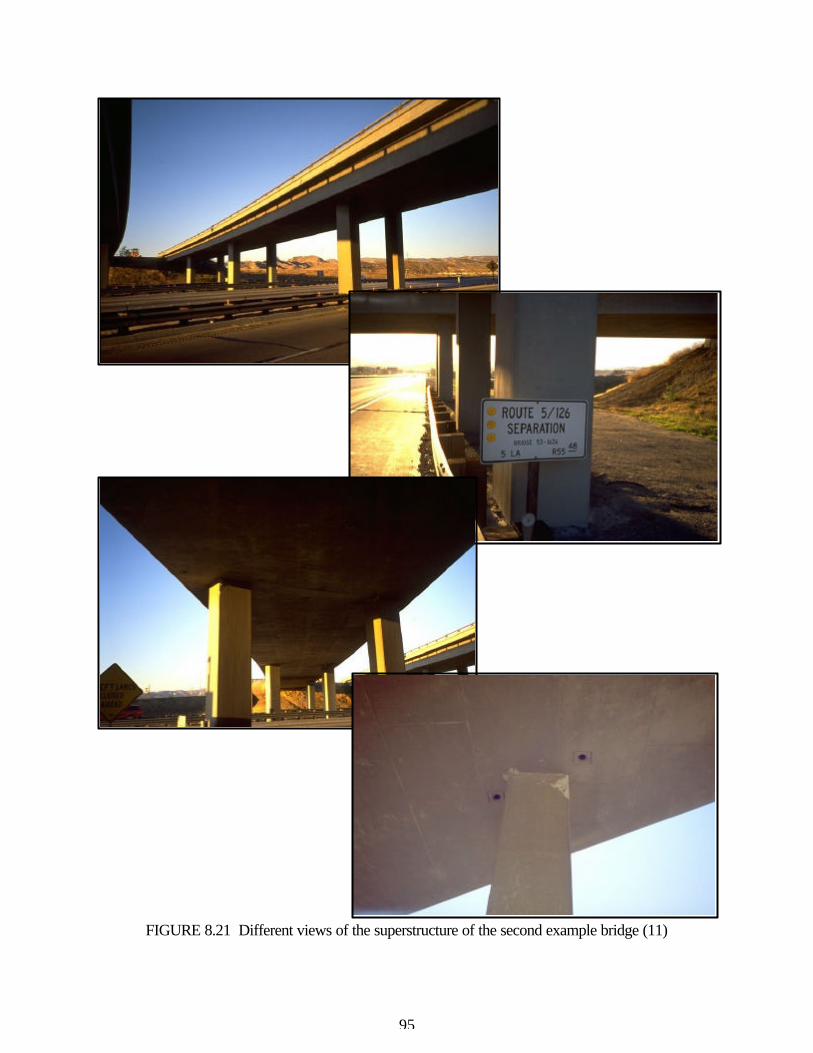
95
FIGURE 8.21 Different views of the superstructure of the second example bridge (11)
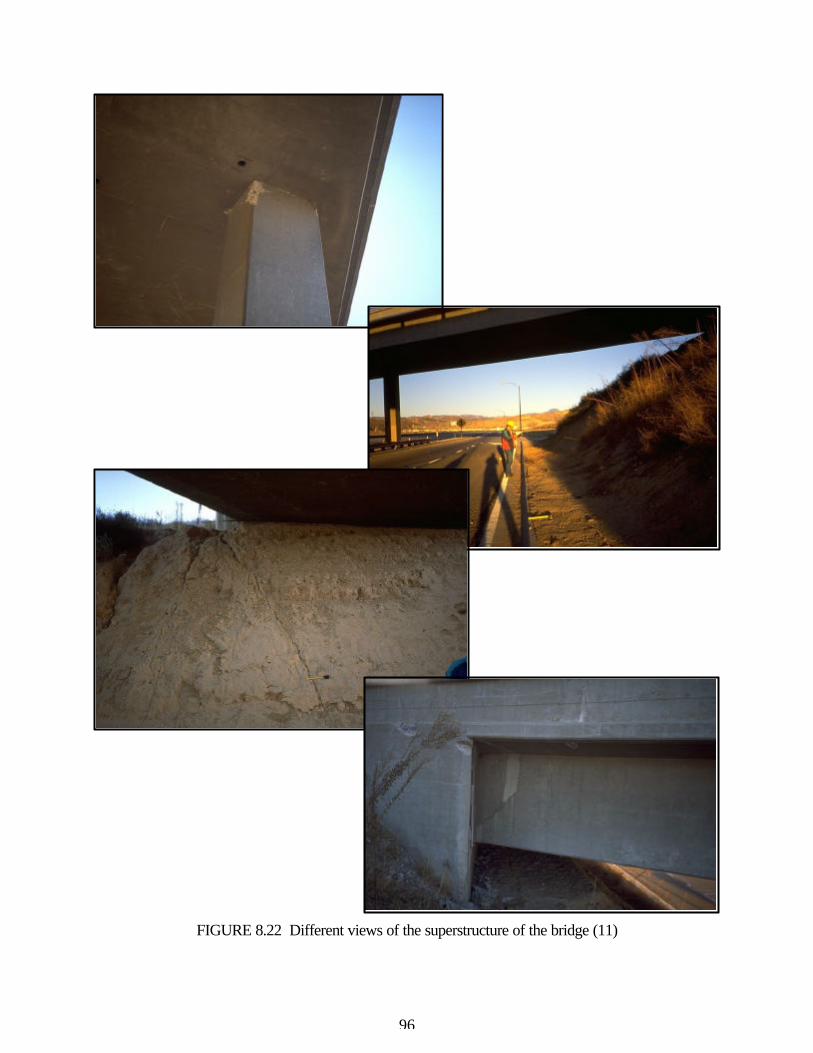
96
FIGURE 8.22 Different views of the superstructure of the bridge (11)

97
FIGURE 8.23 Different views of the superstructure of the bridge (11)

98
FIGURE 8.24 Different views of the second example bridge (11)

99
FIGURE 8.25 Completed Level 2 Inspection Form, Bridge Example 2

100
FIGURE 8.26 Completed Level 2 Inspection Form, Bridge Example 2

101
9. REFERENCES
1. Seismic Bridge Design Applications, Federal Highway Administration, Report SA-97-018,
1996
2. http://www.eas.slu.edu/Earthquake_Center/newmadrid1975-1995.html
3. Atkinson, W., “The Next New Madrid Earthquake, A Survival Guide”, Southern Illinois
University Press, 1989.
4. http://www.indstate.edu/gga/recent/indiana.gif
5. http://geohazards.cr.usgs.gov/eq/html/ceusmap.shtml
6. http://www.hsv.com/genlintr/newmadrd/
7. http://wwwneic.cr.usgs.gov/neis/states/indiana/indiana_history.html
8. Inventory of Bridges State Highway System of Indiana 1999-2000, Indiana Department of
Transportation
9. Indiana Department of Transportation, Vincennes District Picture Archive
10. http://www.koeri.boun.edu.tr /earthqk/earthqk.html
11. http://www.eerc.berkeley.edu/eqiis.html Northridge Collection, Earthquake Engineering
Research Center, University of California, Berkeley.
12. The Great Kansai Earthquake, Asahi Graph, Vol. 3794, Asahi Shimbun, February 1995.
13. The Earthquake Damage Research Report of Hyougo Ken Nanbu Zisin at 1995, Kajima
Corporation, Vol.1, February 1995.
14. The January 17, 1995 Kobe Earthquake, An EQE Summary Report, EQE International, 1995
15. Investigation Report on Bridge Damage In JiJi Earthquake on September 21, 1999, National
Center for Research on Earthquake Engineering, Taiwan, Roc, November 1999.
16. Vejvoda, M.F., “Strengthening of Existing Structures with Post-Tensioning,” Concrete
International, September 1992.
17. ACI Committee 224, “Causes, Evaluation, and Repair of Crack in Concr
224.1R-89
18. Saiidi, M., “Current Bridge Seismic Retrofit Practice in the United States,” Concrete
International, December 1992

102
19. Student Manual to Accompany Training Video on Post-earthquake Safety Evaluation of
Bridges State of Washington, Wiss Janey Elstner Associates, Inc., WJE No.942730, 1996
20. http://pubs.usgs.gov/gip/earthq3/contents.html
21. http://pubs.usgs.gov/gip/earthq3/contents.html
22. http://pubs.usgs.gov/gip/earthq1/plate.html
23. http://www.geo.mtu.edu/UPSeis/where.html
24. http://clgray.simplenet.com/paper/appendb.html
25. http://www.deprem.gov.tr
26. http://www.structures.ucsd.edu/Taiwaneq/index.html
27. The January 17, 1995 Hyogoken-Nanbu (Kobe) Earthquake, Performance of Structures,
Lifelines, and Fire Protection Systems, National Institute of Standards and Technology,
NIST Special Publication 901 (ICSSC TR18), July 1996.
28. http://adamite.igs.indiana.edu/indgeol/index.htm

103
APPENDIX
INDOT VINCENNES DISTRICT RESPONSE PROCEDURES FOR MAJOR DISASTERS
MAJOR DISASTER: A major disaster is defined as any incident that could cause extended
closure of our highway system. Examples could be localized incidents like fire, winds, tornado,
vehicle accidents and spills or non-localized incidents such as floods, ice storms, blizzards,
nuclear incidents or earthquakes (Intensity > 5.0 Magnitude). All INDOT personnel should
participate in appropriate disaster training and following a perceived disaster (and phones do not
work) report to their designated reporting station or the closest Unit to their home.
DISTRICT RESPONSE: As soon as possible following a major disaster incident, the Vincennes
District will open their District Emergency Operations Center (DEOC). Communications will be
established between affected subdistricts and central office. The Vincennes Emergency
Operations Center will be located in the new District Office building on US 41 just south of
Vincennes. The District presently has a 24-hour switchboard attendant. The DEOC will be
staffed by select department heads and designated staff.
SUBDISTRICT RESPONSE: As soon as possible following a major disaster, each affected
Subdistrict will open their Subdistrict Emergency Operations Center. Communications by phone
and radio will be established with all affected Subdistrict units and the Vincennes District.
Subdistricts should establish procedures to contact those people needed to perform disaster
activities including a system of notification if telephones are not working. The Subdistrict EOC
will be staffed by designated Subdistrict personnel with help from the other departments. If a
Subdistrict is not operational, an adjacent Subdistrict will take over as the Subdistrict EOC.
UNIT RESPONSE: As soon as possible following a major disaster, each affected Unit will open
their facility, establish communications by phone and radio and start Level 1 Inspections of all
Unit Primary Routes (Most units have 2 to 3 Primary Routes). Designated personnel from other

104
departments (such as construction) are to be assigned to the closest unit to assist that unit or
personnel may be sent between units as the need is identified.
UNIT LEVEL 1 INPECTIONS: Each Unit involved in the disaster will be responsible for the
Level 1 Inspection of the Units Primary Routes if the respective disaster warrants. Assigned Unit
personnel (normally two people per route) will pick up an Inspection Kit from their disaster
cabinet and inspect their assigned primary route reporting back the condition of the roadway and
all bridges on that route. Primary routes are road sections needed for access to critical areas such
as cities, hospitals, schools, industries, adjacent States. Once primary routes are inspected the
supervisor will determine if the secondary routes should be inspected. The Level1 Inspection will
be a visual assessment with short stops to inspect all bridges. It is important that Level 1
Inspections should be completed as quickly and accurately as possible so that a quick assessment
of the disaster can be made. Only interrupt your Level 1 Inspection to assist with a life-
threatening situation.
DURING THE LEVEL 1 INSPECTION:
1. Minor roadway deficiencies should be recorded on the Level 1 Inspection Form including
pavement damage, earth embankment failures, road obstructions and failure of traffic control
devices. Any roadway damage requiring the closing of the roadway should be relayed back to
the Unit / Subdsitrict / District office immediately. Each inspection crew will carry a set of
Road Closure Signs to be used in such an event.
2. All bridges are to be inspected using the Level 1 Inspection Form with bridges identified.
Approach all bridges with caution and never walk directly under a bridge following an
earthquake. Do not cross the bridge without first sighting down the curb/rail line and
checking the underside for structural damage. Do not cross the bridge if significant problems
are observed. Close the bridge by placing Road Closed Signs on each approach and place a
Red Ribbon with time, date and your initials on the bridge signpost. Use the provided
State/County Map to find a route around closure. If the bridge is passable but repairs are
needed place a Yellow Ribbon or place a Green Ribbon if no problems are found. Place
ribbons on bridge sign post just under the sign and remember to time/date/initial for possible
follow up inspections. Record all observations and proceed to the next structure. Level 1

105
Inspection Training for unit personnel will be done in house by District personnel using
materials provided by Purdue University.
REQUIRED MATERIALS FOR EACH LEVEL 1 INSPECTION CREW: All noted materials
below must be kept in the units Disaster Signal Box located in the yard of each unit.
1. The Units A, B, C,…. Primary Route Maps with detour county maps and state maps and
inspection procedures (in box).
2. Red Ribbon to close, Yellow Ribbon to identify open but repairs needed and Green Ribbon
to denote undamaged with color wording on ribbon (in box).
3. A tablet with waterproof markers, pen, pencil (in box).
4. Load one set (2 signs) of “Road Closed” signs with B flashers and stands.
5. Load shovel/barrels/cones/traffic control paddles (from unit) in truck.
6. Flashlight, fire extinguisher, hard hats, vests, first aid kit and personal items should go with
each radio equipped Level 1 Inspection truck.
LEVEL 2 INSPECTION TEAM: Each unit reporting roadway or bridge damage requiring
Closure (red) or Damage (Yellow) will report it back to the Unit/Subdistrict/District who will
assign a Level 2 Inspection team to do more in-depth inspection of the damage. The Level 2
Inspection team will be a minimum two-person team made up of at least one trained professional
engineer (CE) or experienced project supervisors (EAS). A list of Level 2 trained personnel
assigned to each Subdistrict/Unit will be kept on file. Level 2 personnel will be formally trained
using materials provided by Purdue University. Unless assigned otherwise each CE & EAS is to
report to the closest unit to their home.
LEVEL 3 INSPECTION TEAM: If additional inspection is needed it will be initiated by CO
using in-house design personnel or consultants.
COMMUNICATIONS: It is likely to be a major problem in any disaster. INDOT will prepare
for the loss of phones and radio towers by setting up a mobile to mobile system by strategically
locating 100 watt radio equipped maintenance vehicles to relay to any part of the district. A letter
identifying 100-watt vehicles and a map where vehicles are to be located shall be kept in each

106
disaster kit at the Subdistrict. Traffic will make operational a boom truck that will have an
antenna capable of working as a temporary tower. All subdistricts will maintain their emergency
power generations and wiring will be done at units to allow the connection of a portable
generator for emergency power. During any such disaster minimize your use of the radio and
phone to only critical information such as road closures.
MAJOR DISASTER PROCEDURES FOR UNITS:
The first person to arrive at the Unit should gain access and then:
1. Turn off the incoming gas if the Unit building has been damaged or if gas is smelled
(earthquake/tornado). Do not turn on lights prior to checking for leaking gas. The gas valve
with wrench is located _______________________________________________________.
Also, if electricity is damaged, you may want to disconnect the breaker or shut off water if a
leak is discovered. Units should label all critical gas and water valves. If no key is available
access may have to be gained by cutting/breaking locks.
2. Establish communications with the Subdistrict by telephone and radio and start the Unit
Communications Log, always have someone assigned to monitor communications. If a phone
connection is made with the Sub you may want to leave it open and not hang up to maintain
an open line. Each unit shall id vehicles with 100-watt radios and assigns them to relay
locations such as the unit and strategic hilltops if towers are down.
3. Unlock all doors, locate vehicle keys and start emergency generator, if available and as
needed. Extra vehicle keys may need to be stored in the Units Disaster Signal Box if your
unit building is likely to be affected (older brick buildings). A complete set of backup
vehicle/facility keys should be kept at the Subdistrict.
4. As additional personnel report to the Unit, they should immediately start the Units Primary
Route Level 1 Inspections unless directed otherwise by the Subdistrict. You should assign
two maintenance workers to each primary route. All materials for the inspection should be
available in the Disaster Signal Cabinets or unit.
A. Sign the route assignment sheet and pick up the primary “A” route kit. Later workers will
pick up routes B or C until all routes are being inspected.

107
B. Each Inspection Kit will include a primary route map with detour state and county maps
and inspection procedure, Red Yellow and Green Ribbon, tablet, waterproof marker, pen
and pencil.
C. Load your radio-equipped truck with 2 road-closed signs, B flashers and stands, shovel,
barrels, cones and traffic control paddles.
D. Vehicle should already contain flashlight, fire extinguisher, hard hats, vests, first aid kit
and personal items such as food, water and clothing.
E. Driver should read instructions and begin the Primary Route Level 1 Inspection.
F. When the Primary Route Inspection is completed and you have returned to the Unit, sign in
on the route assignment sheet and report to your supervisor.
G. If all routes have been assigned for inspection additional personnel who arrive should
prepare equipment for possible use.
DISASTER ROAD/BRIDGE CLOSURE PROCEDURE
INDOT has a formal procedure for the planned closing of a road or bridge that includes pre-
closure notification to the public (through the media & signs), marking a detour/approach and
signing the actual barricade closure. In a major disaster, this procedure will be impossible to
follow but INDOT has a responsibility to take all reasonable actions to notify and protect the
public as soon as the need for a road closure is known. To that end each unit shall maintain a
minimum of one set of “Road closure” signs with type B flashers and sign supports for each
primary disaster route in their unit. The Level 1 inspectors shall load one Road Closure setup (2
signs) onto their truck prior to starting their inspection. If the need for a closure is encountered
during the inspection, the signs will be put on each approach and the Unit/Subdistrict will be
immediately notified by radio so that the approach signing, barricading and a detour can be
placed in a timely manner by follow up personnel. Once the sign is placed the Level 1 inspectors
shall continue the inspection on their primary route using the state and county maps to find a way
around the closure. If additional closures are encountered that information is to be relayed back
to the Unit/Subdistrict for assistance. One inspector may have to remain at the closure until
relieved if no signing or other traffic control is available (try to use local law enforcement if
available). The Sub is complete State Form 1866 to notify other agencies of the emergency
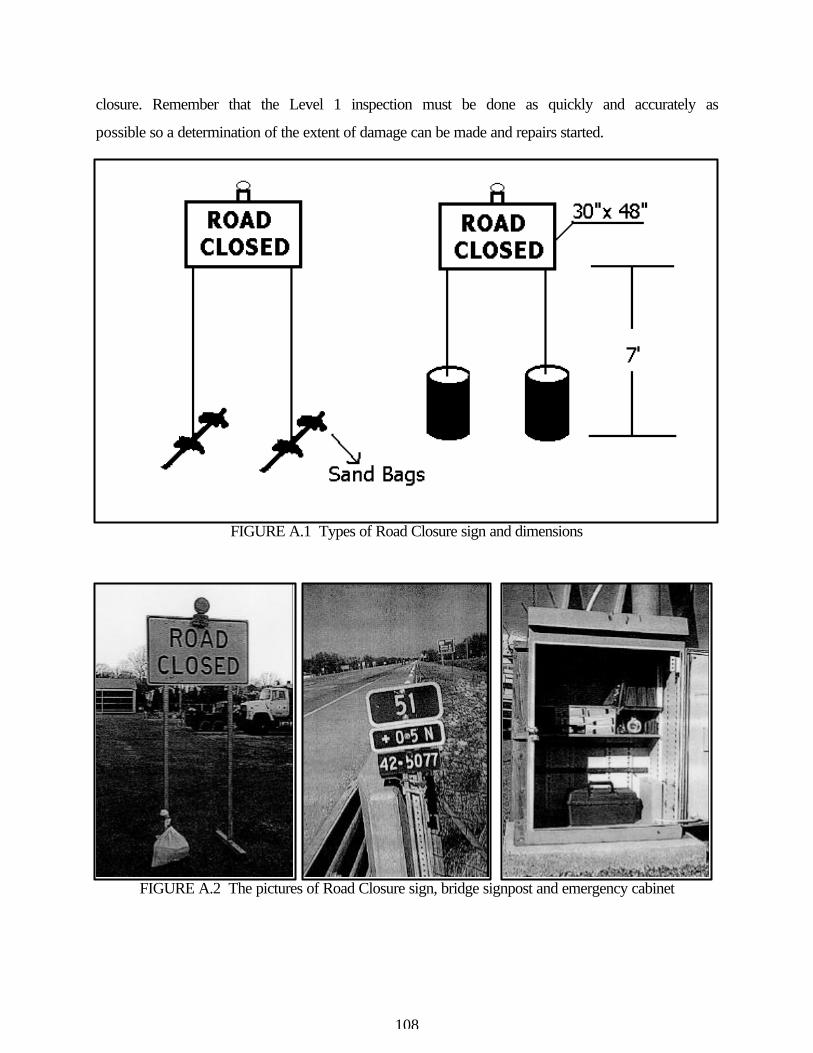
108
closure. Remember that the Level 1 inspection must be done as quickly and accurately as
possible so a determination of the extent of damage can be made and repairs started.
FIGURE A.1 Types of Road Closure sign and dimensions
FIGURE A.2 The pictures of Road Closure sign, bridge signpost and emergency cabinet

109
FIGURE A.3 The map of primary routes in Vincennes District

110

111
EARTHQUAKE PREPAREDNESS
BEFORE
Develop a family earthquake plan. Prepare yourself, your family and your home by completing the activities on this checklist. • Decide how and where your family will reunite if separated. • Choose an out-of-state friend or relative that separated family members can call after the quake to report their whereabouts and condition. • Know the safe spots in each room: under sturdy tables, desks, against inside walls. • Know the danger spots: windows, mirrors, hanging objects, fireplaces, bookcases, tall and unsecured furniture. • Conduct practice drills. Physically place yourself in safe locations. • Learn first aid and CPR (cardiopulmonary resuscitation) from your local Red Cross chapter or other community organizations. • Keep a list of emergency phone numbers. • Learn how to shut off gas, water and electricity in the case the lines are damaged. (Safety note: Do not attempt to relight gas pilot) • Secure water heater and appliances that could move enough to rupture lines. • Secure heavy furniture, hanging plants, heavy pictures or mirrors. • Keep flammable or hazardous liquids in cabinets or on lower shelves. Put latches on cabinet doors to keep them closed during shaking. • Maintain emergency food, water and other supplies, including a flashlight, a portable battery-operated radio, extra batteries, medicines, first aid kit and clothing (for 3 day long).
DURING If indoors, stay there, take cover under a table, desk, or other sturdy furniture: • Face away from windows and glass doors. • Doorways without doors are OK also. • Lay, kneel, or sit near a structurally sound interior wall or corner away from windows, brick fireplaces, glass walls. • Protect your head and body from falling or flying objects. • Remain until shaking stops. Think out your plan of action first, and then move. • Know exit routes if in commercial building. Take cover, don’t move till shaking stops. If outside, get into an open area away from trees, buildings, walls and power lines: • Lie down or crouch low to maintain balance. • Get to best available shelter if there not open area available. If driving, stop safely as soon as possible. Stay inside until the shaking stops: • Do not stop under overpasses or bridges. • Stay below window level in your car. • Turn off engine. • Turn on radio. Fellow emergency instructions. • Stay in vehicle if downed power lines have fallen across it. You are insulated by the tires. Wait for help. You might be able to back away from lines. • If you have to leave your vehicle, move to open area quickly.
AFTER Check for injuries. Apply first aid. Do not move seriously injured individuals unless they are in immediate danger. Do not use the telephone immediately unless there is a serious injury or fire. • Check utilities (water, gas, electric). If there is damage turn utility off at the source. • Check for other hazards and control them (fire, chemical spill, toxic fumes and precarious collapse). • Check building for cracks and damage, including roof, chimneys, and foundation. • Check food and water supplies. • Emergency water can be obtained from water heaters, melted ice cubes, canned vegetables, and toilet tanks. • Never use matches, lighters or candles inside. • Turn on radio and listen for emergency broadcasts/announcements, news reports, and instructions. Cooperate with public safety officials. • Do not use your vehicle unless there is an emergency. Keep the streets clear for emergency vehicles. • If buildings are suspect, set up your shelter area away from damage. • Work together with your neighbors for a quicker recovery. Stay calm and lend a hand to others. • Be prepared for after shocks. • Plan for evacuation in case events make this necessary. Leave written messages for other family members or searchers. • Use gloves, wear heavy shoes, have adequate and appropriate clothing available. • Contact to your work site and report

112
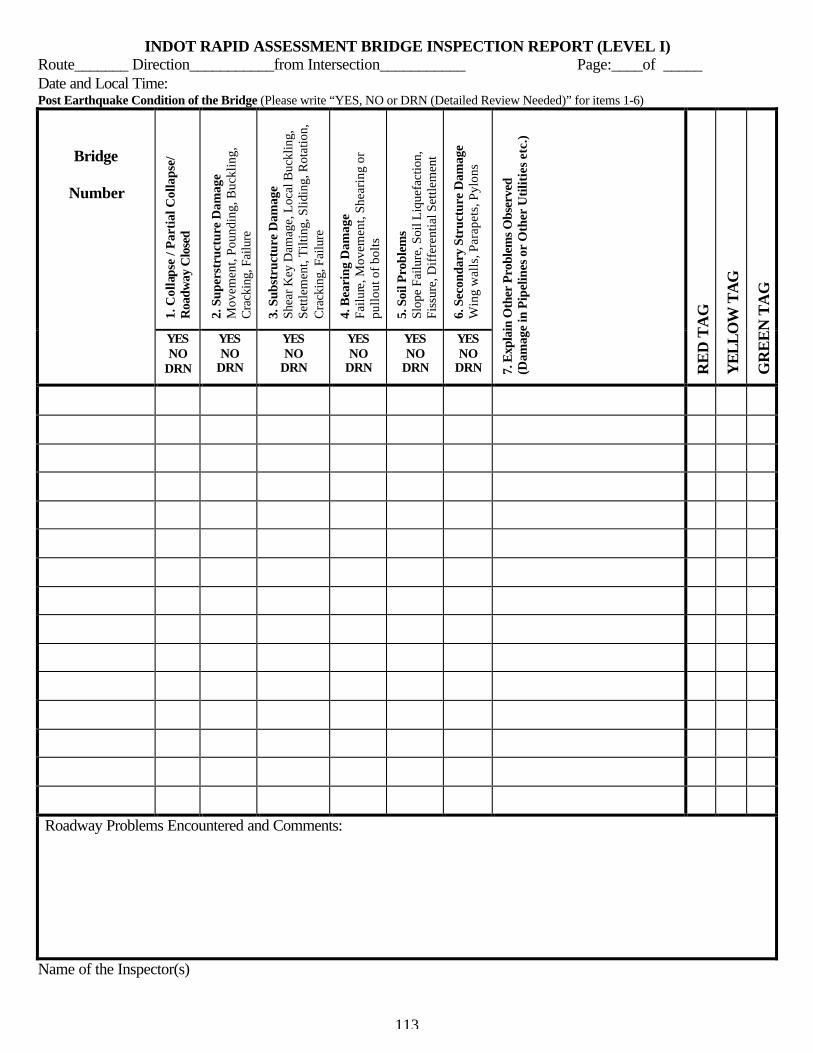
113
INDOT RAPID ASSESSMENT BRIDGE INSPECTION REPORT (LEVEL I) Route_______ Direction___________from Intersection___________ Page:____of _____ Date and Local Time: Post Earthquake Condition of the Bridge (Please write “YES, NO or DRN (Detailed Review Needed)” for items 1-6)
1. C
olla
pse
/ Par
tial
Col
laps
e/
Roa
dway
Clo
sed
2. S
uper
stru
ctur
e D
amag
e M
ovem
ent,
Poun
ding
, Buc
klin
g,
Cra
ckin
g, F
ailu
re
3. S
ubst
ruct
ure
Dam
age
Sh
ear K
ey D
amag
e, L
ocal
Buc
klin
g,
Settl
emen
t, T
iltin
g, S
lidin
g, R
otat
ion,
C
rack
ing,
Fai
lure
4. B
eari
ng D
amag
e
Failu
re, M
ovem
ent,
Shea
ring
or
pullo
ut o
f bol
ts
5. S
oil P
robl
ems
Sl
ope
Failu
re, S
oil L
ique
fact
ion,
Fi
ssur
e, D
iffe
rent
ial S
ettle
men
t
6. S
econ
dary
Str
uctu
re D
amag
e W
ing
wal
ls, P
arap
ets,
Pyl
ons
Bridge
Number
YES NO
DRN
YES NO
DRN
YES NO
DRN
YES NO
DRN
YES NO
DRN
YES NO
DRN 7. E
xpla
in O
ther
Pro
blem
s O
bser
ved
(D
amag
e in
Pip
elin
es o
r O
ther
Uti
litie
s et
c.)
RE
D T
AG
YE
LL
OW
TA
G
GR
EE
N T
AG
Roadway Problems Encountered and Comments:
Name of the Inspector(s)

114

115
INDOT DETAILED BRIDGE INSPECTION REPORT (LEVEL II) Route: Date and Local Time: Bridge ID: Bridge Location : DAMAGE OBSERVED: 1. ROADWAY/APPROACHES 4. SUPERSTRUCTURE
Reinforced Concrete Slab 1 Flexural Cracks 1 Shear Cracks 1 Connection Failure 1 No Damage 1 N/A
Culverts 1 Flexural Cracks 1 Shear Cracks 1 Local Buckling 1 Connection Failure 1 Metal Pipes Distortion & Deflection 1 No Damage 1 N/A
Tr Steel Truss Members, Floor Beams, Stringers 1 Local Buckling 1 Upper Chord 1 Lower Chord 1 Diagonals 1 Connection Failure 1 No Damage 1 N/A
Concrete Arches 1 Flexural Cracks 1 Shear Cracks 1 Connection Failure 1 Spandrel Wall Cracking/Collapse 1 No Damage 1 N/A
Steel/Concrete Girders, Beams 1 Flexural Cracks 1 Shear Cracks 1 Connection Failure 1 Local Buckling 1 No Damage 1 N/A
1 Not Operational 1 Roadway Settlement 1 Off Bridge Seat 1 Excessive Transversal Movement 1 No Damage 1 Other (explain)
2. DECK 5. SUBSTRUCTURE Abutments 1 Wall Movement/Rotation 1 Pounding Damage 1 Wing wall Movement 1 Wing wall Separation 1 Backfill Settlement 1 Foundation Movement 1 Abutment Pile Damage 1 Cracking on the Walls 1 No Damage 1 N/A
1 Longitudinal Joints Enlarged 1 Expansion Joints Enlarged 1 Wearing Surface Cracking 1 Wearing Surface Spalling 1 Deck Cracking/Spalling 1 Misalignment of Guard Rails, Curbs, Pavement Lines 1 No Damage
Piers 1 Joint Failure 1 Moment Failure 1 Shear Failure 1 Inadequate Splice Failure 1 Flexural Cracks 1 Shear Cracks 1 Local Buckling 1 Foundation Failure 1 No Damage 1 N/A
3. BEARINGS 6. GEOTECHNICAL 1 Failure of Bearings (Integral, Contact, Rocker, Elastomeric) 1 Movement of Bearings 1 Shearing or Pullout of Bolts 1 No Damage
1 Slope Failure 1 Settlement 1 Soil Liquefaction 1 Fault Movement 1 Other 1 No Damage 1 N/A
COMMENTS FOR REPAIR AND RECOMMENDATIONS: 1. BARRICADE NEEDED 2. IMMEDIATE SHORE AND BRACE 3. REPAIR
3a. In-House Repair Possible 3b. Outside Contractor Needed
4. EMERGENCY VEHICLE USE ONLY 5. MONITORING UNDER SERVICE NEEDED 6. OTHER (explain)
Overall Rating For the Bridge: SAFE (Green Tag):_______MORE REVIEW NEEDED (Yellow Tag) ________UNSAFE(Red Tag):__________ Name of the Inspector(s):

116

117
QUESTIONNAIRE FOR THE WORKSHOP OF POST-EARTHQUAKE SAFETY EVALUATION OF BRIDGES AND ROADS IN THE STATE OF INDIANA We appreciate your effort in completing all items on this evaluation form. Your comments and constructive criticisms will be carefully studied and will be used to improve the workshop material for future presentations to the other INDOT personnel. Please mark the box that you feel best indicates the quality and effectiveness of the item being evaluated.
THE RATING ABOUT
WORKSHOP CONTENT, MATERIAL, PRESENTATION.
NO
T
APP
LIC
AB
LE
VE
RY
PO
OR
PO
OR
AV
ER
AG
E
GO
OD
y G o
1. Were the objectives of the workshop clearly defined and accomplished?
Comments: 2. Do you believe that subjects were covered adequately in
the allocated time?
Comments: 3. Did the presentations have the right combination of theory
and practice?
Comments: 4. Was the use of the handbook in the classroom effective?
Comments: 5. Will the workshop material serve as a useful reference for
you in the future?
Comments: 6. What is your opinion about the workshop examples and
exercises?
Comments: 7. Were the instructors able to convey the objectives of the
workshop properly?
Comments: 8. Were the participants of the workshop given adequate
opportunity to ask questions and get the satisfactory answers?
Comments: 9. Was the instruction well organized?
Comments: 10. What is your overall assessment about this workshop?
Comments: 11. Do you feel yourself ready to go out and inspect the
bridges?
Comments: