Embed Size (px)
Citation preview
u.s. Department of Justice National Institute of Corrections
Handbook for Evaluating Objective Prison Classification Systems
« •
•
If you have issues viewing or accessing this file contact us at NCJRS.gov.
National Institute of Corrections
M. Wayne Huggins, Director Susan M. Hunter, Chief, Prisons Division
Anna Z. Thompson, Project Manager
-----~~--~
Handbook for Evaluating
Objective Prison Classification Systems
Prepared by
Jack Alexander, Ph.D.
and
James Austin, Ph.D.
National Council on Crime and Delinquency San Francisco, CA 94105
-~ Afooo.' .... ..... f' .,., ."
June 1992
Prepared under Grant Number 89POIAOIO from the National Institute of Corrections, U.S. Department of Justice. Points of view or opinions stated in this document are those of the authors and do not necessarily represent the official position or policies of the u.s. Dep~rtment of Justice.
U.S. Department of Justice National Institute of Justice
139891
This document has been reprodw;:ed exactly as received from the person or organization originating it. Points of view or opinions stated in this document are those of the authors and do not necessarily represent the official position or policies of the National Institute of Justice,
Permission to reproduce this ApI7 "'d( material has been granted by
Public Domain/NIC u. s. Department of Justice
to the National Criminal Justice Reference Service (NCJRS),
Further reproduction outside of the NCJRS system requires permission of the ~owner.
TABLE OF CONTENTS
CHAPTER ONE: INTRODUCTION ........................................... . 1 Objectives Of The Handbook. . . . . . . . . . . . . . . . . . . . . . . . . . . . . . . . . . . . . . . . . . .. 1 Overview Of Prison Classification Evaluations . . . . . . . . . . . . . . . . . . . . . . . . . . . . . . . .. 2 Setting Standards For Conducting Prison Classification Evaluations .............. . . . . .. 5 Ethical Issues In Prison Evaluation ..... . . . . . . . . . . . . . . . . . . . . . . . . . . . . . . . . . .. 6 Prison Classification Evaluation Components ................................. . Evaluation lvlethods ................................................ . The Context Of Evaluations ........................................... . General Standards For The Evaluation Of Objective Classification Systems .............. .
8 8 9 9
CHAPTER TWO: EVALUATION GOALS ....................................... 10 Impact Evaluation Goals And Validation Goals. . . . . . . . . . . . . . . . . . . . . . . . . . . . . . . .. 10 Process Evaluation Goals . . . . . . . . . . . . . . . . . . . . . . . . . . . . . . . . . . . . . . . . . . . . .. 14 Selection Of Evaluation Goals ........................................... 16 Standards For Evaluation Goals ... . . . . . . . . . . . . . . . . . . . . . . . . . . . . . . . . . . . . . . . 17
CHAPTER THREE: EVALUATION QUESTIONS ................................... 19 Definition Of An Evaluation Question ...................................... 19 Examples Of Evaluation Questions ........................................ 19 Standards For Evaluation Questions . . . . . . . . . . . . . . . . . . . . . . . . . . . . . . . . . . . . . . . . 28
CHAPTER FOUR: EVALUATION DESIGNS AND METHODS . . . . . . . . . . . . . . . . . . . . . . . . .. 29 Types Of Evaluation Design ............................................ 29 Evaluation Methods ................................................. 42 Standards For Evaluation Designs And Methods . . . . . . . . . . . . . . . . . . . . . . . . . . . . . . . . 43
CHAPTER FIVE: MEASURES ...................................... , . . . . . . . . 44 Definition Of Measures ............................................... 44 Examples Of Measures ............................................... 47 Standards For Measures ............................................... 51
CHAPTER SIX: SAMPLING ............... " . . . . . . . . . . . . . . . . . . . . . . . . . . . . . . . 52 Definition Of Sample ................................................ 52 Sampling Methods .................................................. 56 Example Of Sampling Methods .......................................... 60 Standards For Sampling ............................................... 61
CHAPTER SEVEN: DATA COLLECTION ....................................... 63 Introduction ...................................................... 63 General Data Collection Issues . . . . . . . . . . . . . . . . . . . . . . . . . . . . . . . . . . . . . . . . . . . 63 Data Collection For Highly Structured Methods And Measures . . . . . . . . . . . . . . . . . . . . . . . 64 Data Collection For Moderately Structured Methods And Measures . . . . . . . . . . . . . . . . . . .. 64 Data Collection For Loosely Structured Methods And Measures ...................... 66 Standards For Data Collection ........................................... 66
CHAPTER EIGHT: STATISTICAL METHODS .................................... 68 Introduction ...................................................... 68 Choosing The Appropriate Statistics ....................................... 68 Standards For Statistics ............................................... 76
SUMMARY OF EVALUATION STANDARDS . . . . . . . . . . . . . . . . . . . . . . . . . . . . . . . . . . . . . 79 GLOSSARIES ... . . . . . . . . . . . . . . . . . . . . . . . . . . . . . . . . . . . . . . . . . . . . . . . . . . . . . . . 83 REFERENCES ......................................................... 89
iii

c -~-~----------~---~~~~~~~~~~~-;l j}
ACKNOWLEDGEMENTS
A number of persons contributed to the production of this manual. Special thanks to Anna Thompson, our project monitor, who helped manage the project and provided guidance. Nola Joyce, Lorraine Fowler, Jim O'Connell, Bruce Frederick, and Chris Baird provided substantive materials and helpful critiques of the earlier drafts. FinaUy, we woulu like to acknowledge the indirect involvement of numerous correctional professionals who are responsible for whatever improvements are being achieved. We hope this manual is of direct benefit to them in their work.
iv
FOREWORD
The development of fair, objective, and manageable offender classification systems has been a significant concern of correctional administrators for some time. Institutional populations are growing and prison overcrowding is a fact of life in virtually every correctional system in the nation. Under these conditions, a sound classification system is an invaluable management tool. Building and facility expansion programs are critically affected by classification decisions, as is resource allocation for programming. Additionally, parity issues and the possibility of litigation are major concerns.
This document presents a critical review of issues relevant to the evaluation of correctional classification systems. Some of the topics covered are standards for conducting classification evaluations; impact evaluation and validation goals; evaluation questions, designs, and methods; and sampling and data collection techniques. Examples used reflect actual evaluations of classification systems and should be helpful in clarifying areas of concern.
It is hoped that this document will provide correctional professionals with a tool for more effectively and efficiently managing their departments.
v
/'~ ~ '//,/ h
M. WaY~inS' D tor National Institute of Corrections
February 1992
-----------------------------------
CHAPTER ONE
INTRODUCTION
OBJECTIVES OF THE HAI\lDBOOK
The evaluation of classification systems requires cooperation between persons experienced in evaluation and persons experienced in classification. The purpose of this handbook is to build a bridge between evaluator and practitioner, so that each understands the language and issues of the other. In this way it is hoped to increase the use and effectiveness of evaluation by improving classification for every prison system and for the discipline as a whole.
This handbook provides prison administrators and evaluators with information on how to best evaluate their objective cla.ssification systems. It offers guidance on the types of evaluations that should be conducted l how they should be designed and implemented, how data should be collected and analyzed, and how findings can be interpreted.
Objective classification systems are those in which classification decisions are based on explicitly defined criteria rather than subjective judgments. The objective criteria are organized into a classification instrument accompanied by operational procedures for applying the instrument to inmates in a systematic manner. The objectivity of a classification system is a matter of degree, for the creation of these systems involves subjective judgments, and all of the systems currently in existence incorporate at least some subjective staff judgment.
Objective classification systems cover many areas, such as custody level, mental health, substance abuse, and programmatic needs. This handbook focuses on security and custody classification, because it is currently a central concern of corrections and criminal justice practitioners. However, the principles set forth apply equally to the evaluation of objective classification instruments in other areas.
Many states have implemented various forms of objective classification systems over the past decade, but few states have undertaken rigorous evaluations of their systems. While many administrators believe their classification systems are functioning properly, there is little scientific evidence to substantiate their claims. It is not known whether current classification systems are valid or whether they are having a positive or negative impact on prison operations.
This opening chapter introduces the importance of evaluating classification and reviews the most important studies conducted to date. Standards for conducting evaluations and ethical issues that must be considered in conducting research on human subjects are examined. Process and impact evaluations and validation are then briefly reviewed' along with data collection methods.
1
OVERVIEW OF PRISON CLASSIFICATION EVALUATIONS
The most general reason for evaluating any classification system is to assess whether goals of classification are being achieved, and to what degree. Since money, staff, and time are allocated to classification activities; it is natural to follow up with an assessment of whether this allocation of resources is achieving the desired effects. Classification activities are linked to virtually every major correctional policy (Brennan, 1987b), the evaluation of classification often includes an examination of most major policy goals of prisons (e.g., inmate and staff safety, orderliness, fairness and equity, least restrictive custody, efficiency in use of prison resources).
Evaluation is also used to support a decision to modify or terminate an existing classification system. Weaknesses can be identified and improvements made, or there may be a decision to completely discontinue a flawed approach and seek a new classification system. Evaluation can provide the evidence to make such decisions on a rational basis.
Finally, evaluation is essential for general advances in the field of classification. A body of well-designed and implemented evaluations done in different jurisdictions can provide the knowledge base for improvement in the field.
There is major distinction between evaluations that are "one-shot" procedures (Le., one discrete study is conducted) and those that are incorporated into prison operations as ongoing activities. A one-shot evaluation is usually large-scale and requires staff with technical expertise and specially designated funds. Because such evaluations require a significant share of scarce resources, they can only be done occasionally. Therefore they should focus on crucial issues, preferably those that concern the field of cl2.ssification as a whole.
Where evaluation is incorporated into prison operations, it assumes a continuous monitoring function to determine the degree to which various classification goals and pblicies are achieved. This monitoring may be conducted on a scheduled or as-needed basis. Reports are provided to management about the level of policy compliance in prisons and the sources of non-compliance. In this approach, evaluation activities are integrated into the management, planning, and policy setting procedures of the prison. Equally important, such continuous monitoring reports provide feedback on perfNmance to staff.
Lack of Formal Prison Classification Evaluation
Despite the obvious need for evaluation, very few "formal" evaluation studies have been done. As part of this project, a national survey was conducted by the National Council on Crime and Delinquency (NCCD) to determine how many states had conducted formal evaluations of their classification systems during the past five years and to review the results of those studies. Only 19 jurisdictions had conducted formal studies. For many states, the motivation for their studies was either litigation requiring that an evaluation be done or federal funding to a third party research organization.
2
The dearth of formal evaluations in this area can be traced to the following factors:
• Administrator disinterest and apathy regarding classification;
• Low awareness of the importance and functions of classification;
• Lack of awareness of the management uses of classification;
• Inadequate background and training in classification techniques (Fowler and Rans, 1982);
• Lack of personnel trained in evaluation;
~ Lack of agency resources committed for the purposes of conducting evaluations;
• Lack of information that can be used for evaluation purposes.
Consequences of Avoiding Formal Evaluation
Avoidance of formal evaluation has several negative consequences. In the broadest sense, objective prison classification systems should be viewed as untested and in their infancy. Most of these systems were designed and introduced during the past decade. Since very few have undergone rigorous evaluation, it is difficult to claim that these systems are having a positive impact on prison operations. Consequently, it is imperative that evaluations be conducted to determine whether these new methods for classifying prisoners are meeting intended objectives.
On a more operational level, it must also be determined whether policies linked to classification are being undermined (Fowler and Rans, 1982; Brennan, 1987b). Administrators may not know whether the classification system is working, may have little knowledge of its weaknesses, and may remain unaware of whether classification goals are being achieved. Feedback on how to update the classification system may be missing. The system may stagnate, becoming progressively less appropriate for the facility, and may finally need to be abandoned.
Failing to evaluate objective classification systems is to neglect one of the greatest advantages of these systems. One of the potential strengths of objective classification systems is that they are particularly amenable to evaluation. Because all the elements of these systems are explicitly defined, they generate data that can be used for evaluations. They can be evaluated precisely, and specific recommendations for improvements can be offered.
Review of Major Classification Studies Conducted to Date
As noted above, the NeCD conducted a survey of all prison classification evaluations completed and published by state prison systems during the past five years. Seventeen states (Arizona, California, Colorado, Illinois, Iowa, Louisiana, Massachusetts, Michigan, Missouri,
3
Nevada, New York, Ohio, South Carolina, Texas, Vermont, Virginia, Washington) and the District of Columbia had conducted such research.' Three of these studies (California, Nevada, and the District of Columbia) were motivated by consent decrees that mandated evaluations of classification systems. Several studies were very limited evaluations on how the implementation of proposed objective criteria would impact classification decision-making. Thirteen states had conducted evaluations on the impact of implemented objective classification criteria. Only one experimental study was conducted. Several studies were severely flawed due to extremely small and biased samples.
Despite these methodological weaknesses, the initial evaluations have contributed to a growing body of knowledge on the merits and limitations of objective classification systems as currently designed. Specifically, states that ha't6 implemented objective classification systems and have conducted evaluations have made the following observations:
• Significant decreases in the extent of over-classification have occurred. States have found that the proportion of inmates who classify at minimum or lower custody levels is much higher than' previously believed. Most states are
, Ohio Department of Rehabilitation and Correction (1986), A Study of the Custody Classification Instrument: The Impact on Initial Placement (condensed version); Pierson, T.A. (1987), The Missouri Depal1ment of Corrections' External Classification System: Reliability, Cel1ification, and Pilot Validity Study; Correctional Services Group, Inc. and Louisiana State University (undated), Evaluation Report: Louisiana Department of Corrections Classification System; Correctional Services Group, Inc. (undated), Evaluation of Virginia Department of Corrections' Offender Classification System; Apao, William K. (1986), Improving Prison Classification Procedures: Application of an Interaction Model; Forcier, Michael W. (1989), Survey of DOC Staff Perceptions of the Inmate Classification System; Forcier, Michael W. (1988), Testing the Implementation of a Point Based Classification System: A Comparison of DOC Initial Classifications with the NIC Model Systems Approach; Correctional Services Group (1989), Evaluation of Arizona Department of Corrections' Classification System; Center for Effective Policy and Entropy Limited (1985), Offender Classification Study: Iowa Department of Corrections; Kosinski, R.D. et al. (1989), Validation of the Michigan Security Classification System; South Carolina Department of Corrections (1990), Annual Classification Validation Analysis; Austin, J. (n.d.), Evaluation of the Texas Department of Corrections Inmate Classification System; Austin, J. et al. (1990), Reducing Prison Violence by More Effective Inmate Management, Washington Department of Corrections; Chayet, E.F. et al. (1989), Classification for Custody and the Assessment of Risk in the Colorado Department of Corrections; California Department of Corrections (1986), Inmate Classification System Final Repol1; Illinois Department of Corrections (n.d.), Illinois Initial Classification System: A Revalidation Study; Jack Alexander (1984), New York State Security Reclassification Guideline Evaluation; James Austin, et al., (1989), Crimes Committed by DC Prisoners After Imprisonment; James Austin and Luiza Chan (1989), Evaluation of the Nevada Department of Prisons Prisoner Classification System.
4
---------------------------------
I I '---
discovering that 25 to 40 percent of their inmates can be safely housed in minimum custody.
• Increases in the consistency of classification decision-making and decreases in the number of staff errors and mhinterpretations of classification policy have been observed.
• Studies report decreases or no changes in the rates of escape and institutional misconduct.
• While there continues to be severe difficulty in developing classification criteria that are predictive of risk, there is considerable evidence that current classification criteria do provide modest but important improvements in the system's ability to house inmates according to level of risk.
• Staff perceive objective classification instruments as useful tools.
• Despite evidence that inmate misconduct is related to objective classification criteria, there is evidence that institutional environment may be an equal or even more important contributor to inmate misconduct. 2
SETTING STANDARDS FOR CONDUCTING PRISON CLASSIFICATION EVALUATIONS
As the need for evaluation increases, it will be important to develop evaluation standards. For instance, in designing a large-scale evaluation of an objective classification system, the following features must be addressed:
• Clearly stated evaluation goals, questions, methods, measures, sampling methods, data to be collected, and proposed statistical analysis;
• Process and impact components;
• Both quantitative and qualitative research methods;
• Multiple measures of key performance indicators that are reliable, valid, sensitive, comparable, convincing and timely.
Standards should guide the design of evaluation methods and interpretation of research findings. Sub-standard evaluations only perpetuate the pendulum swings back and forth from
2 See for example Inmate Classification System Study: Final Report January 1986, Sacramento, CA: California Department of Corrections.
5

"everything works" to "nothing works." They are as damaging to the effef.~tiveness of prisons as sub-standard emergency fire procedures.
Throughout this handbook, standards for evaluation goals, questions, designs and methods, measures, sampling, data collection and statistics are presented. The standards are consistent with those published in the evaluation literature (Rossi, 1982).
ETHICAL ISSUES IN PRISON EVALUATION
All research must adhere to basic ethical standards that have been established by regulatory and advisory bodies to guide scientists. While ethical standards may constrain research designs and methods, they are essential.
The entire enterprise of science can be described as a search for knowledge. That knowledge in the short run may be harmful to some persons and helpful to others, pleasing to some and displeasing to others. Although there is nothing inherently helpful or harmful about data or a correlation coefficient generated from data, scientists can collect or use such data and findings in ways that are harmful to the subjects studied and to others who may be affected by public policies influenced by the research.
Ethical issues are particularly pressing in the area of evaluation, which is an applied branch of science. Evaluations seek practical knowledge about whether to maintain, change, expand or eliminate programs - programs that are run by people and have direct effect on people. Therefore, ethical sensitivity is particularly required in this field.
Scientists have developed over the years a set of ethics to guide them in their research efforts. A number of federal agencies have published these ethical standards, and all researchers should be familiar with them. These agencies inchlde:
• Federal Bureau of Prisons;
• National Institute of Mental Health;
• National Institute of Drug Abuse;
• National Institute of Justice;
• National Institute of Corrections;
• Office of Juvenile Justice and Delinquency Prevention.
Every correctional agency should adopt its own set of ethical standards to guide all research undertaken by agency personnel or by contracted research organizations and consultants. If such standards do not exist, they should be developed and adopted by the agency
6
L
before any research is conducted. Several of the major areas covered by standards are listet! below.
• Confidentiality. All data collected for evaluation purposes must be used only for evaluation purposes. The names and any other identifiers that would allow non-research staff to identify subjects being evaluated (staff or inmates) must not be divulged. Researchers can be protected from divulging any such information to all persons by acquiring a Certificate of Confidentiality from the funding or sponsoring source. Evaluators must also ensure that all data (questionnaires, field notes, data tapes, computer print-outs, lists of subjects) are stored securely where only authorized staff have access. This is especially relevant for surveys and questionnaires that seek to secure extremely confidential information not routinely stored in agency records. In conducting interviews in institutional settings, staff must ensure that no unauthorized persons can have access to the subject's (auditory or any electronic eavesdropping equipment) responses that would compromise the subject's right to confidentiality.
• Informed Consent. This is also referred to as voluntary participation. It requires that the potential subject have a clear understanding of: a) the purposes and procedures of the evaluation (including procedures for maintaining confidentiality of records), b) the reasonably foreseeable risks and benefits of participation in the evaluation, and c) the sponsorship of the research. Informed consent also requires that the potential subject be free of coercion or undue influence in deciding whether or not to participate. Where prisoners are potential subjects, the requirements of informed consent are particularly stringent. Where a project requires that subjects be unaware of the research ("deception research "), informed consent can be dispensed with. The conditions under which deception research is permitted are narrowly defined (U.S. Department of Health and Human Services, 1983; Applebaum, Lidz and Meisel, 1987).
• No Harm to Subjects. Evaluators must ensure that there is no known possibility that the subjects participating in the study will be harmed. The risk must be minimized, and these risks must be reasonable in relation to anticipated benefits for the subjects.
• Analysis and Reporting. Finally, evaluators have an obligation to their colleagues to accurately report their findings. This means that any known shortcomings in the evaluation design and data must be made known in the reports. It is equally important to report both negative and positive findings. Most classification evaluations, if conducted in an objective manner, will find some shortcomings in the current system.
7
~----------------~------
PRISON CLASSIFICATION EVALUATION COMPONENTS
Evaluations may be conceptually separated into three components: process and impact evaluations and validation. A process evaluation concentrates on how the system is functioning within the prison system. It is usually the first evaluation phase to be undertaken and is completed before impact evaluation and validation proceed. The task is to answer questions such as:
• Has the classification scoring instrument been properly designed according to the administrative interests of the DOC, according to previous research findings, and according to legal standards?
• Has the classification system been implemented as intended?
If these two conditions are not true, then corrective actions are necessary before additional phases of evaluation are begun.
An impact evaluation seeks to determine what impacts the system has on a number of key indicators. The classification system is intended to have a positive impact on inmates, staff and overall prison operations. The task of the impact evaluation is to test whether or not such positive impacts are actually occurring.
Finally, a word about validation. A risk assessment instrument claims to measure some kind of risk. A validation study determines the extent to which the instrument does measure that risk. Traditionally, a classification system's ability to accurately predict an inmate's behavior with respect to institutional misconduct (e.g., assaults, drug trafficking, etc.) and escape has been the major evaluation criterion of such a system.
Several standard-setting bodies and some court decisions recommend that factors used in classifying inmates (especially for security levels) show demonstrated predictive validity. This means that items used for classification should be evaluated to assess whether they predict certain basic outcomes (e.g., violence, escape, suicide risk, and so on).
EVALUATION METHODS
Evaluators have developed and tested many methods for investigating evaluation quest~ons. There are two general types of methods - quantitative and qUalitative. Quantitative methods collect information by assigning numbers to phenomena. They imply the use of data which has been coded from agency files, surveys, or computerized information systems. Such data are amenable to sophisticated mathematical computations and statistical analysis. A major advantage of quantitative methods is that a large number of cases can be analyzed relatively quickly and inexpensively thanks to computers and the widespread availability of statistical software packages.
8
Qualitative methods, on the other hand, utilize data which are collected by researchers through such methods as interviews and field observations. Here the researcher is interested in getting closer to the phenomenon being studied. Rarely are statistical applications utilized in qualitative methods, with the exception of sampling procedures. Although qUalitative methods are constrained by the number of persons one can study and the amount of data to be analyzed, they are equally important in conducting a comprehensive evaluation. In particular, qUalitative methods often allow the researcher to "explain" findings observed from quantitative methods.
It is important for classification evaluations to utilize both methods in conducting a formal evaluation. Both approaches have strengths and weaknesses; when pooled together they form a comprehensive methodological approach.
THE CONTEXT OF EVALUATIONS
The goal of research is to gain knowledge; the goal of evaluation is practical -knowledge gained should help to determine whether a program should be continued, replicated, terminated or changed. For an evaluation to be successful it must meet the standards for a research project, but it must also meet further standards (Murphy, 1980).
An evaluation must be useful to those who have a stake in the intervention. Therefore, the final report must be written clearly and non-technically so the user can understand it. Since an evaluation will have an impact on persons with differing stakes in the intervention, it is very important that the evaluation is and appears to be fair. An evaluation could be accurate and yet be seen as unfair. For instance, it might only focus on the vulnerable parts of an intervention or on only one of the offices involved or it might select from several standards of achievement the most difficult one. An evaluation must be timely. An ideally implemented evaluation submitted too late to help make decisions is useless.
Above all, an evaluation must be useful. While an evaluation that is done correctly and fairly and is written clearly may be impressive, if it cannot help staff make decisions about an intervention, it is a failure.
GENERAL STANDARDS FOR THE EVALUATION OF OBJECTIVE CLASSIFICATION SYSTEMS
1. An objective classification system should be evaluated to determine if it: a) is implemented properly, b) meets its goals, and c) can be improved.
2. An evaluation should be based on accurate and comprehensive data.
3. An evaluation should be fair.
4. An evaluation should be written clearly and should b,; understandable to users.
5. An evaluation should be timely.
6. An evaluation should be useful.
9
CHAPTER TWO
EVALUATION GOALS
This chapter covers the range of possible goals for impact, validation, and process evaluations, and how to select specific goals to be evaluated.
IMPACT EVALUATION GOALS AND VALIDATION GOALS
There are four types of impacts that a classification system can have:
• intended;
• anticipated but unintended;
• unanticipated and unintended; and
• latent.
Intended impacts of an intervention are those that the intervention is supposed to achieve. Determining these intended impacts is more complex than might be expected. Often the official goals are vague and ambitious in order to gain support for the intervention. Prison administrators may suppose intended impacts are obvious, but frequently they do not know or they are unable to articulate them. Furthermore, the goals of an intervention may be different for different participants and may even conflict. To determine the intended impacts of an intervention it is necessary to: 1) review the official documents associated with its development and implementation, 2) interview policy-makers involved in its development and implementation, and 3) interview current staff who implement it.
Anticipated but unintended impacts of an intervention are those that the intervention is not intended to achieve, but which the program staff expect might happen. For instance, a criticism of objective classification systems is that they will turn inmates into numbers and staff into calculators. Thus Toch (1985:4,8), in a critique of objective classification systems, writes, "Why not train people in the exercise of clinical skills, making them attuned to the richness of unique personal traits seen by a skilled observer ... , sorting the core motives and perspectives of offenders from distracting data, such as ethnicity and details of offense?.. Why is the person's vocational history checkered? Is there evidence of interests, some spark to be kindled ... ? I work harder and more lovingly when I know (or think I know) that somebody cares. It may be that if an offender had a similar incentive it might make h.im work harder at evolving a law-abiding career and shouldering the responsibilities of his unique version of citizenship." Obviously those who implement objective classification systems do not intend to undermine staff-inmate relations, but they anticipate it might happen.
10
Unanticipated and unintended consequences of an intervention are those that are neither intended nor anticipated. It is a for~gone conclusion that human social systems are so complex that all the consequences of changing them cannot be anticipated. An example from another field is medical innovations that reduced the incidence of pneumonia, resulting in increased chronic diseases of old age (Meyers, 1981:22).
Latent impacts of an intervention are ones that individuals seek without stating so officially or without even being aware they are doing so. Tonry (1990) provides an illustration in his discussion of intensive supervision probation (ISP) programs. He observes that evaluations have shown that ISP programs do not achieve most of their intended impacts (reduce prison crowding, save money, protect public safety and provide more punitive punishment than regular probation)j yet they are very popdlar. Tonry suggests that by enabling probation departments to be "tough on crime" ISP programs improve staff morale and ju.stify increased resources. It is easy to see that the impacts of improved staff morale and increased resources would be powerful incentives to probation officials, whether or not they were aware of or publicly stated these latent impacts.
In summary, the mark of an excellent impact evaluation is that it both focuses on intended impacts of an intervention and is also open to uncovering unintended, unanticipated and latent ones.
Possible Impact and Validation Evaluation Goals
Currently, the most commo~ goal of objective risk classification instruments is to find a responsible way to place inmates in lower custody levels. Administrators, legislators and courts look for some support in determining whether and how they can take unaccustomed risks. Therefore> an instrument that authoritatively identifies low-risk inmates is extremely valuable to administrators. This goal of objective risk classification instruments leads directly to a set of related evaluation goals.
1. Is the objective risk classification instrument valid? This is by far the most common goal of current evaluations; it is also the most complex, as we shall see in Chapter Three.
2. What is the impact on the distribution of decisions? Has the average security level decreased, increased or remained the same? If it has changed, have the changes affected one security level more than another? Has the instrument had an effect on the composition of inmate types classified to different levels?
3. What is the impact on disciplinary adjustment? This goal may appear to be the same as asking what is the validity of the instrument, but in fact it is different. Changed rates of disciplinary adjustment may be due to changed validity of the decision process or to other reasons. For instance, if lower security prisons in themselves generate less misconduct than higher security prisons, then any
11
--------------------------------------------------
classification system that is able to reduce security classification will reduce misconduct. Another possibility is that a classification instrument may shape rather than predict behavior. If an inmate's past behavior is consistently measured by an objective instrument in order to determine future security classification, inmates may control their behavior in order to influence their future security classification. Finally changes in the classification system may affect aggregate phenomena, which may in turn affect disciplinary rates. For instance, changes in classification policy may change the racial balance in housing units, which may change disciplinary rates.
4. What is the impact on escape and danger to the public during escapes? This goal is one of the most important but most difficult to evaluate, simply because escapes are extremely rare in most correctional systems.
5. What is the impact on the formulation and implementation of classification polic~? This goal has two aspects.
a. To what extent does the cl~ssification system support the formulation of classification policy? For instance, California discovered that while its objective classification system had 35 different factors, most of these had little or no bearing on classification decisions; sentence length alone was determining security classification. Given this knowledge, California was in a position to rethink its policy (Austin, 1986). In Colorado, a simulation of different objective) classification instruments enabled policy-makers to simulate the effects of policy alternatives (Chayet, et al., 1989).
b. To what extent does the classification system support implementation of classification policy? In her study of the subjective North Carolina system, Craddock (1988) showed that classification staff ignored classification policy in a substantial number of cases in order to fill space, an aspect of classification ignored in the official policy. Interestingly, Craddock reports that, according to staff, the introduction of an objective classification system did not change this practice. "If they disagree with the score, they can usually override the decision so that the individual is placed in the setting they consider appropriate" (Craddock, 1988, p. 103).
6. 'What is the impact on the consistency or reliability of decision-making? Consistency is a minimum prerequisite for a classification system; without it the system cannot possibly be valid. Furthermore, consistency is one of the strongest potential advantages of an objective system. There are well-known psychological processes that make it extremely difficult to make consistent, subjectively-based decisions. Nevertheless.) consistency of objective instruments cannot be taken for granted; it depends on how well the instrument has been designed and
12
implemented. Therefore, the impact of the instrument on consistency must be evaluated.
7. What is the impact on disparity and discrimination? Disparity exists when classification has different results for different groups of interest. Discrimination exists when such different results for different groups are not based on legitimate grounds. For instance, a system that classifies 20 percent of whites maximum security and 10 percent of blacks maximum security clearly creates disparity. However, if it predicts behavior perfectly, it does not create discrimination. Of course no instrument predicts behavior perfectly. If the instrument predicts equally well for whites and blacks, it does not create discrimination - though it may create disparity. If it predicts better for whites than blacks (or vice versa) it does create discrimination, though it may not create disparity. Thus an instrument may increase or decrease disparity, and it may increase or decrease discrimination.
8. What is the impact of the instrument on classification decision-making efficiency? In these days of scarce resources, if an objective instrument does not improve the quality of decisions but only maintains quality while saving resources, it may be judged worthwhile. Indeed, the origin of the current generation of objective instruments for decision-making in criminal justice lies within this goal. An objective instrument can simplify the vast majority of decisions and leave professional classification staff to concentrate on the few difficult cases.
9. What is the impact on the credibility and stability of classification decisions? Classification is always subject to cross-pressures from prison staff, legislators, the executive, courts and the public. For instance, some parties want more conservative and some more liberal decisions. A relatively stable and predictable environment is essential for staff and inmates to function well. If decisions or criteria for decisions are frequently undone and changed, even if they are improved, they reduce the stability of the system, and therefore the effectiveness of staff and inmates.
10. What is the impact on the management of classification? Here we refer to management as the process of organizing resources to achieve a unit's goals. In most prison systems managers must continuously adjust the match of inmates and resources. Even if an objective instrument has been designed to match inmate needs with department resources in the long run, there are constant short-run imbalances that must be dealt with as rationally as possible. For example, if a new prison opens and must be filled quickly, additional judges are assigned to criminal courts and commitments to prison increase, parole releases at a prison are unusually high. Classification systems must be flexible enough to help manage these imbalances.
13
--------------------------------------------------------
11. What is the impact on the relationships between inmate and staff? Curiously, there has been no evaluation research on this, which may be the most important impact of an objective classification system. All the organization and resources of a prison system ultimately must aim to create the most constmctive possible relation between inmates, and between inmates and staff. Whatever contributes to that is good; whatever reduces it is bad.
12. What is the impact of the system on recidivism? This is a topic that has also been rarely explored. Of the four general purposes of prison (punishment, general deterrence, specific deterrence and rehabilitation), classification should have nothing to do with the first two and a great deal to do with the last two. Generally we think that risk classification concerns specific deterrence and needs classification concerns rehabilitation. It is possible that risk classification has no effect on recidivism. But it is also possible that reducing or increasing the average security classification might reduce or increase recidivism. There are those who argue that unless an inmate experiences "real" prison (Le., maximum security), he will hardly be deterred from returning. And on the other hand there are those who argue that the constraints of maximum security make an inmate ill-suited for the responsibilities of civic life. It might also be the case that a classification system that responds reliably to inmate behavior can have an effect on recidivism.
13. If a process evaluation concludes that a classification instmment has been implemented as intended and an impact evaluation concludes that the impact was not as intended, then a validation study is required. If we designed an instrument to predict disciplinary adjustment, implemented the instmment as intended, and the results are not as intended, then we have to investigate the possibility that the instrument does not, in fact, predict disciplinary adjustment; we must do a validation study.
PROCESS EVALUATION GOALS
An impact evaluation is rarely useful without a process evaluation for three reasons. First, without process evaluation we cannot know if the failure of an intervention is due to the inadequacy of the intervention itself or its implementation. Secondly, without process evaluation we cannot know what parts of the intervention account for its strengths and weaknesses so we will know how to improve the program. Third, process evaluation as continuous monitoring is essential to the successful implementation of any intervention, no matter how well conceived. The simplest matters in the implementation, such as accurate scoring of the instrument by staff, cannot be taken for granted.
A thorough process evaluation is particularly important in evaluatir.g social interventions, such as an objective classification instrument, because social interventions are Sf) often very complex. A new surgical procedure or drugs are interventions that are specific enough that the intervention is clear and tracking the implementation of the intervention is relatively
14
straightforward. A social intervention is so complex that if its implementation is not studied thoroughly and systematically, essential features of the intervention will probably be misunderstood.
Process evaluations are essential for identifying intended, anticipated but unintended and unantidpated and unintended aspects of a newly implemented classification system. The components and processes of the objective system as planned will be set forth in manuals, and it will be necessary to observe whether they are occurring as designed. But it is also necessary to systematically observe what is going on that was not planned or even imagined.
Possible Process Evaluation Goals
Experience suggests that process evaluations should evaluate the following components of an objective classification system:
1. Scoring Criteria (including the values, weights, and scales). Do they accura.tely express department policy? Do they meet legal standards?
2. InstrumentlScoresheet. The objective instrument is embodied in a scoresheet. Does the scoresheet accurately express agency policy? Is it designed for easy use and clear communication?
3. Instrument Instructions. The objective instrument is also embodied in instructions for filling out the scoresheet. These instructions are crucial for the implementation of the instrument. Are the instructions clear? Are they comprehensive? The real world of classification is never as neat as the scoresheets of predictive factors and their weights as their neat boxes suggest. Arrests on a rap sheet have no dispositions or the dispositions on the rapsheet contradict these on the Pre-Sentence Report, An out-of-state conviction has no clear equivalent, and so on. If the instructions do not address such issues clearly and comprehensively, the instrument can hardly be objective.
4. Quality of Information Used for the Instrument. Is the information required for the instrument reliable, valid and timely? For instance, if the instrument is based on self-report and the interview setting has no privacy, then the information collected may be unreliable.
5. Classification Staffing. Are the number and qualifications of the staff who apply the instrument and who supervise appropriate?
6. Training. Is the training of staff and supervisors appropriate?
7. Procedures. How is the collection and processing of information organized to produce classification decisions?
15
8. Classification Overrides. It might be thought that to the degree that staff deviate from the instrument, the results cannot be attributed to the instrument. However, the truth is usually more complex. Insofar as the instrument structures rather than eliminates discretion, the overrides are part of the instrument. Therefore, the nature as well as the number of overrides must be evaluated.
9. Percent of Cases Classified with the Instrument. There may be cases that are not classified by the objective instrument, for instance cases classified and transferred after a disturbance. If a significant percent of cases are classified without the instrument, the results cannot be attributed to the instrument.
10. Relation of Classification to Placement. Unless inmates are placed in accordance with their classification, their behavior will not be relevant to their classification.
11. Staff-inmate Interaction. How do staff interview inmates to determine their classification and how do staff communicate classification decisions to inmates?
12. Policy Formulation. How is the objective classification system used in the formulation of classification policy? For instance, is the system used to simulate the outcomes of different policy options?
13. Policy Implementation. How is the system used to monitor the implementation of classification policy? What monitoring reports are produced? How are they used?
14. Management. How is the system used to manage classification? What part does the system play in the resolution of temporary imbalances between inmate classifications and department resources?
SELECTION OF EVALUATION GOALS
Out of all of the possible evaluation goals, which do we select? Some goals should not be pursued because they cannot be achieved, and other goals should not be pursued, even though they can be achieved, because it would be pointless to do so. (Rutman, 1980 provides a review of techniques and criteria for assessing whether an intervention can be successfully evaluated.)
Goals that Cannot Be Pursued
Some evaluation goals cannot be pursued because under the circumstances they cannot possibly be achieved. As discussed earlier, a successful impact evaluation is rarely possible without a prior process evaluation. A successful impact evaluation is also rarely possible if the goals of the intervention are unclear. One cannot evaluate whether a classification system is achieving its goals unless one knows what those goals are.
16
I
l~
Some evaluation goals cannot be pursued for lack of resources. They may require data that is unavailable or too expensive to collect. For instance, if there is only enough money to collect data on 200 cases, it may be wasteful to attempt a large-scale evaluation. Other goals may require proper timing. Evaluating impacts of new interventions may not be worthwhile, since there is not enough experience with the intervention's operations to evaluate. Also the newness of a program will in itself have effects. On the other hand, many process evaluation goals are reasonable to pursue even while the intervention is being implemented. In short, goals can only be achieved if the resources to achieve them are available.
Evaluation Goals that Should Not Be Pursued
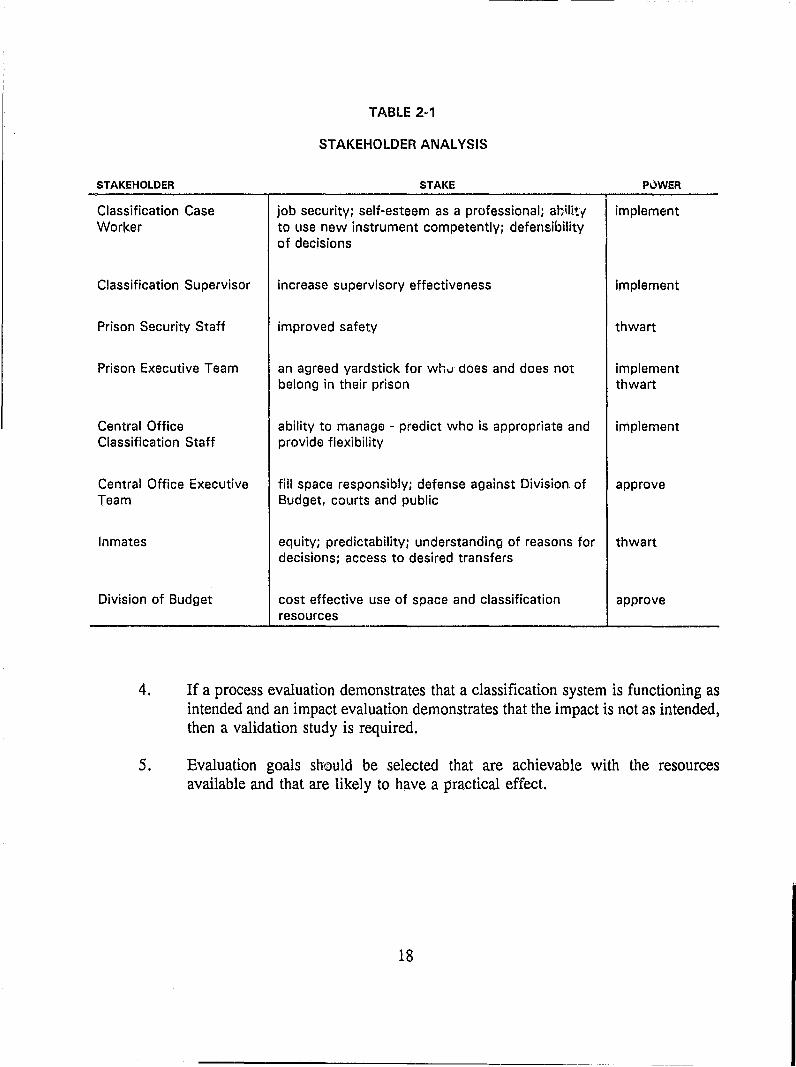
There is another key principle underlying the selection of evaluation goals. An evaluation must be used to guide action. Therefore, evaluation goals must be relevant to the needs of the stakeholders in the intervention. It is necessary to analyze who the stakeholders are, what their interests in the intervention are and what power they have to influence the intervention. Table 2-1 is an example of such an analysis. In this example, hypothetical stakeholders for an objective risk classification instrument are identified along with their stakes in the intervention and their power to make the intervention succeed or fail. A stakeholder analysis such as that in Table 2-1 has important implications for the selection of evaluation goals. The analysis suggests that:
• A process evaluation of training will be important to caseworkers and their supervisors to assure that case workers will be competent and will follow the designed procedures.
• Monitoring reports on such process issues as accuracy, consistency, completion rates and overrides will be essential to supervisors.
• Validation and evaluation of impact on disciplinary adjustment and escape will be essential for the Central Office Classification staff and Executive Team.
STANDARDS FOR EVALUATION GOALS
1.
2.
3.
A comprehensive evaluation of a classification system should include process, validation, and impact goals.
An impact evaluation should focus on intended impacts of a program, but it should be open to uncovering unintended, unanticipated, and latent impacts as well.
With rare exceptions, an impact evaluation should not be conducted until the process evaluation has demonstrated that the classification system is functioning as designed.
17
STAKEHOLDER
Classification Case Worker
Classification Supervisor
Prison Security Staff
Prison Executive Team
Central Office Classification Staff
Central Office Executive Team
Inmates
Division of Budget
TABLE 2·1
STAKEHOLDER ANALYSIS
STAKE
job security; self-esteem as a professional; ahility' to use new instrument competently; defensibility of decisions
increase supervisory effectiveness
improved safety
an agreed yardstick for whv does and does not belong in their prison
ability to manage - predict who is appropriate and provide flexibility
fill space responsibly; defense against Division of Budget, courts and public
equity; predictability; understanding of reasons for decisions; access to desired transfers
cost effective use of space and classification resources
P~WER
implement
implement
thwart
implement thwart
implement
approve
thwart
approve
4. If a process evaluation demonstrates that a classification system is functioning as intended and an impact evaluation demonstrates that the impact is not as intended, then a validation study is required.
5. Evaluation goals should be selected that are achievable with the resources available and that are likely to have a practical effect.
18
CHAPTER THREE
EVALUATION QUESTIONS
DEFINITION OF AN EVALUATION QUESTION
An evaluation question is a question that i.s specific enough to be answered by making observations and analyzing them. For instance, asking whether an instrument is valid is a reasonable evaluation goal, but it is an unacceptable evaluation question because it is much too general. A research question must be specific, but at the same time it must also lead to an answer that satisfies the general evaluation goals. For example, if our goal is to evaluate whether the instrument has improved staff/inmate relations, we might ask whether inmate satisfaction with staff has changed since the instrument was implemented. While this question can be answered by observing and analyzing the observations, the answer will address our evaluation goal very poorly.
EXAMPLES OF EVALUATION QUESTIONS
The issues involved in setting the evaluation questions are illustrated with examples of process, impact, and validation questions.
Process Questions
Consistent with the goals of process evaluations, process questions ask how the classification system is functioning. Consider the process evaluation goal of describing the percent of inmates classified with the instrument. This process goal breaks down into two questions. First, are inmates not being classified who should be classified? This occurs when regularly scheduled reclassifications are not done, perhaps due to competing demands on staff time, disorganization or reluctance to let go of a "good" inmate. Second, are inmates being classified without the use of the scoring instrument? This occurs when inmates are reclassified without using the instrument, perhaps following a disturbance or due to an insufficient number of staff assigned to classification activities. These issues lead to the formulation of process questions such as:
• What percent of cases that should be classified using the instrument are not classified?
• What percent of cases are classified without the instrument?
• What are the characteristics of such cases? by counselor, by prison, by scheduled vs. unscheduled classification?
19
1-----
Impact Questions
Impact questions are causal; they ask how the presence of classification affects inmates, staff, or the prison system in general. In more precise terms, an impact question will consist of an independent variable (denoted as "x") and a dependent va'I1able (denoted as "y"). In classification evaluations, the classification system can be viewed as the independent variable (x), which is having an impact on a dependent or outcome measure (y). For example, introduction of a new classification system is expected to reduce inmate disciplinary infractions. Impact research questions can thus be phrased as follows:
• To what extent does classification impact escapes?
• To what extent does classification impact inmate assaults on staff?
• To what extent does classification impact staff morale?
• To what extent does classification impact operational costs?
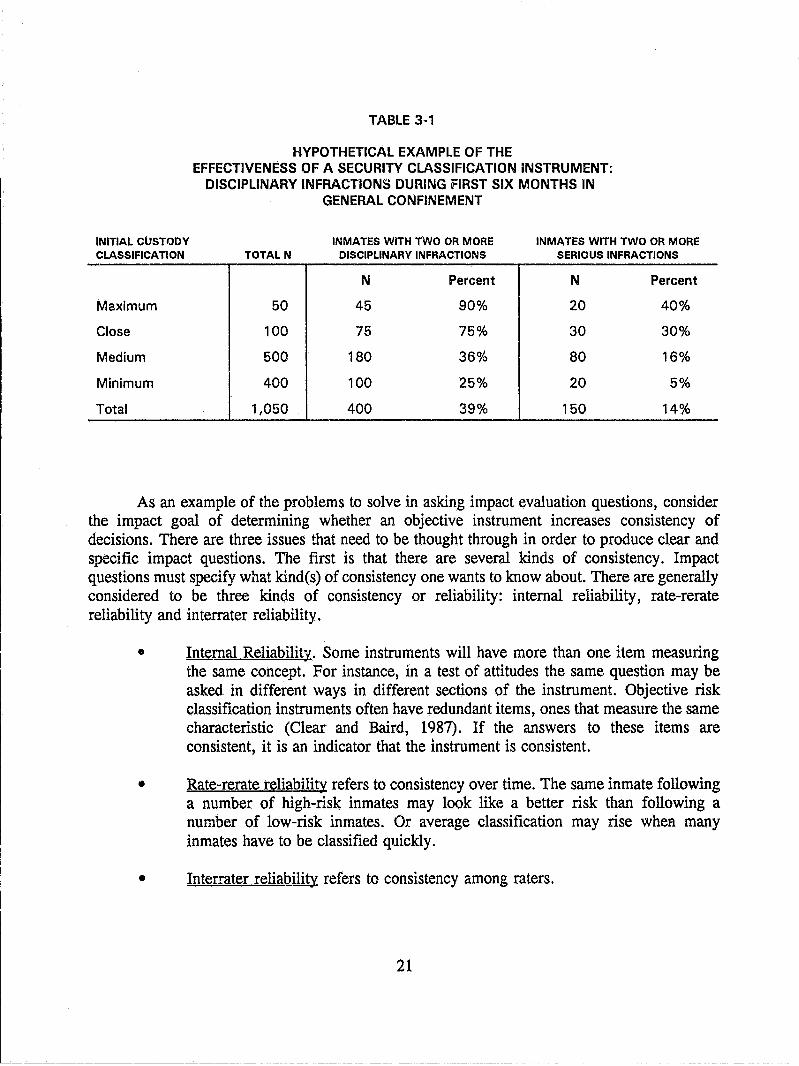
There is one general principle to keep in mind when considering impact questions. Since evaluation concerns the impact of an intervention, the questions should usually be comparative. We are aiming to determine whether and how an intervention has changed things. Table 3-1 s:wws how a hypothetical objective risk classification instrument sorts inmates into four custody levels with different infraction rates. The table suggests that the instrument is sorting inmates successfully. For instance, 40 percent of those classified maximum security had two or more serious infractions during their first six months, compared to only 5 percent of the inmates classified as minimum security. However the preceding classification system might have produced the same or better results. Therefore, Table 3-1 is of limited use.
The impact question must compare the impact of the intervention to a standard. There are three commonly used standards of comparison:
• A planned target. The intervention is implemented in order to achieve a specified target. For instance, ajurisdiction might implement an objective risk classification instrument in order to double its percent of minimum security inmates with no increase in the historic rate of escapes or disciplinary infractions.
• Improvement. The new intervention performs better than the one it replaced. Thus, in Florida's evaluation of its objective risk classification instrument, the results of the objective system were compared to the results of the previous subjective system (Florida, 1981).
• Standard of excellence. The impact of the intervention is compared to the best results in the field.
20
----------------
TABLE 3·'
HYPOTHETICAL EXAMPLE OF THE EFFECTIVENESS OF A SECURITY CLASSIFICATION INSTRUMENT:
DISCIPLINARY INFRACTIONS DURING fiRST SIX MONTHS IN GENERAL CONFINEMENT
INITIAL CUSTODY INMATES WITH TWO OR MORE INMATES WITH TWO OR MORE CLASSIFICATION TOTAL N DISCIPLINARY INFRACTIONS SERIOUS INFRACTIONS
N Percent N Percent
Maximum 50 45 90% 20 40%
Close 100 75 75% 30 30%
Medium 500 180 36% 80 16%
Minimum 400 100 25% 20 5%
Total 1,050 400 39% 150 14%
As an example of the problems to solve in asking impact evaluation questions, consider the impact goal of determining whether an objective instrument increases consistency of decisions. There are three issues that need to be thought through in order to produce clear and specific impact questions. The first is that there are several kinds of consistency. Impact questions must specify what kind(s) of consistency one wants to know about. There are generally considered to be three kinds of consistency or reliability: internal reliability, rate-rerate reliability and interrater reliability.
• Internal Reliability. Some instruments will have more than one item measuring the same concept. For instance, in a test of attitudes the same question may be asked in different ways in different sections of the instrument. Objective risk classification instruments often have redundant items, ones that measure the same characteristic (Clear and Baird, 1987). If the answers to these items are consistent, it is an indicator that the instrument is consistent.
• Rate-rerate reliability refers to consistency over time. The same inmate following a number of high-risk inmates may look like a better risk than following a number of low-risk inmates. Or average classification may rise wheR many inmates have to be classified quickly.
• Interrater reliability refers to consistency among raters.
21
Each of these types of reliability require different evaluation designs and therefore must be specified in the evaluation question.
The second issue is whether to measure consistency of the instrument under ideal circumstances, in practice or both. One may wish to determine whether, given all the required information and no external constraints such as time, counselors will produce consistent decisions. Or one may wish to know whether in actual use, with all the pressures of spotty information, production schedules and pressures from inmates and staff, counselors will produce consistent decisions. Ultimately both questions have to be asked. If it is only asked how consistent the instrument is in practice, then it will not be known whether the weaknesses are in the instrument, its implementation or its suitability in actual working conditions. If one only asks about the instrument in ideal circumstances, it will not be known how it contributes to consistency in practice.
Third, impact questions should be asked in such a way that if the consistency is found unsatisfactory, the data will be available to analyze and respond to the problem. One might guess that possible sources of inconsistency are certain counselors or facilities or types of cases or times of year or items of the instrument. Therefore, we must specify these variables in our impact questions.
The foregoing analysis will make clear why open-ended qualitative research is so important. Careful reports from the scene may quickly reveal factors that was not thought of in advance.
Thus L'1e impact goal of determining whether decisions are consistent breaks down into at least six impact questions, depending on whether one is interested in ideal or actual circumstances and what kinds of consistency are of interest. For instance:
• Under ideal circumstances is interrater consistency greater under the new instrument than the previous instrument?
• In practice is rate-rerate consistency greater under the new instrument than under the previous instrument?
• Is inconsistency in the new instrument related to counselors, facilities, types of cases, time of year, items in the instrument?
It is important to recognize that the same topic can be addressed as a process or an impact question. For example, consistency may be a process question: are decisions in fact consistent? Consistency may also be an impact question: has the objective instrument caused greater consistency? The first question is descriptive, the second is causal. The difference between the two questions is important, because they require different evaluation designs.
22
Validation Questions
The most common evaluation goal is to determine whether the objective classification system is valid. This goal is much vaguer than it may seem and requires much specification in order to become an evaluation question. There are six issues that must be addressed:
Issue 1: Types of Validity
There are many types of validity, such as internal, external, face, content, concurrent, predictive and construct validity. Which kind of validity is to be studied? There 'IS no evaluation question at all until the various types of validity are sorted out and a decision is made as to which one(s) to focus on.3
• Internal validity refers to the adequacy of the design of the instrument. For instance, if in creating the instrument the designers used data that had been collected carelessly, the instrument would suffer from internal validity problems.
• External validity refers to the effectiveness of the instrument when it is used on the prison population. For example, if the instrument is designed using a sample of inmates and that sample is not representative of the population (perhaps the composition of the prison population changes over time) then the instrument will have external validity problems.
• Face validity refers to plausibility. For instance, do the factors in the instrument and the weights assigned to them make sense to staff? Face validity is the weakest sort of validity, since what is plausible is not necessarily so. On the other hand, if an instrument lacks face validity for staff and inmates, it is likely to fail.
• Content validity refers to coverage. Does the instrument cover the variety of topics included in the subject being assessed? For example, a final exam that focused on a tenth of the class material would be an assessment instrument with weak content validity. Similarly a risk assessment instrument that addressed disciplinary risk while ignoring escape risk would have weak content validity.
• Concurrent validity. The instrument results are compared to those of another instrument that is considered valid. For example one might compare results of a new objective risk classification instrument with the results of an accepted instrument, such as the NrC model.
3 Validity is a complex topic, and there are many views on it. For an example of an alternate view to the one presented here, see Messick, 1988.
23
I ----------------------------------------------------------------------
• Predictive validity. The instrument results are compared to the results the instrument is designed to predict. For instance, scores on a risk assessment instrument at classification are related to actual disciplinary adjustment in general confinement.
• Construct validity. Construct validity is the most demanding level of validity. In addition to ensuring that our instrument produces similar results to those of similar, independent instruments, it requires that the instrument produce different results than instruments designed to measure other concepts.
Construct validity comes into play when the phenomenon we want to assess has no clear measure or when our idea of the phenomenon itself is unclear (Cronbach and Meehl, 1955). For instance, if one wants to predict learning ability and develop a measuring instrument, such as an IQ test, it would be hard to tell what should be compared with IQ scores to determine whether IQ scores really predict learning ability. Therefore, one might take several measures of phenomena different from and similar to learning ability, and if these measures relate to IQ scores in the expected way, construct validity would have been achieved. For example, there might be measures of actual school performance, teachers' ratings of pupils' learning ability and pupils' ratings of each other's popularity. If IQ scores related strongly to the first two measures and weakly to the third, some construct validity for our IQ instrument would have been achieved. One pilot study (Van Voorhis, undated) compared five psychological classification systems in terms of their predictive validity and their construct validity. Three of these systems were based on levels of psychological development (Interpersonal MatUlity, Moral Development and Conceptual Level) and two on types of psychological inadequacy (Quay's Taxonomy of Adult Offenders and Megargee and Bohn's MMPI-based taxonomy). Several categories seem to appear in slightly different versions in more than one system. For instance, three of the systems have categories that are labelled "neurotic." Van Voorhis compares how different systems apply similar categories to her sample of inmates in order to assess construct validity.
Usually what is studied is predictive validity. Does the objective classification instrument really predict what it claims to predict? If it is a risk instrument does it really distinguish high from low risks?
Issue 2: Accuracy In Prediction
No risk instrument can predict dangerous prison behavior with complete accuracy. There has been much criminological research on the prediction of different kinds of dangerous behavior; success has been limited. In a review of the accuracy of prediction models, Gottfredson and Gottfredson (1986, p. 271) state that" ... the proportion of criterion variance explained rarely exceeds .15 to .20; it often is lower." On the other hand, well-designed objective risk classification instruments do better than chance. They also do better than clinical prediction (see Monahan, 1981, for a useful summary). Finally, recent advances in classification methodology have improved predictive validity and hold the hope of further improvements in the future (Brennan, 1987a).
24
--------------------------- -----------
_____________ 0 _________ _
Since predictive validity is never perfect, validation questions should be comparative. Therefore, a standard of comparison must be established. Has the instrument increased predictive validity? Has it greater predictive validity than other instruments or decision techniques? Can modifications of the current instrument further increase predictive validity?
Issue 3: Defining The Type Of Risk To Be Predicted
Having determined the type of validity needed, the task of clarification and specification is still not over. What type of risks are we. trying. to predict? All predictive validations have studied success in predicting disciplinary adjustment.
However, there are other types of risks that classification instruments aim to predict. For instance, all practitioners know many examples of inmates who adjust very well in prison, but will never become minimum security due to the severity of their instant offenses. Classification instruments will reflect this fact, and will include a factor for the severity of the instant offense. As a matter of fact, the severity of the instant offense has rarely been found to be a very useful predictor of disciplinary adjustment (Chapman, 1981 and Humphrey, 1987), but even if it were found never to be a useful predictor of disciplinary adjustment, it would still appear on risk instruments. The factor is there to predict risk to the public, should the inmate escape [Severity of the instant offense has rarely been found to be a useful predictor of danger to the public, but it has been consistently used for that purpose anyway (Gottfredson & Gottfredson, 1986, p. 271)].
The following is a list of possible risks an instrument might be designed to predict:
• risk to other inmates;
• risk to staff;
• self-risk;
escape risk;
risk to the public, if the inmate does escape;
• system risk (risk of damage to the agency).
Therefore, in setting predictive validity questions, one must be careful to specify what behavior or behaviors a risk classification instrument is designed to predict, and which of these behaviors will be used to validate the instrument.
25
Issue 4: Defining The Level Of Risk To Be Predicted
In addition to specifying what type(s) of risk are to be validated, the degree of risk must be indicated, especially when validating for disciplinary risk. Is the instrument designed to predict inmates with serious discipline problems or inmates with any disciplinary problems? Because prison rules are so all-encompassing, most inmates have at least one infraction. At the other end of the scale, there are relatively few inmates who are severely disruptive. It is much more difficult to accurately predict rare phenomena (such as severe discipline problems) than phenomena that are more evenly distributed in a population (such as mild discipline problems). For example, in Table 3-1 the validation of a predictive risk instrument is much more likely if its goal is to predict inmates with two or more infractions than if its goal is to predict inmates with two or more serious infractions. Therefore practitioners must be clear about what level of risk they need to predict.
Issue 5: Risk Prediction Versus Risk Management
An objective risk classification instrument includes two components: risk prediction and risk management. Risk prediction can be validated; risk management cannot. In the first step the predictors of, for instance, serious disciplinary problems are identified and then the most effective combination of these is identified. The result is a scoring instrument which might produce the hypothetical results shown in Table 3-2. The scoring instrument clearly predicts serious disciplinary problems. As the score increases, so (with a few exceptions) does the percentage of inmates with serious disciplinary problems. However, the instrument does not predict perfectly. Some of the inmates who score low do poorly and many who score high do well.
Having predicted risk, how is the prison system to manage this risk? At the one extreme, given unlimite,d resQurces and a conservative philosophy, all inmates could be placed in maximum sa:urity, since even among those who score 0, some become disciplinary problems. At the other extreme, given limited resources and a liberal philosophy, all the inmates could be placed in minimum security, since even most of the highest scoring inmates do not have disciplinary problems. If the first risk management philosophy is selected, then the percent of overclassified inmates will be 85 percent; if the second philosophy is selected, the percent of underclassified inmates will be 15 percent. Does the liberal classification instrument have greater predictive validity than the conservative instrument? Not at all. Both instruments are derived from the same predictive scores and are equal in predictive validity. They reflect different policy choices and should be evaluated on some basis other than predictive validity. For instance, an impact evaluation could determine which system was more effective in reducing disciplinary problems or costs.
26
I
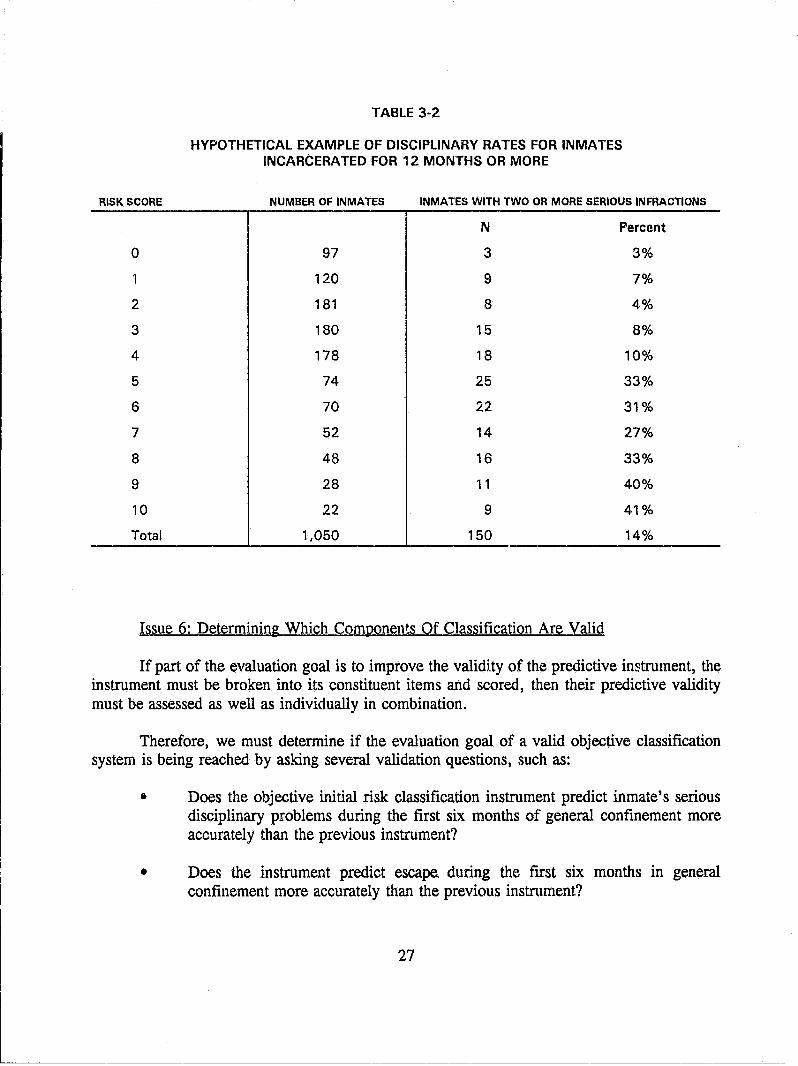
TABLE 3·2
HYPOTHETICAL EXAMPLE OF DISCIPLINARY RATES FOR INMATES INCARCERATED FOR 12 MONTHS OR MORE
RISK SCORE NUMBER OF INMATES INMATES WITH TWO OR MORE SERIOUS INFRACTIONS
N Percent
0 97 3 3%
1 120 9 7%
2 181 8 4%
3 180 15 8%
4 178 18 10%
5 74 25 33%
6 70 22 31%
7 52 14 27%
8 48 16 33%
9 28 11 40%
10 22 9 41%
Total 1,050 150 14%
Issue 6: Determining Which Components Qf Classification Are Valid
If part of the evaluation goal is to improve the validity of the predictive instrument, the instrument must be broken into its constituent items and scored, then their predictive validity must be assessed as well as individually in combination.
Therefore, we must determine if the evaluation goal of a valid objective classification system is being reached by asking several validation questions, such as:
• Does the objective initial risk classification instrument predict inmate's serious disciplinary problems during the first six months of general confinement more accurately than the previous instrument?
• Does the instrument predict escape. during the first six months in general confinement more accurately than the previous instrument?
27
--------_._-----------
• How accurately do the various scoring items found on the instrument predict serious disciplinary problems during the first six months in general confinement?
Will rescaling or reweighting items increase the instrument's ability to predict serious disciplinary problems during the first 12 months in general confinement?
STANDARDS FOR EVALUATION QUESTIONS
1. Evaluation questions should be stated so that they can be answered by analysis of observations.
2. Evaluation questions should be related to the stated evaluation goals.
3. Process questions should address how the classification system is operating.
4. Impact questions consist of independent and dependent variables and seek to determine if the classification system is having an effect on inmates, staff, or the prison system in general.
5. Validation questions should specify what type of validity is meant and for what type of outcome the instrument is being validated.
28
~~-~-~~--- ------------------~----
CHAPTER FOUR
EVALUATION DESIGNS AND METHODS
TYPES OF EVALUATION DESIGN
Having defined the questions so that they can be answered by observations and the analysis of observations, the next step is to determine what observations to make, how to make them, and how to analyze them. If these questions are to be answered with something more than impressions and war stories, and systematic answers are to be provided, then one must rigorously think through rigorously evaluation design, methods, measures, data collection procedures and analysis.
The evaluation design establishes the overall strategy. The method establishes the logic of observation, the measures establish precisely what will be observed, data collecting establishes precisely how the observations will be collected and the analysis establishes precisely how the observations will be analyzed. The goal is always to collect relevant, accurate and complete information for an analysis that will provide a decisive answer to the evaluation question. There are many obstacles in achieving this goal, and it requires the skill of the evaluator and the knowledge of the user to select and apply methods, measures, data collection techniques and analyses that will overcome these obstacles.
As indicated earlier, there are three fundamental designs for the evaluation of objective classification systems - process, validation and impact. In the first, the design must organize a good description of the objective classification system as it actually operates. In the second, the design must establish a relationship between the classification instrument and the risk it is supposed to assess. In the third, the design must establish a causal relationship between the classification system and the impacts it is supposed to and does achieve.
Process Evaluation Designs
As noted previously, a process evaluation provides a detailed description, using both qualitative and quantitative data, of how a program is functioning. In conducting a process evaluation of a prison classification system, the focus is on describing in detail how that system operates within the prison system. It is usually the first and most fundamental phase of evaluation to be undertaken.
In this phase, the work of the evaluator is to provide descriptive analysis and rot to identify causal relationships. The evaluator must identify the major components of the classification process and compare how it is functioning with the original design. The evaluator must select methods that will produce accurate, comprehensive and relevant data.
29
For example, process evaluations must determine whether the scoring instruments are being completed properly. To evaluate this issue, the evaluator might 1) select a set of cases, have the best counselors classify these cases and then analyze the errors; and 2) conduct an audit of cases recently classified in selected institutions. In this way the evaluator will be able to determine how the instrument is used in ideal conditions and in practice, which may help determine whether problems are due to the instrument or its implementation. In Chapter Five sampling will be discussed more thoroughly, but for purposes of this illustration, assume that a random sample of inmates who have been either reclassified or recently admitted to the prison system and received their initial classification score have been selected for analysis. The evaluator can then conduct the following steps:
1. Verify that the classification sheets have been prope,ly completed.
2. For those cases that have been improperly scored, identify the items that caused the error.
As information i~ received, the evaluator may choose to distribute a questionnaire to staff, conduct interviews with staff to learn why such errors are occurring and/or conduct observations of the classification process to secure yet another measure of the classification system in operation. Cumulatively, these data will provide process evaluation.
Impact Evaluation Designs
The impact evaluation determines what impacts the objective system has on key indicators; for example, "the new classification system has reduced levels of violence and escape" or "the new classification syst~m has increased staff morale." These are statements of causality that attribute observed benefits to the introduction of a new classification system. However, to make such statements with a relative degree of confidence, rigorous impact evaluation designs must be used.
Technically, impact indicators are defined as the dependent variable (y) while the classification system represents the independent variable (x). The classification system is believed to be having a positive impact on inmates, staff and overall prison operations. Thus, the task of the evaluation is to test whether or not such positive impacts are actually occurring. For instance, following the introduction of a new classification system, disciplinary reports may decline - but perhaps they have been declining since before the introduction of the. instrument.
The fundamental challenge of an impact evaluation is that a cause-effect relation cannot be directly observed; it must be inferred, and inferences are inevitably complex. As Berk and Rossi (1990) write:
By a "causal effect" we mean a comparison between the outcome and the intervention being introduced compared to the outcome and the intervention not being introduced. For example, the causal effect of a ban on diesel-powered
30
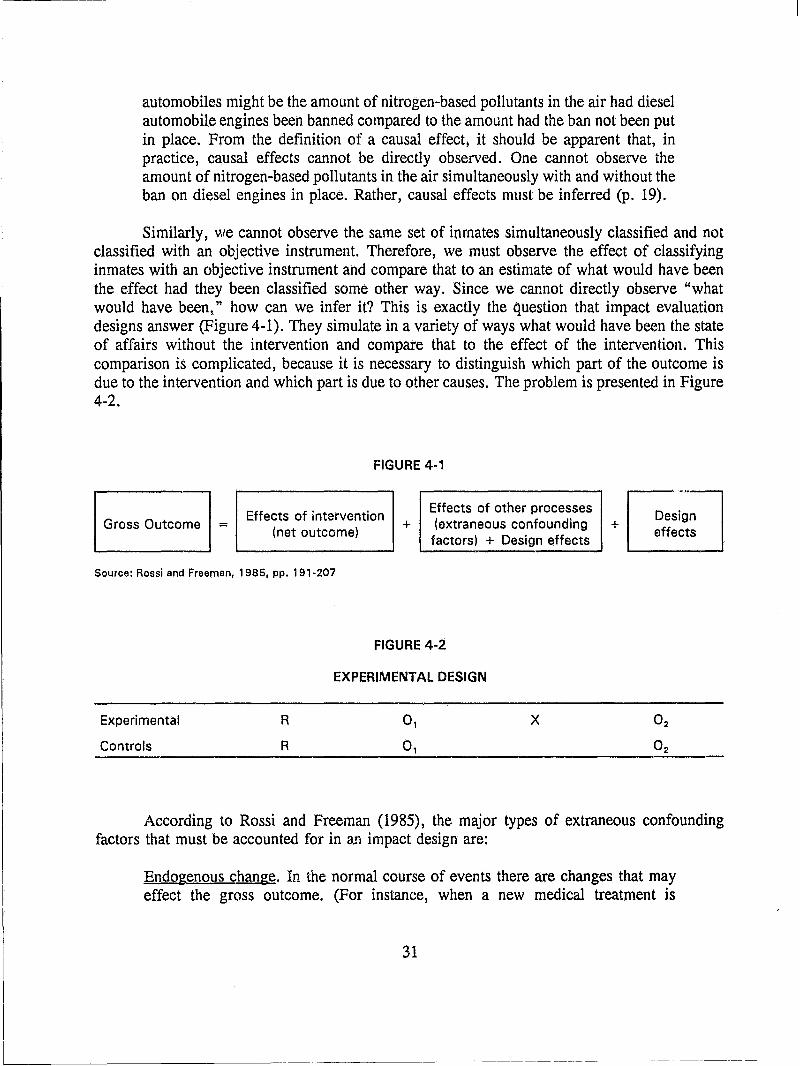
automobiles might be the amount of nitrogen-based pollutants in the air had diesel automobile engines been banned compared to the amount had the ban not been put in place. From the definition of a causal effect, it shou1d be apparent that, in practice, causal effects cannot be directly observed. One cannot observe the amount of nitrogen-based pollutants in the air simultaneously with and without the ban on diesel engines in place. Rather, causal effects must be inferred (p. 19).
Similarly, we cannot observe the same set of inmates simultaneously classified and not classified with an objective instrument. Therefore, we must observe the effect of classifying inmates with an objective instrument and compare that to an estimate of what would have been the effect had they been classified some other way. Since we cannot directly observe "what would have been," how can we infer it? This is exactly the question that impact evaluation designs answer (Figure 4-1). They simulate in a variety of ways what would have been the state of affairs without the intervention and compare that to the effect of the intervention. This comparison is complicated, because it is necessary to distinguish which part of the outcome is due to the intervention and which part is due to other causes. The problem is presented in Figure 4-2.
Gross Outcome =
FIGURE 4·'
Effects of intervention (net outcome) +
Effects of other processes (extraneous confounding
factors) + Design effects
Source: Rossi and Freeman, 1985, pp. 191-207
Experimental
Controls
R
R
FIGURE 4-2
EXPERIMENTAL DESIGN
0,
0,
x
+ Design effects
According to Rossi and Freeman (1985), the major types of extraneous confounding factors that must be accounted for in an impact design are:
Endogenous change. In the normal course of events t.here are changes that may effect the gross outcome. (For instance, when a new medical treatment is
31
evaluated, the effect of the treatment must be distinguished from the effect of body defenses that would have healed some patients anyway.)
Long-term trends. There could be long-term changes that account for the gross outcome. (For instance, if the percent of inmates committed for drug offenses steadily increases, classifications may reduce independent of a new classification system.)
Interfering events. Events may occur at the time of the intervention that affect the gross outcome. For example, at the time the classification system is implemented, a new disciplinary reporting system may also be implemented.
Maturational trends. A special case of endogenous change. For instance, as inmates get older, their disciplinary problems tend to decrease, independently of how they are treated.
Uncontrolled selection. Since the subjects cannot both receive and not receive the intervention, one group of subjects must receive the intervention and a different group of subjects must be used to simulate what would happen in the absence of the intervention. If the evaluator cannot control the selection of the two groups, they may differ and the difference may affect the gross outcome. (For example, if participation in the intervention is voluntary, the evaluator cannot control the subjects, and volunteers are very likely to be different from non-volunteers in significant respects.)
The major design effects that must be accounted for in an impact design are:
Chance effects. Every design compares the gross outcomes with and without the intervention or with variations in the intervention. If this comparison were n~peated many times, the outcomes would vary each time. (For instance, if we repeated an impact evaluation 100 times in which we compared inmates with and without an objective classification instrument, the results would differ every time. Perhaps averaging the results of the 100 repetitions, the inmates classified with the objective instrument have half as many discipliItary infractions as the inmates classified without the objective instrument.) On any single evaluation the difference between the two groups will be more or less than half. In practice the evaluation is done only once. The question is: How well do~s thi~ one evaluation represent the true difference between the two groups? This is the topic of inferential statistics; it is discussed in Chapter Eight.
Measurement unreliability. Insofar as the measures of the variables are unreliable, they will affect the gross outcome. Measurement reliability is discussed in Chapter Five.
32
Measurement validity. Insofar as measures are invalid, they will affect the gross outcomes. Measurement validity is also discussed in Chapter Five.
The "Hawthorne" effect. The fact that an evaluation of an intervention is occurring may have an effect over and above the intervention itself. (For instance, participants in the intervention may perform better or worse than normal during the evaluation, depending on whether they want the intervention to fail or succeed.)
Missing values. Some data required for an evaluation will not be collected. (For instance, during intake peaks some data may not be collected at initial classification.) Chapter Seven deals with data collection, including how to minimize missing values.
Sample design effects. Evaluations are almost always done on samples. If these samples do not accurately represent the group the intervention should affect, the inaccuracy will affect gross outcome. Chapter Six deals with sampling.
The most compelling need of any impact evaluation design for an objective classification system is to control for the confounding effects of the environment. We can imagine many interactions between classification system and environment that would confuse the identification of net impacts. For example, in an ideal classification system the most difficult inmates would be assigned to the setting with the most constraints that would exert the most control. One outcome might be as shown in Table 4-1. In this example, perhaps the most difficult inmates have been placed in the most secure settings, which have repressed inmate violence. This type of suppressor effect was identified in a California evaluation (California Department of Corrections, 1986). Without controlling for the prison environment, the impact evaluation would show that this instrument has failed to sort inmates into higher and lower risk groups.
Another possible interaction is that higher security prisons generate more infractions than lower security prisons. In other words, inmates act "tougher" when placed in a tougher environment. This phenomenon is called a self-fulfilling prophecy. If this were the case, every classification system, regardless of how it sorted inmates, would appear to sort inmates appropriately. The statistical outcome might be as shown in Table 4-2. One could conclude that the classification instrument is working and correctly sorting high risk inmates, or one could conclude that the classification system is irrelevant. Which interpretation is correct? In the above two examples there is no way of knowing whether the outcome is due to the classification instrument or the prison setting. It is worth noting that in one careful study of inmate misbehavior, prison environmental factors, not individual characteristics, were the strongest predictors (Mandaraka-Shephard, 1986).
There are other possible interactions between classification, inmate and environment. For instance, it may be that the inmate who adjusts without disciplinary problems at maximum security would do poorly in medium security, where he may be housed in a dorm rather than
33
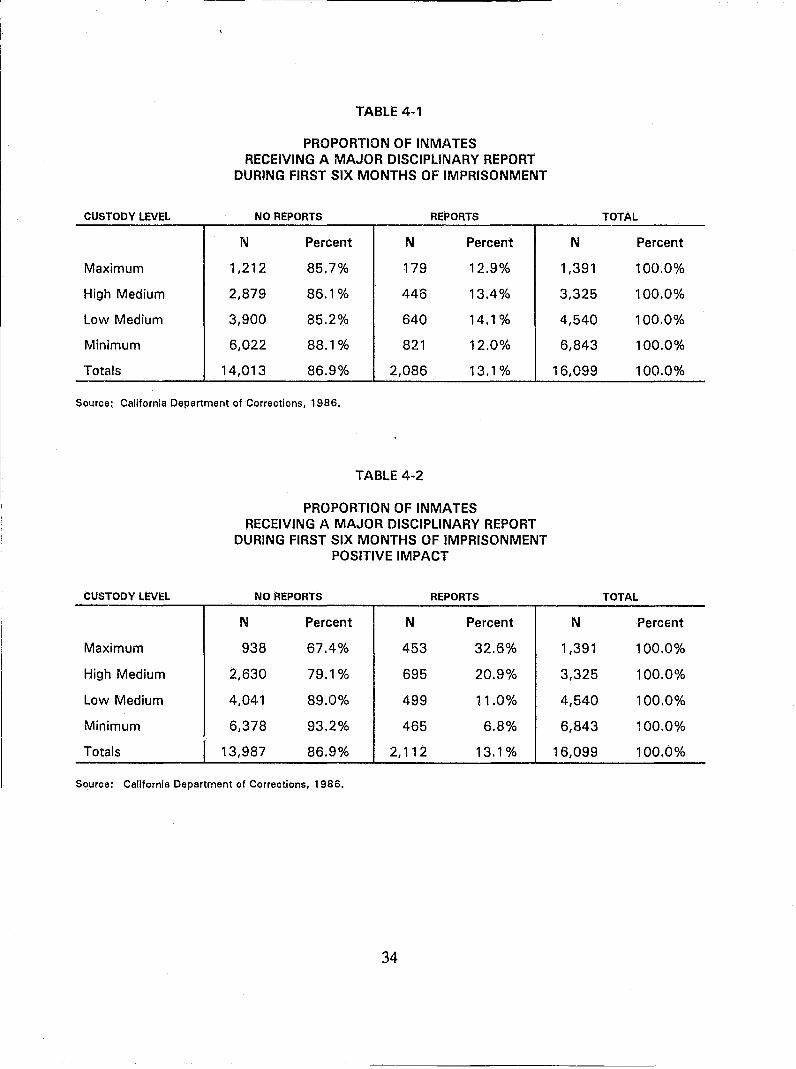
CUSTODY LEVEL
Maximum
High Medium
Low Medium
Minimum
Totals
TABLE 4-1
PROPORTION OF INMATES RECEIVING A MAJOR DISCIPLINARY REPORT
DURING FIRST SIX MONTHS OF IMPRISONMENT
NO REPORTS REPORTS
N Percent N Percent
1,212 85.7% 179 12.9%
2,879 86.1% 446 13.4%
3,900 85.2% 640 14.1 %
6,022 88.1 % 821 12.0%
14,013 86.9% 2,086 13.1 %
Source: California Department of Corrections, 1986.
CUSTODY LEVEL
Maximum
High Medium
Low Medium
Minimum
Totals I
TABLE 4-2
PROPORTION OF INMATES RECEIVING A MAJOR DISCIPLINARY REPORT
DURING FIRST SIX MONTHS OF IMPRISONMENT POSITIVE IMPACT
NO REPORTS REPORTS
N Percent N Percent
938 67.4% 453 32.6%
2,630 79.1% 695 20.9%
4,041 89.0% 499 11.0%
6,378 93.2% 465 6.8%
13,987 86.9% 2,112 13.1 %
Source: California Department of Corrections, 1986.
34
TOTAL
N Percent
1,391 100.0%
3,325 100.0%
4,540 100.0%
6,843 100.0%
16,099 100.0%
TOTAL
N Percent
1,391 100.0%
3,325 100.0%
4,540 100.0%
6,843 100.0%
16,099 100.0%
a cell and among short-termers rather than long-termers. Unless the impact design controls for the effect of environment, it will tell us little about the impact of the objective classification system.
The two most rigorous types of impact evaluation designs are experimental and quasi-experimental. Experimental designs are rare because they require establishing rigorous experimental conditions and assignment procedures (e.g., random assignment, testing of the pre-treatment equivalence of experimental and control groups, and so on). Although difficult to implement, experimental studies offer the best means for measuring the impact of classification systems on prison operations. In recent years there has been increased emphasis on the value of experiments in criminal justice. As more experiments are completed, knowledge on how to conduct experiments in criminal justice is accumulating (Lempert and Visher, 1988).
An example of the basic experimental design is illustrated in Figure 4-2. In this design, the "0" represents observations or measures made of the subjects being tested. Observations can entail pre- and post-measures of behavior and attitudes. In classification system evaluations, the subjects being tested generally represent inmates or staff being exposed to a new classification system or policy. The "X" reflects the treatment intervention Of, in this situation, the experimental classification system or policy that has been introduced. Finally, the "R" reflects the fact that inmates or staff are randomly assigned to either the new classification system or to control conditions. The randomization feature is critical, as it allows the researchers to control for the differences between the control and experimental group characteristics.
In a true experiment, all conditions are held constant except the intervention to assure that any differences between the experimental and control groups at time O2 can only be due to the intervention. In the controlled setting of a laboratory we can be quite sure that the only difference between the experimental and control groups must be due to the intervention. Thus, to use a term introduced in Chapter Two, the results of a true experiment have high internal validity. However, the fact that the experiment took place in the artificial setting of a laboratory means that we do not know how relevant the findings are to the real world - external validity is doubtful.
Another research method is the field experiment in which subjects are randomly selected for the experimental and control groups, but the intervention is applied in a field setting rather than a laboratory. Clearly, a field experiment taking place in a prison classification unit cannot have the controls of a laboratory, so it will probably have lower internal validity. On the other hand, the field experiment will have much higher external validity than the true experiment.
A recent study of an experimental design was the Prisoner Management Classification (PMC) study conducted for the Washington Department of Corrections by the National Council on Crime and Delinquency (Austin, 1990). Here the evaluators randomly assigned newly admitted inmates to either a newly opened prison that was operating a novel classification system or other prisons that were operating the current classification system. In doing so, the
35
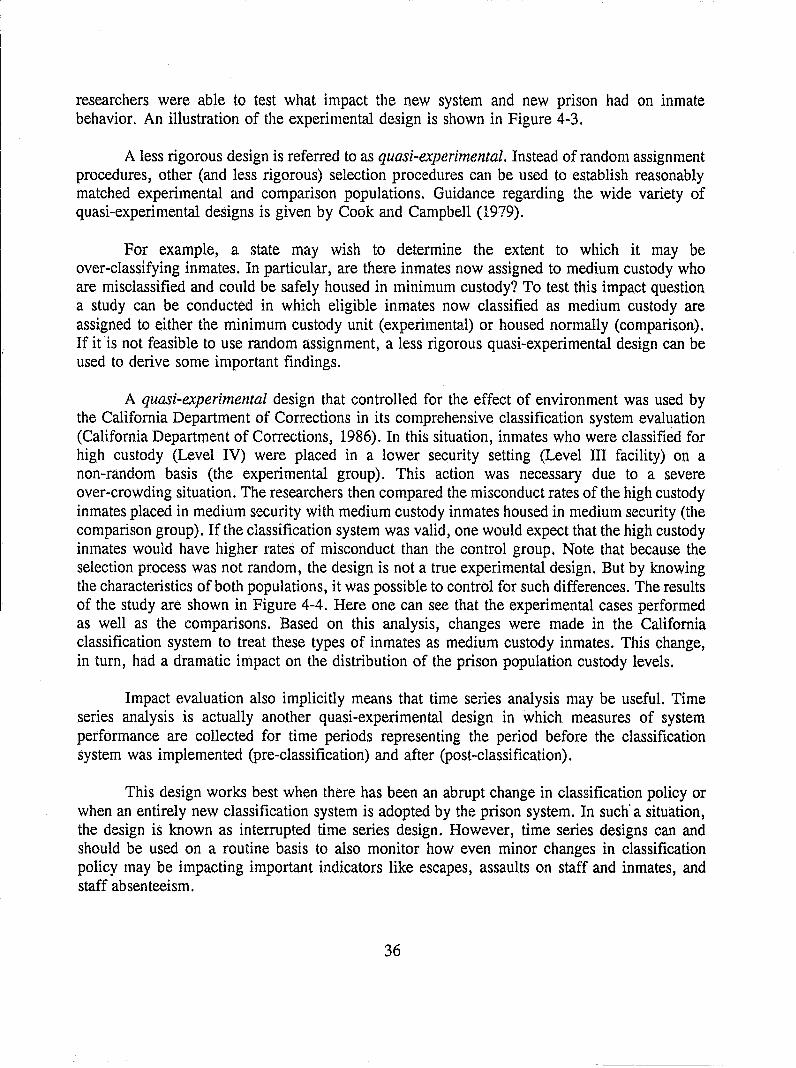
researchers were able to test what impact the new system and new prison had on inmate behavior. An illustration of the experimental design is shown in Figure 4-3.
A less rigorous design is referred to as quasi-experimental. Instead of random assignment procedures, other (and less rigorous) selection procedures can be used to establish reasonably matched experimental and comparison populations. Guidance regarding the wide variety of quasi-experimental designs is given by Cook and Campbell (1979).
For example, a state may wish to determine the extent to which it may be over-classifying inmates. In particular, are there inmates now assigned to medium custody who are misclassified and could be safely housed in minimum custody? To test this impact question a study can be conducted in which eligible inmates now classified as medium custody are assigned to either the minimum custody unit (experimental) or housed normally (comparison). If it is not feasible to use random assignment, a less rigorous quasi-experimental design can be used to derive some important findings.
A quasi-experimental design that controlled for the effect of environment was used by the California Department of Corrections in its comprehensive classification system evaluation (California Department of Corrections, 1986). In this situation, inmates who were classified for high custody (Level IV) were placed in a lower security setting (Level III facility) on a non-random basis (the experimental group). This action was necessary due to a severe over-crowding situation. The researchers then compared the misconduct rates of the high custody inmates placed in medium security with medium custody inmates housed in medium security (the comparison group). If the classification system was valid, one would expect that the high custody inmates would have higher rates of misconduct than the control group. Note that because the selection process was not random, the design is not a true experimental design. But by knowing the characteristics of both populations, it was possible to control for such differences. The results of the study are shown in Figure 4-4. Here one can see that the experimental cases performed as well as the comparisons. Based on this analysis, changes were made in the California classification system to treat these types of inmates as medium custody inmates. This change, in turn, had a dramatic impact on the distribution of the prison population custody levels.
Impact evaluation also implicitly means that time series analysis may be useful. Time series analysis is actually another quasi-experimental design in which measures of system performance are collected for time periods representing the period before the classification system was implemented (pre-classification) and after (post-classification).
This design works best when there has been an abrupt change in classification policy or when an entirely new classification system is adopted by the prison system. In such" a situation, the design is known as interrupted time series design. However, time series designs can and should be used on a routine basis to also monitor how even minor changes in classification policy may be impacting important indicators like escapes, assaults on staff and inmates, and staff absenteeism.
36
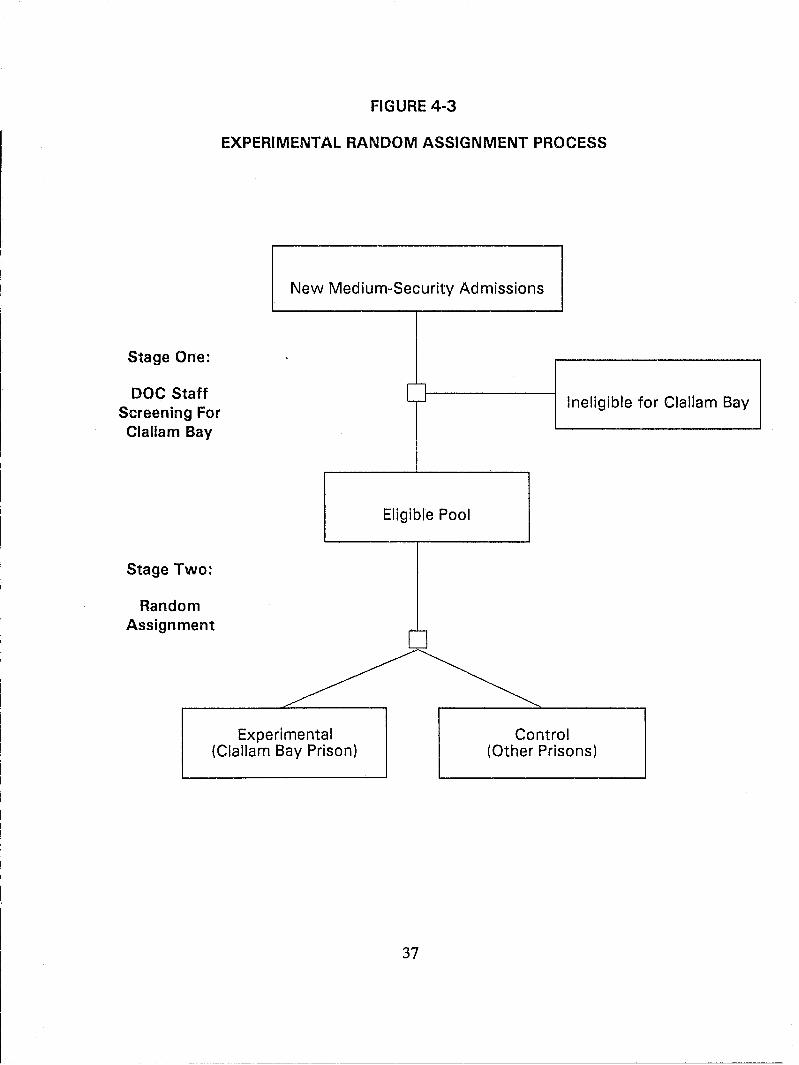
Stage One:
DOC Staff Screening For Clallam Bay
Stage Two:
Random Assignment
FIGURE 4-3
EXPERIMENTAL RANDOM ASSIGNMENT PROCESS
New Medium-Security Admissions
Ineligible for Clallam Bay
Eligible Pool
Experimental (Clallam Bay Prison)
Control (Other Prisons)
37
---------------~-------------------.--~---
Vl 00
40
30
20
10
o v
ANNUAL PERCENT
FIGURE 4-4 PERCENT OF INMATES WITH
SERIOUS DISCIPLINARIES
INMATES
_ LEVEL IV INMATES ENDORSED TO LEVEL III FACILITY
Ii7ZJ LEVEL III INMATES FROM RECEPTION CENTERS
[:::=J LEVEL III INMATES FROM OTHER INSTlTIJTIONS
NOTE: PERCENTS ADJUSTED FOR PERIOD OF EXPOSURE TO REPRESENTTIlE PERCENT PER INMATE YEAR.
SOURCE: CALIFORNIA DEPARTMENT OF CORRECTIONS, 1986
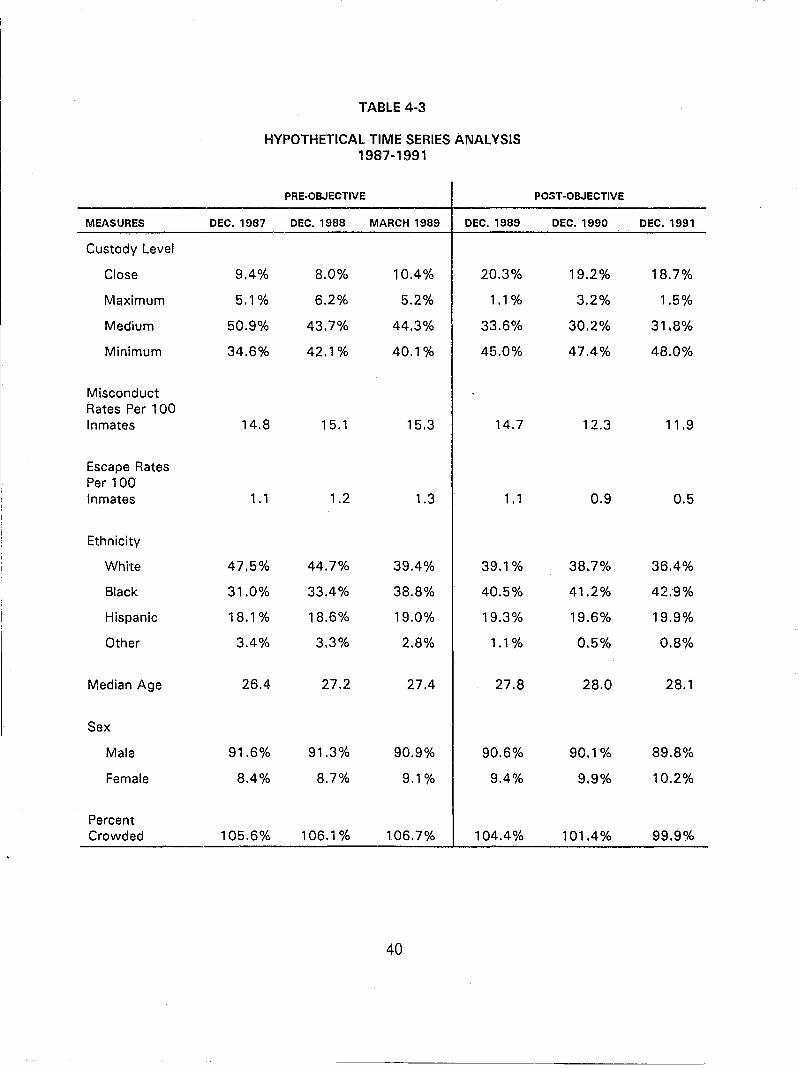
TABLE 4-3
HYPOTHETICAL TIME SERIES ANALYSIS 1987-1991
PRE·OBJECTIVE POST ·OBJECTIVE
MEASURES DEC. 1987 DEC. 1988 MARCH 1989 DEC. 1989 DEC. 1990 DEC. 1991
Custody Level
Close 9.4% 8.0% 10.4% 20.3% 19.2% 18.7%
Maximum 5.1 % 6.2% 5.2% 1.1 % 3.2% 1.5%
Medium 50.9% 43.7% 44.3% 33.6% 30.2% 31.8%
Minimum 34.6% 42.1 % 40.1% 45.0% 47.4% 48.0%
Misconduct Rates Per 1 00 Inmates 14.8 15.1 15.3 14.7 12.3 11.9
Escape Rates Per 100 Inmates 1.1 1.2 1.3 1 .1 0.9 0.5
Ethnicity
White 47.5% 44.7% 39.4% 39.1% 38.7% 36.4%
Black 31.0% 33.4% 38.8% 40.5% 41.2% 42.9%
Hispanic 18.1 % 18.6% 19.0% 19.3% 19.6% 19.9%
Other 3.4% 3.3% 2.8% 1.1 % 0.5% 0.8%
Median Age 26.4 27.2 27.4 27.8 28.0 28.1
Sex
Male 91.6% 91.3% 90.9% 90.6% 90.1% 89.8%
Female 8.4% 8.7% 9.1% 9.4% 9.9% 10.2%
Percent Crowded 105.6% 106.1 % 106.7% 104.4% 101.4% 99.9%
40
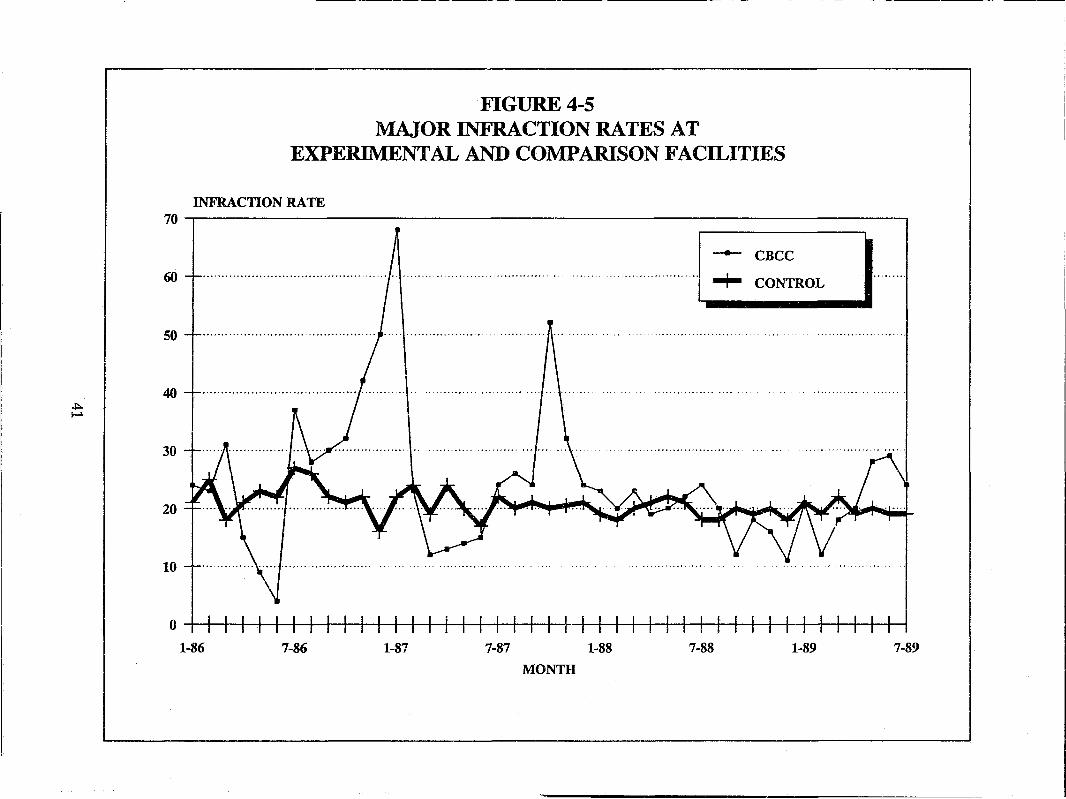
~ j-l
--------------------------------------------------------------------------~--------~------------------------...... ---
FIGURE 4-5 MAJOR INFRACTION RATES AT
EXPERIMENTAL AND COMPARISON FACILITIES
INFRACTION RATE 70 ~--------------------------------------------------------------------------~
- CBCC
60 -+- CONTROL
50 - ............................. .
40
30
20
10
o I I I I I I I I I I I I I I I I I I I I I I ! I I I I I I I I I I I I I I I I I I I I
1-86 7-86 1-87 7-87 1-88 7-88 1-89 7-89
MONTH
Several standard-setting bodies and some court decisions recommend that factors used in classifying inmates (especially for security levels) show demonstrated predictive validity. This means that items used for classification should be evaluated to assess whether they predict certain basic outcomes, e.g., violence, escape, suicide risk, and so on.4 Ideally all risk factors should have predictive validity. However, there is much debate on what factors are relevant for what outcomes. Criminological research continually produces new findings regarding the best "risk factors" for predicting various outcomes. Researchers must keep abreast of this literature in order to be able to properly advise prison administrators.
In the last few years, several writers have suggested that predictive accuracy as an evaluative criterion has been over-emphasized for prison classification (Solomon and Baird, 1982). Some authorities argue that to expect high accuracy in risk prediction of certain behaviors (e.g., low base-rate events such as suicide, violence, or escape) is unrealistic and statistically intractable (Solomon and Baird, 1982; Monahan, 1981). Moreover, one can also argue that unless the field is willing to conduct experimental designs where inmates are in effect randomly distributed throughout a prison system, it win be very difficult to separate the effects on inmate behavior of prison environment, inmate characteristics and inmate-environment interaction. Consequently, the importance of achieving a truly predictive instrument has been downplayed and the other goals of objective risk classification instruments have been emphasized.
EVALUATION METHODS
There are two basic methods used by researchers to conduct studies: quantitative and qUalitative. Quantitative methods collect information by assigning numbers to phenomena. They imply the use of data that have been coded from agency files, surveys, or computerized information systems. Such data are amenable to sophisticated mathematical computations and statistical analysis. A major advantage of quantitative methods is that a large number of cases or individuals can be analyzed relatively quickly and inexpensively, thanks to computers and the widespread availability of statistical software packages.
Qualitative methods, on the other hand, collect information by narrative description of phenomena. They utilize data which are collected by researchers through such methods as interviewing, field observation, participant-observation and focus groups. Here the researcher is interested in getting closer to the phenomenon being studied. Rarely are statistical applications utilized in qualitative methods with the exception of sampling procedures. For example, even when one is making observations of the classification hearings or inmate interviews, the
4 A further component of evaluation is efficiency evaluation. Given that an intervention achieved its intended impacts, was it worth it? Did the intervention cost more than the impacts were worth? Could the impacts have been achieved less expensively? Efficiency evaluation is in its infancy; it involves complex techniques that have not been fully worked out. Therefore we have not included it in this Handbook.
42
researcher may still utilize quantitatively based sampling methods to ensure the observations or interviews are representative of the universe being studied.
Although qualitative methods are constrained by the number of persons one can study and the amount of data to be analyzed, they are equally important in conducting a comprehensive evaluation. In particular, qualitative methods often allow the researcher to better "explain" findings observed from quantitative methods. For example, quantitative analysis may reveal a 25 percent override rate that only tells the evaluator about the number and official reasons for the overrides. Interviews with classification staff and observations of classification hearings may further reveal to the evaluator that the reason staff trigger overrides at such a high rate is because the severity of offense scale used by the classification staff places too great a numerical weight on drug possession crimes, which places inmates in a higher classification level than required.
It is important for classification evaluations to utilize both methods in conducting a formal evaluation. Each approach has strengths and weaknesses; together they complement each other and form a comprehensive methodological approach. In NCCD's evaluations of the Texas and California classification systems, multiple methods were applied to assess violence within the prison system, including forced-choice inmate surveys, interviews with inmates and staff, field observations of classification hearings, and random visits to institutions to observe inmate behavior in housing and work areas. Such a diverse methodological approach allowed the researchers to gather a rich array of data and an ability to confirm and interpret findings produced from either quaf'titative or qualitative methods. This strategy of having multiple .• It" ,
measures of a single phenomenon is referred to as triangulation.
STANDARDS FOR EVALUATION DESIGNS AND METHODS
1. A process design should identify the major components of the objective classification system and compare the plan to the actual performance.
2. An impact design should be experimental with random assignment into experimental and control classification systems. If that design is not feasible, a quasi-experimental design utilizing matched control groups should be used.
3. Time series designs should be used to measure the impact of a system on aggregate levels of inmate misconduct, escapes, employee attitudes, and costs.
4. An impact evaluation design should identify possible confounding and design effects and show how they are accounted for.
5. Both qualitative and quantitative methods should be employed in conducting process and impact evaluations.
43
CHAPTER FIVE
MEASURES
DEFINITION OF MEASURES
Measures are the link between evaluation questions and the everyday activities of classification and prison life. To know whether a new objective classification instrument is being applied accurately or is reducing disciplinary problems, one must determine exactly what activities are to be observed to answer the questions. To find out if the instrument is being applied accurately, should the case folders be reviewed or inmate interviews observed, and exactly what should be looked for in the folder or the interview? To find out if the instrument has reduced disciplinary problems should the staff and inmates be interviewed or should infractions be counted, and if so, what questions should be asked and how should infractions be counted? In technical terms, one must operationalize the concepts in the evaluation questions. Therefore, a measure can be defined as an operational definition of a concept, and an operational definition is defined as one that specifies the procedures to be followed in measuring a concept.
There is no formula for transforming a concept into an operation, and there is no single operation that can accurately measure a concept. For instance, to evaluate the accuracy of classifications, one can begin to operationalize the concept of "accuracy" as the number of errors in classification. However, there are a number of ways to count errors: 1) the number of cases that have errors, 2) the number of cases that have errors that result in misclassifications, 3) the total number of errors, and 4) types of errors (such as scoring errors, mathematical errors). Each of these measures taps a slightly different aspect of "accuracy" and each has advantages and disadvantages. A more difficult issue in measuring the accuracy of classifications is how to define an error. Most objective instruments are less objective than they appear; the incompleteness and ambiguity of criminal and correctional records means that on any given case two persons could differ on the scoring of at least one factor. When should a difference be counted as a matter of judgment and when as an error? Thus, it is shown that measures are indicators of a concept, and that anyone of them must give an incomplete picture of the concept. Therefore, there should be more than one measure of a concept.
While there are no formulae for transforming concepts into measure~, there are several characteristics that if attended to will guide an evaluation project toward good measures. Good measures are reliable, valid, sensitive, comparable, convincing, timely and efficient. Reliability and validity have already been discussed in Chapter Two and therefore will be discussed only briefly here.
• Reliable. An elastic ruler will produce inconsistent results, and a measure that produces inconsistent results is useless. A security classification procedure that produces inconsistent results - an inmate is classified differently by different staff - is seriously, probably fatally, flawed.
44
, i
There are three types of reliability: internal, interrater and rate-rerate reliability. They have been discussed in Chapter Three.
Problems of rellability may be deceptively complex. For instance, it is common to find that staff at some prisons are quicker to issue infractions than at other prisons. Thus, the same behavior may result in an infraction at one prison and not at another. Does this me'an that the rate of official infraction has low interrater reliability as a measure of disciplinary adjustment? It depends. If one focuses on conformity to facility expectations (whatever they may be), then it is a reliable measure. If the rate of actual events are focused on, then it is an unreliable measure.
Reliability is itself a concept that can be measured. Usually some t.ype of correlation or association is used to measure reliability (see Chapter Eight for further explanation of measures of association and correlation).
• Valid. A valid measure is one that measures the concept it is supposed to. A measure may be reliable but invalid (though to be valid it must also be reliable). A poorly made ruler that is too short can yield a highly reliable but invalid measure of the length of a piece of wood. A ruler may give us a reliable measure of the length of a piece of wood; but if our concern is the weight of the wood, the measure is invalid. Types of validity have been discussed in Chapter Three.
Validity is certainly the most difficult measurement standard to address. It is easy to create a measure that is reliable yet invalid without knowing it. For instance, a widely replicated finding in social psychology has been that women are more conformist than men. However, recent analysis shows that the i.nstruments used to measure conformity focused on topics such as politics, economics and spatial judgments, topics that were more familiar to men than women. When the topics were varied to include topics more familiar to women than men, both sexes were equally conformist. We can conclude that the instrument that was supposed to measure conformity in fact measured stimulus familiarity. The instrument was very reliable and very invalid (from Kirk & Miller: 27-28). Qualitative research can be most useful in increasing validity.
• Sensitive refers to how detailed a measure is. One might measure disciplinary adjustment as acceptable/unacceptable or it might be measured on a three or a ten point scale. The more detailed a measure is, the more expensive and time-consuming it is to collect and use. On the other hand, if a measure is insufficiently detailed, it may be of little or no use.
• Comparable refers to how comparable a measure is to measures of the same concept in other studies. This standard is unimportant for any single study, but it is crucial for our ability to accumulate knowledge about classification and advance the field. For instance, there are over 100 published studies in English of predictors of disciplinary adjustment (Chapman, 1981; Humphrey, 1987), yet
45
the measures of these predictors and of disciplinary adjustment are so inconsistent that it is difficult to draw general conclusions from all these studies. Therefore little knowledge has accumulated. This state of affairs is inexcusable. Evaluators should be responsible for knowing the measures that have been used in classification evaluation and for using them unless there is a very good reason not to. Prior studies must be reviewed when designing measures.
• Convincing means' that the measure must be persuasive to the users of the evaluation; it must have what we referred to in Chapter Three as face validity. For example, users may be dubious about the accuracy of official disciplinary records or of inmate self-reports. In that case such measures must be defended or avoided.
• Timely means the measures must be available when needed. Timeliness is particularly important in monitoring reports. A measure of staff performance that comes to staff months after the performance is worse than useless. Staff will have long forgotten what they did, so an untimely measure of performance will disrupt sta.ff without giving them an opportunity to improve.
• Efficient measures are ones that get the job done with the least resources. The importance of this standard cannot be overestimated. Resources for evaluation are always scarce, and if a measure is expensive and complicated, it is unlikely to last. Simple measures are usually more difficult to create than complex ones, but they are more likely to last.
Measures with these characteristics contribute to an effective evaluation. But measures have another role - they influence the very performance they are designed to measure. If classification staff know their performance is measured by percent of scoring errors or override rate, they will attend to these issues and tend to neglect other aspects of performance. Since it is known that anyone measure can only measure a single aspect of a concept, one can be sure that the measure will focus staff on some aspects of their jobs more than others. Therefore, it is important that measures, especially m(~sures that will be repeated, focus on essential aspects of performance. A measure that is inexpensive to collect may be inefficient in the long run if it diverts staff from the essentials of performance.
Finally, there are four levels of measures that should be distL1guished, because, as shown in Chapter Eight, different types of statistics are appropriate to each.
• Nominal. Categories with no quantitative implications. Examples are: male/female or property/drug/violent offense.
• Ordinal. Categories that are ordered with respect to the degree they possess a certain characteristic. Violation/misdemeanor/felony or minimum/medium/maximum security are ordinal categories.
46
I I II . ~
• Interval. Categories ordered into equal intervals with respect to the degree they possess a certain characteristic, such as the Fahrenheit scale.
• Ratio. Categories ordered into equal intervals with respect to the degree they possess a certain characteristic and can be located on a scale with an absolute, non-arbitrary O. For instance, number of arrests or number of convictions.
EXAMPLES OF MEASURES
As an example of the issues involved in measures, consider the concept of disciplinary adjustment and its measures. These measures are crucial in the evaluation of classification, because disciplinary adjustment is so often the dependent variable.
In all evaluations of objective classification instruments, measures of disciplinary adjustment have been based on official reports. Some measures count the number of infractions over time, others weigh the infractions by their severity (measured either by type or disposition) and others distinguish between types of infractions. We will assess these measures from the point of view of our standards: reliability, validity, sensitivity, comparability, convincingness, timeliness and efficiency.
In any jurisdiction where the disciplinary system is automated, official reports have several advantages. First, official reports are efficient, especially if they are already collected on the computer. Second, if the automated disciplinary system is part of the disciplinary procedure, the offiCial reports are likely to be timely, sensitive, and convincing to staff and management. Finally, official disciplinary systems seem to be similar enough across states that they are quite comparable.
A good example of measures based on official reports comes from an Ohio evaluation of its objective security classification (Caprio and Hardy, 1986). In this evaluation, disciplinary adjustment is measured for one year following admission. There are four measures:
• number of disciplinary transfers;
• number of rule infractions;
• number of violent rule infractions;
• days spent in local or administrative control.
When the evaluation concludes that all measures of disciplinary adjustment correlate with security classification, the conclusion is strengthened.
Are official reports adequate measures of the concept "disciplinary adjustment?" Published research on measures of street crime raises questions about the adequacy of official
47
reports as measures of offenses. These questions apply to official reports of prison offenses also. Prison rules usually cover every aspect of prison life. Officers cannot possibly write up inmates for all the offenses they do observe, so officers must use their judgment in writing tickets. Characteristics of officers, inmates and offenses may all have an effect on whether an offense is officially reported, how it is reported and its disposition.
Independent measures of disciplinary adjustment should be used to increase reliability and validity. These independent measures are offender and victim self-reports. In a study of female inmates in English prisons, Mandaraka-Shephard (1986, p. 97) found much higher rates of self-report than official report.
Since self-report measures are much less timely and efficient than official reports, they are best used sparingly. They can then be used to produce a formula that will adjust official reports, or they can be used as alternative measures of the concept "disciplinary adjustment."
Self-report measures of disciplinary adjustment present problems of reliability and validity that must be addressed. Small differences in the design of self-report measures can cause large. differences in results. For instance, in two prison inmate self-report surveys of frequency rates for serious offenses, the second survey found rates about seven times higher than the first survey. Most of the difference was attributed to two small changes in the second questionnaire. The first questionnaire covered the three years preceding the present incarceration; the second covered the period from January 1 of the year preceding the year of incarceration to the time of incarceration. The first questionnaire provided response categories (0, 1-2, 3-5, etc.); the second provided an open field in which the respondent entered a number (Cohen, 1986). Therefore, one can see that self-report measures must be designed very carefully.
There are several choices of self-report measures: they can be interviews or questionnaires, they can be open- or close-ended, they can be administered anonymously or not. The questions themselves can vary greatly in their topics, wording and sequence (see Weis, 1986; Murphy, 1980 and Gorden, 1975 for careful discussions of the issues presented here).
There are numerous obstacles to collecting reliable and valid self-report measures; the measures must be designed to reduce these obstacles. Obstacles are of two kinds: those that make the subject unable to provide reliable and valid data and those that make the informant unwilling to do so. There are four kinds of obstacles that make a subject incapable of giving good data.
• Confusing questions. If the evaluator fails to make crystal clear what s/he wants to know, the informant can hardly provide it.
• Memory lapses. The subject cannot remember the requested information. Research shows that memory lapse is far more complex than a simple passive decay of memory traces (Weis, 1985). Low frequency events tend to be better remembered than high frequency events. Vivid events are better remembered than
48
ordinary events. Events occurring after the targeted event interfere with memory in a variety of ways.
• Habitual behavior is extremely difficult to recall, since the subject was hardly aware of the event even at the time it occurred.
• Retrospective deduction. The final outcome of a sequence of events may make it very difficult to recall the sequence accurately. For instance, if a program fails, subjects are likely to recall early signs of failure more vividly than if it succeeds. If an inmate is removed from a prison for disciplinary reasons, this may well affect recollection of his initial adjustment.
There are four obstacles that make an informant unwilling to provide good information:
• Rational calculation. For instance, an inmate may calculate that reporting his disciplinary offenses may get back to the prison administration.
• Etiquette. For example, the subject may feel that sharing information on his disciplinary adjustment violates inmate codes.
• Self-esteem. The subject may be unwilling to reveal information that makes him feel badly about himself.
• Trauma. The events in question may be so painful that the subject is reluctant to bring them up.
Chapter Six will examine how these obstacles can be reduced in open-ended interviews. The following section will review some of the ways obstacles can be addressed in questionnaires. Anonymous questionnaires may reduce the obstacles of self-esteem and etiquette in comparison to interviews. Preparing questions that are specific and detailed both clarifies the evaluator's intent and encourages the subject's memory. Selecting a time period that is long enough to provide a good sample of the inmate's behavior but not so long as to make recollection very difficult (not more than one year) apparently addresses the obstacle of memory lapse. The questionnaire might use a shorter period for minor offenses and a longer ?eriod for serious offenses. Selecting a beginning date for the period covered that is easily recognized, such as January 1, will produce better data than, for instance, a beginning date one year prior to the date of incarceration.
Figure 5-1 is an example of a well-designed victim self-report questionnaire. It is excerpted from a questionnaire used in the evaluation of the Prison Management Classification System (Austin, Holien, Chan and Baird, 1990).
49
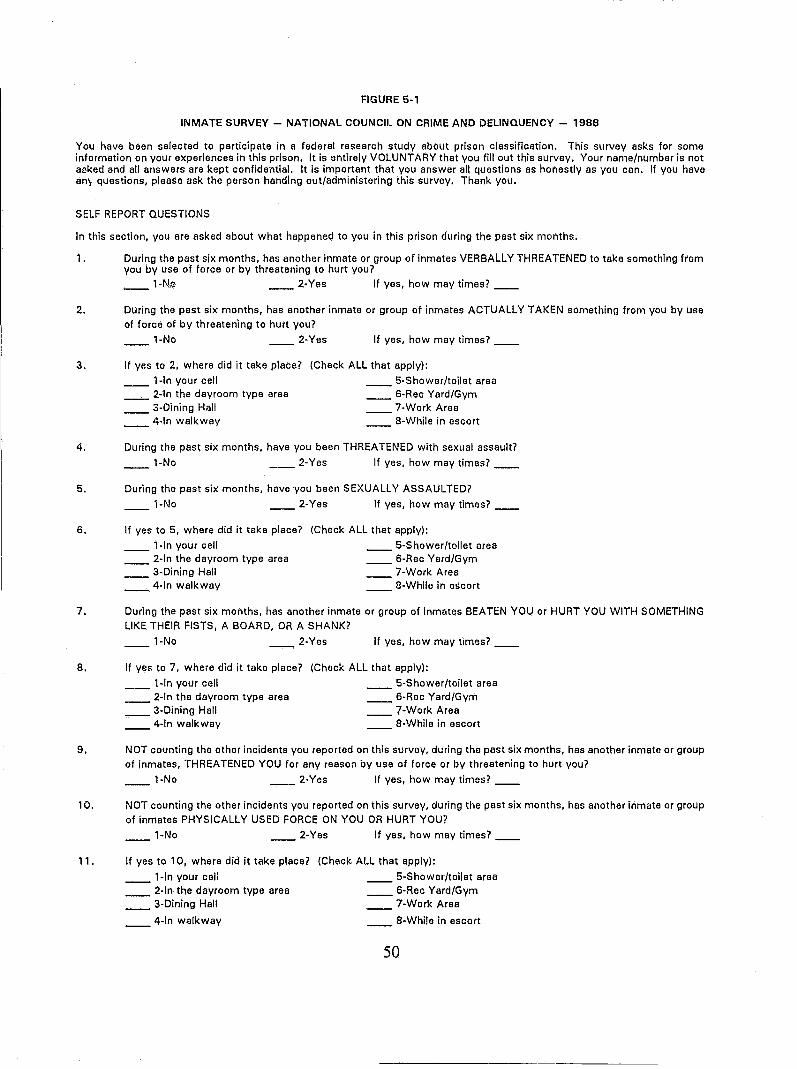
FIGURE 6-1
INMATE SURVEY - NATIONAL COUNCIL ON CRIME AND DELINQUENCY - 1988
You have been selected to participate in a federal research study about prison classification. This survey asks for some information on your experiences in this prison. It is entirely VOLUNTARY that you fill out this survey. Your name/number is not a,"ked and all answers are kept confidential. It is important that you answer all questions as honestly as you can. If you have an~ questions, please ask the person handing out/administering this survey. Thank you.
SELF REPORT QUESTIONS
In this section, you are asked about what happened to you in this prison during the past six months.
1. During the past six months, has another inmate or group of inmates VERBALLY THREATENED to take something from you by use of force or by threatening to hurt you?
l-N~ 2-Yes If yes, how may times? __
2. During the past six months, has another inmate or group of inmates ACTUALLY TAKEN something from you by use of force of by threatening to hurt you?
3.
l-No 2-Yes If yes, how may times? __
If yes to 2, where did it take place?
__ 1 -In your cell __ 2-ln the dayroom type area __ 3-Dining Hall __ 4-ln walkway
(Check ALL that apply):
5-Shower/toilet area __ 6-Rec Yard/Gym
7-Work Area a-While in escort
4. During the past six months, have you been THREATENED with sexual assault?
l-No 2-Yes If yes, how may times? __
5. During the past six months, have you been SEXUALLY ASSAULTED?
'-No 2-Yes If yes, how may times? __
6. If yes to 5, where did it take place? (Check ALL that apply):
__ l-In your cell __ 2-ln the dayroom type area __ 3-Dining Hall __ 4-ln walkway
__ 5-Shower/toilet area __ S-Rec Yard/Gym
7-Work Area a-While in escort
7. During the past six months, has another inmate or group of inmates BEATEN YOU or HURT YOU WITH SOMETHING
LIKE THEIR FISTS, A BOARD, OR A SHANK?
l-No 2-Yes If yes, how may times? __
8. If yes to 7. where did it take place? (Check ALL that apply):
__ l-In your cell __ 2·ln the dayroom type area __ 3-Dining Hall __ 4-ln walkway
__ 5-Shower/toilet area __ 6-Rec Yard/Gym
7-Work Area 8-While in escort
9. NOT counting the other incidents you reported on this survey, during the past six months, has another inmate or group of inmates, THREATENED YOU for any reason by use of force or by threatening to hUrt you?
l-No 2-Yes If yes, how may times? __
10. NOT counting the other incidents you reported on this survey, during the past six months, has another inmate or group of inmates PHYSICALLY USED FORCE ON YOU OR HURT YOU?
l-No 2-Yes If yes, how may times? __
11. If yes to 10, where did it take place? (Check ALL that apply): __ , -In your cell __ 2-ln the dayroom type area __ 3-Dining Hall
__ 4-ln walkway
__ 5-Shower/toilet area __ S-Rec Yard/Gym
7-Work Area
8-While in escort
50

STANDARDS FOR MEASURES
l. There should be multiple measures of concepts.
2. Measures should be reliable, valid, sensitive, comparable, convincing, timely and efficient.
3. Obstacles to collecting reliable and valid measurements should be identified and the strategies for overcoming these obstacles should be specified.
51
CHAPTER SIX
SAMPLING
DEFINITION OF SAMPLE
In evaluating an intervention, including an objective classification system, one cannot observe everything going on in the intervention. Every counselor cannot be observed making decisions and no observation can be made in detail of all inmates' adjustment to prison. How can general conclusions be drawn about a program from partial observations of the program? This is the question of sampling.
It is commonly believed that for a sample to be useful it must be large, and it must be randomly selected. Thus, in the recent classification case, Ruiz vs. Lynaugh (Austin, undated), the Court rejected a study by the Special Master's Office because "the sample was too small." Unfortunately, this objection revealed a lack of understanding on the Court's part, which is wide-spread. There are several factors besides size that determine the usefulness of a sample. After all, behavior of 43 million American voters is successfully predicted with a sample of slibhtly more than 1,000. In this chapter we discuss the criteria for creating a useful sample.
The following concepts will help us think about how to draw general conclusions from partial observations:
• Universe defines the group about which information is sought.
• Population is the group from which a sample will actually be selected.
• Sample frame is a list of the members of the population.
• Sample refers to one or more cases selected from the sample frame.
For example, what is the universe, population, sample frame and sample in a predictive validation of an objective classification instrument? If the instrument is a reclassification instrument, then the universe is all present and future reclassification decisions. A useful population might be all reclassification decisions during the most recent calendar year. If the instrument is an initial classification instrument, then the universe is all present and future initial classification decisions. A useful population might be all initial classification decisions during the most recent year. The sample frames will be lists of all reclassification and initial classification decisions made during the most recent year. The samples will be selections of cases from the two sample frames.
The distinction between universe and population alerts one to the need to analyze the relation between the population from which the sample is selected and the universe one wishes
52
----------------------------------------------------
to learn about. As the characteristics of inmates change over time, which they will, the population on which the instrument was validated will no longer represent the universe, so the instrument will have to be revalidated using a more recent population. To give another example, the stock population (inmates at a given point of time) and the flow population (inmates received over a given time period) have different characteristics. Because long-term inmates accumulate in a prison population while short-term inmates replace each other, the stock population has a larger percentage of long-term inmates than the flow popUlation. Thus, in one prison system the percent of inmates with minimum terms over ten years was 1.2 percent in the flow population and 6.8 percent in the stock population. The relation of these two populations to a universe are very different; so one would have to analyze carefully which would be most appropriate.
Having defined the universe and population, a sample frame is established, a list of the members of the population. Some of the most spectacular errors in sampling have been in creating the sample frame. Generally, evaluators should be on safe ground in creating a sample frame for prison populations, since if there is one thing prison administrators must have, it is accurate lists of their populations. Nevertheless, even here the sample frame must be thought through carefully. For instance, in an evaluation of a Vermont prison classification system the population consisted of all inmates incarcerated from March, 1983 through June, 1985. The sample frame was created from a list of daily facility rosters submitted quarterly in 1983 and monthly thereafter. Since Vermont inmates may serve terms of less than 90 days, short-termers could be under-represented in the 1983 list and therefore in the sample frame. Therefore the evaluator analyzed the 1983 rosters to see if the under-representation of short-termers was significant (it was not) (Apao, 1986: 14-15).
Finally, a sample from the sample frame is chosen. The goal is to select a sample that is representative of the population in the respects that concern us, so that what is learned about the sample will apply to the population and hence the universe.
If the sample is perfectly representative of the popUlation, then what is learned about the sample will apply to the population. For instance, if the disciplinary failures per year in the population is 12 percent and the percent of disciplinary failures in the sample is also 12 percent, what is known about the sample would apply to the population. If, however, the percent of failures in the sample is 12 percent and the percent in the population is 15 percent, then the difference between the measure in the sample and the population is 3 percent, which is called the sampling error. Thus, to say that the goal is to select a representative sample is to say the aim is to reduce sampling error and to know just how much sampling error there is.
What are the sources of sampling error? How can they be reduced, and how can they be specified? There are two sources of sampling error: bias and variance. s
5 Technically, bias exists when the expected value of a statistic based upon sample data differs from the population value it was designed to estimate. The expected value represents the average value of the statistic based upon an infinite number of random samples of the same size
53
Figure 6-1 illustrates the ideas of bias and variance. Imagine an average marksman taking ten shots at a bullseye and creating the pattern in Figure lao An expert marksman using the same rifle then takes ten shots, creating the pattern in lb. Involuntary movements, wind shifts, etc., cause these patterns around the bullseye. These are examples of variance. One could determine the distance between each 8?lOt and the bullseye and average the distances to create a measure of variance, and would discover that the variance is smaller for the expert than for the average marksman. Now suppose the sight on the rifle is inaccurate; the average and the expert marksman might create the patterns in Figures lc and Id respectively. The distance between the actual bullseye and the bullseye the marksmen are aiming at due to the defective sight represents bias. Therefore the distribution of shots in Figures lc and Id is due partly to variance and partly to bias.
There are two types of samples, probability samples and nOll-probability (or judgmental) samples. The advantages of a probability sample is that the bias can be eliminated and variance can be precisely calculated. What defines a probability sample is that all its members are randomly selected from the population. Random selection means that each case in the population has a known, non-zero probability of being selected in the sample. It is the random selection of sample members that enables the bias to be eliminated and the variance of a probability sample calculated. Table 6-1 illustrates the ideas being addressed. In this example, there is a population of 32 inmates housed in three prisons. The 32 inmates have an average of 4.2 infractions per year. Three samples of eight inmates each were drawn to find that the average number of infractions is 4.6 in Sample 1, 3.6 in Sample 2, and 4.9 in Sample 3. There is sampling error in each sample, because the average in each sample is different from the true average in the population. Because the samples were selected randomly, there is no bias. All the sampling error is due to variance. The beauty of a randomly selected sample is that, thanks to sampling theory, its variance can be calculated precisely. In the example the true average in the population is known, but in practice only the average in the sample is known and one wonders how likely that sample average is to be the true average in the popUlation.
From the example one can state that for Sample 1 there is a 95 percent confidence interval and confidence limits of 1.1 and 8.0. This statement means there is a 95 percent likelihood that the mean in the population is somewhere between 1.1 and 8.0.
Calculating the variance for probability sample statistics is very valuable, since it gives a precise knowledge of sampling error. A 95 percent cunfidence interval and 3 percent tolerated error (sometimes confidence limits are expressed as tolerated error) will be more than adequate for some purposes and inadequate for others. For instance, if the results of a simulation of an objective security classification instrument on a sample results in a distribution of 10 percent maximum, 50 percent medium and 40 percent minimum with a 95 percent confidence limit and 3 percent tolerated error, then in actual use the percent of maximums is highly likely to be
taken from the population. Variance refers to the distribution of values for a statistic in a sample.
54
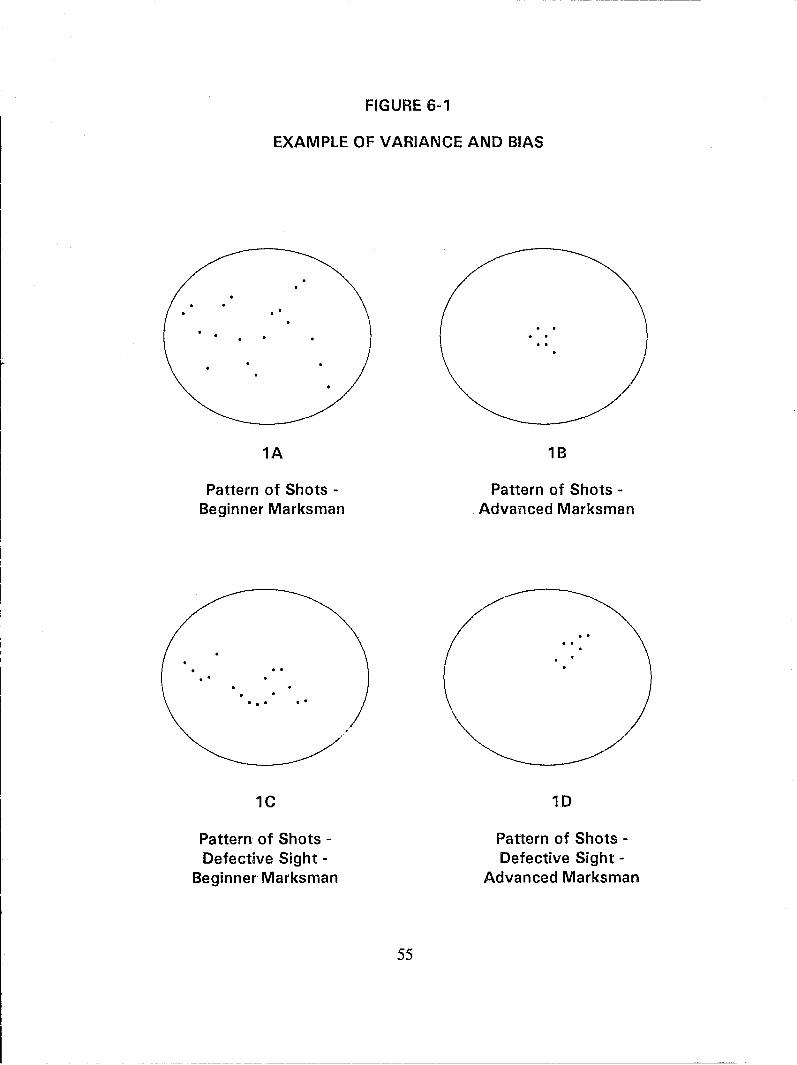
FIGURE 6-1
EXAMPLE OF VARIANCE AND BIAS
1A
Pattern of Shots -Beginner Marksman
. . . . . . .
1C
Pattern of Shots -Defective Sight -
Beginner Marksman
55
1B
Pattern of Shots -Advanced Marksman
..
1D
Pattern of Shots -Defective Sight -
Advanced Marksman
between 7 percent and 13 percent. Depending on departmental space flexibility, this degree of sampling error will be acceptable or unacceptable.
Suppose the degree of sampling error is unacceptable. What could be done to reduce it? The most obvious and common answer i's to increase the size of the sample. The larger the sample of the population, the higher the confidence limit and the lower the tolerated error. If the sample consisted of the entire population, the confidence limit would be 100 percent and the tolerated error would be 0 percent. On the other hand, if a sample of one case from the population is selected, the confidence limit would be low and the tolerated error high.
While it is true that increasing sample size reduces sampling error, it is also true that with large populations, once the sample size gets beyond a few hundred, it takes very large increases in sample size to produce even a small reduction in sampling error. Table 6-2 is an example of the relation between sample size and sample error. Note than an increase of 71 cases reduces tolerated error from 7 percent to 6 percent, but it takes an increase of 7,203 cases to reduce the rate from 2 percent to 1 percent.
Large samples have two disadvantages. First, the larger the sample, the more expensive it is to collect. Second, the larger the sample, the larger the measurement problem. Measurement error is a much larger problem than is usually recognized. The larger the sample, the larger the resources that must be devoted to controlling measurement errors. As sample size increases, the disadvantages of measurement error may outweigh the advantages of reduced sampling error.
A more effective way to reduce sampling error may be to modify the sampling method. There are several sampling methods, of which five will be discussed.
SAMPLING METHODS
In simple random sampling each case in the sample frame is numbered and then numbers are selected randomly until the desired number of cases have been selected. This is how Sample 1 in Table 6-1 was selected.6
In systematic sampling, the cases in the sample frame are numbered, the first case is randomly selected and every following nth case is selected. Sample 2 in our example was selected
6 Simple random sampling can be with or without replacement. If the sampling is with replacement, then after each case is selected for the sample from the population, it is replaced in the population. Therefore, a given case can be selected twice for the sample. In simple random sampling without replacement once a case is selected for the sample from the population, it is not replaced in the population. Therefore, each case c?n be selected only once for the sample. Unless the ratio of sample size to population size is large, these two types have almost identical variances. But if the ratio of sample size to population size is large, then sampling without replacement will result in less variance.
56
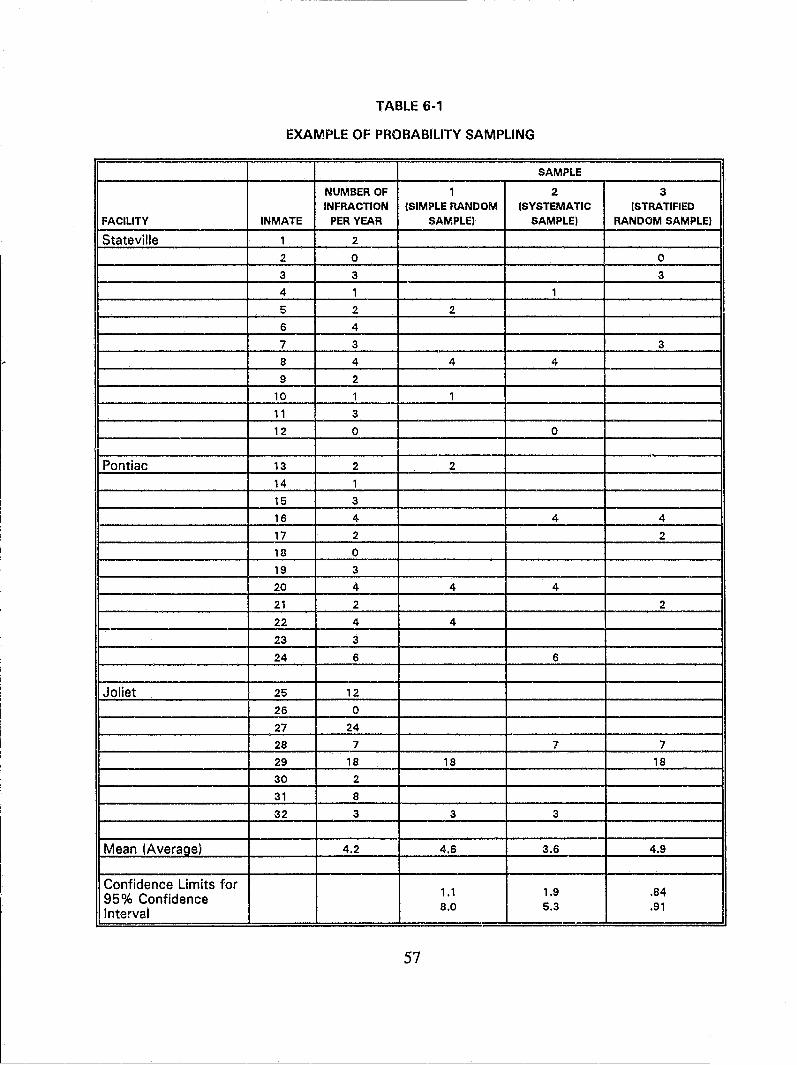
---------------------------------------------------------------------
TABLE 6-1
EXAMPLE OF PROBABILITY SAMPLING
SAMPLE
NUMBER OF 1 2 3 INFRACTION (SIMPLE RANDOM (SYSTEMATIC (STRATIFIED
FACILITY INMATE PER YEAR SAMPLE) SAMPLE) RANDOM SAMPLE)
Stateville 1 2
2 0 0 3 3 3
4 1 1 5 2 2 6 4
7 3 3 8 4 4 4 9 2
10 1 1
11 3
12 0 0
Pontiac 13 2 2
14 1 15 3
16 4 4 4 17 2 2 18 0
19 3
20 4 4 4 21 2 2
22 4 4
23 3
24 6 6
Joliet 25 12
26 0
27 24 28 7 7 7 29 18 18 18 30 2
31 8
32 3 3 3
Mean (Average) 4.2 4.6 3.6 4.9
Confidence limits for , .1 1.9 .84 95% Confidence Interval 8.0 5.3 .91
57
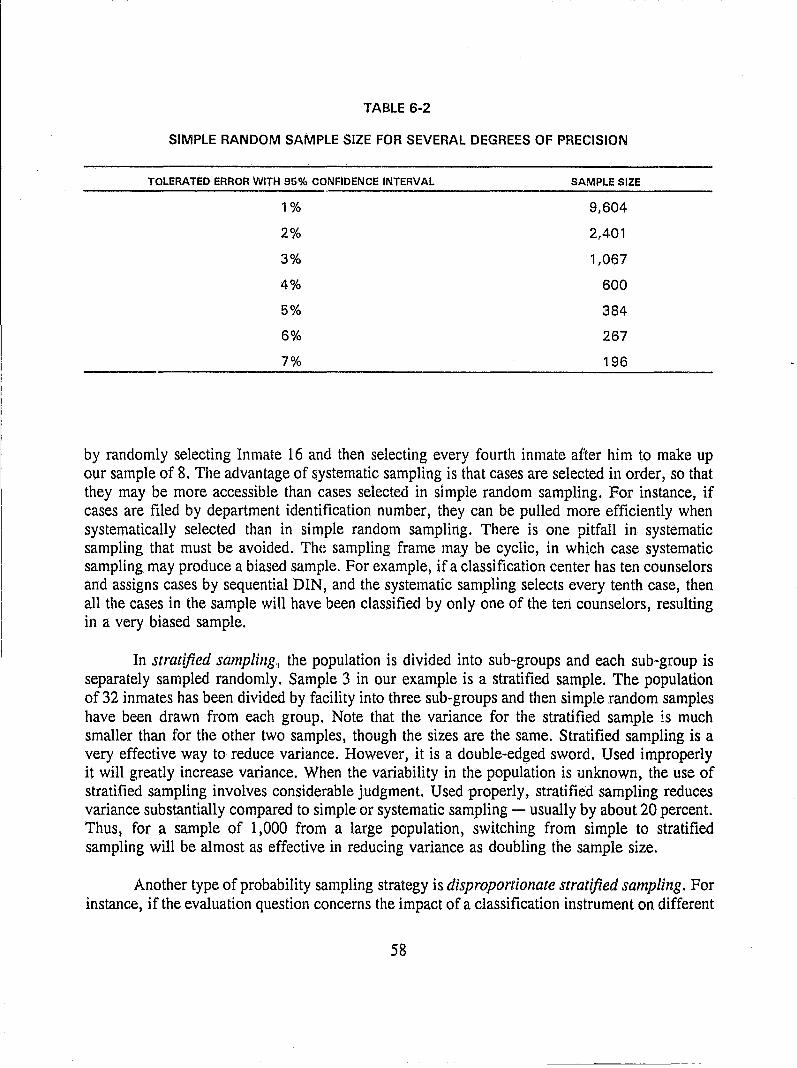
TABLE 6-2
SIMPLE RANDOM SAMPLE SIZE FOR SEVERAL DEGREES OF PRECISION
TOLERATED ERROR WITH 95% CONFIDENCE INTERVAL
1%
2%
3%
4%
5%
6%
7%
SAMPLE SIZE
9,604
2,401
1,067
600
384
267
196
by randomly selecting Inmate 16 and then selecting every fourth inmate after him to make up our sample of 8. The advantage of systematic sampling is that cases are selected in order, so that they may be more accessible than cases selected in simple random sampling. For instance, if cases are filed by department identi'fication number, they can be pulled more efficiently when systematically selected than in simple random sampling. There is one pitfall in systematic sampling that must be avoided. The sampling frame may be cyclic, in which case systematic sampling may produce a biased sample. For example, if a classification center has ten counselors and assigns cases by sequential DIN, and the systematic sampling selects every tenth case, then all the cases in the sample will have been classified by only one of the ten counselors, resulting in a very biased sample.
In stratified sampling" the population is divided into sub-groups and each sub-group is separately sampled randomly. Sample 3 in our example is a stratified sample. The population of 32 inmates has been divided by facility into three sub-groups and then simple random samples have been drawn from each group. Note that the variance for the stratified sample is much smaller than for the other two samples, though the sizes are the same. Stratified sampling is a very effective way to reduce variance. However, it is a double-edged sword. Used improperly it will greatly increase variance. When the variability in the population is unknown, the use of stratified sampling involves considerable judgment. Used properly, stratified sampling reduces variance substantially compared to simple or systematic sampling - usually by about 20 percent. Thus, for a sample of 1,000 from a large population, switching from simple to stratified sampling will be almost as effective in reducing variance as doubling the sample size.
Another type of probability sampling strategy is disproportionate stratified sampling. For instance, if the evaluation question concerns the impact of a classification instrument on different
58
levels of security classification and the number in maximum security is very small, then selecting a proportionate stratified sample will yield such a small number of maximum security cases, that little can be learned from them. A disproportionate stratified sample may be used to increase the number of maximum cases.
Another way to reduce variance is to change the statistic used. For example, the median average has a lower variance than the mean average when the population includes some extreme cases (as in the population in Tahle 6-1, which has two cases with much higher numbers of infractions than the rest of the population). The median average is the mid-point in a set of numbers ranked from highest to lowest. Thus, in the Table 6-1 popUlation, the mean average is 4.2 while the median average is 3. Other measures (not discussed here) may also reduce variance.
Not all probability sampling techniques are designed to reduce sampling error. All the techniques discussed so far assume the presence of a sample frame. Multi-stage cluster sampling is a technique that is particularly useful when a sample frame is impractical or impossible to establish.
For example, if one wanted to study public attitudes towards violent crime (in order to estimate the demand for strict restraint of inmates with violent criminal histories), a sample frame of the public would be difficult or impossible to create. Multi-stage sampling would be an appropriate sampling strategy. However, multi-stage sampling has the disadvantage of increasing variance.
The alternative to probability sampling is non-probability sampling, also caned jUdgmental or purposive sampling. In probability sampling the aim is to select a representative sample of the population by selecting units randomly. In non-probability sampling the aim is to select units purposively, not randomly.
The disadvantage of non-probability sampling is that there is no way of calculating sampling error and therefore no way of knowing quantitatively how well the knowledge gained from the sample applies to the population. On the other hand, non-probability sampling has many potential advantages. There are evaluation designs in which probability sampling serves little purpose. If the design requires detailed investigation of a few cases, only a very small sample can be selected, and with few exceptions, very small probability samples yield such high estimates of sampling error that there is nothing gained by random selection. More importantly, the aim may be to select a sample that represents particular aspects of the population. The aim may be to select extreme cases; if an intervention works well with the worst cases or does not even work with the best cases, one may need go no further. Or the aim may be the opposite, to exclude extreme cases and select typical cases. If one understands in detail how the intervention works in typical cases, then one would be in a position to track its working in extreme cases. Or the aim might be to select a sample of cases that exhibit maximum diversity. We can study the characteristics of the intervention that are common to all settings and the variation in different settings. Another aim would be to select critical cases. For instance, one
59
might pilot test an intervention in what is generally agreed to be the most complex prison in the system and then evaluate the pilot test. Table 6-3 displays the different types of non-probability samples and their uses.
It is commonly supposed that a probability sample is scientific and objective, and a non-probability sample is unscientific and judgmental. Once we have some appreciation of sampling principles we see this distinction is oversimplified. Probability sampling involves judgment and non-probability sampling can and must be based on rigorous and defensible standards. In both types of samples, relating the population to the universe is usually a matter of judgment. In probability sampling designing the sample frame requires a significant amount of judgment. Furthermore, as shown in stratified sampling, the heterogeneity and homogeneity within strata has a large and unknown effect on sampling error. There are numerous other technical issues (not discussed here) in probability sampling strategy that require judgment.
EXAMPLE OF SAMPLING METHODS
The following is an example of sampling from the classification evaluation done fOir the Special Master in the court case of Ruiz vs. Lynaugh concerning the Texas Department of Corrections (Austin, undated).
The purpose of the evaluation was to determine whether the Texas system adequately identified vulnelable and assaultive inmates who required safekeeping (enhanced supervision in sleeping and recreational locations) or single cells. Thus, the universe consisted of all the inmates in the Texas Department of Corrections at the time of the evaluation. The population was defined as follows: first, seven of the 27 prisons were selected. These seven prisons had the highest levels of disruption and inmate assaults, the largest proportion of safekeeping inmates and the greatest number of inmate complaints to the Special Master about safety. The seven prisons were selected purposively, not randomly. Is selection therefore less scientific or objective than if they had been selected randomly? Not at all. The aim was to determine whether vulnerable and assaultive inmates are properly classified and placed. If inmates are properly placed in the most difficult prisons, it is reasonable to suppose the same is true in prisons that are less problematic. If inmates are not properl:r~ placed in the most difficult prisons, then the most important problem to work on has been identified. In addition, the population was restricted to inmates who were in general population and had been in the prison at least six months at the time of the study. These restrictions focused the study on the question: Are there inmates in general confinement who should be housed specially? It sets aside the question: Are there inmates housed specially who need not be? The strategy also focused on inmates who had been in a prison long enough to answer questions about prison conditions knowledgeably. Thereby it eliminated the inmates who had so much trouble they did not last six months in the prison.
The sample was designed as follows. The population was stratified by prison and type of confinement. At least 133 inmates were selected from each prison, and of these at least 100 were general confinement inmates and up to 50 safekeeping inmates were selected (some prisons
60
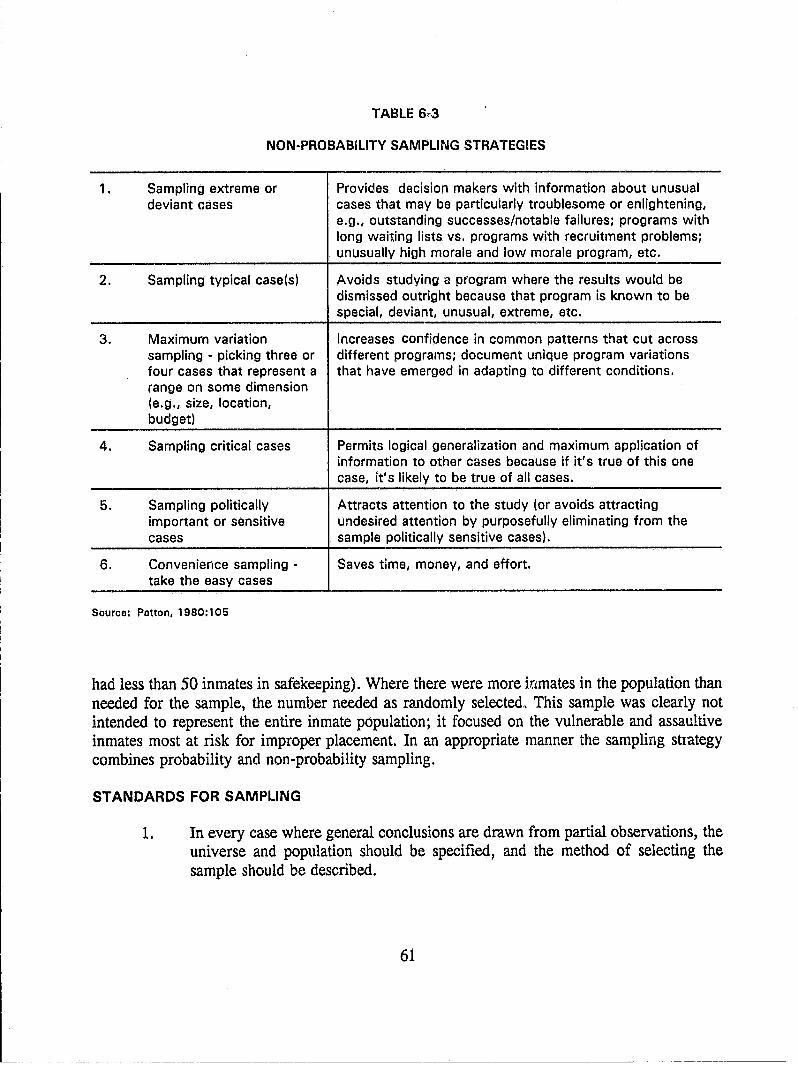
1.
2.
3.
4.
5.
6.
TABLE 6,,3
NON-PROBABiLITY SAMPLING STRATEGIES
Sampling extreme or deviant cases
Sampling typical case(s)
Maximum variation sampling - picking three or four cases that represent a range on some dimension (e.g., size, location, budget)
Sampling critical cases
Sampling politically important or sensitive cases
Convenience sampling -take the easy cases
Provides decision makers with information about unusual cases t.hat may be particularly troublesome or enlightening, e.g., outstanding successes/notable failures; programs with long waiting lists vs. programs with recruitment problems; unusually high morale and low morale program, etc.
Avoids studying a program where the results would be dismissed outright because that program is known to be special, deviant, unusual, extreme, etc.
Increases confidence in common patterns that cut across different programs; document unique program variations that have emerged in adapting to different conditions.
Permits logical generalization and maximum application of information to other cases because if it's true of this one case, it's likely to be true of all cases.
Attracts attention to the study (or avoids attracting undesired attention by purposefully eliminating from the sample politically sensitive cases).
Saves time, money, and effort.
Source: Patton, 1980: 1 05
had less than 50 inmates in safekeeping). Where there were more ir.1mates in the population than needed for the sample, the number needed as randomly selected" This sample was clearly not intended to represent the entire inmate popUlation; it focused on the vulnerable and assaultive inmates most at risk for improper placement. In an appropriate manner the sampling stlategy combines probability and non-probability sampling.
STANDARDS FOR SAMPLING
1. In every case where general conclusions are drawn from partial observations, the universe and population should be specified, and the method of selecting the sample should be described.
61
2. If probability samples are used evaluations should also report sample selection bias, sampling frame, and the confidence limit and tolerated error.
3. The rationale for the sample strategy must include the limitations on generalizatio~s from the sample to the population and the universe.
62
-----------------------------------------------------------
CHAPTER SEVEN
DATA COLLECTION
INTRODUCTION
Data collection is usually the most time-consuming and the least glamorous stage of evaluation. If in the final report a comma is omitted or a statistic misused, everyone will notice it, but if data is fudged it is unlikely that anyone will notice. Yet no amount of brilliant analysis will make up for faulty data collection. Thus, the quality of an evaluation rests on the data and the quality of the data rests very much on the conscientiousness of the evaluator.
Assuring data quality presents vexing problems. Two experts in evaluation suggest that, "It is often prudent to allocate as much as 20 percent of one's evaluation research budget to data quality control" (Berk and Rossi, 1990:99).
Certain issues apply to every kind of data collection. But most issues of data collection vary with the evaluation method and measures. With very structured evaluation methods data collection issues are simple, though they may still be time-consuming. The less structured the method, the more complex the issues that must be faced in the data collection phase. This is because the less structured the evaluation method, the greater the role of the human evaluators in collecting data. There is a tendency to think of human investigators, because of their subjectivity, as inferior versions of an objective data collection instrument. Thus texts discuss "interviewer effects" and how to reduce or eliminate them. But because this is the study of humans, not atoms, human investigators can collect valuable data that is inaccessible to objective data collection instruments. The goal must be not to reduce investigator human effects, but to make them useful.
Next issues that affect every kind of data collection will be dealt with followed by issues arising with highly, moderately and loosely structured methods and measures.
GENERAL DATA COLLECTION ISSUES
The original data must be maintained and accessible to others in a form that will not violate confidentiality, because 1) that is the only way to demonstrate the integrity of the evaluation (all the other stages of the evaluation are documented in the report), and 2) the data may prove valuable later for reanalysis and longitudinal studies.
Data collection procedures should always be pilot tested, because no matter how self-evidently correct they seem, there are usually unforeseen problems when they are put to use.
Data must be assessed to assure that it has been collected in accordance with the operational definitions of the measures. For instance, automated data that has already been
63
collected may appear far more accurate than it really is. The fact that a data element such as inmate's age is filled in for every inmate does not mean that it has been filled in according to the measure of age. Many inmates records show more than one date of birth. Have the rules of the measure been followed in entering this data element? Whether or not the evaluator has actually collected the data, slhe is responsible for assessing its agreement with the measurement rules.
Finally, any time an evaluator has others collecting data, slhe is responsible for training and supervising them. Data collection is usually tedious or difficult enough that staff will be tempted to take short-cuts.
DATA COLLECTiON FOR HIGHLY STRUCTURED METHODS AND MEASURES
Here we refer to methods such as multiple-choice questionnaires and measures such as number of felony convictions. The data collected must be reviewed for missing values and inconsistent or implausible values.
Missing values can be filled in sometimes by exammmg related variables or by estimating. For instance, if the number of felony convictions is missing and the number of felony arrests equals "0," then "0" can be entered for the number of felony convictions.
There are many ways to check for inconsistent data. For example, a case may show more felony convictions than arrests, or a sentence may be inconsistent with the commitment offense.
Implausible data are data that do not make sense. For instance, if half the inmates in the sample have college degrees, either the society and the criminal justice system have changed suddenly and radically or something is wrong with the data collection. There are so many ways data can be collected incorrectly that it is reasonable to question data that does not make sense. At the same time, data that does not fit our expectations may be correct and our expectations may be incorrect.
Finally, all constructed variables must be checked. For instance, if there are automated data giving each disciplinary charge, date and disposition, and from this data we construct a single variable for frequency and severity of infractions over a six-month period, we must inspect several cases to make sure the new constructed variable is correct. It is very easy to make programming errors in constructing variables.
DATA COLLECTION FOR MODERATELY STRUCTURED METHODS AND MEASURES
Here we refer to methods such as the open-ended interview. Some of the problems of reliability, validity, sensitivity and comparability that in the highly structured methods have been addressed in the design, methods and measures stages are here left to be addressed in the data collection stage.
64
When using the open-ended interview, the topics to be covered, the sequence in which they will be covered, exactly how they will be asked, the setting of the interview, the type(s) of interviewer(s) and the subjects to be interviewed have been determined before the data collection stage. That, however, leaves much room for the interaction between the interviewer and the subject. The interviewer must have the discipline and skill to facilitate the subjects's ability and willingness to provide valid and reliable data, and to control interviewer bias and error.
Facilitating Reliable and Valid Data from the Subject
Chapter Five covered factors that inhibit subjects from giving reliable and valid data; below are examples of how a skilled interviewer can reduce these inhibitors.
• Memory. A subject may simply have forgotten the information requested. Sometimes an interviewer can lead the subject back from recent, remembered events back to older, poorly remembered events.
• Self-esteem. A topic may threaten a subject's self-esteem and make him reluctant to discuss it. Sometimes an interviewer can convey her total respect for the subject's willingness to provide valid information regardless of whether or not it makes the subject look good.
• Retrospective deduction. Sometimes in looking back over the history of an intervention, a subject will remember the origins in light of their final outcome. If the intervention was a failure, the subject is likely to remember what now appear as early omens of failure; and if the intervention was a success he is likely to remember tt~e early omens of success. The interviewer may be able to reduce retrospective deduction by taking the subject very specifically through the intervention beginning at its origins (Gorden, 1975).
Interviewer Bias and Error
The following types of interviewer behavior threaten data qUality:
• Interviewer variability. The interviewer may have a hard time recording accurately what the subject tells him/her. Since the interviewer is certainly not going to note everything the subject says, slhe may be unreliable in what s/he selects to note.
• Interviewer bias. The interviewer consistently focuses on some data and ignores oiher data.
65
L---_____________________________________________ _
• Interviewer carelessness and dishonesty. The interviewer may fail to take adequate notes during the interview and then reconstnlct the interview later, or may invent the interview entirely (Simon, 1978).
These problems must be addressed through training and supervision.
DATA COLLECTION FOR LOOSELY STRUCTURED METHODS AND MEASURES
In this section, methods such as participant-observation and case studies are referred to. Participant-observation leaves most of the issues usually dealt with in the design, methods, measures and sampling stages to the data collection stage. However, full-scale participant-observation is unlikely to be an appropriate field research method for the evaluation of objective risk classification instruments, because it is so time-consuming. More appropriate and more practical is field research that includes observation and informal interviews. Of course observational field research can be very structured and leave few data collection issues to be addressed. For instance, a process evaluation of the procedures for applying an instrument might involve observing whether a specific set of procedures is followed for a sample of cases. But where observations and interviews are loosely structured, much is left for the evaluator to solve in the data collection stage.
Are there any principles and skills the evaluator uses that distinguish him/her from an ordinary observer? There are four essential differences. First, the professional evaluator knows the literature on the subject well. S/he is familiar with the findings and the issues of previous studies, so that s/he has an educated eye and ear. Second, s/he is a trained observer, who can distinguish the relevant from the irrelevant data. Third, s/he is a trained interviewer who knows the obstacles to getting reliable and valid information from informant& and how to reduce those obstacles. Fourth, the evaluator enters the field situation with specific questions. The evaluator collects relevant information and revises questions as required by the data, collects more data and continues this process until the question, the data and the answer all fit together.
Only one evaluation of risk classification instruments was found that included the use of a loosely structured observation field research method, and that is Austin's study of the Texas classification system (Austin, undated). He observed two classification hearings at each of the seven prisons he studied. His purpose was to identify the criteria used by committee members to make custody and housing decisions.
STANDARDS FOR DATA COLLECTION
1. Data collection instruments and raw data collected for an evaluation should be maintained permanently and should be accessible to other professionals within the limits of confidentiality.
2. Data collection procedures should be pilot tested.
66
3. Data should be cleaned: missing, inconsistent and implausible data should be reviewed and rectified wherever appropriate and possible. Either the consequences of missing data for the validity of the evaluation must be discussed or estimated data should be used with a rationale provided for the estimations.
4. Data should be assessed to assure that it has been collected in accordance with the operational definitions of the measures.
5. When using loosely structured research methods, the evaluation should report precisely what data was collected and how the issues of reliability and validity were addressed.
6. Data used to evaluate prison classification systems should consist of multiple measures using both qualitative and quantitative data .
. ,
67
CHAPTER EIGHT
STATISTICAL METHODS
INTRODUCTION
The final and perhaps most complicated phase of an evaluation involves the use of statistics. Statistics help organize data in a manner that allows evaluators to reach conclusions regarding the impact of the classification system. Thanks to rapid technological advances in computers during the past two decades, evaluators now have a wide array of statistical software programs. These allow evaluators to compute an ever greater number of statistical tests of hypothetical relationships among large numbers of variables that reside on computerized data files. Unfortunately, these technological advances have not always produced better evaluations. Evaluators often make incorrect decisions on which statistics should be applied to which types of data, leading to incorrect analysis and conclusions. Statistics, including applied statistics, is a complicated and highly advanced specialized sub-field of mathematics. Unless staff have specialized training in applied statistics, it is highly recommended that an advisor with such training be retained to assist in the selection and interpretation of statistical tests.
This is not to say that evaluators without such a specialized background cannot proceed with preliminary statistical analysis of the data. Most social scientists with advanced degrees have received sufficient training in statistical techniques to conduct their own analysis. However, when one begins to utilize a growing number of multivariate regression statistical techniques that often demand a number of assumptions regarding the data being analyzed, it may be best to seek the assistance of persons specialized in such methods.
The purpose of this chapter is not to teach statistics; its objectives are more modest. It is intended to acquaint the reader with the most frequently used and simple forms of statistical analysis - frequencies, measures of central tendencies, cross-tabulations, and correlations. If the reader understands these basic statistics, he or she will have an understanding of the foundations of statistics and when to apply them. Later sections will cover three forms of multivariate analysis: multiple regression, analysis of variance, and logistic analysis. For each statistic reviewed, an example of its application to a classification evaluation will be presented.
CHOOSING THE APPROPRIATE STATISTICS
In order to choose the appropriate statistics, one must first conduct a preliminary analysis of the data. This preliminary analysis can be separated into three distinct phases.
First, the evaluator must identify for each variable its level of measurement. This task req\lires one to identify whether a variable represents a nominal, ordinal, interval, or ratio unit of measurement. These levels have been discussed in Chapter Five. Operational definitions are found in the glossary of statistical terms.
68
-----~-~ -------
Second, the evaluator must categorize each variable as either an independent or dependent variable. The principle purpose of statistical analysis is to discover relationships between variables that are meaningful to the evaluation. For example, is there a relationship between age and rates of misconduct? Here one is hypothesizing such a relationship based on observations (younger inmates tend to be receiving more disciplinary reports than older ones) or a particular theory (as inmates age they tend to mature and become less involved in rule infractions). In this simple example there are two variables (age and number of disciplinary tickets) that may be related statistically. Age is the independent variable (denoted as XJ and numbers of disciplinary tickets is the dependent variable (denoted as Y J. The analysis will seek to determine whether or not X is related to Y, in this case whether older inmates have fewer tickets than younger inmates. The relationship is stated in the following formula:
The formula states that, as the values of Xa change, one expects the values of Yt to change. Number of tickets is called the dependent variable because its value is dependent upon the value of X.
The third task is to summarize with descriptive statistics the overall properties and characteristics of the data. Decisions on which statistic is appropriate for analysis depend upon the statistical properties of each variable. By statistical properties one usually means measures of variance and central tendencies.
For a variable to be useful, it must vary in its values from subject to subject. For example, if all the inmates in our sample were age 25, there would be no variance and no possibility of age predicting inmate misconduct. Thus, it is important to measure the level of variance for our variables.
For this task, the most important measure of variance is the standard deviation. The measures of central tendency are the mean, median and mode. These measures help the researcher understand the extent of variance and the so-called normal distribution or lack thereof for each variable. These measures are important as they will help an evaluator determine whether or not a more sophisticated statistical method should be used.
Measures of variance and central tendency, along with percentages, should be included in a table that describes the data, so that readers can understand the evaluator's choice of various statistics.
All tables should include the number of missing cases for each variable. Knowing the number of missing cases is important for two reasons. First, the quality of the data collection effort must be questioned if a significant number of variables used for analysis have 'missing data. Since most of this information was drawn from inmate files or the department's data system, the extent of missing data directly reflects on the quality of the organization's information system.
69
Second, the absence of complete data is grounds for deleting that variable from further analysis and, more importantly, from the classification system as a scoring item. For example, what if an inmate's education level is used to score custody level, but education level information is available for only 50 percent of the inmates? This would mean that half of the inmates are not being properly scored due to missing data. In such situations, variables with missing data should be deleted from both the study and the classification scoring system.
Statistical versus Substantive Tests of Significance
Before proceeding with a review of the primary statistical methods, a brief discussion of the concept of statistical significance is required. The primary objective of statistical analysis is to identify empirical relationships that relate to the original questions. Statistics help the evaluator determine 1) whether a relationship between two variable exists, 2) whether other variables are also involved in the observed relationship between two variables, and 3) the relative "strength" of the observed relationship.
In assessing the existence of a relationship, statisticians have developed standards that are commonly referred to as confidence levels. Typically that standard is set at the .05 level of confidence, which simply means that the relationship is highly unlikely to have occurred by chance or random error. Should the evaluator repeat the study 100 times, one would observe the same relationship 95 times. If the statistic reports a relationship at the .005 level of confidence, then the evaluator would be confident that the same relationship would appear 995 times out of 1 , 000 studies and so on.
This standard of significance also relates to the acceptance or rejection of the null hypothesis. The null hypothesis assumes there is no relationship between the independent and dependent variables. At the .05 level, the~valuator is saying that 95 times out of 100 one would be right in rejecting the null hypothesis, and that is good enough to accept that there is a relationship between the independent and dependent variables.
It is very important for both evaluators and practitioners to realize that there is absolutely nothing objective about setting the standard of statistical significance for rejecting the null hypothesis at .05. The .05 level reflects a subjective judgment about the tradeoff between rejecting a hypothesis that is true and accepting a hypothesis that is false. Academic researchers would far prefer to reject a true hypothesis than accept a false one. However, practitioners may have other values. If an evaluation sought to determine whether there is a relationship between classification decisions and race, should the confidence level be set higher, perhaps at .10 or .15? The answer depends on subjective judgment (Berk, 1988).
Statistical significance is different from meaningful or substantive significance. For example, one might find that 15 percent of inmates between the ages of 18 and 24 receive at least one major disciplinary report during the first six months of imprisonment compared to 20 percent of inmates over the age of 24. If the sample size is sufficiently large, this difference in i.nfraction rates will be statistically significant. But does the finding mean that age as categorized
70
here is a strong predictor of misconduct, thus warranting the separation of inmates by age? Obviously not. Nor would such a finding justify a classification policy of separating inmates primarily by these two age categories. (Indeed, one could argue that such a policy would have the unintended consequence of actually increasing aggregate levels of violence as institutions would be grouped by age. The facilities filled exclusively with younger inmates might become unmanageable, since the tempering influence of older inmates will have been removed.)
Evaluators must look beyond tests of statistical significance to properly interpret statistical results and appreciate the limits of their statistical findings.
Commonly Used Tests of Association and Correlation
The two most common statistical methods used to identify simple bivariate (two variable) relationships are cross-tabulations and correlations.
Cross-tabulations are typically used for variables that are nominal or ordinal level measures, although interval and ratio level measures can be used if a limited number of categories are created to group the data. For example, age can be grouped into categories of 18-21, 22-24, 25-30, and 31 and above. A frequent alternative for interval and ratio level variables is the Student's t-test.
Cross-tabulations allow the evaluator to determine differences between groups of persons for the variables in question. They are frequently used to determine differences among sample populations, experimental and control group outcome measures, and simple tests of associations between independent and dependent variables.
In classification evaluations, especially process evaluations, cross-tabulations can be extremely useful in pinpointing the degree and reasons for compliance with classitication policies. Tables 8-1 and 8-2 illustrate how crosstabs were applied in a recent evaluation of the Florida classification' system (Austin, 1990). Here the two variables being examined were classification score and classification assignment, with the latter representing the inmate's final classification determination taking into account overrides. Inmates whose classification assignment is consistent with the score (i.e., no override used) are located within the marked diagonals of the table. Those cases outside the diagonals are overridden cases which can be further analyzed to determine the precise reasons for the departures. In this example, the vast majority of overrides are upward, resulting in higher classification levels and suggesting a need to re-examine classification criteria.
Another example of a cross-tabulation is shown in Table 8-3. This table reports the results of the experimental study of the Washington PMC evaluation referred to earlier in which inmates were randomly assigned to either an experimental prison classification system or classified and housed according to traditional practices. The table shows that the experimental cases performed better on two outcome measures (percentage of and mean number) of major disciplinary tickets. Also note that a level of significance is reported indicating the differences
71
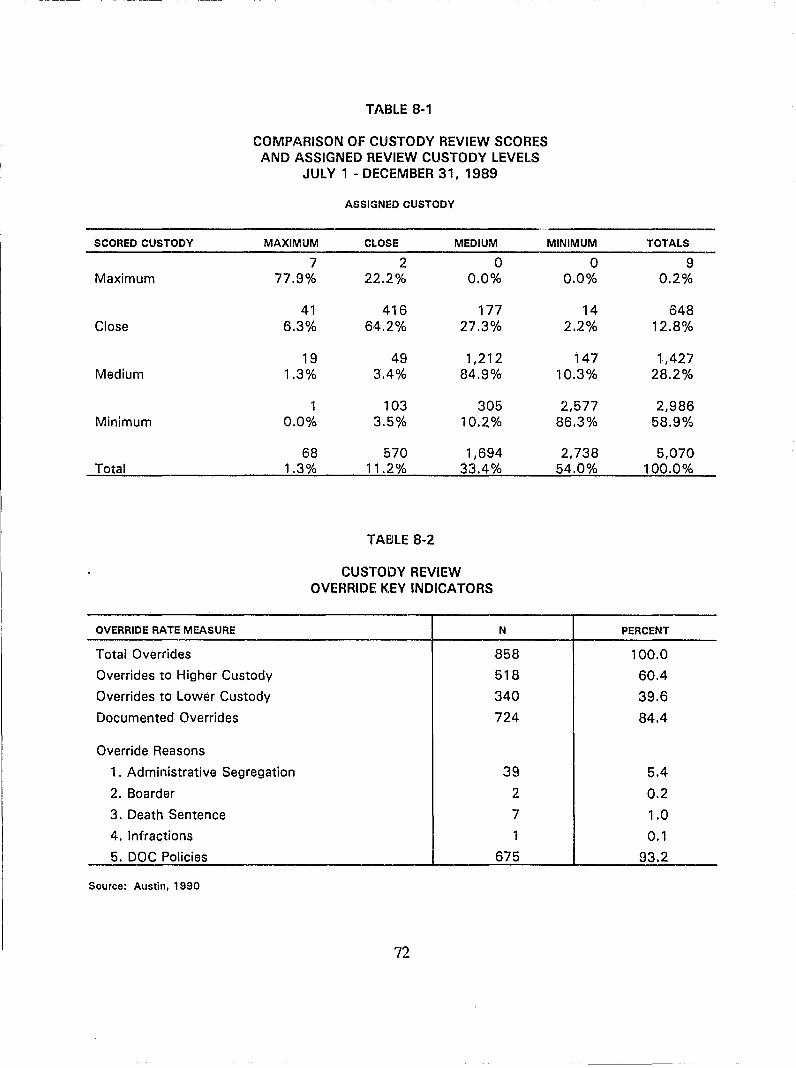
TABLE 8-'
COMPARISON OF CUSTODY REVIEW SCORES AND ASSIGNED REVIEW CUSTODY LEVELS
JULY 1 - DECEMBER 31, 1989
ASSIGNED CUSTODY
SCORED CUSTODY MAXIMUM CLOSE MEDIUM
Maximum
Close
Medium
Minimum
Total
OVERRIDE RATE MEASURE
Total Overrides
Overrides to Higher Custody
Overrides to Lower Custody
Documented Overrides
Override Reasons
7 2 0 77.9% 22.2% 0.0%
41 416 177 6.3% 64.2% 27.3%
19 49 1,212 1.3% 3.4% 84.9%
103 305 0.0% 3.5% 10.2%
68 570 1,694 1.3% 11.2% 33.4%
TAEILE 8-2
CUSTOIDY REVIEW OVERRIDE K.EY INDICATORS
N
858
518
340
724
1 . Administrative Segregation 39
2. Boarder 2
3. Death Sentence 7
4. Infractions 1
5. DOC Policies 675
Source: Austin. 1990
72
MINIMUM
0 0.0%
14 2.2%
147 10.3%
2,577 86.3%
2,738 54.0%
TOTALS
9 0.2%
648 12.8%
1,427 28.2%
2,986 58.9%
5,070 100.0%
PERCENT
100.0
60.4
39.6
84.4
5.4
0.2
1.0
0.1
93.2
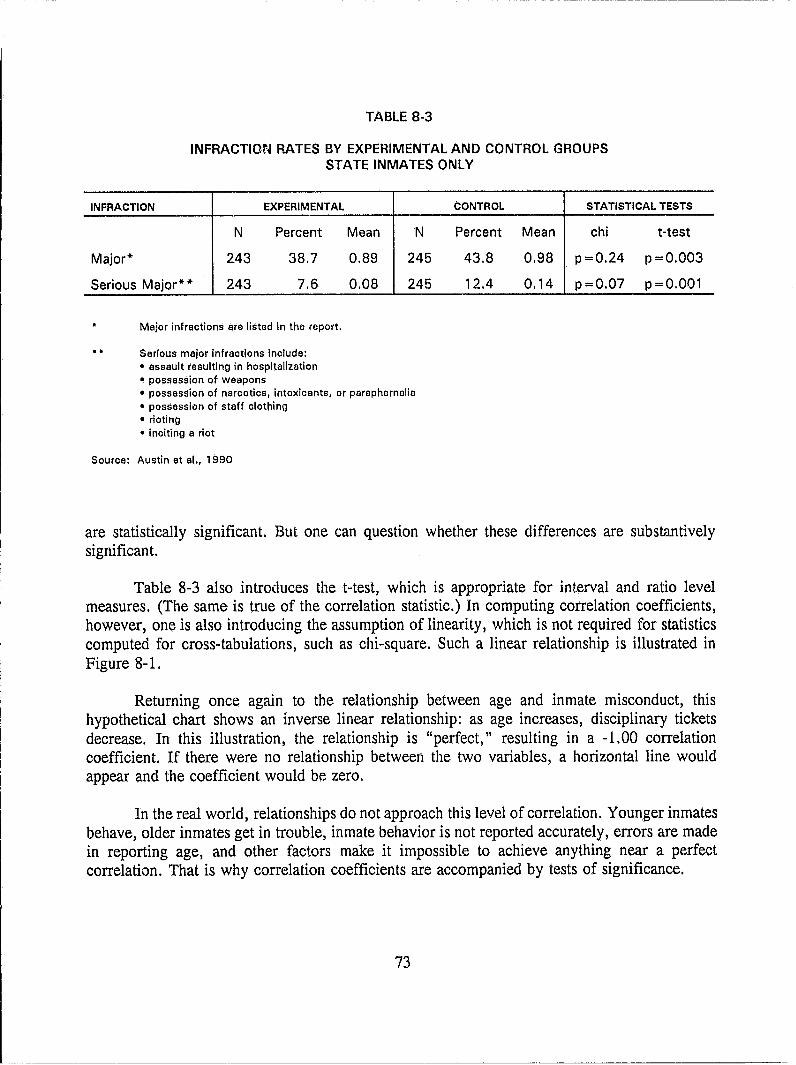
TABLE 8-3
INFRACTION RATES BY EXPERIMENTAL AND CONTROL GROUPS STATE INMATES ONLY
INFRACTION EXPERIMENTAL CONTROL STATISTICAL TESTS
N Percent Mean N Percent Mean chi t-test
Major* 243 38.7 0.89 245 43.8 0.98 p=0.24 p =0.003
Serious Major* * 243 7.6 0.08 245 12.4 0.14 p=0.07 P =0.001
Major infractions are listed in the report.
•• Serious major infractions include: • assault resulting in hospitalization • possession of weapons • possession of narcotics, intoxicants, or paraphernalia • possession of staff clothing • rioting • inciting a riot
Source: Austin et al., 1990
are statistically significant. But one can question whether these differences are substantively significan t.
Table 8-3 also introduces the t-test, which is appropriate for int.erval and ratio level measures. (The same is true of the correlation statistic.) In computing correlation coefficients, however, one is also introducing the assumption of linearity, which is not required for statistics computed for cross-tabulations, such as chi-square. Such a linear relationship is illustrated in Figure 8-1.
Returning once again to the relationship between age and inmate misconduct, this hypothetical chart shows an inverse linear relationship: as age increases, disciplinary tickets decrease. In this illustration, the relationship is "perfect," resulting in a -1.00 correlation coefficient. If there were no relationship between the two variables, a horizontal line would appear and the coefficient would be zero.
In the real world, relationships do not approach this level of correlation. Younger inmates behave, older inmates get in trouble, inmate behavior is not reported accurately, errors are made in reporting age, and other factors make it impossible to achieve anything near a perfect correlation. That is why correlation coefficients are accompanied by tests of significance.
73
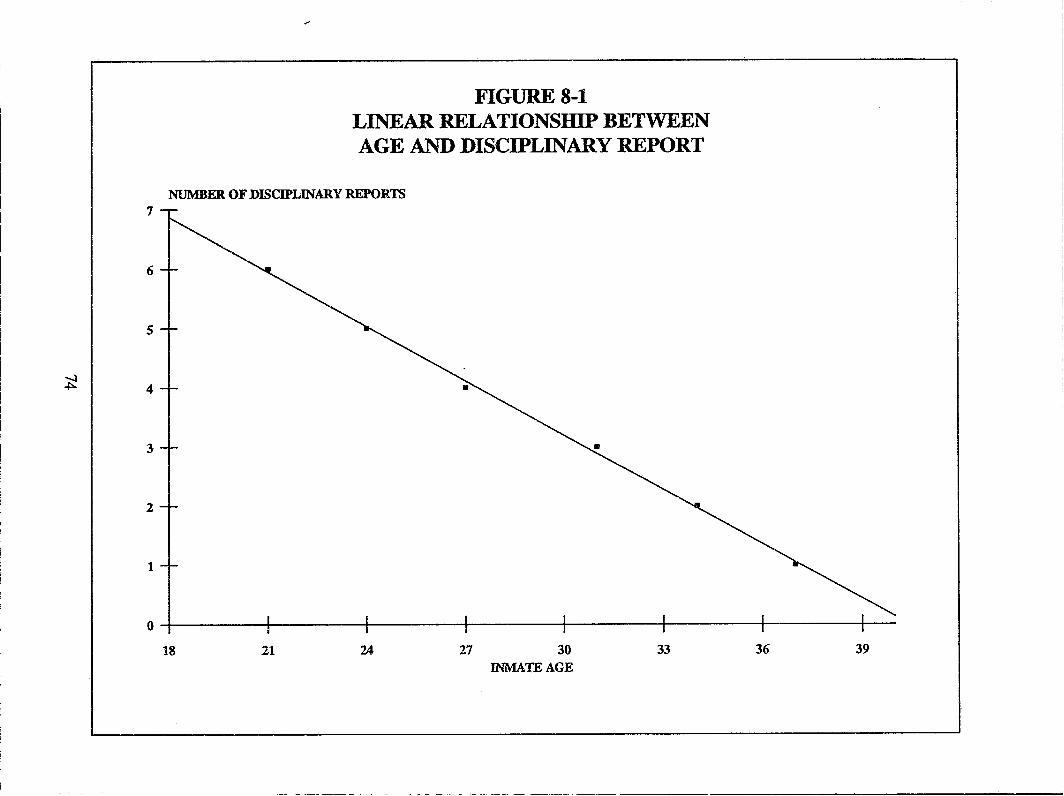
~
7
6
5
4
3
2
1
FIGURE 8-1 LINEAR RELATIONSIllP BETWEEN AGE AND DISCIPLINARY REPORT
NUMBER OF DISCIPLINARY REPORTS
041------~~------~------r_------+_------+_------~------~--
18 21 24 27 30 INMATE AGE
33 36 39
------~- ------ -------------
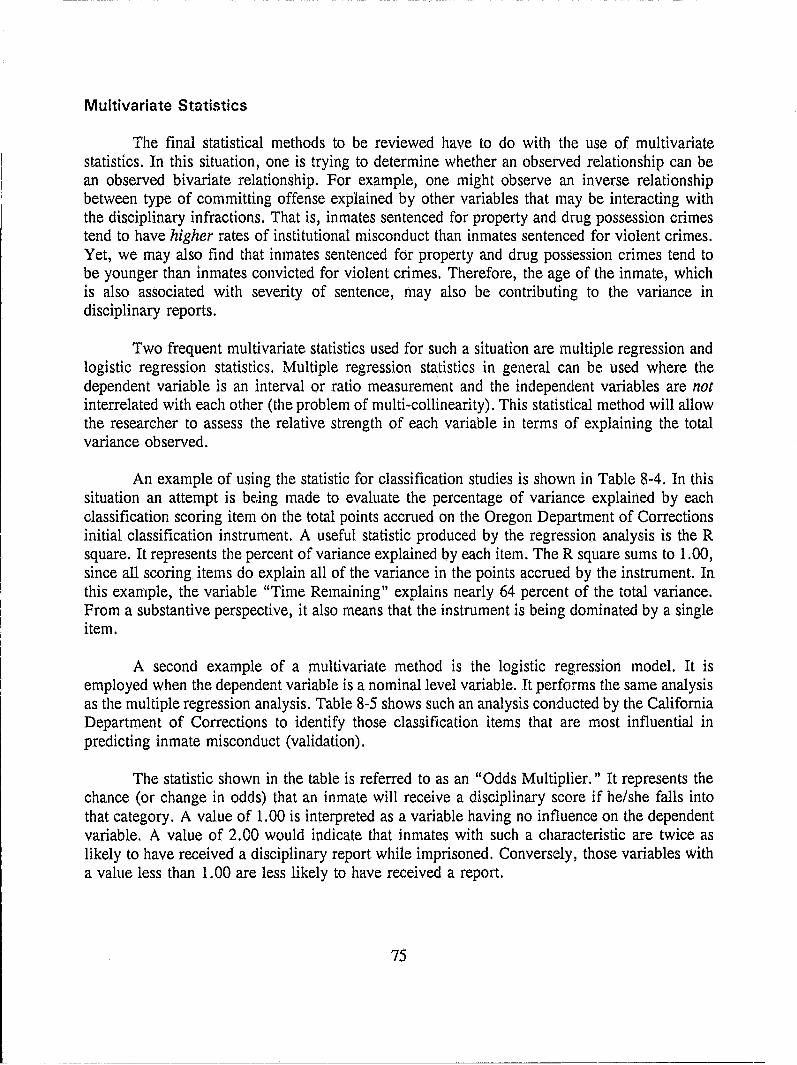
Multivariate Statistics
The final statistical methods to be reviewed have to do with the use of multivariate statistics. In this situation, one is trying to determine whether an observed relationship can be an observed bivariate relationship. For example, one might observe an inverse relationship between type of committing offense explained by other variables that may be interacting with the disciplinary infractions. That is, inmates sentenced for property and drug possession crimes tend to have higher rates of institutional misconduct than inmates sentenced for violent crimes. Yet, we may also find that inmates sentenced for property and drug possession crimes tend to be younger than inmates convicted for violent crimes. Therefore, the age of the inmate, which is also associated with severity of sentence, may also be contributing to the variance in disciplinary reports.
Two frequent multivariate statistics used for such a situation are multiple regression and logistic regression statistics. Multiple regression statistics in general can be used where the dependent variable is an interval or ratio measurement and the independent variables are not interrelated with each other (the problem of multi-collinearity). This statistical method will allow the researcher to assess the relative strength of each variable in terms of explaining the total variance observed.
An example of using the statistic for classification studies is shown in Table 8-4. In this situation an attempt is being made to evaluate the percentage of variance explained by each classification scoring item on the total points accrued on the Oregon Department of Corrections initial classification instrument. A useful statistic produced by the regression analysis is the R square. It represents the percent of variance explained by each item. The R square sums to 1.00, since all scoring items do explain all of the variance in the points accrued by the instrument. In this example, the variable "Time Remaining" explains nearly 64 percent of the total variance. From a substantive perspective, it also means that the instrument is being dominated by a single item.
A second example of a multivariate method is the logistic regression model. It is employed when the dependent variable is a nominal level variable. It performs the same analysis as the multiple regression analysis. Table 8-5 shows such an analysis conducted by the California Department of Corrections to identify those classification items that are most influential in predicting inmate misconduct (validation).
The statistic shown in the table is referred to as an "Odds Multiplier." It represents the chance (or change in odds) that an inmate will receive a disciplinary score if he/she falls into that category. A value of 1.00 is interpreted as a variable having no influence on the dependent variable. A value of 2.00 would indicate that inmates with such a characteristic are twice as likely to have received a disciplinary report while imprisoned. Conversely, those variables with a value less than 1.00 are less likely to have received a report.
75
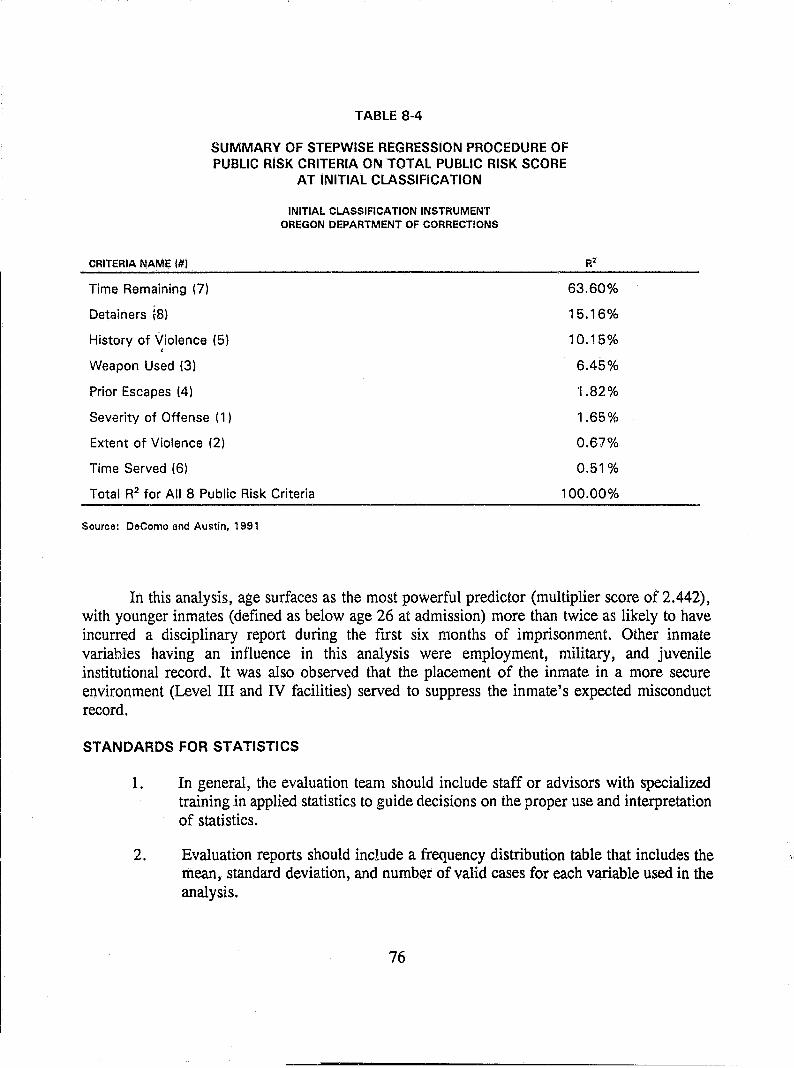
TABLE 8-4
SUMMARY OF STEPWISE REGRESSION PROCEDURE OF PUBLIC RISK CRITERIA ON TOTAL PUBLIC flISK SCORE
AT INITIAL CLASSIFICATION
CRITERIA NAME (#)
Time Remaining (7)
Detainers fa) History of Violence (5) , Weapon Used (3)
Prior Escapes (4)
Severity of Offense (1)
Extent of Violence (2)
Time Served (6)
INITIAL CLASSIFICATION INSTRUMENT OREGON DEPARTMENT OF CORRECTIONS
63.60%
15.16%
10.15%
6.45%
'1.82%
1.65%
0.67%
0.51%
Total R2 for All 8 Public Risk Criteria 100.00%
Source: DeComo and Austin. 1991
In this analysis, age surfaces as the most powerful predictor (multiplier score of 2.442)s with younger inmates (defined as below age 26 at admission) more than twice as likely to have incurreod a disciplinary report during the first six months of imprisonment. Other inmate variables having an influence in this analysis were employment, military, and juvenile institutional record. It was also observed that the placement of the inmate in a more secure environment (Level III and IV facilities) served to suppress the inmate's expected misconduct record.
STANDARDS FOR STATISTICS
1. In general, the evaluation team should include staff or advisors with specialized training in applied statistics to guide decisions on the proper use and interpretation of statistics.
2. Evaluation reports should include a frequency distribution table that includes the mean, standard deviation, and number of valid cases for each variable used in the analysis.
76
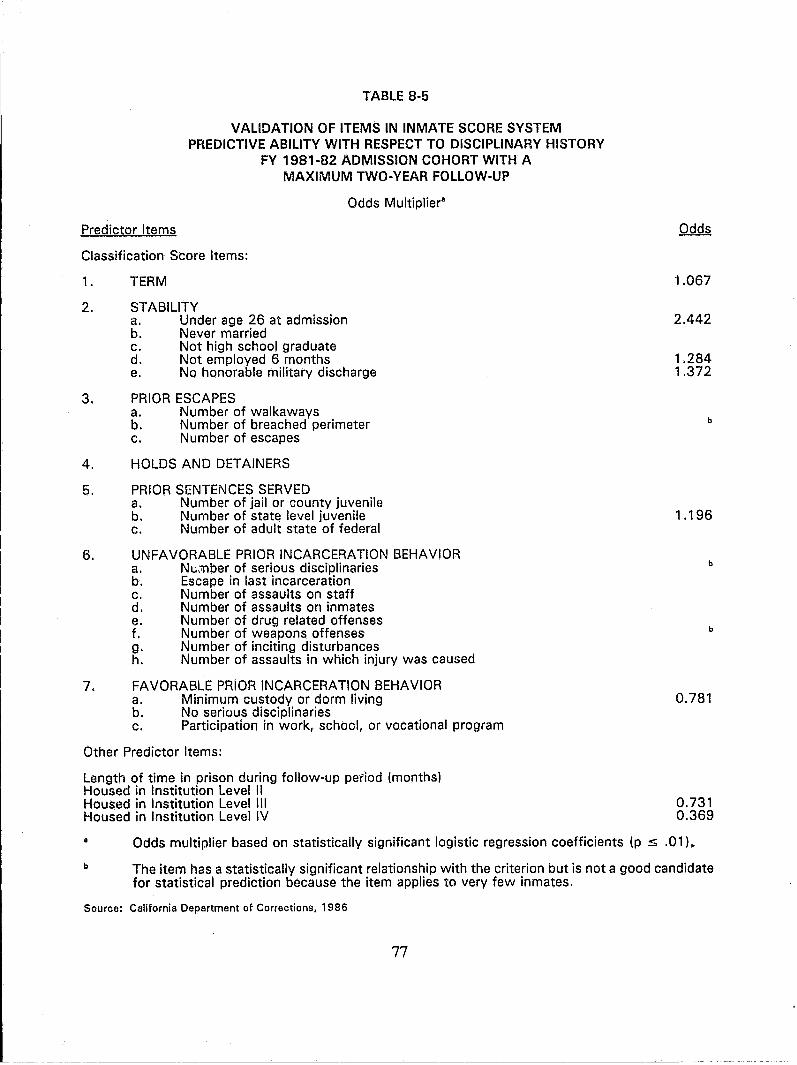
TABLE 8-5
VALIDATION OF ITEMS IN INMATE SCORE SYSTEM PREDICTIVE ABILITY WITH RESPECT TO DISCIPLINARY HISTORY
FY 1981-82 ADMISSION COHORT WITH A MAXIMUM TWO-YEAR FOLLOW-UP
Odds Multiplier"
Predictor Items
Classification Score Items:
1 .
2.
3.
TERM
STABILITY a. Under age 26 at admission b. Never married c. Not high school graduate d. Not employed 6 months e. NQ honorable military discharge
PRIOR ESCAPES a. Number of walkaways b. Number of breached perimeter c. Number of escapes
4. HOLDS AND DETAINERS
5. PRIOR SENTENCES SERVED a. Number of jailor county juvenil(~ b. Number of state level juvenile c. Number of adult state of federal
6. UNFAVORABLE PRIOR INCARCERATION BEHAVIOR a. Nll::nber of serious disciplinaries b. Escape in last incarceration c. Number of assaults on staff d. Number of assaults on inmates e. Number of drug related offenses f. Number of weapons offenses g. Number of inciting disturbances h. Number of assaults in which injury was caused
7. FAVORABLE PRIOR INCARCERATION BEHAVIOR a. Minimum custody or dorm living b. No serious disciplinaries c. Participation in work, school, or vocational program
Other Predictor Items:
Length of time in prison during follow-up period (months) Housed in Institution Level II Housed in Institution Level III Housed in Institution Level IV
1.067
2.442
1.284 1.372
b
1.196
b
b
0.781
0.731 0.369
b
Odds multiplier based on statistically significant logistic regression coefficients (p s .01).
The item has a statistically significant relationship with the criterion but is not a good candidate for statistical prediction because the item applies to very few inmates.
Source: California Department of Corrections, 1986
77
3. Variables with 10 percent or more missing information should be deleted from further statistical analysis. It is also recommended that those variables be excluded as classification scoring criterion.
4. In conducting tests of association on correlation, the researcher must ensure that the statistics being applied are appropriate given the type of data collected for analysis.
5. In presenting one's findings, the researcher should make distinctions between substantive and statistical levels of significance.
78
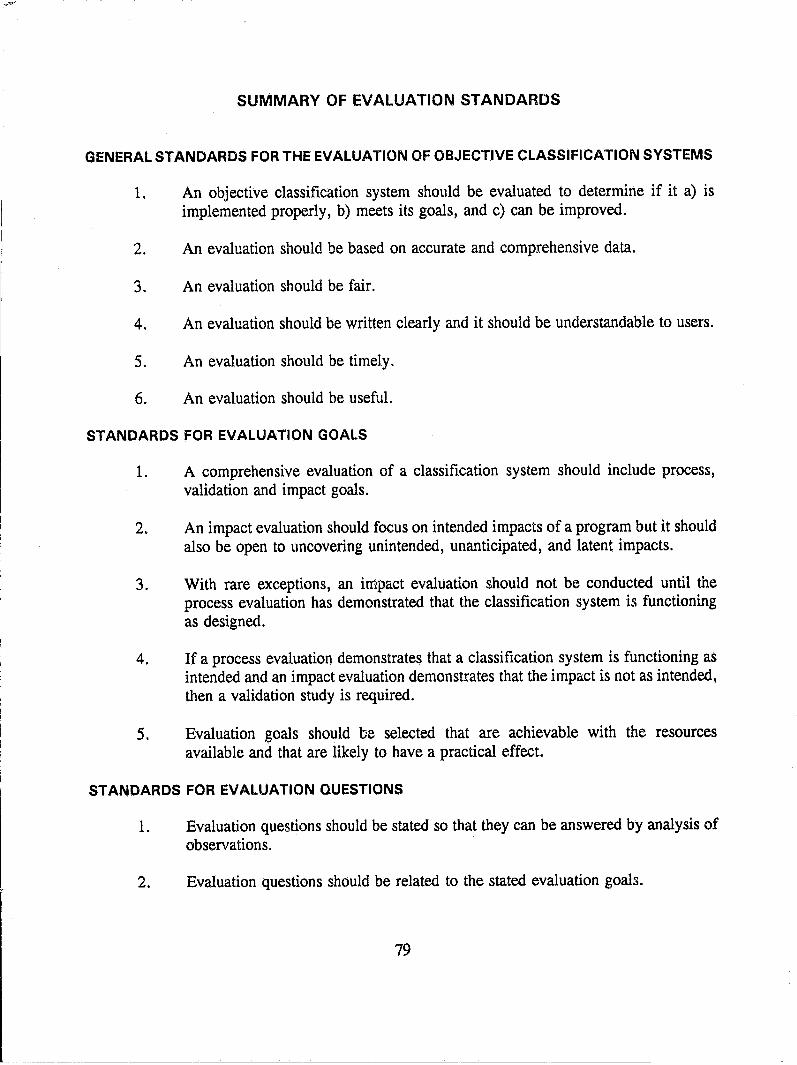
---~~~-----------~---------------------------------------------------------~
SUMMARY OF EVALUATION STANDARDS
GENERAL STANDARDS FOR THE EVALUATION OF OBJECTIVE CLASSIFICATION SYSTEMS
1. An objective classification system should be evaluated to determine if it a) is implemented properly, b) meets its goals, and c) can be improved.
2. An evaluation should be based on accurate and comprehensive data.
3. An evaluation should be fair.
4. An evaluation should be written clearly and it should be understandable to users.
5. An evaluation should be timely.
6. An evaluation should be useful.
STANDARDS FOR EVALUATION GOALS
1. A comprehensive evaluation of a classification system should include process, validation and impact goals.
2. An impact evaluation should focus on intended impacts of a program but it should also be open to uncovering unintended, unanticipated, and latent impacts.
3. With rare exceptions, an impact evaluation should not be conducted until the process evaluation has demonstrated that the classification system is functioning as designed.
4. If a process evaluation demonstrates that a classification system is functioning as intended and an impact evaluation demonstrates that the impact is not as intended, then a validation study is required.
5. Evaluation goals should be selected that are achievable with the resources available and that are likely to have a practical effect.
STANDARDS FOR EVALUATION QUESTIONS
1. Evaluation questions should be stated so that they can be answered by analysis of observations.
2. Evaluation questions should be related to the stated evaluation goals.
79
------------------ ~------ ------------------------~-------
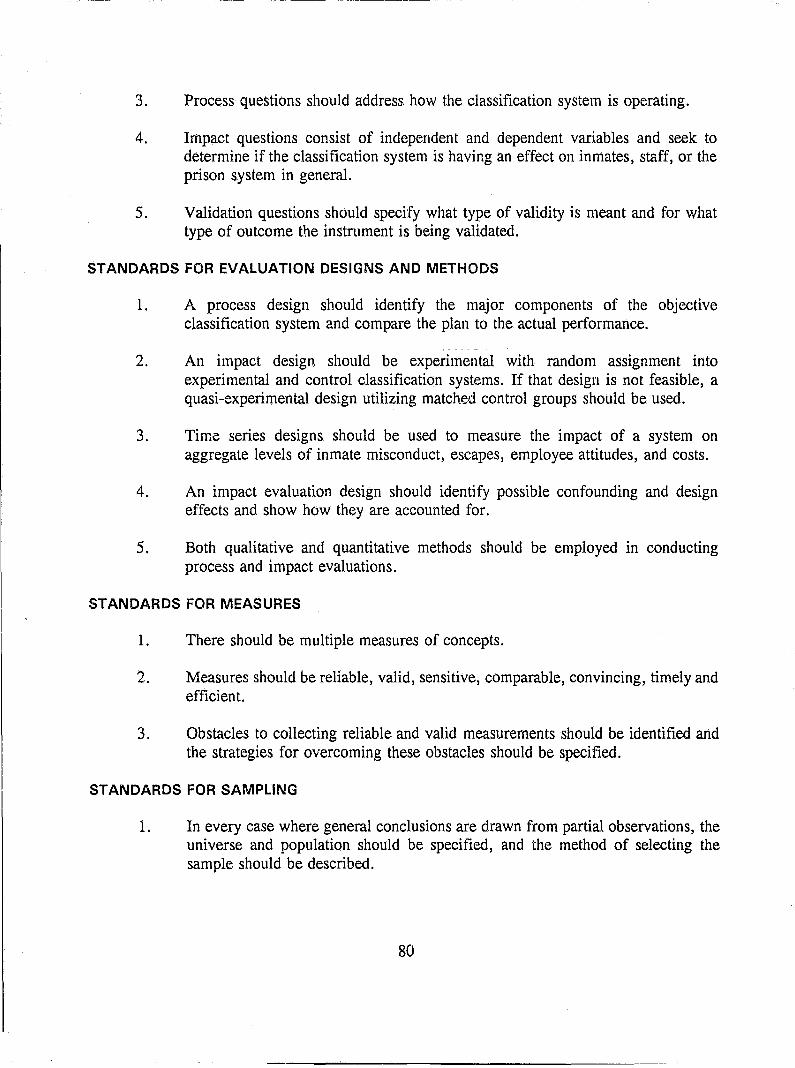
3. Process questions should address how the classification system is operating.
4. Impact questions consist of independent and dependent variables and seek to determine if the classification system is having an effect on inmates, staff, or the prison system in general.
5. Validation questions should specify what type of validity is meant and for what type of outcome the instrument is being validated.
STANDARDS FOR EVALUATION DESIGNS AND METHODS
1. A process design should identify the major components of the objective classification system and compare the plan to the actual performance.
2. An impact design should be experimental with random assignment into experimental and control classification systems. If that design is not feasible, a quasi-experimental design utilizing matchejj control groups should be used.
3. Time series designs should be used to measure the impact of a system on aggregate levels of inmate misconduct, escapes, employee attitudes, and costs.
4. An impact evaluation design should identify possible confounding and design effects and show how they are accounted for.
5. Both qualitative and quantitative methods should be employed in conducting process and impact evaluations.
STANDARDS FOR MEASURES
1. There should be multiple measures of concepts.
2. Measures should be reliable, valid, sensitive, comparable, convincing, timely and efficient.
3. Obstacles to collecting reliable and valid measurements should be identified and the strategies for overcoming these obstacles should be specified.
STANDARDS FOR SAMPLING
1. In every case where general conclusions are drawn from partial observations, the universe and population should be specified, and the method of selecting the sample should be described.
80
2. If probability samples are used evaluations should also report sample selection bias, sampling frame, and the confidence limit and tolerated error.
3. The rationale for the sample strategy must include the limitations on generalizations from the sample to the population and the universe.
STANDARDS FOR DATA COLLECTION
1. Data collection instruments and raw data collected for an evaluation should be maintained permanently and should be accessible to other professionals within the limits of confidentiality.
2. Data collection procedures should be pilot tested.
3. Data should be cleaned: missing, inconsistent and implausible data should be reviewed and rectified wherever appropriate and possible. Either the consequences of missing data for the validity of the evaluation should be discussed or estimated data should be used with a rationale provided for the estimations.
4. Data should be assessed to assure that it has been collected in accordance with the operational definitions of the measures.
5. When using loosely structured research methods, the evaluation should report precisely what data was collected and how the issues of reliability and validity were addressed.
6. Data used to evaluate prison classification systems should consist of multiple measures using both qualitative and quantitative data.
STANDARDS FOR STATISTICS
1. In general, the evaluation team should include staff or advisors with specialized training in applied statistics to guide decisions on the proper use and interpretation of statistics.
2. Evaluation reports should include a frequency distribution table that includes the mean, standard deviation, and number of valid cases for each variable used in the analysis.
3. Variables with 10 percent or more missing information should be deleted from further statistical analysis. It is also recommended that those variables be excluded as classification scoring criterion.
81
4. In conducting tests of association on correlation, the researcher must ensure that the statistics being applied are appropriate given the type of data collected for analysis.
5. In presenting one's findings, the researcher should make distinctions between substantive and statistical levels of significance.
82
GLOSSARIES OF KEY TERMS
FOR
SAMPLING, VALIDITY, RELIABILITY, AND STATISTICS
83
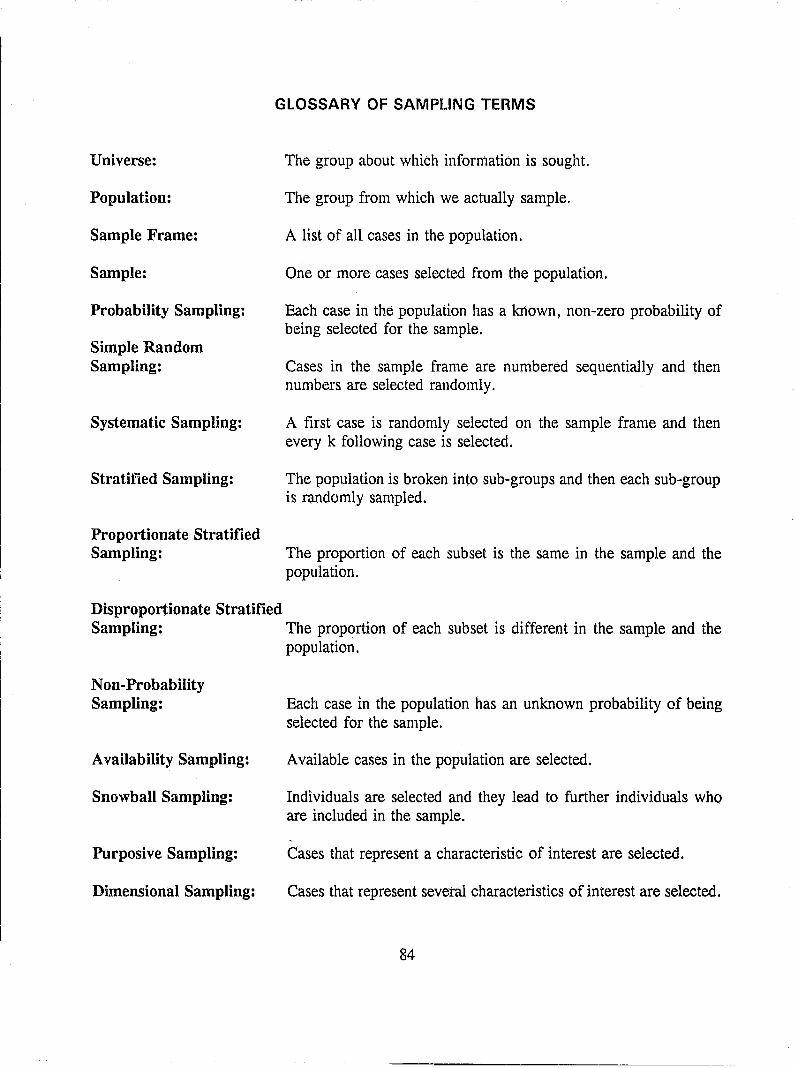
GLOSSARY OF SAMPLING TERMS
Universe:
Population:
Sample Frame:
Sample:
Probability Sampling:
Simple Rand.om Sampling:
Systematic Sampling:
Stratitied Sampling:
Proportionate Stratified Sampling:
Disproportionate Stratified
The group about which information is sought.
The group from which we actually sample.
A list of all cases in the population.
One or more cases selected from the population.
Each case in the population has a known, non-zero probability of being selected for the sample.
Cases in the sample frame are numbered sequentially and then numbers are selected randomly.
A first case is randomly selected on the sample frame and then every k following case is selected.
The population is broken into sub-groups and then each sub-group is randomly sampled.
The proportion of each subset is the same in the sample and the population.
Sampling: The proportion of each subset is different in the sample and the population.
N on-Probability Sampling:
Availability Sampling:
Snowball Sampling:
Purposive Sampling:
Dimensional Sampling:
Each case in the population has an unknown probability of being selected for the sample.
Available cases in the population are selected.
Individuals are selected and they lead to further individuals who are included in the sample.
Cases that represent a characteristic of interest are selected.
Cases that represent several characteristics of interest are selected.
84
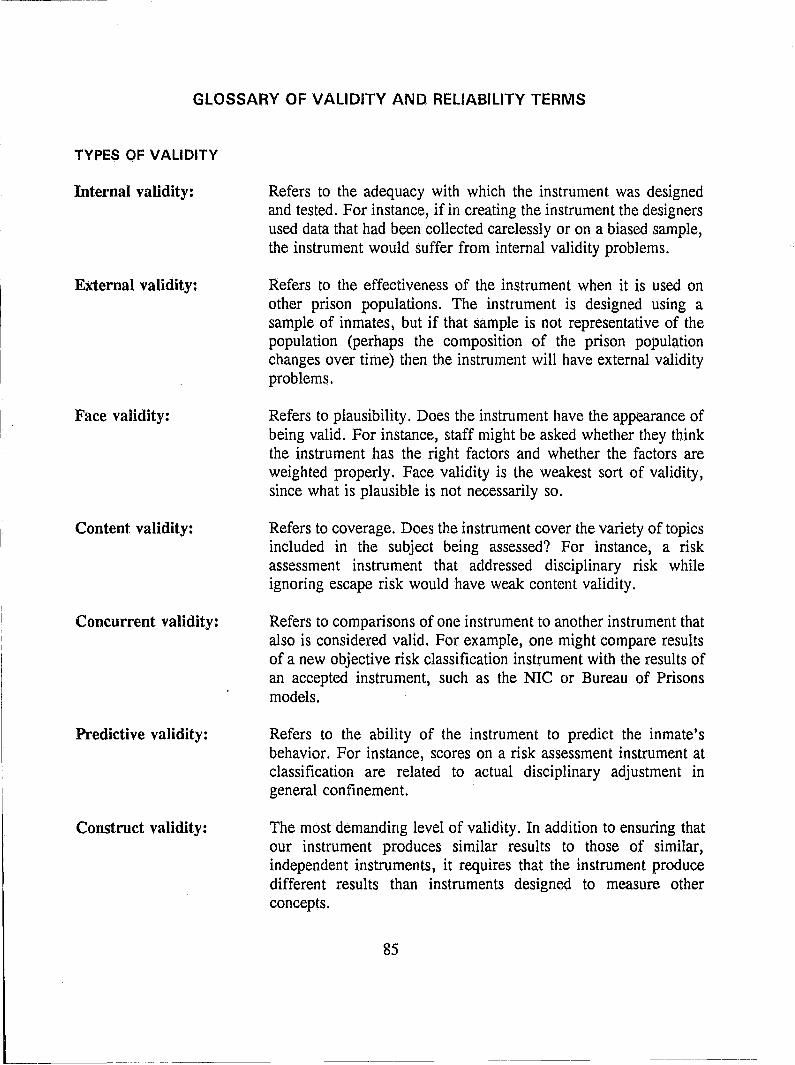
GLOSSARY OF VALIDITY AND RELIABILITY TERMS
TYPES OF VALIDITY
Internal validity:
External validity:
Face validity:
Content validity:
Concurrent validity:
Predictive validity:
Construct validity:
Refers to the adequacy with which the instrument was designed and tested. For instance, if in creating the instrument the designers used data that had been collected carelessly or on a biased sample, the instrument would suffer from internal validity problems.
Refers to the effectiveness of the instrument when it is used on other prison populations. The instrument is designed using a sample of inmates, but if that sample is not representative of the population (perhaps the composition of the prison population changes over time) then tbe instrument will have external validity problems.
Refers to plausibility. Does the instrument have the appearance of being valid. For instance, staff might be asked whether they think the instrument has the right factors and whether the factors are weighted properly. Face validity is the weakest sort of validity, since what is plausible is not necessarily so.
Refers to coverage. Does the instrument cover the variety of topics included in the subject being assessed? For instance, a risk assessment instrument that addressed disciplinary risk while ignoring escape risk would have weak content validity.
Refers to comparisons of one instrument to another instrument that also is considered valid. For example, one might compare results of a new objective risk classification instrument with the results of an accepted instrument, such as the NIC or Bureau of Prisons models.
Refers to the ability of the instrument to predict the inmate's behavior. For instance, scores on a risk assessment instrument at classification are related to actual disciplinary adjustment in general confinement.
The most demanding level of validity. In addition to ensuring that our instrument produces similar results to those of similar, independent instruments, it requires that the instrument produce different results than instruments designe.d to measure other concepts.
85
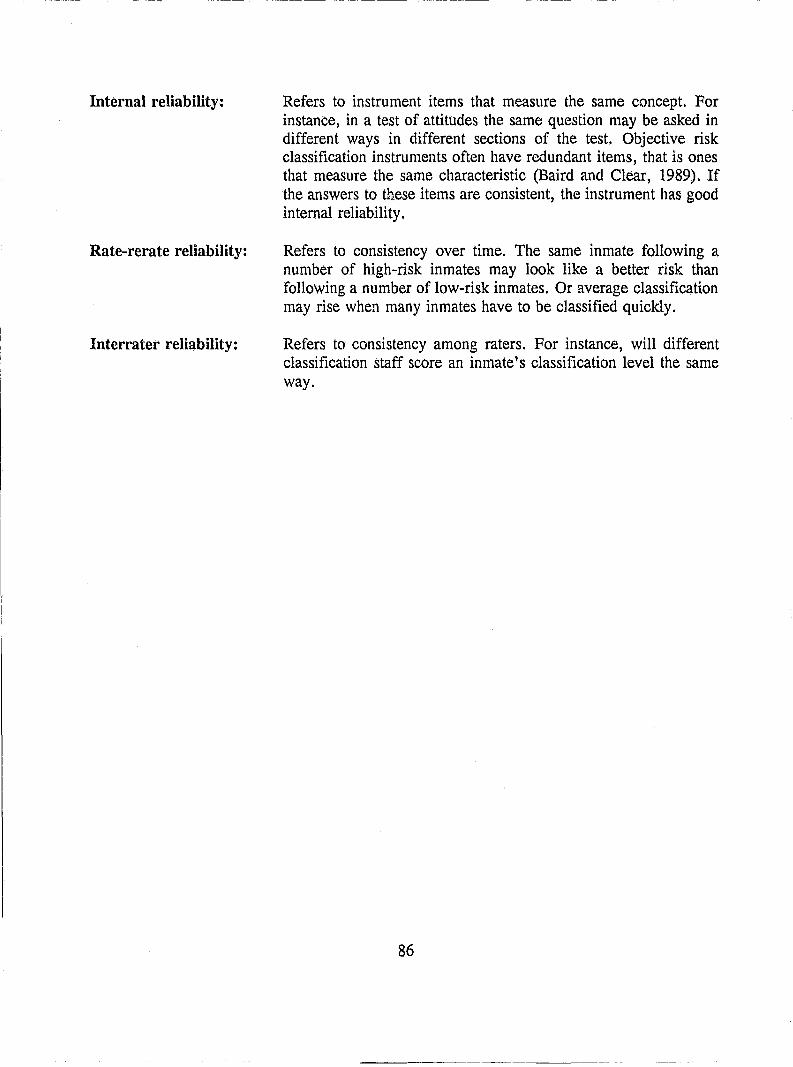
Internal reliability:
Rate-rerate reliability:
Interl'ater reliability:
Refers to instrument items that measure the same concept. For instance, in a test of attitudes the same question may be asked in different ways in different sections of the test. Objective risk classification instruments often have redundant items, that is ones that measure the same characteristic (Baird and Clear, 1989). If the answers to these items are consistent, the instrument has good internal reliability.
Refers to consistency over time. The same inmate following a number of high-risk inmates may look like a better risk than following a number of low-risk inmates. Or average classification may rise when many inmates have to be classified quickly.
Refers to consistency among raters. For instance, will different classification staff score an inmate's classification level the same way.
86
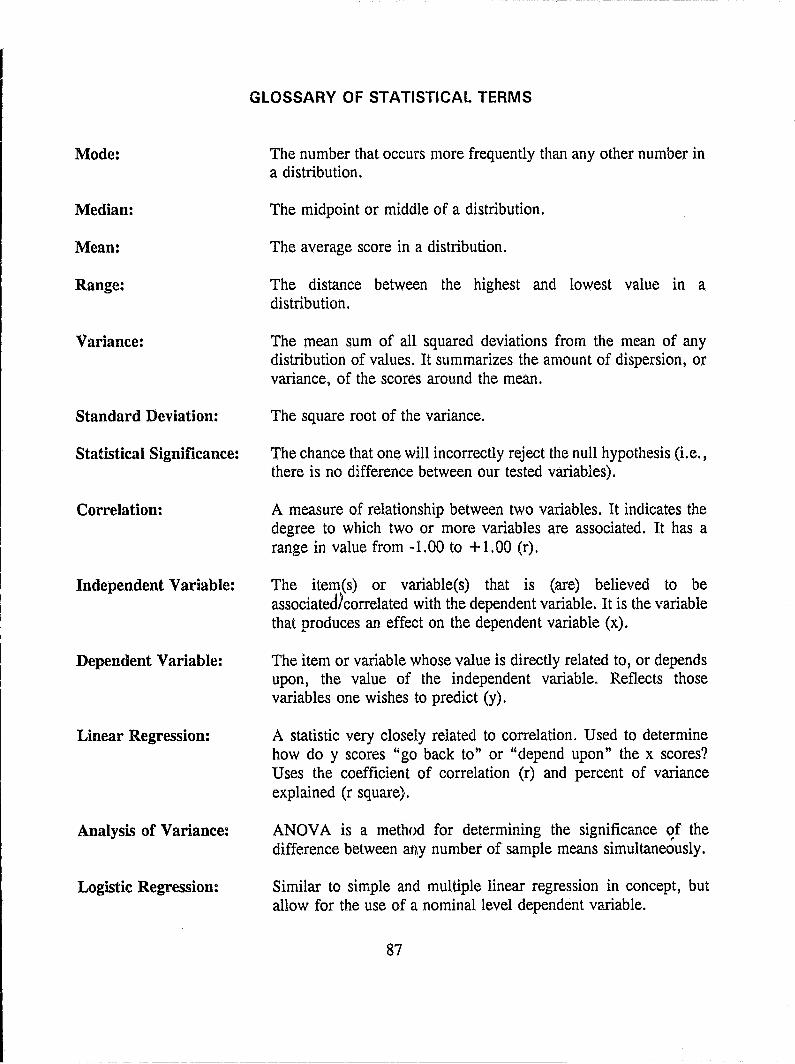
Mode:
Median:
Mean:
Range:
Variance:
Standard Deviation:
Statistical Significance:
Correlation:
Independent Variable:
Dependent Variable:
Linear Regression:
Analysis of Variance:
Logistic Regression:
GLOSSARY OF STATISTICAL TERMS
The number that occurs more frequently than any other number in a distribution.
The midpoint or middle of a distribution.
The average score in a distribution.
The distance between the highest and lowest value in a distribu tion.
The mean sum of all squared deviations from the mean of any distribution of values. It summarizes the amount of dispersion, or variance, of the scores around the mean.
The square root of the variance.
The chance that one will incorrectly reject the null hypothesis (Le., there is no difference between our tested variables).
A measure of relationship between two variables. It indicates the degree to which two or more variables are associated. It has a range in value from -1.00 to + 1.00 (r).
The item(s) or variable(s) that is (are) believed to be associated)correlated with the dependent variable. It is the variable that produces an effect on the dependent variable (x).
The item or variable whose value is directly related to, or depends upon, the value of the independent variable. Reflects those variables one wishes to predict (y).
A statistic very closely related to correlation. Used to determine how do y scores "go back to" or "depend upon" the x scores? Uses the coefficient of correlation (r) and percent of variance explained (r square).
ANOV A is a method for determining the significance of the difference between at~y number of sample means simultaneOusly.
Similar to simple and multiple linear regression in concept, but allow for the use of a nominal level dependent variable.
87
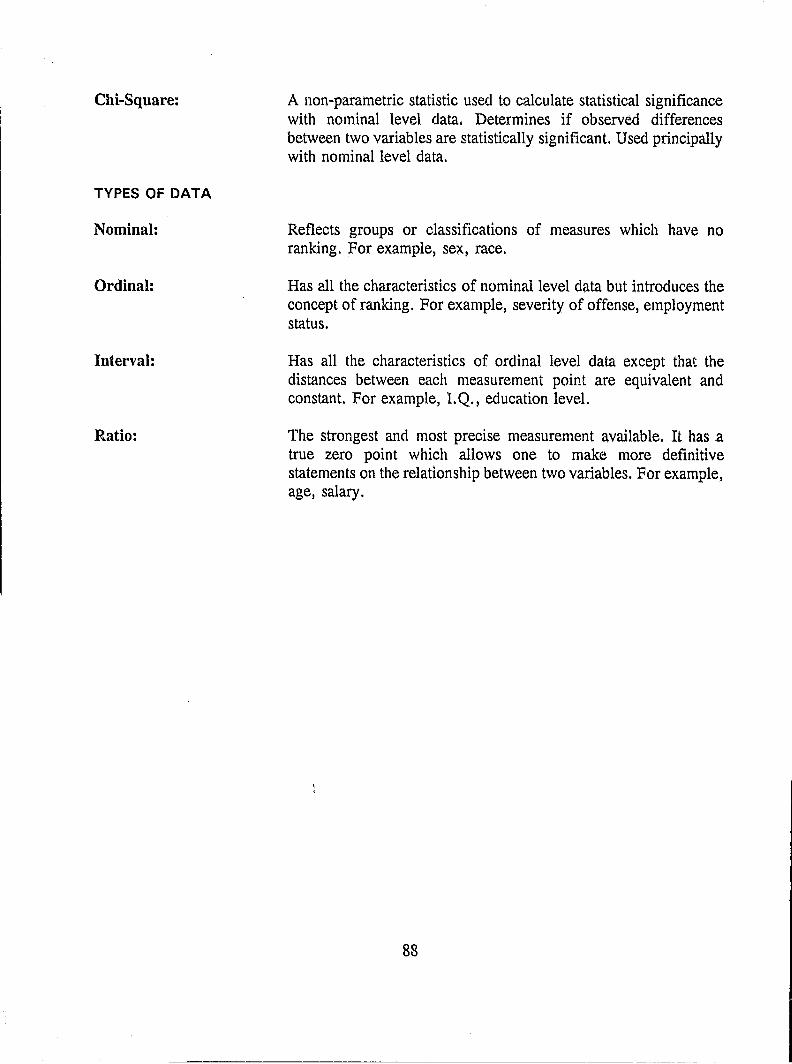
Chi-Square:
TYPES OF DATA
Nominal:
Ordinal:
Interval:
Ratio:
A non-parametric statistic used to calculate statistical significance with nominal level data. Determines if observed differences between two variables are statistically significant. Used principally with nominal1evel data.
Reflects groups or classifications of measures which have no ranking. For example, sex, race.
Has all the characteristics of nominal level data but introduces the concept of ranking. For example, severity of offense, employment status.
Has all the characteristics of ordinal level data except that the distances between each measurement point are equivalent and constant. For example, 1. Q., education level.
The strongest and most precise measurement available. It has a true zero point which allows one to make more definitive statements on the relationship between two variables. For example, age, salary.
88
----------------------------------
REFERENCES
Alexander, Jack, "New York State Security Reclassification Guideline." Albany, NY: New York State Department of Correctional Services, 1984.
Apao, William K., "Improving Prison Classification Procedures: Application of an Interaction Model." Waterbury, VT: Vermont Department of Corrections, 1986.
Appelbaum, Paul S., Charles W. Lidz and Alan Meisel, Informed Consent: Legal Theory and Clinical Practice. Oxford, England: Oxford University Press, 1987.
Austin, James, "Evaluation of the Texas Department of Corrections Inmate Classification System." San Francisco, CA: National Council on Crime and Delinquency, undated.
Austin, James, "Evaluating How Well your Classification System is Working." Crime & Delinquency 32:302-22, 1986.
Austin, James, A Comparative Analysis of the Florida Department of Corrections Inmate Classification System. San Francisco, CA: National Council on Crime and Delinquency, 1990.
Austin, James, Douglas A. Holien, Luiza Chan and Christopher Baird, "Reducing Prison Violence by More Effective Prison Management." San Francisco, CA: National Council on Crime and Delinquency, 1990.
Berk, Richard A., "The Role of Subjectivity in Criminal Justice Classification and Prediction." Criminal Justice Ethics 7:35-46, 1988.
Berk, Richard A. and Peter H. Rossi, Thinking About Program Evaluation. Newbury Park, CA: Sage Publications, 1990.
Bohnstedt, M. and S. Geiser, Classification Instruments for Criminal Justice Decisions. Washington, DC: National Institute of Corrections, 1979.
Brennan, Tim, "Classification: An Overview of Selected Methodological Issues." In Prediction and Classification, edited by D. Gottfredson and M. Tonry. Chicago, IL: University of Chicago Press, 1987a.
Brennan, Tim, "Classification for Control." In Prediction and Classification, edited b¥ D. Gottfredson and M. Tonry. Chicago, IL: University of Chicago Press, 1987b.
California Department of Corrections, "Inmate Classification System Study." Sacramento, CA: California Department of Corrections, 1986.
89
Campbell, D, and J. Stanley, "Experimental and Quasi-Experimental Designs for Research on Teaching." In Handbook of Research on Teaching, edited by N.L. Gage. Chicago, IL: Rand McNally, 1963.
Caprio, Mary and Robert Hardy, "A Study of the Custody Classification Instrument: The Impact on Initial FiZi0t::ment (Condensed Version)." Columbus, OR: Ohio Department of Rehabilitation and Correction, 1986.
Chapman, William, "Adjustment to Prison: A Review of Inmate Characteristics Associated with Misconduct, Victimization and Self-Injury in Confinement." Albany, NY: State Department of Correctional Services, 1981.
Chayet, Ellen F., Todd R. Clear, F. Matthew Clune and A. Raj end ran , "Classification for Custody and the Assessment of Risk in the Colorado Department of Corrections." mimeo, 1989.
Clear, Todd, Christopher Baird, "In/Out Decision Making: A Conceptual Framework." Perspectives: 11,4: 10-14,26, 1987.
Clear, Todd, "Statistical Prediction in Corrections." Research in Corrections 1:1-40, 1988.
Cohen, Jacqueline, "Research on Criminal Careers: Individual Frequency Rates and Offense Seriousness." Pp. 292-418 in Criminal Careers and ItCareer Criminals, " Vol I, edite4 by Alfred Blumstein et al. Washington, DC: National Academy Press, 1986.
Cook, T. and D. Campbell, Quasi-Experimentation. Chicago, IL: Rand McNally, 1979.
Correctional Services Group, "Evaluation of Virginia Department of Corrections' Offender Classification System." Kansas City, MO: Correctional Services Group, Inc., undated.
Correctional Services Group, Inc. and Louisiana State University, Evaluation Report: Louisiana Department of Corrections Classification System. Kansas City, MO: Correctional Services Group, Inc., undated.
Craddock, Amy, "Inmate Classification as Organizational Social Control: Implications for Population Management." Ph.D. Thesis, Chapel Hill, NC: University of North Carolina, 1988.
Cronbach, Lee 1. and Paul E. Meehl, "Construct Validity in Psychological Tests." Psychological Bulletin 52:281-302, 1955.
DeComo, Robert E. and James Austin, Initial Findings of the Oregon Department of Corrections' Institutional Classification System. San Francisco, CA: National Council on Crime and Delinquency, 1991.
90
Eynon, T., "New Roles of Research in Classification and Treatment." In Correctional Classification and Treatment: A Reader, edited by the W.H. Anderson Company. Cincinnati, OH: W.H. Anderson Co., 1975.
Forcier, Michael W., "Survey of DOC Staff Perceptions of the Inmate Classification System. " Boston, MA: Massachusetts Department of Corrections, 1988.
Forcier, Michael J., "Testing the Implementation of a Point Based Classification System: A Comparison of DOC Initial Classifications with the NIC Model Systems Approach." Boston, MA: Massachusetts Department of Corrections, 1989.
Fouty, Lonnie et al., "Evaluation of Uniform System of Inmate Custody Classification. " Florida Department of Corrections, 1981.
Fowler, Lorraine and Laurel Rans, "Classification Design Implementation: Technologies and Values." In Classification as a Management Tool: Theories and Models for Decision Makers, edited by Laurel Rans. College Park, MD: American Correctional Association, 1982.
Goldkamp, John and Michael R. Gottfredson, Policy Guidelines for Bail: An Experiment in Court Refonn. Philadelphia, PA: Temple University Press, 1985.
Gorden, Raymond, Interviewing: Strategy, Techniques and Tactics. Homewood, IL: The Dorsey Press, 1975.
Gottfredson, Don M., Leslie T. Wilkins and Peter B. Hoffman, Guidelines for Parole and Sentencing: A Policy Control Method. Lexington, MA: Lexington Books, 1978.
Gottfredson, Stephen and Don M. Gottfredson, Screening for Risk: A Comparison of Methods. Washington, DC: National Institute of Corrections, 1979.
Gottfredson, Stephen and Don M. Gottfredson, "Accuracy of Prediction Models." In Criminal Careers and "Career Criminals, Vol. II," edited by Alfred Blumstein, et al., Washington, DC: National Academy Press, 1986.
Hall, A., Alleviating Jail Crowding: A Systems Perspective. Washington, DC: National Institute of Justice, 1985.
Hindelang, Michael J., "Uniform Crime Reports Revisited." Journal of Criminal Justice 2:1-18, 1974.
Humphrey, Elaine, "Review of the Literature on Female Security Issues." Albany, NY: NY State Department of Correctional Services, 1987.
91
Kahnemann, D. and A. Tversky, "On the Psychology of Prediction." P~ychological Review 80:237-51, 1973.
Kane, Thomas and William Saylor, "Security Designation/Custody Classification of Inmates." Washington, DC: U.S. Bureau of Prisons, 1982.
Kirk, Jerome and Marc L. Miller, Reliability and Validity in Qualitative Research. Beverly Hills, CA: Sage Publications, 1986.
Lempert, Richard O. and Christy A. Visher, "Randomized Field Experiments in Criminal Justice Agencies." Research in Action. Washington, DC: National Institute of Justice, 1988.
Mandaraka-Shephard, Alexandra, The Dynamics of Aggression in Women's Prisons in England. Aldershot, England: Gower Publishing Co, 1986.
Messick, Samuel, "Validity." In Educational Measurement, 3rd ed., edited by R.L. Linn., New York, NY: Macmillan, 1988.
Meyers, William R., The Evaluation Enterprise. San Francisco, CA: Jossey-Bass Publishers, 1981.
Monahan, John, Predicting Violent Behavior: An Assessment of Clinical Techniques. Beverly Hills, CA: Sage Publications, 1981.
Murphy, Jerome, Getting the Facts: A Fieldwork Guide for Evaluators and Policy Analysts. Santa Monica, CA: Goodyear, 1980.
Patton, Michael Q., Qualitative Evaluation Methods. Newbury Park, CA: Sage Publications, 1980.
Pierson, T.A., "The Missouri Department of Corrections' External Classification System: Reliability, Certification, and Pilot Validity Study. " Missouri Department of Corrections, 1987.
Rossi, Peter H., ed., Standards for Evaluation. Practice: New Directions for Program Evaluation, #15. San Francisco, CA: Jossey-Bass, Inc. Evaluation Research Society, 1982.
Rossi, Peter H. and Howard E. Freeman, Evaluation: A Systematic Approach. Beverly Hills, CA: Sage Publications, 1985.
Rutman, Leonard, Planning Useful Evaluations: Evaluability Assessment. Beverly Hills, CA: Sage Publications, 1980.
92
Simon, Julian L., Basic Research Methods in the Social Sciences. New York, NY: Random House, 1978.
Solomon, L. and C. Baird, "Classification: Past Failures and Future Potential." In Classification as a Management Tool: Theories and Models for Decision Makers, edited by L. Fowler. College Park, MD: American Correctional Association, 1982.
Toch, Hans, "Exchange III between Hans Toch and Leslie Wilkins." Criminal Justice and Behavior: 12,1:3-16, 1985.
Tonry, Michael, "Structuring Sentencing." Pp. 267-337 in Crime and Justice: A Review of Research, edited by Michael Tonry and Norval Morris. Chicago, IL: University of Chicago Press, 1988.
Tonry, Michael, "Stated and Latent Functions of ISP." Crime & Delinquency 36(1):174-91, 1990.
Tonry, Michael and Jacqueline Cohen, "Sentencing Reforms and their Impacts." Pp. 305-459 in Research on Sentencing: The Search for Reform, edited by Alfred Blumstein, et al. Washington, DC: National Academy Press, 1983.
U.S. Department of Health and Human Services, "Protection of Human Subjects." Part 46, title 45, Code of Federal Regulations. Washington, DC: author, 1983.
Van Voorhis, Patricia, "A Cross Classification of Five Offender Topologies: Results of the Pilot Study." Cincinnati, OH: University of Cincinnati, undated.
Weis, Joseph G., "Issues in the Measurement of Criminal Careers." Pp. 1-51 in Criminal Careers and "Career Criminals, " Vol. II, l.Xlited by Alfred Blumstein et al. Washington, DC: National Academy Press, 1986.
Weiss, Carol H., Evaluation Research: Methods for Assessing Program Effectiveness. Englewood Cliffs, NJ: Prentice-Hall, Inc., 1972.
Wisconsin Department of Health and Social Services, "Wisconsin's Case Classification and Staff Deployment System: An Evaluation. Report 1 - Classification, Supervision and Client Outcomes." Madison, WI: author, undated.
93

I
National Institute of Corrections Advisory Board
10 Anne Barnhart Assistant Secretary for Children & Families Department of Health & Human Services Washington, DC
Norman A. Carlson Senior Fellow University of Minnesota Stillwater, Minnesota
JoI-ill E. Clark Attorney-at-Law San Antonio, Texas
Lynne DeLano Secretary South Dakota Department of Corrections Pierre, South Dakota.
Newman Flanagan District Attorney Suffolk County Boston, Massachusetts
Honorable Carol Pavilack Getty Chairman U.S. Parole Commission Bethesda, Maryland
Assistant Attorney General Office of Justice Programs Washington, DC
Susan Humphrey-Barnett Anchorage, Alaska
Norval Morris Professor University of Chicago Law School Chicago, Illinois
Barry J. Nidorf Chief Probation Officer Los Angeles Probation Department Downey, California
Don Omodt Sheriff Hennepin County Adult Detention Center Minneapolis, Minnesota
John A. Prescott Chief, Retired Kennebunkport Police Department Cape Porpoise, Maine
J. Michael Quinlan Director Federal Bureau of Prisons Washington, DC
Gerald P. Regier Acting Administmtor Office of Juvenile Justice
& Delinquency Prevention Washington, DC
Judge William W Schwarzer Director Federal Judicial Center Washington, DC
Paul V. Voinovich Cleveland, Ohio