Embed Size (px)
DESCRIPTION
Weather data
Citation preview
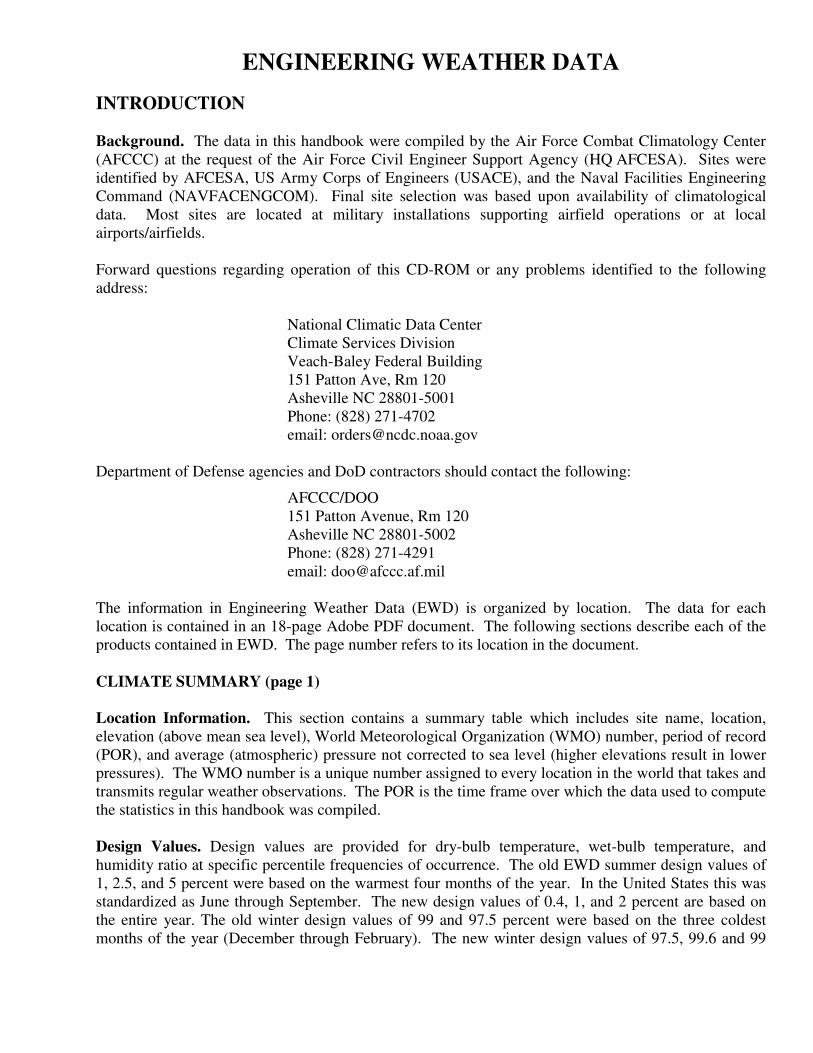
ENGINEERING WEATHER DATA
INTRODUCTION
Background. The data in this handbook were compiled by the Air Force Combat Climatology Center(AFCCC) at the request of the Air Force Civil Engineer Support Agency (HQ AFCESA). Sites wereidentified by AFCESA, US Army Corps of Engineers (USACE), and the Naval Facilities EngineeringCommand (NAVFACENGCOM). Final site selection was based upon availability of climatologicaldata. Most sites are located at military installations supporting airfield operations or at localairports/airfields.
Forward questions regarding operation of this CD-ROM or any problems identified to the followingaddress:
National Climatic Data CenterClimate Services DivisionVeach-Baley Federal Building151 Patton Ave, Rm 120Asheville NC 28801-5001Phone: (828) 271-4702email: [email protected]
Department of Defense agencies and DoD contractors should contact the following:
AFCCC/DOO151 Patton Avenue, Rm 120Asheville NC 28801-5002Phone: (828) 271-4291email: [email protected]
The information in Engineering Weather Data (EWD) is organized by location. The data for eachlocation is contained in an 18-page Adobe PDF document. The following sections describe each of theproducts contained in EWD. The page number refers to its location in the document.
CLIMATE SUMMARY (page 1)
Location Information. This section contains a summary table which includes site name, location,elevation (above mean sea level), World Meteorological Organization (WMO) number, period of record(POR), and average (atmospheric) pressure not corrected to sea level (higher elevations result in lowerpressures). The WMO number is a unique number assigned to every location in the world that takes andtransmits regular weather observations. The POR is the time frame over which the data used to computethe statistics in this handbook was compiled.
Design Values. Design values are provided for dry-bulb temperature, wet-bulb temperature, andhumidity ratio at specific percentile frequencies of occurrence. The old EWD summer design values of1, 2.5, and 5 percent were based on the warmest four months of the year. In the United States this wasstandardized as June through September. The new design values of 0.4, 1, and 2 percent are based onthe entire year. The old winter design values of 99 and 97.5 percent were based on the three coldestmonths of the year (December through February). The new winter design values of 97.5, 99.6 and 99
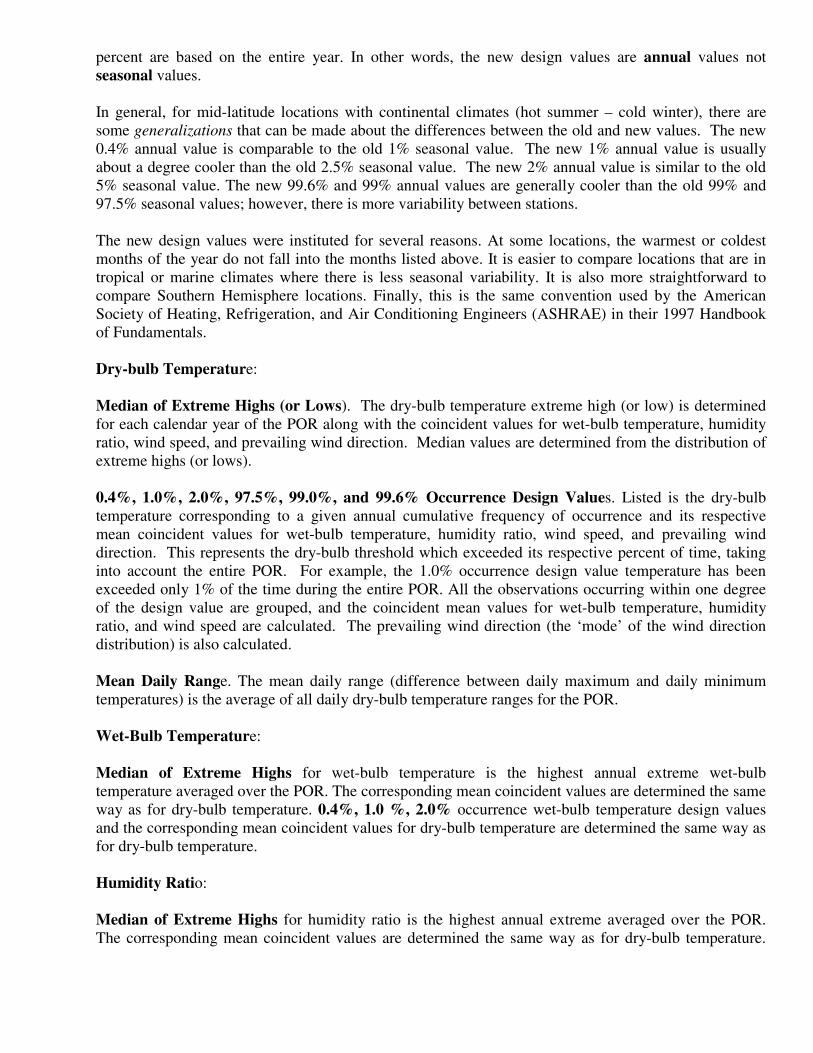
percent are based on the entire year. In other words, the new design values are annual values notseasonal values.
In general, for mid-latitude locations with continental climates (hot summer – cold winter), there aresome generalizations that can be made about the differences between the old and new values. The new0.4% annual value is comparable to the old 1% seasonal value. The new 1% annual value is usuallyabout a degree cooler than the old 2.5% seasonal value. The new 2% annual value is similar to the old5% seasonal value. The new 99.6% and 99% annual values are generally cooler than the old 99% and97.5% seasonal values; however, there is more variability between stations.
The new design values were instituted for several reasons. At some locations, the warmest or coldestmonths of the year do not fall into the months listed above. It is easier to compare locations that are intropical or marine climates where there is less seasonal variability. It is also more straightforward tocompare Southern Hemisphere locations. Finally, this is the same convention used by the AmericanSociety of Heating, Refrigeration, and Air Conditioning Engineers (ASHRAE) in their 1997 Handbookof Fundamentals.
Dry-bulb Temperature:
Median of Extreme Highs (or Lows). The dry-bulb temperature extreme high (or low) is determinedfor each calendar year of the POR along with the coincident values for wet-bulb temperature, humidityratio, wind speed, and prevailing wind direction. Median values are determined from the distribution ofextreme highs (or lows).
0.4%, 1.0%, 2.0%, 97.5%, 99.0%, and 99.6% Occurrence Design Values. Listed is the dry-bulbtemperature corresponding to a given annual cumulative frequency of occurrence and its respectivemean coincident values for wet-bulb temperature, humidity ratio, wind speed, and prevailing winddirection. This represents the dry-bulb threshold which exceeded its respective percent of time, takinginto account the entire POR. For example, the 1.0% occurrence design value temperature has beenexceeded only 1% of the time during the entire POR. All the observations occurring within one degreeof the design value are grouped, and the coincident mean values for wet-bulb temperature, humidityratio, and wind speed are calculated. The prevailing wind direction (the ‘mode’ of the wind directiondistribution) is also calculated.
Mean Daily Range. The mean daily range (difference between daily maximum and daily minimumtemperatures) is the average of all daily dry-bulb temperature ranges for the POR.
Wet-Bulb Temperature:
Median of Extreme Highs for wet-bulb temperature is the highest annual extreme wet-bulbtemperature averaged over the POR. The corresponding mean coincident values are determined the sameway as for dry-bulb temperature. 0.4%, 1.0 %, 2.0% occurrence wet-bulb temperature design valuesand the corresponding mean coincident values for dry-bulb temperature are determined the same way asfor dry-bulb temperature.
Humidity Ratio:
Median of Extreme Highs for humidity ratio is the highest annual extreme averaged over the POR.The corresponding mean coincident values are determined the same way as for dry-bulb temperature.

Design values are provided for "Humidity Ratio" at the 0.4%, 1.0%, and 2.0% occurrence and thecorresponding mean coincident values for dry-bulb temperature, vapor pressure, wind speed, and windprevailing direction.
Air Conditioning/Humid Area Criteria:These are the number of hours, on average, that dry-bulb temperatures of 93 ºF (34 ºC) and 80 ºF (27 ºC)and wet-bulb temperatures of 73 ºF (23 ºC) and 67 ºF (19 ºC) are equaled or exceeded during the year.
Other Site Data:This information is provided for general reference only, and should NOT be used as the basis fordesign.There are some locations for which this data is not available. In these cases, that portion of the table willbe left blank.
Weather Region. There are eleven weather regions developed by the Department of Energy. Theregions are defined by the range of cooling-degree and heating-degree days.
Ventilation Cooling Load Index. The VCLI is a two-part index which defines the total annual coolingload for ventilation air by calculating sensible heat load separately from the latent heat load (moisture).The results are expressed in ton-hours per cubic feet per minute per year of latent and sensible load.Values for sensible heat load are calculated by comparing the outdoor temperature to indoor conditions(75 ºF and 60% relative humidity [RH]), and calculating how much energy is required to bring theoutdoor air to the indoor temperature. The latent load is calculated similarly. Separate calculations aremade for each hour of the year, and them summed to form the annual VCLI (Harriman 1997).
Average Annual Freeze-Thaw Cycles. This is simply the average number of times per year that the airtemperature first drops below freezing and then rises above freezing, regardless of the duration of eitherthe freezing or thawing. The number of cycles is summed per year, and averaged over the entire POR.Days with high temperatures or low temperatures at 32 °F (0 ºC) are not counted for a freeze-thaw cycle.A cycle is counted only when the temperature drops below freezing (31 °F [-0.5 ºC] or colder) or goesabove freezing (33 °F [0.5 ºC] or warmer).
Other Values. The following are derived from sources other than the AFCCC. Engineers and architectsshould contact the organizations listed below for current values, including background information andcomplete guidelines for use of these data elements.
Groundwater:The National Groundwater Educational Foundation, 601 Dempsey Road, Westerville OH 43081-8978Phone: (800) 551-7379
Note: Average groundwater temperature parallels long-term average air temperature, because soil at adepth of 50 feet (15 meters) does not undergo significant temperature change over the course of a year.Soil temperature at 50 feet stays slightly warmer than average annual air temperature by about 2.5degrees Fahrenheit (1.4 degrees Celsius).
Rain Rate:International Plumbing Code, BOCA International, 4051 West Flossmoor Road, Country Club Hills IL60478, Phone: (708) 799-2300
Frost Depth, Basic Wind Speed, Ground Snow Loads:
ANSI/ASCE 7-95American Society of Civil Engineers1015 15th Street NW, Suite 600Washington DC 20005(800) 548-2723
Note: Frost depth penetration data was obtained from TI 809-01, Load Assumptions for Buildings(1986) which is published by the Army Corps of Engineers. Wind and snow load data are provided bythe American Society of Civil Engineers (1995); where snow load data was not available from ASCE,TI-809-01 (1986) was used. However, since the completion of this project, a new version of TI-809-01has also been completed. Many of the new snow loads have changed. Current values can be obtainedat http://www.hnd.usace.army.mil/techinfo/ti/809-01.pdf.
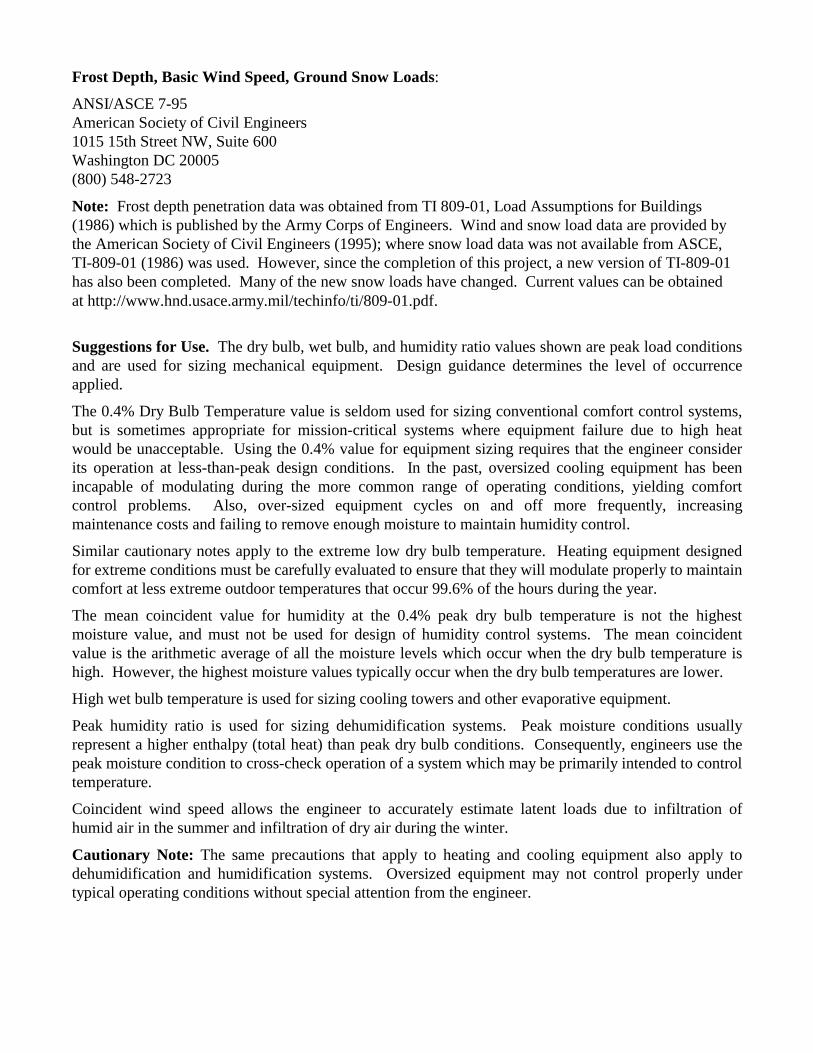
Suggestions for Use. The dry bulb, wet bulb, and humidity ratio values shown are peak load conditionsand are used for sizing mechanical equipment. Design guidance determines the level of occurrenceapplied.
The 0.4% Dry Bulb Temperature value is seldom used for sizing conventional comfort control systems,but is sometimes appropriate for mission-critical systems where equipment failure due to high heatwould be unacceptable. Using the 0.4% value for equipment sizing requires that the engineer considerits operation at less-than-peak design conditions. In the past, oversized cooling equipment has beenincapable of modulating during the more common range of operating conditions, yielding comfortcontrol problems. Also, over-sized equipment cycles on and off more frequently, increasingmaintenance costs and failing to remove enough moisture to maintain humidity control.
Similar cautionary notes apply to the extreme low dry bulb temperature. Heating equipment designedfor extreme conditions must be carefully evaluated to ensure that they will modulate properly to maintaincomfort at less extreme outdoor temperatures that occur 99.6% of the hours during the year.
The mean coincident value for humidity at the 0.4% peak dry bulb temperature is not the highestmoisture value, and must not be used for design of humidity control systems. The mean coincidentvalue is the arithmetic average of all the moisture levels which occur when the dry bulb temperature ishigh. However, the highest moisture values typically occur when the dry bulb temperatures are lower.
High wet bulb temperature is used for sizing cooling towers and other evaporative equipment.
Peak humidity ratio is used for sizing dehumidification systems. Peak moisture conditions usuallyrepresent a higher enthalpy (total heat) than peak dry bulb conditions. Consequently, engineers use thepeak moisture condition to cross-check operation of a system which may be primarily intended to controltemperature.
Coincident wind speed allows the engineer to accurately estimate latent loads due to infiltration ofhumid air in the summer and infiltration of dry air during the winter.
Cautionary Note: The same precautions that apply to heating and cooling equipment also apply todehumidification and humidification systems. Oversized equipment may not control properly undertypical operating conditions without special attention from the engineer.
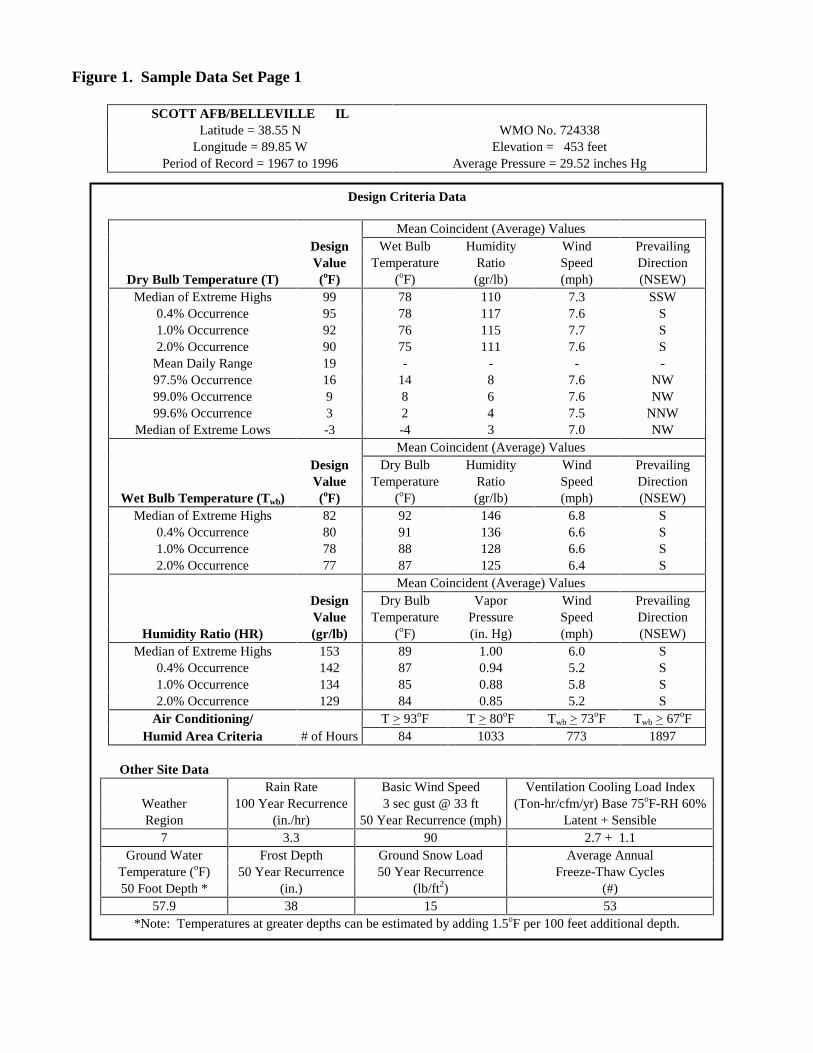
Figure 1. Sample Data Set Page 1
SCOTT AFB/BELLEVILLE ILLatitude = 38.55 N WMO No. 724338
Longitude = 89.85 W Elevation = 453 feetPeriod of Record = 1967 to 1996 Average Pressure = 29.52 inches Hg
Design Criteria Data
Mean Coincident (Average) ValuesDesign Wet Bulb Humidity Wind PrevailingValue Temperature Ratio Speed Direction
Dry Bulb Temperature (T) (oF) (oF) (gr/lb) (mph) (NSEW)Median of Extreme Highs 99 78 110 7.3 SSW
0.4% Occurrence 95 78 117 7.6 S1.0% Occurrence 92 76 115 7.7 S2.0% Occurrence 90 75 111 7.6 S
Mean Daily Range 19 - - - -97.5% Occurrence 16 14 8 7.6 NW99.0% Occurrence 9 8 6 7.6 NW99.6% Occurrence 3 2 4 7.5 NNW
Median of Extreme Lows -3 -4 3 7.0 NWMean Coincident (Average) Values
Design Dry Bulb Humidity Wind PrevailingValue Temperature Ratio Speed Direction
Wet Bulb Temperature (Twb) (oF) (oF) (gr/lb) (mph) (NSEW)Median of Extreme Highs 82 92 146 6.8 S
0.4% Occurrence 80 91 136 6.6 S1.0% Occurrence 78 88 128 6.6 S2.0% Occurrence 77 87 125 6.4 S
Mean Coincident (Average) ValuesDesign Dry Bulb Vapor Wind PrevailingValue Temperature Pressure Speed Direction
Humidity Ratio (HR) (gr/lb) (oF) (in. Hg) (mph) (NSEW)Median of Extreme Highs 153 89 1.00 6.0 S
0.4% Occurrence 142 87 0.94 5.2 S1.0% Occurrence 134 85 0.88 5.8 S2.0% Occurrence 129 84 0.85 5.2 S
Air Conditioning/ T > 93oF T > 80oF Twb > 73oF Twb > 67oFHumid Area Criteria # of Hours 84 1033 773 1897
Other Site DataRain Rate Basic Wind Speed Ventilation Cooling Load Index
Weather 100 Year Recurrence 3 sec gust @ 33 ft (Ton-hr/cfm/yr) Base 75oF-RH 60%Region (in./hr) 50 Year Recurrence (mph) Latent + Sensible
7 3.3 90 2.7 + 1.1Ground Water Frost Depth Ground Snow Load Average Annual
Temperature (oF) 50 Year Recurrence 50 Year Recurrence Freeze-Thaw Cycles50 Foot Depth * (in.) (lb/ft2) (#)
57.9 38 15 53*Note: Temperatures at greater depths can be estimated by adding 1.5oF per 100 feet additional depth.
Average Annual Climate (page 2)
Explanation of Graph. The graph shows the monthly mean temperature, dewpoint, and precipitation.The bar graph representing precipitation uses the scale on the right side of the chart (inches orcentimeters). Lines of temperature and dew point use the scale on the left side of the chart (degreesFahrenheit or Celsius). These charts have fixed maximum and minimum values on their axes for easycomparison between different sites. The precipitation chart is capped at a maximum of 15 inches (45centimeters) per month. A few sites may exceed this value; but to keep the graph readable, a fixedmaximum value was used. There are a number of sites for which accurate precipitation data was notavailable. If this is the case, then no bars are printed on the chart.
Suggestions for Use:
This graph displays the average behavior of weather over a single year. An architect can comparerainfall patterns at one station with another to evaluate differences in gutter and drain sizing, and also therelative importance of water resistance for the exterior envelope. An engineer can compare thetemperature and moisture patterns to understand the relative importance of sensible heat loads vice latentloads at this location.
With averages displayed by month, it is relatively easy to comprehend seasonal variations of eachvariable, and also understand which specific months are likely to be hot or cold; humid or dry, or havehigh precipitation. This can be helpful for mission planning, as well as for planning construction andbuilding operation.
Cautionary Note: This graph displays averages, not extreme values. Data shown should not be used tosize equipment or building envelopes for peak loads. Peak load data appears on page 1 of each stationrecord in this handbook.
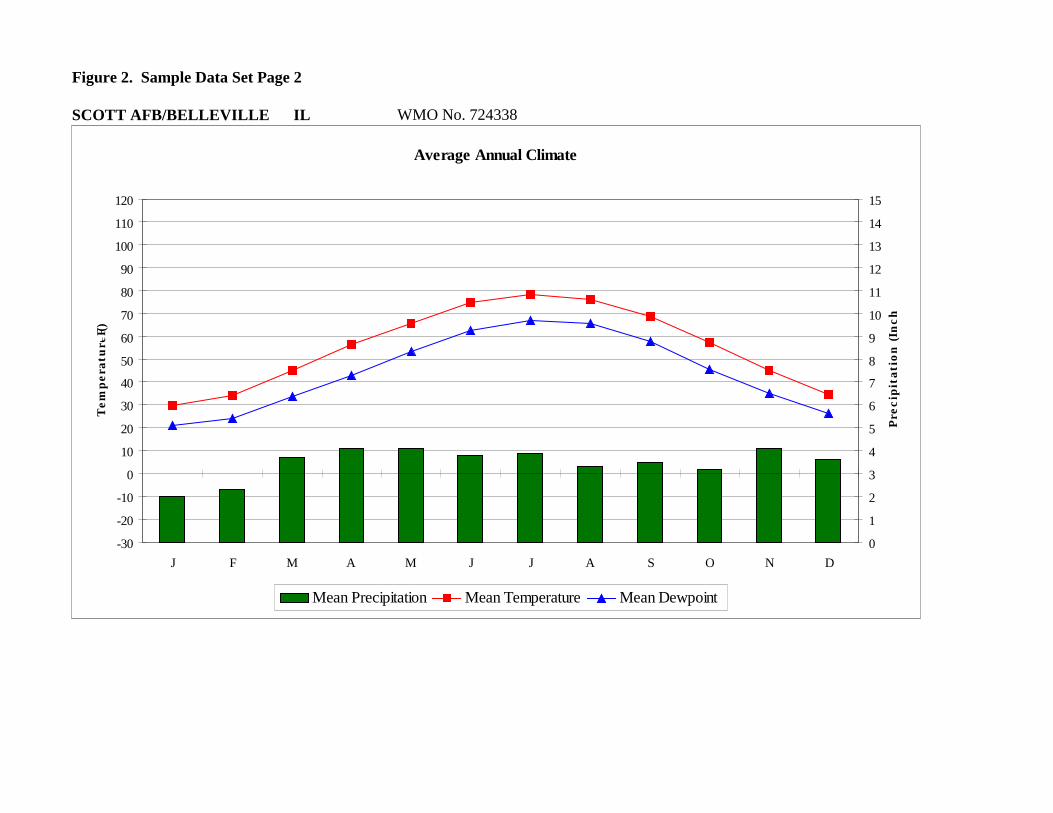
Figure 2. Sample Data Set Page 2
SCOTT AFB/BELLEVILLE IL WMO No. 724338
Average Annual Climate
-30
-20
-10
0
10
20
30
40
50
60
70
80
90
100
110
120
J F M A M J J A S O N D
Tem
per
ature
(F)
0
1
2
3
4
5
6
7
8
9
10
11
12
13
14
15
Pre
cipit
atio
n (In
ch
Mean Precipitation Mean Temperature Mean Dewpoint
Long Term PSYCHROMETRIC SUMMARY (page 3)
Explanation of Graph:
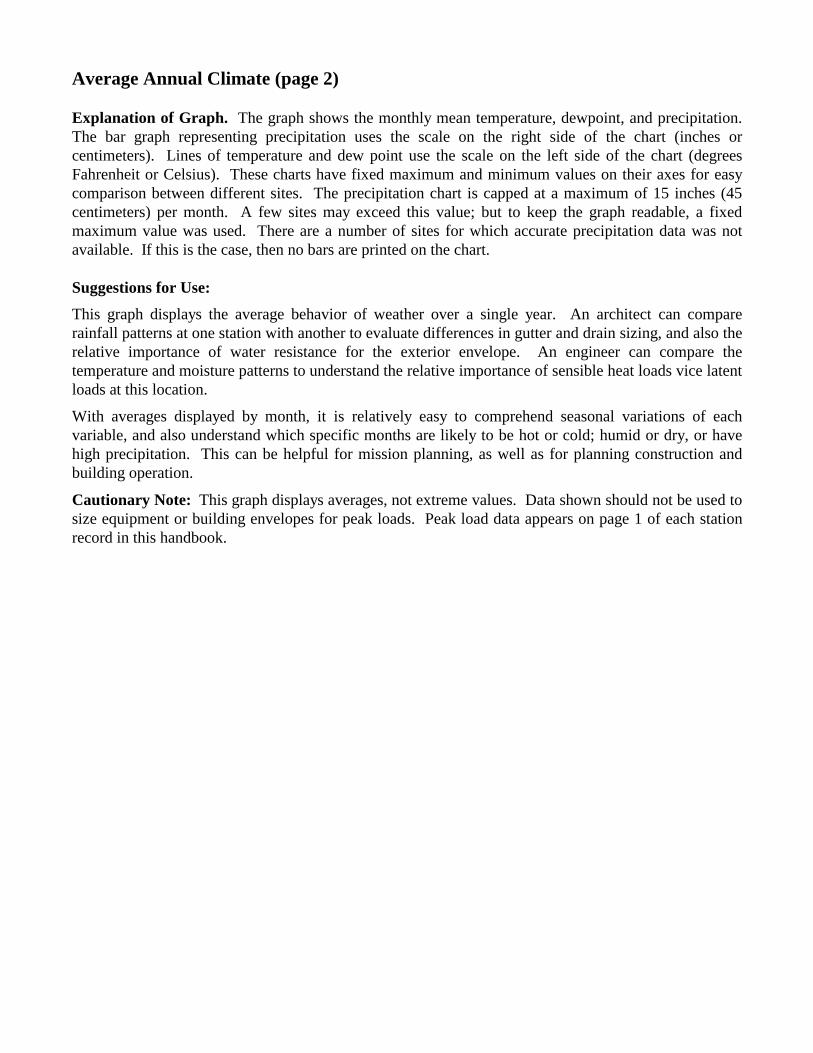
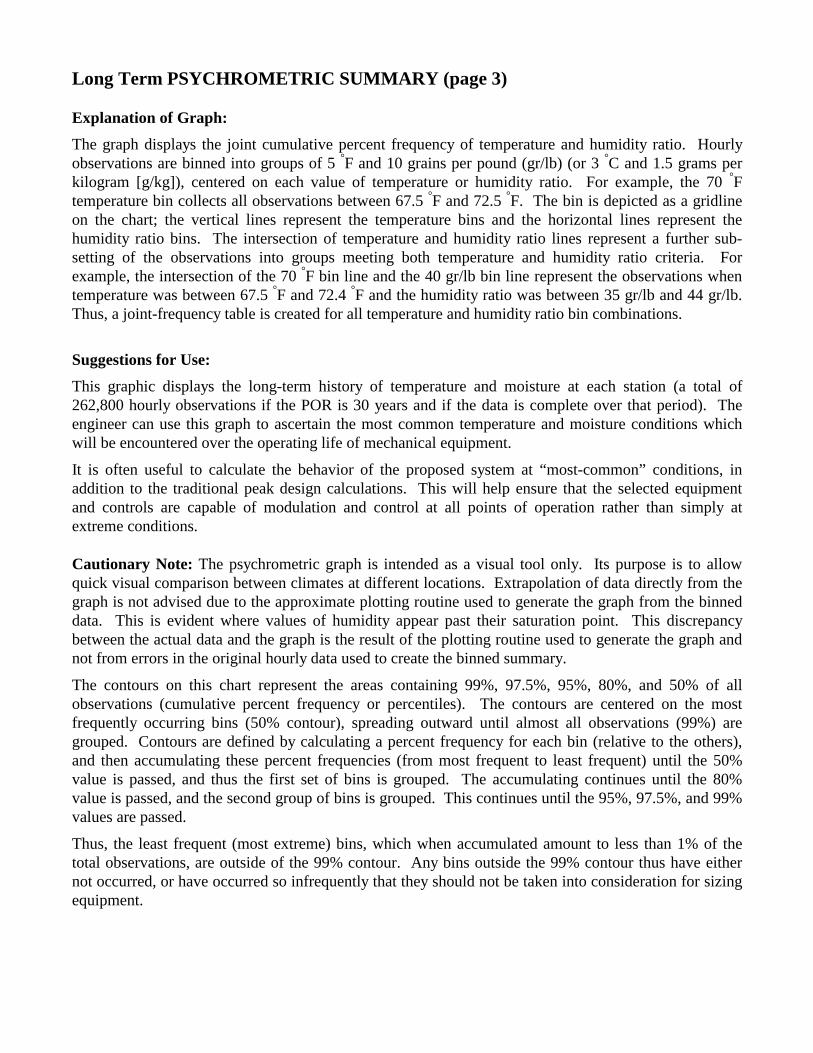
The graph displays the joint cumulative percent frequency of temperature and humidity ratio. Hourlyobservations are binned into groups of 5 °F and 10 grains per pound (gr/lb) (or 3 °C and 1.5 grams perkilogram [g/kg]), centered on each value of temperature or humidity ratio. For example, the 70 °Ftemperature bin collects all observations between 67.5 °F and 72.5 °F. The bin is depicted as a gridlineon the chart; the vertical lines represent the temperature bins and the horizontal lines represent thehumidity ratio bins. The intersection of temperature and humidity ratio lines represent a further sub-setting of the observations into groups meeting both temperature and humidity ratio criteria. Forexample, the intersection of the 70 °F bin line and the 40 gr/lb bin line represent the observations whentemperature was between 67.5 °F and 72.4 °F and the humidity ratio was between 35 gr/lb and 44 gr/lb.Thus, a joint-frequency table is created for all temperature and humidity ratio bin combinations.
Suggestions for Use:
This graphic displays the long-term history of temperature and moisture at each station (a total of262,800 hourly observations if the POR is 30 years and if the data is complete over that period). Theengineer can use this graph to ascertain the most common temperature and moisture conditions whichwill be encountered over the operating life of mechanical equipment.
It is often useful to calculate the behavior of the proposed system at “most-common” conditions, inaddition to the traditional peak design calculations. This will help ensure that the selected equipmentand controls are capable of modulation and control at all points of operation rather than simply atextreme conditions.
Cautionary Note: The psychrometric graph is intended as a visual tool only. Its purpose is to allowquick visual comparison between climates at different locations. Extrapolation of data directly from thegraph is not advised due to the approximate plotting routine used to generate the graph from the binneddata. This is evident where values of humidity appear past their saturation point. This discrepancybetween the actual data and the graph is the result of the plotting routine used to generate the graph andnot from errors in the original hourly data used to create the binned summary.
The contours on this chart represent the areas containing 99%, 97.5%, 95%, 80%, and 50% of allobservations (cumulative percent frequency or percentiles). The contours are centered on the mostfrequently occurring bins (50% contour), spreading outward until almost all observations (99%) aregrouped. Contours are defined by calculating a percent frequency for each bin (relative to the others),and then accumulating these percent frequencies (from most frequent to least frequent) until the 50%value is passed, and thus the first set of bins is grouped. The accumulating continues until the 80%value is passed, and the second group of bins is grouped. This continues until the 95%, 97.5%, and 99%values are passed.
Thus, the least frequent (most extreme) bins, which when accumulated amount to less than 1% of thetotal observations, are outside of the 99% contour. Any bins outside the 99% contour thus have eithernot occurred, or have occurred so infrequently that they should not be taken into consideration for sizingequipment.
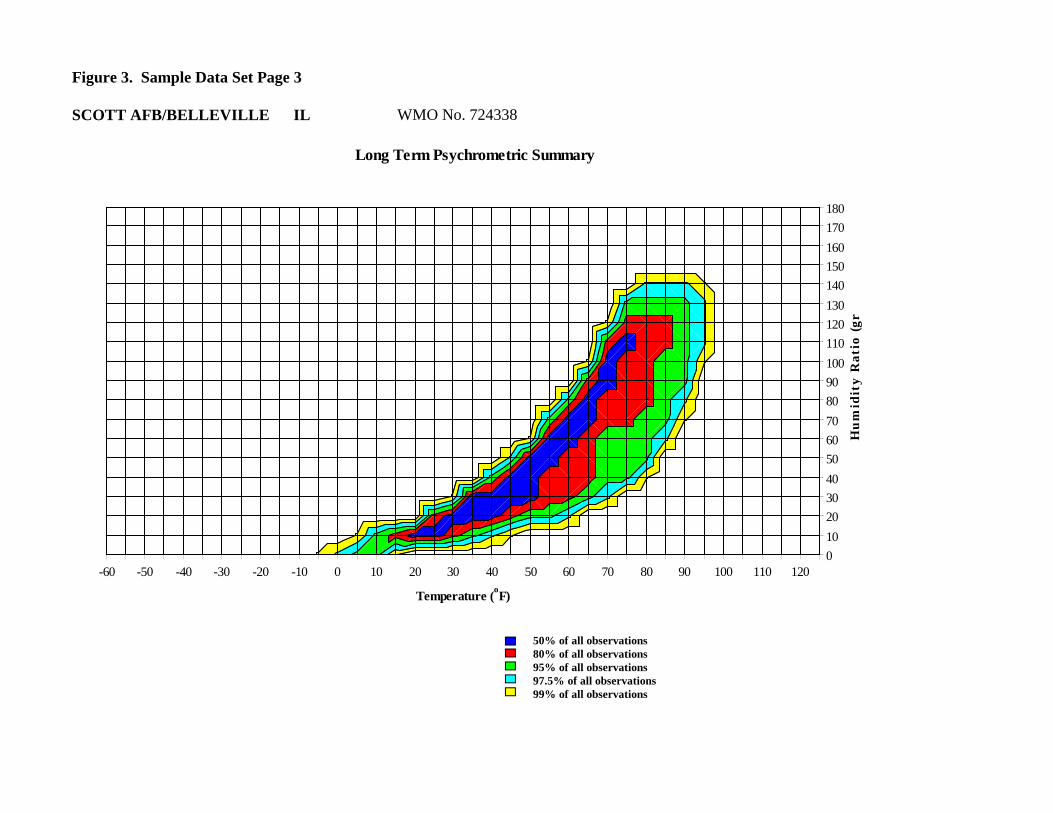
Figure 3. Sample Data Set Page 3
SCOTT AFB/BELLEVILLE IL WMO No. 724338
-60 -50 -40 -30 -20 -10 0 10 20 30 40 50 60 70 80 90 100 110 120010
203040
506070
8090100
110120130
140150160
170180
Temperature (oF)
Hum
idit
y R
atio
(gr
Long Term Psychrometric Summary
50% of all observations80% of all observations95% of all observations97.5% of all observations99% of all observations

PSYCHROMETRIC DISPLAY OF DESIGN VALUES
Explanation of Chart. Similar to Page 3, this chart depicts the saturation curve (when RH = 100%)along with peak design values. The design values are calculated as in the table on Page 1, but this chartshows their relationships graphically, depicting their position relative to each other and relative to thesaturation curve.
Above and to the left of saturation curve, RH would be greater than 100 percent (not possible). The areabelow and to the right of the curve (including the points on the curve itself) represent the area where RHis less than or equal to 100 percent, and thus where all observations occur. Note that since the humidityratio is a function of pressure, and pressure varies with elevation, different sites will have differentsaturation curves.
The dry bulb temperature is the horizontal coordinate on this scatter plot, and the humidity ratio is thevertical coordinate. Peak design values are depicted by the red square (1.0% Dry Bulb Temperature), thegreen circle (1.0% Humidity Ratio), and the blue diamond (99% Dry Bulb Temperature).
The table below the chart shows the exact values of 99% dry bulb temp, 1.0% humidity ratio, and 1.0%dry bulb temperature, along with calculated values of enthalpy, mean coincident wet bulb temperature,and humidity ratio (as applicable). The value of enthalpy coincident to each temperature/humidity ratiois created using the psychometric functions provided by the Linric Company, Bedford, New Hampshire.The dry bulb temperature and humidity ratios are used to calculate enthalpy using the Linric algorithms.
Figure 4. Sample Data Set Page 4
SCOTT AFB/BELLEVILLE IL WMO No. 724338
Psychrometric Summary of Peak Design Values
0
20
40
60
80
100
120
140
160
180
-60 -50 -40 -30 -20 -10 0 10 20 30 40 50 60 70 80 90 100 110 120
Temperature (oF)
Hum
idit
y R
atio
(gr
/
MCHR Enthalpy MCDB MCWB MC Dewpt Enthalpy(oF) (gr/lb) (btu/lb) 1.0% Humidity (gr/lb) (oF) (oF) (oF) (btu/lb)
99% Dry Bulb 9 5.6 3.0 Ratio 133.7 84.8 77.6 75 41.3
MCHR MCWB Enthalpy(oF) (gr/lb) (oF) (btu/lb)
1.0% Dry Bulb 92 113.8 76.3 40.0
BINNED TEMPERATURE DATA (pages 5-9)
Explanation of Tables. Identical to those in AFM 88-29, these tables show the number of hours thattemperatures in 5 ºF (3 ºC) bins occur during a given month, and during 8-hour periods during the daysof that month. The 8-hour periods are based upon a 24-hour clock and displayed in Local Standard Time(LST). The total numbers of observations (hours) in each temperature bin are summed horizontally inthe “Total Obs” column for the month. The mean coincident wet bulb temperature is the mean value ofall those wet bulb temperatures that occur coincidentally with the dry bulb temperatures in the particular5-degree temperature interval. At the upper or warmer end of the mean coincident wet bulb distribution,the values occasionally reverse their trend because the highest wet bulb temperatures do not necessarilyoccur with the highest dry bulb temperatures. There are thirteen such tables, one for each month, andone representing the overall annual summary (Data Set Page 9).
Suggestions for Use. Binned summaries are used by many different technical disciplines for differentpurposes. They are useful in making informal estimates of energy consumption by cooling and heatingequipment, and for gaining a general understanding of patterns of temperature and moisture at differenttimes of the day, month, and year.
Cautionary Note: Do not use these binned summaries to calculate moisture loads. These particularsummaries are based on the dry bulb temperature. After each of the one-hour observations has beenplaced into a dry bulb BIN, the average humidity ratio is calculated for all observations in each BIN.Consequently, dry bulb BINs underestimate the magnitude of dehumidification and humidificationloads, because the averaging calculation “flattens” the peaks and valleys of humidity ratios. The amountof the underestimation varies according to the desired humidity control level.
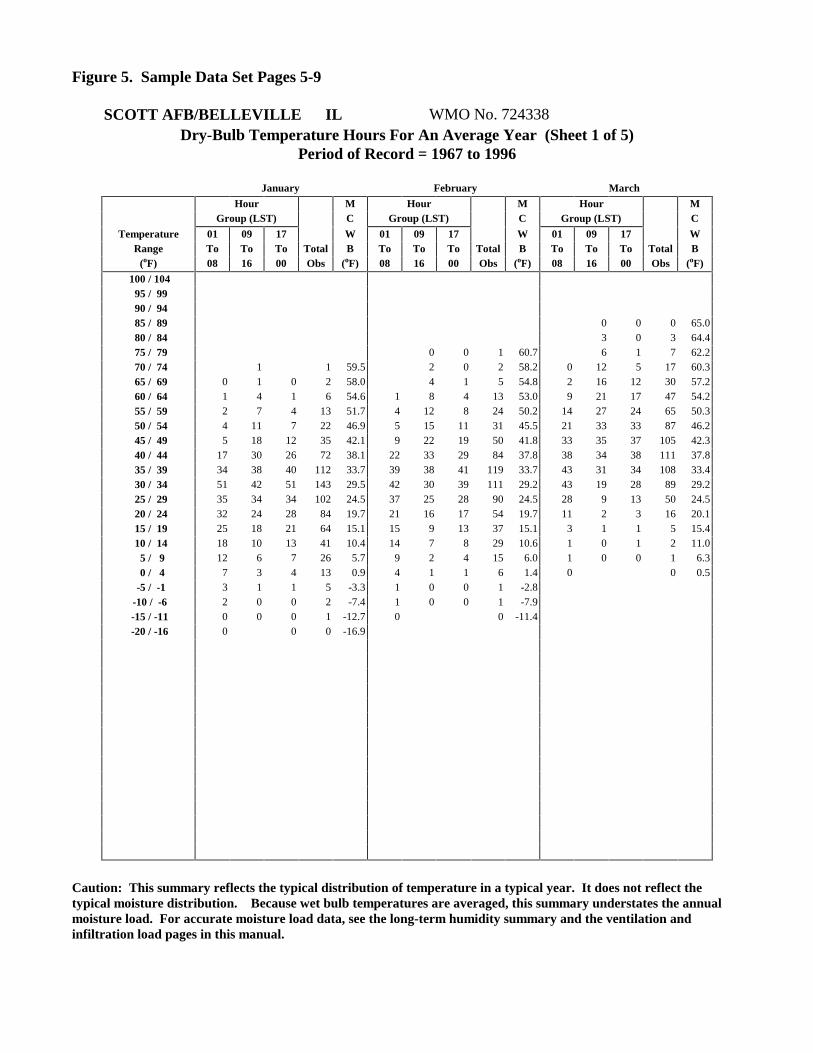
Figure 5. Sample Data Set Pages 5-9
SCOTT AFB/BELLEVILLE IL WMO No. 724338Dry-Bulb Temperature Hours For An Average Year (Sheet 1 of 5)
Period of Record = 1967 to 1996
January February March
Hour M Hour M Hour M Group (LST) C Group (LST) C Group (LST) C
Temperature 01 09 17 W 01 09 17 W 01 09 17 WRange To To To Total B To To To Total B To To To Total B
(oF) 08 16 00 Obs (oF) 08 16 00 Obs (oF) 08 16 00 Obs (oF)
100 / 104 95 / 99 90 / 94 85 / 89 0 0 0 65.0 80 / 84 3 0 3 64.4 75 / 79 0 0 1 60.7 6 1 7 62.2 70 / 74 1 1 59.5 2 0 2 58.2 0 12 5 17 60.3 65 / 69 0 1 0 2 58.0 4 1 5 54.8 2 16 12 30 57.2 60 / 64 1 4 1 6 54.6 1 8 4 13 53.0 9 21 17 47 54.2 55 / 59 2 7 4 13 51.7 4 12 8 24 50.2 14 27 24 65 50.3 50 / 54 4 11 7 22 46.9 5 15 11 31 45.5 21 33 33 87 46.2 45 / 49 5 18 12 35 42.1 9 22 19 50 41.8 33 35 37 105 42.3 40 / 44 17 30 26 72 38.1 22 33 29 84 37.8 38 34 38 111 37.8 35 / 39 34 38 40 112 33.7 39 38 41 119 33.7 43 31 34 108 33.4 30 / 34 51 42 51 143 29.5 42 30 39 111 29.2 43 19 28 89 29.2 25 / 29 35 34 34 102 24.5 37 25 28 90 24.5 28 9 13 50 24.5 20 / 24 32 24 28 84 19.7 21 16 17 54 19.7 11 2 3 16 20.1 15 / 19 25 18 21 64 15.1 15 9 13 37 15.1 3 1 1 5 15.4 10 / 14 18 10 13 41 10.4 14 7 8 29 10.6 1 0 1 2 11.0 5 / 9 12 6 7 26 5.7 9 2 4 15 6.0 1 0 0 1 6.3 0 / 4 7 3 4 13 0.9 4 1 1 6 1.4 0 0 0.5 -5 / -1 3 1 1 5 -3.3 1 0 0 1 -2.8 -10 / -6 2 0 0 2 -7.4 1 0 0 1 -7.9 -15 / -11 0 0 0 1 -12.7 0 0 -11.4 -20 / -16 0 0 0 -16.9
Caution: This summary reflects the typical distribution of temperature in a typical year. It does not reflect thetypical moisture distribution. Because wet bulb temperatures are averaged, this summary understates the annualmoisture load. For accurate moisture load data, see the long-term humidity summary and the ventilation andinfiltration load pages in this manual.
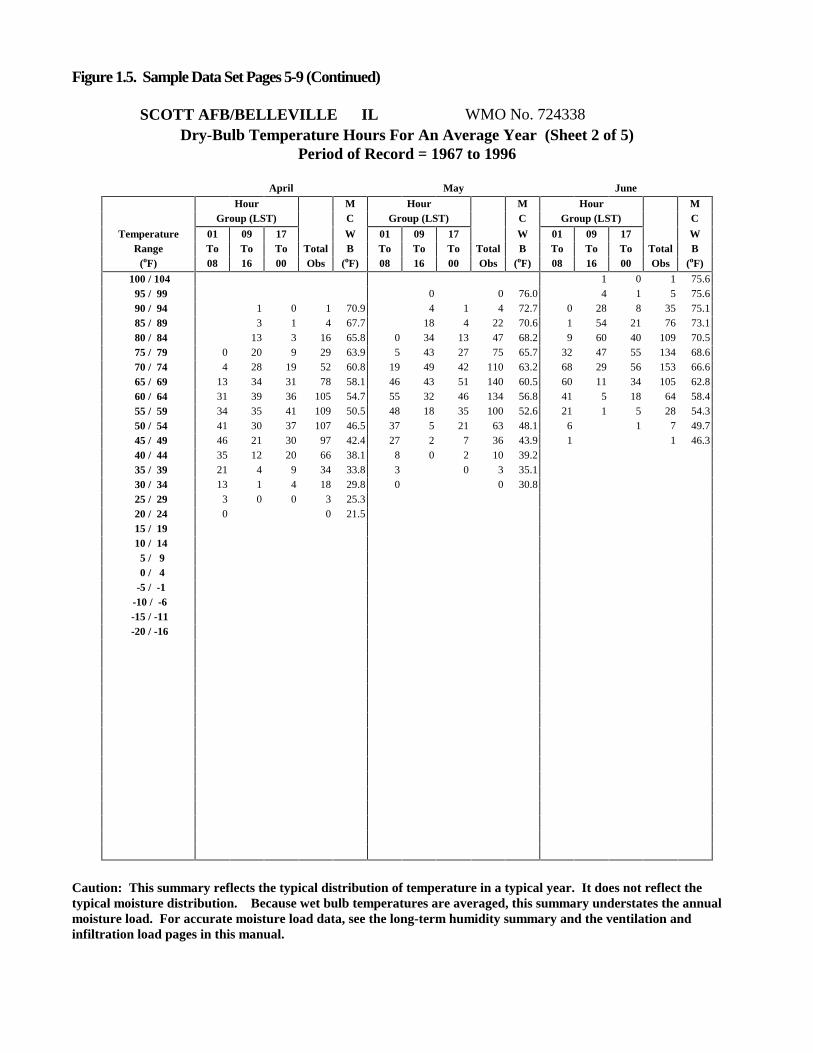
Figure 1.5. Sample Data Set Pages 5-9 (Continued)
SCOTT AFB/BELLEVILLE IL WMO No. 724338Dry-Bulb Temperature Hours For An Average Year (Sheet 2 of 5)
Period of Record = 1967 to 1996
April May June
Hour M Hour M Hour M Group (LST) C Group (LST) C Group (LST) C
Temperature 01 09 17 W 01 09 17 W 01 09 17 WRange To To To Total B To To To Total B To To To Total B
(oF) 08 16 00 Obs (oF) 08 16 00 Obs (oF) 08 16 00 Obs (oF)
100 / 104 1 0 1 75.6 95 / 99 0 0 76.0 4 1 5 75.6 90 / 94 1 0 1 70.9 4 1 4 72.7 0 28 8 35 75.1 85 / 89 3 1 4 67.7 18 4 22 70.6 1 54 21 76 73.1 80 / 84 13 3 16 65.8 0 34 13 47 68.2 9 60 40 109 70.5 75 / 79 0 20 9 29 63.9 5 43 27 75 65.7 32 47 55 134 68.6 70 / 74 4 28 19 52 60.8 19 49 42 110 63.2 68 29 56 153 66.6 65 / 69 13 34 31 78 58.1 46 43 51 140 60.5 60 11 34 105 62.8 60 / 64 31 39 36 105 54.7 55 32 46 134 56.8 41 5 18 64 58.4 55 / 59 34 35 41 109 50.5 48 18 35 100 52.6 21 1 5 28 54.3 50 / 54 41 30 37 107 46.5 37 5 21 63 48.1 6 1 7 49.7 45 / 49 46 21 30 97 42.4 27 2 7 36 43.9 1 1 46.3 40 / 44 35 12 20 66 38.1 8 0 2 10 39.2 35 / 39 21 4 9 34 33.8 3 0 3 35.1 30 / 34 13 1 4 18 29.8 0 0 30.8 25 / 29 3 0 0 3 25.3 20 / 24 0 0 21.5 15 / 19 10 / 14 5 / 9 0 / 4 -5 / -1 -10 / -6 -15 / -11 -20 / -16
Caution: This summary reflects the typical distribution of temperature in a typical year. It does not reflect thetypical moisture distribution. Because wet bulb temperatures are averaged, this summary understates the annualmoisture load. For accurate moisture load data, see the long-term humidity summary and the ventilation andinfiltration load pages in this manual.
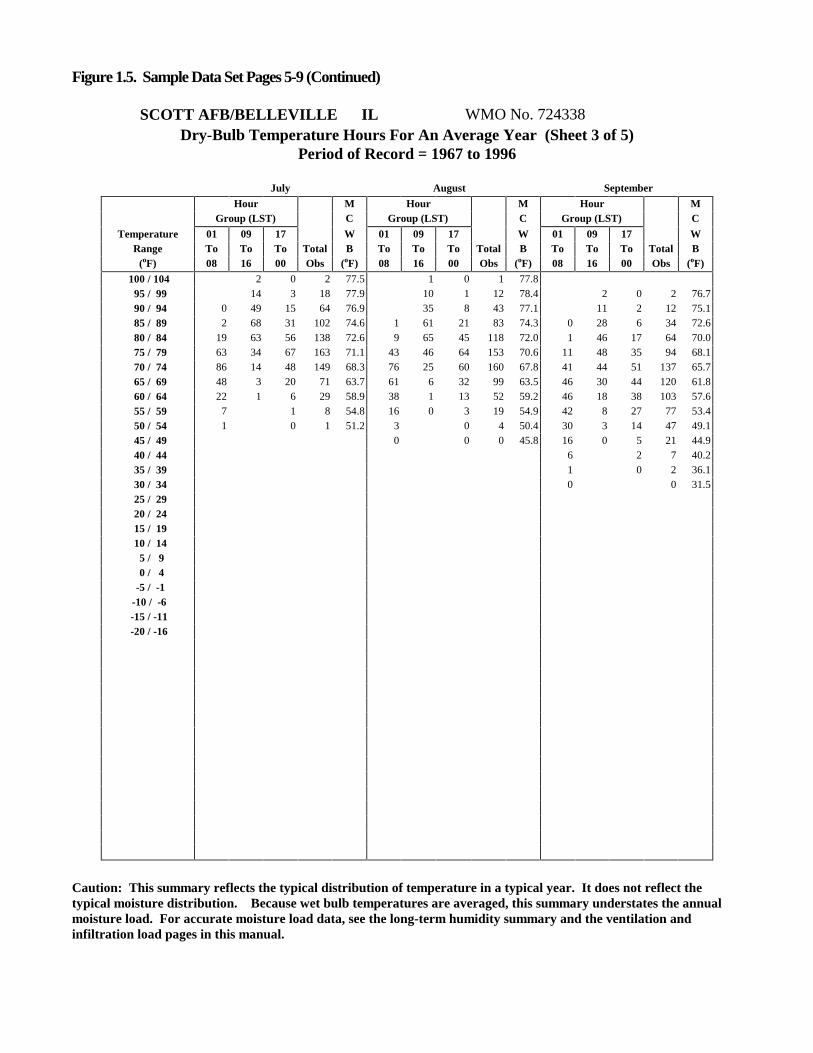
Figure 1.5. Sample Data Set Pages 5-9 (Continued)
SCOTT AFB/BELLEVILLE IL WMO No. 724338Dry-Bulb Temperature Hours For An Average Year (Sheet 3 of 5)
Period of Record = 1967 to 1996
July August September
Hour M Hour M Hour M Group (LST) C Group (LST) C Group (LST) C
Temperature 01 09 17 W 01 09 17 W 01 09 17 WRange To To To Total B To To To Total B To To To Total B
(oF) 08 16 00 Obs (oF) 08 16 00 Obs (oF) 08 16 00 Obs (oF)
100 / 104 2 0 2 77.5 1 0 1 77.8 95 / 99 14 3 18 77.9 10 1 12 78.4 2 0 2 76.7 90 / 94 0 49 15 64 76.9 35 8 43 77.1 11 2 12 75.1 85 / 89 2 68 31 102 74.6 1 61 21 83 74.3 0 28 6 34 72.6 80 / 84 19 63 56 138 72.6 9 65 45 118 72.0 1 46 17 64 70.0 75 / 79 63 34 67 163 71.1 43 46 64 153 70.6 11 48 35 94 68.1 70 / 74 86 14 48 149 68.3 76 25 60 160 67.8 41 44 51 137 65.7 65 / 69 48 3 20 71 63.7 61 6 32 99 63.5 46 30 44 120 61.8 60 / 64 22 1 6 29 58.9 38 1 13 52 59.2 46 18 38 103 57.6 55 / 59 7 1 8 54.8 16 0 3 19 54.9 42 8 27 77 53.4 50 / 54 1 0 1 51.2 3 0 4 50.4 30 3 14 47 49.1 45 / 49 0 0 0 45.8 16 0 5 21 44.9 40 / 44 6 2 7 40.2 35 / 39 1 0 2 36.1 30 / 34 0 0 31.5 25 / 29 20 / 24 15 / 19 10 / 14 5 / 9 0 / 4 -5 / -1 -10 / -6 -15 / -11 -20 / -16
Caution: This summary reflects the typical distribution of temperature in a typical year. It does not reflect thetypical moisture distribution. Because wet bulb temperatures are averaged, this summary understates the annualmoisture load. For accurate moisture load data, see the long-term humidity summary and the ventilation andinfiltration load pages in this manual.
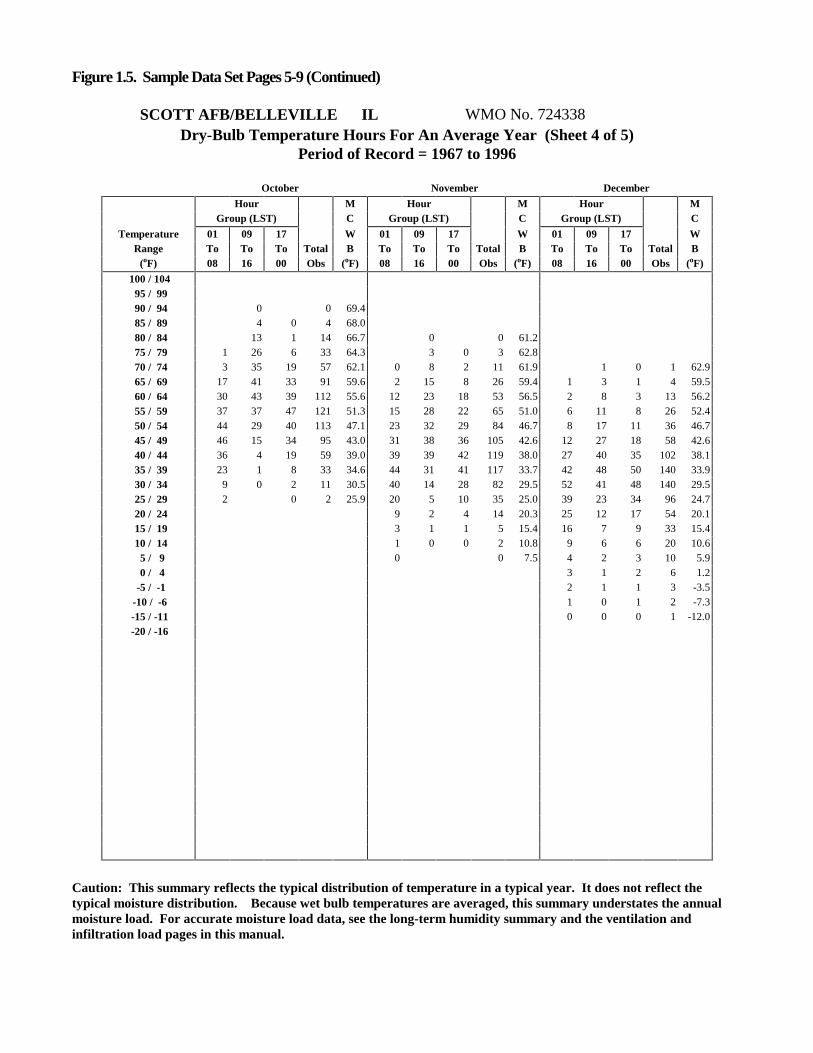
Figure 1.5. Sample Data Set Pages 5-9 (Continued)
SCOTT AFB/BELLEVILLE IL WMO No. 724338Dry-Bulb Temperature Hours For An Average Year (Sheet 4 of 5)
Period of Record = 1967 to 1996
October November December
Hour M Hour M Hour M Group (LST) C Group (LST) C Group (LST) C
Temperature 01 09 17 W 01 09 17 W 01 09 17 WRange To To To Total B To To To Total B To To To Total B
(oF) 08 16 00 Obs (oF) 08 16 00 Obs (oF) 08 16 00 Obs (oF)
100 / 104 95 / 99 90 / 94 0 0 69.4 85 / 89 4 0 4 68.0 80 / 84 13 1 14 66.7 0 0 61.2 75 / 79 1 26 6 33 64.3 3 0 3 62.8 70 / 74 3 35 19 57 62.1 0 8 2 11 61.9 1 0 1 62.9 65 / 69 17 41 33 91 59.6 2 15 8 26 59.4 1 3 1 4 59.5 60 / 64 30 43 39 112 55.6 12 23 18 53 56.5 2 8 3 13 56.2 55 / 59 37 37 47 121 51.3 15 28 22 65 51.0 6 11 8 26 52.4 50 / 54 44 29 40 113 47.1 23 32 29 84 46.7 8 17 11 36 46.7 45 / 49 46 15 34 95 43.0 31 38 36 105 42.6 12 27 18 58 42.6 40 / 44 36 4 19 59 39.0 39 39 42 119 38.0 27 40 35 102 38.1 35 / 39 23 1 8 33 34.6 44 31 41 117 33.7 42 48 50 140 33.9 30 / 34 9 0 2 11 30.5 40 14 28 82 29.5 52 41 48 140 29.5 25 / 29 2 0 2 25.9 20 5 10 35 25.0 39 23 34 96 24.7 20 / 24 9 2 4 14 20.3 25 12 17 54 20.1 15 / 19 3 1 1 5 15.4 16 7 9 33 15.4 10 / 14 1 0 0 2 10.8 9 6 6 20 10.6 5 / 9 0 0 7.5 4 2 3 10 5.9 0 / 4 3 1 2 6 1.2 -5 / -1 2 1 1 3 -3.5 -10 / -6 1 0 1 2 -7.3 -15 / -11 0 0 0 1 -12.0 -20 / -16
Caution: This summary reflects the typical distribution of temperature in a typical year. It does not reflect thetypical moisture distribution. Because wet bulb temperatures are averaged, this summary understates the annualmoisture load. For accurate moisture load data, see the long-term humidity summary and the ventilation andinfiltration load pages in this manual.
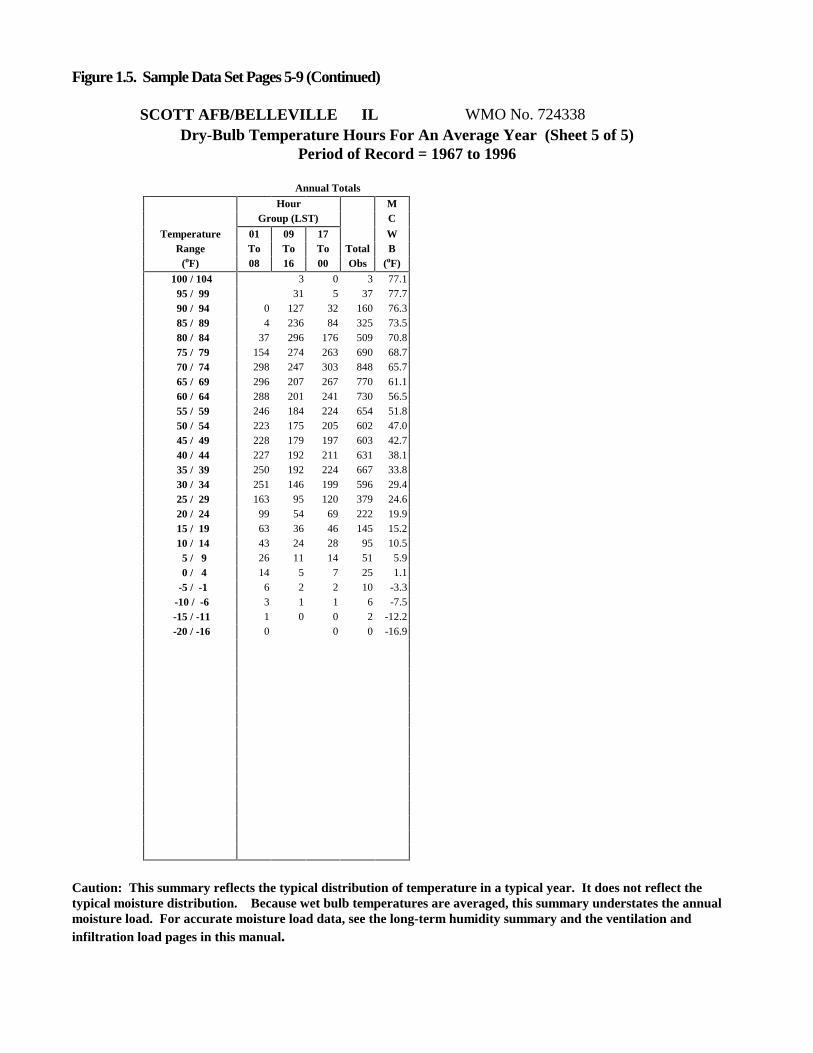
Figure 1.5. Sample Data Set Pages 5-9 (Continued)
SCOTT AFB/BELLEVILLE IL WMO No. 724338Dry-Bulb Temperature Hours For An Average Year (Sheet 5 of 5)
Period of Record = 1967 to 1996
Annual Totals
Hour M Group (LST) C
Temperature 01 09 17 WRange To To To Total B
(oF) 08 16 00 Obs (oF)
100 / 104 3 0 3 77.1 95 / 99 31 5 37 77.7 90 / 94 0 127 32 160 76.3 85 / 89 4 236 84 325 73.5 80 / 84 37 296 176 509 70.8 75 / 79 154 274 263 690 68.7 70 / 74 298 247 303 848 65.7 65 / 69 296 207 267 770 61.1 60 / 64 288 201 241 730 56.5 55 / 59 246 184 224 654 51.8 50 / 54 223 175 205 602 47.0 45 / 49 228 179 197 603 42.7 40 / 44 227 192 211 631 38.1 35 / 39 250 192 224 667 33.8 30 / 34 251 146 199 596 29.4 25 / 29 163 95 120 379 24.6 20 / 24 99 54 69 222 19.9 15 / 19 63 36 46 145 15.2 10 / 14 43 24 28 95 10.5 5 / 9 26 11 14 51 5.9 0 / 4 14 5 7 25 1.1 -5 / -1 6 2 2 10 -3.3 -10 / -6 3 1 1 6 -7.5 -15 / -11 1 0 0 2 -12.2 -20 / -16 0 0 0 -16.9
Caution: This summary reflects the typical distribution of temperature in a typical year. It does not reflect thetypical moisture distribution. Because wet bulb temperatures are averaged, this summary understates the annualmoisture load. For accurate moisture load data, see the long-term humidity summary and the ventilation andinfiltration load pages in this manual.
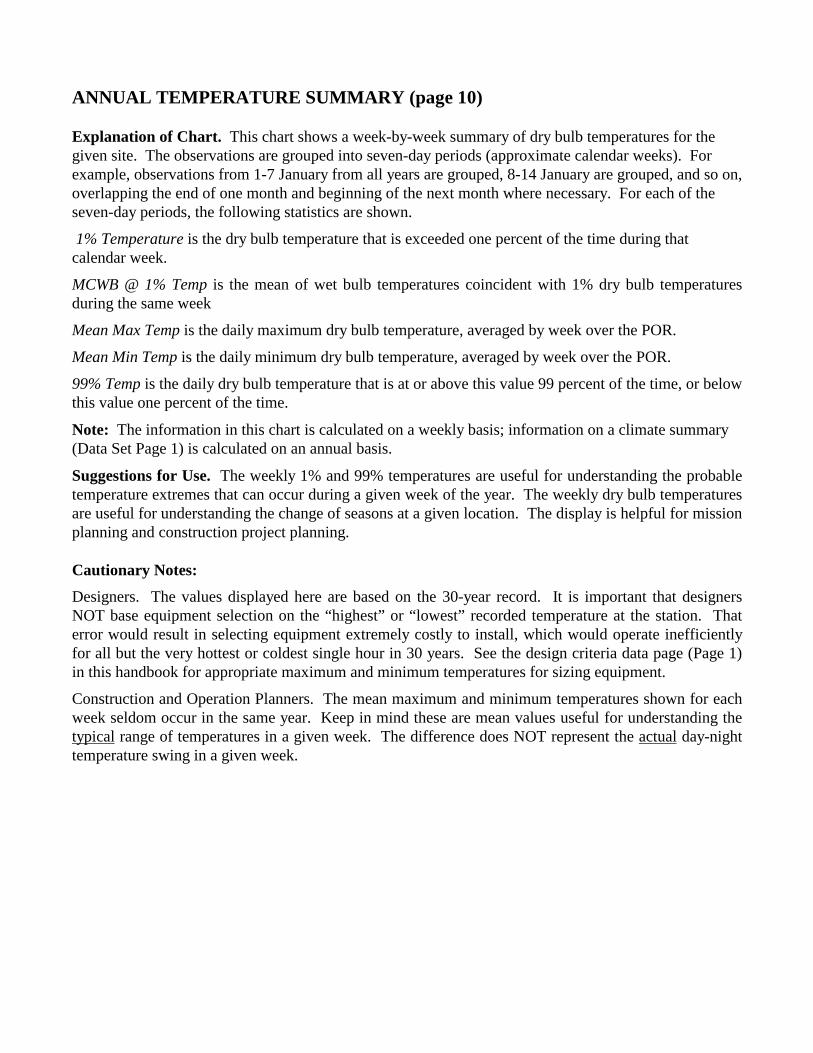
ANNUAL TEMPERATURE SUMMARY (page 10)
Explanation of Chart. This chart shows a week-by-week summary of dry bulb temperatures for thegiven site. The observations are grouped into seven-day periods (approximate calendar weeks). Forexample, observations from 1-7 January from all years are grouped, 8-14 January are grouped, and so on,overlapping the end of one month and beginning of the next month where necessary. For each of theseven-day periods, the following statistics are shown.
1% Temperature is the dry bulb temperature that is exceeded one percent of the time during thatcalendar week.
MCWB @ 1% Temp is the mean of wet bulb temperatures coincident with 1% dry bulb temperaturesduring the same week
Mean Max Temp is the daily maximum dry bulb temperature, averaged by week over the POR.
Mean Min Temp is the daily minimum dry bulb temperature, averaged by week over the POR.
99% Temp is the daily dry bulb temperature that is at or above this value 99 percent of the time, or belowthis value one percent of the time.
Note: The information in this chart is calculated on a weekly basis; information on a climate summary(Data Set Page 1) is calculated on an annual basis.
Suggestions for Use. The weekly 1% and 99% temperatures are useful for understanding the probabletemperature extremes that can occur during a given week of the year. The weekly dry bulb temperaturesare useful for understanding the change of seasons at a given location. The display is helpful for missionplanning and construction project planning.
Cautionary Notes:
Designers. The values displayed here are based on the 30-year record. It is important that designersNOT base equipment selection on the “highest” or “lowest” recorded temperature at the station. Thaterror would result in selecting equipment extremely costly to install, which would operate inefficientlyfor all but the very hottest or coldest single hour in 30 years. See the design criteria data page (Page 1)in this handbook for appropriate maximum and minimum temperatures for sizing equipment.
Construction and Operation Planners. The mean maximum and minimum temperatures shown for eachweek seldom occur in the same year. Keep in mind these are mean values useful for understanding thetypical range of temperatures in a given week. The difference does NOT represent the actual day-nighttemperature swing in a given week.
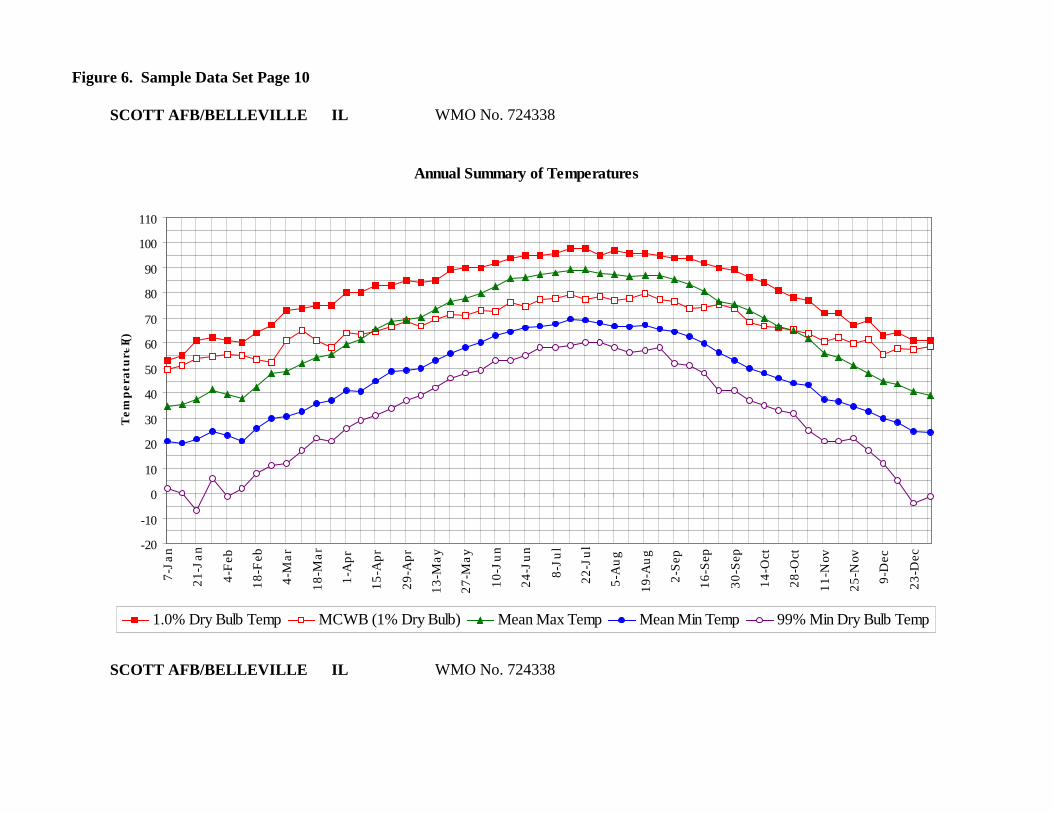
Figure 6. Sample Data Set Page 10
SCOTT AFB/BELLEVILLE IL WMO No. 724338
Annual Summary of Temperatures
-20
-10
0
10
20
30
40
50
60
70
80
90
100
110
7-Ja
n
21-J
an
4-F
eb
18-F
eb
4-M
ar
18-M
ar
1-A
pr
15-A
pr
29-A
pr
13-M
ay
27-M
ay
10-J
un
24-J
un
8-Ju
l
22-J
ul
5-A
ug
19-A
ug
2-S
ep
16-S
ep
30-S
ep
14-O
ct
28-O
ct
11-N
ov
25-N
ov
9-D
ec
23-D
ec
Tem
per
ature
(F)
1.0% Dry Bulb Temp MCWB (1% Dry Bulb) Mean Max Temp Mean Min Temp 99% Min Dry Bulb Temp
SCOTT AFB/BELLEVILLE IL WMO No. 724338

ANNUAL HUMIDITY SUMMARY (page 11)
Explanation of Chart. Similar to the annual temperature summary (Data Set Page 10), this chartdepicts mean maximum and minimum values of humidity ratio, plus the 1% maximum humidity ratio,along with its mean coincident dry bulb temperature, summarized by calendar week. The chart uses twovertical axes: On the left are the humidity ratio values and on the right is a temperature scale for themean coincident dry bulb temperature.
Suggestions for Use. Weekly humidity ratios are useful for understanding the change of seasons at agiven location, and the probable high and low moisture levels during a given week of the year. Thedisplay is helpful for planning humidity-controlled storage projects, and for understanding factorscontributing to atmospheric corrosion. Humidity also affects the deterioration rate of building materialsand weathering of military equipment and structures exposed to the elements.
Cautionary Notes:
Designers. The values displayed here are based on the 30-year record. It is important that designersNOT base equipment selection on the “highest” or “lowest” recorded humidity at the station. That errorwould result in selecting oversized equipment, which would increase costs and may result in controlproblems at other than extreme conditions. Use design values on Data Set Page 1 for equipment sizing.
Construction and Operation Planners. The high and low humidity ratios shown for each week seldomoccur in the same year. Keep in mind that these are mean values that are useful for understanding thetypical range of humidity ratio in a given week. The difference does NOT represent the actual day-nighthumidity ratio swing in a given week.
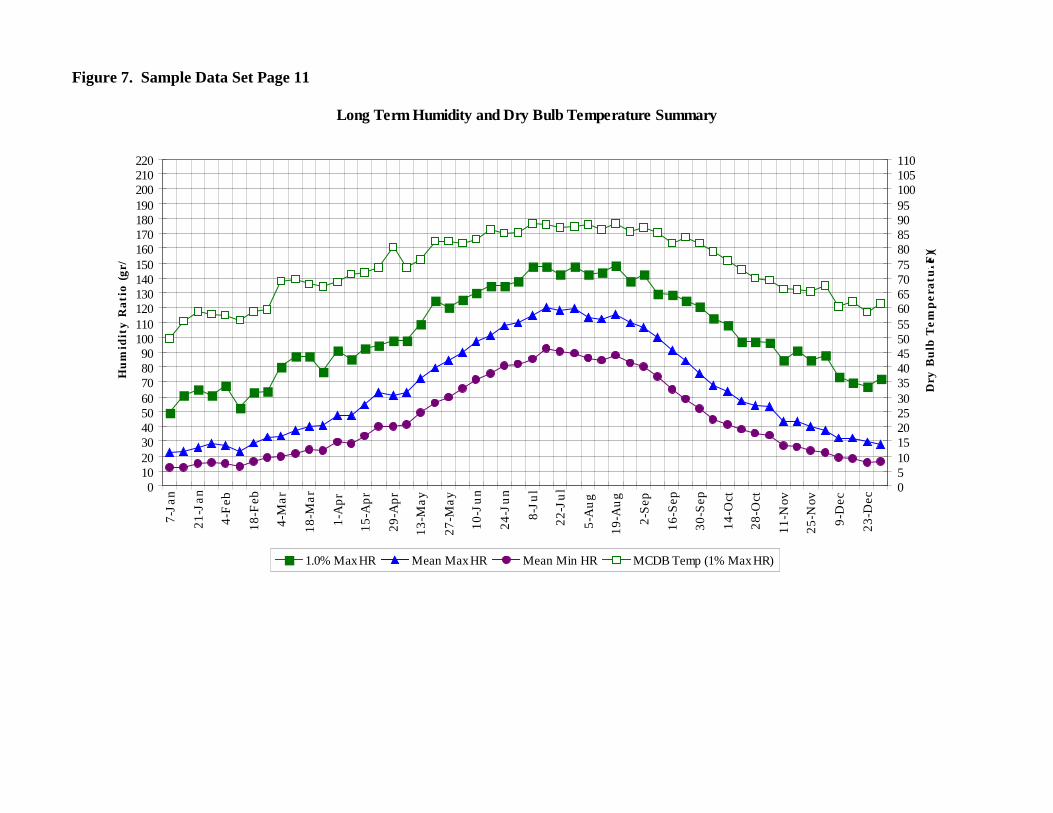
Figure 7. Sample Data Set Page 11
Long Term Humidity and Dry Bulb Temperature Summary
0102030405060708090
100110120130140150160170180190200210220
7-Ja
n
21-J
an
4-F
eb
18-F
eb
4-M
ar
18-M
ar
1-A
pr
15-A
pr
29-A
pr
13-M
ay
27-M
ay
10-J
un
24-J
un
8-Ju
l
22-J
ul
5-A
ug
19-A
ug
2-S
ep
16-S
ep
30-S
ep
14-O
ct
28-O
ct
11-N
ov
25-N
ov
9-D
ec
23-D
ec
Hum
idit
y R
atio
(gr
/
05101520253035404550556065707580859095100105110
Dry
Bulb
Tem
per
ature
(F)
1.0% Max HR Mean Max HR Mean Min HR MCDB Temp (1% Max HR)
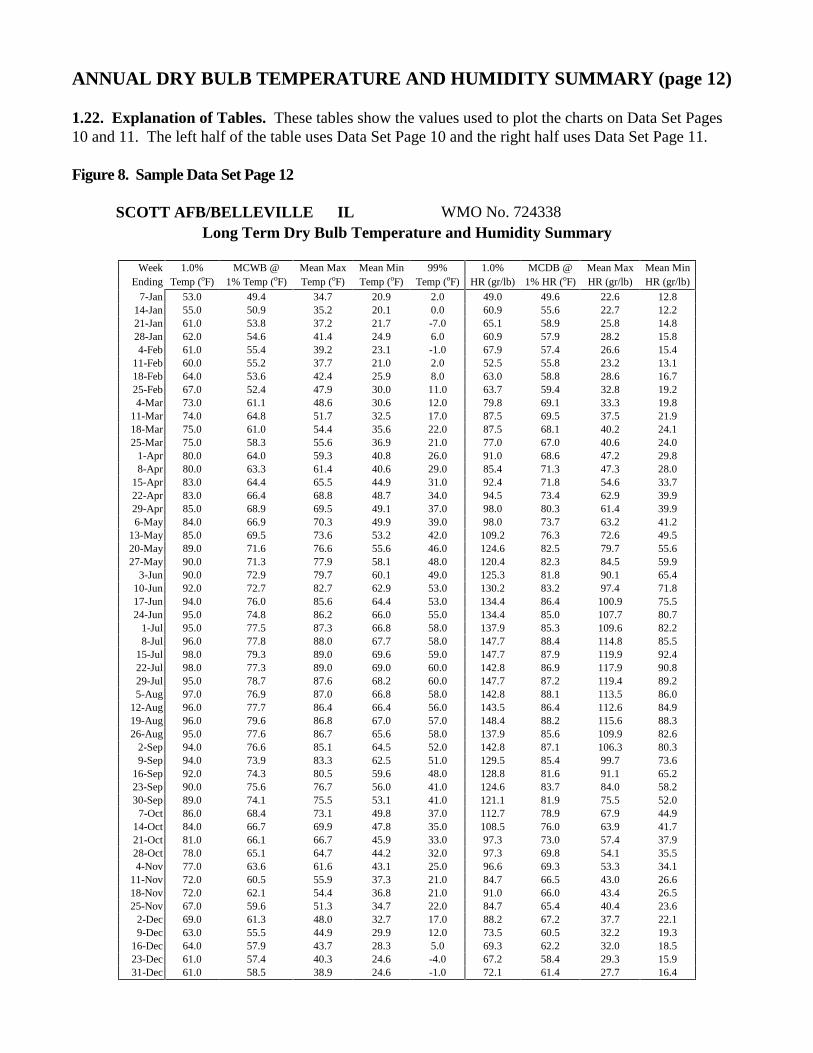
ANNUAL DRY BULB TEMPERATURE AND HUMIDITY SUMMARY (page 12)
1.22. Explanation of Tables. These tables show the values used to plot the charts on Data Set Pages10 and 11. The left half of the table uses Data Set Page 10 and the right half uses Data Set Page 11.
Figure 8. Sample Data Set Page 12
SCOTT AFB/BELLEVILLE IL WMO No. 724338Long Term Dry Bulb Temperature and Humidity Summary
Week 1.0% MCWB @ Mean Max Mean Min 99% 1.0% MCDB @ Mean Max Mean MinEnding Temp (oF) 1% Temp (oF) Temp (oF) Temp (oF) Temp (oF) HR (gr/lb) 1% HR (oF) HR (gr/lb) HR (gr/lb)
7-Jan 53.0 49.4 34.7 20.9 2.0 49.0 49.6 22.6 12.814-Jan 55.0 50.9 35.2 20.1 0.0 60.9 55.6 22.7 12.221-Jan 61.0 53.8 37.2 21.7 -7.0 65.1 58.9 25.8 14.828-Jan 62.0 54.6 41.4 24.9 6.0 60.9 57.9 28.2 15.84-Feb 61.0 55.4 39.2 23.1 -1.0 67.9 57.4 26.6 15.4
11-Feb 60.0 55.2 37.7 21.0 2.0 52.5 55.8 23.2 13.118-Feb 64.0 53.6 42.4 25.9 8.0 63.0 58.8 28.6 16.725-Feb 67.0 52.4 47.9 30.0 11.0 63.7 59.4 32.8 19.24-Mar 73.0 61.1 48.6 30.6 12.0 79.8 69.1 33.3 19.8
11-Mar 74.0 64.8 51.7 32.5 17.0 87.5 69.5 37.5 21.918-Mar 75.0 61.0 54.4 35.6 22.0 87.5 68.1 40.2 24.125-Mar 75.0 58.3 55.6 36.9 21.0 77.0 67.0 40.6 24.0
1-Apr 80.0 64.0 59.3 40.8 26.0 91.0 68.6 47.2 29.88-Apr 80.0 63.3 61.4 40.6 29.0 85.4 71.3 47.3 28.0
15-Apr 83.0 64.4 65.5 44.9 31.0 92.4 71.8 54.6 33.722-Apr 83.0 66.4 68.8 48.7 34.0 94.5 73.4 62.9 39.929-Apr 85.0 68.9 69.5 49.1 37.0 98.0 80.3 61.4 39.96-May 84.0 66.9 70.3 49.9 39.0 98.0 73.7 63.2 41.2
13-May 85.0 69.5 73.6 53.2 42.0 109.2 76.3 72.6 49.520-May 89.0 71.6 76.6 55.6 46.0 124.6 82.5 79.7 55.627-May 90.0 71.3 77.9 58.1 48.0 120.4 82.3 84.5 59.9
3-Jun 90.0 72.9 79.7 60.1 49.0 125.3 81.8 90.1 65.410-Jun 92.0 72.7 82.7 62.9 53.0 130.2 83.2 97.4 71.817-Jun 94.0 76.0 85.6 64.4 53.0 134.4 86.4 100.9 75.524-Jun 95.0 74.8 86.2 66.0 55.0 134.4 85.0 107.7 80.7
1-Jul 95.0 77.5 87.3 66.8 58.0 137.9 85.3 109.6 82.28-Jul 96.0 77.8 88.0 67.7 58.0 147.7 88.4 114.8 85.5
15-Jul 98.0 79.3 89.0 69.6 59.0 147.7 87.9 119.9 92.422-Jul 98.0 77.3 89.0 69.0 60.0 142.8 86.9 117.9 90.829-Jul 95.0 78.7 87.6 68.2 60.0 147.7 87.2 119.4 89.25-Aug 97.0 76.9 87.0 66.8 58.0 142.8 88.1 113.5 86.0
12-Aug 96.0 77.7 86.4 66.4 56.0 143.5 86.4 112.6 84.919-Aug 96.0 79.6 86.8 67.0 57.0 148.4 88.2 115.6 88.326-Aug 95.0 77.6 86.7 65.6 58.0 137.9 85.6 109.9 82.6
2-Sep 94.0 76.6 85.1 64.5 52.0 142.8 87.1 106.3 80.39-Sep 94.0 73.9 83.3 62.5 51.0 129.5 85.4 99.7 73.6
16-Sep 92.0 74.3 80.5 59.6 48.0 128.8 81.6 91.1 65.223-Sep 90.0 75.6 76.7 56.0 41.0 124.6 83.7 84.0 58.230-Sep 89.0 74.1 75.5 53.1 41.0 121.1 81.9 75.5 52.0
7-Oct 86.0 68.4 73.1 49.8 37.0 112.7 78.9 67.9 44.914-Oct 84.0 66.7 69.9 47.8 35.0 108.5 76.0 63.9 41.721-Oct 81.0 66.1 66.7 45.9 33.0 97.3 73.0 57.4 37.928-Oct 78.0 65.1 64.7 44.2 32.0 97.3 69.8 54.1 35.54-Nov 77.0 63.6 61.6 43.1 25.0 96.6 69.3 53.3 34.1
11-Nov 72.0 60.5 55.9 37.3 21.0 84.7 66.5 43.0 26.618-Nov 72.0 62.1 54.4 36.8 21.0 91.0 66.0 43.4 26.525-Nov 67.0 59.6 51.3 34.7 22.0 84.7 65.4 40.4 23.6
2-Dec 69.0 61.3 48.0 32.7 17.0 88.2 67.2 37.7 22.19-Dec 63.0 55.5 44.9 29.9 12.0 73.5 60.5 32.2 19.3
16-Dec 64.0 57.9 43.7 28.3 5.0 69.3 62.2 32.0 18.523-Dec 61.0 57.4 40.3 24.6 -4.0 67.2 58.4 29.3 15.931-Dec 61.0 58.5 38.9 24.6 -1.0 72.1 61.4 27.7 16.4

BUILDING ENVELOPE LOADS (page 13)
Explanation of Charts:
Cooling degree-days are derived by multiplying the number of hours that the outdoor temperature isabove 65 °F (18 ºC) times the number of degrees of that temperature difference. For example, if onehour was observed at a temperature of 78 °F, that observation adds 13 degree-hours to the annual total.The sum of the degree-hours is divided by 24 to yield degree-days.
Heating degree-days are calculated similarly, against an inside temperature of 65 °F. So a one-hourobservation of 62 °F adds 3 degree-hours to the annual total. Heating degree-days are summedseparately from the cooling degree-days. Hot and cold hours do not cancel each other out, as bothheating and cooling conditions may occur over the course of a given day.
Suggestions for Use. Degree-days are used to estimate the sensible heat and sensible cooling loads onthe building envelope. Degree-day loads can be used to estimate the annual energy consumption of abuilding, provided that the loads from ventilation and infiltration air are also considered (see nextsection).
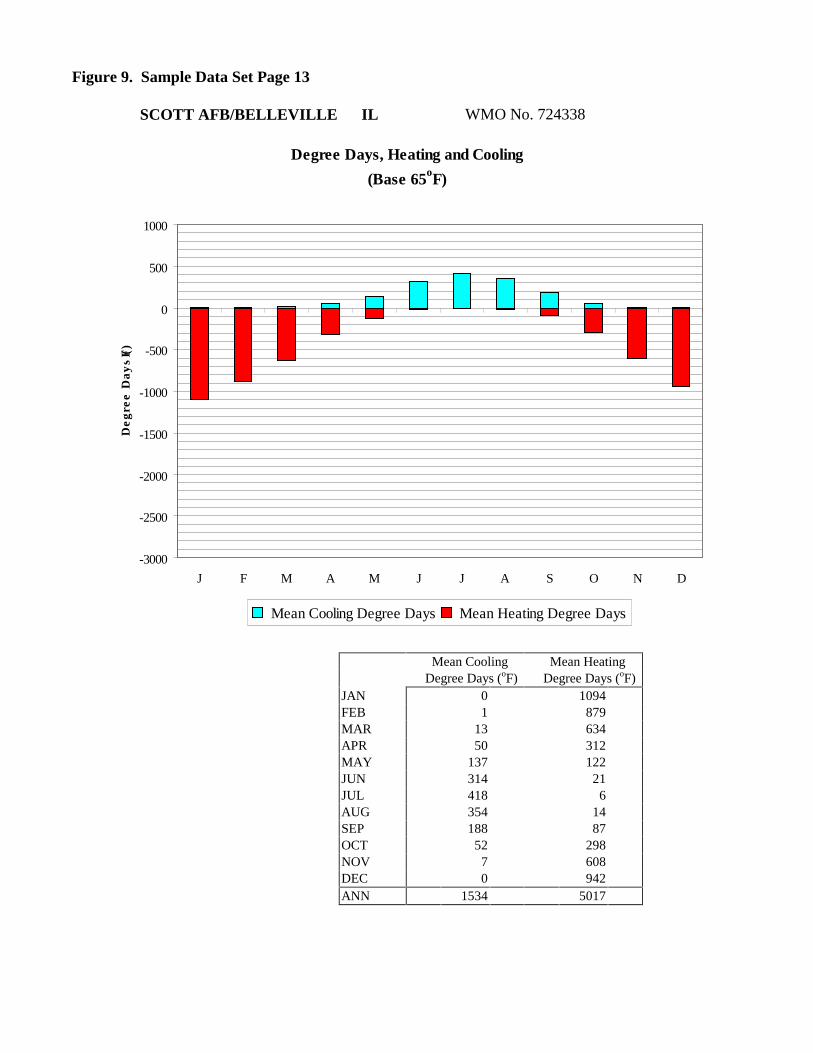
Figure 9. Sample Data Set Page 13
SCOTT AFB/BELLEVILLE IL WMO No. 724338
Degree Days, Heating and Cooling
(Base 65oF)
-3000
-2500
-2000
-1500
-1000
-500
0
500
1000
J F M A M J J A S O N D
Deg
ree
Day
s (F)
Mean Cooling Degree Days Mean Heating Degree Days
Mean Cooling Mean Heating Degree Days (oF) Degree Days (oF)
JAN 0 1094FEB 1 879MAR 13 634APR 50 312MAY 137 122JUN 314 21JUL 418 6AUG 354 14SEP 188 87OCT 52 298NOV 7 608DEC 0 942ANN 1534 5017
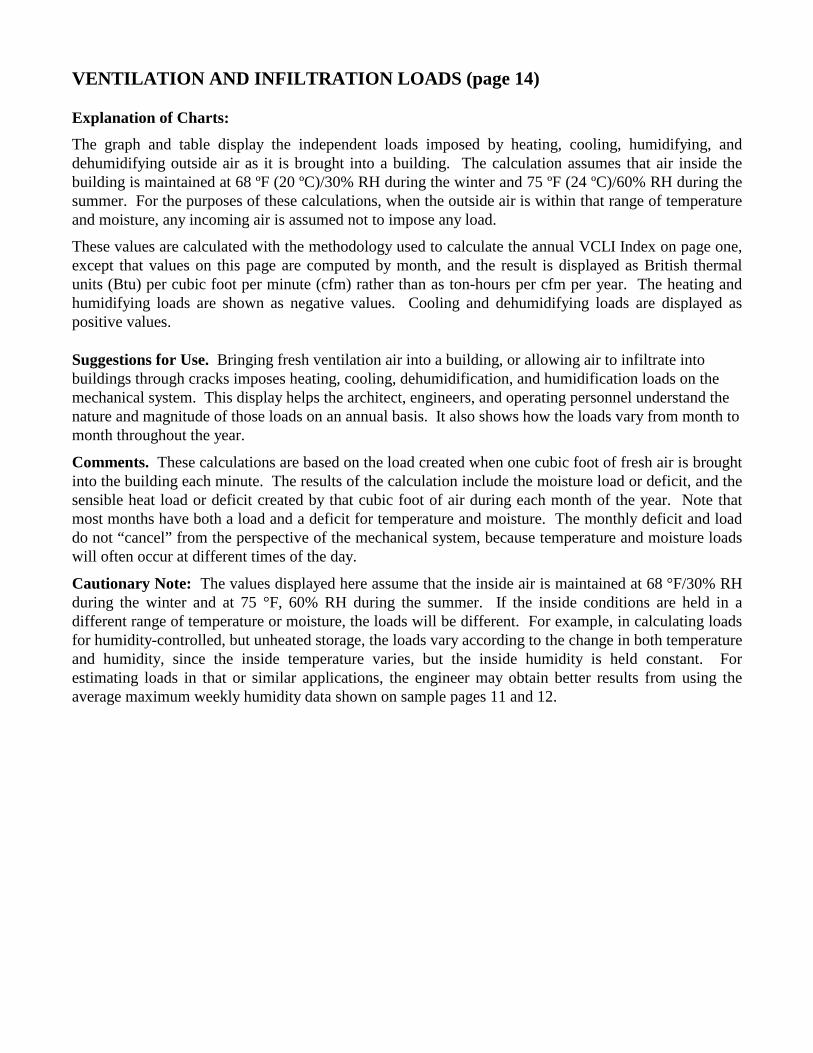
VENTILATION AND INFILTRATION LOADS (page 14)
Explanation of Charts:
The graph and table display the independent loads imposed by heating, cooling, humidifying, anddehumidifying outside air as it is brought into a building. The calculation assumes that air inside thebuilding is maintained at 68 ºF (20 ºC)/30% RH during the winter and 75 ºF (24 ºC)/60% RH during thesummer. For the purposes of these calculations, when the outside air is within that range of temperatureand moisture, any incoming air is assumed not to impose any load.
These values are calculated with the methodology used to calculate the annual VCLI Index on page one,except that values on this page are computed by month, and the result is displayed as British thermalunits (Btu) per cubic foot per minute (cfm) rather than as ton-hours per cfm per year. The heating andhumidifying loads are shown as negative values. Cooling and dehumidifying loads are displayed aspositive values.
Suggestions for Use. Bringing fresh ventilation air into a building, or allowing air to infiltrate intobuildings through cracks imposes heating, cooling, dehumidification, and humidification loads on themechanical system. This display helps the architect, engineers, and operating personnel understand thenature and magnitude of those loads on an annual basis. It also shows how the loads vary from month tomonth throughout the year.
Comments. These calculations are based on the load created when one cubic foot of fresh air is broughtinto the building each minute. The results of the calculation include the moisture load or deficit, and thesensible heat load or deficit created by that cubic foot of air during each month of the year. Note thatmost months have both a load and a deficit for temperature and moisture. The monthly deficit and loaddo not “cancel” from the perspective of the mechanical system, because temperature and moisture loadswill often occur at different times of the day.
Cautionary Note: The values displayed here assume that the inside air is maintained at 68 °F/30% RHduring the winter and at 75 °F, 60% RH during the summer. If the inside conditions are held in adifferent range of temperature or moisture, the loads will be different. For example, in calculating loadsfor humidity-controlled, but unheated storage, the loads vary according to the change in both temperatureand humidity, since the inside temperature varies, but the inside humidity is held constant. Forestimating loads in that or similar applications, the engineer may obtain better results from using theaverage maximum weekly humidity data shown on sample pages 11 and 12.
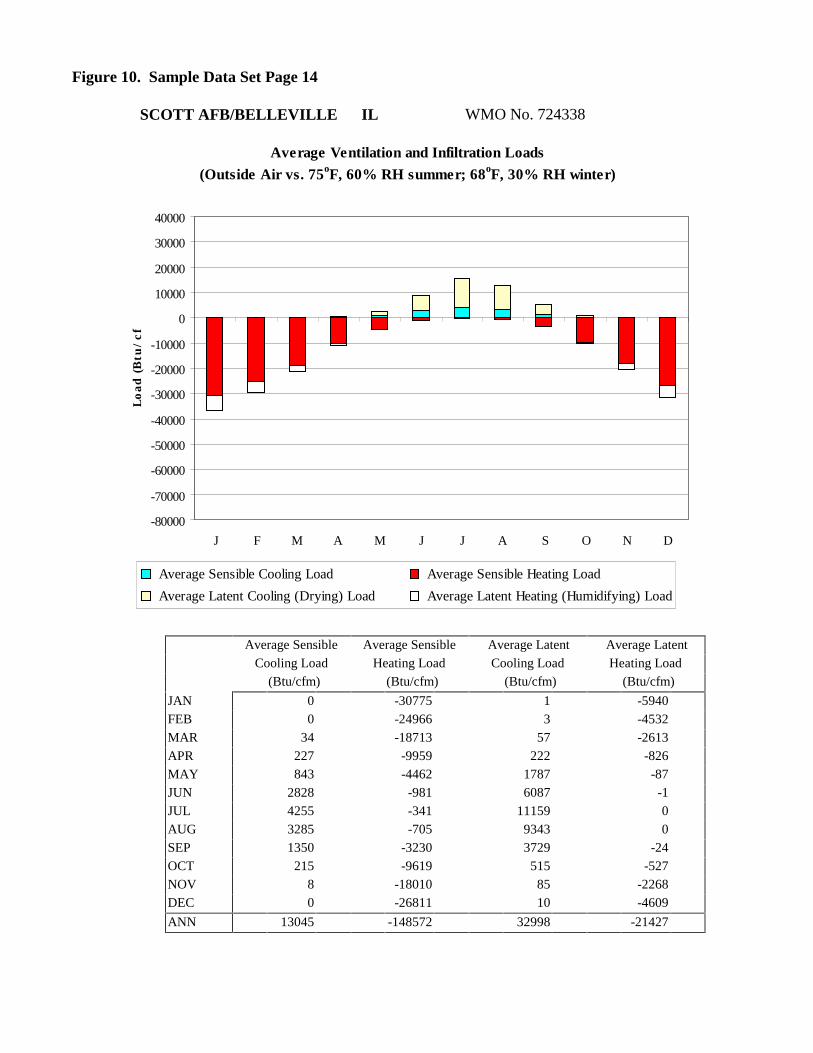
Figure 10. Sample Data Set Page 14
SCOTT AFB/BELLEVILLE IL WMO No. 724338
Average Ventilation and Infiltration Loads
(Outside Air vs. 75oF, 60% RH summer; 68oF, 30% RH winter)
-80000
-70000
-60000
-50000
-40000
-30000
-20000
-10000
0
10000
20000
30000
40000
J F M A M J J A S O N D
Load
(B
tu/cf
m
Average Sensible Cooling Load Average Sensible Heating Load
Average Latent Cooling (Drying) Load Average Latent Heating (Humidifying) Load
Average Sensible Average Sensible Average Latent Average Latent Cooling Load Heating Load Cooling Load Heating Load (Btu/cfm) (Btu/cfm) (Btu/cfm) (Btu/cfm)
JAN 0 -30775 1 -5940FEB 0 -24966 3 -4532MAR 34 -18713 57 -2613APR 227 -9959 222 -826MAY 843 -4462 1787 -87JUN 2828 -981 6087 -1JUL 4255 -341 11159 0AUG 3285 -705 9343 0SEP 1350 -3230 3729 -24OCT 215 -9619 515 -527NOV 8 -18010 85 -2268DEC 0 -26811 10 -4609
ANN 13045 -148572 32998 -21427
SOLAR RADIATION DATA (pages 15-16)
Explanation of Charts:
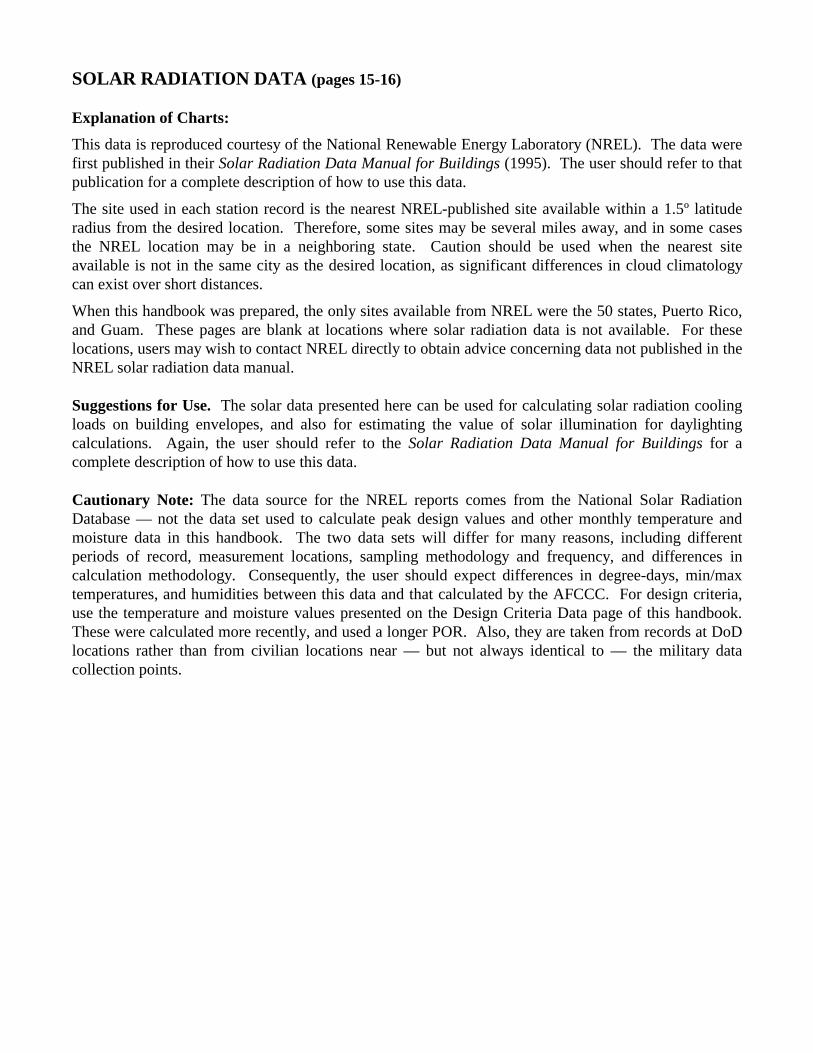
This data is reproduced courtesy of the National Renewable Energy Laboratory (NREL). The data werefirst published in their Solar Radiation Data Manual for Buildings (1995). The user should refer to thatpublication for a complete description of how to use this data.
The site used in each station record is the nearest NREL-published site available within a 1.5º latituderadius from the desired location. Therefore, some sites may be several miles away, and in some casesthe NREL location may be in a neighboring state. Caution should be used when the nearest siteavailable is not in the same city as the desired location, as significant differences in cloud climatologycan exist over short distances.
When this handbook was prepared, the only sites available from NREL were the 50 states, Puerto Rico,and Guam. These pages are blank at locations where solar radiation data is not available. For theselocations, users may wish to contact NREL directly to obtain advice concerning data not published in theNREL solar radiation data manual.
Suggestions for Use. The solar data presented here can be used for calculating solar radiation coolingloads on building envelopes, and also for estimating the value of solar illumination for daylightingcalculations. Again, the user should refer to the Solar Radiation Data Manual for Buildings for acomplete description of how to use this data.
Cautionary Note: The data source for the NREL reports comes from the National Solar RadiationDatabase –– not the data set used to calculate peak design values and other monthly temperature andmoisture data in this handbook. The two data sets will differ for many reasons, including differentperiods of record, measurement locations, sampling methodology and frequency, and differences incalculation methodology. Consequently, the user should expect differences in degree-days, min/maxtemperatures, and humidities between this data and that calculated by the AFCCC. For design criteria,use the temperature and moisture values presented on the Design Criteria Data page of this handbook.These were calculated more recently, and used a longer POR. Also, they are taken from records at DoDlocations rather than from civilian locations near –– but not always identical to –– the military datacollection points.
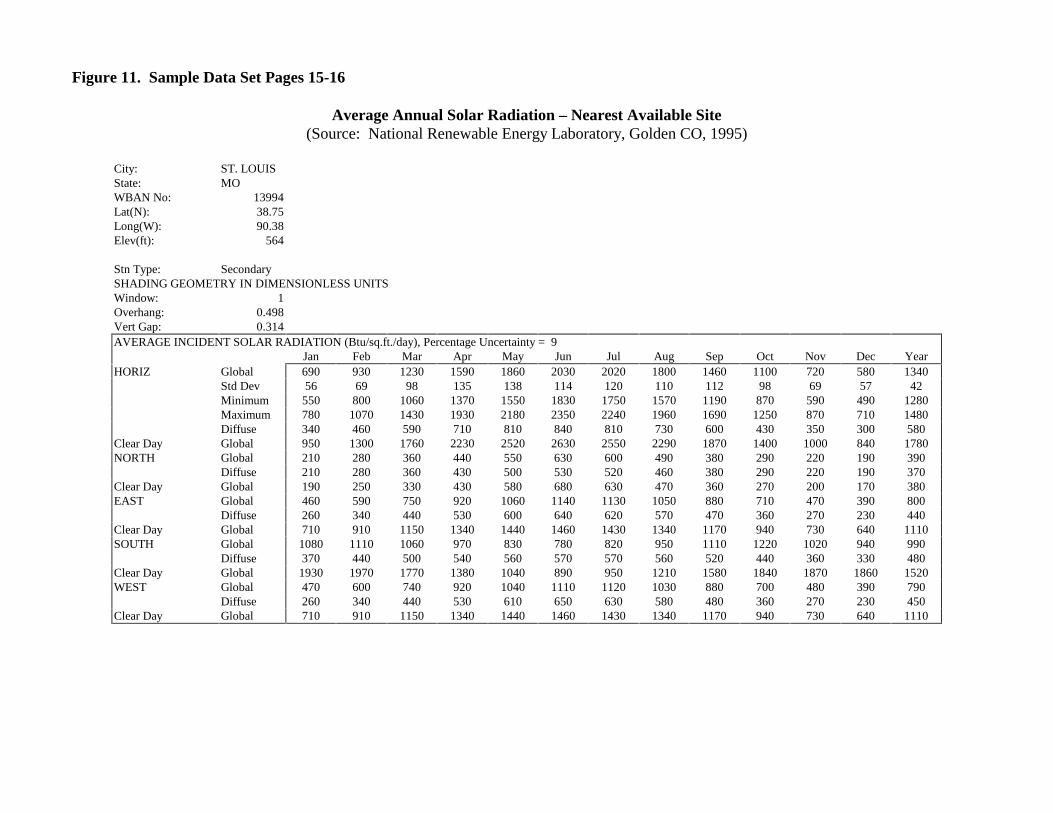
Figure 11. Sample Data Set Pages 15-16
Average Annual Solar Radiation – Nearest Available Site(Source: National Renewable Energy Laboratory, Golden CO, 1995)
City: ST. LOUISState: MOWBAN No: 13994Lat(N): 38.75Long(W): 90.38Elev(ft): 564
Stn Type: SecondarySHADING GEOMETRY IN DIMENSIONLESS UNITSWindow: 1Overhang: 0.498Vert Gap: 0.314AVERAGE INCIDENT SOLAR RADIATION (Btu/sq.ft./day), Percentage Uncertainty = 9
Jan Feb Mar Apr May Jun Jul Aug Sep Oct Nov Dec YearHORIZ Global 690 930 1230 1590 1860 2030 2020 1800 1460 1100 720 580 1340
Std Dev 56 69 98 135 138 114 120 110 112 98 69 57 42Minimum 550 800 1060 1370 1550 1830 1750 1570 1190 870 590 490 1280Maximum 780 1070 1430 1930 2180 2350 2240 1960 1690 1250 870 710 1480Diffuse 340 460 590 710 810 840 810 730 600 430 350 300 580
Clear Day Global 950 1300 1760 2230 2520 2630 2550 2290 1870 1400 1000 840 1780NORTH Global 210 280 360 440 550 630 600 490 380 290 220 190 390
Diffuse 210 280 360 430 500 530 520 460 380 290 220 190 370Clear Day Global 190 250 330 430 580 680 630 470 360 270 200 170 380EAST Global 460 590 750 920 1060 1140 1130 1050 880 710 470 390 800
Diffuse 260 340 440 530 600 640 620 570 470 360 270 230 440Clear Day Global 710 910 1150 1340 1440 1460 1430 1340 1170 940 730 640 1110SOUTH Global 1080 1110 1060 970 830 780 820 950 1110 1220 1020 940 990
Diffuse 370 440 500 540 560 570 570 560 520 440 360 330 480Clear Day Global 1930 1970 1770 1380 1040 890 950 1210 1580 1840 1870 1860 1520WEST Global 470 600 740 920 1040 1110 1120 1030 880 700 480 390 790
Diffuse 260 340 440 530 610 650 630 580 480 360 270 230 450Clear Day Global 710 910 1150 1340 1440 1460 1430 1340 1170 940 730 640 1110
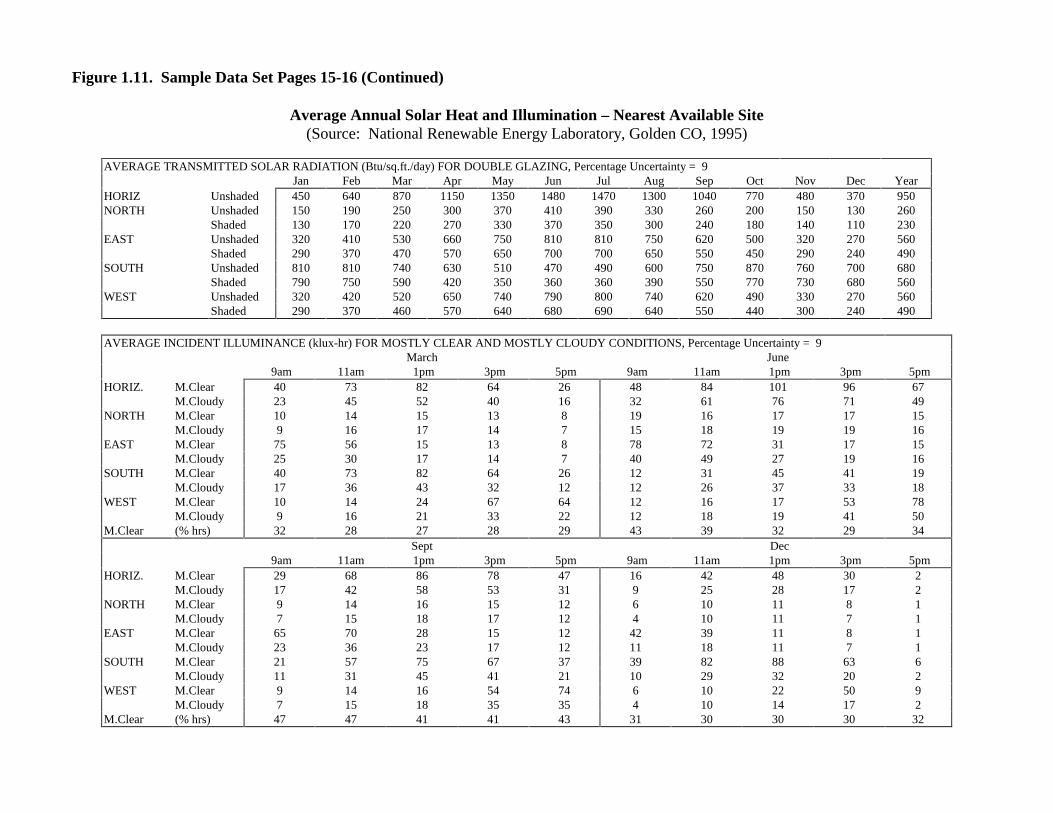
Figure 1.11. Sample Data Set Pages 15-16 (Continued)
Average Annual Solar Heat and Illumination – Nearest Available Site(Source: National Renewable Energy Laboratory, Golden CO, 1995)
AVERAGE TRANSMITTED SOLAR RADIATION (Btu/sq.ft./day) FOR DOUBLE GLAZING, Percentage Uncertainty = 9Jan Feb Mar Apr May Jun Jul Aug Sep Oct Nov Dec Year
HORIZ Unshaded 450 640 870 1150 1350 1480 1470 1300 1040 770 480 370 950NORTH Unshaded 150 190 250 300 370 410 390 330 260 200 150 130 260
Shaded 130 170 220 270 330 370 350 300 240 180 140 110 230EAST Unshaded 320 410 530 660 750 810 810 750 620 500 320 270 560
Shaded 290 370 470 570 650 700 700 650 550 450 290 240 490SOUTH Unshaded 810 810 740 630 510 470 490 600 750 870 760 700 680
Shaded 790 750 590 420 350 360 360 390 550 770 730 680 560WEST Unshaded 320 420 520 650 740 790 800 740 620 490 330 270 560
Shaded 290 370 460 570 640 680 690 640 550 440 300 240 490
AVERAGE INCIDENT ILLUMINANCE (klux-hr) FOR MOSTLY CLEAR AND MOSTLY CLOUDY CONDITIONS, Percentage Uncertainty = 9March June
9am 11am 1pm 3pm 5pm 9am 11am 1pm 3pm 5pmHORIZ. M.Clear 40 73 82 64 26 48 84 101 96 67
M.Cloudy 23 45 52 40 16 32 61 76 71 49NORTH M.Clear 10 14 15 13 8 19 16 17 17 15
M.Cloudy 9 16 17 14 7 15 18 19 19 16EAST M.Clear 75 56 15 13 8 78 72 31 17 15
M.Cloudy 25 30 17 14 7 40 49 27 19 16SOUTH M.Clear 40 73 82 64 26 12 31 45 41 19
M.Cloudy 17 36 43 32 12 12 26 37 33 18WEST M.Clear 10 14 24 67 64 12 16 17 53 78
M.Cloudy 9 16 21 33 22 12 18 19 41 50M.Clear (% hrs) 32 28 27 28 29 43 39 32 29 34
Sept Dec 9am 11am 1pm 3pm 5pm 9am 11am 1pm 3pm 5pm
HORIZ. M.Clear 29 68 86 78 47 16 42 48 30 2M.Cloudy 17 42 58 53 31 9 25 28 17 2
NORTH M.Clear 9 14 16 15 12 6 10 11 8 1M.Cloudy 7 15 18 17 12 4 10 11 7 1
EAST M.Clear 65 70 28 15 12 42 39 11 8 1M.Cloudy 23 36 23 17 12 11 18 11 7 1
SOUTH M.Clear 21 57 75 67 37 39 82 88 63 6M.Cloudy 11 31 45 41 21 10 29 32 20 2
WEST M.Clear 9 14 16 54 74 6 10 22 50 9M.Cloudy 7 15 18 35 35 4 10 14 17 2
M.Clear (% hrs) 47 47 41 41 43 31 30 30 30 32
WIND SUMMARY (pages 17-18)
Explanation of Charts:
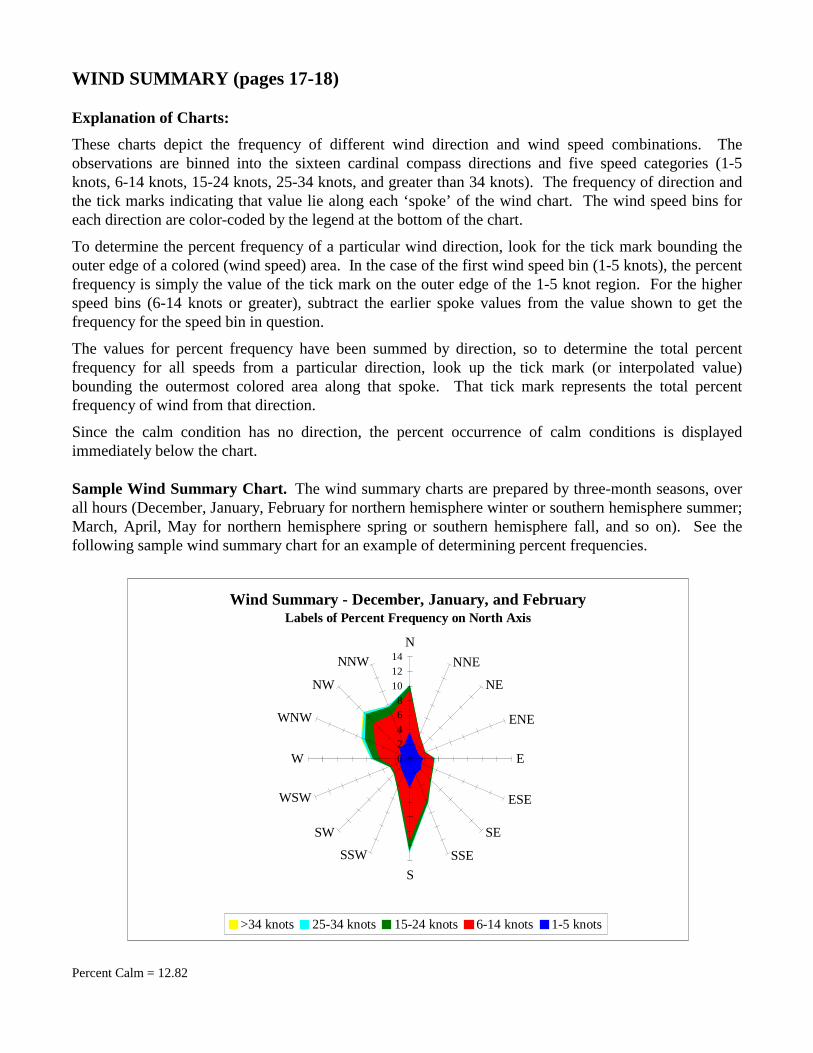
These charts depict the frequency of different wind direction and wind speed combinations. Theobservations are binned into the sixteen cardinal compass directions and five speed categories (1-5knots, 6-14 knots, 15-24 knots, 25-34 knots, and greater than 34 knots). The frequency of direction andthe tick marks indicating that value lie along each ‘spoke’ of the wind chart. The wind speed bins foreach direction are color-coded by the legend at the bottom of the chart.
To determine the percent frequency of a particular wind direction, look for the tick mark bounding theouter edge of a colored (wind speed) area. In the case of the first wind speed bin (1-5 knots), the percentfrequency is simply the value of the tick mark on the outer edge of the 1-5 knot region. For the higherspeed bins (6-14 knots or greater), subtract the earlier spoke values from the value shown to get thefrequency for the speed bin in question.
The values for percent frequency have been summed by direction, so to determine the total percentfrequency for all speeds from a particular direction, look up the tick mark (or interpolated value)bounding the outermost colored area along that spoke. That tick mark represents the total percentfrequency of wind from that direction.
Since the calm condition has no direction, the percent occurrence of calm conditions is displayedimmediately below the chart.
Sample Wind Summary Chart. The wind summary charts are prepared by three-month seasons, overall hours (December, January, February for northern hemisphere winter or southern hemisphere summer;March, April, May for northern hemisphere spring or southern hemisphere fall, and so on). See thefollowing sample wind summary chart for an example of determining percent frequencies.
Wind Summary - December, January, and FebruaryLabels of Percent Frequency on North Axis
024
68
10
12
14N
NNE
NE
ENE
E
ESE
SE
SSE
S
SSW
SW
WSW
W
WNW
NW
NNW
>34 knots 25-34 knots 15-24 knots 6-14 knots 1-5 knots
Percent Calm = 12.82
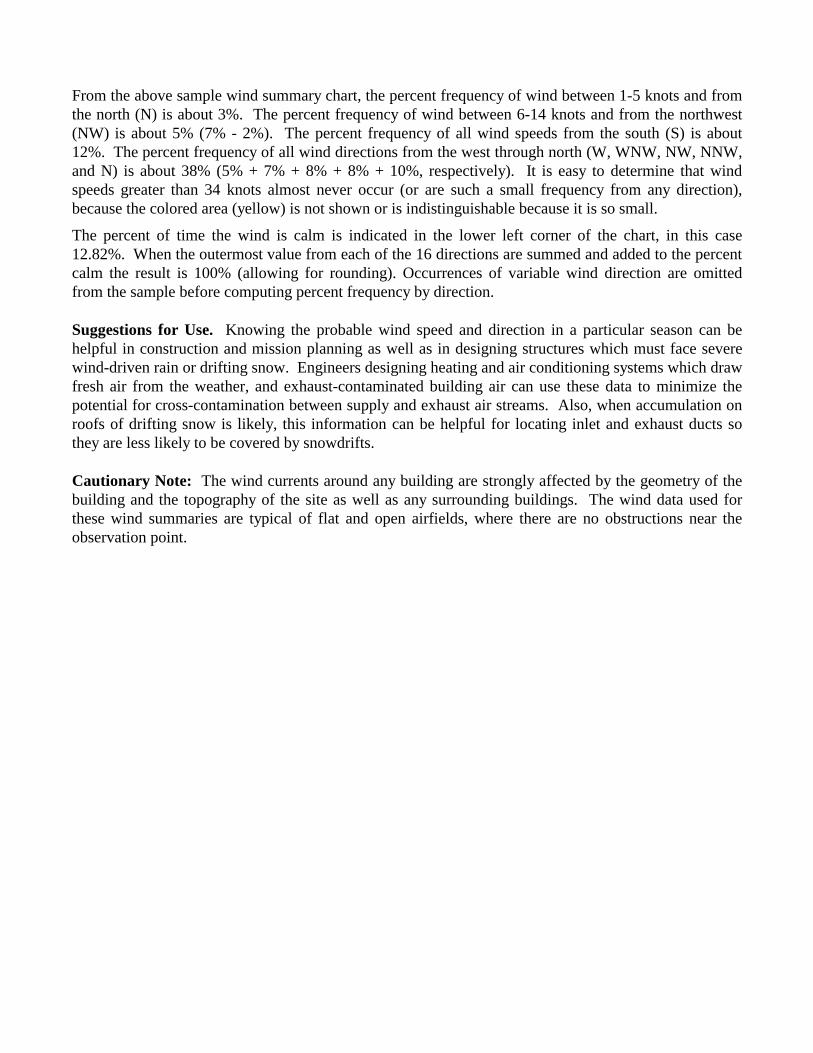
From the above sample wind summary chart, the percent frequency of wind between 1-5 knots and fromthe north (N) is about 3%. The percent frequency of wind between 6-14 knots and from the northwest(NW) is about 5% (7% - 2%). The percent frequency of all wind speeds from the south (S) is about12%. The percent frequency of all wind directions from the west through north (W, WNW, NW, NNW,and N) is about 38% (5% + 7% + 8% + 8% + 10%, respectively). It is easy to determine that windspeeds greater than 34 knots almost never occur (or are such a small frequency from any direction),because the colored area (yellow) is not shown or is indistinguishable because it is so small.
The percent of time the wind is calm is indicated in the lower left corner of the chart, in this case12.82%. When the outermost value from each of the 16 directions are summed and added to the percentcalm the result is 100% (allowing for rounding). Occurrences of variable wind direction are omittedfrom the sample before computing percent frequency by direction.
Suggestions for Use. Knowing the probable wind speed and direction in a particular season can behelpful in construction and mission planning as well as in designing structures which must face severewind-driven rain or drifting snow. Engineers designing heating and air conditioning systems which drawfresh air from the weather, and exhaust-contaminated building air can use these data to minimize thepotential for cross-contamination between supply and exhaust air streams. Also, when accumulation onroofs of drifting snow is likely, this information can be helpful for locating inlet and exhaust ducts sothey are less likely to be covered by snowdrifts.
Cautionary Note: The wind currents around any building are strongly affected by the geometry of thebuilding and the topography of the site as well as any surrounding buildings. The wind data used forthese wind summaries are typical of flat and open airfields, where there are no obstructions near theobservation point.
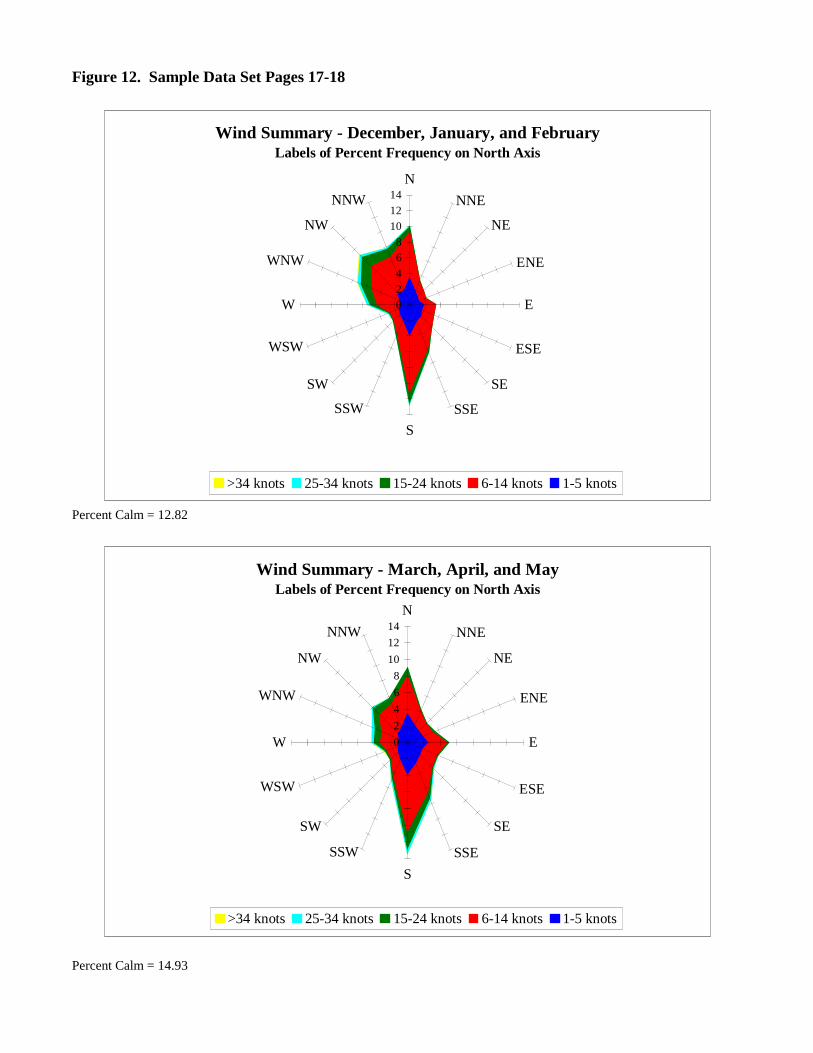
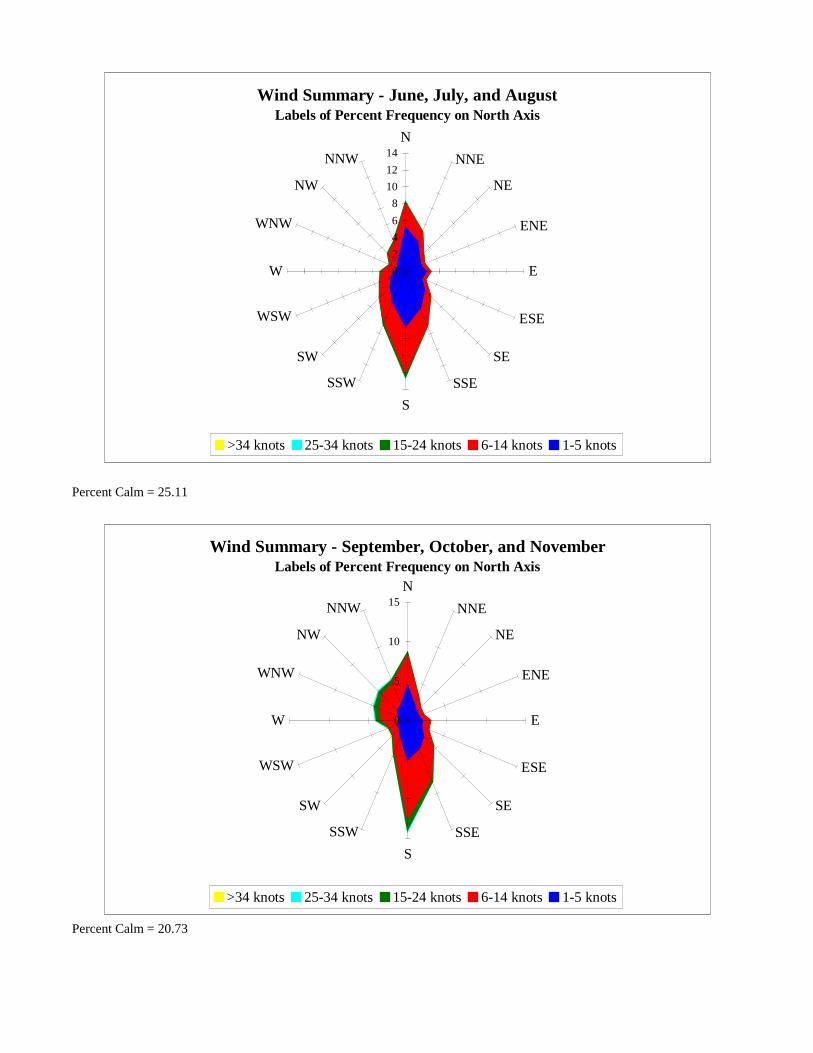
Figure 12. Sample Data Set Pages 17-18
Wind Summary - December, January, and FebruaryLabels of Percent Frequency on North Axis
02
4
68
1012
14N
NNE
NE
ENE
E
ESE
SE
SSE
S
SSW
SW
WSW
W
WNW
NW
NNW
>34 knots 25-34 knots 15-24 knots 6-14 knots 1-5 knots
Percent Calm = 12.82
Wind Summary - March, April, and MayLabels of Percent Frequency on North Axis
0
2
4
6
8
10
12
14N
NNE
NE
ENE
E
ESE
SE
SSE
S
SSW
SW
WSW
W
WNW
NW
NNW
>34 knots 25-34 knots 15-24 knots 6-14 knots 1-5 knots
Percent Calm = 14.93
Wind Summary - June, July, and AugustLabels of Percent Frequency on North Axis
0
2
4
6
8
10
12
14N
NNE
NE
ENE
E
ESE
SE
SSE
S
SSW
SW
WSW
W
WNW
NW
NNW
>34 knots 25-34 knots 15-24 knots 6-14 knots 1-5 knots
Percent Calm = 25.11
Wind Summary - September, October, and NovemberLabels of Percent Frequency on North Axis
0
5
10
15N
NNE
NE
ENE
E
ESE
SE
SSE
S
SSW
SW
WSW
W
WNW
NW
NNW
>34 knots 25-34 knots 15-24 knots 6-14 knots 1-5 knots
Percent Calm = 20.73
REFERENCES AND SUPPORTING INFORMATIONSection A—References
1997 ASHRAE Handbook: Fundamentals, American Society of Heating, Refrigerating, and AirConditioning Engineers, Inc., Atlanta, GA
Anderson, Keith E., Ground Water Handbook, National Ground Water Association, Dublin, OH
Fact Book of the Society of American Military Engineers, Society of American Military Engineers, June1995 (Prince Street, Bldg 607, Alexandria, VA 22314 [Tel: 1-800-336-3097])
Harriman, Plager, and Kosar, "Dehumidification and Cooling Loads from Ventilation Air," ASHRAEJournal, November, 1997, pp: 37-45, American Society of Heating, Air Conditioning andRefrigerating Engineers, Atlanta, GA, 1997
International Plumbing Code, Building Officials and Code Administrators (BOCA) International, Inc.,Country Club Hills, IL, 1995
Judge, James, P.E., PSYFUNC Algorithms, LINRIC Co., Bedford, NH, 1996
Minimum Design Loads for Buildings and Other Structures, ANSI/ASCE 7-95, American Society ofCivil Engineers, New York, NY
Solar Radiation Data Manual for Buildings, National Renewable Energy Laboratory, Golden, CO, 1995
TI 809-01, Load Assumptions for Buildings, 1986, U.S. Army Corps of Engineers
Section B— Abbreviations and Acronyms
Btu/lb—British thermal units per pound of air (enthalpy)
Btu/sq ft/day—Btu per square foot per day (solar radiation)
cm—Centimeter (frost depth)
cm/hr—Centimeters per hour (rain rate)
gr/lb—Grains per pound (humidity ratio, grains of water vapor per pound of air)
gr/kg—Grams per kilogram (humidity ratio, grams of water vapor per kilogram of air)
in Hg—Inches of mercury (atmospheric pressure)
in—Inches (frost depth)
in/hr—Inches per hour (rain rate)
kBtu/cfm —Thousands of Btu per cubic foot per minute (sensible or latent heating or cooling loads)
klux-hr—Thousands of lux-hours (average incident illuminance)
lb/sq ft—pounds per square foot (snow load)
mb Hg—millibars of mercury (atmospheric pressure)
mph—miles per hour (wind speed)
ton-hrs/cfm/yr—ton-hours of load per cubic foot per minute per year (Btu÷12,000)