Embed Size (px)
DESCRIPTION
Amibroker
Citation preview

Handbook- Advance Use of AmiBroker
S t o c k B a n g l a d e s h L i m i t e d
D h a k a t r a d e C e n t e r ( 1 4 t h F )
9 9 K a z i N a z r u l I s l a m A v e n u e
K a w r a n B a z a r , D h a k a - 1 2 1 5
+ 8 8 0 2 8 1 8 9 2 9 5 - 8
i n f o @ s t o c k b a n g l a d e s h . c o m
w w w . s t o c k b a n g l a d e s h . c o m
Stock Bangladesh Courses This handbook is designed to assist the participants
of the Advanced Use of AmiBroker course offered
by Stock Bangladesh Limited
Handbook- Advance Use of AmiBroker | 1 www.stockbangladesh.com
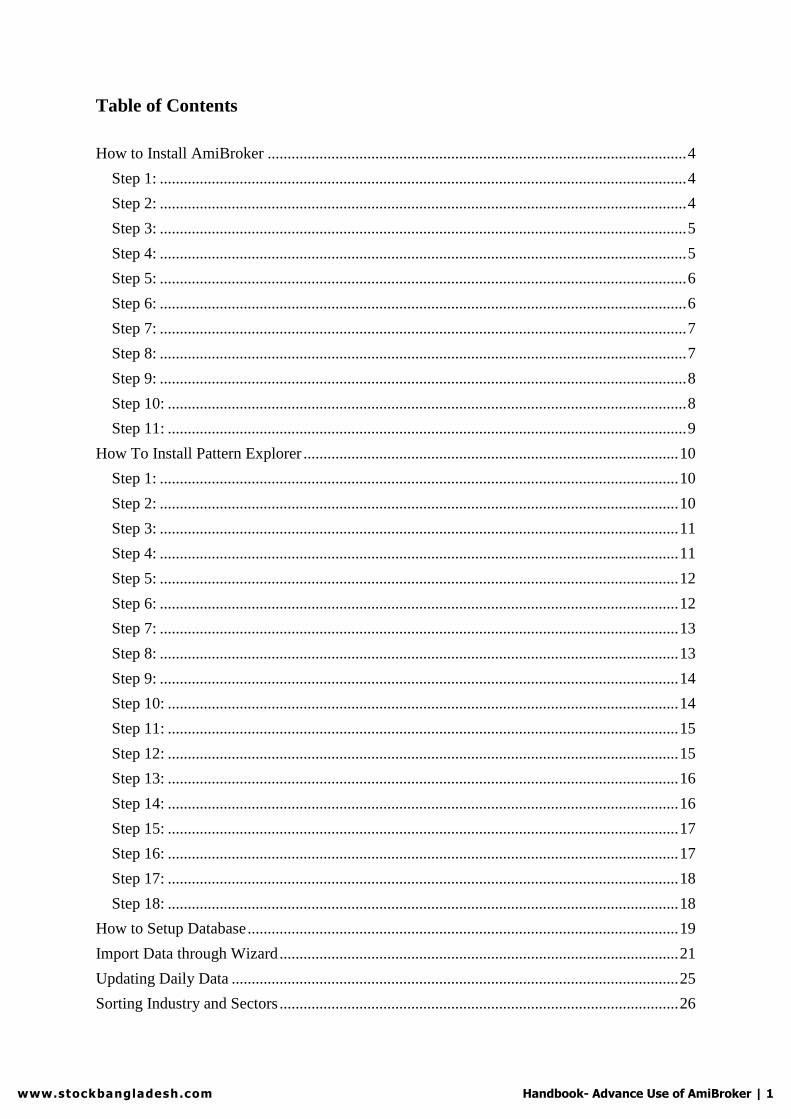
Table of Contents
How to Install AmiBroker ......................................................................................................... 4
Step 1: .................................................................................................................................... 4
Step 2: .................................................................................................................................... 4
Step 3: .................................................................................................................................... 5
Step 4: .................................................................................................................................... 5
Step 5: .................................................................................................................................... 6
Step 6: .................................................................................................................................... 6
Step 7: .................................................................................................................................... 7
Step 8: .................................................................................................................................... 7
Step 9: .................................................................................................................................... 8
Step 10: .................................................................................................................................. 8
Step 11: .................................................................................................................................. 9
How To Install Pattern Explorer .............................................................................................. 10
Step 1: .................................................................................................................................. 10
Step 2: .................................................................................................................................. 10
Step 3: .................................................................................................................................. 11
Step 4: .................................................................................................................................. 11
Step 5: .................................................................................................................................. 12
Step 6: .................................................................................................................................. 12
Step 7: .................................................................................................................................. 13
Step 8: .................................................................................................................................. 13
Step 9: .................................................................................................................................. 14
Step 10: ................................................................................................................................ 14
Step 11: ................................................................................................................................ 15
Step 12: ................................................................................................................................ 15
Step 13: ................................................................................................................................ 16
Step 14: ................................................................................................................................ 16
Step 15: ................................................................................................................................ 17
Step 16: ................................................................................................................................ 17
Step 17: ................................................................................................................................ 18
Step 18: ................................................................................................................................ 18
How to Setup Database ............................................................................................................ 19
Import Data through Wizard .................................................................................................... 21
Updating Daily Data ................................................................................................................ 25
Sorting Industry and Sectors .................................................................................................... 26
Handbook- Advance Use of AmiBroker | 2 www.stockbangladesh.com
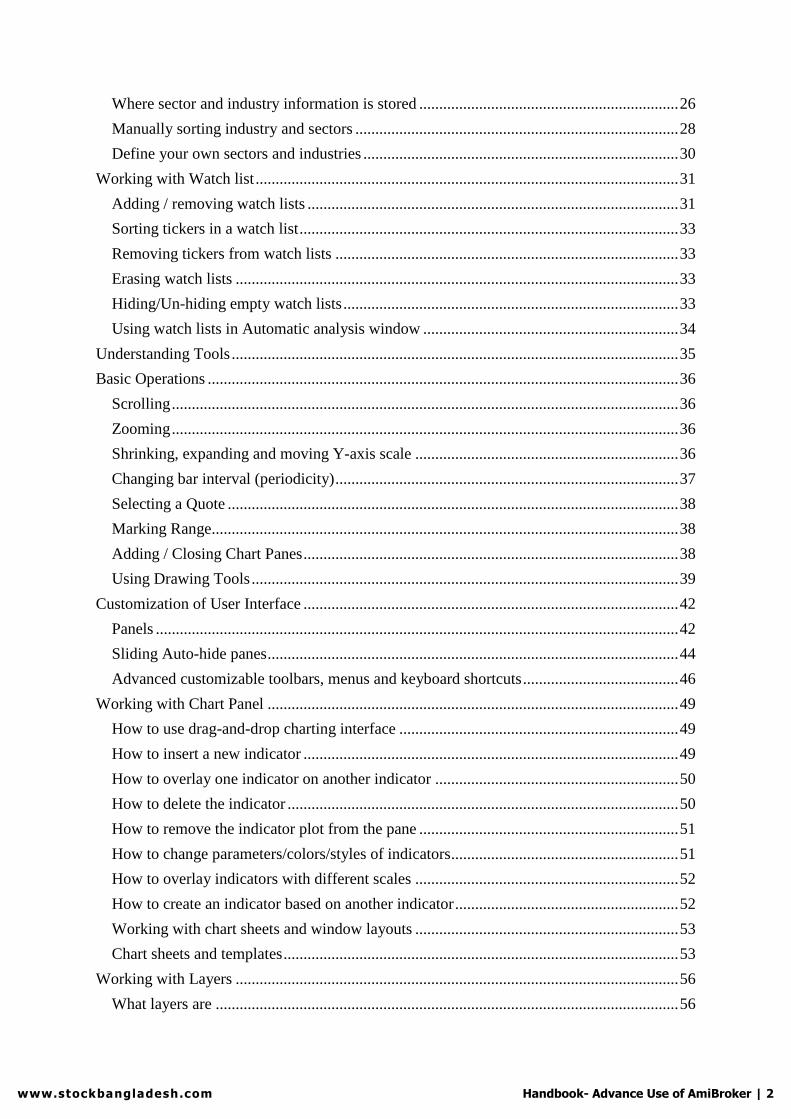
Where sector and industry information is stored ................................................................. 26
Manually sorting industry and sectors ................................................................................. 28
Define your own sectors and industries ............................................................................... 30
Working with Watch list .......................................................................................................... 31
Adding / removing watch lists ............................................................................................. 31
Sorting tickers in a watch list ............................................................................................... 33
Removing tickers from watch lists ...................................................................................... 33
Erasing watch lists ............................................................................................................... 33
Hiding/Un-hiding empty watch lists .................................................................................... 33
Using watch lists in Automatic analysis window ................................................................ 34
Understanding Tools ................................................................................................................ 35
Basic Operations ...................................................................................................................... 36
Scrolling ............................................................................................................................... 36
Zooming ............................................................................................................................... 36
Shrinking, expanding and moving Y-axis scale .................................................................. 36
Changing bar interval (periodicity) ...................................................................................... 37
Selecting a Quote ................................................................................................................. 38
Marking Range..................................................................................................................... 38
Adding / Closing Chart Panes .............................................................................................. 38
Using Drawing Tools ........................................................................................................... 39
Customization of User Interface .............................................................................................. 42
Panels ................................................................................................................................... 42
Sliding Auto-hide panes ....................................................................................................... 44
Advanced customizable toolbars, menus and keyboard shortcuts ....................................... 46
Working with Chart Panel ....................................................................................................... 49
How to use drag-and-drop charting interface ...................................................................... 49
How to insert a new indicator .............................................................................................. 49
How to overlay one indicator on another indicator ............................................................. 50
How to delete the indicator .................................................................................................. 50
How to remove the indicator plot from the pane ................................................................. 51
How to change parameters/colors/styles of indicators ......................................................... 51
How to overlay indicators with different scales .................................................................. 52
How to create an indicator based on another indicator ........................................................ 52
Working with chart sheets and window layouts .................................................................. 53
Chart sheets and templates ................................................................................................... 53
Working with Layers ............................................................................................................... 56
What layers are .................................................................................................................... 56

Handbook- Advance Use of AmiBroker | 3 www.stockbangladesh.com
How to work with layers ...................................................................................................... 56
Context menu ....................................................................................................................... 57
Working with Automatic Analysis .......................................................................................... 59
Controls for setting .............................................................................................................. 60
Scan ...................................................................................................................................... 60
Explore ................................................................................................................................. 60
Back Test ............................................................................................................................. 60
Working with exploration ........................................................................................................ 62
Customizable reports ........................................................................................................... 62
Back-Testing ............................................................................................................................ 66
Introduction .......................................................................................................................... 66
Writing your trading rules .................................................................................................... 66
Back testing .......................................................................................................................... 67
Analysing results .................................................................................................................. 67
Changing your back testing settings .................................................................................... 67
Reserved variable names...................................................................................................... 68
Advanced concepts .............................................................................................................. 69
Controlling trade price ......................................................................................................... 69
Profit target stops ................................................................................................................. 72
"Exit at stop" feature ............................................................................................................ 72
Trailing stops ....................................................................................................................... 73
Dynamic stops ...................................................................................................................... 74
Position sizing ...................................................................................................................... 75
The technique summarized .................................................................................................. 76
Tick size ............................................................................................................................... 76
Reading Backtest report ........................................................................................................... 78

Handbook- Advance Use of AmiBroker | 4 www.stockbangladesh.com
How to Install AmiBroker
Step 1:
Open the CD and open Ami Broker Folder. Then Click on Ami Broker 5.XX (The .exe file)
Step 2:
After clicking Ami Broker 5.31 a dialog box will appear and then Click NEXT button.

Handbook- Advance Use of AmiBroker | 5 www.stockbangladesh.com
Step 3:
Select “I Accept the agreement”, Click Next.
Step 4:
Click Next.

Handbook- Advance Use of AmiBroker | 6 www.stockbangladesh.com
Step 5:
Click Next.
Step 6:
Ami Broker is installing.

Handbook- Advance Use of AmiBroker | 7 www.stockbangladesh.com
Step 7:
When you will arrive in following window then uncheck the Tick.
Step 8:
Uncheck tick, then Click Next.
Handbook- Advance Use of AmiBroker | 8 www.stockbangladesh.com
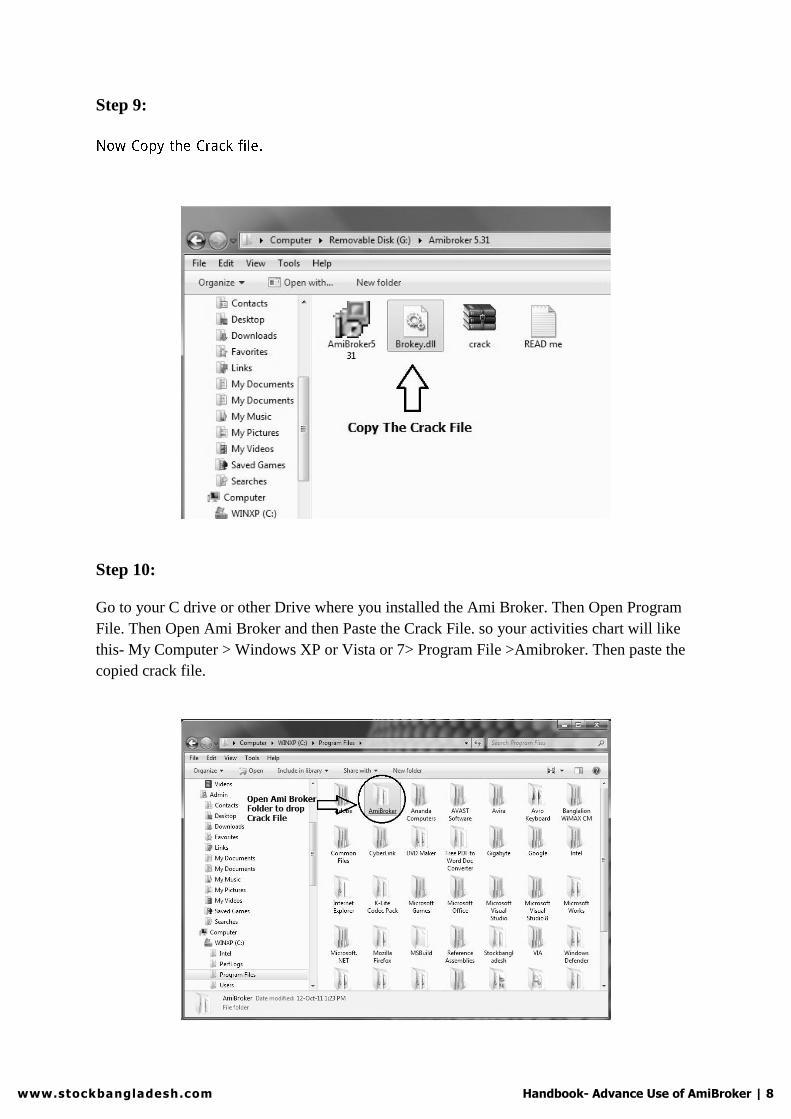
Step 9:
Step 10:
Go to your C drive or other Drive where you installed the Ami Broker. Then Open Program
File. Then Open Ami Broker and then Paste the Crack File. so your activities chart will like
this- My Computer > Windows XP or Vista or 7> Program File >Amibroker. Then paste the
copied crack file.

Handbook- Advance Use of AmiBroker | 9 www.stockbangladesh.com
Step 11:
After copying the crack file, a dialog box will appear. Then you click “Copy and Replace”
Your Ami Broker is installed.

Handbook- Advance Use of AmiBroker | 10 www.stockbangladesh.com
Step 1:
Open the CD and open Pattern Explorer ForAmibroker. 3.75.
Step 2:
Run the PatternExplorer file.

Handbook- Advance Use of AmiBroker | 11 www.stockbangladesh.com
Step 3:
Click Next.
Step 4:
Accept the Terms and License agreement then, Click Next.

Handbook- Advance Use of AmiBroker | 12 www.stockbangladesh.com
Step 5:
Accept the term of the disclaimer then Click Next.
Step 6:
Click Next.

Handbook- Advance Use of AmiBroker | 13 www.stockbangladesh.com
Step 7:
Then you will have to put Serial Number which has given in Pattern Explorer Folder.
Step 8:
Copy the Serial Number from Pattern Explorer folder.

Handbook- Advance Use of AmiBroker | 14 www.stockbangladesh.com
Step 9:
Now paste the copied serial number in the Serial Number Box. Then Click Next.
Step 10:
Click Next.
Handbook- Advance Use of AmiBroker | 15 www.stockbangladesh.com
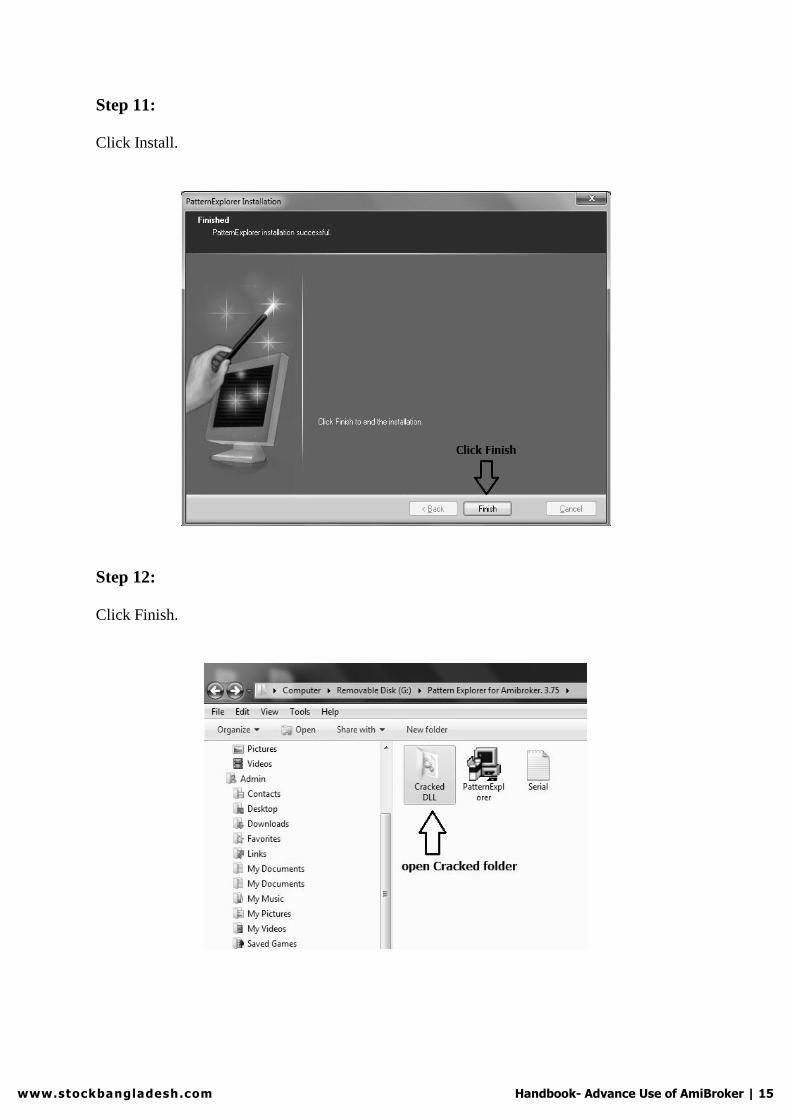
Step 11:
Click Install.
Step 12:
Click Finish.

Handbook- Advance Use of AmiBroker | 16 www.stockbangladesh.com
Step 13:
Again go to Pattern Explorer Folder and then opened the Cracked folder.
Step 14:
Copy The Cracked File.

Handbook- Advance Use of AmiBroker | 17 www.stockbangladesh.com
Step 15:
Go to again program file and then open Ami Broker Folder.
Step 16:
Open Plugins folder then paste copied cracked file.

Handbook- Advance Use of AmiBroker | 18 www.stockbangladesh.com
Step 17:
When you paste the copied file this dialog box will appear then you will have to select copy
and replace.
Step 18:
Now you can see the cracked file in your Plugin folder.

Handbook- Advance Use of AmiBroker | 19 www.stockbangladesh.com
How to Setup Database
1. Open AmiBroker. Then, go to "File>New Database" like below............
2. Now change the name "My New Data" to something link "DSE Database" or as you wish

Handbook- Advance Use of AmiBroker | 20 www.stockbangladesh.com
3. After changing the name, click on Create button
4. After you click on Create, your background of AmiBroker should get blank. Click on OK
button.So, you have successfully created the Database. Remember don't change anything else
in the window. Also, you must select "Load this database at startup". Though the image
below doesn't have it selected. It is better to leave everything as it is.

Handbook- Advance Use of AmiBroker | 21 www.stockbangladesh.com
Import Data through Wizard
This is an important thing to do. You have to do this once and for the first time.
1. After installing AmiBroker,Open the software by clicking its icon on Desktop.
2.Go to File and then Import Wizard. See the image above.

Handbook- Advance Use of AmiBroker | 22 www.stockbangladesh.com
3. Click on Pick Files button. See the image below.
4. Open the folder “Data” (or where you have kept the csv data files)
5. Select the desired csv file.To select more files select one and then press “ctrl+A”. All files
will be selected.

Handbook- Advance Use of AmiBroker | 23 www.stockbangladesh.com
6. Now click on “Open”.
7. Click “Next”.
8. Just click on next button in the image below (Here you will see another window with some
options like the image below. You might have to change the options that is highlighted in the
image below if you use data that is not provided by stockbangladesh.com- for stock
Bangladesh data just click on next).
9. Place a tick on the box saying Add current setting to ASCII importer definitions.
10. Now you would see a window like following. Here Ami is importing the data-

Handbook- Advance Use of AmiBroker | 24 www.stockbangladesh.com
11. Now next window will tell you to see the errors in the files. Just click on No and ignore it
always
12. Now the importing is finished. Data should be imported successfully to Amibroker.
13. After import please ALWAYS Save and Exit. To save,go to File>Save.

Handbook- Advance Use of AmiBroker | 25 www.stockbangladesh.com
Updating Daily Data
1. Go to (Download section) daily after 4 PM. (URL-
http://www.stockbangladesh.com/resources/download)
2. Click on “Download last trading day data all together in a file”. It will open the
page (URL- http://www.stockbangladesh.com/resources/lastdaydata)
3. Select CSV format and click Download.
4. Save the Downloaded file in your computer
5. Now from AmiBroker select File>Import wizard…
6. Pick file from your computer that you have downloaded from
stockbangladesh.com
7. Click Next
8. Click Next
9. Click Finish
Data updating is completed.

Handbook- Advance Use of AmiBroker | 26 www.stockbangladesh.com
Sorting Industry and Sectors
To use AmiBroker in proper manner we have to sort the symbols by industry and the sectors.
To do this first we have to know how it works.
Where sector and industry information is stored
Generally speaking this information is stored in AmiBroker database. The sector and industry
names and settings are stored in the broker.workspace file (in the workspace folder), symbol
data files hold only the information about the assignment of the symbol to given industry
(IndustryID).
When you create a new workspace (a database) AmiBroker sets up your industries and
sectors according to the templates stored in the "broker.sectors" and "broker.industries" files.
These are simple text files that could be edited with plain text editor (such as Notepad). These
files could be also used for quick, automatic setup of the sectors and industries. AmiBroker
comes with predefined broker.sectors and broker.industries that follow described above
convention (see the table). You can rewrite broker.sectors and broker.industries files to define
your own default scheme. So, "broker.sectors" and "broker.industries" files are used as a
template when creating new workspace. Once workspace is created these files are not taken
into consideration. In this way you may have different categories in each workspace. If you
want AmiBroker to load them into already existing workspace please delete
broker.workspace file before opening the workspace. If you then open the workspace
AmiBroker will read broker.sectors and broker.industries.
The layout of broker.sectors file is very simple: it is plain text file holding sector names
written line by line as shown below:
Basic Materials
Capital Goods
Conglomerates
Consumer Cyclical
Consumer/Non-Cyclical
Energy
Financial
Healthcare
Services
Technology
Transportation
Utilities

Handbook- Advance Use of AmiBroker | 27 www.stockbangladesh.com
The layout of broker.industries is similar, but in addition to industry names there is a number
at the beginning of each line:
8 Advertising
1 Aerospace & Defense
10 Air Courier
10 Airline
3 Apparel/Accessories
3 Appliance & Tool
3 Audio & Video Equipment
3 Auto & Truck Manufacturers
3 Auto & Truck Parts
4 Beverages (Alcoholic)
4 Beverages (Non-Alcoholic)
7 Biotechnology & Drugs
8 Broadcasting & Cable TV
8 Business Services
8 Casinos & Gaming
0 Chemical Manufacturing
0 Chemicals - Plastics & Rubber
5 Coal
9 Communications Equipment
The numbers at front of industry names are "Sector IDs". Those numbers decide to which
sector given industry belongs to. Because several industries may belong to one sector - you
may need to put the same number for sector Id. Sector IDs are zero based, which means that 0
refers to the first line (sector name) of "broker.sectors" file, while 7 refers to the eighth line of
this file. In the example above: "Advertising" industry belongs to "Services" sector, while
"Aerospace &Defence" industry belongs to "Capital Goods" sector.
If you don't want to setup detailed industry information and want assign symbols only to
sectors you can define one-to-one relationship between first 32 industries so they will be
equivalent to sectors. Using the broker.sectors as show earlier in this article 1-1
broker.industries file would look like:
0 Basic Materials
1 Capital Goods
2 Conglomerates
3 Consumer Cyclical

Handbook- Advance Use of AmiBroker | 28 www.stockbangladesh.com
4 Consumer/Non-Cyclical
5 Energy
6 Financial
7 Healthcare
8 Services
9 Technology
10 Transportation
11 Utilities
Note that this file is essentially the same as broker.sectors with the only difference that we
have consecutive numbers prepended to each line. Using this kind of setup setting the
industry will be equivalent to setting the sector.
Manually sorting industry and sectors
You can change the industry to which given symbol is assigned by using View->Information
dialog (Industry combo box)

Handbook- Advance Use of AmiBroker | 29 www.stockbangladesh.com
or using Symbol->Organize Assignments.
The first method is fine if you want to change single symbol settings. The latter is better if
you want to move multiple symbols from one category to another.

Handbook- Advance Use of AmiBroker | 30 www.stockbangladesh.com
Define your own sectors and industries
Please go to Symbol->Categories dialog, the last two tabs are "Sectors" and "Industries".
First, switch to the "Sectors" tab and you will see the list of 32 sector names. You can now
select the sector by clicking once on its name and edit the sector name by pressing ENTER or
clicking "Edit name" button. Hit ENTER again to accept the name change.
After you renamed the sectors you can switch to the "Industries" tab. Similarly to the
previous tab you can select the industry in the list and edit its name in the same manner. Here
you can also assign the industry to the sector using "Sector" combo. Just select the sector to
which you want to assign currently selected industry.

Handbook- Advance Use of AmiBroker | 31 www.stockbangladesh.com
Working with Watch list
AmiBroker 5.00 uses now new watch list system. Watch lists differ from other kinds of
categories (as groups, markets, industries, sectors) in that, that you can assign single symbol
to more than one watch list.
You can use UNLIMITED number of watch lists with their names definable in Symbol-
>Categories window. The members of each watch list is shown in the symbol tree under
"Watch lists" leaf.
Watch lists are now stored as text files inside "Watchlists" folder inside database. The folder
contains of any number of .TLS files with watch lists themselves and index.txt that defines
the order of watch lists. You can add your own .tls file (one symbol per line) and AmiBroker
will update index.txt automatically (adding any new watch lists at the end)The .TLS files can
also be open in AmiQuote.
Watch lists remember the order in which symbols were added, so for example if you sort AA
result list in some order and then you"add symbols to watch list" the order will be kept in the
watch list.
Adding / removing watch lists
You can now Add/Delete watch lists using Symbol->Watch List->New Watchlist and
Symbol->Watch List->Delete Watch list menu or from watch list context menu. Note that if
you have done any customization to the menu, you may need to go to Tools->Customize,
select "Menu Bar" and press "Reset" button for this new menu items to appear.

Handbook- Advance Use of AmiBroker | 32 www.stockbangladesh.com
You can easily add a ticker to the watch list by simply clicking with a right mouse button
over the item in the symbol tree and choosing Watch List->Add selected symbol option:
After choosing this option a watch list selector window will appear:
Here you should select the list you want to add the symbol to. Note that you can add one
symbol to multiple lists at once, by holding CTRL key while clicking on the list items. After
clicking OK selected symbol (MSFT) appears in the watch list of your choice.

Handbook- Advance Use of AmiBroker | 33 www.stockbangladesh.com
Sorting tickers in a watch list
You can now alphabetically sort the symbols in the watch list - click on the watch list with
RIGHT mouse button and select "Sort Alphabetically"
Removing tickers from watch lists
Removing symbols from the watch list is as easy as adding them. Just click on the list
member with a right mouse button and select Remove from watch list(s). Then similar list
selector window will appear showing only those lists that currently selected symbol belongs
to. You can now select one or more lists and the symbol will be removed from the list(s).
Erasing watch lists
Sometimes you may want to clear (or erase) the whole watch list. Then just select Symbol-
>Watch list->Erase (empty) option. In the watch list selector window mark the list(s) you
want to clear and click OK. This way selected watch list(s) become empty.
Hiding/Un-hiding empty watch lists
By default empty watch lists are shown in the symbol tree but you can hide them by right-
click on watch list in the symbol tree and select "Hide Empty Watch lists" menu. To un-hide,
select this option again.

Handbook- Advance Use of AmiBroker | 34 www.stockbangladesh.com
Using watch lists in Automatic analysis window
AmiBroker gives you a very easy way to store the results of scanning, back testing and
exploration into a watch list with a single mouse click - just run your favorite AFL formula
over the whole database and click on the results list with a right mouse button to see the
following menu:
When you choose Add all/selected results to watch list a watch list selector will appear where
you select to which list symbols should be added, then after clicking OK all symbols filtered
by your trading rules will automatically appear in the watch list of your choice.
You can also use option Replace watch list with the results/selected results
This new option empties the watch list before adding results. The order of symbols in the
result list is preserved in the watch list.

Handbook- Advance Use of AmiBroker | 35 www.stockbangladesh.com
Understanding Tools
Let's now take a look at the user interface
As you can see the in the center we have chart area in which price chart with moving average
and Bollinger bands is plotted (you can control the appearance of built-in charts from Tools-
>Preferences window).
In the bottom of the chart you can see date axis (marked with red color), and below scroll bar
and chart sheets tab control. Scroll bar can be used to display past quotes, while sheet tab
allows viewing different chart pages/sheets.
To the right you can see Y-axis area (marked with blue color) that shows Y-scale and value
labels. Value labels are color fields that display precisely the "last value" of plots. "Last
value" is the value of the indicator (or price) for the last currently displayed (rightmost) bar.
Y-axis area is used also to move/size chart vertically.
Next to the right is a drawing objects toolbar that allows you to choose from available
drawing types (note that only most popular tools are shown here, complete set is available
from Insert menu). A special tool called "Select" (red arrow) is used to select/move/resize
already drawn objects and to select quotes from the chart.

Handbook- Advance Use of AmiBroker | 36 www.stockbangladesh.com
In the upper part you can see formatting toolbar that allows you to quickly modify color, style
(thick/dotted) and mode (snap to price) of currently selected drawing object.
In the picture you can also see the trend line drawn with sizing handles marked. These
handles are used to drag/size the object as will be explained below.
Basic Operations
Scrolling
To scroll the chart forward/backward just drag scroll bar thumb or use < and > arrows on the
left and right sides of the scroll bar. Note that using <> scroll bar arrows allow you to move
chart by one bar. To scroll the chart you can also use the mouse equipped with a wheel. Just
roll the wheel up and down to scroll back and forward.
Zooming
To zoom the chart (increase or decrease number of data points (bars) displayed) you can use
either View->Zoom menu, zoom toolbar or mouse wheel. There are following options
available: zoom-in - decreases the number of data points displayed, zoom-out - increases the
number of data points displayed, zoom-all - displays all available bars, zoom-normal resets
number of bars displayed to the value defined in Tools->Preferences->Charting. Zoom-in and
zoom-out options are accessible directly from the View toolbar. (see picture below). To zoom
using mouse wheel just press and hold down CTRL key and roll the wheel. You can also
zoom to any from-to range selected on the chart (see 'Marking range' later in this tutorial)
Shrinking, expanding and moving Y-axis scale
To move Y-axis scale hover the mouse to Y-axis area (marked with blue color in the picture
above) and you will see that cursor changes to up/down arrow. Now you click and drag
up/down Y axis and release button when the axis is in the correct position.
To shrink/expand Y-axis scale: press down SHIFT key and click in the Y-axis area, now
shrink/expand Y axis scale by moving your mouse up and down. Release the button to finish.
To reset Y-axis scale and position simply double click in the Y-axis area.

Handbook- Advance Use of AmiBroker | 37 www.stockbangladesh.com
Changing bar interval (periodicity)
You can easily switch between daily/weekly/monthly and intraday intervals by choosing it
from View menu and pressing the toolbar button (see below).
The toolbar uses following notation for intervals - i -intraday, h - hourly, d - daily, w -
weekly, m - monthly. The irepresents "base" intraday interval as defined in File->Database
Settings. Remaining intraday intervals are available from View->Intraday menu.
The interval setting affects active window only, so each window can have different interval.
Please note that intraday intervals are disabled if your database is in end-of-day mode.
Intraday modes are available only for databases that have "Base time interval" in File-
>Database Settings set to anything less than end-of-day. If you for example set "Base time
interval" in File->Database Settings to 5-minute, all chart periodicities from 5-minutes up
will be enabled.
The following intervals are built-in:
daily
weekly
monthly
hourly (intraday)
15-minute (intraday)
5-minute (intraday)
1-minute (intraday)
15-second (intraday RT only)
5-second (intraday RT only)
tick (intraday RT only)

Handbook- Advance Use of AmiBroker | 38 www.stockbangladesh.com
In addition to that you can define 5 custom n-minute bar intervals and 5 custom n-tick
intervals in Tools->Preferences->Intraday. Custom intervals are available from View-
>Intraday menu only.
Selecting a Quote
You can very easily see the past quote and values of indicators by using "select" mode. To
select past quote first switch to "Select" mode (red arrow in the toolbar) then click in the chart
area (but not on the drawing object). A vertical line will show up marking the quote under the
cursor. The chart title will display this bar quote. Indicator panes will show indicator value
for given bar. Once quote is selected you can move to previous/next quote using keyboard
left and right arrow (cursor) <- and -> keys.
To switch off quote selection either click again on the line or click in the date axis area
(marked with red color in the picture above) or click in the right margin (blank quotes) area.
When selection is off chart title displays the values for last visible bar.
Marking Range
To show range marker just double click the chart at the beginning of the range and double
click again at the end of the range. You can also use F12 key in conjunction with "select"
mode (described above). Just select quote and press F12 for begin and SHIFT+F12 for the
range end. You can switch off the range marker by pressing CTRL+F12 key or double
clicking in the same place twice.
Range markers can be used to select zoom-in range (View->Zoom->Range) and to perform
calculations on selected values via BeginValue and EndValue AFL functions.
Adding / Closing Chart Panes
Each window can consist of several panes displaying various charts / indicators. To display a
new indicator in a separate chart pane just find the indicator in the Charts list (use View ->
Charts menu) and double-click on the indicator name. For more information see Drag& drop
charting tutorial.
To close any chart pane: click on the pane, then use either View->Pane->Close from main
menu or click on the pane with right mouse button and choose Close from context menu.
To draw an object on the chart switch on appropriate tool button (see picture below) and start
drawing on the chart by pointing the mouse and pressing left mouse button where you want to

Handbook- Advance Use of AmiBroker | 39 www.stockbangladesh.com
start the drawing. Then move the mouse. Study tracking line will appear. Release left mouse
button when you want to finish drawing. You can also cancel study drawing by pressing ESC
(escape) key.
If you over your mouse over the object you will see that cursor shape changes in the
proximity of the object. This means that
Using Drawing Tools
AmiBroker features extensive set of drawing tools:
The following tools are available:
trend line
ray
extended line
vertical line
horizontal line
parallel lines
Regression channels: Raff, standard deviation, standard error
Rectangle
Ellipse
Text
Triangle
Pitchfork
Arc
Cycles

Handbook- Advance Use of AmiBroker | 40 www.stockbangladesh.com
Fibonacci Retracement study (enhanced in 4.20)
Fibonacci Time zones study
Fibonacci Fan
Fibonacci arc
Gann Square (new in 4.20)
Gann Fan (new in 4.20)
Arc tool
They are available from Insert menu and Draw toolbar. Each drawing object can be moved,
resized, copied, deleted and modified after it is drawn
If cursor is near either end of the object it will change its shape to sizing pointer.
If the cursor is near remaining parts of the object it will change its shape to moving pointer
Once object is drawn it can be selected, moved, resized, deleted, copied.
To select the object simply move the mouse over the object so "moving pointer" appears and
click once - the object will be marked so the sizing handles (see first picture) will appear.
To de-select, click in the blank chart space.

Handbook- Advance Use of AmiBroker | 41 www.stockbangladesh.com
To size the object click on the sizing handle and drag to the desired location as shown in the
picture.
To move the object, click on any other part of the object and move to the desired location.
To delete object - select it first and press DEL (DELETE) key on the keyboard or use Edit-
>Delete menu or use Delete toolbar button.
To copy the object to the clipboard - select it first and press Ctrl+C or use Edit->Copy menu
or use Copy toolbar button.
To cut the object - select it first and press Ctrl+X or use Edit->Cut menu or use Cut toolbar
button.
To paste the object from the clipboard press Ctrl+V or use Edit->Paste or use Paste toolbar
button. Pasted object will drawn in the exactly same location as copied one and will be
selected automatically so you can move it to a new location.
To apply color or style to the object select it and use Format menu or Format tool bar buttons
to change color, thick, dotted and snap to price styles. Note that you can also select color and
style of the object before drawing new object: simply deselect previous object (if any),
change color / style selections and draw new object.
To modify properties of the object - either double click it or use Edit->Properties menu or
Alt+ENTER key
To delete all objects use Edit->Delete All menu.

Handbook- Advance Use of AmiBroker | 42 www.stockbangladesh.com
Customization of User Interface
Panels
A newly introduced customizable user-interface has several nice features that allow complete
control over look and feel of AmiBroker user interface.
Advanced nested docking / tear-off tabs

Handbook- Advance Use of AmiBroker | 43 www.stockbangladesh.com
To dock a pane into any side of the application or as a tab simply click on docking window
caption bar and drag it. If you do this, docking stickers will show up to make it easy to
choose destination place as shown below
You can also click on docking pane tab and drag it (tear off) and dock as a separate window.
This way you can arrange all docking windows either as separate windows or as tabs or as a
mixture of these two approaches. You can also make window / tab floating if you drag it
while holding down CTRL key.

Handbook- Advance Use of AmiBroker | 44 www.stockbangladesh.com
Sliding Auto-hide panes
Another very useful feature that allows to conserve precious real estate on your monitor is
auto-hiding of panes. To control (switch on/off) this feature there is a pinup button in the
upper right corner of each docking window. If you unpin it - the pane will automatically hide
when it loses focus.

Handbook- Advance Use of AmiBroker | 45 www.stockbangladesh.com

Handbook- Advance Use of AmiBroker | 46 www.stockbangladesh.com
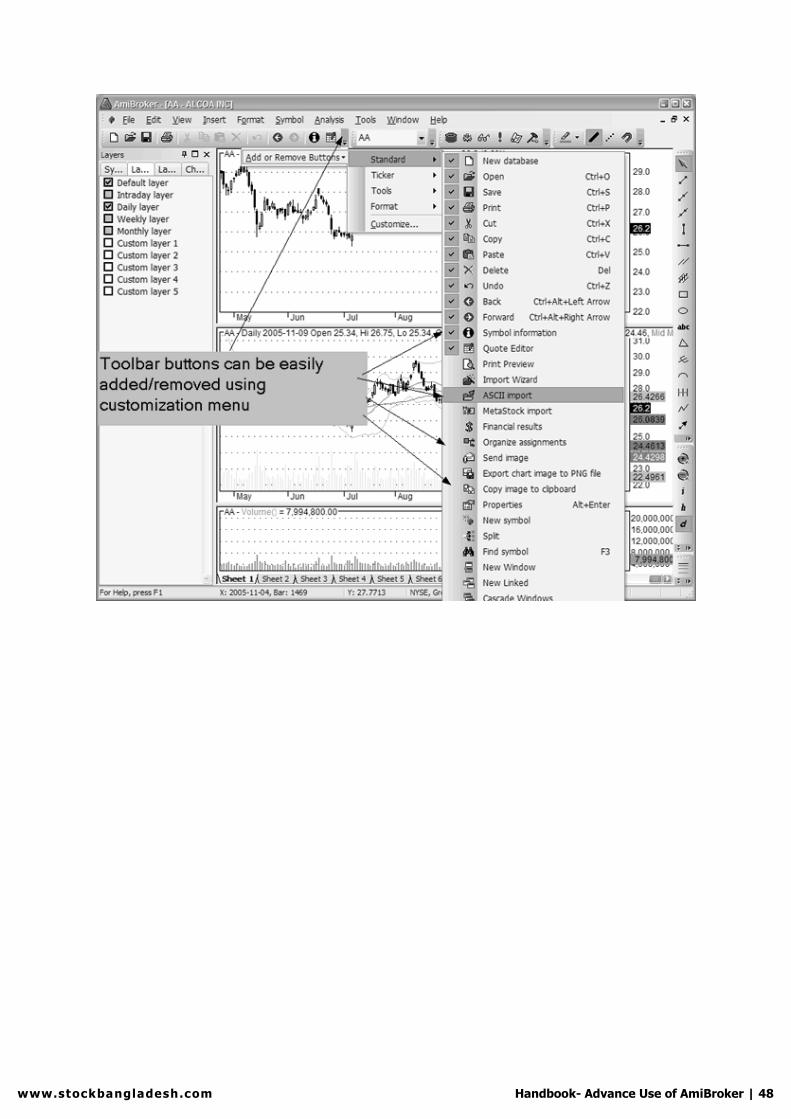
Advanced customizable toolbars, menus and keyboard shortcuts
New user interface allows full user control over appearance, layout and position of all
toolbars, buttons and menus. It allows you to add your own buttons, remove/re-arrange
existing ones. Also you define or re-define new/existing keyboard shortcuts. All these
customization features are available from Tools->Customize menu or from Customize
chevron menu.

Handbook- Advance Use of AmiBroker | 47 www.stockbangladesh.com
Chevron menu is available from little arrow button placed at the end of toolbar strip. It allows
to access auto-hidden elements of the toolbar as well as customization features.
Add or Remove buttons submenu allows to quickly show / hide toolbar buttons according to
your preference. In customization mode (when you enter it using Tools->Customize you can
also move buttons around to change the order in which they appear, and you can also resize
edit fields and combo fields (such as ticker selection field) by selecting them first and
resizing the border that will show after making selection.
Handbook- Advance Use of AmiBroker | 48 www.stockbangladesh.com

Handbook- Advance Use of AmiBroker | 49 www.stockbangladesh.com
Working with Chart Panel
How to use drag-and-drop charting interface
AmiBroker allows you to easily create and modify your indicators with few moves of a
mouse. From now on you can build sophisticated indicators without any programming
knowledge at all. The available (ready-to-use) indicators are listed in Charts tab of the
Workspace window.
How to insert a new indicator
To display a new indicator in a separate chart pane just find the indicator in the Charts list
(use View -> Charts menu) and double-click on the indicator name.
Alternatively you can choose Insert from the context menu. As a result new indicator pane
will be created and Parameters dialog will be displayed. Here you can change the properties
of the indicator (like color or periods). To accept the settings press OK button. (You will find
the detailed description of parameters window below).
Example:
To insert RSI pane - find RSI indicator in the list, double-click on the name, select the
number of periods and color, then press OK.

Handbook- Advance Use of AmiBroker | 50 www.stockbangladesh.com
How to overlay one indicator on another indicator
To overlay one indicator on another one, press LEFT mouse button on the indicator name,
drag (with mouse button held) the chosen indicator into the destination pane and release the
button.
Example:
To insert another RSI (based different periods number) into the same pane - drag RSI into the
previously created RSI pane, change the number of periods in the Parameters window and
press OK
Alternatively you can choose Overlay option from context menu.
How to delete the indicator
To remove the indicator, press Close button from the menu on the top right-hand side of the
indicator pane (the menu will be displayed if you place the mouse cursor in the nearby). This
menu allows you also to move the indicator pane up/down or maximize the pane.

Handbook- Advance Use of AmiBroker | 51 www.stockbangladesh.com
You can also use Close command from context menu that shows up when you click on the
chart pane with right mouse button.
How to remove the indicator plot from the pane
To remove one of the indicators displayed in the indicator pane - click with RIGHT mouse
button on the chart title (near the top of chart pane) and select the indicator that you want to
remove.
You can also remove the indicator plot using Delete Indicator option from chart context
menu.
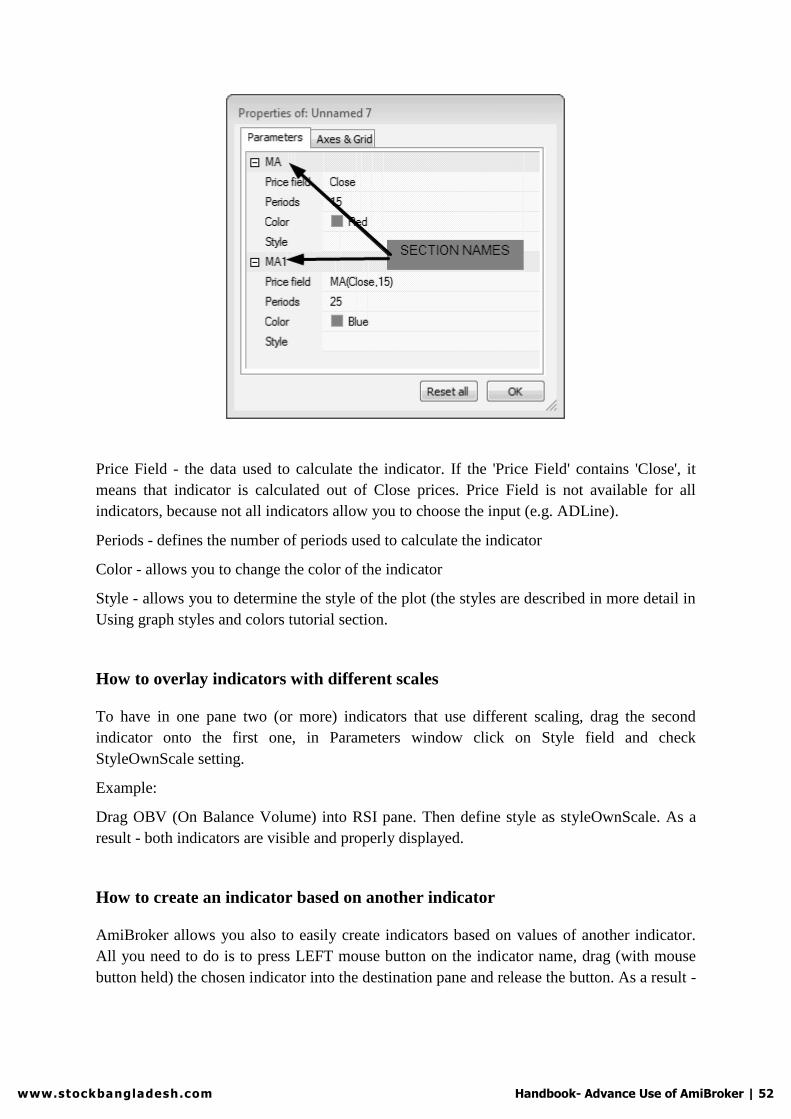
How to change parameters/colors/styles of indicators
The Parameters window allows you to change parameters, colors and styles of your
indicators. Parameters window is displayed when you insert a new indicator. You can also
click RIGHT mouse on the chart pane and choose Parameters from the context menu.
Parameters window displays all the parameters defined in AFL code of certain indicators
(also user-defined parameters) so it's contents depends on the indicator chosen. However - for
most of the indicators you will see:
Handbook- Advance Use of AmiBroker | 52 www.stockbangladesh.com
Price Field - the data used to calculate the indicator. If the 'Price Field' contains 'Close', it
means that indicator is calculated out of Close prices. Price Field is not available for all
indicators, because not all indicators allow you to choose the input (e.g. ADLine).
Periods - defines the number of periods used to calculate the indicator
Color - allows you to change the color of the indicator
Style - allows you to determine the style of the plot (the styles are described in more detail in
Using graph styles and colors tutorial section.
How to overlay indicators with different scales
To have in one pane two (or more) indicators that use different scaling, drag the second
indicator onto the first one, in Parameters window click on Style field and check
StyleOwnScale setting.
Example:
Drag OBV (On Balance Volume) into RSI pane. Then define style as styleOwnScale. As a
result - both indicators are visible and properly displayed.
How to create an indicator based on another indicator
AmiBroker allows you also to easily create indicators based on values of another indicator.
All you need to do is to press LEFT mouse button on the indicator name, drag (with mouse
button held) the chosen indicator into the destination pane and release the button. As a result -

Handbook- Advance Use of AmiBroker | 53 www.stockbangladesh.com
the indicator will be placed in the existing chart pane. In the parameters dialog Price field
parameters indicates what base values are used to calculate the indicator.
Example:
To calculate Simple Moving Average of previously created RSI indicator, drag the MA
indicator into RSI pane. The contents of "Price Field" parameter indicates, that Moving
Average is calculated out of RSI(15) values. (See the below picture).
Working with chart sheets and window layouts
AmiBroker manages multiple chart sheets and multi-window layouts with ability to quickly
load/save thems. This feature enables you to quickly switch between different indicator sets
saving your time dramatically.
Chart sheets and templates
A chart sheet is a set of chart panes (with indicators) displayed within single frame.
You can switch between different sheets by clicking on the tabs located in the bottom of
AmiBroker window as show in the following picture:
You can change the name of the tab by clicking on it with RIGHT mouse button, so the
following window appears:
Handbook- Advance Use of AmiBroker | 54 www.stockbangladesh.com
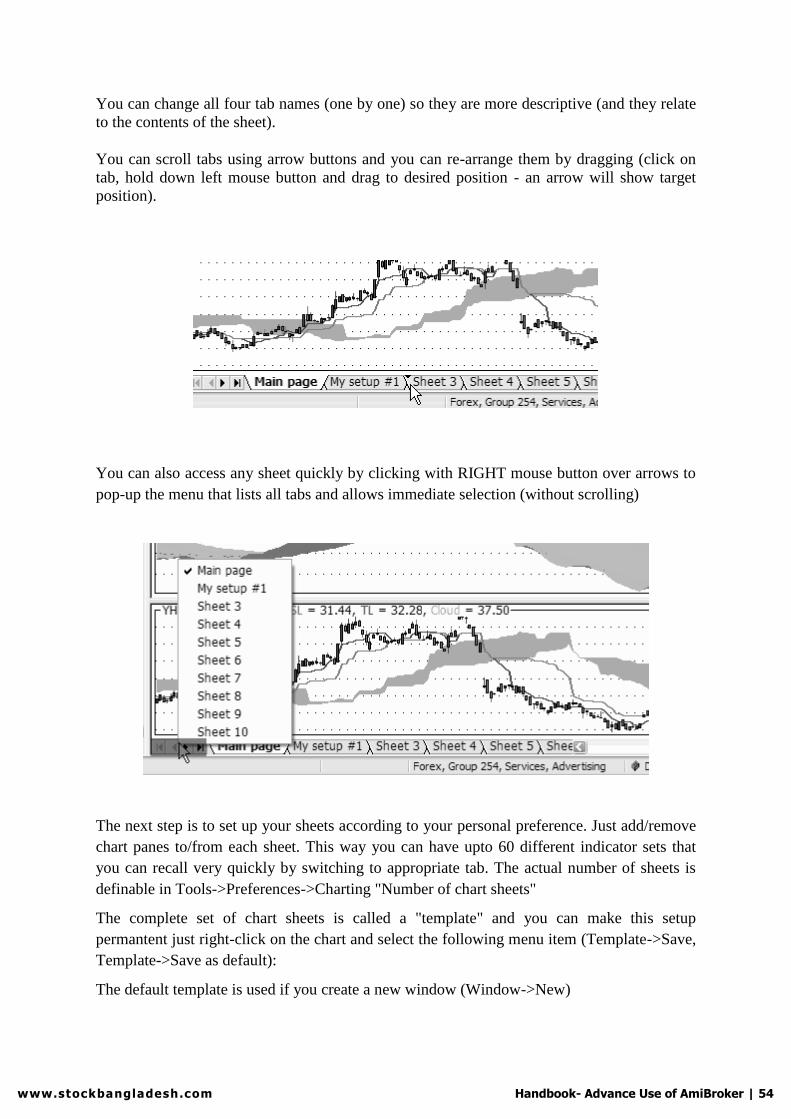
You can change all four tab names (one by one) so they are more descriptive (and they relate
to the contents of the sheet).
You can scroll tabs using arrow buttons and you can re-arrange them by dragging (click on
tab, hold down left mouse button and drag to desired position - an arrow will show target
position).
You can also access any sheet quickly by clicking with RIGHT mouse button over arrows to
pop-up the menu that lists all tabs and allows immediate selection (without scrolling)
The next step is to set up your sheets according to your personal preference. Just add/remove
chart panes to/from each sheet. This way you can have upto 60 different indicator sets that
you can recall very quickly by switching to appropriate tab. The actual number of sheets is
definable in Tools->Preferences->Charting "Number of chart sheets"
The complete set of chart sheets is called a "template" and you can make this setup
permantent just right-click on the chart and select the following menu item (Template->Save,
Template->Save as default):
The default template is used if you create a new window (Window->New)

Handbook- Advance Use of AmiBroker | 55 www.stockbangladesh.com
You can also load once saved template by choosing Template->Load from chart's right
mouse button menu.
In addition to old local template format a new one is added with .chart extension that keeps
not only window sizes and formula references (paths) but also formulas themselves, so all
you need to do is to save your chart into one file (Chart Template, Complete *.chart) and
copy that file onto different computer and chart will be recreated with all formulas linked to
it.
To Save chart into new format do the following:
1. Click with RIGHT MOUSE button over the chart and select Template->Save...
2. In the file dialog, "Files of type" combo select "Chart Template, Complete (*.chart)"
3. Type the file name and click Save.
To load previously saved complete chart do the following:
1. Click with RIGHT MOUSE button over the chart and select Template->Load...
2. In the file dialog, select previously saved *.chart file and press "Open"
Note: The procedure AmiBroker does internally is as follows: When you save the chart into
new format it saves XML file with:
a) names of all sheets, panes, their sizes, locations and other settings
b) paths to all formulas used by all panes

Handbook- Advance Use of AmiBroker | 56 www.stockbangladesh.com
c) the text of formulas themselves
When you load the chart in new format AmiBroker:
a) sets up the sheets/panes according to information stored in the file
b) for each formula stored in the file it checks if the same formula exists already on target
computer:
- if it does not exist - it will create one
- if it exists and the contents is identical to the formula stored in .chart file it will do nothing
- if it exists and the contents is different then it will create NEW formula file with
_imported.afl suffix (so old file is not touched) and will reference the pane to the
_imported.afl formula instead.
A new .chart format is intended to be used to port charts between different computers. For
storing layouts/templates on local computer you should rather use old formats as they
consume much less space (they store only references,not the formulas themselves). One may
however use new format for archiving purposes as it keeps formulas and all references in one
file that is very convenient for backups.
Working with Layers
What layers are
Layers are like pieces of transparent plastic. You can put drawings on them. Layers can be
made visible or invisible. This allows to show/hide drawings placed on given layer without
affecting the drawings placed on other layers.
How to work with layers
First of all make sure that Workspace window is visible (View->Workspace)
Then switch to "Layers" tab. Here you can see the list of pre-defined layers.
The checkboxes on the left side of each layer control layer visibility. If checkbox is marked
than given layer is visible, if it is unmarked - the layer is invisible. Initially first five layers
will be "locked" to intervals.
These built-in layers are:
Default layer - always visible
Intraday layer - visible only when viewing intraday charts
Daily layer - visible only when viewing daily charts
Weekly layer - visible only when viewing weekly charts

Handbook- Advance Use of AmiBroker | 57 www.stockbangladesh.com
Monthly layer - visible only when viewing monthly charts
A locked layer changes its visibility automatically when interval changes and you can not
change its visibility by clicking on the left-side checkbox.
The remaining layers are not locked and they can be shown/hidden freely by marking the
checkbox.
To draw a study in a given layer simply
a) SELECT the layer first (click on name to highlight it)
b) DRAW the study as usual
As long you select the other layer all drawings will be placed on selected layer. After drawing
a study you can assign it to any other layer via object properties box.
Context menu
If you click on layer name with right mouse button you will see the context menu containing
the following options:
Add layer
Remove layer
Show all layers
Hide all layers
Toggle
Unlock built-in layers
Lock built-in layers
Properties.
Add/Remove layer are self-explanatory. Please note that you can not remove first 5 (built-in)
layers
Show all/Hide all - shows and hides all NOT LOCKED layers
Toggle - toggles visibility of all NOT LOCKED layers
Unlock/Lock built-in layers - allows you to unlock/lock 5 first (built-in) layers. Once layer is
unlocked its visibility does not change automatically when interval changes and you can
show/hide it manually.
Properties - this launches properties box that allows you to rename layer and decide if given
layer should or should not be locked to interval displayed.
If you mark "Lock visibility to interval" box the layer will show/hide automatically
depending on what interval is

Handbook- Advance Use of AmiBroker | 58 www.stockbangladesh.com
currently displayed. You can define visibility for each layer using "Interval" combo and
"Show/hide automatically" buttons. Note that there is a *separate* visibility setting for
EACH interval. The layer properties box ALWAYS shows "monthly" interval at start but this
is just a startup condition you just switch to particular interval
and modify visibility. To setup locked layer completely you have to set visibility for every
layer listed in the "Interval" combo-box. Simply select the interval and choose if layer should
be shown or hidden for this interval, select next interval and again choose show or hide,
select next and so on...until you define visibility for all intervals.

Handbook- Advance Use of AmiBroker | 59 www.stockbangladesh.com
Working with Automatic Analysis
Automatic analysis window enables you to check your quotations against defined buy/sell
rules. AmiBroker can produce report telling you if buy/sell signals occurred on given symbol
in the specified period of time. It can also simulate trading, giving you an idea about
performance of your system.
In the upper part of window you can see the path to the formula used along with Pick and
Edit buttons.
Pick button opens up a file dialog that allows you to choose the formula you want to use for
the analysis.
Edit button opens up the AFL Formula Editor that allows you to edit currently selected
formula.
If you want to create new formula just open Formula Editor directly from Tools->Formula
Editor menu, type the formula and press Analysis button in the Formula Editor toolbar.
In the formula editor you need to write the code that specifies either scan/exploration you
want to run or a trading system you want to back test. You can find the description of this
language in AFL reference guide.

Handbook- Advance Use of AmiBroker | 60 www.stockbangladesh.com
In order to make things work you should write two assignment statements (one for buy rule,
second for the sell rule), for example:
buy = cross( macd(), 0 );
sell = cross( 0, macd() );
Controls for setting
To which symbol(s) analysis should be applied.
You can select here all symbols, only currently selected symbol (selected in Select Window)
or custom filter setting
Time range of analysis
analysis can be applied to all available quotations or only to the defined number of most
recent quotations (or days) or to a date range (from/to)
In the lower part of the analysis window you can see 4 buttons:
Scan
this starts the signal scan mode - AmiBroker will search through defined range of symbols
and quotations for buy/sell signals defined by your trading rules.If one of the buy/sell
conditions is fulfilled, AmiBroker will display a line describing when and on which symbol
the signal has occurred. Next AmiBroker proceeds to the end of the range so multiple signals
on single symbol may be generated.
Explore
this starts an exploration mode when AmiBroker scans through database to find symbols that
match user-defined filter. The user can define output columns that show any kind of
information required. For more information please check out "Tutorial: How to create your
own exploration"
Back Test
this starts the back-testing mode - AmiBroker will search through defined range of symbols
and quotation for BUY signal defined by your buy rule. If the buy rule is fulfilled,
AmiBroker will "buy" currently analyzed shares. Next it will search for SELL signal. Then, if
sell rule is fulfilled, AmiBroker will "sell" previously bought symbols. At the same time it
will display the information about this trading in the listview. After performing simulation the
summary will be displayed. Read more in "Tutorial: How to backtest your trading system"...
Handbook- Advance Use of AmiBroker | 61 www.stockbangladesh.com
The back testing parameters could be changed using Settings window.
Settings - allows you to change back tester settings
Optimize - allows you to optimize your trading system. Read more in the "Tutorial: How to
optimize your trading system"...
Check - this option allows you to check if your formula references future quotes. AmiBroker
analyses your formula and detects if it uses quotes past current bar. Please note that formulas
referencing future can give unrealistic backtesting results that can not be reproduced in real
trading, therefore you should avoid systems that reference future.
Report - this displays Report window that allows you to watch, print and save test results
Equity - available only after backtesting - displays Equity curve for currently selected symbol
in a new chart pane. Check out "AFL: Equity chart and function".
Export - allows you to export the results to CSV (comma separated values) file
Close - this closes the analysis window

Handbook- Advance Use of AmiBroker | 62 www.stockbangladesh.com
Working with exploration
One of the most useful features of Automatic Analysis window is called "Exploration".
Basically, an exploration works in a similar wayto scan butinstead of looking forand
reporting just buy/sell signalsit allowsyouto generate customizable screening (orexploration)
report that can giveyoumuchmoreinformation thansimple scan.
The idea behind an exploration is simple - one variable called filter controls which
symbols/quotes are accepted. If "true" (or1) is assigned to that variable forgiven
symbol/quote it willbe displayed in thereport.
So, forexample, thefollowing formula willacceptall symbols with closingpricesgreater
than50:
Filter =close >50;
(NOTE:To createnew formula pleaseopenFormula Editor usingAnalysis->Formula Editor
menu, typetheformula and chooseTools->Send to Automatic Analysis menuin Formula
editor)
Notethat exploration uses all rangeand filter settings that are also used by back-tester and
scanning modesso youcan get multiple signals(report lines) if youselect"Allquotations" range.
To checkjust the most recentquoteyoushouldchoose"n last quotations" and "n=1" as
shownhere:
Customizable reports
Yes, exploration modeallowsyouto createand thenexport a report with completely
customizable columns and it is quite simple to do.
All you have to do is to tell AmiBroker what columns you want. This can be done by calling
AddColumn function in your exploration formula:
Handbook- Advance Use of AmiBroker | 63 www.stockbangladesh.com
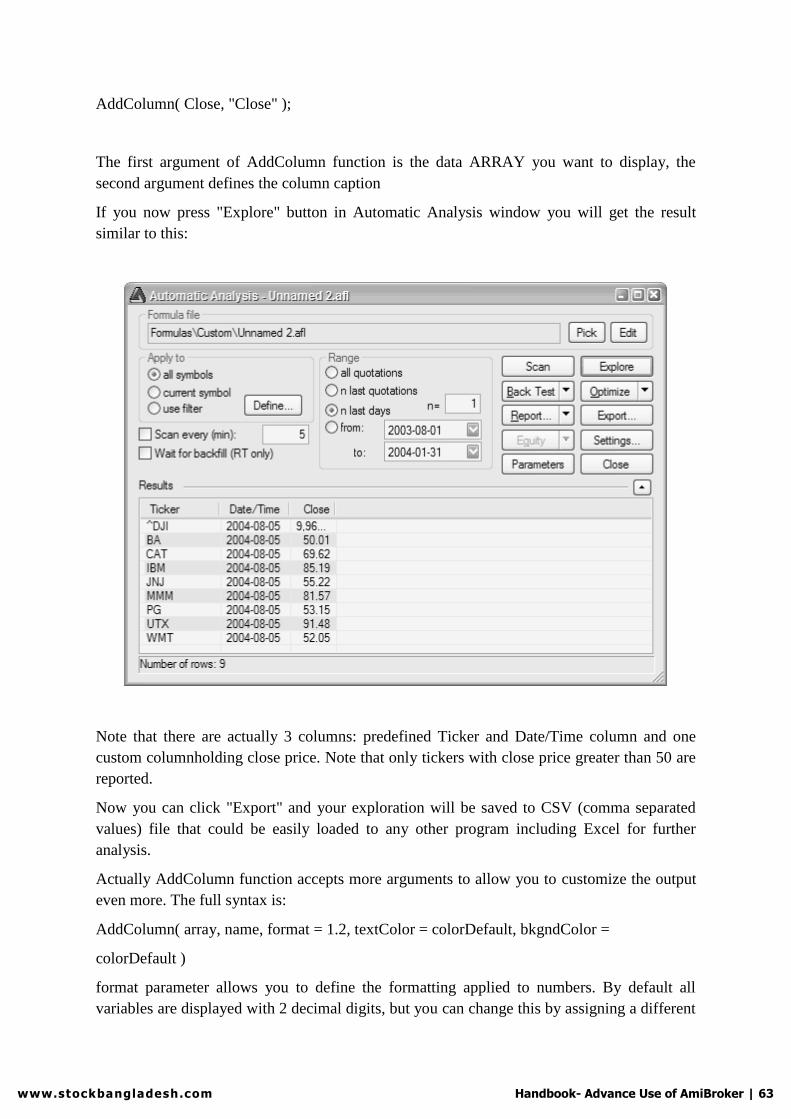
AddColumn( Close, "Close" );
The first argument of AddColumn function is the data ARRAY you want to display, the
second argument defines the column caption
If you now press "Explore" button in Automatic Analysis window you will get the result
similar to this:
Note that there are actually 3 columns: predefined Ticker and Date/Time column and one
custom columnholding close price. Note that only tickers with close price greater than 50 are
reported.
Now you can click "Export" and your exploration will be saved to CSV (comma separated
values) file that could be easily loaded to any other program including Excel for further
analysis.
Actually AddColumn function accepts more arguments to allow you to customize the output
even more. The full syntax is:
AddColumn( array, name, format = 1.2, textColor = colorDefault, bkgndColor =
colorDefault )
format parameter allows you to define the formatting applied to numbers. By default all
variables are displayed with 2 decimal digits, but you can change this by assigning a different

Handbook- Advance Use of AmiBroker | 64 www.stockbangladesh.com
value to this variable: 1.5 gives 5 decimal digits, 1.0 gives no decimal digits. So, in our
example, typing:
AddColumn( Close, "Close", 1.4 );
will give closing prices displayed with 4 decimal digits.
(Note for advanced users: the integer part of this number can be used to pad formatted
number with spaces - 6.0 will give no decimal digits but a number space-padded upto 6
characters.)
There are also special format pre-defined constants that allow to display date/time and single
character codes:
zformatDateTime - produces date time formated according to your system settings
AddColumn(DateTime(), "Date / Time", formatDateTime );
zformatChar - allows outputting single ASCII character codes: Example (produces signal file
accepted by various other programs): Buy=Cross(MACD(),Signal());
Sell=Cross(Signal(), MACD()); Filter=Buy OR Sell; SetOption("NoDefaultColumns", True);
AddColumn(DateTime(), "Date", formatDateTime );
AddColumn(IIf( Buy, 66, 83 ), "Signal", formatChar );
textColor and bkgndColor arguments allow you to produce colorful reports. By default result
list is displayed using system color but you can override this behaviour providing your own
colors.
For example, the code that displays close price in green color when 1 day rate of change is
positive and otherwise uses red color:
AddColumn( Close, "Close", 1.4, IIF( ROC(C, 1 ) > 0, colorGreen, colorRed ) );
Examples
The exploration mode is extermely flexible: you can, for example, export the whole database
to
CSV file using the following formula:
filter = 1; /* all symbols and quotes accepted */ AddColumn(Open,"Open",1.4);
AddColumn(High,"High",1.4);
AddColumn(Low,"Low",1.4);
AddColumn(Close,"Close",1.4);
AddColumn(Volume,"Volume",1.0);
This one will show you only heavily traded securities:
filter = volume > 5000000; /* adjust this threshold for your own needs
*/

Handbook- Advance Use of AmiBroker | 65 www.stockbangladesh.com
AddColumn(Close,"Close",1.4); AddColumn(Volume,"Volume",1.0);
or...just show securities with volume being 30% above its 40-day exponential average
filter = volume > 1.3 * ema( volume, 40 ); AddColumn(Close,"Close",1.4);
AddColumn(Volume,"Volume",1.0);
With this one, you can export multiple indicator values for further analysis:
filter = close > ma( close, 20 ); /* only stocks trading aboveits 20 day MA*/
AddColumn(macd(), "MACD",1.4 ); AddColumn( signal(), "Signal", 1.4 );
AddColumn(adx(), "ADX", 1.4 ); AddColumn( rsi(), "RSI", 1.4 );
AddColumn( roc( close, 15 ), "ROC(15)", 1.4 ); AddColumn( mfi(), "MFI", 1.4 );
AddColumn(obv(), "OBV", 1.4 ); AddColumn( cci(), "CCI", 1.4 );
AddColumn( ultimate(), "Ultimate", 1.4 );
One more example of color output:
Filter =1;
AddColumn( Close, "Close", 1.2 );
AddColumn( MACD(),"MACD",1.4 , IIf( MACD() > 0, colorGreen, colorRed ) );
AddTextColumn(FullName(), "Full name", 77 , colorDefault, IIf( Close <
10, colorLightBlue, colorDefault ) );

Handbook- Advance Use of AmiBroker | 66 www.stockbangladesh.com
Back-Testing
Introduction
One of the most useful things that you can do in automatic analysis window is to back-test
your trading strategy on historical data. This can give you valuable insight into strengths and
weak points of your system before investing real money. This single AmiBroker feature is
can save lots of money for you.
Writing your trading rules
First you need to have objective (or mechanical) rules to enter and exit the market. This step
is the base of your strategy and you need to think about it yourself since the system must
match your risk tolerance, portfolio size, money management techniques, and many other
individual factors.
Once you have your own rules for trading you should write them as buy and sell rules in
AmiBroker Formula Lanugage (plus short and cover if you want to test also short trading).
In this chapter we will consider very basic moving average cross over system. The system
would buy stocks/contracts when close price rises above 45-day exponential moving average
and will sell stocks/contracts when close price falls below 45-day exponential moving
average.
The exponential moving average can be calculated in AFL using its built-in function EMA.
All you need to do is to specify the input array and averaging period, so the 45-day
exponential moving average of closing prices can be obtained by the following statement:
ema( close, 45 );
The close identifier refers to built-in array holding closing prices of currently analysed
symbol. To test if the close price crosses above exponential moving average we will use
built-in cross
function:
buy = cross( close, ema( close, 45 ) );
The above statement defines a buy trading rule. It gives "1" or "true" when close price crosses
above ema( close, 45 ). Then we can write the sell rule which would give "1" when opposite
situation happens - close price crosses below ema( close, 45 ):
sell = cross( ema( close, 45 ), close );
Please note that we are using the same cross function but the opposite order of arguments. So
complete formula for long trades will look like this:
buy = cross( close, ema( close, 45 ) );
sell = cross( ema( close, 45 ), close );

Handbook- Advance Use of AmiBroker | 67 www.stockbangladesh.com
NOTE: To create new formula please open Formula Editor using Analysis->Formula Editor
menu, type the formula and choose Tools->Send to Automatic Analysis menu in Formula
editor
Back testing
To back-test your system just click on the Back test button in the Automatic analysis window.
Make sure you have typed in the formula that contains at least buy and sell trading rules
(asshown above). When the formula is correct AmiBroker starts analysing your symbols
according to your trading rules and generates a list of simulated trades. The whole process is
very fast - you can back test thousands of symbols in a matter of minutes. The progress
window will show you estimated completion time. If you want to stop the process you can
just click Cancel button in the progress window.
Analysing results
When the process is finished the list of simulated trades is shown in the bottom part of
Automatic analysis window. (the Results pane). You can examine when the buy and sell
signals occurred just by double clicking on the trade in Results pane. This will give you raw
or
unfiltered signals for every bar when buy and sell conditions are met. If you want to see only
single trade arrows (opening and closing currently selected trade) you should double click the
line while holding SHIFT key pressed down. Alternatively you can choose the type of display
by selecting appropriate item from the context menu that appears when you click on the
results pane with a right mouse button.
In addition to the results list you can get very detailed statistics on the performance of your
system by clicking on the Report button. To find out more about report statistics please check
out report window description.
Changing your back testing settings
Back testing engine in AmiBroker uses some predefined values for performing its task
including the portfolio size, periodicity (daily/weekly/monthly), amount of commission,
interest rate, maximum loss and profit target stops, type of trades, price fields and so on. All
these settings could be changed by the user using settings window. After changing settings
please remember to run your back testing again if you want the results to be in-sync with the
settings.

Handbook- Advance Use of AmiBroker | 68 www.stockbangladesh.com
For example, to back test on weekly bars instead of daily just click on the Settings button
select Weekly from Periodicity combo box and click OK, then run your analysis by clicking
Back test.
Reserved variable names
The following table shows the names of reserved variables used by Automatic Analyser. The
meaning and examples on using them are given later in this chapter.
Variable Usage Applies to
buy defines "buy" (enter long position) trading rule Automatic
Analysis,
Commentary
sell defines "sell" (close long position) trading rule Automatic
Analysis,
Commentary
short defines "short" (enter short position - short sell) trading rule Automatic
Analysis
cover defines "cover" (close short position - buy to cover) trading rule Automatic
Analysis
buyprice defines buying price array (this array is filled in with the default
values according to the Automatic Analyser settings)
Automatic
Analysis
sellprice defines selling price array (this array is filled in with the default
values according to the Automatic Analyser settings)
Automatic
Analysis
shortprice defines short selling price array (this array is filled in with the Automatic
default values according to the Automatic Analyser settings) Analysis
coverprice defines buy to cover price array (this array is filled in with the
default values according to the Automatic Analyser settings)
Automatic
Analysis
exclude If defined, a true (or 1) value of this variable excludes current
symbol from scan/exploration/back test. They are also not
considered in buy and hold calculations. Useful when you want to
narrow your analysis to certain set of symbols.
Automatic
Analysis
roundlotsize defines round lot sizes used by backtester (see explanations below) Automatic
Analysis (new in
4.10)
ticksize defines tick size used to align prices generated by built-in stops
(see explanations below) (note: it does not affect entry/exit prices
specified by buyprice/sellprice/shortprice/coverprice)
Automatic
Analysis (new in
4.10)
pointvalue allows to read and modify future contract point value (see
backtesting futures)
CAVEAT: this AFL variable is by default set to 1 (one) regardless
of contents of Information window UNLESS you turn ON futures
mode (SetOption("FuturesMode", True ))
Automatic
Analysis (new in
4.10)

Handbook- Advance Use of AmiBroker | 69 www.stockbangladesh.com
margindeposit allows to read and modify future contract margin (see backtesting
futures)
Automatic
Analysis (new in
4.10) positionsize Allows control dollar amount or percentage of portfolio that is
invested into the trade (see explanations below)
Automatic
Analysis (new in
3.9)
Advanced concepts
Until now we discussed fairly simple use of the back tester. AmiBroker, however supports
much more sophisticated methods and concepts that will be discussed later on in this chapter.
Please note that the beginner user should first play a little bit with the easier topics described
above before proceeding.
So, when you are ready, please take a look at the following recently introduced features of the
back-tester:
a) AFL scripting host for advanced formula writers b) enhanced support for short trades
c) the way to control order execution price from the script
d) various kinds of stops in back tester e) position sizing
f) round lot size and tick size g) margin account
h) backtesting futures
AFL scripting host is an advanced topic that is covered in a separate document available here
and I won't discuss it in this document. Remaining features are much more easy to
understand.
Controlling trade price
AmiBroker now provides 4 new reserved variables for specifying the price at which buy, sell,
short and cover orders are executed. These arrays have the following names: buyprice,
sellprice, shortprice and coverprice.
The main application of these variables is controlling trade price:
BuyPrice = IIF(dayofweek() == 1, HIGH, CLOSE );
// on monday buy at high, otherwise buy on close
So you can write the following to simulate real stop-orders:

Handbook- Advance Use of AmiBroker | 70 www.stockbangladesh.com
BuyStop = ... the formula for buy stop level; SellStop = ... the formula for sell stop level;
// if anytime during the day prices rise above buystop level
(high>buystop)
// the buy order takes place (at buystop or low whichever is higher) Buy = Cross( High,
BuyStop );
// if anytime during the day prices fall below sellprice level ( low<
sellstop )
// the sell order takes place (at sellstop or high whichever is lower) Sell = Cross(SellPrice,
SellStop);
BuyPrice = max(BuyStop, Low ); // make sure buy price not less than
Low
SellPrice = min(SellStop, High ); // make sure sell price not greater than High
Please note that AmiBroker presets buyprice, sellprice, shortprice and coverprice array
variables with the values defined in system test settings window (shown below), so you can
but don't need to define them in your formula. If you don't define them AmiBroker works as
in the old versions.
During back-testing AmiBroker will check if the values you assigned to buyprice, sellprice,
shortprice, coverprice fit into high-low range of given bar. If not, AmiBroker will adjust it to
high price (if price array value is higher than high) or to the low price (if price array value is
lower than low)

Handbook- Advance Use of AmiBroker | 71 www.stockbangladesh.com

Handbook- Advance Use of AmiBroker | 72 www.stockbangladesh.com
Profit target stops
As you can see in the picture above, new settings for profit target stops are available in the
system test settings window. Profit target stops are executed when the high price for a given
day exceedes the stop level that can be given as a percentage or point increase from the
buying price. By default stops are executed at price that you define as sell price array (for
long trades) or cover price array (for short trades). This behaviour can be changed by using
"Exit at stop" feature.
"Exit at stop" feature
If you mark "Exit at stop" box in the settings the stops will be executed at exact stop level,
i.e. if you define profit target stop at +10% your stop and the buy price was 50 stop order will
be executed at 55 even if your sell price array contains different value (for example closing
price of 56).

Handbook- Advance Use of AmiBroker | 73 www.stockbangladesh.com
Maximum loss stops work in a similar manner - they are executed when the low price for a
given day drops below the stop level that can be given as a percentage or point increase from
the buying price
Trailing stops
This kind of stop is used to protect profits as it tracks your trade so each time a position value
reaches a new high, the trailing stop is placed at a higher level. When the profit drops below
the trailing stop level the position is closed. This mechanism is illustrated in the picture below
(10% trailing stop is shown):
The trailing stop, as well as two other kind of stops could be enabled from user interface
(Automatic analysis' Settings window) or from the formula level - using ApplyStop function:
To reproduce the example above you would need to add the following code to your automatic
analysis formula:
ApplyStop( 2, 1, 10, 1 ); // 10% trailing stop, percent mode, exit at stop ON
or you can write it using predefined constants that are more descriptive
ApplyStop(stopTypeTrail, stopModePercent, 10, True );

Handbook- Advance Use of AmiBroker | 74 www.stockbangladesh.com
Trailing stops could be also defined in points (dollars) and percent of profit (risk). In the
latter case the amount parameter defines the percentage of profits that could be lost without
activating the stop. So 20% percent of profit (risk) stop will exit your trade that has maximum
profit of $100 when the profit decreases below $80.
Dynamic stops
The ApplyStop() function allows now to change the stop level from trade to trade. This
enables you to implement for example volatility-based stops very easily.
For example to apply maximum loss stop that will adapt the maximum acceptable loss based
on 10 day average true range you would need to write:
ApplyStop( 0, 2, 2 * ATR( 10 ), 1 );
or you can write it using predefined constants that are more descriptive
ApplyStop(stopTypeLoss, stopModePoint, 2 * ATR( 10 ), True );
The function above will place the stop 2 times 10 day ATR below entry price.
As ATR changes from trade to trade - this will result in dynamic, volatility based stop level.
Please note that 3rd parameter of ApplyStop function (the amount) is sampled at the trade
entry and held troughout the trade. So in the example above it uses ATR(10) value from the
date of the entry. Further changes of ATR do not affect the stop level.
See complete APPLYSTOP function documentation for more details.
Coding your own custom stop types
ApplyStop function is intended to cover most "popular" kinds of stops. You can however
code your own kind of stops and exits using looping code. For example the following re-
implements profit target stop and shows how to refer to the trade entry price in your
formulas:
/* a sample low-level implementation of Profit-target stop in AFL: */
Buy = Cross( MACD(), Signal() );
priceatbuy=0;
for( i = 0; i <BarCount; i++ )
{
if(priceatbuy == 0 && Buy[ i ] )
priceatbuy = BuyPrice[ i ];
if(priceatbuy> 0 &&SellPrice[ i ] > 1.1 * priceatbuy )
{

Handbook- Advance Use of AmiBroker | 75 www.stockbangladesh.com
Sell[ i ] = 1;
SellPrice[ i ] = 1.1 * priceatbuy;
priceatbuy = 0;
}
else
Sell[ i ] = 0;
}
Position sizing
This is a new feature in version 3.9. Position sizing in backtester is implemented by means of
new reserved variable
PositionSize = <size array>
Now you can control dollar amount or percentage of portfolio that is invested into the trade
positive number define (dollar) amount that is invested into the trade for example:
PositionSize = 1000; // invest $1000 in every trade
negative numbers -100..-1 define percentage:
-100 gives 100% of current portfolio size,
-33 gives 33% of available equity for example:
PositionSize = -50; /* always invest only half of the current equity */
dynamic sizing example:
PositionSize = - 100 + RSI();
as RSI varies from 0..100 this will result in position depending on RSI values -> low values
of RSI will result in higher percentage invested
If less than 100% of available cash is invested then the remaining amount earns interest rate
as defined in the settings.
There is also a new checkbox in the AA settings window: "Allow position size shrinking" -
this controls how backtester handles the situation when requested position size (via
PositionSize variable) exceeds available cash: when this flag is checked the position is
entered with size shinked to available cash if it is unchecked the position is not entered.
To see actual position sizes please use a new report mode in AA settings window: "Trade list
with prices and pos. size"
For the end, here is an example of Tharp's ATR-based position sizing technique coded in
AFL:
Buy = <your buy formula here>

Handbook- Advance Use of AmiBroker | 76 www.stockbangladesh.com
Sell = 0; // selling only by stop
TrailStopAmount = 2 * ATR( 20 );
Capital = 100000; /* IMPORTANT: Set it also in the Settings: Initial Equity */
Risk = 0.01*Capital;
PositionSize = (Risk/TrailStopAmount)*BuyPrice;
ApplyStop( 2, 2, TrailStopAmount, 1 );
The technique summarized
The total equity per symbol is $100,000, we set the risk level at 1% of total equity. Risk level
is defined as follows: if a trailing stop on a $50 stock is at, say, $45 (the value of two ATR's
against the position), the $5 loss is divided into the $1000 risk to give 200 shares to buy. So,
the loss risk is $1000 but the allocation risk is 200 shares x $50/share or $10,000. So, we are
allocating 10% of the equity to the purchase but only risking $1000. (Edited excerpt from the
AmiBroker mailing list)
Round lot size and tick size
Round lot size
Various instruments are traded with various "trading units" or "blocks". For example you can
purchase fractional number of units of mutual fund, but you can not purchase fractional
number of shares. Sometimes you have to buy in 10s or 100s lots. AmiBroker now allows
you to specify the block size on global and per-symbol level.
You can define per-symbol round lot size in the Symbol->Information page (pic. 3). The
value of zero means that the symbol has no special round lot size and will use "Default round
lot size" (global setting) from the Automatic Analysis settings page (pic. 1). If default size is
set also to zero it means that fractional number of shares/contracts are allowed.
You can also control round lot size directly from your AFL formula using RoundLotSize
reserved variable, for example:
RoundLotSize = 10;
Tick size
This setting controls the minimum price move of given symbol. You can define it on global
and per-symbol level. As with round lot size, you can define per-symbol tick size in the
Symbol->Information page (pic. 3). The value of zero instructs AmiBroker to use "default
tick size" defined in the Settings page (pic. 1) of Automatic Analysis window. If default tick
size is also set to zero it means that there is no minimum price move.

Handbook- Advance Use of AmiBroker | 77 www.stockbangladesh.com
You can set and retrieve the tick size also from AFL formula using TickSize reserved
variable, for example:
TickSize = 0.01;
Note that the tick size setting affects ONLY trades exited by built-in stops and/or
ApplyStop(). The backtester assumes that price data follow tick size requirements and it does
not change price arrays supplied by the user.
So specifying tick size makes sense only if you are using built-in stops so exit points are
generated at "allowed" price levels instead of calculated ones. For example in Japan - you can
not have fractional parts of yen so you should define global ticksize to 1, so built-in stops exit
trades at integer levels.

Handbook- Advance Use of AmiBroker | 78 www.stockbangladesh.com
Reading Backtest report
To view the report of last backest simply click Report button in the automatic analysis
window. To view results of ALL past backtest, click drop down arrow on the Report button
and choose Report Explorer option. This will display the Report Explorer window that will
show the list of all backtests performed. If you double click on the line - detailed report will
be shown.
New report is hugely enhanced compared to old one. It includes separate statistics for all,
long and short sides as well as large number of new metrics. You can get short help on given
figure by hovering your mouse over given field name. You will see the description in the
tooltip. Short explanations are provided also below:
Exposure % - 'Market exposure of the trading system calculated on bar by bar basis. Sum of
bar exposures divided by number of bars. Single bar exposure is the value of open positions
divided by portfolio equity.
Net Risk Adjusted Return % - Net profit % divided by Exposure %
Annual Return % - Compounded Annual Return % (CAR)
Risk Adjusted Return % - Annual return % divided by Exposure %
Avg. Profit/Loss - (Profit of winners + Loss of losers)/(number of trades)
Avg. Profit/Loss % - '(% Profit of winners + % Loss of losers)/(number of trades)
Avg. Bars Held - sum of bars in trades / number of trades
Max. trade drawdown - The largest peak to valley decline experienced in any single trade.
The lower the better
Max. trade % drawdown - The largest peak to valley percentage decline experienced in any
single trade. The lower the better
Max. system drawdown - The largest peak to valley decline experienced in portfolio equity.
The lower the better
Max. system % drawdown - The largest peak to valley percentage decline experienced in
portfolio equity. The lower the better
Recovery Factor - Net profit divided by Max. system drawdown
CAR/MaxDD - Compound Annual % Return divided by Max. system % drawdown. Good if
bigger than 2
RAR/MaxDD - Risk Adjusted Return divided by Max. system % drawdown. Good if bigger
than 2.
Profit Factor - Profit of winners divided by loss of losers
Payoff Ratio - Ratio average win / average loss
Standard Error - Standard error measures chopiness of equity line. The lower the better.

Handbook- Advance Use of AmiBroker | 79 www.stockbangladesh.com
Risk-Reward Ratio - Measure of the relation between the risk inherent in a trading the system
compared to its potential gain. Higher is better. Calculated as slope of equity line (expected
annual return) divided by its standard error.
Ulcer Index - Square root of sum of squared drawdowns divided by number of bars
Ulcer Performance Index - (Annual profit - Tresury notes profit)/Ulcer Index'>Ulcer
Performance Index. Currently tresury notes profit is hardcoded at 5.4. In future version there
will be user-setting for this.
Sharpe Ratio of trades - Measure of risk adjusted return of investment. Above 1.0 is good,
more than 2.0 is very good. Calculation: first average percentage return and standard
deviation of returns is calculated. Then these two figures are annualized by multipling them
by ratio (NumberOfBarsPerYear)/(AvgNumberOfBarsPerTrade). Then the risk free rate of
return is subtracted (currently hard-coded 5) from annualized average return and then divided
by annualized standard deviation of returns.
K-Ratio - Detects inconsistency in returns. Should be 1.0 or more. The higher K ratio is the
more consistent return you may expect from the system. Linear regression slope of equity
line multiplied by square root of sum of squared deviations of bar number divided by
standard error of equity line multiplied by square root of number of bars.

Handbook- Advance Use of AmiBroker | 80 www.stockbangladesh.com
END


![Introduction to the AmiBroker AddToComposite() · PDF fileIntroduction to the AmiBroker AddToComposite() By Herman van den Bergen [ psytek@rogers.com ] Last Updated: 2002-11-12 Page](https://img.pdfslide.us/doc/110x75/5a84c7c47f8b9a882e8bc4b0/introduction-to-the-amibroker-addtocomposite-to-the-amibroker-addtocomposite.jpg)


![Introduction to the AmiBroker AddToComposite() · Introduction to the AmiBroker AddToComposite() By Herman van den Bergen [ psytek@rogers.com ] Last Updated: 2002-11-12 Page 4 of](https://img.pdfslide.us/doc/110x75/5e861b9abd7fdc10f64e8a06/introduction-to-the-amibroker-addtocomposite-introduction-to-the-amibroker-addtocomposite.jpg)