Embed Size (px)
Citation preview

2018 Update
Hampton Roads Regional Bridge Study
Hampton Roads Regional Bridge Study
2018 Update
T18-05
May 2018

HAMPTON ROADS TRANSPORTATION PLANNING ORGANIZATION Robert A. Crum, Jr. Executive Director
VOTING MEMBERS:
CHESAPEAKE Rick West Ella P. Ward – Alternate
JAMES CITY COUNTY Michael Hipple Vacant – Alternate
SOUTHAMPTON COUNTY Barry T. Porter R. Randolph Cook – Alternate
FRANKLIN Barry Cheatham Frank Rabil – Alternate
NEWPORT NEWS McKinley Price Herbert H. Bateman, Jr. – Alternate
SUFFOLK Linda T. Johnson - Chair Leroy Bennett – Alternate
GLOUCESTER COUNTY Phillip Bazzani John C. Meyer, Jr. – Alternate
NORFOLK Kenneth Alexander Martin A. Thomas, Jr. – Alternate
VIRGINIA BEACH Vacant Louis R. Jones – Alternate
HAMPTON Donnie Tuck Jimmy Gray – Alternate
POQUOSON W. Eugene Hunt, Jr. Herbert R. Green, Jr. – Alternate
WILLIAMSBURG Paul Freiling D. Scott Foster, Jr. – Alternate
ISLE OF WIGHT COUNTY Joel Acree Rudolph Jefferson – Alternate
PORTSMOUTH John Rowe – Vice Chair Paige Cherry – Alternate
YORK COUNTY Thomas G. Shepperd, Jr. – Chair Sheila Noll – Alternate
MEMBERS OF THE VIRGINIA SENATE The Honorable Mamie E. Locke The Honorable Frank W. Wagner
VA DEPARTMENT OF RAIL AND PUBLIC TRANSPORTATION Jennifer Mitchell, Director Jennifer DeBruhl – Alternate
MEMBERS OF THE VIRGINIA HOUSE OF DELEGATES The Honorable Christopher P. Stolle The Honorable David Yancey
VIRGINIA PORT AUTHORITY John Reinhart, CEO/Executive Director Cathie Vick – Alternate
TRANSPORTATION DISTRICT COMM OF HAMPTON ROADS William E. Harrell, President/Chief Executive Officer Ray Amoruso – Alternate
WILLIAMSBURG AREA TRANSIT AUTHORITY Zach Trogdon, Executive Director Joshua Moore – Alternate
VIRGINIA DEPARTMENT OF TRANSPORTATION Christopher Hall, Hampton Roads District Administrator Dawn Odom – Alternate

HAMPTON ROADS TRANSPORTATION PLANNING ORGANIZATION
NON-VOTING MEMBERS:
CHESAPEAKE HAMPTON NEWPORT NEWS PORTSMOUTH VIRGINIA BEACH
James E. Baker Mary Bunting Cynthia Rohlf Lydia Pettis Patton David Hansen
FRANKLIN ISLE OF WIGHT COUNTY NORFOLK SOUTHAMPTON COUNTY WILLIAMSBURG
R. Randy Martin Randy Keaton Douglas Smith Michael W. Johnson Marvin Collins
GLOUCESTER COUNTY JAMES CITY COUNTY POQUOSON SUFFOLK YORK COUNTY
J. Brent Fedors William Porter J. Randall Wheeler Patrick Roberts Neil A. Morgan
FEDERAL HIGHWAY ADMINISTRATION FEDERAL TRANSIT ADMINISTRATION Jessie Yung, Division Administrator, Virginia Division Terry Garcia-Crews, Regional Administrator, Region 3
FEDERAL AVIATION ADMINISTRATION VIRGINIA DEPARTMENT OF AVIATION Jeffrey W. Breeden, Washington Airports Office District Randall P. Burdette, Director
PENINSULA AIRPORT COMMISSION NORFOLK AIRPORT AUTHORITY Michael A. Giardino, Executive Director Robert S. Bowen, Executive Director
CITIZEN TRANSPORTATION ADVISORY COMMITTEE FREIGHT TRANSPORTATION ADVISORY COMMITTEE Theresa Danaher, Chair Arthur Moye, Jr , Co-Chair (Nonvoting Board Member)
Christopher P. Stolle., Co-Chair (Voting Board Member)
MILITARY LIAISONS INVITED PARTICIPANT Michael R. Moore, Captain, U.S. Navy Dean VanderLey, Captain, U.S. Navy – Alternate Rick Wester, Captain, U.S. Coast Guard Herbert Joliat, Colonel, Langley-Eustis
John Malbon, Commonwealth Transportation Board Stephen A. Johnsen, Commonwealth Transportation Board
HRTPO PROJECT STAFF Michael S. Kimbrel Deputy Executive Director, HRTPO
Keith Nichols Principal Transportation Engineer Michael Long General Services Manager Chris Vaigneur Assistant General Services Manager

HAMPTON ROADS REGIONAL BRIDGE STUDY
2018 UPDATE
Prepared by:
May 2018
T18-05

REPORT DOCUMENTATION ii
James City/Williamsburg/York Transportation Study HAMPTON ROADS REGIONAL BRIDGE STUDY – 2018 UPDATE
TITLE:
Hampton Roads Regional Bridge Study – 2018 Update
AUTHORS:
Keith M. Nichols, P.E.
PROJECT MANAGER:
Keith M. Nichols, P.E.
REPORT DATE:
May 2018
ORGANIZATION CONTACT INFORMATION
Hampton Roads Transportation Planning Organization
723 Woodlake Drive
Chesapeake, Virginia 23320
(757) 420-8300
www.hrtpo.org
ACKNOWLEDGMENTS & DISCLAIMERS
Prepared in cooperation with the U.S. Department of Transportation
(USDOT), Federal Highway Administration (FHWA), and Virginia
Department of Transportation (VDOT). The contents of this report
reflect the views of the Hampton Roads Transportation Planning
Organization (HRTPO). The HRTPO is responsible for the facts and
the accuracy of the data presented herein. The contents do not
necessarily reflect the official views or policies of the FHWA, VDOT or
Hampton Roads Planning District Commission. This report does not
constitute a standard, specification, or regulation. FHWA or VDOT
acceptance of this report as evidence of fulfillment of the objectives of
this planning study does not constitute endorsement/approval of the
need for any recommended improvements nor does it constitute
approval of their location and design or a commitment to fund any
such improvements. Additional project level environmental impact
assessments and/or studies of alternatives may be necessary.
NON-DISCRIMINATION
The HRTPO assures that no person shall, on the ground of race, color,
national origin, handicap, sex, age, or income status as provided by
Title VI of the Civil Rights Act of 1964 and subsequent authorities, be
excluded from participation in, be denied the benefits of, or be
otherwise subject to discrimination under any program or activity. The
HRTPO Title VI Plan provides this assurance, information about
HRTPO responsibilities, and a Discrimination Complaint Form.
ABSTRACT
Bridges are a prominent part of the Hampton Roads landscape and a
critical component of the Hampton Roads transportation system.
Because of the importance of bridges to the regional transportation
system and concerns about the condition and funding of bridges, the
Hampton Roads Transportation Planning Organization began
analyzing factors impacting regional bridges in 2007. The Hampton
Roads Regional Bridge Study for the first time provided a regional
analysis of bridge topics such as bridge inspections and ratings,
deficient bridges, bridge funding and projects, and the impacts that the
closure of major bridges would have on Hampton Roads travel
patterns.
This 2018 update of the Hampton Roads Regional Bridge Study builds
on the 2007 study and the update released in 2012. Sections regarding
bridge definitions, regional summaries, bridge inspections and ratings,
deficient bridges, fracture and scour critical bridges, health indices,
bridge funding, bridge projects, and the anticipated cost of maintaining
bridges through 2045 are included in this update. In many sections of
this report, comparisons are made between the condition of bridges in
Hampton Roads and those in other large metropolitan areas
throughout the country. This report also includes a section detailing
the new Federal bridge performance measures.

TABLE OF CONTENTS iii
James City/Williamsburg/York Transportation Study HAMPTON ROADS REGIONAL BRIDGE STUDY – 2018 UPDATE
TABLE OF CONTENTS
Introduction ............................................................................................. 1
Bridge Definitions ................................................................................... 3
Bridge Types ................................................................................... 3
Regional Bridge Summary ..................................................................... 5
Total Bridges ................................................................................... 5
Bridges by Ownership ................................................................... 6
Bridges by Type of Service ........................................................... 6
Bridges by Length/Area ................................................................ 7
Bridges by Age ............................................................................... 7
Bridge Inspections and Ratings ............................................................ 9
Deficient Bridges ................................................................................... 12
Structurally Deficient Bridges .................................................... 13
Functionally Obsolete Bridges ................................................... 19
Weight-Posted Bridges ................................................................ 28
Height-Restricted Bridges ........................................................... 31
Closed Bridges in Hampton Roads ........................................... 33
Fracture and Scour Critical Bridges ................................................... 34
Health Index .......................................................................................... 35
Federal Bridge Performance Measures .............................................. 36
Targets ........................................................................................... 38
Bridge Funding ...................................................................................... 40
Federal Bridge Funding .............................................................. 40
State Bridge Funding ................................................................... 42
Regional/Local Bridge Funding ................................................. 45
Tolls ................................................................................................ 45
Bridge Projects ....................................................................................... 46
Cost of Maintaining Bridges ............................................................... 53
Conclusions ............................................................................................ 59
Appendix A – Glossary of Bridge Terms ........................................... 61
Appendix B – Bridge Component Rating Basics .............................. 63
Appendix C – State of Good Repair Prioritization Formula ........... 71
Appendix D – Regional Bridge Inventory ......................................... 82
Appendix E – Public Review and Comment ................................... 138

TABLE OF CONTENTS iv
James City/Williamsburg/York Transportation Study HAMPTON ROADS REGIONAL BRIDGE STUDY – 2018 UPDATE
LIST OF FIGURES
Figure 1 – Bridge Types .......................................................................................... 4 .............................
Figure 2 – Total Bridges in Comparable Metropolitan Areas ............................ 5
Figure 3 – Hampton Roads Bridges by Ownership ............................................. 6
Figure 4 – Bridges in Hampton Roads by Type of Service ................................. 6
Figure 5 – Total Bridge Area in Comparable Metropolitan Areas .................... 7
Figure 6 – Bridges in Hampton Roads by Year Built .......................................... 7
Figure 7 – Bridges in Hampton Roads Jurisdictions by Year Built ................... 8
Figure 8 – Median Bridge Age in Comparable Metropolitan Areas ................. 8
Figure 9 – Structurally Deficient Bridges in Hampton Roads by Jurisdiction
and Maintenance Responsibility .......................................................................... 14
Figure 10 – Structurally Deficient Bridges in Comparable Metropolitan
Areas ....................................................................................................................... 14
Figure 11 – Structurally Deficient Bridges in Hampton Roads by Year ......... 15
Figure 12 – Structurally Deficient Bridges in Hampton Roads........................ 16
Figure 13 – Functionally Obsolete Bridges in Hampton Roads by Jurisdiction
and Maintenance Responsibility .......................................................................... 20
Figure 14 – Functionally Obsolete Bridges in Hampton Roads ....................... 21
Figure 15 – Weight-Posted Bridges in Hampton Roads ................................... 29
Figure 16 – Height-Restricted Bridges in Hampton Roads .............................. 32
Figure 17 – Fracture Critical Bridges in Hampton Roads ................................. 34
Figure 18 – Bridges in Hampton Roads with the Lowest Health Indices....... 35
Figure 19 – Percentage of Bridges and Bridge Area in Hampton Roads in
Good/Fair/Poor Condition .................................................................................... 36
Figure 20 – Percentage of Bridges in Good/Fair/Poor Condition .................... 37
Figure 21 – Percentage of Bridge Area in Good/Fair/Poor Condition ............ 38
Figure 22 – Statewide Bridge Funding Breakdown, FY 2016-2022 .................. 42
Figure 23 – SGR Funding Distribution by VDOT Construction District, FY
2018-2023 ................................................................................................................. 43
Figure 24 – Funding for Structurally Deficient Bridges in Hampton Roads .. 47
Figure 25 – Bridges Constructed, Replaced, or Rehabilitated in Hampton
Roads, 2010-2017 .................................................................................................... 48
Figure 26 – Current and Upcoming Bridge Projects in Hampton Roads ....... 51
Figure 27 – Statewide 35 Year Funding Outlook to Replace All Bridges at
Age 70, 2016-2050 ................................................................................................... 54
Figure 28 – Statewide Annual Replacement Costs to Replace Bridges at Age
70, 2016-2050 ........................................................................................................... 54
Figure 29 – Bridges in Hampton Roads by Year Built ...................................... 55
Figure 30 – Bridges in Hampton Roads by Age ................................................. 55
Figure 31 – Bridges in Hampton Roads Age 70+ ............................................... 56
Figure 32 – Bridges in Hampton Roads and Statewide Age 70+ ..................... 56
Figure 33 – Regional Annual Bridge Replacement Needs, 2018-2045 ............ 57
Figure 34 – Hampton Roads LRTP Bridge Replacement Needs, 2018-2045 .. 58
Figure 35 – Summary of Hampton Roads Bridge Conditions ......................... 59
LIST OF MAPS
Map 1 – Structurally Deficient Bridges in Hampton Roads ............................. 18
Map 2 – Deficient Bridges in Hampton Roads ................................................... 27
Map 3 – Bridge Condition in Hampton Roads .................................................. 39

INTRODUCTION 1
James City/Williamsburg/York Transportation Study HAMPTON ROADS REGIONAL BRIDGE STUDY – 2018 UPDATE
INTRODUCTION
Bridges are a prominent part of the Hampton Roads landscape and a
critical component of the Hampton Roads transportation system.
Major spans such as the Coleman Bridge, Hampton Roads Bridge-
Tunnel, and James River Bridge connect distinct areas of the region.
Bridges on the Interstate system improve mobility throughout the
region by creating a limited-access network. And smaller structures
such as culverts span the large number of creeks, wetlands, and
waterways in the region.
As bridges age, allocating adequate funding to maintain these structures
has been difficult. Constructing bridges can cost four to six times more
than typical urban roadway reconstruction costs according to VDOT
planning level estimates. FHWA estimates that $46 billion would be
needed to address the over 55,000 structurally deficient bridges
throughout the country.
Because of the importance of bridges to the regional transportation
system and concerns about the condition and funding of bridges, the
Hampton Roads Transportation Planning Organization began analyzing
factors impacting regional bridges in 2007. The Hampton Roads Regional
Bridge Study for the first time provided a regional analysis of topics such
as bridge inspections and ratings, deficient bridges, bridge funding and
projects, and the impacts that the closure of major bridges would have
on Hampton Roads travel patterns.
This 2018 update of the Hampton Roads Regional Bridge Study builds on
the previous efforts. Sections in this update include:
Bridge Definitions – This section includes the definition of a
bridge used in this study and describes each type of bridge.
Regional Bridge Summary – This section includes summaries
of bridges in Hampton Roads by ownership, type of service,
length/area, and age.
Bridge Inspections and Ratings – Based on detailed
inspections, bridge inspectors assign ratings to various
components of each bridge. This section describes these
components and how each of them is rated.
Deficient Bridges – This section describes structurally deficient
and functionally obsolete classifications and includes a
summary of those bridges in Hampton Roads that are deficient.
Bridges with posted weight limits and height restrictions are
also detailed, as are bridges in the region that have been closed.
Fracture and Scour Critical Bridges – This section defines
fracture critical and scour critical bridges, and details those
bridges in Hampton Roads that are classified as fracture or
scour critical.
Health Index – This section details the Bridge Health Index,
which is a measure of the physical condition of each bridge that
provides a ranking system for bridge maintenance.
CHESAPEAKE BAY BRIDGE-TUNNEL SHUTTERSTOCK

INTRODUCTION 2
James City/Williamsburg/York Transportation Study HAMPTON ROADS REGIONAL BRIDGE STUDY – 2018 UPDATE
Bridge Performance Measures - Recent federal legislation
established that states and metropolitan areas will be required
to prepare and use a set of federally-established performance
measures and set targets in many different areas, including
bridge condition. These bridge condition performance
measures and targets are detailed in this section.
Bridge Funding – This section details how bridges are funded
through federal, state, and local bridge funding sources.
Bridge Projects – This section describes bridges recently built
and rehabilitated in Hampton Roads, and bridges that have
rehabilitation or replacement projects programmed.
Cost of Maintaining Bridges – Maintaining bridges will be
critical as they age beyond their expected life spans in future
decades. Regional bridge needs out to the year 2045 – the time
horizon of the next regional Long-Range Transportation Plan –
are examined in this section.
Conclusions
Appendices – The Appendices contain a glossary of bridge
terms, definitions of bridge component ratings, a description
and example of calculating State of Good Repair Scores for
bridges, and bridge condition information for each jurisdiction.
It should be noted that Sufficiency Ratings are not included in this
update to the Regional Bridge Study. Sufficiency ratings were
numerical ratings that were calculated for each bridge based on its
structural evaluation, design and function, and public importance.
However, since federal funding for bridges is no longer based on
sufficiency ratings, their value has been diminished.
In many sections of this report, comparisons are made between bridges
in Hampton Roads and those in other similar metropolitan areas. These
comparisons are made between Hampton Roads and the 36 other
metropolitan areas throughout the United States with populations
between one and three million people.
The information included in the report is based on HRTPO’s analysis of
bridge data obtained largely from the Virginia Department of
Transportation’s (VDOT) Structure and Bridge Division. Data for the 33
federally-maintained bridges in Hampton Roads and bridges in the 36
other comparable metropolitan areas was obtained from the Federal
Highway Administration’s (FHWA) National Bridge Inventory (NBI)
database. Both databases contain over 100 types of information that is
collected and rated for each bridge. Examples of information included
for each bridge in these databases are bridge location, design type,
geometric characteristics, traffic volumes, condition and appraisal
ratings, inspection dates, etc.
The VDOT bridge data analyzed in this report was obtained in
December 2017, and represents conditions as of that date. The FHWA
NBI data was obtained in February 2018 and represents 2017 conditions.
Every bridge is inspected on a regular basis, and bridge ratings are
constantly updated based on these inspections. As such, bridges may
currently have different ratings and classifications than shown in this
report due to recent inspections. Up-to-date bridge ratings are available
on VDOT’s bridge website at http://virginiadot.org/info/Bridge.asp and
FHWA’s NBI website at https://www.fhwa.dot.gov/bridge/nbi.cfm.
JAMES RIVER BRIDGE VDOT

BRIDGE DEFINITIONS 3
James City/Williamsburg/York Transportation Study HAMPTON ROADS REGIONAL BRIDGE STUDY – 2018 UPDATE
BRIDGE DEFINITIONS
As part of the original HRTPO Regional Bridge Study, producing a
definition of the term “bridge” was necessary to determine which
structures to include in the analysis. HRTPO staff determined that
using the National Bridge Inspection Standards (NBIS) definition of a
bridge – which is used to determine those structures that are included in
the National Bridge Inventory (NBI) – was appropriate. The NBIS
definition of a bridge is as follows:
“A structure including supports erected over a depression or an
obstruction, such as water, highway, or railway, and having a track
or passageway for carrying traffic or other moving loads, and
having an opening measured along the center of the roadway of
more than 20 feet between under copings of abutments or spring
lines of arches, or extreme ends of openings for multiple boxes; it
may also include multiple pipes, where the clear distance between
openings is less than half of the smaller contiguous opening.”
Using this definition as a guide, HRTPO staff determined that the
following conditions should apply for each bridge to be included in the
2007 study analysis, and the same conditions are used in this update:
Location – The structure must be located on roadways open to
the general public. Bridges owned and maintained by local,
state, and federal government agencies apply, as do bridges
owned and maintained by private operators so long as they are
open for public use. Bridges located within the security
perimeter of military bases and other secure federal facilities are
not included in this study.
Length – The bridge must be more than 20 feet (6.1 meters) in
length per the NBIS. Culverts are included, so long as the
opening in the culvert is more than 20 feet in length.
Service – The bridge must carry a roadway. Structures that
carry only railroad or pedestrian traffic are not covered by NBIS
regulations and are not included in this study.
Tunnels – Tunnels are not considered bridges by the NBIS.
Some information regarding Hampton Roads tunnels and
tunnel inspection procedures are included in this study, but
tunnels are not included in report statistics since many of the
metrics used to measure bridge conditions do not apply to
tunnels.
BRIDGE TYPES
Bridges vary greatly in design, from small culverts to mile-long
suspension bridges. FHWA uses 22 classes to categorize structures
based on the predominant type of design and construction. Figure 1 on
page 4 describes each bridge type and includes the number of each type
of bridge in Hampton Roads.
COLEMAN BRIDGE VDOT

BRIDGE DEFINITIONS 4
James City/Williamsburg/York Transportation Study HAMPTON ROADS REGIONAL BRIDGE STUDY – 2018 UPDATE
1 - SLAB
104 bridges
A slab bridge is a structure where the slab serves as
both the superstructure and the deck of the bridge.
This type of bridge is well-suited for shorter spans.
2 – STRINGER/ MULTI-BEAM OR
GRIDER
813 bridges
This type of bridge uses three or more parallel beams
or girders that transfer the load between the deck and
the substructure. This type of bridge is commonly
used on the Interstate system.
13 - SUSPENSION
0 bridges
7 - FRAME
4 bridges
9 – DECK TRUSS
0 bridges
10 – THROUGH
TRUSS
2 bridges
11 – DECK ARCH
15 bridges
12 – THROUGH
ARCH
2 bridges
14 – STAYED GIRDER
0 bridges
15 – MOVABLE -
LIFT
2 bridges
16 – MOVABLE -
BASCULE
5 bridges
3 – GIRDER AND FLOORBEAM
SYSTEM
7 bridges
4 – TEE BEAM
38 bridges
5/6 – BOX BEAM
OR GIRDER
49 bridges
17 – MOVABLE - SWING
4 bridges
18 - TUNNEL
10 total*
19 - CULVERT
213 total (only those >20’)
21 – SEGMENTAL BOX GIRDER
3 bridges
22 – CHANNEL BEAM
0 bridges
This type of bridge uses two girders parallel to the
roadway, with the deck on top of floorbeams that are
connected to the griders. The roadway can be located
either above or through the griders.
A tee beam bridge is similar to other beam bridges
except that the concrete beams are shaped in the form
of a “T”. Other beam bridges are typically shaped in
the form of an “I”.
A box beam or girder bridge is similar to other beam
and girder bridges except that the beams or girders
have a void in the middle.
A frame bridge is a structure where the piers and deck
are one integrated solid structure.
A truss bridge (which is a simple skeletal structure that
uses a series of triangles to transfer loads from the deck
to the piers) where the roadway surface is located
above the truss.
A truss bridge where the deck is located below the
truss and traffic travels through the truss system.
An arch bridge (which is a bridge that spans an
opening with a curved structure member) where the
roadway surface is located above the arch.
An arch bridge where the deck is hung from a segment
of the arch that rises above the deck.
A suspension bridge is a structure where the deck is
supported by cables. These cables transfer loads over
two towers to anchorages at either end of the bridge.
A stayed girder bridge is a structure where the deck is
supported by cables that are attached to one or more
towers.
A movable lift bridge is a type of bridge where the
span is raised vertically to allow for passage below.
The lifted span remains parallel to the roadway deck.
A movable bascule bridge is a type of bridge where
portions of the bridge deck rotate upward to allow for
passage below.
A movable swing bridge is a type of bridge where
segments of the bridge deck rotate horizontally to
allow for passage below.
Tunnels are underground roadway passages. 8 tunnels in
Hampton Roads are underwater crossings, plus tunnels at
Naval Station Norfolk and Colonial Williamsburg.
* - Tunnels are not included in the statistics shown throughout this study.
UNCLASSIFIED
0 bridges
A culvert is a channel that allows water to flow under
a roadway. Culverts are often used for smaller streams
and drainage canals.
A segmental box girder bridge has a deck that is
supported by a closed box formed from two sloping
side walls that are attached on the bottom with a slab.
This closed box acts as a beam.
A channel beam bridge is constructed with precast
beams that resemble inverted channels. They are
similar in appearance to tee beam bridges.
FIGURE 1 - BRIDGE TYPES Source: HRTPO analysis of VDOT and FHWA data. Data for Hampton Roads bridges as of December 2017. Definitions of terms used in this figure are included in Appendix A.

REGIONAL BRIDGE SUMMARY 5
James City/Williamsburg/York Transportation Study HAMPTON ROADS REGIONAL BRIDGE STUDY – 2018 UPDATE
REGIONAL BRIDGE SUMMARY
This section includes a summary of bridges in Hampton Roads, and
comparisons between bridges in Hampton Roads and those in similar
metropolitan areas. Topics described in this section include:
Total Bridges
Bridges by Ownership
Bridges by Type of Service
Bridges by Length/Area
Bridges by Age
TOTAL BRIDGES
Based on the definition of a bridge described in the previous section,
there are a total of 1,261 bridges in Hampton Roads1 as of December
2017. This number does not include bridges and culverts that are
shorter than or equal to 20 feet in length, bridges on private
property, structures that are in areas that are not open to the
general public such as military bases, pedestrian and railroad
overpasses that are not also shared by a roadway, and tunnels.
As shown in Figure 1 on the page 4, the most common
structure type in Hampton Roads is beam or girder bridges,
comprising 813 (64%) of all bridges in the region. Culverts are
the second most common type of structure in Hampton Roads,
comprising 213 bridges (17%).
Compared to other metropolitan areas, Hampton Roads has
fewer bridges. Among 37 comparable metropolitan areas
1 “Hampton Roads” in this study includes areas within the HRTPO boundary, rural areas included in
the Hampton Roads Planning District Commission, and structures on boundaries with adjacent areas.
Maps showing these boundaries are available at https://www.hrpdcva.gov/page/maps-and-gis.
REGIONAL BRIDGE SUMMARY
Total bridges in Hampton Roads, and Hampton Roads rank among comparable metropolitan areas in terms of total bridges
Total area of bridges in Hampton Roads, and Hampton Roads rank among comparable metropolitan areas in terms of total bridge area
1,261 26th highest of
37 areas
Median age of bridges in Hampton Roads, and Hampton Roads rank among comparable metropolitan areas in terms of median bridge age
FIGURE 2 – TOTAL BRIDGES IN COMPARABLE METROPOLITAN AREAS Source: HRTPO analysis of VDOT and FHWA data. Data for Hampton Roads bridges as of December 2017. Other areas based on 2017 NBI data.
2,746,000 m2 8th highest of
37 areas
39 years
23rd highest of 37 areas
0
1,000
2,000
3,000
4,000
5,000
6,000
Nu
mb
er
of
Bri
dg
es
Num
ber
of
Bri
dg
es

REGIONAL BRIDGE SUMMARY 6
James City/Williamsburg/York Transportation Study HAMPTON ROADS REGIONAL BRIDGE STUDY – 2018 UPDATE
throughout the country with populations between one and three million
people, Hampton Roads ranks 26th highest in terms of total bridges
(Figure 2 on page 5). Some areas, such as Kansas City and St. Louis,
have more than four times as many bridges as Hampton Roads.
BRIDGES BY OWNERSHIP
Bridges in Hampton Roads are owned and maintained by various
jurisdictions. Bridges that are located in counties are mostly owned and
maintained by VDOT, as are bridges that are part of the Interstate
system. Bridges that are located within cities (except for bridges on the
Interstate system) are generally owned and maintained by those cities.
The Federal Government also owns and maintains bridges in Hampton
Roads, including two Army Corps of Engineers drawbridges and
National Park System bridges on the Colonial Parkway, Jamestown
Island Tour Road, and Yorktown Battlefield Tour Road. Some bridges
are owned and maintained by the private sector or state commissions,
such as the South Norfolk Jordan Bridge, the Chesapeake Bay Bridge-
Tunnel, and bridges approaching the Midtown and Downtown Tunnels
by Elizabeth River Crossings.
The majority of bridges in Hampton Roads are owned and maintained
by VDOT. Of the 1,261 bridges in Hampton Roads, 751 (60%) are
owned and maintained by VDOT (Figure 3). Cities own and maintain
437 bridges (35%), the Federal Government owns 33 bridges (3%), 12
bridges are part of the Chesapeake Bay Bridge-Tunnel, and the
remaining 28 bridges are maintained by the private sector.
BRIDGES BY TYPE OF SERVICE
Figure 4 shows the number of bridges in Hampton Roads by what they
span, which is also referred to as type of service. The majority of
VDOT, 751, 59.6%
City, 437, 34.7%
Federal, 33, 2.6%
CBBT, 12, 1.0%
Private, 28, 2.2%
Bridges by Ownership
Waterway, 723, 57.3%
Roadway/ Waterway, 24, 1.9%
Roadway, 375, 29.7%
Roadway/ Railroad, 63, 5.0%
Railroad, 64, 5.1%
Railroad/ Waterway,
3, 0.2%
Other, 6, 0.5%
Roadway/ Railroad/ Waterway,
3, 0.2%
FIGURE 3 – HAMPTON ROADS BRIDGES BY OWNERSHIP Source: HRTPO analysis of VDOT and FHWA data. Data for Hampton Roads bridges as of December 2017.
FIGURE 4 – BRIDGES IN HAMPTON ROADS BY TYPE OF SERVICE Source: HRTPO analysis of VDOT and FHWA data. Data for Hampton Roads bridges as of December 2017.

REGIONAL BRIDGE SUMMARY 7
James City/Williamsburg/York Transportation Study HAMPTON ROADS REGIONAL BRIDGE STUDY – 2018 UPDATE
bridges in the region span waterways. Of the 1,261 bridges in
Hampton Roads, 753 bridges (60%) involve roadways
spanning a waterway. Bridges spanning over other roadways
comprise 465 bridges (37%) in Hampton Roads, while
roadways spanning railroads comprise 133 bridges (11%).
BRIDGES BY LENGTH/AREA
Although the number of bridges in Hampton Roads is lower
than in many other comparable metropolitan areas, bridges in
Hampton Roads are on average much longer than those in
other areas. The 1,261 bridges in Hampton Roads span
588,000 feet (which is over 111 miles), or an average of 466 feet
for each bridge. Among the 37 metropolitan areas in the
United States with populations between one and three million
people, Hampton Roads has the second longest average
bridge length behind only New Orleans.
The total deck area of bridges in Hampton Roads is 29,555,000 square
feet, or 2,746,000 square meters. Hampton Roads has the 8th highest
total bridge deck area among the 37 comparable metropolitan areas
(Figure 5). Bridge maintenance costs are significantly higher than
typical roadway maintenance costs, so having a high total bridge deck
area compared to other metropolitan areas means more funding is
needed in Hampton Roads to maintain these structures.
BRIDGES BY AGE
Aging infrastructure – especially bridges – is a concern nationally. The
median age of bridges in the United States is 43 years as of 2017
according to data in the NBI database, and 40% of the bridges in the
country are at least 50 years old. In Virginia, the median age of NBI
0
1,000,000
2,000,000
3,000,000
4,000,000
5,000,000
6,000,000
7,000,000
Tota
l B
rid
ge D
eck
Are
a (
squ
are
mete
rs)
FIGURE 5 – TOTAL BRIDGE AREA IN COMPARABLE METROPOLITAN AREAS Source: HRTPO analysis of VDOT and FHWA data. Data for Hampton Roads bridges as of December 2017. Other areas based on 2017 NBI data.
0
50
100
150
200
250
300
Pre-1950 1950 -1959
1960 -1969
1970 -1979
1980 -1989
1990 -1999
2000 -2009
2010+
Bri
dg
es
by Y
ea
r B
uilt
Bridges by Year Built
FIGURE 6 – BRIDGES IN HAMPTON ROADS BY YEAR BUILT Source: HRTPO analysis of VDOT and FHWA data. Data for Hampton Roads bridges as of December 2017.

REGIONAL BRIDGE SUMMARY 8
James City/Williamsburg/York Transportation Study HAMPTON ROADS REGIONAL BRIDGE STUDY – 2018 UPDATE
bridges is 45 years as of December 2017 according to VDOT
data, slightly higher than the national figure.
Bridges in Hampton Roads typically are not as old as national
and statewide structures, with a median bridge age in
Hampton Roads of 39 years as of December 2017. However,
many bridges in Hampton Roads are much older, with 108
bridges being built prior to 1950 and another 94 bridges being
built between 1950 and 1959 (Figure 6 on page 7). As of
December 2017, 392 bridges (31%) in Hampton Roads are at
least 50 years old.
Figure 7 shows bridges by year built for each jurisdiction in
Hampton Roads. Williamsburg has the highest median
bridge age of any Hampton Roads jurisdiction at 57 years.
Surry County and York County also have median bridge ages
greater than 50 years.
The overall age of bridges in Hampton Roads is lower than
those in other metropolitan areas. Among the 37 comparable
metropolitan areas in the United States with populations
between one and three million people, Hampton Roads
ranked 23rd highest in median bridge age in 2017 (Figure 8).
0
5
10
15
20
25
30
35
40
45
50
55
Med
ian
Bri
dg
e A
ge
FIGURE 8 – MEDIAN BRIDGE AGE IN COMPARABLE METROPOLITAN AREAS Source: HRTPO analysis of VDOT and FHWA data. Data represents median age as of 2017. Data for Hampton Roads bridges as of December
2017. Other areas based on 2017 NBI data.
Pre
1950
1950 -
1959
1960 -
1969
1970 -
1979
1980 -
1989
1990 -
1999
2000 -
2009 2010+
Chesapeake 183 8 3 20 16 39 46 24 27 26
Gloucester 24 5 3 3 5 0 3 1 4 45
Hampton 83 2 15 6 10 35 3 10 2 34
Isle of Wight 85 9 19 8 13 8 14 8 6 45
James City 62 8 9 5 19 1 16 4 - 41.5
Newport News 93 6 2 21 3 24 23 8 6 30
Norfolk 189 5 7 56 49 26 43 2 1 43
Poquoson 0 - - - - - - - - -
Portsmouth 48 1 2 14 4 4 4 12 7 28
Southampton/Franklin 138 28 7 31 31 18 13 6 4 46
Suffolk 135 13 10 17 35 14 24 16 6 42
Surry 32 8 7 5 6 1 2 2 1 52.5
Virginia Beach 125 3 - 41 13 22 26 6 14 33
Williamsburg 12 5 1 1 3 - 1 1 - 57
York 52 7 9 18 9 1 3 4 1 52
HAMPTON ROADS 1,261 108 94 246 216 193 221 104 79 39
Jurisdiction
Total
Number
of
Bridges
Number of Bridges by Year Built Median
Bridge
Age
(Years)
FIGURE 7 – BRIDGES IN HAMPTON ROADS JURISDICTIONS BY YEAR BUILT Source: HRTPO analysis of VDOT and FHWA data. Data for Hampton Roads bridges as of December 2017.
DEEP CREEK BRIDGE USACE
BRIDGE INSPECTIONS AND RATINGS 9
James City/Williamsburg/York Transportation Study HAMPTON ROADS REGIONAL BRIDGE STUDY – 2018 UPDATE
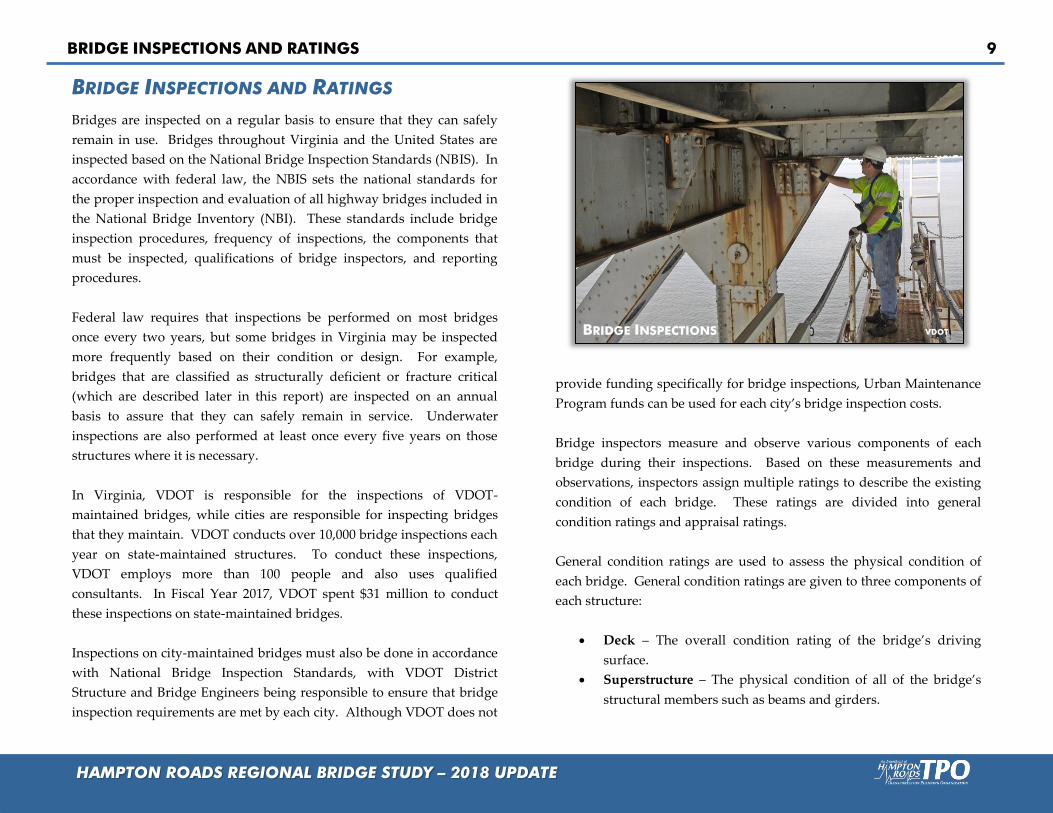
BRIDGE INSPECTIONS AND RATINGS
Bridges are inspected on a regular basis to ensure that they can safely
remain in use. Bridges throughout Virginia and the United States are
inspected based on the National Bridge Inspection Standards (NBIS). In
accordance with federal law, the NBIS sets the national standards for
the proper inspection and evaluation of all highway bridges included in
the National Bridge Inventory (NBI). These standards include bridge
inspection procedures, frequency of inspections, the components that
must be inspected, qualifications of bridge inspectors, and reporting
procedures.
Federal law requires that inspections be performed on most bridges
once every two years, but some bridges in Virginia may be inspected
more frequently based on their condition or design. For example,
bridges that are classified as structurally deficient or fracture critical
(which are described later in this report) are inspected on an annual
basis to assure that they can safely remain in service. Underwater
inspections are also performed at least once every five years on those
structures where it is necessary.
In Virginia, VDOT is responsible for the inspections of VDOT-
maintained bridges, while cities are responsible for inspecting bridges
that they maintain. VDOT conducts over 10,000 bridge inspections each
year on state-maintained structures. To conduct these inspections,
VDOT employs more than 100 people and also uses qualified
consultants. In Fiscal Year 2017, VDOT spent $31 million to conduct
these inspections on state-maintained bridges.
Inspections on city-maintained bridges must also be done in accordance
with National Bridge Inspection Standards, with VDOT District
Structure and Bridge Engineers being responsible to ensure that bridge
inspection requirements are met by each city. Although VDOT does not
provide funding specifically for bridge inspections, Urban Maintenance
Program funds can be used for each city’s bridge inspection costs.
Bridge inspectors measure and observe various components of each
bridge during their inspections. Based on these measurements and
observations, inspectors assign multiple ratings to describe the existing
condition of each bridge. These ratings are divided into general
condition ratings and appraisal ratings.
General condition ratings are used to assess the physical condition of
each bridge. General condition ratings are given to three components of
each structure:
Deck – The overall condition rating of the bridge’s driving
surface.
Superstructure – The physical condition of all of the bridge’s
structural members such as beams and girders.
BRIDGE INSPECTIONS VDOT

BRIDGE INSPECTIONS AND RATINGS 10
James City/Williamsburg/York Transportation Study HAMPTON ROADS REGIONAL BRIDGE STUDY – 2018 UPDATE
Substructure – The physical condition of all of the bridge’s
piers, abutments, piles, footings, and other components of the
bridge’s foundation.
Each of these three components is rated by the bridge inspector from 0
to 9, with 9 representing a component in excellent condition and 0
representing a failed condition or a closed bridge. For culverts, a single
rating is given in place of the deck, superstructure, and substructure
ratings to assess the general condition of the entire culvert.
Appraisal ratings are used to evaluate a bridge relative to the level of
service it provides based on the highway system it is located on. Each
bridge is compared to a structure built to current design standards for
that type of roadway. Appraisal ratings are given to the following items
for each bridge:
Structural Evaluation – This rating is generally equal to the
lowest condition rating among the superstructure and
substructure ratings. The structural evaluation rating, however,
can be lower based on the capacity of the bridge and the
volume of traffic it carries. The structural evaluation rating is
also called the structural condition rating.
Deck Geometry – The width of the bridge as well as the vertical
clearance over the bridge roadway.
Vertical and Lateral Underclearances – The height from the
transversed roadway to the bottom of the structure, and the
horizontal distance between the transversed roadway and the
bridge supports.
Waterway Adequacy – The ability of the bridge opening to
allow water to flow through the passage, and the frequency of
water overtopping the bridge.
Approach Roadway Alignment – The alignment of the
roadway approaches to the bridge as compared to the general
roadway alignment for the section of roadway that the bridge is
located on.
Similar to general condition ratings, each appraisal rating item is rated
by the bridge inspector from 0 to 9, with 9 representing an item in
excellent condition and 0 representing a closed bridge.
General condition and appraisal ratings are used to classify and
prioritize bridges for rehabilitation or replacement. Bridges are
classified as structurally deficient based on their general condition
ratings, and both general condition and appraisal ratings are used to
determine if a bridge is functionally obsolete.
The Moving Ahead for Progress in the 21st Century Act (MAP-21)
federal surface transportation funding and authorization bill that was
passed in 2012 included various regulations that aimed to improve the
highway bridge inspection program. These regulations – which are
continued under the current Fixing America’s Surface Transportation
(FAST) Act – include inspections and inventory of all highway bridges
BRIDGE INSPECTIONS VDOT

BRIDGE INSPECTIONS AND RATINGS 11
James City/Williamsburg/York Transportation Study HAMPTON ROADS REGIONAL BRIDGE STUDY – 2018 UPDATE
on public roads, creating data risk-based inspections and inspection
intervals, establishing procedures for reporting critical findings,
requiring inspector training certifications, and establishing minimum
standards for statewide bridge conditions.
MAP-21 and the FAST Act also require that element level data be
collected for bridges on the National Highway System (NHS), which
includes all roadways with a functional classification of Principal
Arterial and above. Element level data provides much more detail on
the condition of each component of the bridge than the general
condition ratings described previously. For example, FHWA requires
condition information for six elements of each bridge’s deck, ten
elements of each bridge’s superstructure, and seven elements of each
bridge’s substructure.
MAP-21 also established the National Tunnel Inspection Standards
(NTIS) for highway tunnels. These standards require a program for the
inspection of highway tunnels, reporting inspection findings to FHWA,
correcting any critical findings found during the inspections, the
creation and maintenance of a National Tunnel Inventory, and the
development of a training program for tunnel inspectors.
A glossary of many of the bridge terms used in this study is included in
Appendix A, and more detailed descriptions of general condition and
appraisal ratings are included in Appendix B.
BRIDGE INSPECTIONS VDOT

DEFICIENT BRIDGES 12
James City/Williamsburg/York Transportation Study HAMPTON ROADS REGIONAL BRIDGE STUDY – 2018 UPDATE
DEFICIENT BRIDGES
Bridges can be considered deficient for a variety of reasons. Some
bridges are deficient based on the condition of structural elements of the
bridge, while others are deficient based on the bridge’s design. This
section includes the following topics regarding deficient bridges:
Structurally Deficient Bridges – This section describes the
definition of structurally deficient, what conditions lead to a
bridge being classified as structurally deficient, structurally
deficient bridges in Hampton Roads, and how Hampton Roads
compares to other metropolitan areas in terms of structurally
deficient bridges.
Functionally Obsolete – This section details the definition of
functionally obsolete and those bridges in Hampton Roads that
are classified as functionally obsolete.
Weight-posted Bridges – This section includes a summary of
those structures in Hampton Roads that have weight limits
posted so that they can safely remain in service, and how the
percentage of weight-posted bridges in Hampton Roads
compares to other metropolitan areas.
Height-restricted Bridges – This section includes a summary of
structures in Hampton Roads that have posted height
restrictions due to vertical clearances that are below standards.
Closed Bridges in Hampton Roads – In addition to the
deficient bridges included in this section, two prominent
bridges in Hampton Roads have been closed due to their
deteriorated condition. One structure – the Jordan Bridge – was
eventually replaced while the other structure – the Kings
Highway Bridge in Suffolk – has not been replaced. More
information on these two structures is included in this section.
CENTERVILLE TURNPIKE BRIDGE MARINAS.COM

DEFICIENT BRIDGES 13
James City/Williamsburg/York Transportation Study HAMPTON ROADS REGIONAL BRIDGE STUDY – 2018 UPDATE
STRUCTURALLY DEFICIENT BRIDGES
A bridge is classified as structurally deficient if it has elements that need
to be monitored and/or repaired. Structurally deficient bridges typically
require maintenance and eventually need to be rehabilitated or replaced
to address deficiencies.
In spite of these deficiencies, it must be noted that structurally deficient
bridges are not necessarily unsafe. Bridge inspectors will close or
impose weight limits on bridges that they feel are unsafe. In order to
assure the safety of structurally deficient bridges, they are inspected
more frequently (generally on an annual basis) and more thoroughly
than other bridges.
Bridges are classified as structurally deficient if at least one of the
following conditions is true:
For definitions of these terms and ratings, see Appendix B.
It should be noted that two bridge condition ratings – Structural
Condition and Waterway Adequacy – were removed from determining
whether structures are classified as structurally deficient in January
2018 due to FHWA’s Pavement and Bridge Condition Performance
Measures final rule. However, since the bridge condition data used in
STRUCTURALLY DEFICIENT BRIDGES SUMMARY
Bridges in Hampton Roads that are classified as structurally deficient
Hampton Roads rank among comparable metropolitan areas in terms of the percentage of bridges that are classified as structurally deficient
66/5.2%
24th highest
of 37 areas
(77/6.3% in 2012)
CHURCHLAND BRIDGE HRTPO
Component Rating
Deck Condition Rating ≤ 4
Superstructure Condition Rating ≤ 4
Substructure Condition Rating ≤ 4
Culvert Condition Rating ≤ 4
Structural Condition Rating* ≤ 2
Waterway Adequacy Rating* ≤ 2* As of January 2018, Structural Condition and Waterway Adequacy Ratings are no
longer used to determine whether structures are classified as structurally deficient.

DEFICIENT BRIDGES 14
James City/Williamsburg/York Transportation Study HAMPTON ROADS REGIONAL BRIDGE STUDY – 2018 UPDATE
this study was obtained in 2017, the previous definition of
classifying structurally deficient bridges is used in this
analysis.
Historically, bridges built or reconstructed within the last ten
years could not be classified as structurally deficient,
regardless of the condition of the bridge. However, this
stipulation – known as the Ten Year Rule – was removed
under the MAP-21 surface transportation authorization
program that became law in 2012.
There are 66 bridges in Hampton Roads that are classified as
structurally deficient as of December 2017. These bridges are
shown in Figure 12 on pages 16 and 17 and in Map 1 on page
18. Among the most traveled structurally deficient bridges in
Hampton Roads are the Churchland Bridge (High Street over
the Western Branch of the Elizabeth River), the Denbigh
Boulevard bridge over I-64, Fort Eustis Boulevard over the
Newport News Reservoir, the I-264 bridge over First Colonial
Road, Military Highway over Bainbridge Boulevard, and one
of the westbound bridges at the Hampton Roads Bridge-
Tunnel.
Of these 66 structurally deficient bridges, 6 were classified as
structurally deficient based solely on their structural
condition or waterway adequacy ratings, meaning that they
are no longer classified as structurally deficient as of January
2018. These 6 bridges are highlighted in yellow in Figure 12.
Figure 9 shows structurally deficient bridges in Hampton
Roads by jurisdiction and maintenance responsibility. Suffolk
(16 bridges), Southampton County (12 bridges), Chesapeake
(10 bridges), and Isle of Wight County (10 bridges) have the
0%
5%
10%
15%
20%
25%
% B
rid
ges
Cla
ssif
ied
as
Str
uct
ura
lly D
efi
cien
t
FIGURE 10 – STRUCTURALLY DEFICIENT BRIDGES IN COMPARABLE METROPOLITAN AREAS Source: HRTPO analysis of VDOT and FHWA data. Data for Hampton Roads bridges as of December 2017. Other areas based on 2017 NBI data.
Number Percentage Locality VDOT Other
Chesapeake 183 10 5.5% 10 - -
Gloucester 24 3 12.5% - 3 -
Hampton 83 3 3.6% - 1 2
Isle of Wight 85 10 11.8% - 10 -
James City 62 1 1.6% - 1 -
Newport News 93 3 3.2% 2 1 -
Norfolk 189 1 0.5% 1 - -
Poquoson 0 0 - - - -
Portsmouth 48 2 4.2% 2 - -
Southampton/Franklin 138 12 8.7% - 12 -
Suffolk 135 16 11.9% 16 - -
Surry 32 2 6.3% - 2 -
Virginia Beach 125 3 2.4% 2 1 -
Williamsburg 12 0 0.0% - - -
York 52 0 0.0% - - -
HAMPTON ROADS 1,261 66 5.2% 33 (7.6%) 31 (4.1%) 2 (2.7%)
Jurisdiction
Total
Number of
Bridges
Structurally Deficient
Bridges Maintenance Responsibility
FIGURE 9 – STRUCTURALLY DEFICIENT BRIDGES IN HAMPTON ROADS BY
JURISDICTION AND MAINTENANCE RESPONSIBILITY Source: HRTPO analysis of VDOT and FHWA data. Data for Hampton Roads bridges as of December 2017.
DEFICIENT BRIDGES 15
James City/Williamsburg/York Transportation Study HAMPTON ROADS REGIONAL BRIDGE STUDY – 2018 UPDATE
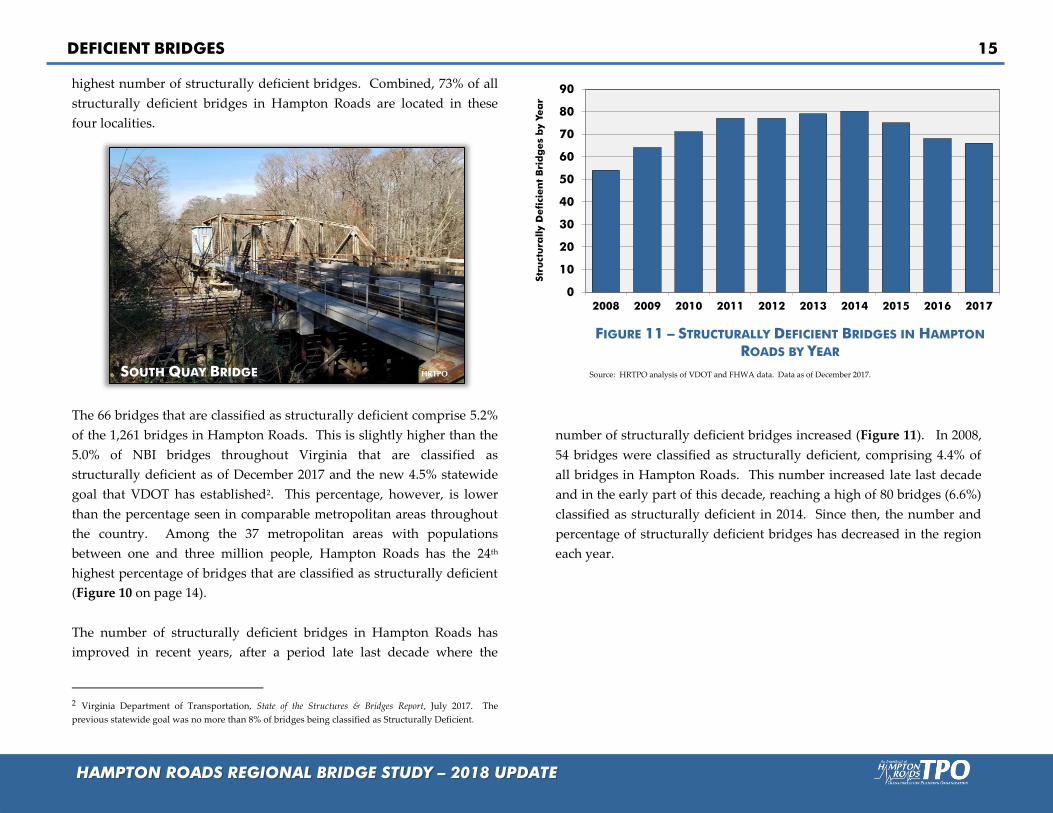
highest number of structurally deficient bridges. Combined, 73% of all
structurally deficient bridges in Hampton Roads are located in these
four localities.
The 66 bridges that are classified as structurally deficient comprise 5.2%
of the 1,261 bridges in Hampton Roads. This is slightly higher than the
5.0% of NBI bridges throughout Virginia that are classified as
structurally deficient as of December 2017 and the new 4.5% statewide
goal that VDOT has established2. This percentage, however, is lower
than the percentage seen in comparable metropolitan areas throughout
the country. Among the 37 metropolitan areas with populations
between one and three million people, Hampton Roads has the 24th
highest percentage of bridges that are classified as structurally deficient
(Figure 10 on page 14).
The number of structurally deficient bridges in Hampton Roads has
improved in recent years, after a period late last decade where the
2 Virginia Department of Transportation, State of the Structures & Bridges Report, July 2017. The
previous statewide goal was no more than 8% of bridges being classified as Structurally Deficient.
number of structurally deficient bridges increased (Figure 11). In 2008,
54 bridges were classified as structurally deficient, comprising 4.4% of
all bridges in Hampton Roads. This number increased late last decade
and in the early part of this decade, reaching a high of 80 bridges (6.6%)
classified as structurally deficient in 2014. Since then, the number and
percentage of structurally deficient bridges has decreased in the region
each year.
SOUTH QUAY BRIDGE HRTPO
0
10
20
30
40
50
60
70
80
90
2008 2009 2010 2011 2012 2013 2014 2015 2016 2017
Str
uct
ura
lly D
efi
cien
t B
rid
ges
by Y
ea
r
SD Bridges by Year
FIGURE 11 – STRUCTURALLY DEFICIENT BRIDGES IN HAMPTON
ROADS BY YEAR Source: HRTPO analysis of VDOT and FHWA data. Data as of December 2017.

DEFICIENT BRIDGES 16
James City/Williamsburg/York Transportation Study HAMPTON ROADS REGIONAL BRIDGE STUDY – 2018 UPDATE
Juris
Federal
Bridge
# Facility Crossing
Year
Built
Year
Recnst
Owner-
ship
Deck
Condition
Rating
Super-
Structure
Condition
Rating
Sub-
Structure
Condition
Rating
Culvert
Condition
Rating
SD in
2012
Improve-
ments
Funded
CHES 21879 22nd Street Seaboard Avenue & NS R/R 1938 - City 4 3 4 N Yes Yes
CHES 21881 Bainbridge Blvd Norfolk Southern R/R 1938 1947 City 7 6 4 N No No
CHES 21797 Centerville Turnpike Chesapeake & Albemarle Canal 1955 1990 City 4 4 5 N Yes Yes
CHES 21824 Elbow Road Stumpy Lake Spillway 1975 - City 6 5 4 N No No
CHES 21827 Military Highway Bainbridge Blvd & NS R/R 1948 1960 City 4 4 5 N Yes Yes
CHES 21830 Military Highway Norfolk Southern R/R 1938 - City 3 4 4 N Yes Yes
CHES 21816 Number Ten Lane Lindsey Drainage Canal 1979 - City 5 4 5 N No Yes
CHES 30267 Old Mill Road Deep Creek 2013 - City N N N 4 No No
CHES 21937 Ramp to Bainbridge Blvd & NS R/R Bainbridge Blvd 1948 1960 City 6 4 5 N Yes Yes
CHES 21821 Rotunda Avenue Trib Goose Creek 1969 - City 5 6 4 N No No
GLO 10588 Adner Road (Rte 14) Porpotank Creek 1938 - VDOT 4 4 5 N Yes No
GLO 12086 Route 17 SB Dragon Run 1957 - VDOT 6 4 5 N No No
GLO 8548 Tidemill Road (Rte 641) Northwest Br Sarah Creek 1974 - VDOT 6 4 5 N Yes Yes
HAM 20353 Hampton Roads Bridge-Tunnel WB Hampton Roads 1957 1999 VDOT 5 4 4 N No No
HAM - Park Lane Road Bethel Reservoir 1935 - Federal 5 4 4 N Yes No
HAM - Ruckman Road West Crossing of Moat 1952 - Federal 5 5 4 N No No
IW 10420 Bows & Arrows Road (Rte 641) Ducks Swamp 1952 - VDOT 6 5 6 N No No
IW 10441 Dews Plantation Road (Rte 683) Stallings Creek 1954 - VDOT 7 5 6 N No No
IW 10442 Ennis Mill Road (Rte 690) Ennis Pond 1961 - VDOT 6 4 5 N No No
IW 10424 Fire Tower Road (Rte 644) Pope Swamp 1948 1979 VDOT 7 4 6 N No No
IW 10394 Jenkins Mill Road (Rte 615) Kingsale Swamp 1964 1978 VDOT 6 4 6 N No No
IW 10382 Longview Drive (Rte 602) Chuckatuck Creek 1951 - VDOT 7 5 6 N No No
IW 10417 Mill Creek Road (Rte 638) Burnt Mill Swamp 1951 1979 VDOT 6 4 5 N No No
IW 10416 Orbit Road (Rte 637) Carbell Swamp 1972 - VDOT N N N 4 Yes Yes
IW 22615 South Church Street (Rte 10) Cypress Creek 1975 - VDOT 5 4 6 N No Yes
IW 10445 Uzzell Church Road (Rte 692) Champion Swamp 1951 1979 VDOT 5 4 4 N Yes Yes
JCC 24057 Glass House Ferry (Rte 31) James River 1994 1995 VDOT 6 4 5 N Yes Yes
NN 20727 Denbigh Blvd I-64 & CSX R/R 1965 1977 VDOT 5 5 4 N Yes Yes
NN 20720 Fort Eustis Blvd Newport News Reservoir 1960 1985 City 5 4 5 N No Yes
NN 20679 Warwick Blvd Lake Maury 1931 1960 City 5 4 5 N Yes Yes
NOR 20811 Ocean View Avenue EB Tidewater Drive 1958 - City 4 5 5 N No Yes
PORT 21199 High Street W Branch Elizabeth River 1951 1975 City 5 5 4 N Yes YesPORT 21217 Victory Blvd Paradise Creek 1944 - City 5 5 4 N Yes No
Source: HRTPO analysis of VDOT and FHWA data. Data for Hampton Roads bridges as of December 2017. Bridges highlighted in yellow are not classified as Structurally Deficient as of January 2018 due to the new definition no longer including Structural Condition
and Waterway Adequacy standards. Funded improvements include those in the current Six-Year Improvement Program (FY 2018-2023), Hampton Roads Transportation Improvement Program (FY 18-21), and/or city Capital Improvement Plans/Programs.
FIGURE 12 – STRUCTURALLY DEFICIENT BRIDGES IN HAMPTON ROADS

DEFICIENT BRIDGES 17
James City/Williamsburg/York Transportation Study HAMPTON ROADS REGIONAL BRIDGE STUDY – 2018 UPDATE
Juris
Federal
Bridge
# Facility Crossing
Year
Built
Year
Recnst
Owner-
ship
Deck
Condition
Rating
Super-
Structure
Condition
Rating
Sub-
Structure
Condition
Rating
Culvert
Condition
Rating
SD in
2012
Improve-
ments
Funded
SH 17785 Adams Grove Road (Rte 615) Browns Branch 1932 - VDOT 8 5 6 N Yes No
SH 17838 Buckhorn Quarter Road (Rte 652) Buckhorn Swamp 1963 - VDOT 7 4 6 N No No
SH 17901 Burnt Reed Road (Rte 743) Tarrara Creek 1932 1997 VDOT 7 4 6 N No Yes
SH 17796 Crumpler Road (Rte 618) Terrapin Swamp 1962 - VDOT 7 4 7 N No No
SH 17820 Drake Road (Rte 638) Johnsons Mill 1961 - VDOT 6 4 6 N No No
SH 17865 General Thomas Hwy (Rte 671) Nottoway River 1960 - VDOT 5 4 5 N Yes Yes
SH 17784 Seacock Chapel Road (Rte 614) Blackwater River 1971 - VDOT 7 7 4 N No No
SH/SUF 17755 South Quay Road (Rte 189) Blackwater River 1940 1962 VDOT 5 3 4 N Yes Yes
SH 17859 Sykes Farm Road (Rte 667) Tarrara Creek 1972 - VDOT 7 4 6 N No No
SH 17757 Three Creek Road (Rte 308) Three Creek 1948 - VDOT 4 4 4 N Yes Yes
SH 17813 Tucker Swamp Road (Rte 635) Norfolk Southern R/R 1915 - VDOT 4 4 5 N Yes Yes
SH 17881 Woodland Road (Rte 682) Br Darden Mill Run 1932 - VDOT 7 4 5 N No No
SUF 22154 Badger Road Washington Ditch 1945 - City 5 5 4 N Yes Yes
SUF 22139 Box Elder Road Norfleets Swamp 1958 1994 City 7 5 5 N Yes No
SUF 22027 Carolina Road Cypress Swamp 1924 1972 City 5 4 5 N Yes Yes
SUF 22110 Elwood Road Kingsale Swamp 1962 - City 4 4 5 N Yes No
SUF 22148 Freeman Mill Road Spivey Swamp 1954 1976 City 5 4 6 N Yes No
SUF 22121 Lake Cahoon Road Norfolk Southern R/R 1962 1974 City 4 5 6 N Yes Yes
SUF 22137 Longstreet Lane Somerton Creek 1968 - City 6 4 4 N Yes Yes
SUF 22111 Mineral Springs Road Jones Swamp 1955 1977 City 5 4 5 N Yes Yes
SUF 22091 Nansemond Parkway Beamons Mill Pond 1920 - City 5 4 5 N Yes Yes
SUF 22105 Old Mill Road Cohoon Creek 1955 1981 City 4 4 6 N Yes No
SUF 22150 Pittmantown Road Mill Swamp 1950 - City 5 4 5 N Yes No
SUF 22107 Simons Drive Cohoon Creek 1945 - City 6 4 4 N Yes Yes
SUF 22138 Southwestern Blvd Chapel Swamp 1956 - City 5 4 4 N Yes Yes
SUF 22159 Turlington Road Branch Kilby Creek - Spillway 1957 - City 5 4 5 N Yes Yes
SUF 22158 Turlington Road Kilby Creek 1973 - City N N N 4 No No
SUF 22088 Washington Street Jericho Canal 1932 - City 6 5 6 N No Yes
SUR 18185 MLK Hwy (Rte 40) Otterdam Swamp 1954 - VDOT 5 4 5 N No Yes
SUR 18304 Three Bridges Road (Rte 603) Blackwater River 1932 - VDOT 5 4 5 N Yes No
VB 22239 I-264 First Colonial Road 1967 1986 VDOT 7 4 5 N No No
VB 22170 Indian River Road West Neck Creek 1975 - City 4 5 5 N No NoVB 22252 Laskin Road Linkhorn Bay 1938 1956 City 5 4 4 N Yes Yes
FIGURE 12 – STRUCTURALLY DEFICIENT BRIDGES IN HAMPTON ROADS (CONTINUED) Source: HRTPO analysis of VDOT and FHWA data. Data for Hampton Roads bridges as of December 2017. Bridges highlighted in yellow are not classified as Structurally Deficient as of January 2018 due to the new definition no longer including Structural Condition
and Waterway Adequacy standards. Funded improvements include those in the current Six-Year Improvement Program (FY 2018-2023), Hampton Roads Transportation Improvement Program (FY 18-21), and/or city Capital Improvement Plans/Programs.

DEFICIENT BRIDGES 18
James City/Williamsburg/York Transportation Study HAMPTON ROADS REGIONAL BRIDGE STUDY – 2018 UPDATE
Data source: HRTPO analysis of VDOT and FHWA data.
Data as of December 2017.
MAP 1
STRUCTURALLY DEFICIENT
BRIDGES IN HAMPTON ROADS
Non-Structurally Deficient Bridges
LEGEND
Structurally Deficient Bridges

DEFICIENT BRIDGES 19
James City/Williamsburg/York Transportation Study HAMPTON ROADS REGIONAL BRIDGE STUDY – 2018 UPDATE
FUNCTIONALLY OBSOLETE BRIDGES
A functionally obsolete bridge is a structure that was built to geometric
standards that are no longer used today. Functionally obsolete bridges
do not have adequate lane widths, shoulder widths, or vertical
clearances to serve current traffic volumes or meet current geometric
standards. Functionally obsolete bridges also may occasionally be
flooded or have approaches that are difficult to navigate.
In spite of these deficiencies, functionally obsolete bridges are not
inherently unsafe. Bridge inspectors will close or impose weight
limits on bridges that they feel are unsafe.
Bridges are classified as functionally obsolete if at least one of the
following conditions is true:
For definitions of these terms and ratings, see Appendix B.
By rule, any structure that is classified as structurally deficient cannot
also be classified as functionally obsolete. Structures that have ratings
that would qualify the bridge to be classified as both structurally
deficient and functionally obsolete are classified as structurally
deficient.
Similar to structurally deficient bridges, bridges built or reconstructed
within the last ten years historically could not be classified as
Component Rating
Structural Condition Rating = 3
Waterway Adequacy Rating = 3
Deck Geometry Rating ≤ 3
Underclearances Rating ≤ 3
Approach Roadway Alignment Rating ≤ 3
FUNCTIONALLY OBSOLETE BRIDGES SUMMARY
Bridges in Hampton Roads that are classified as functionally obsolete
261/20.7% 379/31.0% in 2012
HICKS ISLAND ROAD (RTE 601) IN JAMES CITY COUNTY HRTPO

DEFICIENT BRIDGES 20
James City/Williamsburg/York Transportation Study HAMPTON ROADS REGIONAL BRIDGE STUDY – 2018 UPDATE
functionally obsolete. The Ten Year Rule, however, was
removed under the MAP-21 surface transportation
authorization program.
There are 261 bridges in Hampton Roads that are classified
as functionally obsolete as of December 2017, which
comprises 20.7% of the 1,261 bridges in Hampton Roads.
These bridges are shown in Figure 14 on pages 21-26 and
Map 2 on page 27. This percentage is slightly higher than
the percentage of NBI bridges throughout Virginia that are
classified as functionally obsolete (18.7% as of December
2017).
Figure 13 shows functionally obsolete bridges in Hampton
Roads by jurisdiction and maintenance responsibility.
Norfolk (65 bridges), Chesapeake (31 bridges), and Virginia
Beach (30 bridges) have the highest number of functionally
obsolete bridges. The majority of bridges in Hampton Roads
that are functionally obsolete (59%) are owned and
maintained by VDOT. However, the percentage of bridges maintained
by VDOT that are functionally obsolete (20.6%) is only slightly higher
than the percentage of bridges maintained by localities that are
functionally obsolete (17.6%).
It should be noted that as of 2016, FHWA is no longer tracking whether
bridges are classified as functionally obsolete. MAP-21 discontinued
the Highway Bridge Program (as described later in this report), and
under the current funding and authorization bill bridges being
classified as functionally obsolete has no impact on bridge funding
levels or eligibility. Because of this, no comparison is made between
bridges in Hampton Roads and those in comparable metropolitan areas
in terms of functionally obsolete classifications.
Number Percentage Locality VDOT Other
Chesapeake 183 31 16.9% 22 7 2
Gloucester 24 1 4.2% - 1 -
Hampton 83 22 26.5% 12 9 1
Isle of Wight 85 22 25.9% - 22 -
James City 62 18 29.0% - 14 4
Newport News 93 21 22.6% 6 15 -
Norfolk 189 65 34.4% 12 49 4
Poquoson 0 0 - - - -
Portsmouth 48 8 16.7% 2 5 1
Southampton/Franklin 138 13 9.4% - 13 -
Suffolk 135 8 5.9% 7 1 -
Surry 32 3 9.4% - 3 -
Virginia Beach 125 30 24.0% 13 8 9
Williamsburg 12 6 50.0% 3 - 3
York 52 13 25.0% - 8 5
HAMPTON ROADS 1,261 261 20.7% 77 (17.6%) 155 (20.6%) 29 (39.7%)
Jurisdiction
Total
Number of
Bridges
Functionally Obsolete
Bridges Maintenance Responsibility
FIGURE 13 – FUNCTIONALLY OBSOLETE BRIDGES IN HAMPTON ROADS BY
JURISDICTION AND MAINTENANCE RESPONSIBILITY Source: HRTPO analysis of VDOT and FHWA data. Data for Hampton Roads bridges as of December 2017.

DEFICIENT BRIDGES 21
James City/Williamsburg/York Transportation Study HAMPTON ROADS REGIONAL BRIDGE STUDY – 2018 UPDATE
FIGURE 14 – FUNCTIONALLY OBSOLETE BRIDGES IN HAMPTON ROADS Source: HRTPO analysis of VDOT and FHWA data. Data for Hampton Roads bridges as of December 2017.
Juris
Federal
Bridge
# Facility Crossing
Year
Built
Year
Recnst Ownership
CHES 21840 Airline Blvd Br Goose Creek 1932 - City
CHES 23762 Bainbridge Blvd Mains Creek 1993 - City
CHES 21819 Barnes Road I-464 1983 - VDOT
CHES 21885 Battlefield Blvd Military Highway 1990 - City
CHES 30273 Benefit Road Drainage Ditch 2013 - City
CHES 21804 Benefit Road Lead Ditch 1958 1976 City
CHES 30266 Campostella Road Trib Deep Creek 2012 - City
CHES 25185 Campostella Road SB Ramp Norfolk Southern R/R 2000 - City
CHES 28514 Cedar Road Lindsey Drainage Canal 2006 - City
CHES 21812 Dock Landing Road Bailey Creek 1970 - City
CHES 21805 Etheridge Manor Blvd Coopers Ditch 1990 - City
CHES 30367 Fentress Airfield Road Pocaty Creek 2014 - City
CHES 21810 Fentress Airfield Road Pocaty Creek 1963 - City
CHES 1818 George Washington Hwy Dismal Swamp Canal 1934 2016 Federal
CHES 21906 Great Bridge Blvd I-64 1967 - VDOT
CHES 25566 Great Bridge Bypass NB Battlefield Blvd 1998 - City
CHES 25696 Hanbury Road Chesapeake Expressway 1998 - City
CHES 21941 I-464 NB I-64 1967 - VDOT
CHES 21943 I-464 SB I-64 1967 - VDOT
CHES 21911 I-664 NB W Military Hwy & CSX R/R 1983 - VDOT
CHES 21913 I-664 SB W Military Hwy & CSX R/R 1983 - VDOT
CHES 21799 Indian Creek Road Indian Creek 1972 - City
CHES 25188 Indian River Road Norfolk Southern R/R 1998 - City
CHES 21798 Land Of Promise Road Pocaty Creek 1971 - City
CHES 24742 Luray Street Dismal Swamp Canal Splwy 1996 - City
CHES 1826 Mount Pleasant Road Chesapeake & Albemarle Canal 1951 2014 Federal
CHES 21932 Poindexter Street I-464 1980 - VDOT
CHES 28796 Route 17 NB Bainbridge Blvd 2014 - City
CHES 28795 Route 17 SB Bainbridge Blvd 2015 - City
CHES 28792 Route 17 Cedar Road 2016 - City
CHES 27402 Route 17 Stream 2006 - City
GLO 12085 Route 17 NB Dragon Run 1931 - VDOT
HAM 20293 Big Bethel Road Newmarket Creek 1970 - City
HAM 20362 Cunningham Drive EB I-64 1974 - City
HAM 20364 Cunningham Drive WB I-64 1974 - City
HAM P1113 East Gate Road East Crossing Of Moat 1950 - Federal
HAM 20324 I-64 Armistead Avenue 1957 1986 VDOT
HAM 26145 I-64 Mercury Blvd 2005 - VDOT
HAM 20316 I-64 EB Pembroke Avenue & Hampton River 1958 1987 VDOT
HAM 20346 I-64 WB Pembroke Avenue & Hampton River 1985 - VDOT
HAM 20320 I-64 Rip Rap Road 1959 1984 VDOT
HAM 26146 I-64 Ramp Mercury Blvd 2005 - VDOT
HAM 20328 I-664 SB Ramp I-64 & Newmarket Creek 1981 - VDOT
HAM 25293 LaSalle Avenue NB Mercury Blvd 1998 - City

DEFICIENT BRIDGES 22
James City/Williamsburg/York Transportation Study HAMPTON ROADS REGIONAL BRIDGE STUDY – 2018 UPDATE
FIGURE 14 – FUNCTIONALLY OBSOLETE BRIDGES IN HAMPTON ROADS (CONTINUED) Source: HRTPO analysis of VDOT and FHWA data. Data for Hampton Roads bridges as of December 2017.
Juris
Federal
Bridge
# Facility Crossing
Year
Built
Year
Recnst Ownership
HAM 20367 LaSalle Avenue NB Newmarket Creek 1965 - City
HAM 25292 LaSalle Avenue SB Mercury Blvd 1998 - City
HAM 20368 LaSalle Avenue SB Newmarket Creek 1965 - City
HAM 26143 Magruder Blvd I-64 2004 - VDOT
HAM 20361 Mellen Street Mill Creek 1961 1982 City
HAM 20381 Mercury Blvd Mill Creek (Northern Bridge) 1989 - City
HAM 20382 Mercury Blvd Mill Creek (Southern Bridge) 1989 - City
HAM 26149 Mercury Blvd Ramp Mercury Blvd 2005 - VDOT
HAM 20390 Power Plant Pkwy Newmarket Creek 1962 - City
HAM 20292 Powhatan Pkwy Indian River 1929 1997 City
IW 10419 Barrett Town Road (Rte 641) Antioch Swamp 1955 1984 VDOT
IW 26218 Butler Farm Road (Rte 691) Beaverdam Swamp 1999 - VDOT
IW 10431 Carroll Bridge Road (Rte 654) Champion Swamp 1966 - VDOT
IW 29863 Carrsville Hwy (Bus Rte 58) Old Myrtle Road & CSX R/R 2017 - VDOT
IW 10421 Colosse Road (Rte 641) Corrowaugh Swamp 1955 1992 VDOT
IW 10440 Comet Road (Rte 681) Comet Swamp 1955 1991 VDOT
IW 10389 Freeman Drive (Rte 612) Corrowaugh Swamp 1954 - VDOT
IW 10427 Garrison Drive (Rte 646) Burnt Mill Swamp 1945 1978 VDOT
IW 10422 Harvest Drive (Rte 641) Kingsale Swamp 1955 - VDOT
IW 10443 Jamestown Lane (Rte 691) Csx Railroad 1938 - VDOT
IW 10413 Jones Town Drive (Rte 637) Br. Rattlesnake Swamp 1945 - VDOT
IW 10403 Mill Swamp Road (Rte 621) Mill Swamp 1952 1987 VDOT
IW 10407 Mill Swamp Road (Rte 626) Mount Holly Creek 1957 - VDOT
IW 10406 Mill Swamp Road (Rte 626) Stallings Creek 1945 - VDOT
IW 10435 Nike Park Road (Rte 669) Jones Creek 1961 - VDOT
IW 10411 Old Myrtle Road (Rte 632) Stream 1953 1991 VDOT
IW 10429 Pope Swamp Trail (Rte 647) Pope Swamp 1952 - VDOT
IW 27434 Rescue Road (Rte 704) Stream 2004 - VDOT
IW 10398 Scotts Factory Road (Rte 620) Champion Swamp 1976 - VDOT
IW 10384 Shiloh Drive (Rte 603) Ennis Pond 1955 - VDOT
IW 10434 Titus Creek Drive (Rte 668) Titus Creek 1966 - VDOT
IW 10436 Wrenns Mill Road (Rte 677) Wrenns Mill Spillway 1946 1987 VDOT
JCC 10533 Hickory Signpost Road (Rte 629) Mill Creek 1932 1997 VDOT
JCC 10516 Hicks Island Road (Rte 601) Diascund Creek 1932 1974 VDOT
JCC 10498 I-64 WB Six Mt Zion Road 1975 - VDOT
JCC 4290029P Jamestown Island Tour Road Creek 1957 - Federal
JCC 4290030P Jamestown Island Tour Road Creek 1957 - Federal
JCC 4290031P Jamestown Island Tour Road Kingsmill Creek 1957 - Federal
JCC 4290028P Jamestown Island Tour Road Pitch And Tar Swamp 1957 - Federal
JCC 10476 Jamestown Road (Rte 31) Powhatan Creek 1957 - VDOT
JCC 10464 John Tyler Hwy (Rte 5) Powhatan Creek 1937 1978 VDOT
JCC 10508 Route 199 WB Colonial Pkwy 1976 - VDOT
JCC 25513 Route 199 SB Monticello Avenue 1999 - VDOT
JCC 24228 Route 199 SB Routes 60 & 603 & CSX R/R 1995 - VDOT

DEFICIENT BRIDGES 23
James City/Williamsburg/York Transportation Study HAMPTON ROADS REGIONAL BRIDGE STUDY – 2018 UPDATE
FIGURE 14 – FUNCTIONALLY OBSOLETE BRIDGES IN HAMPTON ROADS (CONTINUED) Source: HRTPO analysis of VDOT and FHWA data. Data for Hampton Roads bridges as of December 2017.
Juris
Federal
Bridge
# Facility Crossing
Year
Built
Year
Recnst Ownership
JCC 10511 Route 199 EB Tour Road 1976 - VDOT
JCC 10513 Route 199 WB Tour Road 1976 - VDOT
JCC 10486 Route 60 EB CSX R/R 1964 - VDOT
JCC 10487 Route 60 WB CSX R/R 1968 - VDOT
JCC 10531 Stewarts Road (Rte 622) Branch Of Diascund Creek 1937 1997 VDOT
JCC 10532 Stewarts Road (Rte 622) Diascund Creek 1937 1997 VDOT
NN 20653 23rd-25th Street I-664/Warwick Blvd/CSX R/R 1988 - VDOT
NN 29307 26th Street I-664 1988 - VDOT
NN 20651 26th Street I-664 & CSX R/R 1987 - VDOT
NN 20663 28th Street I-664/Warwick Blvd/CSX R/R 1980 - VDOT
NN 20647 34th Street EB I-664/Warwick Blvd/CSX R/R 1988 - VDOT
NN 20649 34th Street WB I-664/Warwick Blvd/CSX R/R 1988 - VDOT
NN 30990 Gwynn Circle Lucas Creek 2017 - City
NN 20661 Huntington Avenue Former Shipyard R/R Spur 1899 - City
NN 20710 I-64 EB Fort Eustis Blvd 1965 - VDOT
NN 30639 I-64 EB Industrial Park Drive & R/R 2017 - VDOT
NN 30640 I-64 WB Industrial Park Drive & R/R 2017 - VDOT
NN 20740 I-664 39th Street 1987 - VDOT
NN 20738 I-664 Roanoke Avenue 1985 - VDOT
NN 20759 I-664 Ramp Ramp A 1990 - VDOT
NN 20761 I-664 Ramp Terminal Avenue 1990 - VDOT
NN 20731 J Clyde Morris Blvd NB CSX R/R 1975 - City
NN 20729 J Clyde Morris Blvd SB CSX R/R 1958 1975 City
NN 25809 Jefferson Avenue I-64 2000 - VDOT
NN 20643 Old Oyster Point Road I-64 1991 - VDOT
NN 20681 Warwick Blvd WB Fort Eustis Blvd 1960 1985 City
NN 20659 Washington Avenue Former Shipyard R/R Spur 1946 - City
NOR 20943 26th Street Lafayette River 1938 - City
NOR 21021 Admiral Taussig Blvd I-564 Ramps 1977 - VDOT
NOR 20781 Berkley Avenue EB Norfolk Southern R/R 1985 - City
NOR 20782 Berkley Avenue WB Norfolk Southern R/R 1985 - City
NOR 20961 Berkley Avenue Ramp Emergency Vehicle Ramp 1988 - VDOT
NOR 20805 Brambleton Avenue WB Hampton Blvd 1962 - Private
NOR 20768 First View Street Tidewater Drive 1958 - City
NOR 20764 Frontage Road I-264 1967 - VDOT
NOR 20770 Government Avenue Tidewater Drive 1956 - City
NOR 21034 Granby Street Tidewater Drive 1958 - City
NOR 21024 Hampton Blvd NB Lafayette River 1970 - City
NOR 21019 Hampton Blvd SB Ramp Hampton Blvd NB 1962 - Private
NOR 21002 I-264 EB Ballentine Avenue 1968 1998 VDOT
NOR 21004 I-264 WB Ballentine Avenue 1968 1998 VDOT
NOR 20947 I-264 WB E Branch Elizabeth River 1952 1991 VDOT
NOR 20992 I-264 EB Holt Street & NS R/R 1972 1990 VDOT
NOR 21000 I-264 WB Holt Street & NS R/R 1972 1991 VDOT
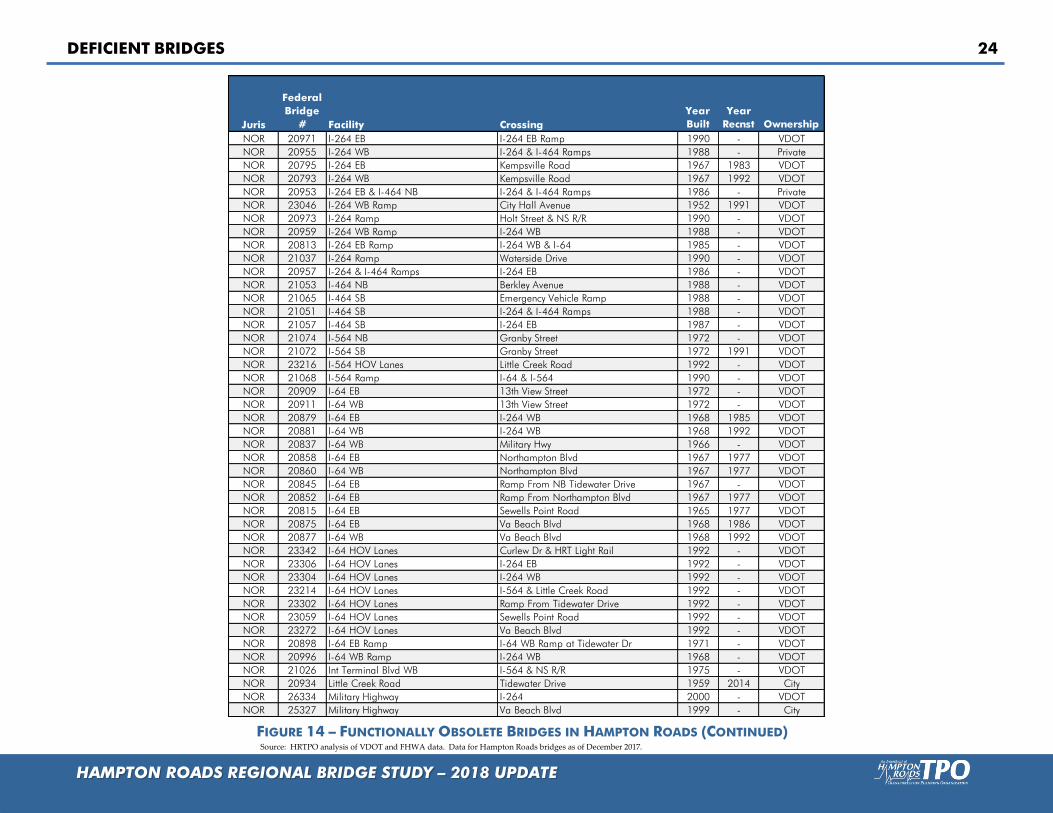
DEFICIENT BRIDGES 24
James City/Williamsburg/York Transportation Study HAMPTON ROADS REGIONAL BRIDGE STUDY – 2018 UPDATE
Juris
Federal
Bridge
# Facility Crossing
Year
Built
Year
Recnst Ownership
NOR 20971 I-264 EB I-264 EB Ramp 1990 - VDOT
NOR 20955 I-264 WB I-264 & I-464 Ramps 1988 - Private
NOR 20795 I-264 EB Kempsville Road 1967 1983 VDOT
NOR 20793 I-264 WB Kempsville Road 1967 1992 VDOT
NOR 20953 I-264 EB & I-464 NB I-264 & I-464 Ramps 1986 - Private
NOR 23046 I-264 WB Ramp City Hall Avenue 1952 1991 VDOT
NOR 20973 I-264 Ramp Holt Street & NS R/R 1990 - VDOT
NOR 20959 I-264 WB Ramp I-264 WB 1988 - VDOT
NOR 20813 I-264 EB Ramp I-264 WB & I-64 1985 - VDOT
NOR 21037 I-264 Ramp Waterside Drive 1990 - VDOT
NOR 20957 I-264 & I-464 Ramps I-264 EB 1986 - VDOT
NOR 21053 I-464 NB Berkley Avenue 1988 - VDOT
NOR 21065 I-464 SB Emergency Vehicle Ramp 1988 - VDOT
NOR 21051 I-464 SB I-264 & I-464 Ramps 1988 - VDOT
NOR 21057 I-464 SB I-264 EB 1987 - VDOT
NOR 21074 I-564 NB Granby Street 1972 - VDOT
NOR 21072 I-564 SB Granby Street 1972 1991 VDOT
NOR 23216 I-564 HOV Lanes Little Creek Road 1992 - VDOT
NOR 21068 I-564 Ramp I-64 & I-564 1990 - VDOT
NOR 20909 I-64 EB 13th View Street 1972 - VDOT
NOR 20911 I-64 WB 13th View Street 1972 - VDOT
NOR 20879 I-64 EB I-264 WB 1968 1985 VDOT
NOR 20881 I-64 WB I-264 WB 1968 1992 VDOT
NOR 20837 I-64 WB Military Hwy 1966 - VDOT
NOR 20858 I-64 EB Northampton Blvd 1967 1977 VDOT
NOR 20860 I-64 WB Northampton Blvd 1967 1977 VDOT
NOR 20845 I-64 EB Ramp From NB Tidewater Drive 1967 - VDOT
NOR 20852 I-64 EB Ramp From Northampton Blvd 1967 1977 VDOT
NOR 20815 I-64 EB Sewells Point Road 1965 1977 VDOT
NOR 20875 I-64 EB Va Beach Blvd 1968 1986 VDOT
NOR 20877 I-64 WB Va Beach Blvd 1968 1992 VDOT
NOR 23342 I-64 HOV Lanes Curlew Dr & HRT Light Rail 1992 - VDOT
NOR 23306 I-64 HOV Lanes I-264 EB 1992 - VDOT
NOR 23304 I-64 HOV Lanes I-264 WB 1992 - VDOT
NOR 23214 I-64 HOV Lanes I-564 & Little Creek Road 1992 - VDOT
NOR 23302 I-64 HOV Lanes Ramp From Tidewater Drive 1992 - VDOT
NOR 23059 I-64 HOV Lanes Sewells Point Road 1992 - VDOT
NOR 23272 I-64 HOV Lanes Va Beach Blvd 1992 - VDOT
NOR 20898 I-64 EB Ramp I-64 WB Ramp at Tidewater Dr 1971 - VDOT
NOR 20996 I-64 WB Ramp I-264 WB 1968 - VDOT
NOR 21026 Int Terminal Blvd WB I-564 & NS R/R 1975 - VDOT
NOR 20934 Little Creek Road Tidewater Drive 1959 2014 City
NOR 26334 Military Highway I-264 2000 - VDOT
NOR 25327 Military Highway Va Beach Blvd 1999 - City
FIGURE 14 – FUNCTIONALLY OBSOLETE BRIDGES IN HAMPTON ROADS (CONTINUED) Source: HRTPO analysis of VDOT and FHWA data. Data for Hampton Roads bridges as of December 2017.

DEFICIENT BRIDGES 25
James City/Williamsburg/York Transportation Study HAMPTON ROADS REGIONAL BRIDGE STUDY – 2018 UPDATE
FIGURE 14 – FUNCTIONALLY OBSOLETE BRIDGES IN HAMPTON ROADS (CONTINUED) Source: HRTPO analysis of VDOT and FHWA data. Data for Hampton Roads bridges as of December 2017.
Juris
Federal
Bridge
# Facility Crossing
Year
Built
Year
Recnst Ownership
NOR 20778 North Shore Road Branch Of Lafayette River 1979 - City
NOR 20767 Robin Hood Road Norfolk Water Supply Canal 1944 1987 City
NOR 20949 Waterside Drive EB East Main Street 1972 1990 VDOT
NOR 20776 Willow Wood Drive Branch Of Lafayette River 1987 - City
PORT 21193 Court Street I-264 WB 1951 1990 VDOT
PORT 21190 Greenwood Drive I-264 1976 - VDOT
PORT 21220 I-264 McLean Avenue 1964 1979 VDOT
PORT 21202 London Boulevard MLK Freeway 1971 - City
PORT 21200 London Boulevard N&P R/R & Virginia Ave 1971 - City
PORT 26653 MLK Freeway Cleveland Street & CSX R/R 2005 - Private
PORT 21210 Route 164 EB W Norfolk Road & Commonwealth R/R 1991 - VDOT
PORT 21212 Route 164 WB W Norfolk Road & Commonwealth R/R 1991 - VDOT
SH 17797 Burdette Road (Rte 619) Black Creek 1932 1983 VDOT
SH 17846 Cedar View Road (Rte 658) Angelico Creek 1932 2010 VDOT
SH 17767 Farmers Bridge Road (Rte 607) Assamoosic Swamp 1932 - VDOT
SH 17866 General Thomas Hwy (Rte 671) Nottoway River Overflow 1960 - VDOT
SH 17812 Indian Branch Lane (Rte 634) Indian Branch 1932 2016 VDOT
SH 29902 Meherrin Road (Rte 35) Nottoway River 2015 - VDOT
SH 17728 Meherrin Road (Rte 35) Overflow, Nottoway River 1979 - VDOT
SH 17768 Mill Neck Road (Rte 608) Racoon Swamp 1932 - VDOT
SH 17795 Sadler Road (Rte 618) Bar B Q Run 1932 - VDOT
SH 17874 Sands Road (Rte 674) Darden Mill Run 1932 2000 VDOT
SH 17782 Seacock Chapel Road (Rte 614) Branch 1932 2015 VDOT
SH 17833 Storys Station Road (Rte 650) Flaggy Run 1932 - VDOT
SH 17848 Vicks Millpond Road (Rte 659) Vicks Creek 1932 - VDOT
SUF 22099 Lake Prince Drive Lake Prince 1954 - City
SUF 22002 Main Street Nansemond River 1935 1987 City
SUF 22163 Pineview Road Chapel Swamp 1949 - City
SUF 30571 Robbie Road Mill Swamp 2015 - City
SUF 23098 Route 164 EB Route 17 1991 - VDOT
SUF 27625 Wilroy Road Burnetts Mill Creek 2003 - City
SUF 30980 Wilroy Road Magnolia Creek 2017 - City
SUF 22125 Wilroy Road Shingle Creek 1958 - City
SUR 18216 Alliance Road (Rte 634) College Run 1932 2003 VDOT
SUR 18220 Hog Island Road (Rte 650) Vepco Discharge Canal 1969 - VDOT
SUR 23137 Scotland Wharf (Rte 31) James River 1991 1995 VDOT
VB 12750 CBBT NB Chesapeake Bay 1964 - State Authority
VB 12752 CBBT NB Chesapeake Bay 1964 - State Authority
VB 12754 CBBT NB Chesapeake Bay 1964 - State Authority
VB 12755 CBBT NB Chesapeake Bay 1964 - State Authority
VB 26630 CBBT SB Chesapeake Bay 1998 - State Authority
VB 26721 CBBT SB Chesapeake Bay 1999 - State Authority
VB 12747 CBBT NB Chesapeake Bay & Lookout Rd 1964 - State Authority
VB 26056 CBBT SB Chesapeake Bay & Lookout Rd 1998 - State Authority

DEFICIENT BRIDGES 26
James City/Williamsburg/York Transportation Study HAMPTON ROADS REGIONAL BRIDGE STUDY – 2018 UPDATE
FIGURE 14 – FUNCTIONALLY OBSOLETE BRIDGES IN HAMPTON ROADS (CONTINUED) Source: HRTPO analysis of VDOT and FHWA data. Data for Hampton Roads bridges as of December 2017.
Juris
Federal
Bridge
# Facility Crossing
Year
Built
Year
Recnst Ownership
VB 12753 CBBT SB Fisherman's Inlet 1964 - State Authority
VB 22176 Elbow Road North Landing River 1960 - City
VB 24173 General Booth Blvd NB Rudee Inlet 1995 - City
VB 22191 General Booth Blvd SB Rudee Inlet 1968 - City
VB 22280 Great Neck Road NB Broad Bay Road & Long Creek 1988 - City
VB 22278 Great Neck Road SB Broad Bay Road & Long Creek 1988 - City
VB 22267 I-64 EB E Br Elizabeth River 1967 1992 VDOT
VB 22265 I-64 WB E Br Elizabeth River 1967 1992 VDOT
VB 22222 I-264 Independence Blvd 1967 1992 VDOT
VB 22232 I-264 London Bridge Road 1967 1982 VDOT
VB 22217 I-264 EB Ramp Baxter Road 1990 - VDOT
VB 25480 Inlet Road Inlet Of Lynnhaven River 1982 - City
VB 22212 International Parkway EB Drainage Canal #2 1987 - City
VB 26138 International Parkway WB Drainage Canal #2 1997 - City
VB 30128 Lynnhaven Parkway Charlestwn Lakes N Canal 2016 - City
VB 22186 Potters Road London Bridge Creek 1977 - City
VB 24949 Princess Anne Road West Neck Creek 1997 - City
VB 22287 Providence Road EB I-64 1967 - VDOT
VB 22285 Providence Road WB I-64 1967 - VDOT
VB 22183 Sandbridge Road Hells Point Creek 1961 - City
VB 22255 Virginia Beach Blvd I-264 WB Ramp 1967 - VDOT
VB 22180 W Great Neck Road Long Creek & Broad Bay Road 1961 - City
WMB 22328 Capitol Landing Road CSX R/R 1977 - City
WMB 4290019P Lafayette Street Colonial Parkway 1936 - Federal
WMB 22338 Merrimac Trail Colonial Parkway 1948 - City
WMB 4290020P Newport Avenue Colonial Parkway 1957 - Federal
WMB 4290018P Page Street Colonial Parkway 1936 - Federal
WMB 23768 Quarterpath Road Tutters Neck Pond 1993 - City
YC 19824 Coleman Bridge York River 1952 1996 VDOT
YC 4290009P Colonial Parkway Naval Weapons Road 1931 - Federal
YC 4290008P Colonial Parkway North Pier Access Road 1962 - Federal
YC 19883 East Queens Drive (Rte 716) Queens Creek - Spillway 1932 1997 VDOT
YC 19820 George Washington Hwy NB (Rte 17) Yorktown Battlefield Tour Road 1968 - VDOT
YC 19822 George Washington Hwy SB (Rte 17) Yorktown Battlefield Tour Road 1968 - VDOT
YC 19838 I-64 EB Colonial Pkwy 1965 - VDOT
YC 19840 I-64 WB Colonial Pkwy 1965 - VDOT
YC 19855 Magruder Blvd WB (Rte 134) Brick Kiln Creek 1930 - VDOT
YC 19857 Route 143 I-64 1965 - VDOT
YC 4290002P Yorktown Battlefield Tour Road Beaverdam Creek 1975 - Federal
YC 4290003P Yorktown Battlefield Tour Road Crawford Road 1956 - Federal
YC 4290004P Yorktown Battlefield Tour Road Route 17 1959 - Federal

DEFICIENT BRIDGES 27
James City/Williamsburg/York Transportation Study HAMPTON ROADS REGIONAL BRIDGE STUDY – 2018 UPDATE
Functionally Obsolete Bridges
Data source: HRTPO analysis of VDOT and FHWA data.
Data as of December 2017.
MAP 2
DEFICIENT BRIDGES IN
HAMPTON ROADS
Non-Deficient bridges
LEGEND
Structurally Deficient Bridges

DEFICIENT BRIDGES 28
James City/Williamsburg/York Transportation Study HAMPTON ROADS REGIONAL BRIDGE STUDY – 2018 UPDATE
WEIGHT-POSTED BRIDGES
A weight-posted bridge is defined as a structure that has a rated load-
carrying capacity that is less than the designated legal truck weights. In
Virginia, the maximum legal truck weight is 27 tons for a three-axle,
single unit vehicle and 40 tons for trucks with semi-trailers. Structures
are also posted if they have weight restrictions for five-axle, 45-ton
vehicles that can obtain blanket operating permits, which are DMV-
issued permits that allow an overweight truck to travel on any
designated route throughout the state. Bridge inspectors impose weight
restrictions on bridges as necessary for the structure to remain safely in
service.
A total of 69 of the 1,261 bridges (5.5%) in Hampton Roads have weight
limits posted as of December 2017. These bridges are shown in Figure
15 on pages 29-30. These weight-posted bridges are generally on lesser
traveled roadways; none of the weight-posted bridges carry over 10,000
vehicles per day. The most heavily-used weight-posted bridge in the
region is the Sunray Bridge (Military Highway over the Norfolk
Southern Railroad near Bowers Hill), which carries an average of 8,500
vehicles per day. Many are also on federal park roadways such as the
Jamestown Island Tour Road and Yorktown Battlefield Tour Road.
The number of weight-posted bridges in Hampton Roads has decreased
through the years. In the 2007 Regional Bridge Study, 119 bridges in
Hampton Roads had weight restrictions posted. In the 2012 study, this
number had decreased to 102 bridges posted with weight restrictions.
The percentage of weight-posted bridges in Hampton Roads is typical
of those in comparable metropolitan areas. At 5.5%, Hampton Roads
has the 18th highest percentage of weight-posted bridges among the 37
metropolitan areas with populations between one and three million
people.
WEIGHT-POSTED BRIDGES SUMMARY
Bridges in Hampton Roads that have posted weight restrictions
Hampton Roads rank among comparable metropolitan areas in terms of the percentage of bridges that have weight limits posted
69/5.5%
18th highest of 37 areas
22ND STREET BRIDGE GOOGLE

DEFICIENT BRIDGES 29
James City/Williamsburg/York Transportation Study HAMPTON ROADS REGIONAL BRIDGE STUDY – 2018 UPDATE
FIGURE 15 – WEIGHT-POSTED BRIDGES IN HAMPTON ROADS Source: HRTPO analysis of VDOT and FHWA data. Data for Hampton Roads bridges as of December 2017. SU = Single Unit trucks. The specific weight limits
on federal bridges are not included in the NBI data and are shown as “N/A” above.
All V
ehic
les
SU
Tru
cks
Sem
i-Tra
ilers
21879 CHES 22nd Street Seaboard Avenue & NS R/R 5 - -
21799 CHES Indian Creek Road Indian Creek - 14 20
21830 CHES Military Highway Norfolk Southern R/R - 19 31
10588 GLO Adner Road (Rte 14) Porpotank Creek - 27 40
P1113 HAM East Gate Road East Crossing of Moat
J50170 HAM Park Lane Road Bethel Reservoir
P1049 HAM Ruckman Road West Crossing of Moat
10392 IW Ballard Road (Rte 614) Corrowaugh Swamp 10 - -
10419 IW Barrett Town Road (Rte 641) Antioch Swamp 18 - -
10420 IW Bows & Arrows Road (Rte 641) Ducks Swamp 12 - -
10431 IW Carroll Bridge Road (Rte 654) Champion Swamp 18 - -
10378 IW Deer Path Trail (Rte 600) Ennis Pond 15 - -
10441 IW Dews Plantation Road (Rte 683) Stallings Creek 16 - -
10442 IW Ennis Mill Road (Rte 690) Ennis Pond 15 - -
10389 IW Freeman Drive (Rte 612) Corrowaugh Swamp 10 - -
10427 IW Garrison Drive (Rte 646) Burnt Mill Swamp 10 - -
10422 IW Harvest Drive (Rte 641) Kingsale Swamp 18 - -
10394 IW Jenkins Mill Road (Rte 615) Kingsale Swamp 18 - -
10413 IW Jones Town Drive (Rte 637) Br. Rattlesnake Swamp 15 - -
10382 IW Longview Drive (Rte 602) Chuckatuck Creek 9 - -
10403 IW Mill Swamp Road (Rte 621) Mill Swamp 14 - -
10406 IW Mill Swamp Road (Rte 626) Stallings Creek 18 - -
10429 IW Pope Swamp Trail (Rte 647) Pope Swamp 17 - -
10384 IW Shiloh Drive (Rte 603) Ennis Pond 12 - -
10445 IW Uzzell Church Road (Rte 692) Champion Swamp 11 - -
10381 IW Woodland Drive (Rte 600) Great Swamp 15 - -
24057 JCC Glass House Ferry (Rte 31) James River - 16 28
10533 JCC Hickory Signpost Road (Rte 629) Mill Creek 18 - -
10516 JCC Hicks Island Road (Rte 601) Diascund Creek 15 - -
4290029 JCC Jamestown Island Tour Road Creek
4290030 JCC Jamestown Island Tour Road Creek
4290031 JCC Jamestown Island Tour Road Kingsmill Creek
4290028 JCC Jamestown Island Tour Road Pitch and Tar Swamp
17785 SH Adams Grove Road (Rte 615) Browns Branch 10 - -
Federal
Bridge
#
N/A
N/A
Posted Weight
Limit (tons)
CrossingFacilityJuris
N/A
N/A
N/A
N/A
N/A

DEFICIENT BRIDGES 30
James City/Williamsburg/York Transportation Study HAMPTON ROADS REGIONAL BRIDGE STUDY – 2018 UPDATE
All V
ehic
les
SU
Tru
cks
Sem
i-Tra
ilers
17838 SH Buckhorn Quarter Road (Rte 652) Buckhorn Swamp 18 - -
17797 SH Burdette Road (Rte 619) Black Creek 14 - -
17796 SH Crumpler Road (Rte 618) Terrapin Swamp 24 - -
17820 SH Drake Road (Rte 638) Johnsons Mill 14 - -
17767 SH Farmers Bridge Road (Rte 607) Assamoosic Swamp 10 - -
17768 SH Mill Neck Road (Rte 608) Racoon Swamp 9 - -
17811 SH Saint Lukes Road (Rte 633) Horse Pen Run 21 - -
17874 SH Sands Road (Rte 674) Darden Mill Run 24 - -
17781 SH Seacock Chapel Road (Rte 614) Seacock Swamp 27 - -
17755 SH/SUF South Quay Road (Rte 189) Blackwater River 9 - -
17757 SH Three Creek Road (Rte 308) Three Creek - 27 40
17813 SH Tucker Swamp Road (Rte 635) Norfolk Southern R/R 11 - -
22154 SUF Badger Rd Washington Ditch 8 - -
22139 SUF Box Elder Road Norfleets Swamp 13 - -
22110 SUF Elwood Road Kingsale Swamp 6 - -
22148 SUF Freeman Mill Road Spivey Swamp 10 - -
22099 SUF Lake Prince Drive Lake Prince 18 - -
22137 SUF Longstreet Lane Somerton Creek 18 - -
22111 SUF Mineral Springs Road Jones Swamp 13 18 -
22091 SUF Nansemond Parkway Beamons Mill Pond - 23 30
22105 SUF Old Mill Road Cohoon Creek 27 - -
22163 SUF Pineview Road Chapel Swamp - 27 38
22150 SUF Pittmantown Road Mill Swamp 8 - -
22107 SUF Simons Drive Cohoon Creek 6 - -
22138 SUF Southwestern Blvd Chapel Swamp 9 - -
22159 SUF Turlington Road Branch Kilby Creek- Spillway 19 - -
18206 SUR Beaverdam Road (Rte 626) Sunken Meadow Creek 15 - -
18187 SUR Goodrich Fork Road (Rte 604) Terrapin Swamp 21 - -
18185 SUR MLK Hwy (Rte 40) Otterdam Swamp - 27 40
23137 SUR Scotland Wharf (Rte 31) James River - 16 28
18304 SUR Three Bridges Road (Rte 603) Blackwater River 8 - -
19883 YC East Queens Drive (Rte 716) Queens Creek - Spillway 11 - -
4290002 YC Yorktown Battlefield Tour Road Beaverdam Creek
4290003 YC Yorktown Battlefield Tour Road Crawford Road
4290004 YC Yorktown Battlefield Tour Road Route 17
N/A
N/A
N/A
Federal
Bridge
#
Posted Weight
Limit (tons)
CrossingFacilityJuris
FIGURE 15 – WEIGHT-POSTED BRIDGES IN HAMPTON ROADS (CONTINUED)
Source: HRTPO analysis of VDOT and FHWA data. Data for Hampton Roads bridges as of December 2017. SU = Single Unit trucks. The specific weight limits
on federal bridges are not included in the NBI data and are shown as “N/A” above.

DEFICIENT BRIDGES 31
James City/Williamsburg/York Transportation Study HAMPTON ROADS REGIONAL BRIDGE STUDY – 2018 UPDATE
HEIGHT-RESTRICTED BRIDGES
A height-restricted bridge is a structure that has a vertical clearance that
is less than legal standards. This restriction can be based on the
elevation of the structure spanning the roadway, the clearance for a
bridge where the roadway travels through the structure such as a truss
bridge, or the vertical clearance in a tunnel.
Virginia law dictates that the maximum height for vehicles traveling on
Virginia roadways is 13 feet, 6 inches. Oversize permits, however, are
available from the Virginia Department of Motor Vehicles (DMV) when
the size of the load cannot be reduced to meet this limit.
According to both the Manual of Uniform Traffic Control Devices
(MUTCD) and the Virginia Supplement to the MUTCD, bridges shall be
posted with a low clearance sign when the vertical clearance of the
bridge is less than 14 feet, 6 inches, which is one foot above the statutory
maximum vehicle height. The vertical clearance posted on the warning
signs shall be 3 inches less than the actual vertical clearance. The
Virginia Supplement to the MUTCD also states that warning signs may
be posted for bridges with a vertical clearance of 14 feet, 6 inches or
greater based upon engineering judgment. Figure 16 on page 32
includes those structures in Hampton Roads with a vertical clearance of
less than 14 feet, 6 inches. It should be noted, however, that Figure 16
only includes those bridges that are part of the National Bridge
Inventory (NBI). The NBI does not include any bridges that do not
carry roadways, such as bridges that only carry railroads or structures
restricted to pedestrians and bicyclists.
Most tunnels in Hampton Roads have height-restrictions posted at the
statutory height of 13 feet, 6 inches, although many have vertical
clearances of at least 14 feet, 6 inches. The tunnel with the most
prominent issues related to height restrictions is the westbound
Hampton Roads Bridge-Tunnel (HRBT). The westbound HRBT – while
posted at 13 feet, 6 inches – has an actual vertical clearance only a few
inches taller. This leads to many vehicles being turned around due to
this limitation. In 2016, 7,100 vehicles approaching the westbound
HRBT were stopped, measured, and turned around for being
overheight. This includes 1,437 vehicles at the tunnel entrance on the
South Island, which greatly impacts congestion and safety since traffic
has to be stopped in both directions to complete the turnaround.
RIP RAP ROAD AT I-64 GOOGLE

DEFICIENT BRIDGES 32
James City/Williamsburg/York Transportation Study HAMPTON ROADS REGIONAL BRIDGE STUDY – 2018 UPDATE
Federal
Bridge
# Juris Facility Crossing
Posted
Vertical
Clearance
21797 CHES Centerville Turnpike Chesapeake & Albemarle Canal 13' 9"
21937 CHES Ramp to Bainbridge Blvd & NS R/R Bainbridge Blvd 13' 8"
20324 HAM I-64 Armistead Avenue 13' 8"
20326 HAM I-64 LaSalle Avenue 13' 6"
20320 HAM I-64 Rip Rap Road 13' 2"
20384 HAM Mercury Blvd EB King Street 14' 2"
20386 HAM Mercury Blvd WB King Street 14' 2"
10511 JCC Route 199 EB Tour Road 11' 4"
10513 JCC Route 199 WB Tour Road 11' 3"
20673 NN Mercury Blvd EB Warwick Boulevard 14' 2"
20675 NN Mercury Blvd WB Warwick Boulevard 14' 2"
20805 NOR Brambleton Avenue WB Hampton Blvd 13' 11"
20768 NOR First View Street Tidewater Drive 13' 10"
20770 NOR Government Avenue Tidewater Drive 13' 10"
21034 NOR Granby Street Tidewater Drive 13' 10"
20831 NOR I-64 EB Azalea Garden Road 14' 0"
20833 NOR I-64 WB Azalea Garden Road 14' 0"
20835 NOR I-64 EB Military Highway 14' 2"
20837 NOR I-64 WB Military Highway 14' 2"
20858 NOR I-64 EB Northampton Blvd 14' 0"
20860 NOR I-64 WB Northampton Blvd 14' 0"
20856 NOR I-64 EB Ramp Northampton Blvd 13' 10"
20827 NOR I-64 EB Robin Hood Road 14' 2"
20829 NOR I-64 WB Robin Hood Road 14' 2"
20815 NOR I-64 EB Sewells Point Road 13' 7"
20817 NOR I-64 WB Sewells Point Road 13' 7"
20896 NOR I-64 EB Ramp Thole Street 14' 5"
20841 NOR I-64 EB Tidewater Drive 14' 3"
20843 NOR I-64 WB Tidewater Drive 14' 3"
20934 NOR Little Creek Road Tidewater Drive 13' 10"
20811 NOR Ocean View Avenue EB Tidewater Drive 14' 2"
20949 NOR Waterside Drive EB East Main Street 13' 10"
21220 PORT I-264 McLean Avenue 13' 9"
21218 PORT I-264 Rodman Avenue 14' 4"
12747 VB Chesapeake Bay Bridge-Tunnel NB Lookout Road 12' 4"
26056 VB Chesapeake Bay Bridge-Tunnel SB Lookout Road 12' 4"
22243 VB I-264 Birdneck Road 14' 1"
22239 VB I-264 First Colonial Road 14' 1"
22222 VB I-264 Independence Blvd 14' 0"
22232 VB I-264 London Bridge Road 13' 8"
22228 VB I-264 Lynnhaven Parkway 14' 0"
22226 VB I-264 South Plaza Trail 13' 10"
22224 VB I-264 Rosemont Road 14' 0"
22213 VB Northampton Blvd NB Shore Drive 14' 1"
22215 VB Northampton Blvd SB Shore Drive 14' 1"
22180 VB West Great Neck Road Long Creek & Broad Bay Road 12' 5"
19820 YC George Washington Hwy NB Yorktown Battlefield Tour Road 13' 8"
19822 YC George Washington Hwy SB Yorktown Battlefield Tour Road 13' 6"
4290003P YC Yorktown Battlefield Tour Road Crawford Road 13' 9"
FIGURE 16 – HEIGHT-RESTRICTED BRIDGES IN HAMPTON ROADS
Source: HRTPO analysis of VDOT and FHWA data. Data for
Hampton Roads bridges as of December 2017.

DEFICIENT BRIDGES 33
James City/Williamsburg/York Transportation Study HAMPTON ROADS REGIONAL BRIDGE STUDY – 2018 UPDATE
CLOSED BRIDGES IN HAMPTON ROADS
Two bridges in Hampton Roads have been closed in recent years due to
their deteriorating condition. One of these structures – the South
Norfolk Jordan Bridge – has been rebuilt while the other one – the Kings
Highway Bridge – has not.
JORDAN BRIDGE
The original Jordan Bridge – which spanned the Southern Branch of the
Elizabeth River between Chesapeake and Portsmouth – opened in 1928
as a privately-owned toll facility, creating a convenient fixed route
between Norfolk and points to the west.
By the middle of last decade, the Jordan Bridge was the oldest operating
drawbridge in Virginia, and was falling into disrepair despite
undergoing maintenance through the years. The weight limit was
restricted to three tons in order to remain in service. On November 8,
2008, the City of Chesapeake – which had owned the bridge since 1977 –
closed the Jordan Bridge to traffic.
Two months later, the Chesapeake City Council approved a proposal
from Figg Bridge Developers for a privately-funded, tolled structure to
replace the Jordan Bridge. On October 29, 2012 – nearly four years after
the original bridge was closed – the new South Norfolk Jordan Bridge
opened to traffic. With a 145-foot vertical clearance, the new structure is
the tallest bridge in Hampton Roads.
KINGS HIGHWAY BRIDGE
The Kings Highway Bridge was a structure that carried Virginia Route
125 across the Nansemond River in the Chuckatuck area of the City of
Suffolk. Similar to the Jordan Bridge, the Kings Highway Bridge
opened to traffic in 1928 as a privately-owned toll facility. VDOT
purchased the bridge in 1963 and maintained the bridge as a toll-free
facility.
In 2002, the Kings Highway Bridge
carried 2,700 vehicles each day. By
this time, however, the bridge was
falling into disrepair and load
limits were implemented which
prohibited heavy vehicles,
including school buses and
emergency vehicles, from using the
bridge.
On March 19, 2005, the Kings
Highway Bridge was closed to all
traffic. This created a 16-mile
detour from one side of the bridge
to the other, since the adjacent
bridges are five miles to the north (Bridge Road) and five miles to the
south (Suffolk Bypass). The Kings Highway Bridge was demolished in
early 2008.
According to city officials, the cost to replace the Kings Highway Bridge
is estimated to be $60 million. There is currently no funding in place for
the project, nor is it eligible for State of Good Repair funding (as
described later in this report). Replacing the Kings Highway Bridge is
also not included in the fiscally-constrained Hampton Roads 2040 Long-
Range Transportation Plan. However, the bridge is included in the
Hampton Roads 2040 Regional Transportation Vision Plan.
KINGS HIGHWAY BRIDGE VDOT

FRACTURE AND SCOUR CRITICAL BRIDGES 34
James City/Williamsburg/York Transportation Study HAMPTON ROADS REGIONAL BRIDGE STUDY – 2018 UPDATE
FRACTURE AND SCOUR CRITICAL BRIDGES
Certain structures, due to their design or location, require more
monitoring than typical bridges. Two types of structures that require
this additional monitoring are fracture critical bridges and bridges that
are vulnerable to scouring.
Most bridges are designed so that loads can be redistributed to other
structural members if any one structural member loses its ability to
distribute loads. However, fracture critical bridges are structures that
are designed with few or no redundant supporting elements and are in
danger of collapsing if a key structural member fails. Examples of
fracture critical bridges include most truss bridges, drawbridges, and
certain beam or girder bridges designed without redundant elements.
Despite this lack of redundant elements, fracture critical bridges are
not necessarily unsafe. Bridge inspectors will close or impose limits
on structures that they feel are unsafe. Fracture critical bridges
undergo more extensive and more frequent inspections – usually on an
annual basis – to ensure that they remain safe.
A total of 38 bridges in Hampton Roads are classified as fracture critical
as of December 2017 (Figure 17). This is the same number of bridges
that were classified as fracture critical in the 2012 Regional Bridge
Study. Notable examples include the Berkley Bridge, Coleman Bridge,
High Rise Bridge, and James River Bridge. Based on their design, all
drawbridges in Hampton Roads are classified as fracture critical.
Bridges with underwater substructure sections may be vulnerable to
scouring, or the exposure of portions of the substructure due to changes
in the river bed. In cases where a bridge is at risk of failure due to
scouring, the bridge is classified as scour critical. Underwater
substructure sections are inspected regularly (usually every five years)
to assure that bridges that could potentially be vulnerable to scouring
do not become scour critical. As of December 2017, no bridges in
Hampton Roads are classified as scour critical.
Federal
Bridge
# Juris Facility Crossing
27874 CHES Battlefield Blvd Chesapeake & Albemarle Canal
21797 CHES Centerville Turnpike Chesapeake & Albemarle Canal
1818 CHES George Washington Hwy Dismal Swamp Canal
27144 CHES Gilmerton Bridge S Branch Elizabeth River
21868 CHES High Rise Bridge S Branch Elizabeth River & SR 166
26355 CHES I-64 EB Collector Road Battlefield Blvd Ramp
26354 CHES I-64 WB Collector Road Greenbrier Pkwy Ramp
21915 CHES I-664 Ramp Route 58 & 460 EB
21937 CHES Ramp to Bainbridge Blvd & NS R/R Bainbridge Blvd
19824 GLO/YC Coleman Bridge York River
20314 HAM I-64 EB East Branch Hampton River
20399 HAM I-64 Ramps Newmarket Creek
20346 HAM I-64 WB Pembroke Avenue & Hampton River
20396 HAM I-664 NB I-64 Ramp & Newmarket Creek
20328 HAM I-664 SB Ramp I-64 & Newmarket Creek
10364 IW/NN James River Bridge James River
24057 JCC Glass House Ferry James River
10516 JCC Hicks Island Road Diascund Creek
20750 NN I-664 Terminal Avenue
20754 NN I-664 Ramp Terminal Avenue & CSX R/R
20761 NN I-664 Ramp Terminal Avenue
23186 NOR I-64 HOV Ramp I-64 WB & I-264 & Ramps
23191 NOR I-64 HOV Lanes I-64 WB
23214 NOR I-64 HOV Lanes I-564 & Little Creek Road
20962 NOR I-264 EB E Branch Elizabeth River
20971 NOR I-264 EB I-264 EB Ramp
20979 NOR I-264 WB City Hall Avenue
20947 NOR I-264 WB E Branch Elizabeth River
21000 NOR I-264 WB Holt Street & NS R/R
21224 PORT I-264 Norfolk & Portsmouth R/R
21242 PORT I-264 WB Ramp from Effingham Street
21208 PORT Route 164 EB Former Coast Guard Blvd
21206 PORT Route 164 WB Former Coast Guard Blvd
17755 SH South Quay Road Blackwater River
26972 SH Sunbeam Road Cokemoke Mill
17813 SH Tucker Swamp Road Norfolk Southern R/R
23137 SUR Scotland Wharf James River
12752 VB CBBT NB Chesapeake Bay
FIGURE 17 – FRACTURE CRITICAL BRIDGES IN HAMPTON ROADS Source: HRTPO analysis of VDOT and FHWA data. Data for Hampton Roads bridges as of December 2017.

HEALTH INDEX 35
James City/Williamsburg/York Transportation Study HAMPTON ROADS REGIONAL BRIDGE STUDY – 2018 UPDATE
HEALTH INDEX
VDOT and many other state DOTs use a measure referred to as the
Health Index to measure the physical condition of the bridge and
provide a reliable ranking system for bridge maintenance.
The Health Index is determined based on the physical condition of
various elements of the bridge – such as railings, joints, and girders
– which are each rated from “new condition” to “serious or badly
deteriorated condition”. These elements are then assigned a dollar
value based on their condition relative to a new structure. Each
element is assigned a weight and the elements are combined to
determine a current dollar value of the entire structure. The Health
Index of a structure is calculated by dividing this current dollar
value by the sum of the total value of all the structure’s elements in
new condition. A Health Index of 100% indicates that all of the
elements of the structure are in the best possible condition, while a
Health Index of 0% indicates that all of the elements are in the worst
possible condition. A low Health Index, however, does not mean
that the bridge is unsafe. Bridge inspectors will close or impose
weight limits on bridges that they feel are unsafe.
VDOT uses the Health Index as a factor to prioritize bridges for
State of Good Repair funding. VDOT calculates the Health Index for
most VDOT and locality-maintained structures and includes this
information in its bridge database.
The bridges in Hampton Roads with the lowest Health Indices are
shown in Figure 18.
FIGURE 18 – BRIDGES IN HAMPTON ROADS WITH THE LOWEST HEALTH INDICES Source: HRTPO analysis of VDOT data. Data for Hampton Roads bridges as of December 2017.
Juris
Federal
Structure
ID Facility Crossing
VDOT
Health
Index
IW 10416 Orbit Road (Rte 637) Carbell Swamp 31.97
SH 17820 Drake Road (Rte 638) Johnsons Mill 34.89
SH 17881 Woodland Road (Rte 682) Br Darden Mill Run 38.66
SUR 18304 Three Bridges Road (Rte 603) Blackwater River 44.46
WMB 22342 Monticello Avenue Stream 45.99
SH 17792 Ivor Road (Rte 616) Br Round Hill Swamp 46.67
SH 17797 Burdette Road (Rte 619) Black Creek 47.55
SH 17813 Tucker Swamp Road (Rte 635) Norfolk Southern R/R 48.08
SH 17901 Burnt Reed Road (Rte 743) Tarrara Creek 48.37
IW 10442 Ennis Mill Road (Rte 690) Ennis Pond 48.90
VB 25480 Inlet Road Inlet Of Lynnhaven River 49.06
VB 22252 Laskin Road Linkhorn Bay 49.07
SUR 18208 Beechland Road (Rte 626) Trib. Moores Swamp 49.66
SH 17728 Meherrin Road (Rte 35) Overflow, Nottoway River 50.00
IW 10394 Jenkins Mill Road (Rte 615) Kingsale Swamp 50.96
IW 10423 Bowling Green Road (Rte 644) Great Swamp 51.02
SUR 18204 Southwark Road (Rte 618) Grays Creek 53.30
IW 10417 Mill Creek Road (Rte 638) Burnt Mill Swamp 53.48
SH 17859 Sykes Farm Road (Rte 667) Tarrara Creek 53.54
IW 10382 Longview Drive (Rte 602) Chuckatuck Creek 54.75
SUR 18187 Goodrich Fork Road (Rte 604) Terrapin Swamp 54.79
IW 10445 Uzzell Church Road (Rte 692) Champion Swamp 55.26
SUR 14080 Montpelier Road (Rte 600) Upper Chippokes Creek 56.48
SUF 21996 Armistead Road (Rte 810) I-664 56.77
IW 10371 Route 258 Champion Swamp 57.89
SH 17838 Buckhorn Quarter Road (Rte 652) Buckhorn Swamp 58.40
SH 17806 Womble Mill Road (Rte 626) Wade Mill Pond 58.87
SH 17780 Fortsville Road (Rte 612) Apple White Swamp 59.24
CHES 21830 Military Highway Norfolk Southern R/R 59.50
SUR 18185 MLK Hwy (Rte 40) Otterdam Swamp 60.33
SH 17864 General Thomas Hwy (Rte 671) Branch 60.93
SH 17823 Cobb Road (Rte 642) Branch 61.11
SH 17877 Barns Church Cir (Rte 677) Branch 61.28
SH 17755 South Quay Road (Rte 189) Blackwater River 61.81
SH 17796 Crumpler Road (Rte 618) Terrapin Swamp 62.15
IW 10441 Dews Plantation Road (Rte 683) Stallings Creek 62.53
NOR 21070 I-564 NB Little Creek Road 62.75
JCC 10464 John Tyler Hwy (Rte 5) Powhatan Creek 63.24
SH 17862 Clarksbury Road (Rte 668) Rosa Swamp 63.37NOR 20787 Military Highway Branch Of Broad Creek 63.64

FEDERAL BRIDGE PERFORMANCE MEASURES 36
James City/Williamsburg/York Transportation Study HAMPTON ROADS REGIONAL BRIDGE STUDY – 2018 UPDATE
FEDERAL BRIDGE PERFORMANCE MEASURES
Recent federal legislation established that states and Metropolitan
Planning Organizations (MPOs) will be required to prepare and use a
set of federally-established performance measures and set targets.
These measures and targets will be required in areas including safety,
pavement condition, roadway performance, freight, and bridge
condition.
There are two bridge condition measures that states and MPOs will be
required to track and establish targets for:
Percentage of bridges by deck area on the National Highway
System (NHS) that are in good condition
Percentage of bridges by deck area on the NHS that are in poor
condition
The condition of each bridge (except for culverts) is determined using
the deck, superstructure, and substructure ratings, which are described
in detail earlier in the report. The condition of the deck, superstructure,
and substructure are all rated from 0 to 9, with 9 representing a
component in excellent condition and 0 representing a failed condition
or a closed bridge. For culverts, a single rating is given in place of the
deck, superstructure, and substructure ratings to assess the general
condition of the entire culvert.
The lowest of these three condition ratings (or the culvert condition
rating) is the rating used to determine whether the bridge is in good,
fair, or poor condition. If the lowest condition rating is ≥ 7, the bridge is
considered to be in good condition. If the lowest condition rating is 5 or
6, the bridge is in fair condition. Those bridges with the lowest
condition rating ≤ 4 are considered to be in poor condition.
Once each bridge on the NHS is classified as good, fair, or poor, the
bridge deck area is summed up for each classification to determine the
percentage of NHS bridge area in each MPO in good or poor condition.
Map 3 on page 39 shows the condition of each bridge in Hampton
Roads, and Figure 19 shows the number and area of bridges in the
region that are in good, fair, and poor condition based on these
standards for all bridges (as defined in this study), as well as only for
those bridges that carry the NHS.
In Hampton Roads, almost 30% of all bridges are in good condition as
of December 2017. Nearly two thirds of bridges (65.6%) are in fair
condition, while the remaining 4.8% are in poor condition. When
looking at the area of bridges in Hampton Roads, 35.0% is in good
condition, 61.9% is in fair condition, and 3.0% is in poor condition.
34.5%60.8%
4.7%
Bridges - VA
Good Fair Poor
29.7%
65.6%
4.8%
ALL Bridges - HR
26.2%
72.5%
1.2%
NHS Bridges ONLY - HR
35.0%
61.9%
3.0%
ALL Bridge Area - HR
34.8%
63.0%
2.2%
NHS Bridge Area ONLY - HR
FIGURE 19 – PERCENTAGE OF BRIDGES AND BRIDGE AREA IN
HAMPTON ROADS IN GOOD/FAIR/POOR CONDITION Source: HRTPO analysis of VDOT and FHWA data. Data as of December 2017.
ALL BRIDGES
ALL BRIDGES
BRIDGE AREA
BRIDGES
NHS BRIDGES ONLY
NHS BRIDGES ONLY

FEDERAL BRIDGE PERFORMANCE MEASURES 37
James City/Williamsburg/York Transportation Study HAMPTON ROADS REGIONAL BRIDGE STUDY – 2018 UPDATE
The condition improves when looking only at Hampton Roads bridges
that carry the NHS. Only 1.2% of bridges on the NHS in Hampton
Roads are in poor condition, with 26.2% in good condition and the
remaining 72.5% in fair condition. In terms of bridge area for those
bridges carrying the NHS, 34.8% is in good condition, 63.0% is in fair
condition, and only 2.2% is in poor condition.
Figure 20 shows the number of bridges in good, fair, and poor condition
in Hampton Roads, Virginia and other comparable large metropolitan
areas with populations between one and three million people. There is
a lower percentage of bridges in Hampton Roads that are in good
condition compared to the rest of Virginia and other comparable
metropolitan areas. While almost 30% of bridges in Hampton Roads are
in good condition, 34.5% of bridges in Virginia and 48.7% of bridges in
large metropolitan areas are in good condition. The percentage of
bridges in poor condition in Hampton Roads (4.8%) is comparable to
the statewide figure (4.7%), but is lower than the percentage seen in
other large metropolitan areas (6.3%).
Looking only at those bridges that carry the NHS, the percentage of
bridges that are in poor condition is much lower in Hampton Roads
(1.2%) than statewide (2.9%) and in comparable metropolitan areas
(3.5%). However, the percentage of NHS bridges in good condition is
much lower in Hampton Roads (26.2%) than in comparable
metropolitan areas (49.3%).
Figure 21 on page 38 shows the area of bridges in good, fair, and poor
condition in Hampton Roads, Virginia and other comparable large
metropolitan areas. There is a lower percentage of bridge area in
Hampton Roads that is in good condition compared to other areas, but
also a lower percentage that is in poor condition. The percentage of
bridge area in Hampton Roads in good condition (35.0%) is comparable
to the statewide percentage (35.7%), but is much lower than the 46.7% of
bridge area in large metropolitan areas that is in good condition. The
percentage of bridge area in poor condition, however, is also lower in
Hampton Roads (3.0%) than across Virginia (3.7%) and in comparable
metropolitan areas (5.5%)
29.7%
65.6%
4.8%
ALL Bridges - HR
26.2%
72.5%
1.2%
NHS Bridges ONLY - HR
34.5%
60.8%
4.7%
ALL Bridges - VA
26.2%
70.9%
2.9%
NHS Bridges - VA
48.7%45.0%
6.3%
ALL Bridges - Large MSAs
49.3%47.1%
3.5%
NHS Bridges - Large MSAs
FIGURE 20 – PERCENTAGE OF BRIDGES IN GOOD/FAIR/POOR CONDITION
Source: VDOT, FHWA, and HRTPO analysis of VDOT data. Includes only NBI bridges. Data for Hampton Roads and
Virginia bridges as of December 2017. Data reflects 2017 conditions for Comparable MPO bridges.
VIRGINIA
LARGE MSAS
TOTAL BRIDGES
NHS BRIDGES ONLY
LARGE MSAS
HAMPTON ROADS
VIRGINIA
HAMPTON ROADS
34.5%60.8%
4.7%
Bridges - VA
Good Fair Poor
34.5%60.8%
4.7%
Bridges - VA
Good Fair Poor
34.5%60.8%
4.7%
Bridges - VA
Good Fair Poor
34.5%60.8%
4.7%
Bridges - VA
Good Fair Poor

FEDERAL BRIDGE PERFORMANCE MEASURES 38
James City/Williamsburg/York Transportation Study HAMPTON ROADS REGIONAL BRIDGE STUDY – 2018 UPDATE
Looking only at the bridge area for those bridges on the NHS – which is
the measure that is reported for the federal performance measures – the
percentage of bridge area in poor condition is lower in Hampton Roads
(2.2%) than statewide (3.4%) and in comparable metropolitan areas
(5.2%). The percentage of NHS bridge area in good condition, however,
is lower in Hampton Roads (34.8%) than in comparable metropolitan
areas (45.1%).
TARGETS
Targets must be set by each state and MPO for the percentage of NHS
bridges by deck area that are in good and poor condition. MPOs may
adopt the statewide targets but report metrics specific to the
Metropolitan Planning Area (MPA); select unique, MPO-specific targets
and report metrics specific to the MPA; or use a combination of
statewide and unique targets.
Although there are no “penalties” for MPOs for not meeting their
performance targets, it can be addressed during the MPO’s quadrennial
certification review to ensure adequate performance-based planning.
For the statewide bridge targets, if for 3 consecutive years more than
10.0% of a State DOT’s NHS bridge total deck area is classified as
structurally deficient, the State DOT must obligate and set aside
National Highway Performance Program (NHPP) funds for eligible
projects on bridges on the NHS. As mentioned previously, Hampton
Roads is well below this threshold, with only 2.2% in poor condition as
of December 2017.
The initial bridge performance targets for each Metropolitan Planning
Organization (MPO) will be due 180 days after the statewide targets
have been submitted. With statewide bridge targets being due on May
20, 2018, MPO targets will be due in November 2018. HRTPO staff, in
cooperation with the Transportation Technical Advisory Committee
(TTAC), will produce the bridge performance measures and targets as
required by the federal legislation.
34.5%60.8%
4.7%
Bridges - VA
Good Fair Poor
34.5%60.8%
4.7%
Bridges - VA
Good Fair Poor
35.0%
61.9%
3.0%
ALL Bridge Area - HR
34.8%
63.0%
2.2%
NHS Bridge Area ONLY - HR
35.7%
60.6%
3.7%
ALL Bridge Area - VA
32.7%
63.8%
3.4%
NHS Bridge Area - VA
46.7%47.8%
5.5%
ALL Bridge Area - Large MSAs
45.1%
49.7%
5.2%
NHS Bridge Area - Large MSAs
FIGURE 21 – PERCENTAGE OF BRIDGE AREA IN GOOD/FAIR/POOR CONDITION
Source: VDOT, FHWA, and HRTPO analysis of VDOT data. Includes only NBI bridges. Data for Hampton Roads and
Virginia bridges as of December 2017. Data reflects 2017 conditions for Comparable MPO bridges.
VIRGINIA
LARGE MSAS
TOTAL BRIDGE AREA
NHS BRIDGE AREA ONLY
LARGE MSAS
HAMPTON ROADS
VIRGINIA
HAMPTON ROADS

FEDERAL BRIDGE PERFORMANCE MEASURES 39
James City/Williamsburg/York Transportation Study HAMPTON ROADS REGIONAL BRIDGE STUDY – 2018 UPDATE
Fair
Data source: HRTPO analysis of VDOT and FHWA data.
Data as of December 2017.
MAP 3
BRIDGE CONDITION IN
HAMPTON ROADS
Poor
LEGEND
Good
Based on Federal Bridge Performance Measure Standards
Under Construction

BRIDGE FUNDING 40
James City/Williamsburg/York Transportation Study HAMPTON ROADS REGIONAL BRIDGE STUDY – 2018 UPDATE
BRIDGE FUNDING
Funding for bridge projects comes from a variety of federal, state, and
local sources, and even tolls in some cases. However, the process for
funding bridges both on the federal and state level has changed in
recent years. This section details these various bridge funding sources.
FEDERAL BRIDGE FUNDING
On July 6, 2012, the Moving Ahead for Progress in the 21st Century Act
(MAP-21) federal surface transportation funding and authorization bill
was signed into law, which significantly changed how bridge
rehabilitation and reconstruction is funded on the federal level. The
current federal surface transportation funding and authorization bill –
the Fixing America’s Surface Transportation (FAST) Act – largely
continues these changes from the MAP-21 program. The FAST Act was
signed into law on December 4, 2015, and will remain in effect until
September 30, 2020.
Prior to MAP-21, the primary federal program for funding bridge
projects was the Highway Bridge Program. This program, which was
created by Congress in 1978 as the Highway Bridge Replacement and
Rehabilitation Program (HBRRP), provided dedicated funding to states
to enable them to improve the condition of highway bridges.
Allocating federal bridge funds to each state through the Highway
Bridge Program was done through a complex formula. The amount of
allocations was determined by each state’s relative share of the total
costs to rehabilitate or replace all eligible deficient bridges. Bridges
were considered eligible for federal bridge replacement funds if they
were classified as structurally deficient or functionally obsolete and had
a sufficiency rating of less than 50.0, and were considered eligible for
federal bridge rehabilitation funds if they were classified as structurally
deficient or functionally obsolete and had a sufficiency rating between
50.0 and 80.0. Funding levels were also determined by whether each
eligible deficient bridge was on a federal-aid roadway, which generally
includes all roadways that are not classified as locals or rural minor
collectors. The total deck area of all deficient bridges throughout the
state for each group (rehabilitation vs. replacement and federal-aid
roadway vs. non-federal-aid roadway) was summed together and
multiplied by a state average unit construction cost. These groups were
then combined to produce a statewide total cost that would be needed
to rehabilitate or replace all eligible bridges.
Although there were a number of stipulations, each state largely
controlled how they allocated federal bridge funding for their bridges
under the Highway Bridge Program.
Nationwide, $6.0 billion was authorized for the Highway Bridge
Program in Federal Fiscal Year 2012, which was the final year of the
program. Of that total, Virginia received $134 million, which was the
15th highest total apportionment and 31st highest apportionment per
capita among the 50 states and the District of Columbia.
MAP-21 greatly consolidated the number of programs – including the
Highway Bridge Program – from the previous authorization bill (the
Safe, Accountable, Flexible, Efficient Transportation Equity Act: A
Legacy for Users, or SAFETEA-LU). This consolidation continues under
the FAST Act. There are seven primary programs included in the FAST
Act: the National Highway Performance Program ($23.3 billion in
funding nationwide for FFY 2018), Surface Transportation Block Grant
Program ($11.7 billion), Highway Safety Improvement Program ($2.3
billion), Congestion Mitigation and Air Quality Program ($2.4 billion),
Railway-Highway Crossings Program ($0.2 billion), Metropolitan
Planning ($0.3 billion), and the National Highway Freight Program ($1.2
billion).

BRIDGE FUNDING 41
James City/Williamsburg/York Transportation Study HAMPTON ROADS REGIONAL BRIDGE STUDY – 2018 UPDATE
Under MAP-21, funding for bridges was moved from the Highway
Bridge Program to the National Highway Performance Program
(NHPP) and the Surface Transportation Program (STP). This continues
under the FAST Act, although the Surface Transportation Program has
been renamed the Surface Transportation Block Grant Program.
The National Highway Performance Program provides funding for the
condition and performance of the National Highway System (NHS),
and for the construction of new facilities on the NHS. This includes
funding for the construction, replacement, rehabilitation, preservation,
inspection, and protection of bridges and tunnels. The NHS was
expanded under MAP-21 to include all roadways classified as principal
arterial and above.
The NHPP program continues under the FAST Act, but there was a
significant change related to bridges. In the FAST Act, there is no
longer a requirement that bridges must be on the National Highway
System under the NHPP program. NHPP funds can now be used on
any bridge project on a federal-aid roadway.
Another change in MAP-21 – which is continued under the FAST Act –
is the emphasis on performance measures and targets. The FAST Act
establishes a standard where no more than 10 percent of the total deck
area of bridges on the NHS in a state can be classified as structurally
deficient. If a state has more than 10 percent of the total deck area of
bridges on the NHS classified as structurally deficient for three
consecutive years, the state must devote an amount equal to 50 percent
of that state’s Federal Fiscal Year 2009 bridge apportionment from the
state’s NHPP apportionment to bridges on the NHS each year until the
threshold is met. No additional funds are provided to the state to
improve bridges to the threshold.
The FAST Act also provides funding through the Surface
Transportation Block Grant Program. This program, which replaced the
Surface Transportation Program that was in previous federal surface
transportation authorization bills, provides flexible funding that may be
used for federal-aid highway projects, active transportation facilities,
and transit capital projects. In addition, the replacement, rehabilitation,
preservation, and protection of all bridges on public roadways may be
funded through the Surface Transportation Block Grant Program,
regardless of whether or not they are on the NHS.
There is a funding requirement in MAP-21 (and continued under the
FAST Act) for bridges that are not on federal-aid highways. A portion
of each state’s Surface Transportation Block Grant Program funds of no
less than 15 percent of the state’s Federal Fiscal Year 2009 Highway
Bridge Program apportionment is to be set aside for bridges not on
federal-aid highways (also referred to as off-system bridges), unless
federal officials determine that the State has insufficient needs to justify
this amount.
COLONIAL PARKWAY BRIDGES HRTPO

BRIDGE FUNDING 42
James City/Williamsburg/York Transportation Study HAMPTON ROADS REGIONAL BRIDGE STUDY – 2018 UPDATE
STATE BRIDGE FUNDING
The Virginia General Assembly passed two bills that significantly
changed how roadway maintenance and construction is funded and
prioritized throughout the Commonwealth. While the selection of
roadway improvement projects was changed by House Bill 2 (which is
now referred to as SMART SCALE), House Bill 1887 – which is now
referred to as the State of Good Repair (SGR) program – was instituted
to provide a dedicated funding source for improving the condition of
Virginia’s bridges and pavements.
House Bill 1887 requires that 45% of the state’s construction program be
allocated to improve deficient bridges and pavements. This funding is
allocated to each of the nine VDOT Construction Districts based on
needs, with guarantees that each district will receive a minimum of 5.5%
and a maximum of 17.5% of the total yearly allocation. This funding is
then further split within each district between VDOT-maintained and
locality-maintained structures.
For bridges, the State of Good Repair program replaces the Dedicated
Bridge Fund (DBF) and other funds allocated by the CTB. There will be
a transition period between the DBF/CTB funds and the SGR program
for funding bridges. While funding for structures through the SGR
program began in FY 2017, bridges will continue to be funded with
previously-allocated DBF funds through Fiscal Year 2020. Starting in
Fiscal Year 2021, all funding for rehabilitating or replacing bridges will
be allocated through the SGR program. However, new bridges, as well
as existing bridges on roadway corridor improvement projects, may be
funded through the SMART SCALE program. Figure 22 shows the
statewide bridge funding breakdown through this transition period.
The Commonwealth Transportation Board approved a resolution in
June 2016 that stated that structures will be selected for SGR program
funds based on a prioritization formula. Bridge projects will be eligible
for SGR funding if they meet the following criteria:
The bridge is classified as structurally deficient
The bridge meets the definition required to be included in the
National Bridge Inventory (which is described previously in
this report.)
The project meets the definition of bridge rehabilitation and
replacement in FHWA’s Bridge Preservation Guide
The proposed project must take the bridge out of structurally
deficient status
Inspections on the structure must be current
Bridge projects receiving funding from the SGR program must initiate
the Preliminary Engineering or Construction phase within 24 months of
the funds being awarded. If it is not initiated, funds for the bridge
project could be deallocated.
FIGURE 22 – STATEWIDE BRIDGE FUNDING BREAKDOWN
FY 2016-2022 Source: VDOT State of Structures and Bridges Report
Fiscal
Year
DBF and CTB
Funds - All
Sources
SGR - VDOT
Bridges
SGR - Local
Bridges
Bridge Funds -
All Sources
FY 2016 $123,658,554 N/A N/A $123,658,554
FY 2017 $118,943,248 $99,384,417 $17,634,814 $235,962,479
FY 2018 $158,500,763 $47,633,571 $8,452,121 $214,586,455
FY 2019 $204,374,544 $40,671,454 $8,387,756 $253,433,754
FY 2020 $203,338,182 $23,988,473 $5,463,088 $232,789,743
FY 2021 N/A $206,734,414 $37,930,646 $244,665,060
FY 2022 N/A $203,188,815 $37,342,553 $240,531,368

BRIDGE FUNDING 43
James City/Williamsburg/York Transportation Study HAMPTON ROADS REGIONAL BRIDGE STUDY – 2018 UPDATE
A State of Good Repair (SGR) Score is calculated for each bridge, and
structurally deficient bridges are prioritized for replacement or
rehabilitation based on the SGR Score. There are two prioritized lists for
each VDOT district, one for VDOT-maintained structures and one for
locality-maintained structures. Those bridges with higher SGR Scores
are prioritized for funding over those with lower SGR Scores, although
bridges in the list can be skipped over for reasons such as cost
effectiveness, maintenance of traffic, or the possible use of other funding
sources.
Five factors are assigned a specific percentage towards the overall SGR
Score for each bridge, and each factor can have a value of between 0 and
1. The five factors are:
Importance Factor (30%) – The Importance Factor measures the
relative importance of each bridge to the overall highway
network.
Condition Factor (25%) – The Condition Factor uses the Health
Index (which was described previously in this report) to
measure the overall physical condition of each bridge based on
the condition of each individual element.
Design Redundancy Factor (15%) – This factor measures four
risk factors related to redundancy, scour susceptibility, fatigue,
and vulnerability to earthquakes.
Structure Capacity Factor (10%) – The Structure Capacity Factor
measures the capacity of the structure to carry traffic, including
the impacts of weight restrictions, waterway adequacy, vertical
clearance, and the width of the bridge.
Cost-Effectiveness Factor (20%) – This factor measures the cost-
effectiveness of the work required.
The method for calculating each of these factors is described in much
more detail in Appendix C.
Based on the regulations included in the FAST Act that were detailed
previously, a portion of each state’s Surface Transportation Block Grant
Program funds of no less than 15 percent of the state’s Federal Fiscal
Year 2009 Highway Bridge Program apportionment is to be set aside for
bridges that are not on federal-aid highways. This equates to
approximately $18.9 million annually in Virginia.
As mentioned previously, the amount of SGR funding varies by VDOT
Construction District. For Fiscal Years 2018-2023, Hampton Roads is
expected to receive $167.2 million in SGR funding (Figure 23). Of this
amount, $53.5 million is for pavements and $113.7 million is for bridges.
Further, of this $113.7 million in SGR funding for bridges in Hampton
Roads, $63.5 million (56%) is for VDOT-maintained bridges and $50.2
million (44%) is for locality-maintained bridges.
FIGURE 23 – SGR FUNDING DISTRIBUTION BY VDOT
CONSTRUCTION DISTRICT, FY 2018-2023 Source: VDOT

BRIDGE FUNDING 44
James City/Williamsburg/York Transportation Study HAMPTON ROADS REGIONAL BRIDGE STUDY – 2018 UPDATE
The $113.7 million in SGR funding for bridges in Hampton Roads
comprises almost 14% of the $822.3 million in statewide SGR funding
for bridges. Among the nine VDOT Construction Districts, only the
Richmond District is receiving a larger share of SGR funding for
bridges.
In addition to the SGR program for bridges, funds are annually
allocated to cities and eligible towns for street and bridge maintenance,
construction, and reconstruction via the Urban Maintenance Program
and Urban Construction Program. Urban Maintenance Program funds
can be used for any eligible roadway maintenance activity. For bridges
this includes substructure and superstructure repair, culvert repair,
waterproofing bridge decks, and paying for the operational expenses
related to drawbridges. Urban Maintenance Program funds can also be
used by cities for bridge inspections, since cities are responsible for
inspecting the bridges that they own and maintain.
Urban Maintenance Program funds are allocated to cities based on the
number of lane-miles of roadway by functional classification that each
locality maintains. The number or condition of bridges in each city has
no impact on the level of maintenance funds each city receives. There is
an exception for the City of Chesapeake, which receives an additional $1
million annually from the Urban Maintenance Program for bridge
operations and maintenance due to the high number of movable bridges
operated and maintained by the city. This funding, however, only
covered about a third of the $3.2 million that Chesapeake budgeted in
Fiscal Year 2018 to cover bridge operations and maintenance.
The bridge projects in Hampton Roads that are slated to be funded
using SGR funding and other sources are detailed in the next section.
GREAT BRIDGE BRIDGE USACE

BRIDGE FUNDING 45
James City/Williamsburg/York Transportation Study HAMPTON ROADS REGIONAL BRIDGE STUDY – 2018 UPDATE
REGIONAL/LOCAL BRIDGE FUNDING
In addition to state and federal funding sources, transportation funding
is also available through the Regional Surface Transportation Program
(RSTP). RSTP funds are federal funds that are matched with state funds
that are allocated by each region’s Metropolitan Planning Organization
(MPO). Many bridge projects in Hampton Roads were funded (at least
partially) with RSTP funds. Recent examples include the Gilmerton
Bridge, Pinners Point Interchange, and Middle Ground Boulevard
railroad overpass. RSTP funding is also allocated to upcoming bridge
projects including the Campostella Bridge over the Eastern Branch of
the Elizabeth River, the Granby Street Bridge over the Lafayette River in
Norfolk, the new Skiffes Creek Connector spanning the CSX Railroad in
James City County, and a bridge on Turlington Road in Suffolk.
Many cities also provide local funds for bridge construction and
maintenance. Local funds are required as matching funds for certain
projects, and some cities fully fund smaller bridge projects through
Capital Improvement Plan/Program (CIP) allocations. Upcoming
examples of bridge projects fully funded with CIP allocations include
the 20th Street bridge over Salters Creek and the J. Clyde Morris
Boulevard bridge over the CSX Railway in Newport News, Sandbridge
Road over Hells Point Creek in Virginia Beach, and the Fentress Airfield
Road over Pocaty Creek, Indian River Road over Indian River, Number
Ten Lane over Lindsey Drainage Canal, and Route 168 Bypass over
Battlefield Boulevard bridges in Chesapeake.
TOLLS
Tolls are also used as a mechanism for funding bridge construction and
maintenance costs. Bridges in Hampton Roads that charge tolls include
the Coleman Bridge, Chesapeake Bay Bridge-Tunnel, South Norfolk
Jordan Bridge, and the Veterans Bridge. Tolls were also implemented at
the Midtown Tunnel and Downtown Tunnel to fund the recent
Midtown Tunnel/Downtown Tunnel/MLK Freeway project.
SOUTH NORFOLK JORDAN BRIDGE CITY OF CHESAPEAKE
GILMERTON BRIDGE VDOT

BRIDGE PROJECTS 46
James City/Williamsburg/York Transportation Study HAMPTON ROADS REGIONAL BRIDGE STUDY – 2018 UPDATE
BRIDGE PROJECTS
Since 2010, there have been 102 bridges throughout Hampton Roads
built, replaced, or that underwent a major rehabilitation. Of these 102
bridges (which are shown in Figure 25 on pages 48-50), 59 are
replacements of existing bridges, 22 are new structures where bridges
did not exist previously, and 21 are major rehabilitations of existing
bridges. Examples of bridges built or replaced in Hampton Roads in
this decade include the Gilmerton Bridge, Middle Ground Boulevard
over the CSX Railroad, and the South Norfolk Jordan Bridge. A number
of bridges were also built as part of the Dominion Boulevard and MLK
Freeway Extension projects.
In addition, a number of bridges in Hampton Roads are currently under
construction. This list includes the Eastbound Lesner Bridge in Virginia
Beach, the Sunray Overpass on Military Highway near Bowers Hill in
Chesapeake, the Warwick Boulevard bridge over Lake Maury in
Newport News, and the Churchland Bridge in Portsmouth. Bridges are
also being added or rebuilt as part of ongoing major regional priority
projects including I-64 widening on the Peninsula and the I-64/I-264
Interchange in Norfolk/Virginia Beach.
Upcoming bridge projects in Hampton Roads are included HRTPO’s
Hampton Roads Transportation Improvement Program (TIP), VDOT’s
Six-Year Improvement Program (SYIP), and in each city’s Capital
Improvement Plan/Program (CIP). The TIP is a federally-mandated,
fiscally-constrained regional document that identifies the programming
of transportation funds over a four year period. It lists all projects for
which federal funds are anticipated, along with non-federally funded
projects that are determined to be regionally significant.
The SYIP is a statewide document through which the Virginia
Commonwealth Transportation Board (CTB) allocates funds for the
construction, development, or study of transportation projects. Per its
name, the Six-Year Improvement Program includes information on
funding allocations for each project over the course of the upcoming six
state fiscal years. The SYIP is developed annually by VDOT and the
CTB, and most projects included in the TIP are also included in the SYIP
and vice-versa.
A total of 51 existing bridges in Hampton Roads are programmed for
replacement, rehabilitation, or removal in the current Six-Year
Improvement Program3, Transportation Improvement Program4, or a
city Capital Improvement Plan/Program (Figure 26 on page 51-52). Of
these 51 bridges, 36 are classified as structurally deficient (or were
classified as structurally deficient before construction started), 11 are
classified as functionally obsolete, and the remaining 4 bridges are not
deficient. Two projects involving new bridges – Route 58 at the Route
3 FY 2018-2023 Six-Year Improvement Program, Commonwealth Transportation Board, June 2017. 4 FY 2018-2021 Transportation Improvement Program, HRTPO, April 2017.
LESNER BRIDGE CONSTRUCTION VA BEACH

BRIDGE PROJECTS 47
James City/Williamsburg/York Transportation Study HAMPTON ROADS REGIONAL BRIDGE STUDY – 2018 UPDATE
58 Business intersection east of Courtland and the Skiffes Creek
Connector in James City County – are also included in the SYIP, as are
many roadway widening and construction projects that will involve
constructing new and replacement bridges.
A total of $475 million is allocated in the current SYIP, TIP, and CIPs to
these 51 bridge projects. Of this total, $244 million was allocated in
previous years and $231 million is allocated between Fiscal Years 2018
and 2023. However, the total estimated cost to replace these bridges is
$502 million dollars, leaving a shortfall that will require additional
allocations.
The majority of structurally deficient bridges in Hampton Roads have
funding in place for improvement projects. Among the 66 bridges in
Hampton Roads classified as structurally deficient as of December 2017,
19 bridges (29%) are included in the current SYIP, TIP, or a locality CIP
for replacement (Figure 24). Of these 19 bridges, construction on 6
bridges is currently underway or expected to begin in 2018, construction
on 8 bridges is expected to begin in 2019, 3 bridges are expected to start
construction in 2020, and the remaining 2 bridges are expected to start
construction in 2021. Another 13 bridges (20%) are included in the
SYIP, TIP, or a CIP for rehabilitation, and one bridge has funds allocated
for removal. Five of the bridges that do not have funding allocated are
no longer classified as structurally deficient as of January 2018, due to
the structurally deficient classification no longer including structural
condition and waterway adequacy ratings. The remaining 28
structurally deficient bridges (42%) in Hampton Roads have no funding
currently included in the SYIP, TIP, or a locality CIP.
FIGURE 24 – FUNDING FOR STRUCTURALLY DEFICIENT BRIDGES
IN HAMPTON ROADS
Source: HRTPO analysis of VDOT and FHWA data. Data for Hampton Roads bridges as of December 2017. Figure includes
those bridges in the current Six-Year Improvement Program (FY 2018-2023), Hampton Roads Transportation Improvement
Program (FY 18-21), and/or city Capital Improvement Plans/Programs.
HIGH RISE BRIDGE VDOT
Funding Included for Replacement
19 (29%)
Funding Included for
Removal 1 (1%)
Funding Included for Rehabilitation
13 (20%)
No Longer Classified SD
5 (8%)
No Funding Currently Included 28 (42%)

BRIDGE PROJECTS 48
James City/Williamsburg/York Transportation Study HAMPTON ROADS REGIONAL BRIDGE STUDY – 2018 UPDATE
Juris
Federal
Bridge # Facility Type Opening Date
CHES 29969 Beaver Dam Road over Drainage Ditch Replacement 2012
CHES 30096 Bells Mill Road over Mill Creek Replacement 2012
CHES 30273 Benefit Road over Drainage Ditch Replacement 2013
CHES 29532 Blackwater Road over Pocaty Creek Replacement 2010
CHES 30266 Campostella Road over Trib Deep Creek Replacement 2012
CHES 30272 Cedar Road over Trib Bells Mill Creek Replacement 2013
CHES 30280 Copper Knoll Lane over Trib C&A Canal Replacement 2013
CHES 30271 Deep Creek Blvd over Drainage Ditch Replacement 2013
28792 Dominion Blvd NB over Cedar Road New 2016
28793 Dominion Blvd SB over Cedar Road New 2016
28794 Veterans (Steel) Bridge NB Replacement 2014
26479 Veterans (Steel) Bridge SB Replacement 2016
28796 Dominion Blvd NB over Bainbridge Blvd New 2014
28795 Dominion Blvd SB over Bainbridge Blvd New 2015
30685 Dominion Blvd over Mains Creek Culvert Replacement 2013
28798 Dominion Blvd NB over Great Bridge Blvd New 2016
28797 Dominion Blvd SB over Great Bridge Blvd New 2016
28799 Ramp K over Ramp L New 2015
CHES 30367 Fentress Airfield Road over Pocaty Creek Replacement 2014
CHES 29531 George Washington Hwy over Deep Creek Replacement 2011
CHES 27144 Gilmerton Bridge Replacement 2013
CHES 30093 Lake Drummond Causeway over Lead Ditch Replacement 2012
CHES 29509 Lake Shore Drive over Trib of Goose Creek Replacement 2011
CHES/VB 1826 Mount Pleasant Rd/North Landing Rd over C&A Canal Rehabilitation 2014
CHES 30267 Old Mill Road over Deep Creek Replacement 2013
CHES - South Norfolk Jordan Bridge Replacement 2012
CHES 30281 Station Road over Trib Drum Point Creek Replacement 2013
CHES 29508 Willow Lake Road over Trib of Goose Creek Replacement 2011
GLO 29427 Burkes Pond Road (Rte 602) over Burkes Pond Replacement 2015
GLO 30573 Cunningham Lane (Rte 627) over Wilson Creek Replacement 2017
GLO 8533 Dutton Road (Rte 198) over Harpers Creek Rehabilitation 2016
GLO 27069 Main Street SB over Fox Mill Run Replacement 2012
GLO 8538 Old Pinetta Road (Rte 610) over Coffee Creek Rehabilitation 2013
HAM 20294 Bridge St over Salters Creek Replacement 2017
HAM 27473 Commander Shepard Blvd over Magruder Blvd Replacement 2011
IW 29863 Carrsville Highway (Bus Rte 58) over Route 632 & CSX R/R Replacement 2017
IW 10421 Collosse Road (Rte 641) over Corrowaugh Swamp Rehabilitation 2017
IW 10414 Jones Town Drive (Rte 637) Bridge over Rattlesnake Swamp Rehabilitation 2016
IW 10409 Lawrence Drive (Rte 630) over Stream Rehabilitation 2016
CHES Dominion Blvd Corridor Project
FIGURE 25 – BRIDGES CONSTRUCTED, REPLACED, OR REHABILITATED IN HAMPTON ROADS, 2010-2017
Source: HRTPO analysis of VDOT and locality data. Includes all bridges complete by the end of 2017.

BRIDGE PROJECTS 49
James City/Williamsburg/York Transportation Study HAMPTON ROADS REGIONAL BRIDGE STUDY – 2018 UPDATE
Juris
Federal
Bridge # Facility Type Opening Date
IW 29858 Longview Drive (Rte 602) over Pagan Creek Replacement 2015
IW 29859 Mill Swamp Road (Rte 621) over Passenger Swamp Replacement 2016
IW 29856 Orbit Road (Rte 637) over Nuby Run Replacement 2014
IW 30284 Stallings Creek Rd (Rte 680) over Stallings Creek Replacement 2016
IW 29488 Whippingham Pkwy (Rte 662) over Ragged Island Creek Replacement 2017
NN 20658 Chestnut Avenue over Newmarket Creek Rehabilitation 2016
NN 30415 Fort Eustis Blvd over CSX Railroad Replacement 2015
NN 30979 Freedom Way over Deep Creek New 2017
NN 30990 Gwynn Circle over Lucas Creek Replacement 2017
30639 I-64 EB over Industrial Park Dr Replacement 2017
30640 I-64 WB over Industrial Park Dr Replacement 2017
- I-64 EB over Fort Eustis Blvd Replacement 2017
NN - I-64 WB over Fort Eustis Blvd Replacement 2017
NN 29266 Middle Ground Blvd over CSX Railroad New 2014
NN 20659 Washington Avenue over NNS Railroad Replacement 2017
NOR 30075 Granby Street over Mason Creek Rehabilitation 2012
NOR 30488 Kimball Terrace over Ohio Creek Replacement 2014
NOR 20934 Little Creek Rd over Tidewater Dr Rehabilitation 2014
NOR 20777 North Shore Rd over Branch of Lafayette River Rehabilitation 2015
NOR 20778 North Shore Rd over Branch of Lafayette River Rehabilitation 2015
NOR - R/R over Hampton Boulevard at NIT North Entrance New 2015
21233 I-264 over Des Moines Ave Rehabilitation 2016
21224 I-264 over N&P Belt Line R/R Rehabilitation 2016
30133 MLK Expressway - Mainline New 2016
30134 MLK Expressway - Ramp N New 2016
30135 MLK Expressway - Ramp S New 2016
30136 MLK Expressway - Ramp EN New 2016
30137 MLK Expressway - Ramp EN New 2016
30138 MLK Expressway - Ramp WN New 2016
30139 MLK Expressway - Ramp SW New 2016
SH 17854 Cross Keys Road (Rte 665) over Deal Swamp Rehabilitation 2013
SH 17812 Indian Branch Lane (Rte 634) over Indian Branch Rehabilitation 2016
SH 17793 Ivor Road (Rte 616) over Seacock Swamp Replacement 2016
SH 17809 Mission Church Road (Rte 631) over Black Creek Rehabilitation 2017
SH 30763 Old Place Road (Rte 657) over Tarrara Creek Rehabilitation 2015
SH 17773 Popes Station Road (Rte 609) over Branch Rehabilitation 2013
SH 17779 Rivers Mill Road (Rte 612) over Rivers Mill Rehabilitation 2012
SH 29358 Rose Valley Road (Rte 688) over Branch Replacement 2010
NN
PORT Midtown Tunnel/Downtown Tunnel/MLK Fwy Project
I-64 Widening Project
FIGURE 25 (CONTINUED) – BRIDGES CONSTRUCTED, REPLACED, OR REHABILITATED IN HAMPTON ROADS, 2010-2017
Source: HRTPO analysis of VDOT and locality data. Includes all bridges complete by the end of 2017.

BRIDGE PROJECTS 50
James City/Williamsburg/York Transportation Study HAMPTON ROADS REGIONAL BRIDGE STUDY – 2018 UPDATE
Juris
Federal
Bridge # Facility Type Opening Date
SH 29902 Route 35 over Nottoway River Replacement 2015
SH 29862 Route 35 over Tarrara Creek Replacement 2017
SH 17782 Seacock Chapel Road (Rte 614) over Branch Rehabilitation 2015
SH 30444 Vicks Millpond Rd (Rte 659) over Flat Swamp Replacement 2016
SUF 30826 Arthur Drive over Spivey Swamp Replacement 2017
SUF 30827 Arthur Drive over Langston Swamp Replacement 2017
SUF 29441 Corinth Chapel Road over March Swamp Replacement 2010
SUF 30571 Robbie Road over Mill Swamp Replacement 2015
SUF 30980 Wilroy Road over Magnolia Creek Replacement 2017
SUR 29857 Loafers Oak Rd (Rte 630) over Cypress Swamp Replacement 2014
VB 29370 Constitution Drive over Thalia Creek New 2010
VB 30676 Crags Causeway over Mill Dam Creek Replacement 2015
VB 29367 Diamond Springs Road SB over Waterworks Canal Replacement 2010
VB 22230 I-264 over London Bridge Creek Rehabilitation 2012
VB 29394 Kempsville Road over Fox Run Replacement 2014
VB 30155 Lesner Bridge (WB Lanes) Replacement 2016
VB 30128 Lynnhaven Parkway over Charlestown Lakes Canal New 2016
VB 29369 Lynnhaven Parkway over Drainage Canal Replacement 2010
VB 28706 Lynnhaven Parkway over London Bridge Creek Replacement 2010
VB 30326 Lynnhaven Parkway over Stream New 2016
VB 27513 Nimmo Parkway over Hunt Club Tributary New 2014
VB 27067 Nimmo Parkway over West Neck Creek New 2014
VB 30052 Pinewood Road over Little Neck Creek Replacement 2013
VB 30816 Providence Road over Cedar Hill Canal Replacement 2016
YC 27508 George Washington Highway over Poquoson River Replacement 2015
FIGURE 25 (CONTINUED) – BRIDGES CONSTRUCTED, REPLACED, OR REHABILITATED IN HAMPTON ROADS, 2010-2017
Source: HRTPO analysis of VDOT and locality data. Includes all bridges complete by the end of 2017.

BRIDGE PROJECTS 51
James City/Williamsburg/York Transportation Study HAMPTON ROADS REGIONAL BRIDGE STUDY – 2018 UPDATE
FIGURE 26 – CURRENT AND UPCOMING BRIDGE PROJECTS IN HAMPTON ROADS
Source: HRTPO analysis of VDOT, HRTPO, and locality data. Figure includes those bridges in the current Six-Year Improvement Program (FY 2018-2023), Hampton Roads Transportation Improvement Program (FY 18-21), and/or city Capital Improvement
Plans/Programs. * - This UPC includes 3 bridge rehabilitation projects in the Fredericksburg District. Only Structure #8548 is in Gloucester County. ** - This UPC also includes widening roadway and removing frontage roads from west of First Colonial Road to Birdneck
Road. *** - Original bridges were classified as SD before replacement project began.
Funding sources: CIP – Locality Capital Improvement Plan/Program DGP – District Grant Program RSTP – Regional Surface Transportation Program USACE – U.S. Army Corps of Engineers
CN – Legacy Bridge Construction Funds Revenue Sharing – 50% VDOT/50% Locality funds SGR – State of Good Repair Program
Juris
Federal
Bridge # Facility Type
SD/
FO
UPC
Code
Construction
Start|End
Estimated
Project Cost
Allocations
Prior to FY
2018
FY 2018 -
FY 2023
Allocations
Remaining
Allocations
Required Funding Sources
CHES 21879 22nd Street Overpass Replacement SD 108665 2019|2021 $18,349,000 $18,349,000 - - CIP & Revenue Sharing
CHES 21797 Centerville Turnpike Bridge Rehabilitation SD 107350 2018|2018 $8,872,000 $5,520,000 $1,686,000 $1,666,000 SGR
CHES 1818 Deep Creek Bridge Replacement FO 109382 2020|2022 $48,468,000 $28,468,000 $20,000,000 - DGP & USACE
CHES 21830 Sunray Overpass Rehabilitation SD 111220 Underway|2019 $3,187,000 $1,500,000 $1,412,000 $275,000 SGR
CHES 21827 Triple Decker Bridge - Upper Level Rehabilitation SD 111002 2019|2020 $5,110,000 $50,000 $5,060,000 - SGR
CHES 21937 Triple Decker Bridge - Lower Level Rehabilitation SD 111032 2019|2020 $2,672,000 - $2,216,000 $456,000 SGR
CHES 21810 Fentress Airfield Rd over Pocaty Creek Rehabilitation FO
CHES 21935 Indian River Road over Indian River Rehabilitation -
CHES 21816 Number Ten Lane over Lindsey Drainage Canal Rehabilitation SD
CHES 25566 Route 168 Bypass over Battlefield Boulevard Rehabilitation FO
GLO 8552 Almondsville Rd (Rte 662) over Fox Creek Replacement *** 98807 Complete (2018) $2,470,000 $1,454,000 $1,016,000 - SGR
GLO 8548 Tidemill Rd over Northwest Br Sarah Creek Rehabilitation SD 110109* 2018|2020 $1,500,000 $1,000,000 $500,000 - SGR
HAM/YC 19855/19856 Route 134 over Brick Kiln Creek Replacement FO 105222 2019|2021 $7,013,000 $2,089,000 $4,925,000 - Legacy CN and Specialized Federal
IW 10416 Orbit Rd (Rte 637) over Carbell Swamp Rehabilitation SD
IW 22615 South Church Street (Bus Rte 258) over Cypress Creek Rehabilitation SD 111338 2020|2021 $1,600,000 - $1,600,000 - SGR
IW 10445 Uzzell Church Road (Rte 692) over Champion Swamp Replacement SD 111339 2021|2022 $1,250,000 - $1,250,000 - SGR
JCC 24057 Glass House Ferry at James River Rehabilitation SD
JCC 10516 Hicks Island Rd (Rte 601) over Diascund Creek Replacement FO 98823 2021|2022 $3,259,000 $524,000 $2,734,000 - Legacy CN
JCC - Skiffes Creek Connector New N/A 100200 2021|2024 $50,504,000 $10,000,000 $42,048,000 - DGP & RSTP
NN 25086 20th Street over Salters Creek Rehabilitation - - Underway|2018 $70,500 CIP only
NN 20727 Denbigh Blvd over I-64/CSX Railroad Replacement SD 93077 2018|2023 $32,500,000 $5,740,000 $26,760,000 - Both SGR and Legacy CN
NN 20720 Fort Eustis Blvd over Newport News Reservoir Replacement SD 105624 2019|2021 $23,100,000 $4,100,000 $2,100,000 $16,900,000 SGR
NN 20661 Huntington Avenue over NNS Railroad Replacement FO 94832 2018|2019 $5,956,000 $5,956,000 - - Revenue Sharing
NN 20731 J. Clyde Morris Boulevard NB Bridge over CSX Railway Rehabilitation FO - 2018|2019 $241,000 - $241,000 - CIP only
NN 20679 Warwick Blvd over Lake Maury Replacement SD 101279 Underway|2018 $8,863,000 $7,623,000 $1,240,000 - DGP, Revenue Sharing, and Other
NOR 20936 Campostella Avenue over Eastern Branch Elizabeth River Rehabilitation - 107039 2021|2022 $6,000,000 - $6,000,000 - RSTP
NOR 21040 Granby Street over Lafayette River Rehabilitation - 109568 2018|2019 $3,500,000 $3,500,000 - - RSTP and others
NOR 20811 Ocean View Ave EB over Tidewater Drive Removal SD 108729 2018|2019 $2,540,000 $2,476,000 - $64,000 Revenue Sharing
PORT 21199 High St over Western Branch Elizabeth River Replacement (P) SD 102715 Underway|2019 $35,500,000 $28,793,000 $6,707,000 - Legacy CN and Revenue Sharing
SH 17901 Burnt Reed Rd (Rte 743) over Tarrara Creek Rehabilitation SD
SH 17865 General Thomas Hwy (Rte 671) over Nottoway River Replacement SD 108976 2019|2020 $7,000,000 - $7,000,000 - SGR
SH 17864/17866 General Thomas Hwy (Rte 671) over Nottoway River Replacement FO 101495 2019|2021 $15,725,000 $1,331,000 $7,459,000 $6,935,000 Legacy CN
SH - Route 58 Business over Route 58 east of Courtland New N/A 17728 Underway|2018 $26,402,000 $10,672,000 $15,730,000 - Various
To be funded and scheduled under Maintenance and Repair Contract
To be funded and scheduled under Maintenance and Repair Contract
To be funded and scheduled under Maintenance and Repair Contract
- CIP only, grouped project- $2,960,000 $460,000 $2,500,000Various|2022

BRIDGE PROJECTS 52
James City/Williamsburg/York Transportation Study HAMPTON ROADS REGIONAL BRIDGE STUDY – 2018 UPDATE
Juris
Federal
Bridge # Facility Type
SD/
FO
UPC
Code
Construction
Start|End
Estimated
Project Cost
Allocations
Prior to FY
2018
FY 2018 -
FY 2023
Allocations
Remaining
Allocations
Required Funding Sources
SH 17757 Three Creek Rd (Rte 308) over Three Creek Replacement SD 104965 2018|2019 $3,872,000 $3,872,000 - - SGR
SH 17813 Tucker Swamp Rd (Rte 635) over N/S Railroad Replacement SD 93078 Underway|2019 $3,607,000 $1,954,000 $1,653,000 - SGR
SUF/SH 17755 South Quay Road (Rte 189) over Blackwater River Replacement SD 98813 2020|2022 $25,077,000 $2,633,000 $22,445,000 - SGR
SUF 22154 Badger Road over Washington Ditch Rehabilitation SD 111043 2019|2019 $575,000 - $414,000 $161,000 SGR
SUF 22027 Carolina Road over Cypress Swamp Replacement SD 111033 2019|2023 $2,706,000 - $1,989,000 $717,000 SGR
SUF 22121 Lake Cahoon Road over CSX Railroad Rehabilitation SD 111042 2019|2023 $3,440,000 - $2,838,000 $602,000 SGR
SUF 22137 Longstreet Lane over Somerton Creek Replacement SD 111040 2020|2023 $2,590,000 - $1,981,000 $609,000 SGR
SUF 22111 Mineral Springs Road over Jones Swamp Replacement SD 111039 2019|2019 $1,815,000 - $1,398,000 $418,000 SGR
SUF 22091 Nansemond Pkwy over Beamons Mill Pond Replacement SD 111037 2019|2022 $1,121,000 $239,000 $641,000 $241,000 SGR
SUF 22107 Simons Drive over Cohoon Creek Replacement SD 111041 2019|2019 $641,000 - $470,000 $170,000 SGR
SUF 22138 Southwestern Blvd over Chapel Swamp Rehabilitation SD 111044 2019|2019 $567,000 - $408,000 $159,000 SGR
SUF 22159 Turlington Road over Kilby Creek Spillway Replacement SD 108984 2020|2023 $1,350,000 - $2,128,000 - SGR & RSTP
SUF 22088 E. Washington Street over Jericho Canal Replacement SD 111038 2019|2022 $621,000 - $480,000 $141,000 SGR
SUR 18185 Route 40 over Otterdam Swamp Replacement SD 111342 2021|2022 $1,715,000 - $1,715,000 - SGR
VB 22252 Laskin Road over Linkhorn Bay Replacement SD 12546** 2018|2021 $21,160,000 $21,160,000 - - Various
VB 30155 Lesner Bridge WB Replacement ***
VB 22264 Lesner Bridge EB Replacement ***
VB 22183 Sandbridge Road over Hells Point Creek Replacement FO - 2018|2020 $8,043,000 $1,250,000 $6,793,000 - CIP only
Various97737 $98,400,000 $73,224,000 $25,176,000 -Underway|2018
FIGURE 26 (CONTINUED) – CURRENT AND UPCOMING BRIDGE PROJECTS IN HAMPTON ROADS
Source: HRTPO analysis of VDOT, HRTPO, and locality data. Figure includes those bridges in the current Six-Year Improvement Program (FY 2018-2023), Hampton Roads Transportation Improvement Program (FY 18-21), and/or city Capital Improvement
Plans/Programs. * - This UPC includes 3 bridge rehabilitation projects in the Fredericksburg District. Only Structure #8548 is in Gloucester County. ** - This UPC also includes widening roadway and removing frontage roads from west of First Colonial Road to Birdneck
Road. *** - Original bridges were classified as SD before replacement project began.
Funding sources: CIP – Locality Capital Improvement Plan/Program DGP – District Grant Program RSTP – Regional Surface Transportation Program USACE – U.S. Army Corps of Engineers
CN – Legacy Bridge Construction Funds Revenue Sharing – 50% VDOT/50% Locality funds SGR – State of Good Repair Program

COST OF MAINTAINING BRIDGES 53
HAMPTON ROADS REGIONAL BRIDGE STUDY – 2018 UPDATE
COST OF MAINTAINING BRIDGES
There are 1,261 bridges in Hampton Roads, but only 80 bridges in the
region were replaced or had major rehabilitation projects between 2010
and 2017. As structures continue to age – the median age for bridges in
Hampton Roads is currently 39 years – allocating adequate funding to
maintain these structures will continue to be difficult.
Regional long term transportation planning is conducted by the
HRTPO. The Hampton Roads Long-Range Transportation Plan (LRTP)
is a comprehensive and multimodal transportation blueprint that
identifies and plans for critically important transportation
improvements that impact the region’s economic vitality and quality of
life. LRTPs must be fiscally-constrained, which means that the cost of
all of the projects included in the plan cannot exceed the funding that is
reasonably expected to be available over the horizon period.
The current 2040 Hampton Roads Long-Range Transportation Plan was
approved and adopted by the HRTPO Board in July 2016. HRTPO staff
has started working on the 2045 LRTP, which will be approved by the
HRTPO Board by July 2021.
Although the LRTP largely focuses on new roadway construction and
fixed guideway transit improvements, funding for roadway
maintenance needs is also included in the fiscal constraint analysis. In
the 2040 Hampton Roads LRTP, it is anticipated that the region will
receive approximately $12 billion in funding for maintenance between
2016 and 2040.
In the 2012 Regional Bridge Study, HRTPO Staff estimated the cost of
sustaining existing bridge connections throughout the time horizon of
the 2040 Hampton Roads LRTP. Based on the analysis done for the
study, HRTPO staff determined that it would cost nearly $8 billion over
the time period from 2016-2040 to sustain existing bridge connections in
Hampton Roads. This $8 billion exceeded the $7.3 billion cost of all of
the construction projects that were included in the 2034 Hampton Roads
Long-Range Transportation Plan.
On a statewide level, VDOT annually prepares an analysis of the
anticipated statewide bridge monetary needs and projected funding
levels available. As part of this analysis, VDOT makes assumptions on
what the typical age of a bridge will be when it will need to be replaced.
According to VDOT, bridges built prior to 2007 have a 50-year design
service life, and as part of their analysis makes the assumption that they
will need to be replaced on average at 70 years old. Since 2007, bridges
have been designed and built using new standards and construction
materials, which have resulted in an increase in the anticipated design
service life from 50 years up to 75 years.

COST OF MAINTAINING BRIDGES 54
HAMPTON ROADS REGIONAL BRIDGE STUDY – 2018 UPDATE
According to VDOT’s most recent analysis, if the Commonwealth
replaced all of its bridges that have a 50-year design service life as they
reached 70 years old, the cost over a 35-year period (2016-2050) would
be $45 billion. However, based on current funding levels and
mechanisms, VDOT estimates that only $13 billion will be available in
combined maintenance and construction funds to address bridges
during this time horizon (Figure 27). Most of the funding will be
needed in later years as shown in Figure 28, since the number of bridges
that will reach 70 years old statewide will escalate starting around 2027.
In spite of these needs, VDOT has only allocated $1.4 billion for bridges
in the State of Good Repair and legacy bridge programs between Fiscal
Years 2017 and 2022. Because of these funding constraints, VDOT uses
a proactive approach in order to ensure bridges can remain in service
for an optimal period of time before requiring replacement and
achieving the most value for the funds that are invested in bridges. This
approach includes:
Exceeding FHWA requirements in its bridge inspection
program.
Cost-effectively prioritizing the rehabilitation and replacement
of structures through the State of Good Repair program.
Instituting a bridge maintenance program that balances
preserving, repairing, and rehabilitating structures.
Funding a proactive research program that allows for early
implementation of innovative techniques.
Allowing decisions to be made at the local and district level
through its organizational structure.
Using performance measures and targets, and reporting
measures on a quarterly basis.
$13
$45
$0
$5
$10
$15
$20
$25
$30
$35
$40
$45
$50
Available Needed
Tota
l Rep
lace
men
t C
ost
($ B
illion
s)
35 Year Funding Outlook to Replace Bridges at Age 70
FIGURE 28 – STATEWIDE ANNUAL REPLACEMENT COSTS TO
REPLACE BRIDGES AT AGE 70, 2016-2050 Source: VDOT
FIGURE 27 – STATEWIDE 35 YEAR FUNDING OUTLOOK TO
REPLACE ALL BRIDGES AT AGE 70, 2016-2050
Source: VDOT

COST OF MAINTAINING BRIDGES 55
HAMPTON ROADS REGIONAL BRIDGE STUDY – 2018 UPDATE
It is important to note that it is generally more cost-efficient to
rehabilitate bridges on a timely basis than waiting and having to
allocate more funds for a full replacement at a later date. However,
rehabilitating bridges on a timely basis is largely dependent on the
availability of adequate funding. Bridges deteriorate over a period of
decades (rather than months or years), so the impacts of funding
deficiencies on the condition of bridges is usually not evident in the
short term. If funding for bridge maintenance is not increased over the
long-term, a degradation of the condition of bridges throughout
Hampton Roads and the state is likely.
The condition of bridges and bridge maintenance needs will likely be
even more of an issue in Hampton Roads over the next few decades
than the statewide figures indicate. Among the bridges that currently
exist in Hampton Roads, the decade with the most bridges built is the
1960s (Figure 29). This was the decade when many of the Interstates in
the region were constructed, and 132 of the 246 bridges built throughout
the region in the 1960s are on the Interstate system.
Of the 1,261 structures in the region, 392 (31%) are 50 years old or older
as of December 2017, which means that they have exceeded their
anticipated design service life (Figure 30). Using VDOT’s 70-year
0
50
100
150
200
250
300
Pre-1950 1950 -1959
1960 -1969
1970 -1979
1980 -1989
1990 -1999
2000 -2009
2010+
Bri
dg
es
by Y
ea
r B
uilt
Bridges by Year Built
FIGURE 29 – BRIDGES IN HAMPTON ROADS BY YEAR BUILT Source: HRTPO analysis of VDOT and FHWA data. Data for Hampton Roads bridges as of December 2017.
0
50
100
150
200
250
0-9 10-19 20-29 30-39 40-49 50-59 60-69 70+
Bri
dg
es
by A
ge (
as
of
12/2
017
)
Bridges by Age
FIGURE 30 – BRIDGES IN HAMPTON ROADS BY AGE Source: HRTPO analysis of VDOT and FHWA data. Data for Hampton Roads bridges as of December 2017.
FIRST COLONIAL AT I-264 GOOGLE

COST OF MAINTAINING BRIDGES 56
HAMPTON ROADS REGIONAL BRIDGE STUDY – 2018 UPDATE
threshold for their replacement needs analysis, 100 bridges in Hampton
Roads (7.9%) are 70 years old or older as of December 2017. By
comparison, 16.9% of the bridges statewide are 70 years old or older as
of December 2017, which is more than double the Hampton Roads rate.
The number of bridges in Hampton Roads that will be 70 years old or
older is expected to grow exponentially in future years. If none of the
existing bridges are replaced between now and 2045 (the horizon of the
upcoming Hampton Roads LRTP), 600 bridges in Hampton Roads will
be 70 years old or older by 2045 (Figure 31). This is nearly half (48%) of
the 1,261 bridges that currently exist in the region. Statewide, 7,502 NBI
bridges will be 70 years old or older by 2045 if none of the existing
bridges are replaced, which is 55% of the bridges that currently exist
statewide (Figure 32).
Although the statewide rate of 70+ year old bridges is expected to
remain higher than the rate in Hampton Roads, the difference between
the regional and statewide rate will narrow from the current rate. As of
2017, 4.4% of the bridges statewide that are 70 years old or older are in
the Hampton Roads area. By 2045, this percentage is expected to
increase to 8.0% of the existing bridges statewide.
In order to determine the cost of maintaining bridges in Hampton
Roads through 2045, HRTPO staff used a methodology that is similar to
the one used by VDOT. For the analysis, HRTPO staff assumed that
bridges would need to be replaced at an age of 70 years. Also similar to
the statewide analysis, the replacement cost for those bridges that are
currently 70+ years old and/or currently classified as structurally
deficient are also divided up over the next 25 years.
The bridge replacement costs used in this analysis are based on the
Statewide Planning Level Cost Estimates provided by VDOT’s
Transportation and Mobility Planning Division (TMPD). TMPD
provides unit cost estimates for many types of improvements, including
0
100
200
300
400
500
600
700
Bri
dg
es
-A
ge 7
0+
Bridges by Age (70+)
FIGURE 31 – BRIDGES IN HAMPTON ROADS AGE 70+ Source: HRTPO analysis of VDOT and FHWA data.
0
2,500
5,000
7,500
10,000
12,500
15,000
17,500
20,000
0
100
200
300
400
500
600
700
800
900
1,000
Vir
gin
ia B
rid
ges
-A
ge 7
0+
Ha
mp
ton
Roa
ds
Bri
dg
es
-A
ge 7
0+
Hampton Roads
Virginia
FIGURE 32 – BRIDGES IN HAMPTON ROADS AND STATEWIDE
AGE 70+ Source: HRTPO analysis of VDOT and FHWA data.

COST OF MAINTAINING BRIDGES 57
HAMPTON ROADS REGIONAL BRIDGE STUDY – 2018 UPDATE
bridges. The most recent bridge replacement unit costs (2015) for
Hampton Roads are broken down as follows:
Bridges less than 3,000 square feet - $300 ft2 - $500 ft2
Bridges between 3,000 square feet and 12,500 square feet - $240
ft2 - $330 ft2
Bridges greater than 12,500 square feet - $180 ft2 - $250 ft2
The averages of these values were used in this analysis: $400 for bridges
less than 3,000 ft2, $285 for bridges between 3,000 ft2 and 12,500 ft2, and
$215 for bridges greater than 12,500 ft2. These average unit costs were
then inflated by 3% annually to advance from 2015 to the year that the
bridge would need to be replaced, which is assumed to occur at 70 years
old. This 3% inflation rate is used by VDOT in their planning level cost
estimates as well as by HRTPO in their long-range transportation
planning efforts.
Based on these assumptions, HRTPO staff calculated that $4.5 billion
would be necessary to fund the maintenance of bridges in Hampton
Roads through 2045. As shown in Figure 33, most of these funds – over
$3.5 billion – will be needed in 2034 and later years.
It must be noted that this is assumed to be a “worst-case” scenario,
where bridges are replaced rather than rehabilitated in a timely manner
due to funding limitations. It is expected that this $4.5 billion number
would be lower if timely maintenance extends the service life of older
bridges. It also does not take into account bridges that may have
already had major rehabilitations to extend their useful life beyond the
50 and 70 year-thresholds used in this analysis.
Many of these bridges in Hampton Roads that will need to be
maintained, however, are outside the purview of HRTPO’s Long-Range
Transportation Plan. These bridges include:
Bridges outside of the Metropolitan Planning Area (MPA) -
The bridge analysis in this study uses the Hampton Roads
Planning District Commission (HRPDC) boundary to represent
“Hampton Roads” as noted on page 5. The Hampton Roads
Long-Range Transportation Plan, however, only reflects
projects within the Hampton Roads MPA. The Hampton
Roads MPA does not include Surry County, the majority of
Franklin and Southampton County, and the northern portion of
Gloucester County. Of the 1,261 bridges analyzed in this study,
174 bridges are outside of the MPA.
Private bridges – There are 40 bridges in Hampton Roads that
are either privately maintained or maintained by state
commissions. These bridges include the South Norfolk Jordan
Bridge, the Chesapeake Bay Bridge-Tunnel, and bridges
$0
$200
$400
$600
$800
$1,000
$1,200
An
nu
al B
rid
ge R
ep
lace
men
t N
eed
s (i
n $
Mil
lion
s)
Existing SD AND 70+ Bridges
Annual Needs as Bridges Turn 70
FIGURE 33 – REGIONAL ANNUAL BRIDGE REPLACEMENT NEEDS, 2018-2045
Source: HRTPO analysis of VDOT and FHWA data. Costs reflect year of expenditure. The replacement cost for those
bridges that are currently 70+ years old and/or are currently classified as structurally deficient are divided up over 25
years (2018-2042).

COST OF MAINTAINING BRIDGES 58
HAMPTON ROADS REGIONAL BRIDGE STUDY – 2018 UPDATE
approaching the Midtown and Downtown Tunnels maintained
by Elizabeth River Crossings. These 40 bridges are largely
maintained through funding streams that are not included in
the regional LRTP.
Federally-maintained bridges – There are 33 bridges in
Hampton Roads that are federally maintained. These bridges
include the Jamestown Tour Road, Yorktown Tour Road, and
most of the bridges on the Colonial Parkway. Two bridges
over the Intracoastal Waterway – the Deep Creek Bridge and
the North Landing Bridge – are also federally-maintained.
Maintenance for federal roadways and bridges is largely not
included in the maintenance needs reflected by the regional
LRTP, although there are some exceptions such as the
upcoming replacement and widening of the Deep Creek
Bridge.
Combined, these three exceptions comprise 247 of the 1,261 bridges
analyzed in this study. Removing these 247 bridges from the analysis,
the funding that would be necessary to maintain bridges through 2045
that are within the purview of the HRTPO Long-Range Transportation
Plan is $3.4 billion (Figure 34). This is 28% of the approximately $12
billion in funding for maintenance provided in the 2040 Hampton
Roads LRTP.
Outside MPA, $151,139,743
Private, $907,085,596
Federal, $78,231,981
TOTAL NEEDS
All Others,$3,362,351,447
FIGURE 34 – HAMPTON ROADS LRTP BRIDGE REPLACEMENT NEEDS,
2018-2045 Source: HRTPO analysis of VDOT and FHWA data. Costs reflect year of expenditure. Private bridges include those
maintained by private sources and state commissions. The replacement cost for those bridges that are currently 70+ years
old and/or are currently classified as structurally deficient are divided up over 25 years (2018-2042).

CONCLUSIONS 59
HAMPTON ROADS REGIONAL BRIDGE STUDY – 2018 UPDATE
CONCLUSIONS
Because of the importance of bridges to the regional transportation
system and concerns about the condition and funding of bridges,
the Hampton Roads Transportation Planning Organization
prepared this update to the Regional Bridge Study. The following
conclusions are made concerning bridges in Hampton Roads
based on the analyses included in this study:
Hampton Roads has 1,261 bridges (based on the NBI definition
of a bridge used in this study), which is lower than the number
in other comparable metropolitan areas. Among the 37
metropolitan areas in the United States with populations
between one and three million people, Hampton Roads ranks
26th highest in terms of the number of bridges.
Hampton Roads, however, does have longer bridges than most
other areas, with the 2nd longest average bridge length among the 37
comparable metropolitan areas and the 8th highest total bridge area.
The median age of bridges in Hampton Roads is 39 years as of
December 2017. This is typical to other metropolitan areas, ranking
23rd highest among the 37 comparable metropolitan areas.
The number of bridges in Hampton Roads that are classified as
structurally deficient is decreasing. There are 66 bridges in Hampton
Roads that are classified as structurally deficient as of December
2017, down from 77 bridges in August 2012.
The percentage of structurally deficient bridges in Hampton Roads
(5.2%) is lower than in many other comparable areas. Hampton
Roads ranks only 24th highest among the 37 metropolitan areas with
populations between one and three million people in terms of the
percentage of bridges that are classified as structurally deficient.
The number of bridges in Hampton Roads classified as functionally
obsolete is also decreasing. There are 261 bridges (20.7%) classified
as functionally obsolete in the region as of December 2017. This is
down from 379 bridges as of August 2012.
Weight limits are posted on 69 bridges in Hampton Roads (5.5%) as
of December 2017. This number has decreased by 33 bridges since
August 2012. Hampton Roads has the 18th highest percentage of
bridges with posted weight limits among the 37 comparable
metropolitan areas.
There are 60 bridges that are classified as being in poor condition in
Hampton Roads as of December 2017 using the new federal bridge
performance measures. This comprises 4.8% of the total bridges in
the region, and 3.0% of the bridge deck area.
Looking only at bridges on the National Highway System (NHS),
only 1.2% of the bridges in Hampton Roads are classified in poor
condition. This compares to 2.9% of NHS bridges in Virginia and
3.5% in comparable metropolitan areas. Looking at NHS bridge
area, 2.2% is in poor condition in Hampton Roads, which is better
than the 3.4% statewide figure and 5.2% in comparable metropolitan
areas.
Since 2010, there have been 102 bridges throughout Hampton Roads
built, replaced, or that underwent a major rehabilitation. Of these
Component
Number in
Hampton
Roads
(Dec. 2017)
Change in
Number in
Hampton
Roads since
August 2012
Percentage of
Total Bridges
in Hampton
Roads
(Dec. 2017)
Rank Among 37
Metro Areas
with Populations
between 1 and 3
Million
Total Number of Bridges 1,261 +38 N/A 26th highest
Total Bridge Area 2,746,000 m2
+124,000 m2 N/A 8th highest
Median Bridge Age 39 years +2 years N/A 23rd highest
Structurally Deficient Bridges 66 -11 5.2% 24th highest
Functionally Obsolete Bridges 261 -118 20.7% N/A
Bridges with Posted Weight Limits 69 -33 5.5% 18th highest
Total Bridges in Poor Condition 60 N/A 4.8% 23rd highest
Total Bridge Area in Poor Condition 83,400 m2 N/A 3.0% 27th highest
NHS Bridges in Poor Condition 8 N/A 1.2% 30th highest
NHS Bridge Area in Poor Condition 4,680 m2 N/A 2.2% 26th highest
FIGURE 35 – SUMMARY OF HAMPTON ROADS BRIDGE CONDITIONS Source: HRTPO analysis of VDOT and FHWA data.
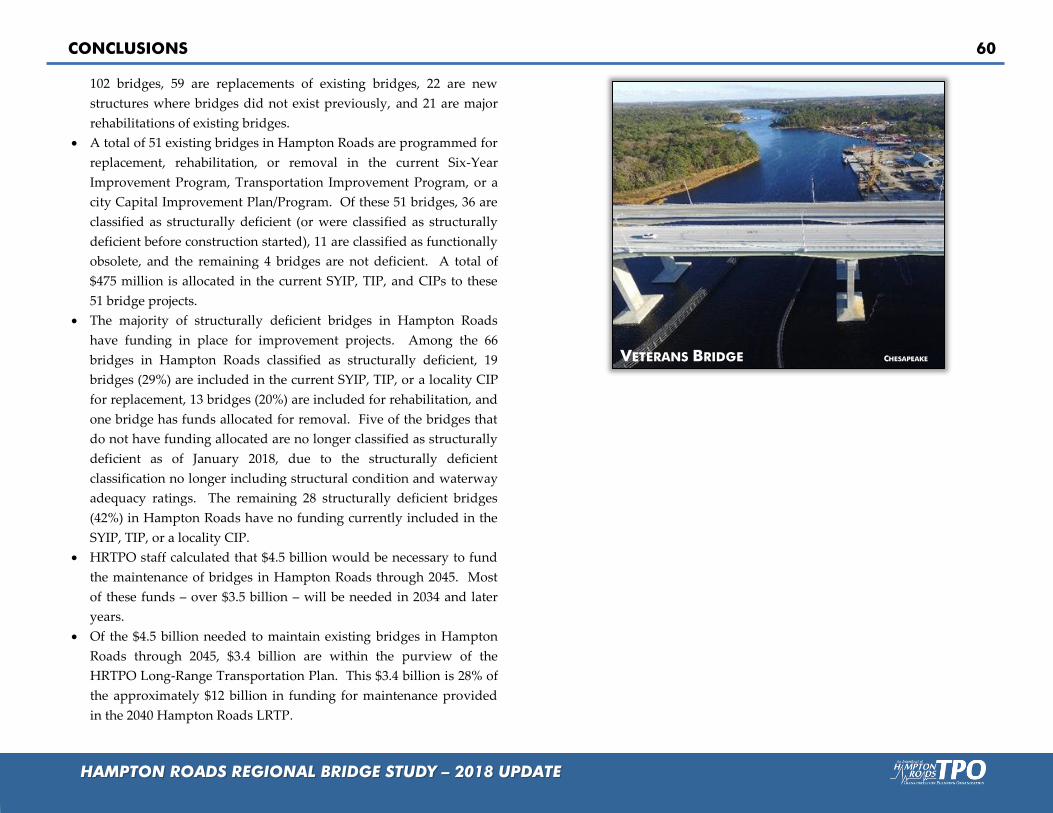
CONCLUSIONS 60
HAMPTON ROADS REGIONAL BRIDGE STUDY – 2018 UPDATE
102 bridges, 59 are replacements of existing bridges, 22 are new
structures where bridges did not exist previously, and 21 are major
rehabilitations of existing bridges.
A total of 51 existing bridges in Hampton Roads are programmed for
replacement, rehabilitation, or removal in the current Six-Year
Improvement Program, Transportation Improvement Program, or a
city Capital Improvement Plan/Program. Of these 51 bridges, 36 are
classified as structurally deficient (or were classified as structurally
deficient before construction started), 11 are classified as functionally
obsolete, and the remaining 4 bridges are not deficient. A total of
$475 million is allocated in the current SYIP, TIP, and CIPs to these
51 bridge projects.
The majority of structurally deficient bridges in Hampton Roads
have funding in place for improvement projects. Among the 66
bridges in Hampton Roads classified as structurally deficient, 19
bridges (29%) are included in the current SYIP, TIP, or a locality CIP
for replacement, 13 bridges (20%) are included for rehabilitation, and
one bridge has funds allocated for removal. Five of the bridges that
do not have funding allocated are no longer classified as structurally
deficient as of January 2018, due to the structurally deficient
classification no longer including structural condition and waterway
adequacy ratings. The remaining 28 structurally deficient bridges
(42%) in Hampton Roads have no funding currently included in the
SYIP, TIP, or a locality CIP.
HRTPO staff calculated that $4.5 billion would be necessary to fund
the maintenance of bridges in Hampton Roads through 2045. Most
of these funds – over $3.5 billion – will be needed in 2034 and later
years.
Of the $4.5 billion needed to maintain existing bridges in Hampton
Roads through 2045, $3.4 billion are within the purview of the
HRTPO Long-Range Transportation Plan. This $3.4 billion is 28% of
the approximately $12 billion in funding for maintenance provided
in the 2040 Hampton Roads LRTP.
VETERANS BRIDGE CHESAPEAKE

APPENDIX A 61
HAMPTON ROADS REGIONAL BRIDGE STUDY – 2018 UPDATE
GLOSSARY OF BRIDGE TERMS
Many terms are used throughout this study to describe various
components and aspects of bridges. This section includes a glossary of
selected terms used throughout this study.
Bridge – For the purposes of this study,
the definition of a bridge is similar to the
definition used for bridges in the National
Bridge Inventory. A bridge is defined as
any structure carrying a roadway open to
the general public with a length of more
than 20 feet. Bridges less than or equal to 20 feet in length are not
included in this report, nor are bridges on secure areas of military bases
and tunnels.
Culvert – A culvert is a smaller drainage
structure, such as a drain, pipe, or channel, which
allows water to pass under a roadway. Culverts
are included in this report if the opening is more
than 20 feet.
Deck – The portion of the
bridge that directly supports
motorized and pedestrian
traffic.
Fatigue – For bridges, fatigue is the weakening of a material (such as
steel) caused by repeatedly applied loads.
Fracture Critical – A fracture critical bridge is
a structure that is designed with few or no
redundant supporting elements. If a key
structural member fails in a fracture critical
bridge, the structure is in danger of collapsing.
Examples of fracture critical bridges include
most truss bridges and drawbridges.
Despite the lack of redundancy, fracture critical bridges are not
inherently unsafe. Fracture critical bridges undergo more frequent and
extensive inspections than non-fracture critical bridges, and inspectors
will close or impose limits on bridges that they feel are unsafe.
Functionally Obsolete – A functionally
obsolete bridge is a structure that was built to
standards that are no longer used today.
Functionally obsolete bridges are not
inherently unsafe; they are bridges that do not
have adequate lane widths, shoulder widths, or
vertical clearances to serve current traffic
volumes or meet current geometric standards.
Inventory Rating – The inventory rating is the load level that can safely
utilize an existing structure for an indefinite period of time. This is
based on the type of vehicle used in the rating.
Health Index – The Health Index is a measure of the physical condition
of a bridge, which provides a reliable ranking system for bridge
maintenance. The Health Index of a structure is calculated by dividing
the sum of this current dollar value of all the structure’s elements by the
sum of the total value of all the structure’s elements in new condition.
A Health Index of 100% indicates that all of the elements of the structure

APPENDIX A 62
HAMPTON ROADS REGIONAL BRIDGE STUDY – 2018 UPDATE
are in the best possible condition, while a Health Index of 0% indicates
that all of the elements are in the worst possible condition.
National Bridge Inspection Standards (NBIS) – Federal regulations
that establish the requirements for all facets of bridge inspections and
reporting.
National Bridge Inventory (NBI) – A database compiled by FHWA
containing bridge characteristics for all structures that meet the
previously shown definition of a bridge.
Operating Rating – The operating rating is the maximum permissible
load level that can safely utilize an existing structure. This is based on
the type of vehicle used in the rating.
Scour Critical – A scour critical bridge is a
structure that could fail or become structurally
unstable due to scouring, or the exposure of
portions of the bridge’s substructure due to
changes in the river bed.
Structurally Deficient – A structurally deficient bridge is a structure
with elements that need to be monitored and/or repaired. A
structurally deficient bridge is not necessarily unsafe; bridge inspectors
will close or impose limits on bridges they feel are unsafe.
Substructure – The parts of a
bridge, such as the piers,
abutments, piles, and footings,
which support the superstructure
of the bridge.
Superstructure – The structural
members of a bridge, such as the
beams and girders, which carry the
load from the deck to the
substructure.
Underclearances – The height and the
width of the underside of a bridge that
passes over a road and/or a railroad. The
underclearance rating evaluates the
adequacy of these heights and widths.
Waterway Adequacy – The ability of a
waterway under a bridge to handle
floodwaters, and the potential for these
floodwaters to overtop the bridge.

APPENDIX B 63
HAMPTON ROADS REGIONAL BRIDGE STUDY – 2018 UPDATE
BRIDGE COMPONENT RATING BASICS
Several components of each bridge are graded based on factors such as
the design of the bridge, the type of roadway carried by the bridge,
traffic volumes, and the observations of bridge inspectors. These rated
components include:
Deck, Superstructure, and Substructure Condition
Culvert Condition
Inventory Rating
Structural Evaluation
Deck Geometry
Underclearances
Waterway Adequacy
Approach Roadway Alignment
These general condition and appraisal ratings are used in a variety of
ways to determine the overall existing condition of the structure,
including determining if a bridge is classified as structurally deficient or
functionally obsolete. This appendix describes in detail how each of
these ratings are produced.

APPENDIX B 64
HAMPTON ROADS REGIONAL BRIDGE STUDY – 2018 UPDATE
DECK, SUPERSTRUCTURE, AND SUBSTRUCTURE GENERAL CONDITION
RATINGS
These items describe the overall condition of the bridge’s roadway
surface (bridge deck), the physical condition of all of the bridge’s
structural members such as beams and girders (superstructure), and the
physical condition of the piers, abutments, piles, fenders, and footings
(substructure).
The condition of the deck, superstructure, and substructure are rated
based on the descriptions listed to the right. If the structure is a culvert,
the general conditions will be rated as “N” for each of these three
components.
Condition
Rating
N
9
8
No problems noted.
7
Some minor problems.
6
Structural elements show some minor deterioration.
5
All primary structural elements are sound but may have some minor section loss,
cracking, spalling or scour.
4
Advanced section loss, deterioration, spalling or scour.
3Loss of section, deterioration, spalling or scour have seriously affected primary
structural components. Local failures are possible. Fatigue cracks in steel or shear
cracks in concrete may be present.
2
Advanced deterioration of primary structural elements. Fatigue cracks in steel or
shear cracks in concrete may be present or scour may have removed substructure
support. Unless closely monitored it may be necessary to close the bridge until
corrective action is taken.
1
Major deterioration or section loss present in critical structural components or
obvious vertical or horizontal movement affecting structure stability. Bridge is
closed to traffic but corrective action may put it back in light service.
0
Out of service - beyond corrective action.
Fair Condition
Poor Condition
Serious Condition
Critical Condition
"Imminent" Failure Condition
Failed Condition
Description
Not Applicable
Excellent Condition
Very Good Condition
Good Condition
Satisfactory Condition
GENERAL CONDITION RATINGS AND DESCRIPTIONS FOR DECKS, SUPERSTRUCTURES, AND SUBSTRUCTURES
DECK
SUBSTRUCTURE
SUPERSTRUCTURE
Source: FHWA.

APPENDIX B 65
HAMPTON ROADS REGIONAL BRIDGE STUDY – 2018 UPDATE
CULVERT GENERAL CONDITION RATINGS
The culvert general condition rating evaluates the alignment,
settlement, joints, structural condition, scour, and all other items
associated with culverts. The rating code is intended to be an overall
condition evaluation of the culvert. If the structure is not a culvert, this
general condition rating will be rated as “N”.
Condition
Rating
N
9
8
7
6
5
4
3
2
1
0
Moderate to major deterioration or disintegration, extensive cracking and leaching,
or spalls on concrete or masonry walls and slabs. Minor settlement or
misalignment. Noticeable scouring or erosion at curtain walls, wingwalls, or pipes.
Metal culverts have significant distortion and deflection in one section, significant
corrosion or deep pitting.
Large spalls, heavy scaling, wide cracks, considerable efflorescence, or opened
construction joint permitting loss of backfill. Considerable settlement or
misalignment. Considerable scouring or erosion at curtain walls, wingwalls, or
pipes. Metal culverts have significant distortion and deflection throughout,
extensive corrosion or deep pitting.
Any condition described in Condition Rating 4 but which is excessive in scope.
Severe movement or differential settlement of the segments, or loss of fill. Holes may
exist in walls or slabs. Integral wingwalls nearly severed from culvert. Severe scour
or erosion at curtain walls, wingwalls or pipes. Metal culverts have extreme
distortion and deflection in one section, extensive corrosion, or deep pitting with
scattered perforations.
Integral wingwalls collapsed, severe settlement of roadway due to loss of fill.
Section of culvert may have failed and can no longer support embankment.
Complete undermining at curtain walls and pipes. Corrective action required to
maintain traffic. Metal culverts have extreme distortion and deflection throughout
with extensive perforations due to corrosion.
Bridge closed. Corrective action may put back in light service.
Bridge closed. Replacement necessary.
Description
Not Applicable. Use if structure is not a culvert.
No deficiencies.
No noticeable or noteworthy deficiencies which affect the condition of the culvert.
Insignificant scrape marks caused by drift.
Shrinkage cracks, light scaling, and insignificant spalling which does not expose
reinforcing steel. Insignificant damage caused by drift with no misalignment and
not requiring corrective action. Some minor scouring has occurred near curtain
walls, wingwalls, or pipes. Metal culverts have a smooth symmetrical curvature
with superficial corrosion and no pitting.
Deterioration or initial disintegration, minor chloride contamination, cracking with
some leaching, or spalls on concrete or masonry walls and slabs. Local minor
scouring at curtain walls, wingwalls, or pipes. Metal culverts have a smooth
curvature, non-symmetrical shape, significant corrosion or moderate pitting.
GENERAL CONDITION RATINGS AND DESCRIPTIONS FOR CULVERTS
Source: FHWA.

APPENDIX B 66
HAMPTON ROADS REGIONAL BRIDGE STUDY – 2018 UPDATE
INVENTORY RATING
The inventory rating is the load level that can safely utilize an existing
structure for an indefinite period of time. This is currently done in
Virginia using HS loading procedures (in tons) as defined by AASHTO,
with HS representing the type of vehicles a bridge can accommodate.
For inventory ratings using HS loading, the first number indicates the
type of loading and the last two numbers represent the load level in
tons. Using an inventory rating of 231 as an example, the 2 represents
HS loading procedures, and the load level that the bridge can safely
utilize for an indefinite period of time is 31 tons.
MS loading is the metric equivalent of HS loading. Converting the last
two numbers of the HS loading inventory ratings from tons to metric
tons produces the MS loading inventory rating.
STRUCTURAL EVALUATION
This item evaluates the structural condition of the bridge based on the
superstructure, substructure, and culvert general condition ratings,
inventory rating, and average daily traffic volumes.
For structures other than culverts, the lowest value among the
superstructure condition rating, substructure condition rating, and the
value in the table to the right is used to determine the structural
evaluation rating. For culverts, the lowest value among the culvert
condition rating and the value in the table to the right is used to
determine the structural evaluation rating.
If the superstructure, substructure, or culvert ratings are equal to one,
the structural evaluation rating is equal to zero, regardless of whether
the structure is actually closed.
0-500 501-5000 > 5000
9> 236 (HS) or
> 32.4 (MS)
> 236 (HS) or
> 32.4 (MS)
> 236 (HS) or
> 32.4 (MS)
8236 (HS) or
32.4 (MS)
236 (HS) or
32.4 (MS)
236 (HS) or
32.4 (MS)
7231 (HS) or
27.9 (MS)
231 (HS) or
27.9 (MS)
231 (HS) or
27.9 (MS)
6223 (HS) or
20.7 (MS)
225 (HS) or
22.5 (MS)
227 (HS) or
24.3 (MS)
5218 (HS) or
16.2 (MS)
220 (HS) or
18.0 (MS)
222 (HS) or
19.8 (MS)
4212 (HS) or
10.8 (MS)
214 (HS) or
12.6 (MS)
218 (HS) or
16.2 (MS)
3
2
0
Structural
Evaluation
Rating Code
Inventory Rating
Average Daily Traffic (ADT)
Inventory rating less than value in rating code of 4
and requiring corrective action.
Inventory rating less than value in rating code of 4
and requiring replacement.
Bridge closed.
STRUCTURAL EVALUATION RATING
(BASED ON ADT AND INVENTORY RATING)
Source: FHWA.
Notes: 1) Use the lower rating code for values between those listed in the table.
2) HS loading represents the load level which can safely utilize an existing structure for an indefinite
period of time. MS loading is the metric equivalent of the HS loading.
3) All bridges coded with a functional class of Interstate, Freeway, or Expressway shall be evaluated
using the ADT column of > 5000 vehicles per day, regardless of the actual ADT on the bridge.

APPENDIX B 67
HAMPTON ROADS REGIONAL BRIDGE STUDY – 2018 UPDATE
DECK GEOMETRY
This item evaluates the deck geometry of the structure based on the
bridge width and the minimum vertical clearance over the bridge
roadway.
The lower of the deck geometry ratings among the bridge width and
vertical clearance tables shall be used as the deck geometry rating.
When an individual table lists several deck geometry rating codes for
the same roadway width under a specific ADT, the lower rating code is
used. For values between those listed in the tables, the lower code is
used.
All Routes
Except as
noted for
Urban Areas
Undesignated
Routes, Urban
Areas*
9 >17'-0" >16'-6" >16'-6" >16'-6"
8 17'-0" 16'-6" 16'-6" 16'-6"
7 16'-9" 15'-6" 15'-6" 15'-6"
6 16'-6" 14'-6" 14'-6" 14'-6"
5 15'-9" 14'-3" 14'-3" 14'-3"
4 15'-0" 14'-0" 14'-0" 14'-0"
3
2
0
Vertical clearance less than value in rating code 4 and requiring corrective action.
Vertical clearance less than value in rating code 4 and requiring replacement.
Bridge closed.
Deck
Geometry
Rating
Code
Minimum Vertical Clearance
Functional Class
Interstate and Other Freeways
Other Principal
and Minor
Arterials
Major and
Minor
Collectors and
Locals
2 Lanes 3 or more 2 Lanes 3 or more 1 Lane 2 or more
9 >42' >12N + 24' >42' >12N + 18' >26' >12N + 12'
8 42' 12N + 24' 42' 12N + 18' 26' 12N + 12'
7 40' 12N + 20' 38' 12N + 15' 24' 12N + 10'
6 38' 12N + 16' 36' 12N + 12' 22' 12N + 8'
5 36' 12N + 14' 33' 11N + 10' 20' 12N + 6'
4 34' (29')11N + 12'
(11N+7)*30' 11N + 6' 18' 12N + 4'
3 33' (28')11N + 11'
(11N+6)*27' 11N + 5' 16' 12N + 2'
2
0
Any width less than required for a code of 3 & structure open.
Bridge closed.
Deck
Geometry
Rating
Code
TABLE C TABLE D
Bridge Roadway Width
2 or More Lanes Each Direction
Bridge Roadway
Width; 1 Way Traffic
Interstate and Other
Divided Freeways
Other Multilane
Divided Facilities Ramps Only
DECK GEOMETRY RATING BASED ON MINIMUM VERTICAL CLEARANCE
OVER BRIDGE ROADWAY Source: FHWA.
Notes: * Use for routes in highly developed urban areas only when there is an alternative Interstate, freeway or expressway
facility with a minimum of 16’-0” clearance.
1) Use the lower rating code for values between those listed in the table.
DECK GEOMETRY RATING BASED ON BRIDGE ROADWAY WIDTH Source: FHWA.
Notes: * Use the value in parentheses for bridges longer than 200 feet.
1) Use the lower rating code for values between those listed in the table.
2) For one lane of one-way traffic use Table A.
3) One-lane bridges 16 feet and greater in width, which are not ramps, are evaluated using Table A.
4) N = Number of lanes
5) Use Table C, Other Multilane Divided Facilities, for 3 or more undivided lanes of 2-way traffic.
0-100
100-
400
401-
1000
1001-
2000
2001-
5000 >5000 0-100 >100
9 >32' >36' >40' >44' >44' >44' - -
8 32' 36' 40' 44' 44' 44' 15'-11" -
7 28' 32' 36' 40' 44' 44' 15' -
6 24' 28' 30' 34' 40' 44' 14' -
5 20' 24' 26' 28' 34' 38' 13' -
4 18' 20' 22' 24' 28' 32' (28'*) 12' -
3 16' 18' 20' 22' 26' 30' (26'*) 11' 15'-11"
2
0
Any width less than required for a code of 3 & structure open.
Bridge closed.
Deck
Geometry
Rating
Code
TABLE A TABLE B
Bridge Roadway Width
2 Lanes; 2 Way Traffic
Bridge Roadway
Width
1 Lane; 2 Way
Traffic
ADT - Both Directions
ADT - Both
Directions
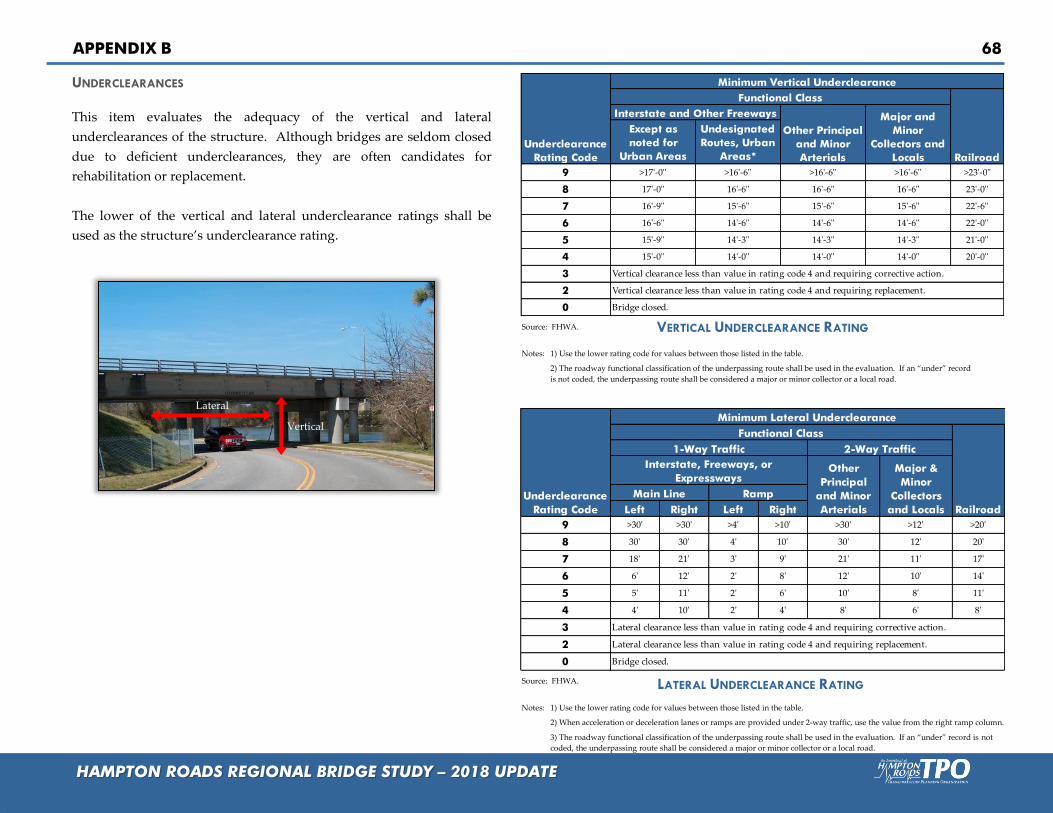
APPENDIX B 68
HAMPTON ROADS REGIONAL BRIDGE STUDY – 2018 UPDATE
UNDERCLEARANCES
This item evaluates the adequacy of the vertical and lateral
underclearances of the structure. Although bridges are seldom closed
due to deficient underclearances, they are often candidates for
rehabilitation or replacement.
The lower of the vertical and lateral underclearance ratings shall be
used as the structure’s underclearance rating.
Source: FHWA.
Notes: 1) Use the lower rating code for values between those listed in the table.
2) When acceleration or deceleration lanes or ramps are provided under 2-way traffic, use the value from the right ramp column.
3) The roadway functional classification of the underpassing route shall be used in the evaluation. If an “under” record is not
coded, the underpassing route shall be considered a major or minor collector or a local road.
Left Right Left Right
9 >30' >30' >4' >10' >30' >12' >20'
8 30' 30' 4' 10' 30' 12' 20'
7 18' 21' 3' 9' 21' 11' 17'
6 6' 12' 2' 8' 12' 10' 14'
5 5' 11' 2' 6' 10' 8' 11'
4 4' 10' 2' 4' 8' 6' 8'
3
2
0 Bridge closed.
Other
Principal
and Minor
Arterials
Major &
Minor
Collectors
and Locals
Main Line Ramp
Lateral clearance less than value in rating code 4 and requiring corrective action.
Lateral clearance less than value in rating code 4 and requiring replacement.
Underclearance
Rating Code
Minimum Lateral Underclearance
Functional Class
Railroad
1-Way Traffic 2-Way Traffic
Interstate, Freeways, or
Expressways
All Routes
Except as
noted for
Urban Areas
Undesignated
Routes, Urban
Areas*
9 >17'-0" >16'-6" >16'-6" >16'-6" >23'-0"
8 17'-0" 16'-6" 16'-6" 16'-6" 23'-0"
7 16'-9" 15'-6" 15'-6" 15'-6" 22'-6"
6 16'-6" 14'-6" 14'-6" 14'-6" 22'-0"
5 15'-9" 14'-3" 14'-3" 14'-3" 21'-0"
4 15'-0" 14'-0" 14'-0" 14'-0" 20'-0"
3
2
0
Vertical clearance less than value in rating code 4 and requiring corrective action.
Vertical clearance less than value in rating code 4 and requiring replacement.
Bridge closed.
Underclearance
Rating Code
Minimum Vertical Underclearance
Functional Class
Railroad
Interstate and Other Freeways
Other Principal
and Minor
Arterials
Major and
Minor
Collectors and
Locals
Source: FHWA.
Notes: 1) Use the lower rating code for values between those listed in the table.
2) The roadway functional classification of the underpassing route shall be used in the evaluation. If an “under” record
is not coded, the underpassing route shall be considered a major or minor collector or a local road.
LATERAL UNDERCLEARANCE RATING
VERTICAL UNDERCLEARANCE RATING
Vertical
Lateral

APPENDIX B 69
HAMPTON ROADS REGIONAL BRIDGE STUDY – 2018 UPDATE
WATERWAY ADEQUACY
This item evaluates the adequacy of the waterway opening
with respect to the passage of water flow under the bridge. In
some cases, site conditions may warrant higher or lower
ratings than are indicated in the table.
Principal
Arterials,
Interstates,
Freeways, or
Expressways
Other
Principal and
Minor
Arterials and
Major
Collectors
Minor
Collectors and
Locals
N N N Bridge not over a waterway.
9 9 9Bridge deck and roadway approaches above floodwater elevations
(high water). Chance of overtopping is remote.
8 8 8Bridge deck above roadway approaches. Slight chance of
overtopping roadway approaches.
6 6 7 Slight chance of overtopping bridge deck and roadway approaches.
4 5 6Bridge deck above roadway approaches. Occasional overtopping
of roadway approaches with insignificant traffic delays.
3 4 5Bridge deck above roadway approaches. Occasional overtopping
of roadway approaches with significant traffic delays.
2 3 4Occasional overtopping of bridge deck and roadway approaches
with significant traffic delays.
2 2 3Frequent overtopping of bridge deck and roadway approaches
with significant traffic delays.
2 2 2Occasional or frequent overtopping of bridge deck and roadway
approaches with severe traffic delays.
0 0 0 Bridge closed.
Roadway Functional Classification
DescriptionWaterway Adequacy Rating Code
WATERWAY ADEQUACY RATING
Source: FHWA.
Note: In the above table, the descriptions for chances of overtopping mean the following:
Remote: Greater than 100 years
Slight: 11 to 100 years
Occasional: 3 to 10 years
Frequent: Less than 3 years
Adjectives in this table describing traffic delay mean the following:
Insignificant: Minor inconvenience. Highway passable in a matter of hours.
Significant: Traffic delay of up to several days.
Severe: Long term delay to traffic with resulting hardship.

APPENDIX B 70
HAMPTON ROADS REGIONAL BRIDGE STUDY – 2018 UPDATE
APPROACH ROADWAY ALIGNMENT
This item evaluates the adequacy of the approach roadway alignment
and identifies those bridges that do not function properly or adequately
due to the alignment of the approaches. This rating differs from the
previously listed ratings in that it is not intended that the approach
roadway alignment be compared to current standards but rather to the
existing highway alignment.
Each individual structure shall be rated in accordance with the general
appraisal ratings listed in the table. The approach roadway alignment
should only be rated intolerable (a rating code of 3 or less) if the
horizontal or vertical curvature require a substantial reduction in speed
from the prevailing speed on the highway section. A very minor speed
reduction should be rated a 6, and when speed reduction is not
necessary the approach roadway alignment should be rated an 8.
Additional ratings between these general values may be selected.
Speed reductions due to the width of the structure rather than the
alignment approaching the structure shall not be considered in
evaluating this item.
Rating
Code Description
N Not Applicable
9 Superior to present desirable criteria
8 Equals present desirable criteria
7 Better than present desirable criteria
6 Equal to present desirable criteria
5 Somewhat better than minimum adequacy to tolerate being left in place as is
4 Meets minimum tolerable limits to be left in place as is
3 Basically intolerable requiring high priority of corrective action
2 Basically intolerable requiring high priority of replacement
0 Bridge Closed
APPROACH ROADWAY ALIGNMENT RATING
Source: FHWA.

APPENDIX C 71
HAMPTON ROADS REGIONAL BRIDGE STUDY – 2018 UPDATE
STATE OF GOOD REPAIR PRIORITIZATION
FORMULA - BRIDGES
Virginia House Bill 1887, passed into law in March 2015, established the
State of Good Repair (SGR) program to supplement the SMART SCALE
prioritization program and provide a dedicated funding source for the
improvement of the condition of Virginia’s bridges and pavements.
The Commonwealth Transportation Board approved a resolution in
June 2016 that stated that structures will be selected for SGR program
funds based on a prioritization formula. A State of Good Repair Score is
calculated for each bridge, and structurally deficient bridges are
prioritized for replacement or rehabilitation based on the SGR Score.
Those bridges with higher SGR Scores are prioritized over those with
lower SGR Scores.
Five factors are assigned a specific percentage towards the overall SGR
Score for each bridge, and each factor can have a value of between 0 and
1. The five factors are:
Importance Factor (30%) – The Importance Factor measures the
relative importance of each bridge to the overall highway
network.
Condition Factor (25%) – The Condition Factor uses the Health
Index (which was described previously in this report) to
measure the overall physical condition of each bridge based on
the condition of each individual element.
Design Redundancy Factor (15%) – This factor measures four
risk factors related to redundancy, scour susceptibility, fatigue,
and vulnerability to earthquakes.
Structure Capacity Factor (10%) – The Structure Capacity
Factor measures the capacity of the structure to carry traffic,
including the impacts of weight restrictions, waterway
adequacy, vertical clearance, and the width of the bridge.
Cost-Effectiveness Factor (20%) – This factor measures the cost-
effectiveness of the work required.
The structure’s SGR Score is determined by the following equation:
Structure SGR Score = (0.30 x Importance Factor) + (0.25 x Condition
Factor) + (0.15 x Design Redundancy Factor) + (0.10 x Structure
Capacity Factor) + (0.20 x Cost-Effectiveness Factor)
The following pages include the methodology used to calculate each
bridge’s SGR Score from VDOT’s SGR Program Bridge Prioritization
Formula document5. The SGR Score calculation for the Centerville
Turnpike Bridge in Chesapeake is also included as an example.
5 State of Good Repair (SGR) Program Bridge Prioritization Formula, VDOT, November 2, 2017.

APPENDIX C 72
HAMPTON ROADS REGIONAL BRIDGE STUDY – 2018 UPDATE
FACTOR #1 – IMPORTANCE FACTOR
The Importance Factor measures the relative importance of every
structure to the Virginia highway network. This importance is
measured independently of other factors such as the condition and
design of the bridge.
The Importance Factor is calculated using the following formula:
Importance Factor = (0.30 x A) + (0.10 x B) + (0.15 x C) + (0.20 x D) + (0.05 x
E) + (0.20 x F)
Where each of the components is:
A = Average Daily Traffic Factor
B = Future Average Daily Traffic Factor
C = Truck ADT
D = Bypass Impact Factor
E = National Highway System
F = Corridor of Statewide Significance
Each of these components is described further on the following pages.
CENTERVILLE TURNPIKE BRIDGE EXAMPLE
Current ADT = 15,980 (2014)
Future ADT = 24,772 (2035)
Truck ADT Percentage = 2%
Number of Lanes = 2
Bypass Detour Length = 13 miles
Base Highway Network = N
STRAHNET = N
Designated National Network = N
Virginia Highway System = Urban
Virginia Corridor of Statewide Significance = N
Deck Condition = 4
Superstructure Condition = 4
Substructure Condition = 5
Health Index = 74.71
Fracture Critical = Y
Scour Critical = N
Seismically Vulnerable = N
Presence of Fatigue Prone Details = N
Operating Rating = 35.4
Waterway Adequacy = 7
Vertical Clearance = N/A
Approach Width = 7.3 m = 24 ft
Deck Width = 8.2 m = 27 ft
Recommended Action Cost = $3,361,947
Structure Replacement Cost = $8,877,060
Bridge Information

APPENDIX C 73
HAMPTON ROADS REGIONAL BRIDGE STUDY – 2018 UPDATE
Component A – Average Daily Traffic Factor
Component A is an estimate of the current travel demand for the
structure. Component A is determined by the chart and equation
shown in Figure C-1, with the value of Component A (VA) determined
by the Average Daily Traffic.
If the Average Daily Traffic is lower than 50 then Component A will
have a value of 0. If the Average Daily Traffic is higher than 25,000,
Component A will have a value of 1.
Component B – Future Average Daily Traffic Factor
Component B is an estimate of the future travel demand for the
structure. Component B is determined by the chart and equation shown
in Figure C-2, with the value of Component B (VB) determined by the
Future Average Daily Traffic.
If the Future Average Daily Traffic is lower than 50 then Component B
will have a value of 0. If the Future Average Daily Traffic is higher than
25,000, Component B will have a value of 1.
FIGURE C-1: Index Value Function for Variable A:
Average Daily Traffic
For the Centerville Turnpike Bridge:
Current ADT = 15,980
VA = 2 * (0.0707 ln (15,980) – 0.2534) = 0.862
For the Centerville Turnpike Bridge:
Future ADT = 24,772
VB = 2 * (0.0707 ln (24,772) – 0.2534) = 0.924
FIGURE C-2: Index Value Function for Variable B:
Future Average Daily Traffic

APPENDIX C 74
HAMPTON ROADS REGIONAL BRIDGE STUDY – 2018 UPDATE
Component C – Truck ADT
Component C conveys the importance of the structure for commerce
and infers the magnitude of potential negative impacts caused by truck
traffic on detour routes if the structure was taken out of service.
Component C is determined by the chart and equation shown in Figure
C-3, with the value of Component C (VC) determined by the Average
Daily Truck Traffic volume.
If the Truck ADT is lower than 50 then Component C will have a value
of 0. If the Truck ADT is higher than 25,000, Component C will have a
value of 1.
Component D – Bypass Impact Factor
Component D reflects the inconvenience to drivers of vehicles that
would be diverted by a structure’s closure by combining the Bypass
Detour Length (BYP) around a structure with the structure’s current
ADT and the classification of the roadway.
For roadways that are classified as Interstates, Component D = 1.0. For
roadways that are classified as a Primary, Component D = 0.75. For
Secondary, Urban, and other roadways, two variables are used to
calculate Component D. The first variable, BYPD, reflects the bypass
detour length of the structure. The second variable, ADTD, reflects the
volume of traffic that would be impacted by the structure’s closure. The
value of Component D is determined by using these two variables in the
chart below (Figure C-4).
FIGURE C-3: Index Value Function for Variable C: Average
Daily Truck Traffic
FIGURE C-4: Index Value Function for Bypass Detour Length Factor in
Variable D
For the Centerville Turnpike Bridge:
Current ADT = 15,980
Truck ADT Percentage = 2%
VC = 0.071397 * (15,980*.02)^0.25978 = 0.319 For the Centerville Turnpike Bridge:
Current ADT = 15,980
Bypass Detour Length = 13 miles
Roadway Classification = Urban
VD = 0.92

APPENDIX C 75
HAMPTON ROADS REGIONAL BRIDGE STUDY – 2018 UPDATE
Component E – National Highway System
Component E is a component that reflects whether the structure carries
a roadway included in the National Highway System (NHS). These
designated routes have unique objectives that must be supported with
maintenance and replacement expenditures as needed to keep
structures in service.
If the roadway carried by the structure is part of the NHS, Component E
= 1.0. If the roadway carried by the structure is not part of the NHS,
Component E = 0.0.
Component F – Corridor of Statewide Significance
Component F is determined based on whether the structure carries a
roadway that is designated as a Virginia “Corridor of Statewide
Significance (CoSS)”. If the roadway carried by the structure is a CoSS,
Component F = 1.0. If the roadway carried by the structure is not a
CoSS, Component F = 0.0.
For the Centerville Turnpike Bridge:
NHS = 0 (The roadway is not a part of the NHS)
VE = 0
For the Centerville Turnpike Bridge – Importance Factor
Importance Factor = (0.30 x A) + (0.10 x B) + (0.15 x C) + (0.20 x D) + (0.05 x E) + (0.20 x F)
= (0.30 x 0.862) + (0.10 x 0.924) + (0.15 x 0.319) + (0.20 x 0.92) + (0.05 x 0) + (0.20 x 0)
= 0.583
For the Centerville Turnpike Bridge:
CoSS = 0 (The roadway is not a Virginia Corridor of Statewide Significance)
VF = 0

APPENDIX C 76
HAMPTON ROADS REGIONAL BRIDGE STUDY – 2018 UPDATE
FACTOR #2 – CONDITION FACTOR
The Condition Factor aims to use the Health Index to measure the
overall physical condition of each bridge based on the condition of each
individual element.
The Health Index (which was described previously in this report) is
determined based on the condition of various elements of the bridge –
such as railings, joints, and girders – which are each rated from “new
condition” to “serious or badly deteriorated condition”. These elements
are then assigned a dollar value based on their condition relative to a
new structure. Each element is assigned a weight and the elements are
combined to determine a current dollar value of the entire structure.
The Health Index of a structure is calculated by dividing this current
dollar value by the sum of the total value of all the structure’s elements
in new condition. A Health Index of 100% indicates that all of the
elements of the structure are in the best possible condition, while a
Health Index of 0% indicates that all of the elements are in the worst
possible condition.
The Condition Factor is calculated using the following formula:
Condition Factor = 1.0 – (Health Index/100)
Although VDOT currently calculates a Health Index for each bridge,
VDOT believes the Health Index may be unreliable due to federally-
mandated changes in the nature of the data that are used to calculate the
index. VDOT plans to have the issue resolved before the next round of
SGR funding but will use an approximate “Interim Health Index” in the
meantime in place of the Health Index in the Condition Factor equation.
The Interim Health Index uses a Blended General Condition Rating
(BGCR). The BGCR for bridges is calculated as follows:
BGCR (For bridges) = (0.25 x Deck General Condition Rating) + (0.35 x
Superstructure General Condition Rating) + (0.40 x Substructure
General Condition Rating)
For culverts, the BGCR is calculated as follows:
BGCR (For culverts) = (1.0 x Culvert General Condition Rating)
The Interim Health Index is calculated using the following equation:
Interim Health Index = 100 – [100 x (9 – BGCR)3/ 5.53 ]
The Interim Health Index is used in place of the Health Index to
calculate the Condition Factor for the structure. If the value of the
BGCR is less than or equal to 3, then the value of 1 is used for the
Condition Factor. If the value of the BGCR is greater than or equal to 7,
then the value of 0 is used for the Condition Factor.
For the Centerville Turnpike Bridge – Condition Factor
Deck Condition Rating = 4
Superstructure Rating = 4
Substructure Rating = 5
BGCR = (0.25 x 4) + (0.35 x 4) + (0.40 x 5) = 4.4
Interim Health Index = 100 – [100 x (9-BGCR)3/5.53]
= 100 – [100 x(9-4.4)3/5.53] = 41.5
Condition Factor = 1.0 – (Health Index/100)
= 1.0 – (41.5/100)
= 0.585

APPENDIX C 77
HAMPTON ROADS REGIONAL BRIDGE STUDY – 2018 UPDATE
FACTOR #3 – DESIGN REDUNDANCY FACTOR
The Design Redundancy Factor measures the vulnerability each
structure has for four risk factors. These risk factors are:
Redundancy – Most bridges are designed so that loads can be
redistributed to other structural members if any one structural
member loses its ability to distribute loads. However, some
bridges were designed with few or no redundant supporting
elements and could collapse if a key structural member fails.
Despite this lack of redundant elements, these bridges –
classified as fracture critical – are not necessarily unsafe but
they undergo more extensive and more frequent inspections.
Examples of fracture critical bridges include most truss bridges,
drawbridges, and those beam or girder bridges designed
without redundant elements.
Scour Susceptibility – Bridges with underwater substructure
sections may be vulnerable to scouring, or the exposure of
portions of the substructure due to changes in the river bed. In
cases where a bridge is at risk of failure due to scouring, the
bridge is classified as scour critical.
Seismically Vulnerable – This factor measures the
vulnerability of structures to damage caused by earthquakes.
Fatigue Prone – The definition of fatigue is the tendency of a
component of a bridge to fail at a stress level below its yield
stress when subject to cyclical loading. “Fatigue prone details”
are defined as details meeting the AASHTO fatigue detail
categories of C through E on bridges that either carry a route
that has 500 or more trucks per day or carry an interstate route.
The value of the Design Redundancy Factor is comprised of these four
risk factors using the following formula:
Design Redundancy Factor = 0.4 x (Fracture Critical) + 0.4 x (Scour
Critical) + 0.1 x (Seismically Vulnerable) + 0.1 x (Fatigue Prone)
For each of these four risk factors, a value of 1.0 is given if the bridge is
vulnerable to that risk factor and a value of 0 is given if the bridge is not
vulnerable to that risk factor.
For the Centerville Turnpike Bridge – Design Redundancy Factor
Fracture Critical = Y
Scour Critical = N
Seismically Vulnerable = N
Presence of Fatigue Prone Details = N
Design Redundancy Factor = 0.4 x (Fracture Critical) + 0.4 x (Scour Critical) +
0.1 x (Seismically Vulnerable) + 0.1 x (Fatigue Prone)
Design Redundancy Factor = (0.4 x 1) + (0.4 x 0) + (0.1 x 0) + (0.1 x 0)
Design Redundancy Factor = 0.4

APPENDIX C 78
HAMPTON ROADS REGIONAL BRIDGE STUDY – 2018 UPDATE
FACTOR #4 – STRUCTURE CAPACITY FACTOR
The Structure Capacity Factor measures the capacity of a structure to
carry traffic, including the impacts of weight restrictions, waterway
adequacy, vertical clearance, and the width of the bridge. The Structure
Capacity Factor is comprised of three components: Weight Reduction
Factor, Waterway/Vertical Clearance Factor, and Width Factor.
Component A – Weight Reduction Factor
The Weight Reduction Factor measures the ability of the structure to
carry fire trucks, ambulances, school buses, and trucks. Component A–
which has a value between 0 and 1 – is comprised of three variables: VA
– Safe Structure Load, VB – Weight Posting, and VC – Sufficiency to
Carry Public Vehicles. The values for VA and VB are calculated using the
following graphs:
The values for VC – Sufficiency to Carry Public Vehicles are calculated
using three graphs. VC1 represents sufficiency to carry school buses, VC2
represents ambulances, and VC3 represents fire trucks:
FIGURE C-5: Index Value Function for Variable VA: Safe
Structure Load
FIGURE C-6: Index Value Function for Variable VB: Weight
Posting
FIGURE C-7: Index Value Function for Variable VC1:
Sufficiency to Carry School Buses

APPENDIX C 79
HAMPTON ROADS REGIONAL BRIDGE STUDY – 2018 UPDATE
Component A is calculated using the following formula:
Component A = (0.333 x VA) + (0.333 x VB) + 0.333 x [(0.333 X VC1) + (0.333 x
VC2) + (0.333 x VC3)]
Component B – Waterway/Vertical Clearance Factor
The Waterway/Vertical Clearance Factor measures the adequacy of the
vertical clearance for waterways, railways, and trucks. This factor –
which has a value between 0 and 1 – is based on the waterway
adequacy and vertical clearance scores.
Waterway Adequacy describes the condition of the opening of the
structure with respect to the passage of water flow through the bridge.
Based on the rating that bridge inspectors assign to a bridge, VDOT
assigns a Waterway Adequacy Score based on the following figure:
The value for the Vertical Clearance Score is based on the vertical
clearance under the structure and the functional class of the roadway
under the structure, and is calculated using the following graph:
Component B is calculated as the minimum of the Waterway Adequacy
Score and the Vertical Clearance Score.
Component B = Minimum (Waterway Adequacy Score, Vertical Clearance
Score)
FIGURE C-8: Index Value Function for Variable VC2:
Sufficiency to Carry Ambulances
FIGURE C-9: Index Value Function for Variable VC3:
Sufficiency to Carry Fire Trucks
FIGURE C-10: Waterway Adequacy Score Index
FIGURE C-11: Vertical Clearance Score

APPENDIX C 80
HAMPTON ROADS REGIONAL BRIDGE STUDY – 2018 UPDATE
Component C – Width Factor
The Width Factor measures the adequacy of the width of the bridge.
The Width Factor has a value between 0 and 1 and is based on the
approach roadway width and deck width of the bridge.
The Width Factor has a value of 0 for culverts. For bridges, the Width
Factor is calculated using the following figure:
The Structure Capacity Factor is calculated using the following weights
for each of the three components:
Structure Capacity Factor = (0.50 x Component A) + (0.35 x Component B)
+ (0.15 x Component C)
FIGURE C-12: Deck Width Score
For the Centerville Turnpike Bridge – Structure Capacity Factor
Operating Rating = 35.4 metric tons = 39.0 tons
Posted Capacity - Single = N/A
Posted Capacity - Semi 27 = N/A
Posted Capacity - Semi 40 = N/A
Waterway Adequacy Rating = 7
Approach Width = 24 feet
Deck Width = 27 feet
# of Lanes = 2
Component A = (0.333 x VA) + (0.333 x VB) + 0.333 x [(0.333 X VC1) + (0.333 x VC2)
+ (0.333 x VC3)]
Component A = (0.333 x 0.320) + (0.333 x 0) + 0.333 x [(0.333 x 0) + (0.333 x 0) +
(0.333 x 0)]
Component A = 0.107
Component B = Minimum (Waterway Adequacy Score, Vertical Clearance
Score)
Component B = Minimum (0, N/A) = 0
Component C = Lookup [(Approach Width – Deck Width)/# of Lanes]
Component C = Lookup [(24 ft – 27 ft)/2]
Component C = Lookup [(-3 ft)/2] = -1.5
Component C = 0
Structure Capacity Factor = (0.50 x Component A) + (0.35 x Component B) +
(0.15 x Component C)
Structure Capacity Factor = (0.50 x 0.107) + (0.35 x 0) + (0.15 x 0)
Structure Capacity Factor = 0.053

APPENDIX C 81
HAMPTON ROADS REGIONAL BRIDGE STUDY – 2018 UPDATE
FACTOR #5 – COST-EFFECTIVENESS FACTOR
The Cost-Effectiveness Factor measures the cost-effectiveness of the
work required on the structure. It is a function of the ratio of the
“Action Cost” to repair the structure versus the cost to replace the
structure. The Action Cost is also the amount of State of Good Repair
(SGR) funding requested, and excludes any funding available from non-
SGR sources.
The Cost-Effectiveness Factor – which has a value of between 0 and 1 –
is calculated using the following figure:
In the above figure, the SGR Fund Needs are the same as the Action
Cost referred to above. In cases where bridge replacement is
recommended, the “Action Cost” will be equal to the SGR Bridge
Repacement Cost Estimate.
For the Centerville Turnpike Bridge – Cost-Effectiveness Factor
(Note: These estimates are from the FY 2017 SGR submittal)
Action Cost = $3,361,947
Structure Replacement Cost = $8,877,060
Action Cost/Structure Replacement Cost = $3,361,947 / $8,877,060 = 0.379
Cost-Effectiveness Factor = 0.667
SGR Score - Centerville Turnpike Bridge
Importance Factor = 0.583
Condition Factor = 0.585
Design Redundancy Factor = 0.400
Structure Capacity Factor = 0.053
Cost-Effectiveness Factor = 0.667
Structure SGR Score = (0.30 x Importance Factor) + (0.25 x Condition Factor) +
(0.15 x Design Redundancy Factor) + (0.10 x Structure Capacity Factor) + (0.20 x
Cost-Effectiveness Factor)
SGR Score = (0.30 x 0.583) + (0.25 x 0.585) + (0.15 x 0.400) + (0.10 x 0.053) + (0.20 x
0.667)
SGR Score = (0.175) + (0.146) + (0.060) + (0.005) + (0.133)
SGR Score = 0.519
FIGURE C-13: Cost-Effectiveness Score

APPENDIX D 82
HAMPTON ROADS REGIONAL BRIDGE STUDY – 2018 UPDATE
REGIONAL BRIDGE INVENTORY
Appendix D contains an inventory of the 1,261 bridges in Hampton
Roads, broken down by jurisdiction. Maps and tables describing details
of each bridge are included. The data included in the tables in this
appendix is described below:
Federal Bridge # (Structure ID) – A unique number designated
for each bridge. This is different than the Virginia Bridge ID.
Structurally Deficient (SD) – This column indicates if a bridge is
classified as structurally deficient.
Functionally Obsolete (FO) – This column indicates if a bridge is
classified as functionally obsolete.
Bridge Condition Ratings – General condition ratings are
included for each bridge. These ratings include the deck
condition, superstructure condition, substructure condition, and
culvert condition (if applicable). Descriptions of each of these
bridge ratings are included in Appendix B.
Federal Performance Measure (PM) Bridge Condition – This
column includes each bridge’s condition, based on the new
Federal Performance Measure standards. Bridges can be rated as
Good, Fair, or Poor.
Fracture Critical – This column indicates whether the bridge is
classified as fracture critical. Fracture critical bridges are bridges
that are designed with few or no redundant supporting elements,
and the bridge is in danger of collapse if a key structural member
fails.
Posted Weight Limit – This column lists the posted weight limit
of the bridge in tons. The posted weight limit of the bridge is
shown as X/Y/Z, with the first number (X) representing the posted
weight limit for all vehicles, the second number (Y) representing
the posted weight limit for single unit trucks, and the third
number (Z) representing the posted weight limit for trucks with
semi-trailers. A ‘-‘ indicates that there is no posted weight limit
on the bridge for that type of vehicle. For federally-maintained
bridges, the NBI data only specifies whether weight limits are in
place, not specific weight limit levels.
1
2
3
4
6
5
7
1
2
3
4
5
6
7
SD FO Deck
Super-
Structure
Sub-
Structure Culvert
CHES 21879 166 22nd Street Seaboard Avenue & N/S R/R 1938 - City SD - 4 3 4 N Poor - 5/-/-
CHES 21840 58 Airline Blvd Br Goose Creek 1932 - City - FO 5 5 5 N Fair - -
CHES 25186 168 Atlantic Avenue N/S R/R And SB Ramp 1998 - City - - 7 7 7 N Good - -
CHES 25182 168 Atlantic Avenue Norfolk Southern R/R 1999 - City - - 7 7 7 N Good - -
CHES 23762 166 Bainbridge Blvd Mains Creek 1993 - City - FO 7 7 7 N Good - -
CHES 21882 166 Bainbridge Blvd Milldam Creek 1985 - City - - 7 6 6 N Fair - -
CHES 21881 166 Bainbridge Blvd Norfolk Southern R/R 1938 1947 City SD - 7 6 4 N Poor - -
CHES 24840 Ballahack Road Lead Ditch 1997 - City - - N N N 6 Fair - -
Year
BuiltJuris
Federal
Bridge
# Route Facility Crossing
Year
Recnst Ownership
Bridge Condition RatingsFederal
PM Bridge
Condition
Posted
Weight
Limit
(tons)
Fracture
Critical

APPENDIX D 83
HAMPTON ROADS REGIONAL BRIDGE STUDY – 2018 UPDATE
Functionally Obsolete Bridges
Bridges with a Posted Weight Limit
Data source: HRTPO analysis of VDOT and FHWA data.
Data as of December 2017.
CHESAPEAKE BRIDGES
Non-Deficient Bridges
LEGEND
Structurally Deficient Bridges

APPENDIX D 84
HAMPTON ROADS REGIONAL BRIDGE STUDY – 2018 UPDATE
LEGEND
Fair
Data source: HRTPO analysis of VDOT and FHWA data.
Data as of December 2017.
BRIDGE CONDITION
CHESAPEAKE
Poor
LEGEND
Good
Based on Federal Bridge Performance Measure Standards
Under Construction

APPENDIX D 85
HAMPTON ROADS REGIONAL BRIDGE STUDY – 2018 UPDATE
CHESAPEAKE BRIDGES
SD FO Deck
Super-
Structure
Sub-
Structure Culvert
CHES 21879 166 22nd Street Seaboard Avenue & N/S R/R 1938 - City SD - 4 3 4 N Poor - 5/-/-
CHES 21840 58 Airline Blvd Br Goose Creek 1932 - City - FO 5 5 5 N Fair - -
CHES 25186 168 Atlantic Avenue N/S R/R And SB Ramp 1998 - City - - 7 7 7 N Good - -
CHES 25182 168 Atlantic Avenue Norfolk Southern R/R 1999 - City - - 7 7 7 N Good - -
CHES 23762 166 Bainbridge Blvd Mains Creek 1993 - City - FO 7 7 7 N Good - -
CHES 21882 166 Bainbridge Blvd Milldam Creek 1985 - City - - 7 6 6 N Fair - -
CHES 21881 166 Bainbridge Blvd Norfolk Southern R/R 1938 1947 City SD - 7 6 4 N Poor - -
CHES 24840 Ballahack Road Lead Ditch 1997 - City - - N N N 6 Fair - -
CHES 25081 Ballahack Road Lead Ditch 1997 - City - - N N N 7 Good - -
CHES 21813 Ballahack Road Newland Swamp 1974 - City - - 6 5 5 N Fair - -
CHES 21819 Barnes Road I-464 1983 - VDOT - FO 7 6 6 N Fair - -
CHES 27874 168 Battlefield Blvd Chesapeake & Albemarle Canal 2004 - City - - 7 7 7 N Good Yes -
CHES 26940 168 Battlefield Blvd Chesapeake Expressway 2001 - City - - 7 7 7 N Good - -
CHES 27047 168 Battlefield Blvd I-64 2008 - VDOT - - 7 7 7 N Good - -
CHES 28148 168 Battlefield Blvd Inlet Of C&A Canal 2005 - City - - 7 7 7 N Good - -
CHES 21885 168 Battlefield Blvd Military Highway 1990 - City - FO 6 6 6 N Fair - -
CHES 26887 168 Battlefield Blvd NB Northwest River 2001 - City - - 6 7 6 N Fair - -
CHES 21887 168 Battlefield Blvd SB Northwest River 1987 - City - - 7 7 6 N Fair - -
CHES 24003 168 Battlefield Blvd Poplar Branch 1993 - City - - 7 7 7 N Good - -
CHES 29969 Beaver Dam Road Drainage Ditch 2012 - City - - 8 8 8 N Good - -
CHES 30096 Bells Mill Road Bells Mill Creek 2012 2012 City - - 8 8 8 N Good - -
CHES 21803 Benefit Road Branch Northwest River 1986 - City - - 7 6 6 N Fair - -
CHES 26883 Benefit Road Chesapeake Expressway 2001 - City - - 7 7 7 N Good - -
CHES 30273 Benefit Road Drainage Ditch 2013 - City - FO N N N 7 Good - -
CHES 21804 Benefit Road Lead Ditch 1958 1976 City - FO 6 5 6 N Fair - -
CHES 24257 Benefit Road Lead Ditch 1993 - City - - N N N 7 Good - -
CHES 29532 Blackwater Road Pocaty Creek 2010 - City - - 7 7 7 N Good - -
CHES 24704 Bunch Walnuts Road Northwest River 1996 - City - - 7 6 7 N Fair - -
CHES 21791 Campostella Road I-464 1966 - VDOT - - 5 6 5 N Fair - -
CHES 21884 168 Campostella Road Norfolk Southern R/R 1938 1985 City - - 7 6 6 N Fair - -
CHES 30266 Campostella Road Trib Deep Creek 2012 - City - FO N N N 8 Good - -
CHES 25185 168 Campostella Road SB Ramp Norfolk Southern R/R 2000 - City - FO 6 7 6 N Fair - -
CHES 26696 165 Cedar Road Bells Mill Creek 1999 - City - - 7 7 7 N Good - -
CHES 28514 165 Cedar Road Lindsey Drainage Canal 2006 - City - FO N N N 7 Good - -
CHES 29507 165 Cedar Road New Mill Creek 2007 - City - - N N N 7 Good - -
CHES 30272 165 Cedar Road Trib Bells Mill Creek 2013 - City - - N N N 7 Good - -
CHES 21797 Centerville Turnpike Chesapeake & Albemarle Canal 1955 1990 City SD - 4 4 5 N Poor Yes -
CHES 26885 168 Chesapeake Expressway NB Battlefield Blvd South 2001 - City - - 7 7 7 N Good - -
CHES 26886 168 Chesapeake Expressway SB Battlefield Blvd South 2001 - City - - 7 7 7 N Good - -
CHES 26881 168 Chesapeake Expressway NB Hillcrest Parkway 2001 - City - - 7 7 7 N Good - -
CHES 26882 168 Chesapeake Expressway SB Hillcrest Parkway 2001 - City - - 7 7 7 N Good - -
CHES 24206 168 Chesapeake Expressway NB Poplar Branch 1993 - City - - 7 7 8 N Good - -
CHES 24207 168 Chesapeake Expressway SB Poplar Branch 1993 - City - - 7 7 8 N Good - -
CHES 30280 Copper Knoll Lane Trib Ches & Albem Canal 2013 - City - - N N N 8 Good - -
CHES 30271 Deep Creek Blvd Drainage Ditch 2013 - City - - N N N 6 Fair - -
CHES 21812 Dock Landing Road Bailey Creek 1970 - City - FO 6 6 5 N Fair - -
CHES 23104 Dock Landing Road I-664 1991 - VDOT - - 6 6 7 N Fair - -
CHES 30685 17 Dominion Boulevard Mains Creek Culvert 2013 - VDOT - - N N N 7 Good - -
CHES 21824 Elbow Road Stumpy Lake Spillway 1975 - City SD - 6 5 4 N Poor - -
CHES 21805 Etheridge Manor Blvd Coopers Ditch 1990 - City - FO 7 7 7 N Good - -
Year
BuiltJuris
Federal
Bridge
# Route Facility Crossing
Year
Recnst Ownership
Bridge Condition RatingsFederal
PM Bridge
Condition
Posted
Weight
Limit
(tons)
Fracture
Critical
Source: HRTPO analysis of VDOT and FHWA data. Data as of December 2017. A description of codes used in this table is included on page 82.

APPENDIX D 86
HAMPTON ROADS REGIONAL BRIDGE STUDY – 2018 UPDATE
CHESAPEAKE BRIDGES
SD FO Deck
Super-
Structure
Sub-
Structure Culvert
CHES 21822 Etheridge Road Coopers Ditch 1989 - City - - 7 7 7 N Good - -
CHES 30367 Fentress Airfield Road Pocaty Creek 2014 2014 City - FO N N N 8 Good - -
CHES 21810 Fentress Airfield Road Pocaty Creek 1963 - City - FO 6 5 6 N Fair - -
CHES 24202 Forest Road Coopers Ditch 1993 - City - - 7 7 7 N Good - -
CHES 29531 17 George Washington Hwy Deep Creek 2011 2010 City - - 7 7 7 N Good - -
CHES 1818 George Washington Hwy Dismal Swamp Canal 1934 2016 Federal - FO 6 5 7 N Fair Yes -
CHES 21836 17 George Washington Hwy I-64 1969 - VDOT - - 5 6 6 N Fair - -
CHES 21833 17 George Washington Hwy St Julians Creek 1985 - City - - 7 6 6 N Fair - -
CHES 21838 17 George Washington Hwy Yadkins Road & NS R/R 1992 1992 City - - 7 7 7 N Good - -
CHES 27144 13 Gilmerton Bridge S Br Elizabeth River 2013 - City - - 7 7 7 N Good Yes -
CHES 21906 190 Great Bridge Blvd I-64 1967 - VDOT - FO 7 6 6 N Fair - -
CHES 25566 168 Great Bridge Bypass NB Battlefield Blvd 1998 - City - FO 7 5 7 N Fair - -
CHES 21898 168 Great Bridge Bypass SB Battlefield Blvd 1981 - City - - 6 7 7 N Fair - -
CHES 21891 168 Great Bridge Bypass Chesapeake & Albemarle Canal 1981 - City - - 5 5 6 N Fair - -
CHES 21900 168 Great Bridge Bypass NB Kempsville Rd 1981 - City - - 7 7 6 N Fair - -
CHES 21902 168 Great Bridge Bypass SB Kempsville Rd 1981 - City - - 7 7 6 N Fair - -
CHES 21894 168 Great Bridge Bypass NB Mount Pleasant Road 1981 - City - - 7 7 7 N Good - -
CHES 21896 168 Great Bridge Bypass SB Mount Pleasant Road 1981 - City - - 7 7 7 N Good - -
CHES 21793 Greenbrier Parkway I-64 1978 - VDOT - - 7 7 6 N Fair - -
CHES 23021 Gum Court Drum Point Creek 1991 - VDOT - - N N N 7 Good - -
CHES 25696 Hanbury Road Chesapeake Expressway 1998 - City - FO 7 7 7 N Good - -
CHES 21868 64 High Rise Bridge S Br Eliz River & SR 166 1969 1991 VDOT - - 5 5 5 N Fair Yes -
CHES 21823 Hillwell Road Poplar Branch 1989 - City - - 7 6 7 N Fair - -
CHES 21844 64 I-64 Canal 1967 1995 VDOT - - N N N 6 Fair - -
CHES 21862 64 I-64 EB Military Highway 1969 - VDOT - - 7 6 6 N Fair - -
CHES 21864 64 I-64 WB Military Highway 1969 - VDOT - - 7 6 5 N Fair - -
CHES 25192 64 I-64 Norfolk Southern R/R 1998 - VDOT - - 7 7 7 N Good - -
CHES 21920 64 I-64 EB N/S R/R & Rotunda Ave 1969 1993 VDOT - - 6 5 6 N Fair - -
CHES 21922 64 I-64 WB N/S R/R & Rotunda Ave 1969 1993 VDOT - - 6 5 5 N Fair - -
CHES 21858 64 I-64 EB N/S R/R & Yadkin Road 1969 - VDOT - - 6 7 5 N Fair - -
CHES 21860 64 I-64 WB N/S R/R & Yadkin Road 1969 - VDOT - - 6 6 6 N Fair - -
CHES 21856 64 I-64 EB Shell Road 1969 - VDOT - - 6 6 6 N Fair - -
CHES 21854 64 I-64 WB Shell Road 1969 - VDOT - - 7 7 5 N Fair - -
CHES 26355 64 I-64 EB Collector Road Battlefield Blvd Ramp 2008 - VDOT - - 6 7 7 N Fair Yes -
CHES 26354 64 I-64 WB Collector Road Greenbrier Pkwy Ramp 2008 - VDOT - - 6 7 7 N Fair Yes -
CHES 26357 64 I-64 EB Collector Road Norfolk Southern R/R 2008 - VDOT - - 7 7 7 N Good - -
CHES 26356 64 I-64 WB Collector Road Norfolk Southern R/R 2008 - VDOT - - 7 7 7 N Good - -
CHES 21870 64 I-64 EB Ramp Canal 1978 - VDOT - - N N N 7 Good - -
CHES 21871 64 I-64 WB Ramp Canal 1978 - VDOT - - N N N 7 Good - -
CHES 21872 64 I-64 EB Ramp Canal 1978 - VDOT - - N N N 7 Good - -
CHES 21873 64 I-64 WB Ramp Canal 1978 - VDOT - - N N N 7 Good - -
CHES 21925 264 I-264 EB I-64 EB 1963 1993 VDOT - - 5 5 5 N Fair - -
CHES 21927 264 I-264 EB I-64 Ramp 1963 1993 VDOT - - 6 6 5 N Fair - -
CHES 21918 264 I-264 WB Ramp I-64 1969 - VDOT - - 6 6 5 N Fair - -
CHES 21945 464 I-464 NB Bainbridge Blvd 1984 - VDOT - - 6 6 7 N Fair - -
CHES 21947 464 I-464 SB Bainbridge Blvd 1984 - VDOT - - 6 6 6 N Fair - -
CHES 21957 464 I-464 NB Freeman Avenue 1987 - VDOT - - 7 7 6 N Fair - -
CHES 21959 464 I-464 SB Freeman Avenue 1987 - VDOT - - 7 7 6 N Fair - -
CHES 21961 464 I-464 NB Gilligan Creek & NS R/R 1987 - VDOT - - 6 6 7 N Fair - -
CHES 21962 464 I-464 SB Gilligan Creek & NS R/R 1987 - VDOT - - 6 6 7 N Fair - -
Year
BuiltJuris
Federal
Bridge
# Route Facility Crossing
Year
Recnst Ownership
Bridge Condition RatingsFederal
PM Bridge
Condition
Posted
Weight
Limit
(tons)
Fracture
Critical
Source: HRTPO analysis of VDOT and FHWA data. Data as of December 2017. A description of codes used in this table is included on page 82.

APPENDIX D 87
HAMPTON ROADS REGIONAL BRIDGE STUDY – 2018 UPDATE
SD FO Deck
Super-
Structure
Sub-
Structure Culvert
CHES 21941 464 I-464 NB I-64 1967 - VDOT - FO 6 6 6 N Fair - -
CHES 21943 464 I-464 SB I-64 1967 - VDOT - FO 6 6 5 N Fair - -
CHES 21963 464 I-464 NB Jones Creek 1987 - VDOT - - 6 6 7 N Fair - -
CHES 21964 464 I-464 SB Jones Creek 1987 - VDOT - - 7 6 7 N Fair - -
CHES 21965 464 I-464 NB Jones Creek 1987 - VDOT - - 7 7 7 N Good - -
CHES 21966 464 I-464 SB Jones Creek 1987 - VDOT - - 7 7 7 N Good - -
CHES 21949 464 I-464 NB Military Hwy 1984 - VDOT - - 6 6 7 N Fair - -
CHES 21951 464 I-464 SB Military Hwy 1984 - VDOT - - 6 6 7 N Fair - -
CHES 21955 464 I-464 NB Milldam Creek 1986 - VDOT - - 6 7 6 N Fair - -
CHES 21956 464 I-464 SB Milldam Creek 1986 - VDOT - - 6 6 7 N Fair - -
CHES 21953 464 I-464 NB NS R/R & Br Milldam Creek 1984 - VDOT - - 7 6 6 N Fair - -
CHES 21954 464 I-464 SB NS R/R & Br Milldam Creek 1984 - VDOT - - 7 6 6 N Fair - -
CHES 21967 464 I-464 NB South Norfolk Basin 1980 - VDOT - - 6 6 6 N Fair - -
CHES 21968 464 I-464 SB South Norfolk Basin 1980 - VDOT - - 6 7 6 N Fair - -
CHES 21969 464 I-464 SB South Norfolk Basin 1980 - VDOT - - 6 7 6 N Fair - -
CHES 23105 664 I-664 NB Bailey Creek 1991 - VDOT - - 7 7 7 N Good - -
CHES 23106 664 I-664 SB Bailey Creek 1991 - VDOT - - 6 7 7 N Fair - -
CHES 23037 664 I-664 Br Drum Point Creek 1991 - VDOT - - N N N 5 Fair - -
CHES 23017 664 I-664 Drum Point Creek 1991 - VDOT - - N N N 7 Good - -
CHES 23102 664 I-664 NB Goose Creek 1991 - VDOT - - 6 7 7 N Fair - -
CHES 23103 664 I-664 SB Goose Creek 1991 - VDOT - - 7 7 6 N Fair - -
CHES 23109 664 I-664 NB Norfolk Southern R/R 1991 - VDOT - - 6 7 7 N Fair - -
CHES 23110 664 I-664 SB Norfolk Southern R/R 1991 - VDOT - - 6 6 7 N Fair - -
CHES 23014 664 I-664 NB Route 13/58/460 1991 - VDOT - - 6 7 7 N Fair - -
CHES 23015 664 I-664 SB Route 13/58/460 1991 - VDOT - - 6 7 7 N Fair - -
CHES 21911 664 I-664 NB W Military Hwy & CSX R/R 1983 - VDOT - FO 6 6 6 N Fair - -
CHES 21913 664 I-664 SB W Military Hwy & CSX R/R 1983 - VDOT - FO 6 6 6 N Fair - -
CHES 21915 664 I-664 Ramp Route 58 & 460 EB 1983 - VDOT - - 6 6 6 N Fair Yes -
CHES 26884 Indian Creek Road Chesapeake Expressway 2001 - City - - 7 7 7 N Good - -
CHES 21799 Indian Creek Road Indian Creek 1972 - City - FO 6 6 5 N Fair - -/14/20
CHES 21935 407 Indian River Road Indian River 1974 - City - - 6 5 5 N Fair - -
CHES 25188 407 Indian River Road Norfolk Southern R/R 1998 - City - FO 6 7 7 N Fair - -
CHES 21908 191 Jolliff Road I-664 1991 - VDOT - - 6 7 7 N Fair - -
CHES 30093 17 Lake Drummond Causeway Lead Ditch 2012 - City - - N N N 7 Good - -
CHES 29509 Lake Shore Drive Tributary Of Goose Creek 2011 - City - - N N N 8 Good - -
CHES 21798 Land Of Promise Road Pocaty Creek 1971 - City - FO 7 6 5 N Fair - -
CHES 21800 Long Ridge Road Pocaty Creek 1973 - City - - 6 6 5 N Fair - -
CHES 24742 Luray Street Dismal Swamp Canal Spillway 1996 - City - FO 7 7 7 N Good - -
CHES 21827 13 Military Highway Bainbridge Blvd & NS R/R 1948 1960 City SD - 4 4 5 N Poor - -
CHES 21826 13 Military Highway Norfolk Southern R/R 1990 - City - - 6 7 7 N Fair - -
CHES 21830 13 Military Highway Norfolk Southern R/R 1938 - City SD - 3 4 4 N Poor - -/19/31
CHES 24180 Millstone Road Coopers Ditch 1993 - City - - 7 7 7 N Good - -
CHES 28523 165 Moses Grandy Trail New Mill Creek 2006 - City - - 7 8 7 N Good - -
CHES 1826 Mount Pleasant Road Chesapeake & Albemarle Canal 1951 2014 Federal - FO 7 6 5 N Fair - -
CHES 21877 165 Mount Pleasant Road Coopers Ditch 1985 - City - - 6 7 7 N Fair - -
CHES 21816 Number Ten Lane Lindsey Drainage Canal 1979 - City SD - 5 4 5 N Poor - -
CHES 30270 17 Old Dock Landing Rd Trib Goose Creek 1990 - City - - N N N 7 Good - -
CHES 30267 17 Old Mill Road Deep Creek 2013 - City SD - N N N 4 Poor - -
CHES 26701 Peaceful Road Chesapeake Expressway 2001 - City - - 7 7 6 N Fair - -
CHES 21932 337 Poindexter Street I-464 1980 - VDOT - FO 6 6 6 N Fair - -
Year
BuiltJuris
Federal
Bridge
# Route Facility Crossing
Year
Recnst Ownership
Bridge Condition RatingsFederal
PM Bridge
Condition
Posted
Weight
Limit
(tons)
Fracture
Critical
CHESAPEAKE BRIDGES Source: HRTPO analysis of VDOT and FHWA data. Data as of December 2017. A description of codes used in this table is included on page 82.

APPENDIX D 88
HAMPTON ROADS REGIONAL BRIDGE STUDY – 2018 UPDATE
SD FO Deck
Super-
Structure
Sub-
Structure Culvert
CHES 23107 337 Portsmouth Blvd EB I-664 1992 - VDOT - - 6 6 6 N Fair - -
CHES 23108 337 Portsmouth Blvd WB I-664 1992 - VDOT - - 6 6 6 N Fair - -
CHES 24256 337 Portsmouth Blvd Trib Bailey's Creek 1990 - City - - N N N 6 Fair - -
CHES 21934 337 Portsmouth Blvd W Br Elizabeth River 1983 - City - - 6 6 5 N Fair - -
CHES 21795 Providence Road Branch Of Indian River 1970 - City - - N N N 7 Good - -
CHES 21796 Providence Road Branch Of Indian River 1970 - City - - N N N 7 Good - -
CHES 23039 Pughsville Road Br Drum Point Creek 1991 - VDOT - - N N N 6 Fair - -
CHES 23112 Pughsville Road I-664 1991 - VDOT - - 7 7 7 N Good - -
CHES 21937 460 Ramp To Bainbridge Blvd & NS R/R Bainbridge Blvd 1948 1960 City SD - 6 4 5 N Poor Yes -
CHES 25570 168 Ramp To Dominion Blvd I-464 & Oak Grove Conn 1999 - VDOT - - 7 7 7 N Good - -
CHES 21817 Rosemont Avenue I-464 1983 - VDOT - - 7 7 6 N Fair - -
CHES 21821 Rotunda Avenue Trib Goose Creek 1969 - City SD - 5 6 4 N Poor - -
CHES 28796 17 Route 17 NB Bainbridge Blvd 2014 - City - FO 8 8 8 N Good - -
CHES 28795 17 Route 17 SB Bainbridge Blvd 2015 - City - FO 8 8 8 N Good - -
CHES 28792 17 Route 17 NB Cedar Road 2016 - City - FO 8 8 8 N Good - -
CHES 28793 17 Route 17 SB Cedar Road 2016 - City - - 8 8 8 N Good - -
CHES 28798 17 Route 17 NB Great Bridge Blvd 2016 - City - - 8 8 8 N Good - -
CHES 28797 17 Route 17 SB Great Bridge Blvd 2016 - City - - 8 8 8 N Good - -
CHES 27402 17 Route 17 Stream 2006 - City - FO N N N 7 Good - -
CHES 27231 17 Route 17 NB Wetlands 2005 - City - - 6 7 6 N Fair - -
CHES 27232 17 Route 17 SB Wetlands 2005 - City - - 7 7 7 N Good - -
CHES 28799 17 Route 17 - Ramp K Over Ramp L Ramp L 2015 - City - - 8 8 8 N Good - -
CHES 25568 168 Route 168 SB Dominion Blvd And Ramps 1998 - VDOT - - 7 7 7 N Good - -
CHES 25567 168 Route 168 NB Ramp To I-64 WB 1999 - VDOT - - 7 7 7 N Good - -
CHES 25569 64 Route 168 SB Ramp Dominion Blvd And Ramps 1999 - VDOT - - 7 7 7 N Good - -
CHES 29359 Saint Brides Road Lead Ditch 2009 - City - - N N N 8 Good - -
CHES 23038 Service Road Br Drum Point Creek 1991 - VDOT - - N N N 5 Fair - -
CHES 21931 South Norfolk Jordan Bridge Southern Branch Elizabeth River 2012 - Private - - - - - N N/A - -
CHES 30281 Station Road Trib Drum Point Creek 2013 - City - - N N N 7 Good - -
CHES 28794 17 Veterans Bridge NB S Br Elizabeth River 2014 - City - - 7 7 7 N Good - -
CHES 26479 17 Veterans Bridge SB S Br Elizabeth River 2016 - City - - 8 8 8 N Good - -
CHES 29508 Willow Lake Rd Tributary Of Goose Creek 2011 - City - - N N N 8 Good - -
CHES 24203 Woodlake Drive Drainage Channel 1975 1988 City - - N N N 7 Good - -
Year
BuiltJuris
Federal
Bridge
# Route Facility Crossing
Year
Recnst Ownership
Bridge Condition RatingsFederal
PM Bridge
Condition
Posted
Weight
Limit
(tons)
Fracture
Critical
CHESAPEAKE BRIDGES
Source: HRTPO analysis of VDOT and FHWA data. Data as of December 2017. A description of codes used in this table is included on page 82.

APPENDIX D 89
HAMPTON ROADS REGIONAL BRIDGE STUDY – 2018 UPDATE
Functionally Obsolete Bridges
Bridges with a Posted Weight Limit
Data source: HRTPO analysis of VDOT and FHWA data.
Data as of December 2017.
GLOUCESTER COUNTY BRIDGES
Non-Deficient Bridges
LEGEND
Structurally Deficient Bridges

APPENDIX D 90
HAMPTON ROADS REGIONAL BRIDGE STUDY – 2018 UPDATE
Fair
Data source: HRTPO analysis of VDOT and FHWA data.
Data as of December 2017.
BRIDGE CONDITION
GLOUCESTER COUNTY
Poor
LEGEND
Good
Based on Federal Bridge Performance Measure Standards
Under Construction

APPENDIX D 91
HAMPTON ROADS REGIONAL BRIDGE STUDY – 2018 UPDATE
GLOUCESTER COUNTY BRIDGES
Source: HRTPO analysis of VDOT and FHWA data. Data as of December 2017. A description of codes used in this table is included on page 82.
SD FO Deck
Super-
Structure
Sub-
Structure Culvert
GLO 10588 14 Adner Road Porpotank Creek 1938 - VDOT SD - 4 4 5 N Poor - -/27/40
GLO 8552 662 Allmondsville Road Fox Creek 2018 - VDOT - - N/A N/A N/A N/A N/A - -
GLO 8544 616 Belroi Road Fox Mill Run 1958 - VDOT - - N N N 6 Fair - -
GLO 29427 602 Burke's Pond Road Burkes Pond 2015 - VDOT - - 8 8 8 N Good - -
GLO 30573 627 Cunningham Lane Wilson Creek 2017 - VDOT - - 8 8 8 N Good - -
GLO 8532 198 Dutton Road Ferry Creek 1938 1999 VDOT - - 8 8 7 N Good - -
GLO 8533 198 Dutton Road Harper Creek 1941 2016 VDOT - - 8 8 7 N Good - -
GLO 8537 606 Farys Mill Road Beaverdam Swamp 1964 - VDOT - - N N N 7 Good - -
GLO 12085 17 George Washington Hwy NB Dragon Run 1931 - VDOT - FO 5 5 6 N Fair - -
GLO 12086 17 George Washington Hwy SB Dragon Run 1957 - VDOT SD - 6 4 5 N Poor - -
GLO 8530 17 George Washington Hwy NB Fox Mill Run 1972 - VDOT - - N N N 6 Fair - -
GLO 8529 17 George Washington Hwy SB Fox Mill Run 1972 - VDOT - - N N N 7 Good - -
GLO 8534 198 Glenns Road Carvers Creek 1950 - VDOT - - N N N 7 Good - -
GLO 26610 614 Hickory Fork Road Carters Creek 2006 - VDOT - - 7 7 8 N Good - -
GLO 8524 3 John Clayton Hwy Beaverdam Swamp 1974 - VDOT - - N N N 6 Fair - -
GLO 8523 3 John Clayton Hwy EB Cow Creek 1938 2003 VDOT - - 7 8 7 N Good - -
GLO 8525 3 John Clayton Hwy WB Cow Creek 1974 - VDOT - - N N N 7 Good - -
GLO 8528 17 Main Street NB Fox Mill Run 1964 - VDOT - - 5 5 5 N Fair - -
GLO 27069 17 Main Street SB Fox Mill Run 2012 - VDOT - - 8 8 8 N Good - -
GLO 8538 610 Old Pinetta Road Bland Creek 1960 2013 VDOT - - 8 8 5 N Fair - -
GLO 8547 636 Providence Road Timberneck Creek 1990 - VDOT - - N N N 7 Good - -
GLO 8546 636 Providence Road Trib. Of Timberneck Creek 1990 - VDOT - - N N N 6 Fair - -
GLO 23898 616 Roaring Springs Road Beaverdam Swamp 1993 - VDOT - - 7 7 7 N Good - -
GLO 8548 641 Tidemill Road Northwest Br Sarah Creek 1974 - VDOT SD - 6 4 5 N Poor - -
Year
BuiltJuris
Federal
Bridge
# Route Facility Crossing
Year
Recnst Ownership
Bridge Condition RatingsFederal
PM Bridge
Condition
Posted
Weight
Limit
(tons)
Fracture
Critical

APPENDIX D 92
HAMPTON ROADS REGIONAL BRIDGE STUDY – 2018 UPDATE
Functionally Obsolete Bridges
Bridges with a Posted Weight Limit
Data source: HRTPO analysis of VDOT and FHWA data.
Data as of December 2017.
HAMPTON/POQUOSON BRIDGES
Non-Deficient Bridges
LEGEND
Structurally Deficient Bridges

APPENDIX D 93
HAMPTON ROADS REGIONAL BRIDGE STUDY – 2018 UPDATE
Fair
Data source: HRTPO analysis of VDOT and FHWA data.
Data as of December 2017.
BRIDGE CONDITION
HAMPTON/POQUOSON
Poor
LEGEND
Good
Based on Federal Bridge Performance Measure Standards
Under Construction
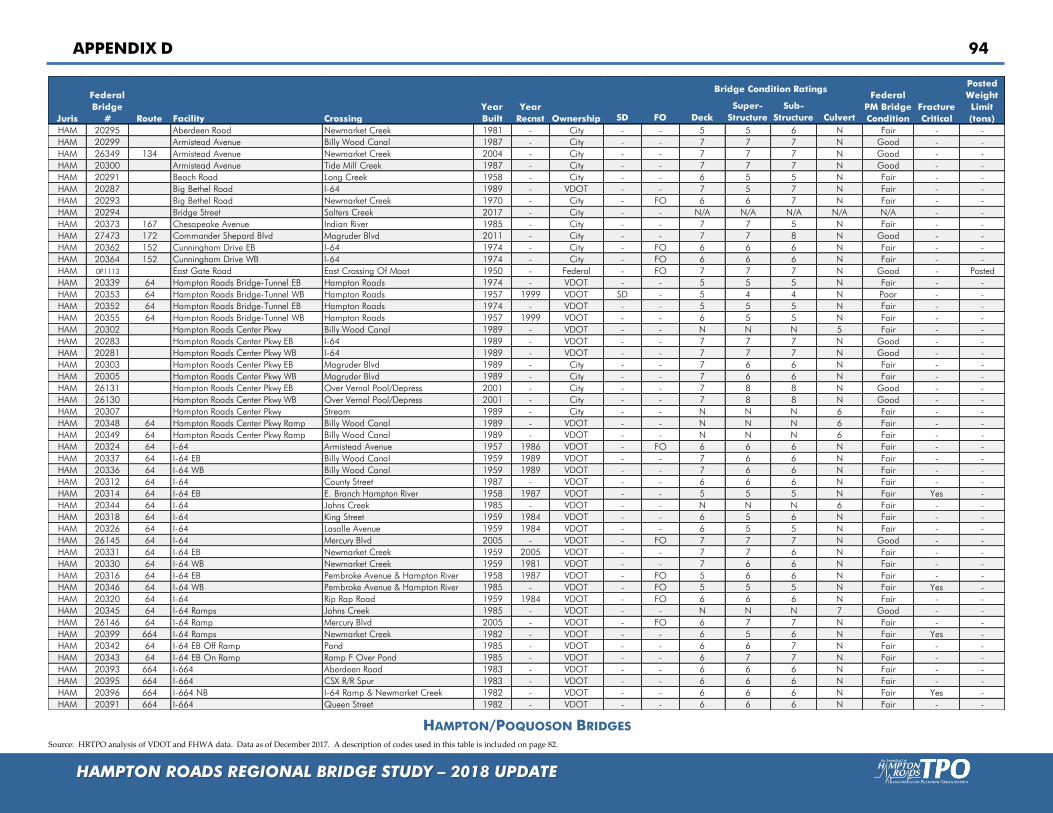
APPENDIX D 94
HAMPTON ROADS REGIONAL BRIDGE STUDY – 2018 UPDATE
SD FO Deck
Super-
Structure
Sub-
Structure Culvert
HAM 20295 Aberdeen Road Newmarket Creek 1981 - City - - 5 5 6 N Fair - -
HAM 20299 Armistead Avenue Billy Wood Canal 1987 - City - - 7 7 7 N Good - -
HAM 26349 134 Armistead Avenue Newmarket Creek 2004 - City - - 7 7 7 N Good - -
HAM 20300 Armistead Avenue Tide Mill Creek 1987 - City - - 7 7 7 N Good - -
HAM 20291 Beach Road Long Creek 1958 - City - - 6 5 5 N Fair - -
HAM 20287 Big Bethel Road I-64 1989 - VDOT - - 7 5 7 N Fair - -
HAM 20293 Big Bethel Road Newmarket Creek 1970 - City - FO 6 6 7 N Fair - -
HAM 20294 Bridge Street Salters Creek 2017 - City - - N/A N/A N/A N/A N/A - -
HAM 20373 167 Chesapeake Avenue Indian River 1985 - City - - 7 7 5 N Fair - -
HAM 27473 172 Commander Shepard Blvd Magruder Blvd 2011 - City - - 7 7 8 N Good - -
HAM 20362 152 Cunningham Drive EB I-64 1974 - City - FO 6 6 6 N Fair - -
HAM 20364 152 Cunningham Drive WB I-64 1974 - City - FO 6 6 6 N Fair - -
HAM 0P1113 East Gate Road East Crossing Of Moat 1950 - Federal - FO 7 7 7 N Good - Posted
HAM 20339 64 Hampton Roads Bridge-Tunnel EB Hampton Roads 1974 - VDOT - - 5 5 5 N Fair - -
HAM 20353 64 Hampton Roads Bridge-Tunnel WB Hampton Roads 1957 1999 VDOT SD - 5 4 4 N Poor - -
HAM 20352 64 Hampton Roads Bridge-Tunnel EB Hampton Roads 1974 - VDOT - - 5 5 5 N Fair - -
HAM 20355 64 Hampton Roads Bridge-Tunnel WB Hampton Roads 1957 1999 VDOT - - 6 5 5 N Fair - -
HAM 20302 Hampton Roads Center Pkwy Billy Wood Canal 1989 - VDOT - - N N N 5 Fair - -
HAM 20283 Hampton Roads Center Pkwy EB I-64 1989 - VDOT - - 7 7 7 N Good - -
HAM 20281 Hampton Roads Center Pkwy WB I-64 1989 - VDOT - - 7 7 7 N Good - -
HAM 20303 Hampton Roads Center Pkwy EB Magruder Blvd 1989 - City - - 7 6 6 N Fair - -
HAM 20305 Hampton Roads Center Pkwy WB Magruder Blvd 1989 - City - - 7 6 6 N Fair - -
HAM 26131 Hampton Roads Center Pkwy EB Over Vernal Pool/Depress 2001 - City - - 7 8 8 N Good - -
HAM 26130 Hampton Roads Center Pkwy WB Over Vernal Pool/Depress 2001 - City - - 7 8 8 N Good - -
HAM 20307 Hampton Roads Center Pkwy Stream 1989 - City - - N N N 6 Fair - -
HAM 20348 64 Hampton Roads Center Pkwy Ramp Billy Wood Canal 1989 - VDOT - - N N N 6 Fair - -
HAM 20349 64 Hampton Roads Center Pkwy Ramp Billy Wood Canal 1989 - VDOT - - N N N 6 Fair - -
HAM 20324 64 I-64 Armistead Avenue 1957 1986 VDOT - FO 6 6 6 N Fair - -
HAM 20337 64 I-64 EB Billy Wood Canal 1959 1989 VDOT - - 7 6 6 N Fair - -
HAM 20336 64 I-64 WB Billy Wood Canal 1959 1989 VDOT - - 7 6 6 N Fair - -
HAM 20312 64 I-64 County Street 1987 - VDOT - - 6 6 6 N Fair - -
HAM 20314 64 I-64 EB E. Branch Hampton River 1958 1987 VDOT - - 5 5 5 N Fair Yes -
HAM 20344 64 I-64 Johns Creek 1985 - VDOT - - N N N 6 Fair - -
HAM 20318 64 I-64 King Street 1959 1984 VDOT - - 6 5 6 N Fair - -
HAM 20326 64 I-64 Lasalle Avenue 1959 1984 VDOT - - 6 5 5 N Fair - -
HAM 26145 64 I-64 Mercury Blvd 2005 - VDOT - FO 7 7 7 N Good - -
HAM 20331 64 I-64 EB Newmarket Creek 1959 2005 VDOT - - 7 7 6 N Fair - -
HAM 20330 64 I-64 WB Newmarket Creek 1959 1981 VDOT - - 7 6 6 N Fair - -
HAM 20316 64 I-64 EB Pembroke Avenue & Hampton River 1958 1987 VDOT - FO 5 6 6 N Fair - -
HAM 20346 64 I-64 WB Pembroke Avenue & Hampton River 1985 - VDOT - FO 5 5 5 N Fair Yes -
HAM 20320 64 I-64 Rip Rap Road 1959 1984 VDOT - FO 6 6 6 N Fair - -
HAM 20345 64 I-64 Ramps Johns Creek 1985 - VDOT - - N N N 7 Good - -
HAM 26146 64 I-64 Ramp Mercury Blvd 2005 - VDOT - FO 6 7 7 N Fair - -
HAM 20399 664 I-64 Ramps Newmarket Creek 1982 - VDOT - - 6 5 6 N Fair Yes -
HAM 20342 64 I-64 EB Off Ramp Pond 1985 - VDOT - - 6 6 7 N Fair - -
HAM 20343 64 I-64 EB On Ramp Ramp F Over Pond 1985 - VDOT - - 6 7 7 N Fair - -
HAM 20393 664 I-664 Aberdeen Road 1983 - VDOT - - 6 6 6 N Fair - -
HAM 20395 664 I-664 CSX R/R Spur 1983 - VDOT - - 6 6 6 N Fair - -
HAM 20396 664 I-664 NB I-64 Ramp & Newmarket Creek 1982 - VDOT - - 6 6 6 N Fair Yes -
HAM 20391 664 I-664 Queen Street 1982 - VDOT - - 6 6 6 N Fair - -
Year
Recnst Ownership
Bridge Condition RatingsFederal
PM Bridge
Condition
Posted
Weight
Limit
(tons)
Fracture
Critical
Year
BuiltJuris
Federal
Bridge
# Route Facility Crossing
HAMPTON/POQUOSON BRIDGES Source: HRTPO analysis of VDOT and FHWA data. Data as of December 2017. A description of codes used in this table is included on page 82.

APPENDIX D 95
HAMPTON ROADS REGIONAL BRIDGE STUDY – 2018 UPDATE
HAMPTON/POQUOSON BRIDGES
SD FO Deck
Super-
Structure
Sub-
Structure Culvert
HAM 20400 664 I-664 VPA R/R Spur 1983 - VDOT - - 6 6 6 N Fair - -
HAM 20328 664 I-664 SB Ramp I-64 & Newmarket Creek 1981 - VDOT - FO 6 6 5 N Fair Yes -
HAM 20398 664 I-664 Ramp Newmarket Creek 1982 - VDOT - - 7 6 6 N Fair - -
HAM 25293 167 LaSalle Avenue NB Mercury Blvd 1998 - City - FO 7 8 7 N Good - -
HAM 25292 167 LaSalle Avenue SB Mercury Blvd 1998 - City - FO 7 8 7 N Good - -
HAM 20367 167 LaSalle Avenue NB Newmarket Creek 1965 - City - FO 7 6 6 N Fair - -
HAM 20368 167 LaSalle Avenue SB Newmarket Creek 1965 - City - FO 7 6 6 N Fair - -
HAM 20366 167 LaSalle Avenue Tide Mill Creek 1965 - City - - 6 6 5 N Fair - -
HAM 20358 134 Magruder Blvd Billy Wood Canal 1963 1990 City - - 6 6 6 N Fair - -
HAM 26143 134 Magruder Blvd I-64 2004 - VDOT - FO 7 7 6 N Fair - -
HAM 20279 Mallory Street I-64 1985 - VDOT - - 7 6 6 N Fair - -
HAM 20298 Mallory Street Johns Creek 1985 - City - - N N N 6 Fair - -
HAM 20361 143 Mellen Street Mill Creek 1961 1982 City - FO 5 5 6 N Fair - -
HAM 20383 258 Mercury Blvd EB Hampton Creek 1971 - City - - 7 6 6 N Fair - -
HAM 20380 258 Mercury Blvd WB Hampton Creek 1983 - City - - 7 7 7 N Good - -
HAM 20384 258 Mercury Blvd EB King St 1971 - City - - 7 7 6 N Fair - -
HAM 20386 258 Mercury Blvd WB King St 1971 - City - - 7 7 6 N Fair - -
HAM 20381 258 Mercury Blvd Mill Creek (Northern Bridge) 1989 - City - FO 6 6 7 N Fair - -
HAM 20382 258 Mercury Blvd Mill Creek (Southern Bridge) 1989 - City - FO 7 7 6 N Fair - -
HAM 25127 258 Mercury Blvd Newmarket Creek 1998 - City - - 7 7 7 N Good - -
HAM 26148 64 Mercury Blvd Ramp I-64 2005 - VDOT - - 7 7 7 N Good - -
HAM 26150 64 Mercury Blvd Ramp I-64 Ramp 2005 - VDOT - - 6 8 7 N Fair - -
HAM 26149 64 Mercury Blvd Ramp Mercury Blvd 2005 - VDOT - FO 6 6 6 N Fair - -
HAM 0P1051 North Gate Road North Crossing of Moat 1975 - Federal - - 6 5 5 N Fair - -
HAM J50170 Park Lane Rd Bethel Reservoir 1935 - Federal SD - 5 4 4 N Poor - Posted
HAM 26382 351 Pembroke Avenue Hampton Creek 2003 - City - - 7 7 7 N Good - -
HAM 20285 Pine Chapel Road I-64 1978 - VDOT - - 6 7 6 N Fair - -
HAM 20390 415 Power Plant Pkwy Newmarket Creek 1962 - City - FO 6 6 5 N Fair - -
HAM 20296 Powhatan Pkwy I-664 1983 - VDOT - - 6 5 6 N Fair - -
HAM 20292 Powhatan Pkwy Indian River 1929 1997 City - FO 7 7 6 N Fair - -
HAM 0P1049 Ruckman Road West Crossing of Moat 1952 - Federal SD - 5 5 4 N Poor - Posted
HAM 20310 60 Settlers Landing Road Hampton River 1985 - City - - 7 6 5 N Fair - -
HAM 20378 172 Wythe Creek Road Brick Kiln Creek 1981 - City - - 6 6 6 N Fair - -
Year
Recnst Ownership
Bridge Condition RatingsFederal
PM Bridge
Condition
Posted
Weight
Limit
(tons)
Fracture
Critical
Year
BuiltJuris
Federal
Bridge
# Route Facility Crossing
Source: HRTPO analysis of VDOT and FHWA data. Data as of December 2017. A description of codes used in this table is included on page 82.

APPENDIX D 96
HAMPTON ROADS REGIONAL BRIDGE STUDY – 2018 UPDATE
Functionally Obsolete Bridges
Bridges with a Posted Weight Limit
Data source: HRTPO analysis of VDOT and FHWA data.
Data as of December 2017.
ISLE OF WIGHT COUNTY
BRIDGES
Non-Deficient Bridges
LEGEND
Structurally Deficient Bridges

APPENDIX D 97
HAMPTON ROADS REGIONAL BRIDGE STUDY – 2018 UPDATE
Fair
Data source: HRTPO analysis of VDOT and FHWA data.
Data as of December 2017.
BRIDGE CONDITION
ISLE OF WIGHT COUNTY
Poor
LEGEND
Good
Based on Federal Bridge Performance Measure Standards
Under Construction

APPENDIX D 98
HAMPTON ROADS REGIONAL BRIDGE STUDY – 2018 UPDATE
ISLE OF WIGHT COUNTY BRIDGES
SD FO Deck
Super-
Structure
Sub-
Structure Culvert
IW 10392 614 Ballard Road Corrowaugh Swamp 1945 - VDOT - - 7 5 6 N Fair - 10/-/-
IW 10419 641 Barrett Town Road Antioch Swamp 1955 1984 VDOT - FO 6 5 6 N Fair - 18/-/-
IW 10418 641 Barrett Town Road Burnt Mill Swamp 1958 - VDOT - - N N N 6 Fair - -
IW 23874 646 Beale Place Drive Pope Creek 1994 - VDOT - - 7 7 8 N Good - -
IW 24600 630 Beaverdam Road Beaverdam Swamp 1996 - VDOT - - 8 8 8 N Good - -
IW 10386 603 Blackwater Road Blackwater River 1970 - VDOT - - 7 6 7 N Fair - -
IW 10385 603 Blackwater Road Horse Swamp 1968 - VDOT - - N N N 7 Good - -
IW 10423 644 Bowling Green Road Great Swamp 1972 - VDOT - - N N N 5 Fair - -
IW 10420 641 Bows & Arrows Road Ducks Swamp 1952 - VDOT SD - 6 5 6 N Fair - 12/-/-
IW 10401 620 Broadwater Road Blackwater River 1964 - VDOT - - 5 5 6 N Fair - -
IW 23500 620 Broadwater Road Villines Swamp 1992 - VDOT - - 7 7 7 N Good - -
IW 26218 691 Butler Farm Road Beaverdam Swamp 1999 - VDOT - FO 6 8 8 N Fair - -
IW 10431 654 Carroll Bridge Road Champion Swamp 1966 - VDOT - FO 5 5 5 N Fair - 18/-/-
IW 29863 B58 Carrsville Hwy Old Myrtle Road & CSX R/R 2017 - VDOT - FO 8 8 8 N Good - -
IW 22613 626 Cary Street Route 10 Bypass 1972 - VDOT - - 6 5 7 N Fair - -
IW 10421 641 Colosse Road Corrowaugh Swamp 1955 2017 VDOT - FO 7 7 6 N Fair - -
IW 10440 681 Comet Road Comet Swamp 1955 1991 VDOT - FO 8 5 7 N Fair - -
IW 10408 629 Dardens Mill Road Corrowaugh Swamp 1976 - VDOT - - N N N 6 Fair - -
IW 10378 600 Deer Path Trail Ennis Pond 1956 - VDOT - - 6 5 6 N Fair - 15/-/-
IW 10441 683 Dews Plantation Road Stallings Creek 1954 - VDOT SD - 7 5 6 N Fair - 16/-/-
IW 10442 690 Ennis Mill Road Ennis Pond 1961 - VDOT SD - 6 4 5 N Poor - 15/-/-
IW 25069 710 Fairway Drive Route 10 Bypass 1997 - VDOT - - 7 8 6 N Fair - -
IW 10424 644 Fire Tower Road Pope Swamp 1948 1979 VDOT SD - 7 4 6 N Poor - -
IW 10389 612 Freeman Drive Corrowaugh Swamp 1954 - VDOT - FO 7 5 6 N Fair - 10/-/-
IW 10427 646 Garrison Drive Burnt Mill Swamp 1945 1978 VDOT - FO 5 5 7 N Fair - 10/-/-
IW 24777 1190 Gatling Pointe Parkway Branch 1996 - VDOT - - 7 8 7 N Good - -
IW 10404 623 Green Level Road Pouches Swamp 1971 - VDOT - - 8 5 6 N Fair - -
IW 10422 641 Harvest Drive Kingsale Swamp 1955 - VDOT - FO 6 5 6 N Fair - 18/-/-
IW 10364 17 James River Bridge James River 1980 - VDOT - - 5 5 5 N Fair Yes -
IW 10443 691 Jamestown Lane CSX Railroad 1938 - VDOT - FO 6 6 6 N Fair - -
IW 10394 615 Jenkins Mill Road Kingsale Swamp 1964 1978 VDOT SD - 6 4 6 N Poor - 18/-/-
IW 10413 637 Jones Town Drive Br. Rattlesnake Swamp 1945 - VDOT - FO 6 5 7 N Fair - 15/-/-
IW 10414 637 Jones Town Drive Rattlesnake Creek 1945 - VDOT - - 8 7 6 N Fair - -
IW 10388 611 Joyner's Bridge Road Blackwater River 1984 - VDOT - - 6 7 7 N Fair - -
IW 24659 611 Joyner's Bridge Road Corrowaugh Swamp 1996 - VDOT - - 7 7 7 N Good - -
IW 10409 630 Lawerence Drive Stream 1956 2016 VDOT - - 8 8 7 N Good - -
IW 10397 616 Lee's Mill Road Beaverdam Swamp 1982 - VDOT - - 7 7 7 N Good - -
IW 26637 616 Lee's Mill Road Stream 2001 - VDOT - - N N N 7 Good - -
IW 10382 602 Longview Drive Chuckatuck Creek 1951 - VDOT SD - 7 5 6 N Fair - 9/-/-
IW 29858 602 Longview Drive Pagan Creek 2015 - VDOT - - 8 8 8 N Good - -
IW 25742 600 Lovers Lane Ennis Pond 1998 - VDOT - - N N N 7 Good - -
IW 10417 638 Mill Creek Road Burnt Mill Swamp 1951 1979 VDOT SD - 6 4 5 N Poor - -
IW 10403 621 Mill Swamp Road Mill Swamp 1952 1987 VDOT - FO 5 5 6 N Fair - 14/-/-
IW 10407 626 Mill Swamp Road Mount Holly Creek 1957 - VDOT - FO 5 5 5 N Fair - -
IW 29859 621 Mill Swamp Road Passenger Swamp 2016 - VDOT - - 8 8 8 N Good - -
IW 10406 626 Mill Swamp Road Stallings Creek 1945 - VDOT - FO 5 5 6 N Fair - 18/-/-
IW 10405 625 Modest Neck Road Rattlesnake Swamp 1970 - VDOT - - 7 6 6 N Fair - -
IW 10400 620 Muddy Cross Drive Cypress Creek 1987 - VDOT - - N N N 5 Fair - -
IW 10435 669 Nike Park Road Jones Creek 1961 - VDOT - FO 6 6 6 N Fair - -
IW 23090 10 North Church Street Pagan River 1991 - VDOT - - 6 7 7 N Fair - -
Year
BuiltJuris
Federal
Bridge
# Route Facility Crossing
Year
Recnst Ownership
Bridge Condition RatingsFederal
PM Bridge
Condition
Posted
Weight
Limit
(tons)
Fracture
Critical
Source: HRTPO analysis of VDOT and FHWA data. Data as of December 2017. A description of codes used in this table is included on page 82.

APPENDIX D 99
HAMPTON ROADS REGIONAL BRIDGE STUDY – 2018 UPDATE
ISLE OF WIGHT COUNTY BRIDGES
SD FO Deck
Super-
Structure
Sub-
Structure Culvert
IW 10411 632 Old Myrtle Road Stream 1953 1991 VDOT - FO 6 5 7 N Fair - -
IW 26219 10 Old Stage Highway Lawnes Creek 1999 - VDOT - - 8 8 8 N Good - -
IW 25258 636 Old Suffolk Road Stream 1997 - VDOT - - N N N 7 Good - -
IW 10416 637 Orbit Road Carbell Swamp 1972 - VDOT SD - N N N 4 Poor - -
IW 29856 637 Orbit Road Nuby Run 2014 - VDOT - - 7 7 8 N Good - -
IW 10429 647 Pope Swamp Trail Pope Swamp 1952 - VDOT - FO 6 5 6 N Fair - 17/-/-
IW 10446 696 Pruden Road Beaverdam Swamp 1977 - VDOT - - N N N 6 Fair - -
IW 24466 681 Raynor Road Rattlesnake Swamp 1996 - VDOT - - 8 8 8 N Good - -
IW 26753 704 Rescue Road Jones Creek 2004 - VDOT - - 8 8 8 N Good - -
IW 27434 704 Rescue Road Stream 2004 - VDOT - FO 8 8 8 N Good - -
IW 24214 614 River Run Trail Ducks Swamp 1995 - VDOT - - 7 7 7 N Good - -
IW 22618 10 Route 10 Bypass Cypress Creek 1973 - VDOT - - 6 6 6 N Fair - -
IW 22617 10 Route 10 Bypass Pagan River 1973 - VDOT - - 6 6 6 N Fair - -
IW 26640 258 Route 258 Beaverdam Swamp 2002 - VDOT - - 7 8 7 N Good - -
IW 26643 258 Route 258 Beaverdam Swamp 2002 - VDOT - - 7 8 7 N Good - -
IW 10371 258 Route 258 Champion Swamp 1932 1976 VDOT - - 5 5 5 N Fair - -
IW 10370 258 Route 258 Great Swamp 1952 1980 VDOT - - 6 5 5 N Fair - -
IW 26651 258 Route 258 Lee's Mill Road 2002 - VDOT - - 7 8 7 N Good - -
IW 26649 258 Route 258 Norfolk Southern R/R 2001 - VDOT - - 7 8 7 N Good - -
IW 26650 258 Route 258 Trib Beaverdam Swamp 2003 - VDOT - - N N N 7 Good - -
IW 10377 460 Route 460 Blackwater River 1987 - VDOT - - 5 5 6 N Fair - -
IW 10398 620 Scotts Factory Road Champion Swamp 1976 - VDOT - FO 7 5 7 N Fair - -
IW 10384 603 Shiloh Drive Ennis Pond 1955 - VDOT - FO 7 5 6 N Fair - 12/-/-
IW 22615 10 South Church Street Cypress Creek 1975 - VDOT SD - 5 4 6 N Poor - -
IW 30284 680 Stallings Creek Drive Stallings Creek 2016 - VDOT - - 8 8 8 N Good - -
IW 10390 614 Thomas Woods Trail Antioch Swamp 1987 - VDOT - - 7 7 7 N Good - -
IW 10393 614 Thomas Woods Trail Blackwater River 1970 - VDOT - - N N N 5 Fair - -
IW 10434 668 Titus Creek Drive Titus Creek 1966 - VDOT - FO 6 6 6 N Fair - -
IW 10430 649 Tomlin Hill Road Pope Creek 1999 - VDOT - - N N N 8 Good - -
IW 10373 656 Union Camp Drive Beaverdam Swamp 1986 - VDOT - - 7 7 7 N Good - -
IW 10445 692 Uzzell Church Road Champion Swamp 1951 1979 VDOT SD - 5 4 4 N Poor - 11/-/-
IW 29488 Whippingham Parkway Ragged Island Creek 2017 - VDOT - - N/A N/A N/A N/A N/A - -
IW 10381 600 Woodland Drive Great Swamp 1967 - VDOT - - 7 5 5 N Fair - 15/-/-
IW 10436 677 Wrenns Mill Road Wrenns Mill Spillway 1946 1987 VDOT - FO 6 5 6 N Fair - -
IW 10426 645 Yellow Hammer Road Norfolk Southern R/R 1984 - VDOT - - 6 6 6 N Fair - -
Year
BuiltJuris
Federal
Bridge
# Route Facility Crossing
Year
Recnst Ownership
Bridge Condition RatingsFederal
PM Bridge
Condition
Posted
Weight
Limit
(tons)
Fracture
Critical
Source: HRTPO analysis of VDOT and FHWA data. Data as of December 2017. A description of codes used in this table is included on page 82.

APPENDIX D 100
HAMPTON ROADS REGIONAL BRIDGE STUDY – 2018 UPDATE
Functionally Obsolete Bridges
Bridges with a Posted Weight Limit
Data source: HRTPO analysis of VDOT and FHWA data.
Data as of December 2017.
JAMES CITY COUNTY &
WILLIAMSBURG BRIDGES
Non-Deficient Bridges
LEGEND
Structurally Deficient Bridges
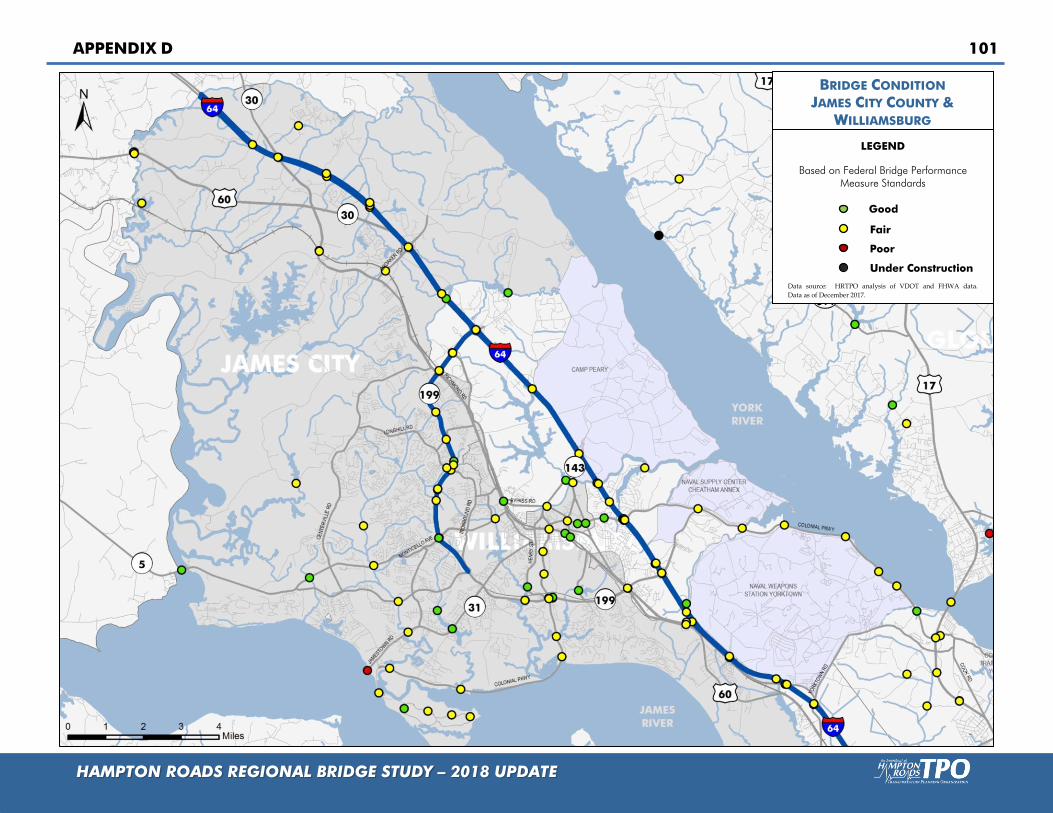
APPENDIX D 101
HAMPTON ROADS REGIONAL BRIDGE STUDY – 2018 UPDATE
Fair
Data source: HRTPO analysis of VDOT and FHWA data.
Data as of December 2017.
BRIDGE CONDITION
JAMES CITY COUNTY &
WILLIAMSBURG
Poor
LEGEND
Good
Based on Federal Bridge Performance Measure Standards
Under Construction
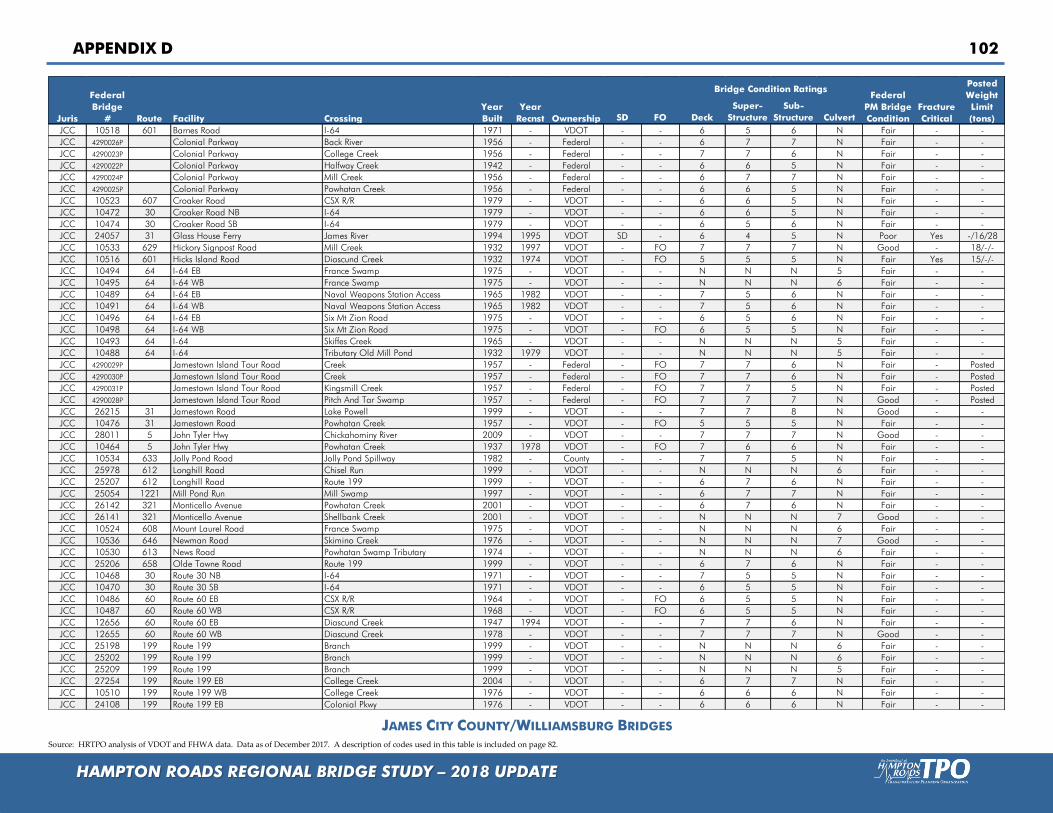
APPENDIX D 102
HAMPTON ROADS REGIONAL BRIDGE STUDY – 2018 UPDATE
SD FO Deck
Super-
Structure
Sub-
Structure Culvert
JCC 10518 601 Barnes Road I-64 1971 - VDOT - - 6 5 6 N Fair - -
JCC 4290026P Colonial Parkway Back River 1956 - Federal - - 6 7 7 N Fair - -
JCC 4290023P Colonial Parkway College Creek 1956 - Federal - - 7 7 6 N Fair - -
JCC 4290022P Colonial Parkway Halfway Creek 1942 - Federal - - 6 6 5 N Fair - -
JCC 4290024P Colonial Parkway Mill Creek 1956 - Federal - - 6 7 7 N Fair - -
JCC 4290025P Colonial Parkway Powhatan Creek 1956 - Federal - - 6 6 5 N Fair - -
JCC 10523 607 Croaker Road CSX R/R 1979 - VDOT - - 6 6 5 N Fair - -
JCC 10472 30 Croaker Road NB I-64 1979 - VDOT - - 6 6 5 N Fair - -
JCC 10474 30 Croaker Road SB I-64 1979 - VDOT - - 6 5 6 N Fair - -
JCC 24057 31 Glass House Ferry James River 1994 1995 VDOT SD - 6 4 5 N Poor Yes -/16/28
JCC 10533 629 Hickory Signpost Road Mill Creek 1932 1997 VDOT - FO 7 7 7 N Good - 18/-/-
JCC 10516 601 Hicks Island Road Diascund Creek 1932 1974 VDOT - FO 5 5 5 N Fair Yes 15/-/-
JCC 10494 64 I-64 EB France Swamp 1975 - VDOT - - N N N 5 Fair - -
JCC 10495 64 I-64 WB France Swamp 1975 - VDOT - - N N N 6 Fair - -
JCC 10489 64 I-64 EB Naval Weapons Station Access 1965 1982 VDOT - - 7 5 6 N Fair - -
JCC 10491 64 I-64 WB Naval Weapons Station Access 1965 1982 VDOT - - 7 5 6 N Fair - -
JCC 10496 64 I-64 EB Six Mt Zion Road 1975 - VDOT - - 6 5 6 N Fair - -
JCC 10498 64 I-64 WB Six Mt Zion Road 1975 - VDOT - FO 6 5 5 N Fair - -
JCC 10493 64 I-64 Skiffes Creek 1965 - VDOT - - N N N 5 Fair - -
JCC 10488 64 I-64 Tributary Old Mill Pond 1932 1979 VDOT - - N N N 5 Fair - -
JCC 4290029P Jamestown Island Tour Road Creek 1957 - Federal - FO 7 7 6 N Fair - Posted
JCC 4290030P Jamestown Island Tour Road Creek 1957 - Federal - FO 7 7 6 N Fair - Posted
JCC 4290031P Jamestown Island Tour Road Kingsmill Creek 1957 - Federal - FO 7 7 5 N Fair - Posted
JCC 4290028P Jamestown Island Tour Road Pitch And Tar Swamp 1957 - Federal - FO 7 7 7 N Good - Posted
JCC 26215 31 Jamestown Road Lake Powell 1999 - VDOT - - 7 7 8 N Good - -
JCC 10476 31 Jamestown Road Powhatan Creek 1957 - VDOT - FO 5 5 5 N Fair - -
JCC 28011 5 John Tyler Hwy Chickahominy River 2009 - VDOT - - 7 7 7 N Good - -
JCC 10464 5 John Tyler Hwy Powhatan Creek 1937 1978 VDOT - FO 7 6 6 N Fair - -
JCC 10534 633 Jolly Pond Road Jolly Pond Spillway 1982 - County - - 7 7 5 N Fair - -
JCC 25978 612 Longhill Road Chisel Run 1999 - VDOT - - N N N 6 Fair - -
JCC 25207 612 Longhill Road Route 199 1999 - VDOT - - 6 7 6 N Fair - -
JCC 25054 1221 Mill Pond Run Mill Swamp 1997 - VDOT - - 6 7 7 N Fair - -
JCC 26142 321 Monticello Avenue Powhatan Creek 2001 - VDOT - - 6 7 6 N Fair - -
JCC 26141 321 Monticello Avenue Shellbank Creek 2001 - VDOT - - N N N 7 Good - -
JCC 10524 608 Mount Laurel Road France Swamp 1975 - VDOT - - N N N 6 Fair - -
JCC 10536 646 Newman Road Skimino Creek 1976 - VDOT - - N N N 7 Good - -
JCC 10530 613 News Road Powhatan Swamp Tributary 1974 - VDOT - - N N N 6 Fair - -
JCC 25206 658 Olde Towne Road Route 199 1999 - VDOT - - 6 7 6 N Fair - -
JCC 10468 30 Route 30 NB I-64 1971 - VDOT - - 7 5 5 N Fair - -
JCC 10470 30 Route 30 SB I-64 1971 - VDOT - - 6 5 5 N Fair - -
JCC 10486 60 Route 60 EB CSX R/R 1964 - VDOT - FO 6 5 5 N Fair - -
JCC 10487 60 Route 60 WB CSX R/R 1968 - VDOT - FO 6 5 5 N Fair - -
JCC 12656 60 Route 60 EB Diascund Creek 1947 1994 VDOT - - 7 7 6 N Fair - -
JCC 12655 60 Route 60 WB Diascund Creek 1978 - VDOT - - 7 7 7 N Good - -
JCC 25198 199 Route 199 Branch 1999 - VDOT - - N N N 6 Fair - -
JCC 25202 199 Route 199 Branch 1999 - VDOT - - N N N 6 Fair - -
JCC 25209 199 Route 199 Branch 1999 - VDOT - - N N N 5 Fair - -
JCC 27254 199 Route 199 EB College Creek 2004 - VDOT - - 6 7 7 N Fair - -
JCC 10510 199 Route 199 WB College Creek 1976 - VDOT - - 6 6 6 N Fair - -
JCC 24108 199 Route 199 EB Colonial Pkwy 1976 - VDOT - - 6 6 6 N Fair - -
Year
BuiltJuris
Federal
Bridge
# Route Facility Crossing
Year
Recnst Ownership
Bridge Condition RatingsFederal
PM Bridge
Condition
Posted
Weight
Limit
(tons)
Fracture
Critical
JAMES CITY COUNTY/WILLIAMSBURG BRIDGES Source: HRTPO analysis of VDOT and FHWA data. Data as of December 2017. A description of codes used in this table is included on page 82.

APPENDIX D 103
HAMPTON ROADS REGIONAL BRIDGE STUDY – 2018 UPDATE
SD FO Deck
Super-
Structure
Sub-
Structure Culvert
JCC 10508 199 Route 199 WB Colonial Pkwy 1976 - VDOT - FO 6 6 6 N Fair - -
JCC 25210 199 Route 199 Long Hill Swamp 1999 - VDOT - - N N N 5 Fair - -
JCC 25512 199 Route 199 NB Monticello Avenue 1999 - VDOT - - 7 7 7 N Good - -
JCC 25513 199 Route 199 SB Monticello Avenue 1999 - VDOT - FO 7 7 7 N Good - -
JCC 25201 199 Route 199 Over Branch 1999 - VDOT - - N N N 7 Good - -
JCC 24224 199 Route 199 NB Routes 60 & 603 & CSX R/R 1995 - VDOT - - 6 7 7 N Fair - -
JCC 24228 199 Route 199 SB Routes 60 & 603 & CSX R/R 1995 - VDOT - FO 6 7 7 N Fair - -
JCC 25208 199 Route 199 Stream 1999 - VDOT - - N N N 7 Good - -
JCC 10511 199 Route 199 EB Tour Road 1976 - VDOT - FO 7 7 7 N Good - -
JCC 10513 199 Route 199 WB Tour Road 1976 - VDOT - FO 7 7 7 N Good - -
JCC 10531 622 Stewarts Road Branch Of Diascund Creek 1937 1997 VDOT - FO 6 7 7 N Fair - -
JCC 10532 622 Stewarts Road Diascund Creek 1937 1997 VDOT - FO 6 7 6 N Fair - -
Year
BuiltJuris
Federal
Bridge
# Route Facility Crossing
Year
Recnst Ownership
Bridge Condition RatingsFederal
PM Bridge
Condition
Posted
Weight
Limit
(tons)
Fracture
Critical
JAMES CITY COUNTY/WILLIAMSBURG BRIDGES BRIDGES
SD FO Deck
Super-
Structure
Sub-
Structure Culvert
WMB 22335 60 Bypass Road CSX R/R 1934 1981 City - - 7 7 7 N Good - -
WMB 22328 Capitol Landing Road CSX R/R 1977 - City - FO 7 7 8 N Good - -
WMB 4290040P Colonial Parkway Papermill Creek 2007 - Federal - - N N N 6 Fair - -
WMB 22337 132 Henry Street South Papermill Creek 1976 - City - - N N N 7 Good - -
WMB 4290019P Lafayette Street Colonial Parkway 1936 - Federal - FO N 6 7 N Fair - -
WMB 22338 143 Merrimac Trail Colonial Parkway 1948 - City - FO 7 7 7 N Good - -
WMB 22342 Monticello Avenue Stream 1963 - VDOT - - 5 5 6 N Fair - -
WMB 4290020P Newport Avenue Colonial Parkway 1957 - Federal - FO N 6 6 N Fair - -
WMB 4290018P 60 Page Street Colonial Parkway 1936 - Federal - FO N 6 7 N Fair - -
WMB 22336 60 Page Street CSX R/R 1935 1967 City - - 7 7 7 N Good - -
WMB 4290016P Parkway Drive Colonial Parkway 1972 - Federal - - N 7 7 N Good - -
WMB 23768 Quarterpath Road Tutters Neck Pond 1993 - City - FO 7 7 8 N Good - -
Year
BuiltJuris
Federal
Bridge
# Route Facility Crossing
Year
Recnst Ownership
Bridge Condition RatingsFederal
PM Bridge
Condition
Posted
Weight
Limit
(tons)
Fracture
Critical
Source: HRTPO analysis of VDOT and FHWA data. Data as of December 2017. A description of codes used in this table is included on page 82.

APPENDIX D 104
HAMPTON ROADS REGIONAL BRIDGE STUDY – 2018 UPDATE
Functionally Obsolete Bridges
Bridges with a Posted Weight Limit
Data source: HRTPO analysis of VDOT and FHWA data.
Data as of December 2017.
NEWPORT NEWS BRIDGES
Non-Deficient Bridges
LEGEND
Structurally Deficient Bridges

APPENDIX D 105
HAMPTON ROADS REGIONAL BRIDGE STUDY – 2018 UPDATE
Fair
Data source: HRTPO analysis of VDOT and FHWA data.
Data as of December 2017.
BRIDGE CONDITION
NEWPORT NEWS
Poor
LEGEND
Good
Based on Federal Bridge Performance Measure Standards
Under Construction
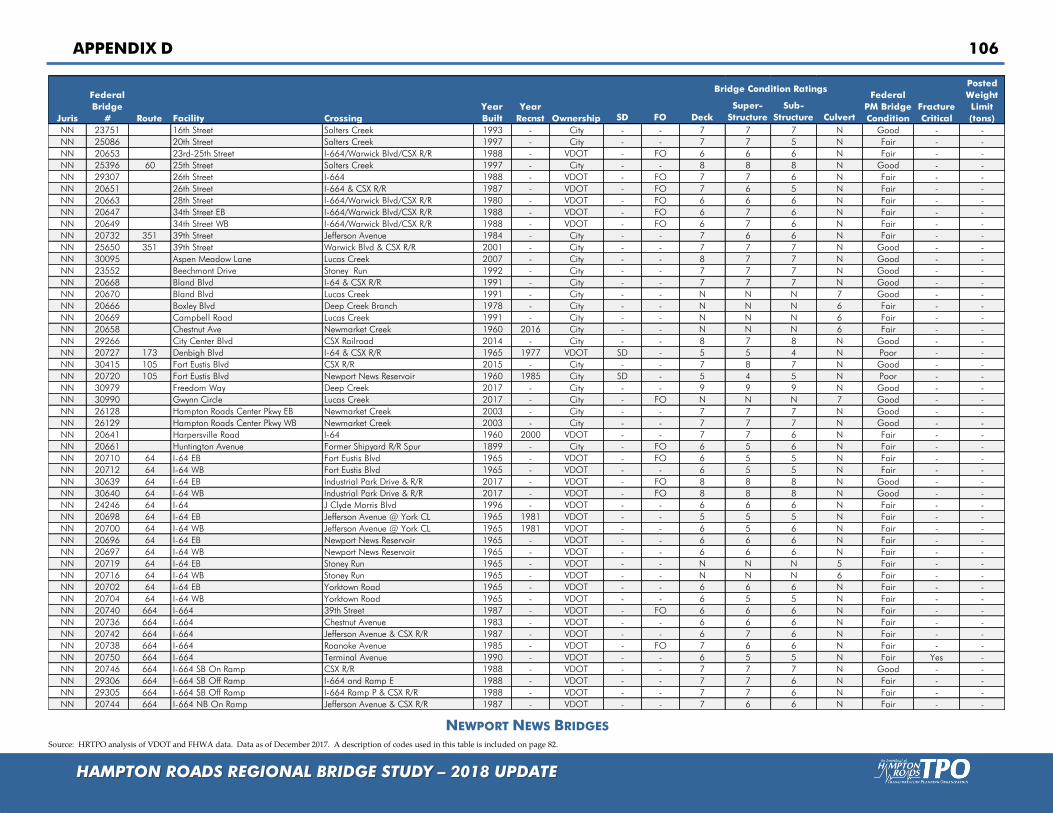
APPENDIX D 106
HAMPTON ROADS REGIONAL BRIDGE STUDY – 2018 UPDATE
SD FO Deck
Super-
Structure
Sub-
Structure Culvert
NN 23751 16th Street Salters Creek 1993 - City - - 7 7 7 N Good - -
NN 25086 20th Street Salters Creek 1997 - City - - 7 7 5 N Fair - -
NN 20653 23rd-25th Street I-664/Warwick Blvd/CSX R/R 1988 - VDOT - FO 6 6 6 N Fair - -
NN 25396 60 25th Street Salters Creek 1997 - City - - 8 8 8 N Good - -
NN 29307 26th Street I-664 1988 - VDOT - FO 7 7 6 N Fair - -
NN 20651 26th Street I-664 & CSX R/R 1987 - VDOT - FO 7 6 5 N Fair - -
NN 20663 28th Street I-664/Warwick Blvd/CSX R/R 1980 - VDOT - FO 6 6 6 N Fair - -
NN 20647 34th Street EB I-664/Warwick Blvd/CSX R/R 1988 - VDOT - FO 6 7 6 N Fair - -
NN 20649 34th Street WB I-664/Warwick Blvd/CSX R/R 1988 - VDOT - FO 6 7 6 N Fair - -
NN 20732 351 39th Street Jefferson Avenue 1984 - City - - 7 6 6 N Fair - -
NN 25650 351 39th Street Warwick Blvd & CSX R/R 2001 - City - - 7 7 7 N Good - -
NN 30095 Aspen Meadow Lane Lucas Creek 2007 - City - - 8 7 7 N Good - -
NN 23552 Beechmont Drive Stoney Run 1992 - City - - 7 7 7 N Good - -
NN 20668 Bland Blvd I-64 & CSX R/R 1991 - City - - 7 7 7 N Good - -
NN 20670 Bland Blvd Lucas Creek 1991 - City - - N N N 7 Good - -
NN 20666 Boxley Blvd Deep Creek Branch 1978 - City - - N N N 6 Fair - -
NN 20669 Campbell Road Lucas Creek 1991 - City - - N N N 6 Fair - -
NN 20658 Chestnut Ave Newmarket Creek 1960 2016 City - - N N N 6 Fair - -
NN 29266 City Center Blvd CSX Railroad 2014 - City - - 8 7 8 N Good - -
NN 20727 173 Denbigh Blvd I-64 & CSX R/R 1965 1977 VDOT SD - 5 5 4 N Poor - -
NN 30415 105 Fort Eustis Blvd CSX R/R 2015 - City - - 7 8 7 N Good - -
NN 20720 105 Fort Eustis Blvd Newport News Reservoir 1960 1985 City SD - 5 4 5 N Poor - -
NN 30979 Freedom Way Deep Creek 2017 - City - - 9 9 9 N Good - -
NN 30990 Gwynn Circle Lucas Creek 2017 - City - FO N N N 7 Good - -
NN 26128 Hampton Roads Center Pkwy EB Newmarket Creek 2003 - City - - 7 7 7 N Good - -
NN 26129 Hampton Roads Center Pkwy WB Newmarket Creek 2003 - City - - 7 7 7 N Good - -
NN 20641 Harpersville Road I-64 1960 2000 VDOT - - 7 7 6 N Fair - -
NN 20661 Huntington Avenue Former Shipyard R/R Spur 1899 - City - FO 6 5 6 N Fair - -
NN 20710 64 I-64 EB Fort Eustis Blvd 1965 - VDOT - FO 6 5 5 N Fair - -
NN 20712 64 I-64 WB Fort Eustis Blvd 1965 - VDOT - - 6 5 5 N Fair - -
NN 30639 64 I-64 EB Industrial Park Drive & R/R 2017 - VDOT - FO 8 8 8 N Good - -
NN 30640 64 I-64 WB Industrial Park Drive & R/R 2017 - VDOT - FO 8 8 8 N Good - -
NN 24246 64 I-64 J Clyde Morris Blvd 1996 - VDOT - - 6 6 6 N Fair - -
NN 20698 64 I-64 EB Jefferson Avenue @ York CL 1965 1981 VDOT - - 5 5 5 N Fair - -
NN 20700 64 I-64 WB Jefferson Avenue @ York CL 1965 1981 VDOT - - 6 5 6 N Fair - -
NN 20696 64 I-64 EB Newport News Reservoir 1965 - VDOT - - 6 6 6 N Fair - -
NN 20697 64 I-64 WB Newport News Reservoir 1965 - VDOT - - 6 6 6 N Fair - -
NN 20719 64 I-64 EB Stoney Run 1965 - VDOT - - N N N 5 Fair - -
NN 20716 64 I-64 WB Stoney Run 1965 - VDOT - - N N N 6 Fair - -
NN 20702 64 I-64 EB Yorktown Road 1965 - VDOT - - 6 6 6 N Fair - -
NN 20704 64 I-64 WB Yorktown Road 1965 - VDOT - - 6 5 5 N Fair - -
NN 20740 664 I-664 39th Street 1987 - VDOT - FO 6 6 6 N Fair - -
NN 20736 664 I-664 Chestnut Avenue 1983 - VDOT - - 6 6 6 N Fair - -
NN 20742 664 I-664 Jefferson Avenue & CSX R/R 1987 - VDOT - - 6 7 6 N Fair - -
NN 20738 664 I-664 Roanoke Avenue 1985 - VDOT - FO 7 6 6 N Fair - -
NN 20750 664 I-664 Terminal Avenue 1990 - VDOT - - 6 5 5 N Fair Yes -
NN 20746 664 I-664 SB On Ramp CSX R/R 1988 - VDOT - - 7 7 7 N Good - -
NN 29306 664 I-664 SB Off Ramp I-664 and Ramp E 1988 - VDOT - - 7 7 6 N Fair - -
NN 29305 664 I-664 SB Off Ramp I-664 Ramp P & CSX R/R 1988 - VDOT - - 7 7 6 N Fair - -
NN 20744 664 I-664 NB On Ramp Jefferson Avenue & CSX R/R 1987 - VDOT - - 7 6 6 N Fair - -
Year
Recnst Ownership
Bridge Condition RatingsFederal
PM Bridge
Condition
Posted
Weight
Limit
(tons)
Fracture
Critical
Year
BuiltJuris
Federal
Bridge
# Route Facility Crossing
NEWPORT NEWS BRIDGES Source: HRTPO analysis of VDOT and FHWA data. Data as of December 2017. A description of codes used in this table is included on page 82.

APPENDIX D 107
HAMPTON ROADS REGIONAL BRIDGE STUDY – 2018 UPDATE
SD FO Deck
Super-
Structure
Sub-
Structure Culvert
NN 20748 664 I-664 SB Off Ramp Jefferson Avenue & CSX R/R 1987 - VDOT - - 6 7 6 N Fair - -
NN 20759 664 I-664 Ramp Ramp A 1990 - VDOT - FO 6 6 6 N Fair - -
NN 20756 664 I-664 Off Ramp Ramp B 1990 - VDOT - - 6 6 7 N Fair - -
NN 20757 664 I-664 SB On Ramp Ramp GH 1990 - VDOT - - 6 6 7 N Fair - -
NN 20761 664 I-664 Ramp Terminal Avenue 1990 - VDOT - FO 7 7 6 N Fair Yes -
NN 20754 664 I-664 On Ramp Terminal Avenue & CSX R/R 1990 - VDOT - - 6 6 7 N Fair Yes -
NN 20678 17 J Clyde Morris Blvd Big Bethel Reservoir 1932 1949 City - - N N N 7 Good - -
NN 20730 312 J Clyde Morris Blvd Lake Maury Trib 1958 1975 City - - N N N 6 Fair - -
NN 20731 312 J Clyde Morris Blvd NB CSX R/R 1975 - City - FO 5 5 6 N Fair - -
NN 20729 312 J Clyde Morris Blvd SB CSX R/R 1958 1975 City - FO 6 6 6 N Fair - -
NN 20677 17 Jefferson Avenue Government Ditch 1966 - City - - N N N 6 Fair - -
NN 25809 143 Jefferson Avenue I-64 2000 - VDOT - FO 7 7 7 N Good - -
NN 25178 143 Jefferson Avenue Trib Stoney Run 1997 - City - - N N N 7 Good - -
NN 30094 Knolls Drive Lucas Creek 2007 - City - - 8 8 7 N Good - -
NN 26954 Lucas Creek Road Lucas Creek 2001 - City - - 7 7 7 N Good - -
NN 20725 152 Main Street Newmarket Creek 1968 - City - - N N N 6 Fair - -
NN 20671 17 Mercury Blvd EB CSX R/R 1938 1992 City - - 6 6 7 N Fair - -
NN 20672 17 Mercury Blvd WB CSX R/R 1967 1992 City - - 7 7 7 N Good - -
NN 20673 17 Mercury Blvd EB Warwick Road 1967 1992 City - - 6 6 6 N Fair - -
NN 20675 17 Mercury Blvd WB Warwick Road 1967 1992 City - - 6 6 6 N Fair - -
NN 20752 664 Monitor-Merrimac Bridge-Tunnel NB Hampton Roads-James River 1990 - VDOT - - 6 6 5 N Fair - -
NN 20753 664 Monitor-Merrimac Bridge-Tunnel SB Hampton Roads-James River 1990 - VDOT - - 7 5 5 N Fair - -
NN 24986 Old Courthouse Way Stoney Run 1997 - City - - 8 7 7 N Good - -
NN 20643 Old Oyster Point Road I-64 1991 - VDOT - FO 6 7 6 N Fair - -
NN 20667 Oyster Point Road CSX R/R 1981 - City - - 6 6 6 N Fair - -
NN 20645 171 Oyster Point Road I-64 1990 - VDOT - - 7 7 6 N Fair - -
NN 29405 664 Ramp E I-664 1988 - VDOT - - 5 6 6 N Fair - -
NN 29406 664 Ramp H CSX R/R & I-664 SB Ramp G 1988 - VDOT - - 6 7 6 N Fair - -
NN 29494 664 Ramp K Ramp P 1996 - VDOT - - 6 6 7 N Fair - -
NN 29493 664 Ramp M Ramp P 1996 - VDOT - - 7 6 6 N Fair - -
NN 29495 664 Ramp N 35th Street 1996 - VDOT - - 7 6 6 N Fair - -
NN 20747 664 Ramp To 35th Street CSX R/R 1987 - VDOT - - 6 7 6 N Fair - -
NN 28191 Shellabarger Rd Warwick River 2005 - City - - 7 7 7 N Good - -
NN 20685 60 Warwick Blvd Br Deep Creek 1974 - City - - N N N 6 Fair - -
NN 20687 60 Warwick Blvd EB Fort Eustis Blvd 1984 - City - - 7 7 6 N Fair - -
NN 20681 60 Warwick Blvd WB Fort Eustis Blvd 1960 1985 City - FO 7 6 6 N Fair - -
NN 20684 60 Warwick Blvd Government Ditch 1931 - City - - N N N 5 Fair - -
NN 20679 60 Warwick Blvd Lake Maury 1931 1960 City SD - 5 4 5 N Poor - -
NN 20686 60 Warwick Blvd Lucas Creek 1981 - City - - N N N 7 Good - -
NN 20683 60 Warwick Blvd Stoney Run 1968 - City - - N N N 6 Fair - -
NN 20680 60 Warwick Blvd Warwick River 1984 - City - - N N N 7 Good - -
NN 20689 60 Warwick Blvd EB Warwick WB Ramp To Ft Eustis 1984 - City - - 7 6 6 N Fair - -
NN 20659 Washington Avenue Former Shipyard R/R Spur 1946 - City - FO 7 8 8 N Good - -
Year
Recnst Ownership
Bridge Condition RatingsFederal
PM Bridge
Condition
Posted
Weight
Limit
(tons)
Fracture
Critical
Year
BuiltJuris
Federal
Bridge
# Route Facility Crossing
NEWPORT NEWS BRIDGES
Source: HRTPO analysis of VDOT and FHWA data. Data as of December 2017. A description of codes used in this table is included on page 82.

APPENDIX D 108
HAMPTON ROADS REGIONAL BRIDGE STUDY – 2018 UPDATE
Functionally Obsolete Bridges
Bridges with a Posted Weight Limit
Data source: HRTPO analysis of VDOT and FHWA data.
Data as of December 2017.
NORFOLK BRIDGES
Non-Deficient Bridges
LEGEND
Structurally Deficient Bridges

APPENDIX D 109
HAMPTON ROADS REGIONAL BRIDGE STUDY – 2018 UPDATE
Fair
Data source: HRTPO analysis of VDOT and FHWA data.
Data as of December 2017.
BRIDGE CONDITION
NORFOLK
Poor
LEGEND
Good
Based on Federal Bridge Performance Measure Standards
Under Construction

APPENDIX D 110
HAMPTON ROADS REGIONAL BRIDGE STUDY – 2018 UPDATE
NORFOLK BRIDGES
SD FO Deck
Super-
Structure
Sub-
Structure Culvert
NOR 20943 247 26th Street Lafayette River 1938 - City - FO 5 6 6 N Fair - -
NOR 21021 337 Admiral Taussig Blvd I-564 Ramps 1977 - VDOT - FO 5 5 5 N Fair - -
NOR 20781 407 Berkley Avenue EB Norfolk Southern R/R 1985 - City - FO 6 6 7 N Fair - -
NOR 20782 Berkley Avenue WB Norfolk Southern R/R 1985 - City - FO 6 6 7 N Fair - -
NOR 20961 264 Berkley Avenue Ramp Emergency Vehicle Ramp 1988 - VDOT - FO 7 8 6 N Fair - -
NOR 20805 58 Brambleton Avenue WB Hampton Blvd 1962 - Private - FO 6 6 6 N Fair - -
NOR 20804 58 Brambleton Avenue Smith Creek @ The Hague 1962 - City - - 7 6 7 N Fair - -
NOR 20936 460 Campostella Road E Br Elizabeth River 1986 - City - - 6 5 5 N Fair - -
NOR 20944 247 Chesapeake Blvd Wayne Creek 1978 - City - - N N N 6 Fair - -
NOR 20773 Colley Avenue Lafayette River 1978 - City - - 6 5 6 N Fair - -
NOR 20768 First View Street Tidewater Drive 1958 - City - FO 6 6 6 N Fair - -
NOR 20764 Frontage Road I-264 1967 - VDOT - FO 5 5 6 N Fair - -
NOR 20770 Government Avenue Tidewater Drive 1956 - City - FO 6 6 7 N Fair - -
NOR 21040 460 Granby Street Lafayette River 1979 - City - - 5 5 5 N Fair - -
NOR 30075 460 Granby Street Masons Creek 1936 2012 City - - N N N 7 Good - -
NOR 21034 460 Granby Street Tidewater Drive 1958 - City - FO 5 6 6 N Fair - -
NOR 21024 337 Hampton Blvd NB Lafayette River 1970 - City - FO 6 5 6 N Fair - -
NOR 21023 337 Hampton Blvd SB Lafayette River 1994 - City - - 7 7 7 N Good - -
NOR 21019 337 Hampton Blvd SB Ramp Hampton Blvd NB 1962 - Private - FO 6 6 5 N Fair - -
NOR 20931 64 I-64 EB 4th View Street 1975 - VDOT - - 6 5 6 N Fair - -
NOR 20929 64 I-64 WB 4th View Street 1975 - VDOT - - 7 5 6 N Fair - -
NOR 20909 64 I-64 EB 13th View Street 1972 - VDOT - FO 6 5 6 N Fair - -
NOR 20911 64 I-64 WB 13th View Street 1972 - VDOT - FO 5 5 5 N Fair - -
NOR 20831 64 I-64 EB Azalea Garden Road 1966 - VDOT - - 6 5 5 N Fair - -
NOR 20833 64 I-64 WB Azalea Garden Road 1966 - VDOT - - 7 5 5 N Fair - -
NOR 23067 64 I-64 HOV Lanes Azalea Garden Road 1992 - VDOT - - 7 7 7 N Good - -
NOR 20866 64 I-64 EB Bay Coast Railroad 1967 - VDOT - - 5 5 5 N Fair - -
NOR 20867 64 I-64 WB Bay Coast Railroad 1967 - VDOT - - 5 5 5 N Fair - -
NOR 23073 64 I-64 HOV Lanes Bay Coast Railroad 1992 - VDOT - - 7 7 7 N Good - -
NOR 20921 64 I-64 EB Bay View Blvd 1974 - VDOT - - 6 7 6 N Fair - -
NOR 20919 64 I-64 WB Bay View Blvd 1974 - VDOT - - 6 7 7 N Fair - -
NOR 20819 64 I-64 EB Chesapeake Blvd 1965 1977 VDOT - - 6 6 6 N Fair - -
NOR 20821 64 I-64 WB Chesapeake Blvd 1965 1977 VDOT - - 5 6 6 N Fair - -
NOR 23134 64 I-64 HOV Lanes Chesapeake Blvd 1992 - VDOT - - 6 7 7 N Fair - -
NOR 20887 64 I-64 EB Curlew Dr & HRT Light R/R 1968 - VDOT - - 6 6 5 N Fair - -
NOR 20889 64 I-64 WB Curlew Dr & HRT Light R/R 1968 1992 VDOT - - 7 6 5 N Fair - -
NOR 23342 64 I-64 HOV Lanes Curlew Dr & HRT Light R/R 1992 - VDOT - FO 7 7 7 N Good - -
NOR 20925 64 I-64 EB Evans Street 1974 - VDOT - - 6 5 5 N Fair - -
NOR 20923 64 I-64 WB Evans Street 1974 - VDOT - - 6 5 5 N Fair - -
NOR 20850 64 I-64 EB First View Street 1975 - VDOT - - 6 5 6 N Fair - -
NOR 20839 64 I-64 WB First View Street 1975 - VDOT - - 7 5 5 N Fair - -
NOR 20902 64 I-64 EB Granby Street 1971 1991 VDOT - - 7 7 5 N Fair - -
NOR 20904 64 I-64 WB Granby Street 1971 - VDOT - - 6 6 5 N Fair - -
NOR 23133 64 I-64 HOV Lanes Granby Street 1992 - VDOT - - 7 7 7 N Good - -
NOR 23191 64 I-64 HOV Lanes I-64 WB 1992 - VDOT - - 7 7 6 N Fair Yes -
NOR 20883 64 I-64 EB I-264 EB 1968 - VDOT - - 6 6 6 N Fair - -
NOR 20885 64 I-64 WB I-264 EB 1968 1992 VDOT - - 6 6 7 N Fair - -
NOR 23306 64 I-64 HOV Lanes I-264 EB 1992 - VDOT - FO 7 7 7 N Good - -
NOR 20879 64 I-64 EB I-264 WB 1968 1985 VDOT - FO 7 7 7 N Good - -
NOR 20881 64 I-64 WB I-264 WB 1968 1992 VDOT - FO 7 6 7 N Fair - -
Year
Recnst Ownership
Bridge Condition RatingsFederal
PM Bridge
Condition
Posted
Weight
Limit
(tons)
Fracture
Critical
Year
BuiltJuris
Federal
Bridge
# Route Facility Crossing
Source: HRTPO analysis of VDOT and FHWA data. Data as of December 2017. A description of codes used in this table is included on page 82.

APPENDIX D 111
HAMPTON ROADS REGIONAL BRIDGE STUDY – 2018 UPDATE
SD FO Deck
Super-
Structure
Sub-
Structure Culvert
NOR 23304 64 I-64 HOV Lanes I-264 WB 1992 - VDOT - FO 7 8 7 N Good - -
NOR 20900 64 I-64 EB I-564 NB 1971 - VDOT - - 6 5 6 N Fair - -
NOR 23214 64 I-64 HOV Lanes I-564 & Little Creek Road 1992 - VDOT - FO 6 6 7 N Fair Yes -
NOR 20862 64 I-64 EB Kempsville Road 1967 1986 VDOT - - 6 5 5 N Fair - -
NOR 20864 64 I-64 WB Kempsville Road 1967 1991 VDOT - - 7 6 5 N Fair - -
NOR 23284 64 I-64 HOV Lanes Kempsville Road 1992 - VDOT - - 7 8 7 N Good - -
NOR 20871 64 I-64 Lake Taylor 1966 - VDOT - - N N N 7 Good - -
NOR 20892 64 I-64 EB Little Creek Road 1971 - VDOT - - 6 6 5 N Fair - -
NOR 20894 64 I-64 WB Little Creek Road 1971 - VDOT - - 6 5 6 N Fair - -
NOR 20928 64 I-64 EB Mason Creek 1974 - VDOT - - 5 5 6 N Fair - -
NOR 20927 64 I-64 WB Mason Creek 1974 - VDOT - - 5 5 6 N Fair - -
NOR 20825 64 I-64 EB Mason Creek Road 1975 - VDOT - - 7 5 5 N Fair - -
NOR 20823 64 I-64 WB Mason Creek Road 1975 - VDOT - - 7 5 5 N Fair - -
NOR 20835 64 I-64 EB Military Hwy 1966 - VDOT - - 6 6 6 N Fair - -
NOR 20837 64 I-64 WB Military Hwy 1966 - VDOT - FO 5 6 5 N Fair - -
NOR 23068 64 I-64 HOV Lanes Military Hwy 1992 - VDOT - - 7 7 7 N Good - -
NOR 20917 64 I-64 EB New Gate Road 1974 - VDOT - - 5 5 5 N Fair - -
NOR 20915 64 I-64 WB New Gate Road 1974 - VDOT - - 6 5 5 N Fair - -
NOR 20858 64 I-64 EB Northampton Blvd 1967 1977 VDOT - FO 5 5 5 N Fair - -
NOR 20860 64 I-64 WB Northampton Blvd 1967 1977 VDOT - FO 5 5 5 N Fair - -
NOR 23074 64 I-64 HOV Lanes Northampton Blvd 1992 - VDOT - - 7 7 7 N Good - -
NOR 20873 64 I-64 EB Oasts Creek & Bay Ave 1975 - VDOT - - 5 5 6 N Fair - -
NOR 20869 64 I-64 WB Oasts Creek & Bay Ave 1975 - VDOT - - 5 5 6 N Fair - -
NOR 20852 64 I-64 EB Ramp From Northampton Blvd 1967 1977 VDOT - FO 7 6 6 N Fair - -
NOR 20854 64 I-64 WB Ramp From Northampton Blvd 1964 1977 VDOT - - 5 6 6 N Fair - -
NOR 23132 64 I-64 HOV Lanes Ramp From Northampton Blvd 1992 - VDOT - - 7 8 7 N Good - -
NOR 20845 64 I-64 EB Ramp From Tidewater Drive 1967 - VDOT - FO 6 5 6 N Fair - -
NOR 23302 64 I-64 HOV Lanes Ramp From Tidewater Drive 1992 - VDOT - FO 6 6 7 N Fair - -
NOR 20827 64 I-64 EB Robin Hood Road 1966 - VDOT - - 6 6 5 N Fair - -
NOR 20829 64 I-64 WB Robin Hood Road 1966 - VDOT - - 6 6 5 N Fair - -
NOR 23061 64 I-64 HOV Lanes Robin Hood Road 1992 - VDOT - - 7 7 7 N Good - -
NOR 20815 64 I-64 EB Sewells Point Road 1965 1977 VDOT - FO 5 5 5 N Fair - -
NOR 20817 64 I-64 WB Sewells Point Road 1965 - VDOT - - 5 5 5 N Fair - -
NOR 23059 64 I-64 HOV Lanes Sewells Point Road 1992 - VDOT - FO 6 6 7 N Fair - -
NOR 20841 64 I-64 EB Tidewater Drive 1967 1977 VDOT - - 7 6 5 N Fair - -
NOR 20843 64 I-64 WB Tidewater Drive 1967 1985 VDOT - - 7 5 5 N Fair - -
NOR 23217 64 I-64 HOV Lanes Tidewater Drive 1992 - VDOT - - 6 7 7 N Fair - -
NOR 20875 64 I-64 EB Va Beach Blvd 1968 1986 VDOT - FO 5 5 5 N Fair - -
NOR 20877 64 I-64 WB Va Beach Blvd 1968 1992 VDOT - FO 6 5 5 N Fair - -
NOR 23272 64 I-64 HOV Lanes Va Beach Blvd 1992 - VDOT - FO 6 7 7 N Fair - -
NOR 20913 64 I-64 EB Willoughby Bay 1972 - VDOT - - 5 5 5 N Fair - -
NOR 20914 64 I-64 WB Willoughby Bay 1972 - VDOT - - 5 5 5 N Fair - -
NOR 20898 64 I-64 EB Ramp I-64 WB Ramp at Tidewater Dr 1971 - VDOT - FO 7 6 7 N Fair - -
NOR 23186 64 I-64 HOV Ramp I-64 WB & I-264 & Ramps 1992 - VDOT - - 6 6 6 N Fair Yes -
NOR 20994 264 I-64 EB Ramp I-264 EB 1968 - VDOT - - 6 6 6 N Fair - -
NOR 20996 264 I-64 WB Ramp I-264 WB 1968 - VDOT - FO 7 6 6 N Fair - -
NOR 20856 64 I-64 EB Ramp Northampton Blvd 1967 - VDOT - - 5 5 6 N Fair - -
NOR 20896 64 I-64 EB Ramp Thole Street 1972 - VDOT - - 7 7 6 N Fair - -
NOR 20906 64 I-64 EB Ramp Trib. Of Lafayette River 1967 - VDOT - - N N N 6 Fair - -
NOR 20847 64 I-64 WB Ramp Trib. Of Lafayette River 1967 - VDOT - - N N N 7 Good - -
Year
Recnst Ownership
Bridge Condition RatingsFederal
PM Bridge
Condition
Posted
Weight
Limit
(tons)
Fracture
Critical
Year
BuiltJuris
Federal
Bridge
# Route Facility Crossing
NORFOLK BRIDGES Source: HRTPO analysis of VDOT and FHWA data. Data as of December 2017. A description of codes used in this table is included on page 82.

APPENDIX D 112
HAMPTON ROADS REGIONAL BRIDGE STUDY – 2018 UPDATE
SD FO Deck
Super-
Structure
Sub-
Structure Culvert
NOR 21002 264 I-264 EB Ballentine Avenue 1968 1998 VDOT - FO 6 6 5 N Fair - -
NOR 21004 264 I-264 WB Ballentine Avenue 1968 1998 VDOT - FO 6 6 5 N Fair - -
NOR 20998 264 I-264 Brambleton Avenue 1968 1998 VDOT - - 6 6 6 N Fair - -
NOR 20981 264 I-264 EB Broad Creek 1967 1998 VDOT - - 6 6 5 N Fair - -
NOR 20982 264 I-264 WB Broad Creek 1967 2000 VDOT - - 6 6 5 N Fair - -
NOR 20979 264 I-264 WB City Hall Avenue 1991 - VDOT - - 7 6 7 N Fair Yes -
NOR 21011 264 I-264 Claiborne Avenue 1972 1998 VDOT - - 6 6 6 N Fair - -
NOR 20962 264 I-264 EB E Br Elizabeth River 1990 - VDOT - - 6 6 6 N Fair Yes -
NOR 20947 264 I-264 WB E Br Elizabeth River 1952 1991 VDOT - FO 6 6 5 N Fair Yes -
NOR 20992 264 I-264 EB Holt Street & N/S R/R 1972 1990 VDOT - FO 5 6 6 N Fair - -
NOR 21000 264 I-264 WB Holt Street & N/S R/R 1972 1991 VDOT - FO 5 5 5 N Fair Yes -
NOR 21008 264 I-264 EB HRT Light R/R 1968 1998 VDOT - - 6 6 6 N Fair - -
NOR 21009 264 I-264 WB HRT Light R/R 1968 1998 VDOT - - 6 6 5 N Fair - -
NOR 20971 264 I-264 EB I-264 EB Ramp 1990 - VDOT - FO 7 7 5 N Fair Yes -
NOR 20955 264 I-264 WB I-264 & I-464 Ramps 1988 - Private - FO 7 8 6 N Fair - -
NOR 20953 264 I-264 EB & I-464 NB I-264 & I-464 Ramps 1986 - Private - FO 7 8 6 N Fair - -
NOR 20983 264 I-264 EB Ingleside Road 1967 1998 VDOT - - 6 7 5 N Fair - -
NOR 20985 264 I-264 WB Ingleside Road 1967 1998 VDOT - - 7 7 5 N Fair - -
NOR 20795 264 I-264 EB Kempsville Road 1967 1983 VDOT - FO 7 5 6 N Fair - -
NOR 20793 264 I-264 WB Kempsville Road 1967 1992 VDOT - FO 6 6 6 N Fair - -
NOR 20963 264 I-264 EB Main Street 1990 - VDOT - - 6 6 6 N Fair - -
NOR 20797 264 I-264 Newtown Road 1967 1983 VDOT - - 6 6 6 N Fair - -
NOR 21006 264 I-264 EB Norfolk Southern R/R 1968 1998 VDOT - - 7 6 5 N Fair - -
NOR 21007 264 I-264 WB Norfolk Southern R/R 1968 1998 VDOT - - 7 6 5 N Fair - -
NOR 21013 264 I-264 Park Avenue 1972 1998 VDOT - - 6 6 6 N Fair - -
NOR 20975 264 I-264 WB SR 337 SB 1972 1990 VDOT - - 7 6 6 N Fair - -
NOR 20969 264 I-264 Ramp City Hall Avenue 1990 - VDOT - - 7 6 7 N Fair - -
NOR 20977 264 I-264 Ramp City Hall Avenue 1972 1990 VDOT - - 6 6 7 N Fair - -
NOR 20978 264 I-264 WB Ramp City Hall Avenue 1991 - VDOT - - 7 6 7 N Fair - -
NOR 23046 460 I-264 WB Ramp City Hall Avenue 1952 1991 VDOT - FO 6 6 5 N Fair - -
NOR 21032 460 I-264 EB Ramp East Street 1990 - VDOT - - 6 7 6 N Fair - -
NOR 20973 264 I-264 Ramp Holt Street & NS R/R 1990 - VDOT - FO 7 6 7 N Fair - -
NOR 20813 64 I-264 EB Ramp I-264 WB & I-64 1985 - VDOT - FO 5 6 6 N Fair - -
NOR 20959 264 I-264 WB Ramp I-264 WB 1988 - VDOT - FO 6 8 6 N Fair - -
NOR 21030 460 I-264 NB Ramp I-264 WB & City Hall Avenue 1990 - VDOT - - 7 7 6 N Fair - -
NOR 20957 264 I-264 & I-464 Ramps I-264 EB 1986 - VDOT - FO 6 8 6 N Fair - -
NOR 20967 264 I-264 EB Ramp Main Street 1990 - VDOT - - 7 6 6 N Fair - -
NOR 21037 460 I-264 Ramp Waterside Drive 1990 - VDOT - FO 7 7 6 N Fair - -
NOR 21053 464 I-464 NB Berkley Avenue 1988 - VDOT - FO 6 7 6 N Fair - -
NOR 21055 464 I-464 SB Berkley Avenue 1988 - VDOT - - 6 7 5 N Fair - -
NOR 21045 464 I-464 NB Buchanan St & N&P R/R 1988 - VDOT - - 6 6 6 N Fair - -
NOR 21047 464 I-464 SB Buchanan St & N&P R/R 1988 - VDOT - - 7 7 6 N Fair - -
NOR 21065 464 I-464 SB Emergency Vehicle Ramp 1988 - VDOT - FO 7 8 6 N Fair - -
NOR 21057 464 I-464 SB I-264 EB 1987 - VDOT - FO 7 8 6 N Fair - -
NOR 21061 464 I-464 SB I-264 WB 1989 - VDOT - - 7 7 6 N Fair - -
NOR 21063 464 I-464 SB I-264 WB Ramp 1988 - VDOT - - 7 7 6 N Fair - -
NOR 21051 464 I-464 SB I-264 & I-464 Ramps 1988 - VDOT - FO 7 8 7 N Good - -
NOR 21059 464 I-464 NB I-464 SB Ramp 1987 - VDOT - - 6 8 5 N Fair - -
NOR 21041 464 I-464 NB South Main Street 1988 - VDOT - - 7 7 6 N Fair - -
NOR 21043 464 I-464 SB South Main Street 1988 - VDOT - - 7 7 5 N Fair - -
Year
Recnst Ownership
Bridge Condition RatingsFederal
PM Bridge
Condition
Posted
Weight
Limit
(tons)
Fracture
Critical
Year
BuiltJuris
Federal
Bridge
# Route Facility Crossing
NORFOLK BRIDGES Source: HRTPO analysis of VDOT and FHWA data. Data as of December 2017. A description of codes used in this table is included on page 82.

APPENDIX D 113
HAMPTON ROADS REGIONAL BRIDGE STUDY – 2018 UPDATE
SD FO Deck
Super-
Structure
Sub-
Structure Culvert
NOR 21049 464 I-464 Ramp I-464 SB Ramp 1989 - Private - - 7 8 7 N Good - -
NOR 21067 564 I-564 Boush Creek 1977 - VDOT - - N N N 7 Good - -
NOR 21074 564 I-564 NB Granby Street 1972 - VDOT - FO 5 5 5 N Fair - -
NOR 21072 564 I-564 SB Granby Street 1972 1991 VDOT - FO 7 6 5 N Fair - -
NOR 21070 564 I-564 NB Little Creek Road 1971 - VDOT - - 6 5 6 N Fair - -
NOR 23216 564 I-564 HOV Lanes Little Creek Road 1992 - VDOT - FO 7 7 7 N Good - -
NOR 21068 564 I-564 Ramp I-64 & I-564 1990 - VDOT - FO 5 6 6 N Fair - -
NOR 25187 407 Indian River Road Steamboat Creek 1998 - City - - 6 7 7 N Fair - -
NOR 21028 406 Int Terminal Blvd EB I-564 & N/S R/R 1975 - VDOT - - 6 6 5 N Fair - -
NOR 21026 406 Int Terminal Blvd WB I-564 & N/S R/R 1975 - VDOT - FO 5 5 5 N Fair - -
NOR 30488 Kimball Terrace Ohio Creek 2014 - City - - 8 8 8 N Good - -
NOR 20934 165 Little Creek Road Tidewater Drive 1959 2014 City - FO 7 7 7 N Good - -
NOR 20787 13 Military Highway Branch of Broad Creek 1945 - City - - N N N 5 Fair - -
NOR 20790 13 Military Highway Curlew Dr & HRT Light R/R 1943 1999 City - - 6 6 6 N Fair - -
NOR 24817 13 Military Highway NB E Br Elizabeth River 1996 - City - - 6 7 6 N Fair - -
NOR 24819 13 Military Highway SB E Br Elizabeth River 1996 - City - - 6 6 6 N Fair - -
NOR 26334 13 Military Highway I-264 2000 - VDOT - FO 6 7 7 N Fair - -
NOR 25327 13 Military Highway Va Beach Blvd 1999 - City - FO 6 6 6 N Fair - -
NOR 20777 North Shore Road Branch Of Lafayette River 1979 - City - - 6 5 6 N Fair - -
NOR 20778 North Shore Road Branch Of Lafayette River 1979 - City - FO 5 5 5 N Fair - -
NOR 24432 13 Northampton Blvd NB Lake Wright 1995 - City - - 7 8 7 N Good - -
NOR 24433 13 Northampton Blvd SB Lake Wright 1995 - City - - 7 8 7 N Good - -
NOR 23313 247 Norview Avenue I-64 1992 - VDOT - - 6 7 6 N Fair - -
NOR 20775 Norview Avenue Lake Whitehurst 1975 - City - - 6 6 6 N Fair - -
NOR 26010 Norview Avenue Rinda Creek 1999 - City - - 5 6 7 N Fair - -
NOR 20811 60 Ocean View Avenue EB Tidewater Drive 1958 - City SD - 4 5 5 N Poor - -
NOR 20767 Robin Hood Road Norfolk Water Supply Canal 1944 1987 City - FO 6 5 5 N Fair - -
NOR 20809 60 Shore Drive Lake Whitehurst 1984 - City - - N N N 6 Fair - -
NOR 26314 60 Shore Drive Little Creek 2002 - City - - 6 6 7 N Fair - -
NOR 20774 337 SR 337 NB & Ramp Adjacent To Structure #21000 1972 1990 VDOT - - 5 6 5 N Fair - -
NOR 20766 Thole Street Branch of Lafayette River 1967 - City - - N N N 6 Fair - -
NOR 20938 168 Tidewater Drive Lafayette River 1985 2007 City - - 7 7 6 N Fair - -
NOR 20939 168 Tidewater Drive Norfolk Southern R/R 1960 - City - - 5 5 5 N Fair - -
NOR 20942 168 Tidewater Drive Trib of Lafayette River 1967 - VDOT - - N N N 7 Good - -
NOR 20937 168 Tidewater Drive Wayne Creek 1985 2003 City - - 6 7 7 N Fair - -
NOR 24793 58 Va Beach Blvd Broad Creek 1996 - City - - 6 6 7 N Fair - -
NOR 24148 58 Va Beach Blvd Norfolk Southern R/R 1995 - City - - 5 6 6 N Fair - -
NOR 20949 337 Waterside Drive EB East Main Street 1972 1990 VDOT - FO 7 6 6 N Fair - -
NOR 20776 Willow Wood Drive Branch of Lafayette River 1987 - City - FO 6 6 5 N Fair - -
Year
Recnst Ownership
Bridge Condition RatingsFederal
PM Bridge
Condition
Posted
Weight
Limit
(tons)
Fracture
Critical
Year
BuiltJuris
Federal
Bridge
# Route Facility Crossing
NORFOLK BRIDGES
Source: HRTPO analysis of VDOT and FHWA data. Data as of December 2017. A description of codes used in this table is included on page 82.
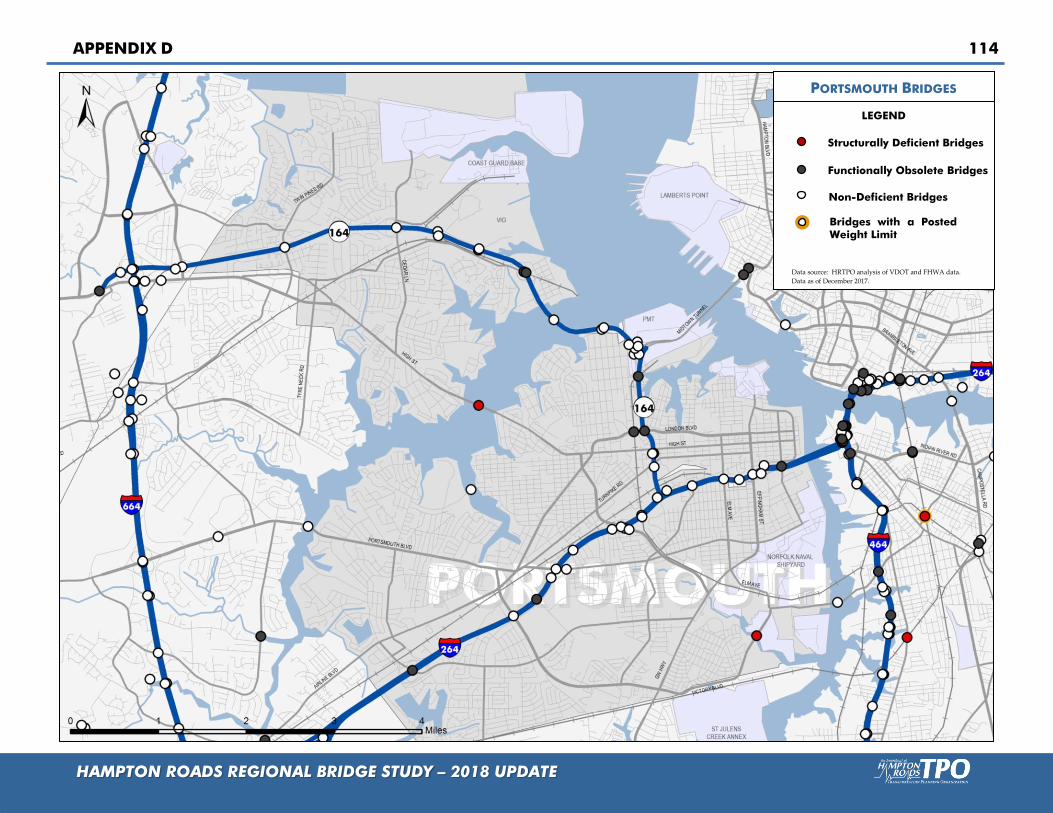
APPENDIX D 114
HAMPTON ROADS REGIONAL BRIDGE STUDY – 2018 UPDATE
Functionally Obsolete Bridges
Bridges with a Posted Weight Limit
Data source: HRTPO analysis of VDOT and FHWA data.
Data as of December 2017.
PORTSMOUTH BRIDGES
Non-Deficient Bridges
LEGEND
Structurally Deficient Bridges

APPENDIX D 115
HAMPTON ROADS REGIONAL BRIDGE STUDY – 2018 UPDATE
Fair
Data source: HRTPO analysis of VDOT and FHWA data.
Data as of December 2017.
BRIDGE CONDITION
PORTSMOUTH
Poor
LEGEND
Good
Based on Federal Bridge Performance Measure Standards
Under Construction

APPENDIX D 116
HAMPTON ROADS REGIONAL BRIDGE STUDY – 2018 UPDATE
SD FO Deck
Super-
Structure
Sub-
Structure Culvert
PORT 21197 Cedar Lane Route 164 1989 - VDOT - - 6 7 7 N Fair - -
PORT 26832 Clifford Street Baines Creek 2005 - City - - 8 8 7 N Good - -
PORT 21193 Court Street I-264 WB 1951 1990 VDOT - FO 7 7 7 N Good - -
PORT 21190 Greenwood Drive I-264 1976 - VDOT - FO 6 6 6 N Fair - -
PORT 21199 17 High Street W Br Elizabeth River 1951 1975 City SD - 5 5 4 N Poor - -
PORT 21233 264 I-264 Des Moines Avenue 1964 2016 Private - - 5 6 5 N Fair - -
PORT 21240 264 I-264 Effingham Street 1966 1985 Private - - 6 6 6 N Fair - -
PORT 21244 264 I-264 Elm Avenue 1966 1985 Private - - 6 5 5 N Fair - -
PORT 21229 264 I-264 Frederick Blvd 1964 1979 VDOT - - 6 5 5 N Fair - -
PORT 21220 264 I-264 Mclean Avenue 1964 1979 VDOT - FO 6 6 6 N Fair - -
PORT 21224 264 I-264 Norfolk & Portsmouth R/R 1964 2016 VDOT - - 5 5 5 N Fair Yes -
PORT 21225 264 I-264 Portsmouth Blvd 1964 1991 VDOT - - 6 5 5 N Fair - -
PORT 21231 264 I-264 Portsmouth Blvd Ramp 1964 1979 VDOT - - 6 5 5 N Fair - -
PORT 21235 264 I-264 Ramp From Frederick Blvd 1964 1979 VDOT - - 6 5 6 N Fair - -
PORT 21218 264 I-264 Rodman Avenue 1964 - VDOT - - 6 6 6 N Fair - -
PORT 21237 264 I-264 Victory Blvd 1963 1979 VDOT - - 6 5 6 N Fair - -
PORT 21242 264 I-264 WB Ramp From Effingham Street 1966 1985 Private - - 5 5 5 N Fair Yes -
PORT 21248 264 I-264 EB Off Ramp Ramp To EB Downtown Tunnel 1985 - Private - - 7 6 6 N Fair - -
PORT 21222 264 I-264 EB Ramp Frederick Blvd 1964 - VDOT - - 6 6 5 N Fair - -
PORT 21227 264 I-264 EB Ramp Portsmouth Blvd 1964 - VDOT - - 6 6 6 N Fair - -
PORT 21246 264 I-264 WB On Ramp Ramp From I-264 WB 1985 - Private - - 6 7 6 N Fair - -
PORT 21202 58 London Boulevard MLK Freeway 1971 - City - FO 7 6 7 N Fair - -
PORT 21200 58 London Boulevard N&P R/R & Virginia Ave 1971 - City - FO 7 6 8 N Fair - -
PORT 26653 58 MLK Freeway Cleveland Street & CSX R/R 2005 - Private - FO 6 7 6 N Fair - -
PORT 30133 164 MLK Fwy - Mainline I-264, Columbus, High, R/R 2016 - Private - - 7 7 8 N Good - -
PORT 30136 164 MLK Fwy - Ramp EN Frederick Blvd 2016 - Private - - 8 7 8 N Good - -
PORT 30137 164 MLK Fwy - Ramp EN Norfolk & Portsmouth R/R 2016 - Private - - 8 7 8 N Good - -
PORT 30134 MLK Fwy - Ramp N Pond 2016 - Private - - 7 8 8 N Good - -
PORT 30135 16 MLK Fwy - Ramp S Pond 2016 - Private - - 8 8 8 N Good - -
PORT 30139 MLK Fwy - Ramp SW Unknown 2016 - Private - - 7 7 8 N Good - -
PORT 30138 164 MLK Fwy - Ramp WN Unknown 2016 - Private - - 7 7 7 N Good - -
PORT 21208 164 Route 164 EB Former Coast Guard Blvd 1991 - VDOT - - 6 6 6 N Fair Yes -
PORT 21206 164 Route 164 WB Former Coast Guard Blvd 1991 - VDOT - - 6 5 6 N Fair Yes -
PORT 28376 164 Route 164 WB MLK Fwy & Western Freeway & PMT 2006 - Private - - 7 7 7 N Good - -
PORT 28384 164 Route 164 EB Portsmouth Marine Terminal 2006 - Private - - 7 7 7 N Good - -
PORT 28239 164 Route 164 EB VIG Blvd 2006 - VDOT - - 6 7 7 N Fair - -
PORT 28241 164 Route 164 WB VIG Blvd 2006 - VDOT - - 6 8 7 N Fair - -
PORT 21215 164 Route 164 W Br Elizabeth River 1978 - VDOT - - 6 5 6 N Fair - -
PORT 27133 164 Route 164 EB W Br Elizabeth River 2006 - VDOT - - 7 7 7 N Good - -
PORT 28217 164 Route 164 WB W Br Elizabeth River 2006 - VDOT - - 7 7 7 N Good - -
PORT 21210 164 Route 164 EB West Norfolk Road & N/S R/R 1991 - VDOT - FO 6 6 7 N Fair - -
PORT 21212 164 Route 164 WB West Norfolk Road & N/S R/R 1991 - VDOT - FO 6 7 7 N Fair - -
PORT 28396 164 Route 164 EB Ramp to Midtown Tunnel MLK Freeway WB & PMT 2006 - Private - - 7 7 7 N Good - -
PORT 28350 164 Route 164 WB Ramp from Cleveland St MLK Freeway & PMT 2006 - Private - - 7 7 7 N Good - -
PORT 28349 164 Route 164 EB Ramp to Cleveland St Portsmouth Marine Terminal 2006 - Private - - 7 7 7 N Good - -
PORT 28348 164 Route 164 Ramp from WB Route 58 Portsmouth Marine Terminal 2006 - Private - - 7 7 7 N Good - -
PORT 21195 Town Point Road Route 164 1989 - VDOT - - 6 7 7 N Fair - -
PORT 21217 239 Victory Blvd Paradise Creek 1944 - City SD - 5 5 4 N Poor - -
Year
Recnst Ownership
Bridge Condition RatingsFederal
PM Bridge
Condition
Posted
Weight
Limit
(tons)
Fracture
Critical
Year
BuiltJuris
Federal
Bridge
# Route Facility Crossing
PORTSMOUTH BRIDGES
Source: HRTPO analysis of VDOT and FHWA data. Data as of December 2017. A description of codes used in this table is included on page 82.

APPENDIX D 117
HAMPTON ROADS REGIONAL BRIDGE STUDY – 2018 UPDATE
Functionally Obsolete Bridges
Bridges with a Posted Weight Limit
Data source: HRTPO analysis of VDOT and FHWA data.
Data as of December 2017.
SOUTHAMPTON/FRANKLIN
BRIDGES
Non-Deficient Bridges
LEGEND
Structurally Deficient Bridges

APPENDIX D 118
HAMPTON ROADS REGIONAL BRIDGE STUDY – 2018 UPDATE
Fair
Data source: HRTPO analysis of VDOT and FHWA data.
Data as of December 2017.
BRIDGE CONDITION
SOUTHAMPTON/FRANKLIN
Poor
LEGEND
Good
Based on Federal Bridge Performance Measure Standards
Under Construction

APPENDIX D 119
HAMPTON ROADS REGIONAL BRIDGE STUDY – 2018 UPDATE
SOUTHAMPTON COUNTY/FRANKLIN BRIDGES
Source: HRTPO analysis of VDOT and FHWA data. Data as of December 2017. A description of codes used in this table is included on page 82.
SD FO Deck
Super-
Structure
Sub-
Structure Culvert
SH 17785 615 Adams Grove Road Browns Branch 1932 - VDOT SD - 8 5 6 N Fair - 10/-/-
SH 17786 615 Adams Grove Road Three Creek 1957 - VDOT - - 6 7 6 N Fair - -
SH 17804 626 Appleton Road Round Hill Swamp 1978 - VDOT - - N N N 6 Fair - -
SH 17835 652 Barhams Hill Road Angelico Creek 1932 - VDOT - - 7 7 6 N Fair - -
SH 17877 677 Barns Church Cir Branch 1932 - VDOT - - 7 5 6 N Fair - -
SH 17801 622 Bell Road Seacock Swamp 1963 - VDOT - - 7 7 6 N Fair - -
SH 17821 640 Berea Church Road Branch 1932 - VDOT - - 7 7 6 N Fair - -
SH 17815 635 Black Creek Road Black Creek 1956 - VDOT - - 7 7 6 N Fair - -
SH 17816 635 Black Creek Road Branch 1983 - VDOT - - 7 7 6 N Fair - -
SH 17847 658 Blackhead Signpost Road Mill Swamp 1965 - VDOT - - 7 7 6 N Fair - -
SH 25493 655 Brandy Pond Road Hornet Swamp 1998 - VDOT - - N N N 7 Good - -
SH 17843 655 Brandy Pond Road Three Creek 1973 - VDOT - - 6 7 6 N Fair - -
SH 17838 652 Buckhorn Quarter Road Buckhorn Swamp 1963 - VDOT SD - 7 4 6 N Poor - 18/-/-
SH 17797 619 Burdette Road Black Creek 1932 1983 VDOT - FO 7 5 5 N Fair - 14/-/-
SH 17798 619 Burdette Road Blackwater River 1983 - VDOT - - 7 7 7 N Good - -
SH 17901 743 Burnt Reed Road Tarrara Creek 1932 1997 VDOT SD - 7 4 6 N Poor - -
SH 26227 606 Cabin Point Road Branch 2000 - VDOT - - N N N 7 Good - -
SH 17892 702 Cabin Pond Road Branch Rosa Swamp 1972 - VDOT - - N N N 6 Fair - -
SH 29234 58 Camp Parkway Blackwater River 2009 - VDOT - - 7 7 7 N Good - -
SH 17841 653 Carys Bridge Road Nottoway River 1954 - VDOT - - 5 5 5 N Fair - -
SH 17839 653 Carys Bridge Road Overflow Nottoway River 1969 - VDOT - - N N N 6 Fair - -
SH 17846 658 Cedar View Road Angelico Creek 1932 2010 VDOT - FO 7 7 7 N Good - -
SH 17862 668 Clarksbury Road Rosa Swamp 1973 - VDOT - - N N N 5 Fair - -
SH 17861 668 Clarksbury Road Tarrara Creek 1969 2008 VDOT - - 7 7 5 N Fair - -
SH 17802 623 Clayton Road Seacock Swamp 1968 - VDOT - - 6 5 7 N Fair - -
SH 17823 642 Cobb Road Branch 1978 - VDOT - - N N N 5 Fair - -
SH 17831 649 Country Club Road Branch 1976 - VDOT - - N N N 6 Fair - -
SH 17832 649 Country Club Road Nottoway Swamp 1965 - VDOT - - 7 7 6 N Fair - -
SH 17854 665 Cross Keys Road Deal Swamp 1975 2013 VDOT - - N N N 7 Good - -
SH 17796 618 Crumpler Road Terrapin Swamp 1962 - VDOT SD - 7 4 7 N Poor - 24/-/-
SH 17824 643 Darden Scout Road Branch 1974 - VDOT - - N N N 6 Fair - -
SH 17825 643 Darden Scout Road Branch 1975 - VDOT - - N N N 5 Fair - -
SH 17856 665 Davis Lane Vicks Creek 1987 - VDOT - - 7 7 7 N Good - -
SH 17889 687 Delaware Road Route 58 1979 - VDOT - - 7 5 6 N Fair - -
SH 24615 600 Doles Road Branch 1996 - VDOT - - N N N 6 Fair - -
SH 17820 638 Drake Road Johnsons Mill 1961 - VDOT SD - 6 4 6 N Poor - 14/-/-
SH 29357 607 Farmers Bridge Road Assamoosic Swamp 2009 - VDOT - - N N N 7 Good - -
SH 17767 607 Farmers Bridge Road Assamoosic Swamp 1932 - VDOT - FO 7 5 5 N Fair - 10/-/-
SH 17776 611 Flaggy Run Road Flaggy Run 1967 - VDOT - - 7 8 6 N Fair - -
SH 17780 612 Fortsville Road Apple White Swamp 1975 - VDOT - - N N N 5 Fair - -
SH 26570 612 Fortsville Road Browns Branch 2000 - VDOT - - N N N 7 Good - -
SH 24456 612 Fortsville Road Rawlings Swamp 1996 - VDOT - - N N N 6 Fair - -
SH 17851 659 Fortsville Road Three Creek 1967 - VDOT - - 6 6 7 N Fair - -
SH 17864 671 General Thomas Hwy Branch 1977 - VDOT - - N N N 5 Fair - -
SH 17865 671 General Thomas Hwy Nottoway River 1960 - VDOT SD - 5 4 5 N Poor - -
SH 17866 671 General Thomas Hwy Nottoway River Overflow 1960 - VDOT - FO 5 5 5 N Fair - -
SH 17827 646 Governor Darden Road Branch Nottoway River 1972 - VDOT - - N N N 6 Fair - -
SH 17828 646 Governor Darden Road Darden Mill Pond 1968 - VDOT - - 7 7 6 N Fair - -
SH 17872 673 Gray's Shop Road Stream 1932 - VDOT - - 7 7 6 N Fair - -
SH 17754 186 Hugo Road Meherrin River 1936 - VDOT - - 6 6 5 N Fair - -
Year
BuiltJuris
Federal
Bridge
# Route Facility Crossing
Year
Recnst Ownership
Bridge Condition RatingsFederal
PM Bridge
Condition
Posted
Weight
Limit
(tons)
Fracture
Critical

APPENDIX D 120
HAMPTON ROADS REGIONAL BRIDGE STUDY – 2018 UPDATE
SOUTHAMPTON COUNTY/FRANKLIN BRIDGES
Source: HRTPO analysis of VDOT and FHWA data. Data as of December 2017. A description of codes used in this table is included on page 82.
SD FO Deck
Super-
Structure
Sub-
Structure Culvert
SH 17752 186 Hugo Road Overflow Meherrin River 1937 1993 VDOT - - 7 7 5 N Fair - -
SH 17812 634 Indian Branch Lane Indian Branch 1932 2016 VDOT - FO 8 8 6 N Fair - -
SH 17834 651 Indian Town Road Buckhorn Swamp 1986 - VDOT - - 7 7 7 N Good - -
SH 17788 616 Ivor Road Barlow Mill Run 1973 - VDOT - - N N N 7 Good - -
SH 17792 616 Ivor Road Br Round Hill Swamp 1975 - VDOT - - N N N 5 Fair - -
SH 17791 616 Ivor Road Branch 1976 - VDOT - - N N N 5 Fair - -
SH 17789 616 Ivor Road Lightwood Swamp 1976 - VDOT - - N N N 7 Good - -
SH 17793 616 Ivor Road Seacock Swamp 1960 - VDOT - - 5 5 5 N Fair - -
SH 17822 641 Johnson's Mill Road Johnsons Mill 1989 - VDOT - - 7 7 7 N Good - -
SH 17763 601 Kellos Mill Road Lightwood Swamp 1963 - VDOT - - 7 7 5 N Fair - -
SH 17840 653 Little Texas Road Flat Swamp 1971 2006 VDOT - - 7 7 5 N Fair - -
SH 9139 730 Little Texas Road Meherrin River 1953 - VDOT - - 6 5 6 N Fair - -
SH 17882 683 Mary Hunt Road Cokemoke Creek 1981 - VDOT - - 6 6 6 N Fair - -
SH 29902 35 Meherrin Road Nottoway River 2015 - VDOT - FO 8 8 8 N Good - -
SH 17728 35 Meherrin Road Overflow, Nottoway River 1979 - VDOT - FO N N N 5 Fair - -
SH 24961 35 Meherrin Road Route 58 1997 - VDOT - - 7 7 7 N Good - -
SH 17768 608 Mill Neck Road Racoon Swamp 1932 - VDOT - FO 6 5 5 N Fair - 9/-/-
SH 17769 608 Mill Neck Road Racoon Swamp 1932 1985 VDOT - - 5 5 5 N Fair - -
SH 17809 631 Mission Church Road Black Creek 1962 2017 VDOT - - 7 7 5 N Fair - -
SH 17885 684 Monroe Road Darden Mill Run 1982 - VDOT - - 7 6 7 N Fair - -
SH 25627 684 Monroe Road Nottoway River 1999 - VDOT - - 6 7 7 N Fair - -
SH 17863 670 Number 8 School House Road Tarrara Creek 1956 - VDOT - - 6 6 5 N Fair - -
SH 26226 652 Old Belfield Road Pleasant Creek 2000 - VDOT - - N N N 6 Fair - -
SH 17800 621 Old Blackwater Road Blackwater River 1963 - VDOT - - 6 6 5 N Fair - -
SH 17857 666 Old Branchville Road Tarrara Creek 1969 - VDOT - - 6 6 6 N Fair - -
SH 17852 661 Old Church Road Bellyache Swamp 1964 - VDOT - - N N N 6 Fair - -
SH 30763 657 Old Place Road Tarrara Creek 1988 2015 VDOT - - N N N 8 Good - -
SH 17721 35 Plank Road Assamoosick Creek 1980 - VDOT - - 6 5 6 N Fair - -
SH 17726 35 Plank Road Branch 1932 1971 VDOT - - 6 6 5 N Fair - -
SH 17722 35 Plank Road Mill Run 1921 1998 VDOT - - 6 7 7 N Fair - -
SH 17773 609 Popes Station Road Branch 1979 2013 VDOT - - N N N 7 Good - -
SH 17772 609 Popes Station Road Buckhorn Swamp 1978 - VDOT - - 7 5 7 N Fair - -
SH 17774 609 Popes Station Road Three Creek 1965 - VDOT - - 7 6 7 N Fair - -
SH 17895 714 Pretlow Road Route 58 1980 - VDOT - - 7 5 5 N Fair - -
SH 17790 616 Proctors Bridge Road Hickaneck Swamp 1990 - VDOT - - N N N 8 Good - -
SH 17787 616 Proctors Bridge Road Proctor Swamp 1987 - VDOT - - N N N 6 Fair - -
SH 17899 731 Ridley Road Mill Swamp 1968 - VDOT - - N N N 6 Fair - -
SH 17829 647 River Road Assamoosick Swamp 1971 - VDOT - - 7 7 6 N Fair - -
SH 17830 647 River Road Cuscora Branch 1972 - VDOT - - N N N 5 Fair - -
SH 17779 612 River's Mill Road Rivers Mill 1971 2012 VDOT - - 7 7 7 N Good - -
SH 29358 688 Rose Valley Road Branch 2010 - VDOT - - N N N 7 Good - -
SH 29862 35 Route 35 Tarrara Creek 2017 - VDOT - - 8 8 8 N Good - -
SH 17731 58 Route 58 EB Angelico Creek 1990 - VDOT - - 7 7 7 N Good - -
SH 17730 58 Route 58 WB Angelico Creek 1948 1981 VDOT - - 7 5 5 N Fair - -
SH 23647 58 Route 58 EB Armory Drive 1993 - VDOT - - 7 7 7 N Good - -
SH 17740 58 Route 58 WB Armory Drive 1979 - VDOT - - 7 6 5 N Fair - -
SH 17732 58 Route 58 Branch 1988 - VDOT - - N N N 6 Fair - -
SH 17733 58 Route 58 Branch 1988 - VDOT - - N N N 7 Good - -
SH 23715 58 Route 58 EB CSX R/R 1993 - VDOT - - 7 7 6 N Fair - -
SH 17742 58 Route 58 WB CSX R/R 1979 - VDOT - - 6 5 5 N Fair - -
Year
BuiltJuris
Federal
Bridge
# Route Facility Crossing
Year
Recnst Ownership
Bridge Condition RatingsFederal
PM Bridge
Condition
Posted
Weight
Limit
(tons)
Fracture
Critical

APPENDIX D 121
HAMPTON ROADS REGIONAL BRIDGE STUDY – 2018 UPDATE
SOUTHAMPTON COUNTY/FRANKLIN BRIDGES
Source: HRTPO analysis of VDOT and FHWA data. Data as of December 2017. A description of codes used in this table is included on page 82.
SD FO Deck
Super-
Structure
Sub-
Structure Culvert
SH 17749 58 Route 58 EB Nottoway River 1984 - VDOT - - 7 6 6 N Fair - -
SH 23609 58 Route 58 WB Nottoway River 1993 - VDOT - - 7 6 5 N Fair - -
SH 17729 58 Route 58 EB Nottoway Swamp 1930 1978 VDOT - - 6 5 5 N Fair - -
SH 17739 58 Route 58 WB Nottoway Swamp 1966 - VDOT - - 7 7 5 N Fair - -
SH 17750 58 Route 58 Overflow Nottoway River 1984 - VDOT - - 7 7 7 N Good - -
SH 23630 58 Route 58 Overflow Nottoway River 1993 - VDOT - - 6 7 5 N Fair - -
SH 23648 58 Route 58 EB Route 258 1993 - VDOT - - 7 7 7 N Good - -
SH 17744 58 Route 58 WB Route 258 1980 - VDOT - - 7 6 6 N Fair - -
SH 17795 618 Sadler Road Bar B Q Run 1932 - VDOT - FO 7 7 6 N Fair - -
SH 17811 633 Saint Lukes Road Horse Pen Run 1962 - VDOT - - 7 5 5 N Fair - 21/-/-
SH 17874 674 Sands Road Darden Mill Run 1932 2000 VDOT - FO 7 7 7 N Good - 24/-/-
SH 17887 686 Sandy Ridge Road Mill Creek 1970 - VDOT - - 6 7 6 N Fair - -
SH 17784 614 Seacock Chapel Road Blackwater River 1971 - VDOT SD - 7 7 4 N Poor - -
SH 17782 614 Seacock Chapel Road Branch 1932 2015 VDOT - FO 8 8 5 N Fair - -
SH 17783 614 Seacock Chapel Road Round Hill Swamp 1967 - VDOT - - 7 7 6 N Fair - -
SH 17781 614 Seacock Chapel Road Seacock Swamp 1953 - VDOT - - 5 5 6 N Fair - 27/-/-
SH 17756 258 Smiths Ferry Road Nottoway River 1960 - VDOT - - 5 5 6 N Fair - -
SH 17755 189 South Quay Road Blackwater River 1940 1962 VDOT SD - 5 3 4 N Poor Yes 9/-/-
SH 17833 611 Storys Station Road Flaggy Run 1932 - VDOT - FO 7 7 7 N Good - -
SH 17775 611 Storys Station Road Nottoway Swamp 1966 - VDOT - - 7 7 6 N Fair - -
SH 26972 680 Sunbeam Road Cokemoke Mill 2002 - VDOT - - 7 7 7 N Good Yes -
SH 17810 632 Sycamore Avenue Branch 1974 - VDOT - - N N N 5 Fair - -
SH 17859 667 Sykes Farm Road Tarrara Creek 1972 - VDOT SD - 7 4 6 N Poor - -
SH 17853 663 The Hall Road Flat Swamp 1968 - VDOT - - 7 7 5 N Fair - -
SH 17900 735 Three Creek Road Hornet Swamp 1985 - VDOT - - 7 7 7 N Good - -
SH 17757 308 Three Creek Road Three Creek 1948 - VDOT SD - 4 4 4 N Poor - -/27/40
SH 17826 645 Trinity Church Road Indian Branch 1932 - VDOT - - 8 8 8 N Good - -
SH 17817 635 Tucker Swamp Road Branch 1960 - VDOT - - 7 7 5 N Fair - -
SH 17813 635 Tucker Swamp Road Norfolk Southern R/R 1915 - VDOT SD - 4 4 5 N Poor Yes 11/-/-
SH 17814 635 Tucker Swamp Road Seacock Swamp 1956 - VDOT - - 6 5 6 N Fair - -
SH 17764 603 Unity Road Whitefield Mill 1966 - VDOT - - 7 7 6 N Fair - -
SH 30444 659 Vicks Millpond Road Flat Swamp 2016 - VDOT - - 8 8 8 N Good - -
SH 17848 659 Vicks Millpond Road Vicks Creek 1932 - VDOT - FO 7 7 7 N Good - -
SH 17855 665 White Meadow Road Tarrara Creek 1974 - VDOT - - 7 7 6 N Fair - -
SH 17898 730 Whitehead Road Flat Swamp 1988 - VDOT - - 6 7 6 N Fair - -
SH 17805 626 Womble Mill Road Wade Branch 1999 - VDOT - - N N N 5 Fair - -
SH 17806 626 Womble Mill Road Wade Mill Pond 1968 - VDOT - - N N N 5 Fair - -
SH 17881 682 Woodland Road Br Darden Mill Run 1932 - VDOT SD - 7 4 5 N Poor - -
Year
BuiltJuris
Federal
Bridge
# Route Facility Crossing
Year
Recnst Ownership
Bridge Condition RatingsFederal
PM Bridge
Condition
Posted
Weight
Limit
(tons)
Fracture
Critical

APPENDIX D 122
HAMPTON ROADS REGIONAL BRIDGE STUDY – 2018 UPDATE
Functionally Obsolete Bridges
Bridges with a Posted Weight Limit
Data source: HRTPO analysis of VDOT and FHWA data.
Data as of December 2017.
SUFFOLK BRIDGES
Non-Deficient Bridges
LEGEND
Structurally Deficient Bridges

APPENDIX D 123
HAMPTON ROADS REGIONAL BRIDGE STUDY – 2018 UPDATE
Fair
Data source: HRTPO analysis of VDOT and FHWA data.
Data as of December 2017.
BRIDGE CONDITION
SUFFOLK
Poor
LEGEND
Good
Based on Federal Bridge Performance Measure Standards
Under Construction

APPENDIX D 124
HAMPTON ROADS REGIONAL BRIDGE STUDY – 2018 UPDATE
SUFFOLK BRIDGES
SD FO Deck
Super-
Structure
Sub-
Structure Culvert
SUF 22123 Adams Swamp Road Adams Swamp 1970 - City - - N N N 7 Good - -
SUF 21996 Armistead Road I-664 1988 - VDOT - - 6 6 7 N Fair - -
SUF 30827 Arthur Drive Langston Swamp 2017 - City - - 7 7 8 N Good - -
SUF 30826 Arthur Drive Spivey Swamp 2017 - City - - 7 7 8 N Good - -
SUF 22154 Badger Road Washington Ditch 1945 - City SD - 5 5 4 N Poor - 8/-/-
SUF 22139 Box Elder Road Norfleets Swamp 1958 1994 City SD - 7 5 5 N Fair - 13/-/-
SUF 22023 17 Bridge Road EB Bennetts Creek 1969 - City - - 5 7 6 N Fair - -
SUF 22025 17 Bridge Road WB Bennetts Creek 1969 - City - - 5 7 6 N Fair - -
SUF 28594 17 Bridge Road Commonwealth Railway 2009 - City - - 7 8 8 N Good - -
SUF 22024 17 Bridge Road Nansemond River 1981 - City - - 6 5 5 N Fair - -
SUF 24841 Broad Street SBD & N/S R/R 1997 - City - - 6 6 7 N Fair - -
SUF 22161 Camp Pond Road Somerton Creek 1988 - City - - 6 6 7 N Fair - -
SUF 22027 32 Carolina Road Cypress Swamp 1924 1972 City SD - 5 4 5 N Poor - -
SUF 22026 17 Carrollton Blvd Chuckatuck Creek 1988 - VDOT - - 6 6 6 N Fair - -
SUF 22157 Cherry Grove Road Stream 1971 - City - - N N N 7 Good - -
SUF 22082 135 College Drive I-664 1991 - VDOT - - 6 7 6 N Fair - -
SUF 22080 135 College Drive Route 164 1991 - VDOT - - 6 6 6 N Fair - -
SUF 29441 Corinth Chapel Road March Swamp 2010 - City - - N N N 8 Good - -
SUF 22155 Cypress Chapel Road Trib To Cypress Swamp 1991 - City - - N N N 5 Fair - -
SUF 22096 Desert Road Cypress Swamp 1981 - City - - 7 7 7 N Good - -
SUF 22095 Desert Road Moss Swamp 1975 - City - - N N N 6 Fair - -
SUF 22110 Elwood Road Kingsale Swamp 1962 - City SD - 4 4 5 N Poor - 6/-/-
SUF 22093 Everetts Road W Br Nansemond River 1963 - City - - 6 6 5 N Fair - -
SUF 22104 Exeter Drive Lake Prince 1967 - City - - 7 7 6 N Fair - -
SUF 22148 Freeman Mill Road Spivey Swamp 1954 1976 City SD - 5 4 6 N Poor - 10/-/-
SUF 22108 Gardner Lane Lake Prince 1967 - City - - 5 5 6 N Fair - -
SUF 24215 Gates Road March Swamp 1995 - City - - N N N 5 Fair - -
SUF 22162 Gates Road Somerton Creek 1985 - City - - 5 7 7 N Fair - -
SUF 22153 Gates Run Road Adams Swamp 1970 - City - - 5 5 5 N Fair - -
SUF 22103 Girl Scout Road Br Lake Prince 1990 - City - - 7 8 7 N Good - -
SUF 22102 Girl Scout Road Exchange Creek 1962 - City - - 5 5 7 N Fair - -
SUF 26220 10 Godwin Blvd Chuckatuck Creek 1999 - City - - 7 7 7 N Good - -
SUF 22004 10 Godwin Blvd Suffolk Bypass 1973 - City - - 6 6 6 N Fair - -
SUF 22001 10 Godwin Blvd W Br Nansemond River 1984 - City - - 6 6 6 N Fair - -
SUF 29212 Harvest Drive Kingsale Swamp 2009 - City - - N N N 7 Good - -
SUF 22136 Holland Corner Road Stream 1987 - City - - N N N 6 Fair - -
SUF 22030 58 Holland Road Lake Meade 1942 1958 City - - 5 5 5 N Fair - -
SUF 22112 Holy Neck Road Chapel Swamp 1967 - City - - N N N 5 Fair - -
SUF 23099 664 I-664 NB Commonwealth Railway 1991 - VDOT - - 6 7 6 N Fair - -
SUF 23095 664 I-664 NB Routes 17 & 164 EB Ramp 1991 - VDOT - - 6 6 6 N Fair - -
SUF 23096 664 I-664 SB Routes 17 & 164 EB Ramp 1991 - VDOT - - 6 6 6 N Fair - -
SUF 23091 664 I-664 NB Route 164 1991 - VDOT - - 7 6 6 N Fair - -
SUF 23092 664 I-664 SB Route 164 1991 - VDOT - - 7 6 6 N Fair - -
SUF 22142 664 I-664 Streeter Creek 1990 - VDOT - - N N N 6 Fair - -
SUF 23097 664 I-664 Ramp Route 17 1991 - VDOT - - 6 6 6 N Fair - -
SUF 23093 664 I-664 Ramp Route 164 1991 - VDOT - - 6 6 5 N Fair - -
SUF 22144 664 I-664 Ramp Streeter Creek 1990 - VDOT - - N N N 7 Good - -
SUF 22160 Joshua Lane Lake Cahoon 1967 - City - - N N N 5 Fair - -
SUF 22117 Kings Fork Road Cohoon Creek 1968 - City - - 7 6 7 N Fair - -
SUF 22116 Kings Fork Road Lake Cohoon 1961 - City - - 5 5 6 N Fair - -
Year
BuiltJuris
Federal
Bridge
# Route Facility Crossing
Year
Recnst Ownership
Bridge Condition RatingsFederal
PM Bridge
Condition
Posted
Weight
Limit
(tons)
Fracture
Critical
Source: HRTPO analysis of VDOT and FHWA data. Data as of December 2017. A description of codes used in this table is included on page 82.

APPENDIX D 125
HAMPTON ROADS REGIONAL BRIDGE STUDY – 2018 UPDATE
SUFFOLK BRIDGES
SD FO Deck
Super-
Structure
Sub-
Structure Culvert
SUF 22121 Lake Cahoon Road SBD Sys & N/S R/R 1962 1974 City SD - 4 5 6 N Poor - -
SUF 22118 Lake Meade Drive Lake Cohoon 1961 - City - - 5 5 6 N Fair - -
SUF 22099 Lake Prince Drive Lake Prince 1954 - City - FO 5 5 6 N Fair - 18/-/-
SUF 22152 Liberty Spring Road Cypress Swamp 1970 - City - - N N N 7 Good - -
SUF 22137 Longstreet Lane Somerton Creek 1968 - City SD - 6 4 4 N Poor - 18/-/-
SUF 22018 Main Street Hall Ave, Poplar Ave, & N/S R/R 1978 - City - - 5 6 5 N Fair - -
SUF 22002 10 Main Street Nansemond River 1935 1987 City - FO 5 7 5 N Fair - -
SUF 30517 Manning Bridge Road Speights Run 2014 - City - - 7 7 7 N Good - -
SUF 22111 Mineral Springs Road Jones Swamp 1955 1977 City SD - 5 4 5 N Poor - -/13/18
SUF 22114 Mineral Springs Road Spivey Swamp 1975 - City - - N N N 5 Fair - -
SUF 22119 Murphy's Mill Road Suffolk Bypass 1974 - City - - 5 5 6 N Fair - -
SUF 22091 337 Nansemond Parkway Beamons Mill Pond 1920 - City SD - 5 4 5 N Poor - -/23/30
SUF 22109 O'Kelly Drive Chapel Swamp 1989 - City - - N N N 6 Fair - -
SUF 22105 Old Mill Road Cohoon Creek 1955 1981 City SD - 4 4 6 N Poor - 27/-/-
SUF 22115 Old Myrtle Road Cohoon Creek 1949 1980 City - - 8 7 7 N Good - -
SUF 22163 Pineview Road Chapel Swamp 1949 - City - FO 5 5 5 N Fair - -/27/38
SUF 21998 Pinner Street N/S, SBD, & CNW R/R 1984 - City - - 6 6 5 N Fair - -
SUF 22097 Pitchkettle Road Lake Meade 1973 - City - - 6 6 5 N Fair - -
SUF 22098 Pitchkettle Road Lake Meade 1969 - City - - 5 5 5 N Fair - -
SUF 22100 Pitchkettle Road Suffolk Bypass 1974 - City - - 5 6 6 N Fair - -
SUF 22150 Pittmantown Road Mill Swamp 1950 - City SD - 5 4 5 N Poor - 8/-/-
SUF 22012 13 Portsmouth Blvd Shingle Creek 1963 1976 City - - 6 6 6 N Fair - -
SUF 22143 664 Ramp To SB I-664 Streeter Creek 1990 - VDOT - - N N N 5 Fair - -
SUF 30570 Redgate Drive Br Nansemond River 2006 - City - - 7 7 7 N Good - -
SUF 30571 Robbie Road Mill Swamp 2015 - City - FO 7 7 7 N Good - -
SUF 22113 Rountree Crescent Cypress Swamp 1980 - City - - N N N 5 Fair - -
SUF 23301 58 Route 58 EB Blackwater River 1992 - VDOT - - 6 6 7 N Fair - -
SUF 22029 58 Route 58 WB Blackwater River 1981 - VDOT - - 6 5 6 N Fair - -
SUF 22068 58 Route 58 WB Bus Route 58 EB 1976 - City - - 6 5 6 N Fair - -
SUF 22032 58 Route 58 Lake Kilby 1932 - City - - N N N 7 Good - -
SUF 22071 58 Route 58 EB Norfolk Southern R/R 1976 - City - - 6 6 6 N Fair - -
SUF 22070 58 Route 58 WB Norfolk Southern R/R 1976 - City - - 6 6 6 N Fair - -
SUF 22072 58 Route 58 EB Old Dutch Road 1976 - City - - 6 6 6 N Fair - -
SUF 22074 58 Route 58 WB Old Dutch Road 1976 - City - - 6 6 6 N Fair - -
SUF 22034 58 Route 58 EB Quaker Swamp 1939 1976 City - - 5 5 5 N Fair - -
SUF 22077 58 Route 58 Trib Blackwater River 1981 - City - - N N N 6 Fair - -
SUF 23094 164 Route 164 EB Commonwealth Railway 1991 - VDOT - - 7 7 7 N Good - -
SUF 23098 164 Route 164 EB Route 17 1991 - VDOT - FO 6 6 6 N Fair - -
SUF 22085 189 Route 189 Ducks Creek 1986 - City - - N N N 6 Fair - -
SUF 23300 189 Route 189 Route 58 1992 - City - - 6 7 6 N Fair - -
SUF 22037 58 Ruritan Blvd Kingsale Swamp 1923 1975 City - - 6 5 5 N Fair - -
SUF 22107 Simons Drive Cohoon Creek 1945 - City SD - 6 4 4 N Poor - 6/-/-
SUF 22166 South 6th Street Shingle Creek 1960 - City - - N N N 5 Fair - -
SUF 25658 13 Southwest Suffolk Bypass NB Carolina Road 2002 - City - - 7 8 7 N Good - -
SUF 25663 13 Southwest Suffolk Bypass NB Lake Kilby 2002 - City - - 7 7 7 N Good - -
SUF 25664 13 Southwest Suffolk Bypass SB Lake Kilby 2002 - City - - 7 7 7 N Good - -
SUF 25661 13 Southwest Suffolk Bypass NB Norfolk Southern R/R 2002 - City - - 7 8 7 N Good - -
SUF 25662 13 Southwest Suffolk Bypass SB Norfolk Southern R/R 2002 - City - - 7 8 7 N Good - -
SUF 25667 13 Southwest Suffolk Bypass SB Route 58 2002 - City - - 7 7 7 N Good - -
SUF 27252 13 Southwest Suffolk Bypass Stream 2002 - City - - N N N 7 Good - -
Year
BuiltJuris
Federal
Bridge
# Route Facility Crossing
Year
Recnst Ownership
Bridge Condition RatingsFederal
PM Bridge
Condition
Posted
Weight
Limit
(tons)
Fracture
Critical
Source: HRTPO analysis of VDOT and FHWA data. Data as of December 2017. A description of codes used in this table is included on page 82.

APPENDIX D 126
HAMPTON ROADS REGIONAL BRIDGE STUDY – 2018 UPDATE
SUFFOLK BRIDGES
SD FO Deck
Super-
Structure
Sub-
Structure Culvert
SUF 25668 13 Southwest Suffolk Bypass NB Turlington Road 2002 - City - - 7 7 7 N Good - -
SUF 25669 13 Southwest Suffolk Bypass SB Turlington Road 2002 - City - - 7 7 7 N Good - -
SUF 25671 13 Southwest Suffolk Bypass Ramp Holland Road 2002 - City - - 7 7 7 N Good - -
SUF 27256 13 Southwest Suffolk Bypass Ramp Route 58 2002 - City - - 6 7 7 N Fair - -
SUF 25670 13 Southwest Suffolk Bypass Ramp Turlington Road 2002 - City - - 7 7 7 N Good - -
SUF 22138 Southwestern Blvd Chapel Swamp 1956 - City SD - 5 4 4 N Poor - 9/-/-
SUF 22055 13 Suffolk Bypass EB Lake Cohoon Road 1974 - City - - 6 5 6 N Fair - -
SUF 22057 13 Suffolk Bypass WB Lake Cohoon Road 1974 - City - - 6 6 5 N Fair - -
SUF 22059 13 Suffolk Bypass EB Lake Meade 1974 - City - - 6 6 6 N Fair - -
SUF 22060 13 Suffolk Bypass WB Lake Meade 1974 - City - - 6 6 6 N Fair - -
SUF 22047 13 Suffolk Bypass EB N.F.& D. R/R 1974 - City - - 6 6 5 N Fair - -
SUF 22048 13 Suffolk Bypass WB N.F.& D. R/R 1973 - City - - 6 5 5 N Fair - -
SUF 22043 13 Suffolk Bypass EB Nansemond Pkwy 1973 - City - - 6 5 5 N Fair - -
SUF 22045 13 Suffolk Bypass WB Nansemond Pkwy 1973 - City - - 6 5 5 N Fair - -
SUF 22039 13 Suffolk Bypass EB Nansemond River 1972 - City - - 6 5 6 N Fair - -
SUF 22040 13 Suffolk Bypass WB Nansemond River 1972 - City - - 6 5 5 N Fair - -
SUF 22061 13 Suffolk Bypass EB Norfolk Southern R/R 1974 2002 City - - 6 5 7 N Fair - -
SUF 22062 13 Suffolk Bypass WB Norfolk Southern R/R 1974 2002 City - - 6 6 6 N Fair - -
SUF 22053 13 Suffolk Bypass EB Pruden Blvd 1973 - City - - 6 5 5 N Fair - -
SUF 22063 13 Suffolk Bypass WB Pruden Blvd 1974 - City - - 6 6 6 N Fair - -
SUF 22049 13 Suffolk Bypass EB Wilroy Road 1973 - City - - 5 5 5 N Fair - -
SUF 22051 13 Suffolk Bypass WB Wilroy Road 1973 - City - - 5 5 5 N Fair - -
SUF 22016 13 Suffolk Byp Ramp To Portsmouth Blvd Suffolk Bypass 1973 - City - - 5 5 6 N Fair - -
SUF 23086 Town Point Road EB I-664 1991 - VDOT - - 6 6 6 N Fair - -
SUF 23087 Town Point Road WB I-664 1991 - VDOT - - 6 6 6 N Fair - -
SUF 22159 Turlington Road Br Kilby Creek-Spillway 1957 - City SD - 5 4 5 N Poor - 19/-/-
SUF 22158 Turlington Road Kilby Creek 1973 - City SD - N N N 4 Poor - -
SUF 22088 337 Washington Street Jericho Canal 1932 - City SD - 6 5 6 N Fair - -
SUF 22008 13 Whaleyville Blvd Spivey Swamp 1945 1975 City - - 7 7 6 N Fair - -
SUF 22128 White Marsh Road Cypress Swamp 1959 - City - - 7 7 6 N Fair - -
SUF 22129 White Marsh Road Shingle Creek 1972 1984 City - - N N N 5 Fair - -
SUF 23524 White Marsh Road Washington Ditch 1992 - City - - 7 8 7 N Good - -
SUF 27625 Wilroy Road Burnetts Mill Creek 2003 - City - FO 7 7 8 N Good - -
SUF 30980 Wilroy Road Magnolia Creek 2017 - City - FO N N N 7 Good - -
SUF 22125 Wilroy Road Shingle Creek 1958 - City - FO 7 7 6 N Fair - -
Year
BuiltJuris
Federal
Bridge
# Route Facility Crossing
Year
Recnst Ownership
Bridge Condition RatingsFederal
PM Bridge
Condition
Posted
Weight
Limit
(tons)
Fracture
Critical
Source: HRTPO analysis of VDOT and FHWA data. Data as of December 2017. A description of codes used in this table is included on page 82.

APPENDIX D 127
HAMPTON ROADS REGIONAL BRIDGE STUDY – 2018 UPDATE
Functionally Obsolete Bridges
Bridges with a Posted Weight Limit
Data source: HRTPO analysis of VDOT and FHWA data.
Data as of December 2017.
SURRY COUNTY BRIDGES
Non-Deficient Bridges
LEGEND
Structurally Deficient Bridges

APPENDIX D 128
HAMPTON ROADS REGIONAL BRIDGE STUDY – 2018 UPDATE
Fair
Data source: HRTPO analysis of VDOT and FHWA data.
Data as of December 2017.
BRIDGE CONDITION
SURRY COUNTY
Poor
LEGEND
Good
Based on Federal Bridge Performance Measure Standards
Under Construction

APPENDIX D 129
HAMPTON ROADS REGIONAL BRIDGE STUDY – 2018 UPDATE
SURRY COUNTY BRIDGES
Source: HRTPO analysis of VDOT and FHWA data. Data as of December 2017. A description of codes used in this table is included on page 82.
SD FO Deck
Super-
Structure
Sub-
Structure Culvert
SUR 18216 634 Alliance Road College Run 1932 2003 VDOT - FO 7 8 5 N Fair - -
SUR 18206 626 Beaverdam Road Sunken Meadow Creek 1932 - VDOT - - 6 7 5 N Fair - 15/-/-
SUR 18208 626 Beechland Road Trib. Moores Swamp 1956 - VDOT - - 6 6 5 N Fair - -
SUR 23585 613 Cabin Point Road Upper Chippokes Creek 1993 - VDOT - - N N N 7 Good - -
SUR 18221 783 Chippokes Park Road College Run Creek 1982 - VDOT - - 6 5 6 N Fair - -
SUR 18179 10 Colonial Trail Lower Chippokes Creek 1932 1951 VDOT - - 6 6 5 N Fair - -
SUR 18173 10 Colonial Trail Mill Run 1920 1971 VDOT - - 5 5 6 N Fair - -
SUR 18178 10 Colonial Trail Trib Chippokes Creek 1932 1971 VDOT - - 6 6 6 N Fair - -
SUR 18181 10 Colonial Trail Upper Chippokes Creek 1932 1971 VDOT - - 6 6 7 N Fair - -
SUR 26713 647 Cypress Swamp Lane Cypress Swamp 2001 - VDOT - - N N N 7 Good - -
SUR 18187 604 Goodrich Fork Road Terrapin Swamp 1932 - VDOT - - 7 5 5 N Fair - 21/-/-
SUR 18220 650 Hog Island Road Vepco Discharge Canal 1969 - VDOT - FO 6 6 6 N Fair - -
SUR 18205 618 Holly Bush Road Br Cypress Swamp 1974 - VDOT - - N N N 6 Fair - -
SUR 18189 607 Huntington Road Otterdam Swamp 1953 - VDOT - - 6 6 5 N Fair - -
SUR 18301 602 Laurel Springs Road Blackwater River 1974 - VDOT - - 7 6 5 N Fair - -
SUR 18212 628 Lawnes Drive Lawnes Creek 1975 - VDOT - - 7 7 7 N Good - -
SUR 18209 626 Lebanon Road Grays Creek 1954 - VDOT - - N N N 6 Fair - -
SUR 29857 630 Loafers Oak Road Cypress Swamp 2014 - VDOT - - 8 8 8 N Good - -
SUR 28616 40 MLK Hwy Blackwater River 2008 - VDOT - - 7 8 8 N Good - -
SUR 18185 40 MLK Hwy Otterdam Swamp 1954 - VDOT SD - 5 4 5 N Poor - -/27/40
SUR 14080 600 Montpelier Road Upper Chippokes Creek 1977 - VDOT - - N N N 5 Fair - -
SUR 18199 616 New Design Road Cypress Swamp 1965 - VDOT - - 6 6 6 N Fair - -
SUR 18197 616 New Design Road Johnchecohunk Creek 1968 - VDOT - - N N N 6 Fair - -
SUR 18218 637 Pleasant Point Road Crouches Creek 1964 - VDOT - - 6 6 6 N Fair - -
SUR 18182 31 Rolfe Highway Blackwater River 1958 - VDOT - - 5 5 5 N Fair - -
SUR 18184 31 Rolfe Highway Cypress Swamp 1969 - VDOT - - 6 6 7 N Fair - -
SUR 23137 31 Scotland Wharf James River 1991 1995 VDOT - FO 5 5 5 N Fair Yes -/16/28
SUR 18204 618 Southwark Road Grays Creek 1954 - VDOT - - 5 5 5 N Fair - -
SUR 18214 630 Sprately Mill Road Johnchecohunk Swamp 1970 2007 VDOT - - 8 7 8 N Good - -
SUR 18304 603 Three Bridges Road Blackwater River 1932 - VDOT SD - 5 4 5 N Poor - 8/-/-
SUR 18200 617 White Marsh Road Blackwater River 1979 - VDOT - - 6 5 6 N Fair - -
SUR 18201 617 White Marsh Road Mill Swamp 1959 - VDOT - - 6 6 5 N Fair - -
Year
BuiltJuris
Federal
Bridge
# Route Facility Crossing
Year
Recnst Ownership
Bridge Condition RatingsFederal
PM Bridge
Condition
Posted
Weight
Limit
(tons)
Fracture
Critical

APPENDIX D 130
HAMPTON ROADS REGIONAL BRIDGE STUDY – 2018 UPDATE
SOUTHERN VIRGINIA BEACH INSET
SEE INSET
Functionally Obsolete Bridges
Bridges with a Posted Weight Limit
Data source: HRTPO analysis of VDOT and FHWA data.
Data as of December 2017.
VIRGINIA BEACH BRIDGES
Non-Deficient Bridges
LEGEND
Structurally Deficient Bridges

APPENDIX D 131
HAMPTON ROADS REGIONAL BRIDGE STUDY – 2018 UPDATE
Fair
Data source: HRTPO analysis of VDOT and FHWA data.
Data as of December 2017.
BRIDGE CONDITION
VIRGINIA BEACH
Poor
LEGEND
Good
Based on Federal Bridge Performance Measure Standards
Under Construction
SOUTHERN VIRGINIA BEACH INSET
SEE INSET

APPENDIX D 132
HAMPTON ROADS REGIONAL BRIDGE STUDY – 2018 UPDATE
VIRGINIA BEACH BRIDGES
SD FO Deck
Super-
Structure
Sub-
Structure Culvert
VB 22178 Blackwater Road Blackwater Creek 1975 - City - - 6 6 7 N Fair - -
VB 23523 Blackwater Road Milldam Creek 1992 - City - - 8 8 7 N Good - -
VB 22189 Bonney Road Thalia Creek 1982 - City - - N N N 6 Fair - -
VB 28047 Bow Creek Blvd Drainage Canal 2000 - City - - N N N 7 Good - -
VB 28049 Bow Creek Blvd Drainage Canal 2000 - City - - N N N 6 Fair - -
VB 24508 Bow Creek Blvd London Bridge Creek 1996 - City - - 7 7 7 N Good - -
VB 12750 13 CBBT NB Chesapeake Bay 1964 - CBBT - FO 7 7 7 N Good - -
VB 26075 13 CBBT SB Chesapeake Bay 1998 - CBBT - - 7 8 8 N Good - -
VB 12755 13 CBBT NB Chesapeake Bay 1964 - CBBT - FO 7 7 7 N Good - -
VB 26628 13 CBBT SB Chesapeake Bay 1998 - CBBT - - 8 7 8 N Good - -
VB 12752 13 CBBT NB Chesapeake Bay 1964 - CBBT - FO 8 7 7 N Good Yes -
VB 26721 13 CBBT SB Chesapeake Bay 1999 - CBBT - FO 8 8 8 N Good - -
VB 12754 13 CBBT NB Chesapeake Bay 1964 - CBBT - FO 8 7 8 N Good - -
VB 26630 13 CBBT SB Chesapeake Bay 1998 - CBBT - FO 7 8 8 N Good - -
VB 12747 13 CBBT NB Chesapeake Bay & Lookout Rd 1964 - CBBT - FO 7 7 7 N Good - -
VB 26056 13 CBBT SB Chesapeake Bay & Lookout Rd 1998 - CBBT - FO 8 8 8 N Good - -
VB 26631 13 CBBT NB Fisherman's Inlet 1998 - CBBT - - 8 8 8 N Good - -
VB 12753 13 CBBT SB Fisherman's Inlet 1964 - CBBT - FO 8 7 7 N Good - -
VB 28045 Club House Road Drainage Canal 2000 - City - - N N N 7 Good - -
VB 29370 Constitution Drive Thalia Creek 2010 - City - - 7 7 7 N Good - -
VB 30676 Crags Causeway Mill Dam Creek 2015 - City - - N N N 8 Good - -
VB 28050 Culver Lane Drainage Canal 1989 - City - - N 7 7 N Good - -
VB 28472 Dam Neck Road Canal 4 2006 - City - - N 8 8 N Good - -
VB 22167 Dam Neck Road Drainage Canal 1991 - City - - 6 6 6 N Fair - -
VB 23548 Dam Neck Road EB West Neck Creek 1992 - City - - 7 7 7 N Good - -
VB 23549 Dam Neck Road WB West Neck Creek 1992 - City - - 7 7 7 N Good - -
VB 29371 166 Diamond Springs Road NB Waterworks Canal 2009 - City - - 7 7 8 N Good - -
VB 29367 166 Diamond Springs Road SB Waterworks Canal 2010 - City - - 7 7 8 N Good - -
VB 22210 Dorchester Lane Drainage Canal 1986 - City - - 7 7 7 N Good - -
VB 22202 E Green Garden Cir Sunset Canal 1973 - City - - 7 7 7 N Good - -
VB 22176 Elbow Road North Landing River 1960 - City - FO 8 8 6 N Fair - -
VB 22211 Ferrell Parkway Drainage Canal 1976 1989 City - - N N N 6 Fair - -
VB 23668 Ferrell Parkway Drainage Canal 1993 - City - - 7 7 7 N Good - -
VB 23694 Ferrell Parkway Princess Anne Road 1993 - City - - 7 7 6 N Fair - -
VB 23667 Ferrell Parkway EB Salem Road 1993 - City - - 7 7 7 N Good - -
VB 23666 Ferrell Parkway WB Salem Road 1993 - City - - 7 7 7 N Good - -
VB 24173 General Booth Blvd NB Rudee Inlet 1995 - City - FO 7 7 7 N Good - -
VB 22191 General Booth Blvd SB Rudee Inlet 1968 - City - FO 5 6 6 N Fair - -
VB 22280 279 Great Neck Road NB Broad Bay Road & Long Creek 1988 - City - FO 7 7 7 N Good - -
VB 22278 279 Great Neck Road SB Broad Bay Road & Long Creek 1988 - City - FO 7 7 7 N Good - -
VB 22282 279 Great Neck Road Wolfsnare Creek 1979 - City - - N N N 6 Fair - -
VB 22196 Greenwich Road Drainage Canal 1932 - City - - N N N 5 Fair - -
VB 22177 Head Of River Road Blackwater River 1979 - City - - N N N 7 Good - -
VB 22169 Holland Road Drainage Canal 1985 - City - - N N N 6 Fair - -
VB 22267 64 I-64 EB E Br Elizabeth River 1967 1992 VDOT - FO 6 6 5 N Fair - -
VB 22265 64 I-64 WB E Br Elizabeth River 1967 1992 VDOT - FO 6 6 5 N Fair - -
VB 22243 264 I-264 Birdneck Road 1967 1996 VDOT - - 6 5 5 N Fair - -
VB 22239 264 I-264 First Colonial Road 1967 1986 VDOT SD - 7 4 5 N Poor - -
VB 22242 264 I-264 Great Neck Creek 1967 1982 VDOT - - 6 6 6 N Fair - -
VB 22222 264 I-264 Independence Blvd 1967 1992 VDOT - FO 6 5 5 N Fair - -
Year
BuiltJuris
Federal
Bridge
# Route Facility Crossing
Year
Recnst Ownership
Bridge Condition RatingsFederal
PM Bridge
Condition
Posted
Weight
Limit
(tons)
Fracture
Critical
Source: HRTPO analysis of VDOT and FHWA data. Data as of December 2017. A description of codes used in this table is included on page 82.

APPENDIX D 133
HAMPTON ROADS REGIONAL BRIDGE STUDY – 2018 UPDATE
VIRGINIA BEACH BRIDGES
SD FO Deck
Super-
Structure
Sub-
Structure Culvert
VB 22230 264 I-264 London Bridge Creek 1967 2012 VDOT - - 6 6 6 N Fair - -
VB 22232 264 I-264 London Bridge Road 1967 1982 VDOT - FO 6 5 5 N Fair - -
VB 22228 264 I-264 Lynnhaven Parkway 1967 1986 VDOT - - 7 5 5 N Fair - -
VB 22219 264 I-264 Norfolk Southern R/R 1967 1992 VDOT - - 6 5 5 N Fair - -
VB 22231 264 I-264 Norfolk Southern R/R 1967 1982 VDOT - - 7 6 6 N Fair - -
VB 22226 264 I-264 Plaza Trail 1967 1977 VDOT - - 6 5 6 N Fair - -
VB 22224 264 I-264 Rosemont Road 1967 1977 VDOT - - 6 5 6 N Fair - -
VB 22241 264 I-264 Thalia Creek 1967 - VDOT - - N N N 7 Good - -
VB 22249 264 I-264 Trib E Br Elizabeth River 1967 1985 VDOT - - N N N 6 Fair - -
VB 22251 264 I-264 Trib Thalia Creek 1967 - VDOT - - N N N 7 Good - -
VB 22236 264 I-264 Trib Wolfsnare Creek 1967 1967 VDOT - - N N N 7 Good - -
VB 22237 264 I-264 Va Beach Blvd 1967 1982 VDOT - - 7 7 5 N Fair - -
VB 22220 264 I-264 Witchduck Road 1967 1992 VDOT - - 7 5 5 N Fair - -
VB 22217 264 I-264 EB Ramp Baxter Road 1990 - VDOT - FO 6 6 6 N Fair - -
VB 22234 264 I-264 EB Ramp To Laskin Road I-264 1967 - VDOT - - 7 6 6 N Fair - -
VB 22194 Independence Blvd Drainage Canal 1990 - City - - 6 6 7 N Fair - -
VB 22274 225 Independence Blvd NB Northampton Blvd 1969 - City - - 6 7 7 N Fair - -
VB 22276 225 Independence Blvd SB Northampton Blvd 1969 - City - - 6 7 7 N Fair - -
VB 22209 Indian Lakes Blvd Drainage Canal 1974 - City - - N N N 6 Fair - -
VB 22172 Indian River Road Drainage Canal 1987 - City - - N N N 6 Fair - -
VB 23579 407 Indian River Road I-64 1993 - VDOT - - 6 7 5 N Fair - -
VB 25101 Indian River Road North Landing River 1997 - City - - 7 8 7 N Good - -
VB 22170 Indian River Road West Neck Creek 1975 - City SD - 4 5 5 N Poor - -
VB 25480 Inlet Road Inlet Of Lynnhaven River 1982 - City - FO 6 5 5 N Fair - -
VB 22212 International Parkway EB Drainage Canal #2 1987 - City - FO 7 7 7 N Good - -
VB 26138 International Parkway WB Drainage Canal #2 1997 - City - FO 7 7 7 N Good - -
VB 29394 190 Kempsville Road Fox Run 2014 - City - - 8 8 8 N Good - -
VB 22252 58 Laskin Road Linkhorn Bay 1938 1956 City SD - 5 4 4 N Poor - -
VB 25189 London Bridge Road Drainage Canal 1996 - City - - N N N 7 Good - -
VB 22206 Lord Dunmore Drive Drainage Ditch 1932 - City - - N N N 6 Fair - -
VB 30128 Lynnhaven Parkway Charlestwn Lakes N Canal 2016 - City - FO 8 8 8 N Good - -
VB 28706 Lynnhaven Parkway Drainage Canal 2010 - City - - 7 7 7 N Good - -
VB 22203 Lynnhaven Parkway Drainage Canal 1989 - City - - 7 7 6 N Fair - -
VB 29369 Lynnhaven Parkway Drainage Canal 2010 - City - - N N N 7 Good - -
VB 22195 Lynnhaven Parkway Green Run Drainage Canal 1982 - City - - N N N 6 Fair - -
VB 22198 Lynnhaven Parkway NB London Bridge Creek 1974 1982 City - - 7 7 7 N Good - -
VB 22199 Lynnhaven Parkway SB London Bridge Creek 1974 1982 City - - 7 7 7 N Good - -
VB 30326 Lynnhaven Parkway Stream 2016 - City - - N N N 8 Good - -
VB 22174 Muddy Creek Road Branch North Bay 1985 - City - - 7 7 7 N Good - -
VB 22171 Nanneys Creek Road Nanney Creek 1982 - City - - 7 7 7 N Good - -
VB 27513 165 Nimmo Pkwy Hunt Club Trib 2014 - City - - 8 8 8 N Good - -
VB 27067 165 Nimmo Pkwy West Neck Creek 2014 - City - - 7 8 7 N Good - -
VB 22213 13 Northampton Blvd NB Shore Drive 1963 - City - - 6 7 6 N Fair - -
VB 22215 13 Northampton Blvd SB Shore Drive 1963 - City - - 6 7 6 N Fair - -
VB 30052 Pinewood Road Little Neck Creek 2013 - City - - 8 8 8 N Good - -
VB 22186 Potters Road London Bridge Creek 1977 - City - FO 7 6 7 N Fair - -
VB 22270 165 Princess Anne Road Tidal Stream 1969 - City - - N N N 6 Fair - -
VB 24949 149 Princess Anne Road West Neck Creek 1997 - City - FO 7 7 7 N Good - -
VB 30816 409 Providence Road Cedar Hill Canal 2016 - City - - N N N 7 Good - -
VB 22287 409 Providence Road EB I-64 1967 - VDOT - FO 6 6 6 N Fair - -
Year
BuiltJuris
Federal
Bridge
# Route Facility Crossing
Year
Recnst Ownership
Bridge Condition RatingsFederal
PM Bridge
Condition
Posted
Weight
Limit
(tons)
Fracture
Critical
Source: HRTPO analysis of VDOT and FHWA data. Data as of December 2017. A description of codes used in this table is included on page 82.

APPENDIX D 134
HAMPTON ROADS REGIONAL BRIDGE STUDY – 2018 UPDATE
SD FO Deck
Super-
Structure
Sub-
Structure Culvert
VB 22285 409 Providence Road WB I-64 1967 - VDOT - FO 6 6 6 N Fair - -
VB 22190 Pungo Ferry Road North Landing River 1991 - City - - 6 6 7 N Fair - -
VB 22256 58 Ramp To Laskin Road Va Beach Blvd 1967 - VDOT - - 6 6 7 N Fair - -
VB 22200 Rosemont Road Sunset Canal 1975 1989 City - - 7 7 6 N Fair - -
VB 22185 Salem Road Drainage Canal 1980 - City - - N N N 6 Fair - -
VB 22208 Sandbridge Road Drainage Ditch 1984 - City - - N N N 6 Fair - -
VB 22183 Sandbridge Road Hells Point Creek 1961 - City - FO 5 5 7 N Fair - -
VB 28622 Ships Corner Road Drainage Lynnhaven Inlet 2006 - City - - N 7 7 N Good - -
VB 22262 60 Shore Drive Bay Coast Railroad 1986 - City - - 7 7 7 N Good - -
VB 22261 60 Shore Drive Lake Smith Spillway 1987 - City - - N N N 7 Good - -
VB 22260 60 Shore Drive EB Lynnhaven Inlet 2018 - City - - N/A N/A N/A N/A N/A - -
VB 30155 60 Shore Drive WB Lynnhaven Inlet 2016 2016 City - - 7 7 7 N Good - -
VB 22173 South Boulevard Thalia Creek 1985 - City - - N N N 6 Fair - -
VB 22187 South Lynnhaven Road London Bridge Creek 1966 - City - - 6 6 5 N Fair - -
VB 23693 South Plaza Trail Drainage Canal 1992 - City - - 7 7 7 N Good - -
VB 22255 58 Va Beach Blvd I-264 WB Ramp 1967 - VDOT - FO 7 7 7 N Good - -
VB 22253 58 Va Beach Blvd Lynnhaven River 1989 - City - - 7 7 7 N Good - -
VB 22254 58 Va Beach Blvd Thalia Creek 1987 - City - - 7 7 7 N Good - -
VB 22258 58 Va Beach Blvd Trib Wolfsnare Creek 1967 - VDOT - - N N N 7 Good - -
VB 22180 W Great Neck Road Long Creek & Broad Bay Road 1961 - City - FO 6 6 6 N Fair - -
VB 22201 W Green Garden Cir Sunset Canal 1973 - City - - 6 7 7 N Fair - -
VB 22168 Ware Neck Drive North Landing River 1988 - City - - N N N 7 Good - -
VB 22197 Wesleyan Drive Drainage Canal 1985 - City - - N N N 6 Fair - -
VB 23664 West Neck Road West Neck Creek 1993 - City - - 7 7 7 N Good - -
VB 22204 Wolfsnare Road Wolfsnare Creek 1979 - City - - N N N 6 Fair - -
Year
BuiltJuris
Federal
Bridge
# Route Facility Crossing
Year
Recnst Ownership
Bridge Condition RatingsFederal
PM Bridge
Condition
Posted
Weight
Limit
(tons)
Fracture
Critical
VIRGINIA BEACH BRIDGES
Source: HRTPO analysis of VDOT and FHWA data. Data as of December 2017. A description of codes used in this table is included on page 82.

APPENDIX D 135
HAMPTON ROADS REGIONAL BRIDGE STUDY – 2018 UPDATE
Functionally Obsolete Bridges
Bridges with a Posted Weight Limit
Data source: HRTPO analysis of VDOT and FHWA data.
Data as of December 2017.
YORK COUNTY BRIDGES
Non-Deficient Bridges
LEGEND
Structurally Deficient Bridges

APPENDIX D 136
HAMPTON ROADS REGIONAL BRIDGE STUDY – 2018 UPDATE
Fair
Data source: HRTPO analysis of VDOT and FHWA data.
Data as of December 2017.
BRIDGE CONDITION
YORK COUNTY
Poor
LEGEND
Good
Based on Federal Bridge Performance Measure Standards
Under Construction

APPENDIX D 137
HAMPTON ROADS REGIONAL BRIDGE STUDY – 2018 UPDATE
YORK COUNTY BRIDGES
SD FO Deck
Super-
Structure
Sub-
Structure Culvert
YC 19871 604 Barlow Road I-64 1979 - VDOT - - 6 6 6 N Fair - -
YC 19870 600 Big Bethel Road Big Bethel Reservoir 1931 1986 VDOT - - 6 6 5 N Fair - -
YC 19826 60 Bypass Road Trib Queens Creek 1968 - VDOT - - N N N 6 Fair - -
YC 19824 17 Coleman Bridge York River 1952 1996 VDOT - FO 6 6 5 N Fair Yes -
YC 4290011P Colonial Parkway Felgate's Creek 1981 - Federal - - 6 7 5 N Fair - -
YC 4290014P Colonial Parkway Hubbard's Lane 1964 - Federal - - 7 7 7 N Good - -
YC 4290010P Colonial Parkway Indian Field Creek 1933 - Federal - - 6 5 5 N Fair - -
YC 4290012P Colonial Parkway Kings Creek 1933 - Federal - - 6 6 5 N Fair - -
YC 4290009P Colonial Parkway Naval Weapons Road 1931 - Federal - FO 6 6 7 N Fair - -
YC 4290008P Colonial Parkway North Pier Access Road 1962 - Federal - FO 6 6 7 N Fair - -
YC 4290013P Colonial Parkway Penniman Road 1964 - Federal - - 6 6 6 N Fair - -
YC 4290006P Colonial Parkway Route 17 1956 - Federal - - 6 6 7 N Fair - -
YC 4290005P Colonial Parkway Yorktown Creek 1955 - Federal - - 6 7 6 N Fair - -
YC 19883 716 East Queens Drive Queens Creek - Spillway 1932 1997 VDOT - FO 6 7 6 N Fair - 11/-/-
YC 27508 17 George Washington Hwy Poquoson River 2015 - VDOT - - 8 8 8 N Good - -
YC 19820 17 George Washington Hwy NB Yorktown Battlefield Tour Road 1968 - VDOT - FO 7 6 6 N Fair - -
YC 19822 17 George Washington Hwy SB Yorktown Battlefield Tour Road 1968 - VDOT - FO 6 6 6 N Fair - -
YC 25281 64 Grove Interchange I-64 2002 - VDOT - - 6 7 7 N Fair - -
YC 25282 64 Grove Interchange I-64 Ramp 2002 - VDOT - - 7 7 6 N Fair - -
YC 25283 64 Grove Interchange Routes 60 & 143 and CSX R/R 2002 - VDOT - - 6 7 7 N Fair - -
YC 30641 64 I-64 WB Branch Of King Creek 2002 - VDOT - - N N N 7 Good - -
YC 19838 64 I-64 EB Colonial Pkwy 1965 - VDOT - FO 6 6 7 N Fair - -
YC 19840 64 I-64 WB Colonial Pkwy 1965 - VDOT - FO 6 6 7 N Fair - -
YC 19834 64 I-64 EB Lakes Head Drive 1965 - VDOT - - 6 5 6 N Fair - -
YC 19836 64 I-64 WB Lakes Head Drive 1965 - VDOT - - 6 6 6 N Fair - -
YC 19828 64 I-64 EB Penniman Road 1965 1977 VDOT - - 6 5 5 N Fair - -
YC 19830 64 I-64 WB Penniman Road 1965 1977 VDOT - - 6 5 5 N Fair - -
YC 19842 64 I-64 EB Queens Creek 1965 - VDOT - - 5 5 5 N Fair - -
YC 19843 64 I-64 WB Queens Creek 1965 - VDOT - - 5 5 5 N Fair - -
YC 19827 64 I-64 Skimino Creek 1956 1979 VDOT - - N N N 7 Good - -
YC 19832 64 I-64 EB WB Ramp to Route 143 1965 1982 VDOT - - 7 7 6 N Fair - -
YC 19856 134 Magruder Blvd EB Brick Kiln Creek 1973 - VDOT - - 6 6 6 N Fair - -
YC 19855 134 Magruder Blvd WB Brick Kiln Creek 1930 - VDOT - FO 5 5 5 N Fair - -
YC 19853 134 Magruder Blvd Route 17 1965 - VDOT - - 5 5 5 N Fair - -
YC 4290007P Old Williamsburg Road Colonial Parkway 1956 - Federal - - N 7 7 N Good - -
YC 19851 132 Route 132 Queens Creek 1996 - VDOT - - 7 7 7 N Good - -
YC 19857 143 Route 143 I-64 1965 - VDOT - FO 5 5 5 N Fair - -
YC 19860 143 Route 143 Queens Creek 1941 1944 VDOT - - 5 5 5 N Fair - -
YC 19866 199 Route 199 EB I-64 1977 - VDOT - - 6 6 5 N Fair - -
YC 19868 199 Route 199 WB I-64 1977 - VDOT - - 7 7 5 N Fair - -
YC 25213 199 Route 199 NB Mooretown Road 1999 - VDOT - - 6 7 7 N Fair - -
YC 25212 199 Route 199 SB Mooretown Road 1999 - VDOT - - 6 7 6 N Fair - -
YC 19862 199 Route 199 NB Routes 60 & 143 & CSX R/R 1977 - VDOT - - 6 5 6 N Fair - -
YC 19864 199 Route 199 SB Routes 60 & 143 & CSX R/R 1977 - VDOT - - 7 6 6 N Fair - -
YC 19877 646 Route 199/Newman Road EB I-64 1979 - VDOT - - 6 6 6 N Fair - -
YC 19879 646 Route 199/Newman Road WB I-64 1979 - VDOT - - 6 6 6 N Fair - -
YC 19874 631 Waterview Road Vepco Discharge Canal 1955 - Private - - N N N 6 Fair - -
YC 19875 631 Waterview Road Vepco Intake Canal 1955 1974 Private - - 7 6 7 N Fair - -
YC 19884 716 West Queens Drive I-64 1965 - VDOT - - 6 7 6 N Fair - -
YC 4290002P Yorktown Battlefield Tour Road Beaverdam Creek 1975 - Federal - FO 6 6 6 N Fair - Posted
YC 4290003P Yorktown Battlefield Tour Road Crawford Road 1956 - Federal - FO 6 6 7 N Fair - Posted
YC 4290004P Yorktown Battlefield Tour Road Route 17 1959 - Federal - FO 6 6 7 N Fair - Posted
Year
BuiltJuris
Federal
Bridge
# Route Facility Crossing
Year
Recnst Ownership
Bridge Condition RatingsFederal
PM Bridge
Condition
Posted
Weight
Limit
(tons)
Fracture
Critical
Source: HRTPO analysis of VDOT and FHWA data. Data as of December 2017. A description of codes used in this table is included on page 82.

APPENDIX E 138
HAMPTON ROADS REGIONAL BRIDGE STUDY – 2018 UPDATE
PUBLIC REVIEW AND COMMENTS
As part of the Hampton Roads Transportation Planning Organization’s
(HRTPO) efforts to provide opportunities for the public and
stakeholders to review and comment on this draft report prior to the
final product being published, a public review period was conducted
from April 3, 2018, through April 20, 2018. No public comments were
received.