Embed Size (px)
Citation preview

Hampshire Paper Consumption in Context
Trends in paper consumption; their economic and environmental effects

“The Paperless Office”
“global consumption of office paper more than doubled in the last two decades of the 20th century, as digital technology made printing cheaper and easier than ever before”(5).
Source: http://sustainablepractices.ning.com/pages/page/show?id=1037707%3APage%3A3601
Source: http://www.economist.com/opinion/displaystory.cfm?story_id=12381449

Potential Costs of High Levels of Paper Consumption
Economic Costs:• cost of paper for its manufacture• amount of ink and energy for printing,
copying, and faxing• cost of shipping more• cost of storing more• cost of disposing and recycling
Environmental Costs:• depleted forests• energy consumption used for cutting,
transporting, and pulping trees; • for manufacturing paper; for shipping paper• energy used to send paper to landfill or to
recycling facility(3)

In Focus: Forest Depletion• “Assuming the consumption rate of paper
for the previous two hundred years continues without intervention then in roughly 300 years the U.S. would completely deplete its forests. (2)”
• “In the last year [2006], logging in the Southeastern U.S. resulted in a loss of land about the size of New Jersey (5 million acres).(4)”
• Impact of Environmental Racism “Pulping the South” (6)

The Wages of Whiteness:Environmental effects of paper bleaching and processing
Air PollutionWater ConsumptionEnergy ConsumptionSolid Waste (slurry)
” A single pulp and paper facility that uses or stores chlorine or chlorine dioxide can endanger a large number of people. In Ohio, a single facility places 1.2 million people at risk in a worst-case chemical release; in Tennessee, a single facility endangers more than 600,000 people.”(7)

Getting Rid of It:the problems of paper disposal and recycling
• Paper makes up 40% of landfill waste in the U.S. (1)• Problems of Recycling:
– Requires an additional curbside-pickup truck – may reduce amount of new trees planted – can be more expensive than landfill disposal (8)

Paper Product Consumption at Hampshire College
• Looked at 2007-2008 & 2008-2009
• Paper, envelopes, paper towels, and toilet paper
• Got most of the information from Purchasing, but also talked to a lot of vendors
• Office survey

Uncertainties• Overlap of information from office survey and looking
at records.• Offices have their own budget to order things with-
how much/many paper products do they order without going through purchasing?
• Paper is complicated- what does the difference in thickness and color mean?
• Per capita- how do accurately account for the time students are here and their usage vs. time and use of faculty and staff?
• Input of information- how do you accurately crunch the numbers down with so many different units and kinds of data?!

04/19/23
Survey of Offices
• Survey of all Hampshire College offices, asking about paper consumption
• Focused on copy paper, envelopes, and tissues

04/19/23
Survey Results• Data from 6 offices so far:
– Library– Physical Plant– Institutional Advancement– Communications– HACU– Lemelson
• Average number of employees 60, range 9 (Communications) to 185 (HACU)
• Different offices have different activities, material needs

04/19/23
Survey Results• Printer/copier paper (fiscal year 2007):
– total 173 cases, average 29 cases/office, range 0 (Lemelson) to 79 cases (Library)
– mostly 8.5 x 11 in paper– average 0.45 cases per capita, range 0 (Lemelson) to
1.05 cases per capita (Library)
Paper consumption (cases)
0
10
20
30
40
50
60
70
80
90
Paper consumption (FY2007)
Library
Phys. Plant
Institutional Advancement
Communications
HACU
Lemelson
Paper consumption per capita (cases)
0
0.2
0.4
0.6
0.8
1
1.2
Paper per capita (FY2007)
Library
Phys. Plant
Institutional Advancement
Communications
HACU
Lemelson

04/19/23
Survey Results• Envelopes (fiscal year 2007):
– total 5500 envelopes, average 917 envelopes/office, range 0 (Physical Plant, Communications) to 3000 envelopes (HACU)
– average 12.35 envelopes per capita, range 0 (Physical Plant, Communications) to 51.28 envelopes per capita (Institutional Advancement)
Envelopes (number)
0
500
1000
1500
2000
2500
3000
3500
Envelopes (FY2007)
Library
Phys. Plant
Institutional Advancement
Communications
HACU
Lemelson
Envelopes per capita (number)
0
10
20
30
40
50
60
Envelopes per capita (FY2007)
Library
Phys. Plant
Institutional Advancement
Communications
HACU
Lemelson

04/19/23
Survey Results• Tissues (fiscal year 2007):
– total 46 boxes, average 7.67 boxes/office, range 0 (Physical Plant, Communications) to 24 boxes per office (Institutional Advancement)
– average 0.15 boxes per capita, range 0 (Physical Plant, Communications) to 0.62 boxes per capita (Institutional Advancement)
Tissues (boxes)0
5
10
15
20
25
30
Tissues (FY2007)
Library
Phys. Plant
Institutional Ad-vancement
Communications
HACU
Lemelson
Tissues per capita (boxes)0
0.1
0.2
0.3
0.4
0.5
0.6
0.7
Tissues per capita (FY2007)
Library
Phys. Plant
Institutional Ad-vancement
Communications
HACU
Lemelson

04/19/23
Survey Results
• For many offices, paper use fluctuates throughout the year.
• Paper waste:– on average, 94% of paper waste is recycled; range
80% (Lemelson) to 100% (Communications)– on average, 49% of paper waste comes from
incoming mail; range 5% (Institutional Advancement) to 80% (Communications)
“Most of the mail from other departments is a waste of paper. They should do it via email. A lot of it is stuff our department does not care about.” -Physical Plant

04/19/23
Survey Results
• Uses of paper:– on average, 68% of paper is used within the office
versus 32% sent out; range 15%/85% (Institutional Advancement) to 99%/1% (Physical Plant)
– average distribution of paper use:• 9% flyers/posters• 46% in-office use• 8% on-campus mail• 20% off-campus mail• 16% public/student use (e.g. in the library)

04/19/23
Survey ResultsLibrary
Flyers/posters
In-office use
On-campus mail
Off-campus mail
Public/student use
Institutional Advancement
Flyers/posters
In-office use
On-campus mail
Off-campus mail
Public/student use
Communications
Flyers/posters
In-office use
On-campus mail
Off-campus mail
Public/student use
HACU
Flyers/posters
In-office use
On-campus mail
Off-campus mail
Public/student use
Lemelson
Flyers/posters
In-office use
On-campus mail
Off-campus mail
Public/student use
AVERAGE
Flyers/posters
In-office use
On-campus mail
Off-campus mail
Public/student use

04/19/23
Survey Results
• Printers/copiers:– total 40 machines, average 6.67 machines per
office, range 4 (Communications, Lemelson) to 11 machines (Physical Plant)
– average 0.24 machines per capita, range 0.09 (Library) to 0.44 (Communications)
– 27% of machines are capable of double-sided printing
– 0% set to print double-sided as the default

04/19/23
Survey Results• Other paper products:
– 83% of offices surveyed use notepad/stationary paper
– 50% use notecards– 33% use postcards or other cards– 17% use cardboard– 83% use paper plates/bowls– 100% use paper cups– 83% use paper napkins– 83% use paper towels (not including paper towels
in bathrooms)

04/19/23
Survey Results• Other paper products used by offices include:
– letterhead– envelopes with HC logo– notes cards and note card envelopes– invitations and invitation envelopes– NSS magazines– Hampshire Reports alumni/family newsletter– paper cut in thirds for gift receipts– booklets– postcards– manila envelopes– hanging folders– labels– color paper– writing pads– vellum paper

04/19/23
Survey Results
• This is a small sample, probably not representative of all offices.
• Lots of variation between different offices.• Didn't include all paper products.• But we see many opportunities for
improvement...

Clark UniversityThe report found:• Total quantity of machine paper purchased by Clark
University departments-measured in reams of paper.• Total quantity of recycled content machine paper
purchased by Clark University departments—measured in reams of paper.
• Total quantity of recycled content "institutional" paper purchased by Clark—measured in volume.
• Total amount of paper recycled—measured in volume.• Access to recycling bins in offices, dorms, and common
rooms (including classrooms and computer facilities)—measured in number of bins/room.


Clark UniversityGoals and Next Steps
• Generate initiatives to create a culture of environmental sustainability around paper conservation (i.e., possibly increased use of digital communications, education and training on paper formatting, increased use of electronic devices in teaching, and incentives).
• Continue to research sources of paper and other products with lower ecological footprints

Clark UniversityPaper Facts
• 1 tree makes 16.67 reams of copy paper or 8,333.3 sheets• 720 trees are harvested each year to supply printer/copy
paper for Clark University• By using paper of 30% recycled content, only 504 trees are
needed to supply Clark University with its printer/copy paper for a year.
• Reducing copy paper consumption by 10% and by using 30% recycled content paper, only 453 trees will be cut to supply Clark University with its printer / copy paper next year

Goucher CollegePrint Wisely Program
In the Spring 2006 semester, Goucher College implemented a “Print Wisely” program. The purpose of this program is to discourage wasteful printing, conserve environmental resources, and control printing costs to avoid passing these rising costs to students. Decisions on the aspects of this program were developed in collaboration with students.
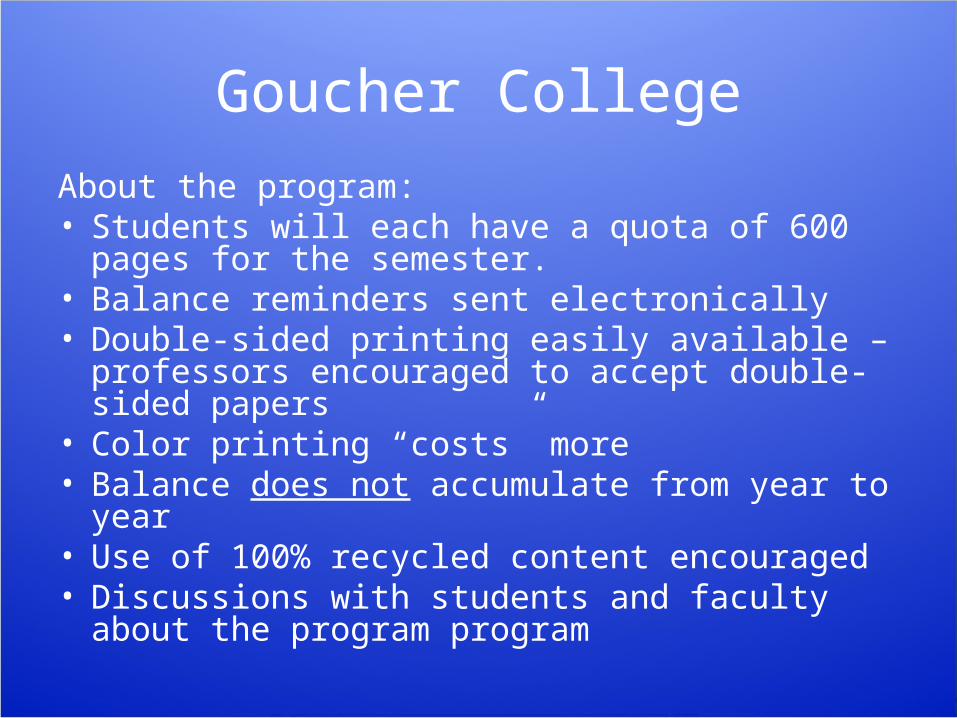
Goucher CollegeAbout the program:• Students will each have a quota of 600 pages for the
semester.• Balance reminders sent electronically• Double-sided printing easily available – professors
encouraged to accept double-sided papers• Color printing “costs” more• Balance does not accumulate from year to year• Use of 100% recycled content encouraged• Discussions with students and faculty about the
program program
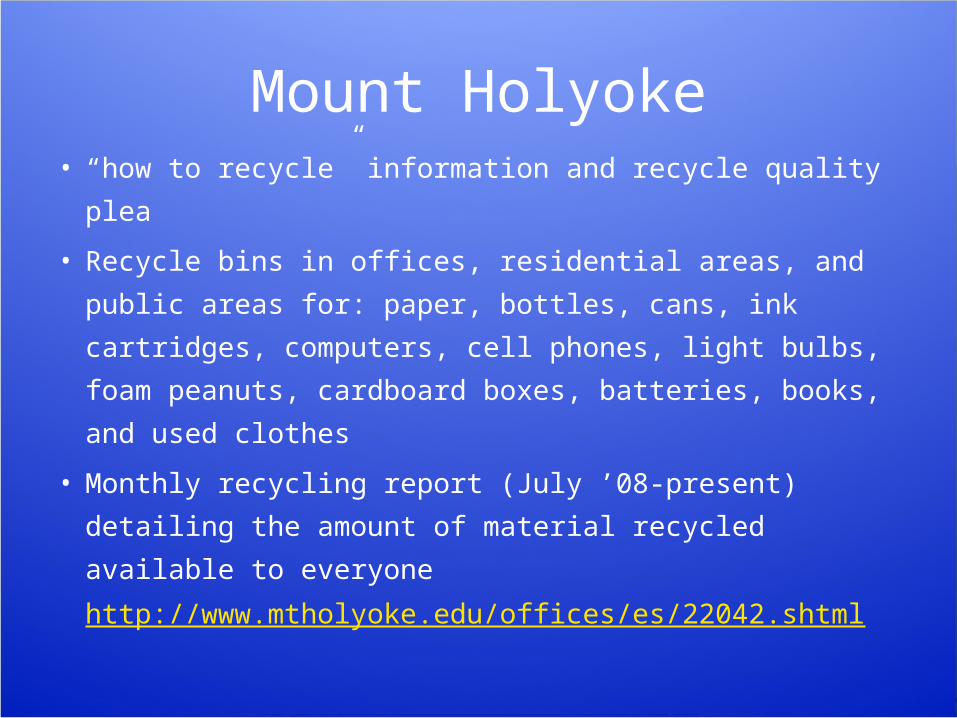
Mount Holyoke• “how to recycle” information and recycle quality plea
• Recycle bins in offices, residential areas, and public
areas for: paper, bottles, cans, ink cartridges,
computers, cell phones, light bulbs, foam peanuts,
cardboard boxes, batteries, books, and used clothes
• Monthly recycling report (July ’08-present) detailing
the amount of material recycled available to everyone
http://www.mtholyoke.edu/offices/es/22042.shtml

Tons Paper & Cardboard Recyclingat Mount Holyoke College
FY07-08 vs annual average of previous 5 fiscal years
185.65
153.94
0
50
100
150
200
250
5 yr historical FY07-08

Lbs paper & cardboard recycled per studentFY07-08
•Per capita data includes material from entire campus divided by number of students (as the common population denominator.
234.45
95.07
139.71163.61
Amherst Hampshire Mount Holyoke Smith0
50
100
150
200
250
300

What Hampshire can do to lower it’s Paper Consumption
1. Encourage double-sided printing for students and make it default setting for school printers
2. Encourage using smaller margins to save paper3. Limit or eliminate on-campus junk mail4. Limit or eliminate flyers5. Try do to more electronic and live communication6. Provide information on and resources for recycling
and re-use7. Create better, more convenient recycling facilities8. Limit or eliminate colored paper usage and other
non-recyclable paper products

Sources• http://www.woodconsumption.org/products/paper.pdf
• http://sustainablepractices.ning.com/pages/page/show?id=1037707%3APage%3A3601
• http://aesop.rutgers.edu/~envpurchase/materials_paper_consume.htm
• http://www.greenschools.net/news/paperarticle.htm
• http://www.economist.com/opinion/displaystory.cfm?story_id=12381449
• http://www.wrm.org.uy/plantations/information/Lang1.html
• http://www.environmentamerica.org/home/reports/report-archives/healthy-communities/healthy-communities/pulp-fiction-chemical-hazard-reduction-at-pulp-and-paper-mills
• http://en.wikipedia.org/wiki/Criticism_of_recycling#Working_conditions
• http://www.clarku.edu/offices/campusSustainability/energyuse/paperoverview.cfm
• http://www.goucher.edu/x2987.xml
• http://www.mtholyoke.edu/offices/es/8436.shtml


![[Oil & Gas White Paper] Optimizing Pipeline Energy Consumption](https://img.pdfslide.us/doc/110x75/5557551ad8b42aa8378b5365/oil-gas-white-paper-optimizing-pipeline-energy-consumption.jpg)