Embed Size (px)
Citation preview
Hammer, Sjurdur (2017) The use of eggs and diet of great skuas as
biomonitors in the Faroe Islands. PhD thesis.
https://theses.gla.ac.uk/8649/
Copyright and moral rights for this work are retained by the author
A copy can be downloaded for personal non-commercial research or study,
without prior permission or charge
This work cannot be reproduced or quoted extensively from without first
obtaining permission in writing from the author
The content must not be changed in any way or sold commercially in any
format or medium without the formal permission of the author
When referring to this work, full bibliographic details including the author,
title, awarding institution and date of the thesis must be given
Enlighten: Theses
https://theses.gla.ac.uk/
The use of eggs and diet of
great skuas as biomonitors
in the Faroe Islands
Sjúrður Hammer
BSc (Hons), MRes
Submitted in fulfilment of the requirements for the
Degree of Doctor of Philosophy
Institute of Biodiversity, Animal Health and Comparative Medicine,
College of Medical, Veterinary and Life Sciences
University of Glasgow
January 2016
Declaration
I declare that, except where explicit reference is made to the contribution of others, that
this dissertation is the result of my own work and has not been submitted for any other
degree at the University of Glasgow or any other institution.
The following chapters have been published in co-authorship with my supervisors and
others:
Chapter 4: Hammer, S., Nager, R. G., Alonso, S., McGill, R. A. R., Furness, R. W., Dam,
M., Legacy Pollutants are Declining in Great Skuas (Stercorarius skua) but Remain Higher
in Faroe Islands than in Scotland (2016), Bulletin of Environmental Contamination and
Toxicology, DOI: 10.1007/s00128-016-1856-x
Chapter 5: Hammer, S., Nager, R. G., Johnson, P. G. D., Furness, R. W., Provencher, J. P.,
Plastic debris in great skua (Stercorarius skua) pellets corresponds to seabird prey species,
Marine Pollution Bulletin (2016), DOI: 10.1016/j.marpolbul.2015.12.018
Signature ____________________ Printed name __________________________
Glasgow 2017
3
Contents
Acknowledgements. ........................................................................................................ 7
1. General Introduction ................................................................................................... 8
Biomonitoring in the Northeast Atlantic ...................................................................... 11
Natural history and ecology of the great skua in the Faroe Islands .............................. 12
Aims .............................................................................................................................. 18
2. Diet of great skua in the Faroe Islands ...................................................................... 20
Introduction ................................................................................................................... 20
Method .......................................................................................................................... 22
Results ........................................................................................................................... 27
Discussion ..................................................................................................................... 29
3. Temporal and spatial variation in seabird egg sizes.................................................. 37
Introduction ................................................................................................................... 37
Method .......................................................................................................................... 39
Results ........................................................................................................................... 41
Discussion ..................................................................................................................... 44
4. Legacy Pollutants are Declining in Great Skuas (Stercorarius skua) but Remain
Higher in Faroe Islands than in Scotland ......................................................................... 51
Introduction ................................................................................................................... 51
Method .......................................................................................................................... 52
Results and Discussion ................................................................................................. 55
5. Plastic debris in great skua (Stercorarius skua) pellets corresponds to seabird prey
species .............................................................................................................................. 61
Introduction ................................................................................................................... 61
Method .......................................................................................................................... 63
Results ........................................................................................................................... 65
Discussion ..................................................................................................................... 66
6. General discussion .................................................................................................... 72
7. References ................................................................................................................. 76
4
List of tables
Table 2.1: Types of pellets, categorised as birds, egg, fish, and other. In order to
correspond pellets to meals a correction factor (Votier et al. 2001) was applied. Body mass
of birds was calculated from mean species specific body masses (Dunning 1992) and
average fish size assumed to be 300g.
Table 2.2: Spearman ranked correlations between number of pellets collected (pre-
egglaying) per territory and proportion of pellets with bird, fish or other remains against
stable isotope signature from egg content or adult blood samples.
Table 2.3 Linear mixed effects model with territory cluster as random effect. Various
dietary parameters against breeding parameters.
Table 2.4 Linear mixed effects model with territory cluster as random effect. Various
dietary parameters against breeding parameters.
Table 3.1. Sample sizes (clutches) of great skua, guillemot and fulmar egg measurements
in the field. *excluding eggs from 1992,1993 (Ratcliffe, 1993) and 2013 due to
supplementary feeding experiment.
Table 3.2. Sample sizes (clutches) of great skua, guillemot and fulmar egg measurements
in museum collections.
Table 4.1. Mean (standard deviation) and median (range) concentrations (µg/kg wet
weight) of organochlorines assayed in great skua eggs from the Faroes in 1977 (Bloch et
al., 1987), from the Faroes in 2012 (this study) and from Shetland 2008 (Leat et al 2011).
For the t-test and Welch test the data were log transformed. Comparisons between 1977
and 2012 of Faroes eggs and between Faroese eggs in 2012 and Shetland eggs in 2008 are
shown with significant differences after Bonferroni correction (corrected p = 0.0038)
highlighted in bold. a n=18, b n=10.
Table 4.2. Spearman rank correlations between POPs and δ15N ratio in great skua
eggshells. *Tied values.
Table 5.1. Types of pellets and which contained plastic, and a modelled prevalence of
plastic assuming a binomial distribution with 95% confidence interval and territory as
random effect. a Other types of pellets included eggs, insects, sheep and terrestrial birds. b
Computation of 95% CI for this category was not possible.
5
Table 5.2. Mean number and mass abundance and standard deviation of different plastic
types found in different pellet types. Prevalence is percentage of occurrence in pellets of
that prey type.
List of figures
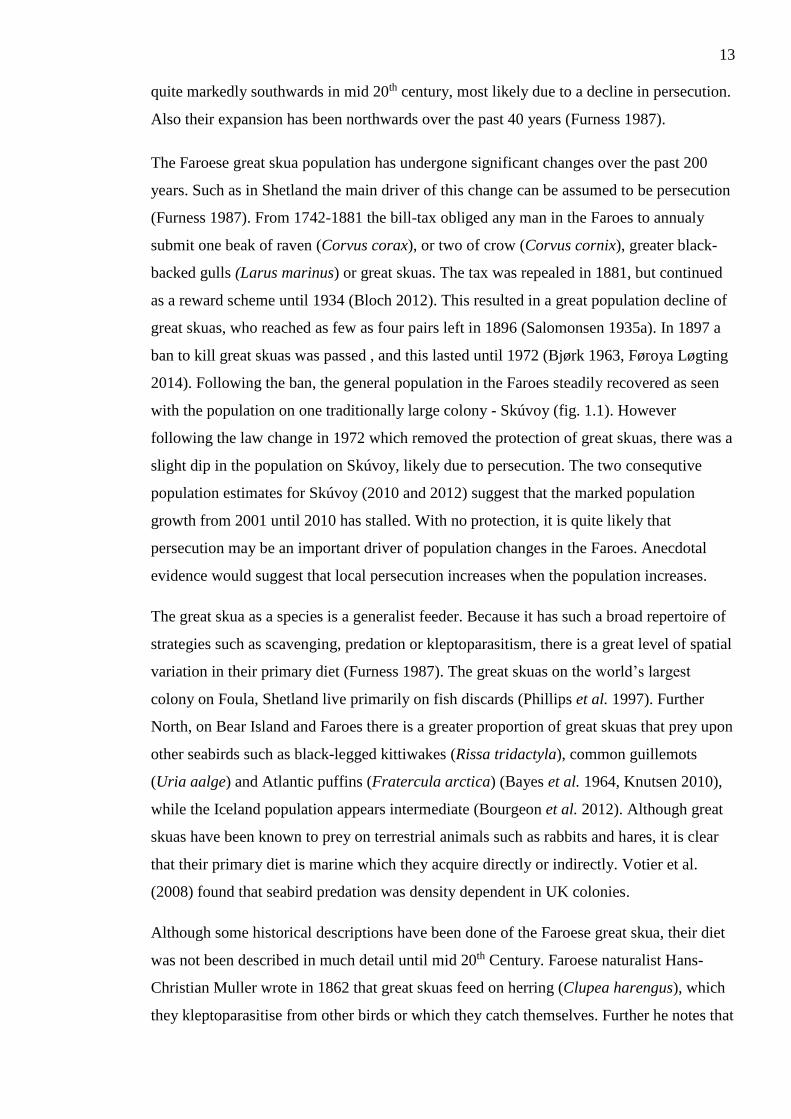
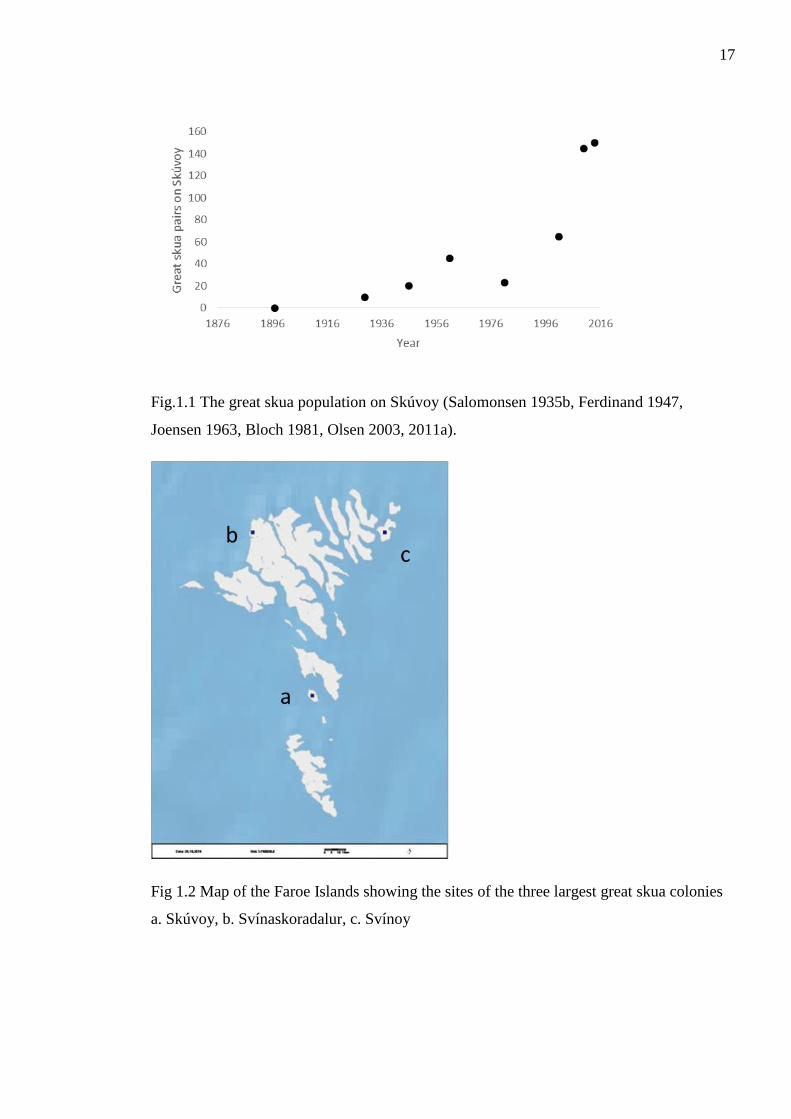
Figure1.1 The great skua population on Skúvoy (Salomonsen 1935b, Ferdinand 1947,
Joensen 1963, Bloch 1981, Olsen 2003, 2011a).
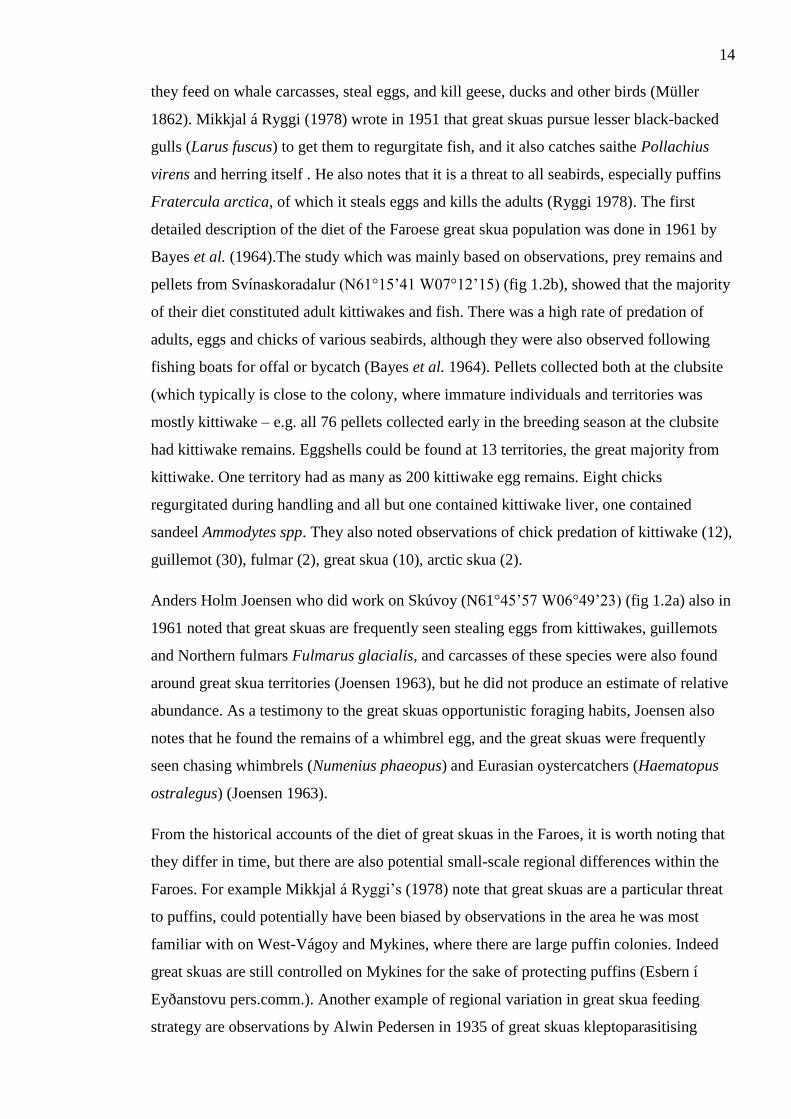
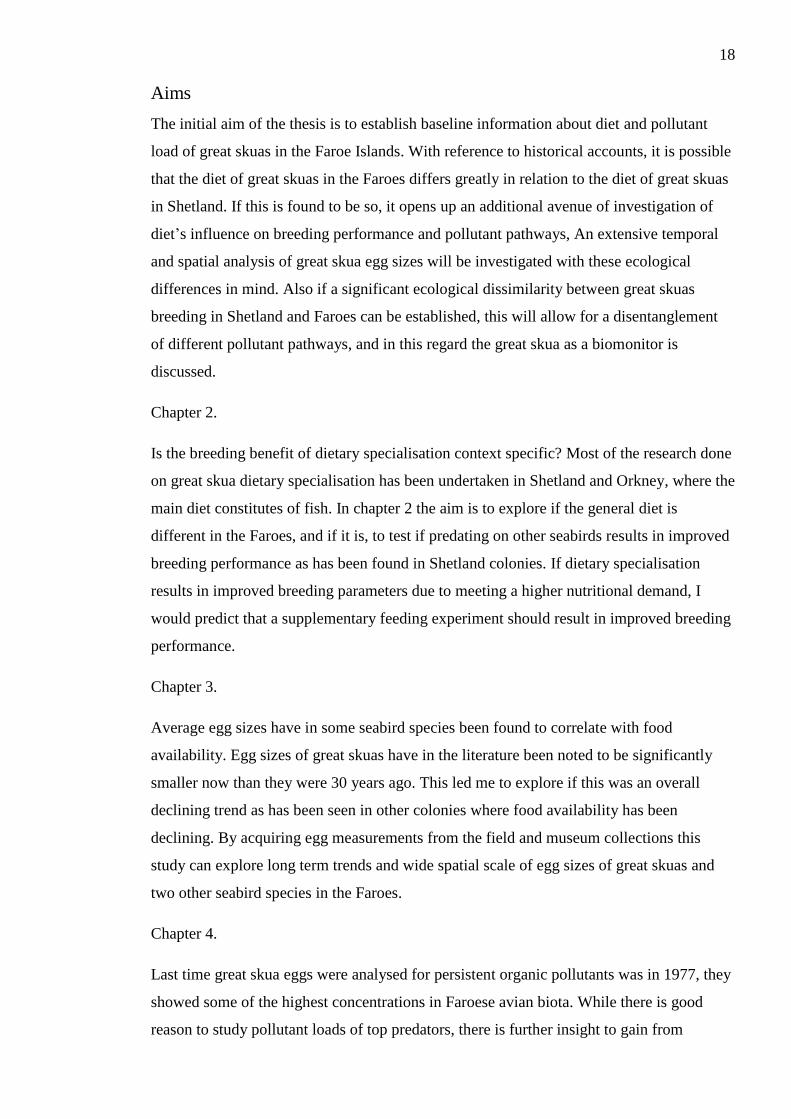
Figure 1.2 Map of the Faroe Islands showing the sites of the three largest great skua
colonies a. Skúvoy, b. Svínaskoradalur, c. Svínoy (Kortal.fo)
Figure 2.1 Showing experimental setup at the great skua colony on Skúvoy. The green
points are experimentally fed pairs, and red are control pairs, A-D annotate the
experimental zones (Google Earth, Kortal.fo).
Figure. 2.2: Number of territories’ percentage occurrence of different types of pellets.
These histograms include all territories where pellets were found (including those where
fewer than 5 pellets were found).
Figure. 2.3: Quadratic regression through egg density measurements of eggs of known
hatching dates. Marginal r2 is 0.8865 and conditional r2 is 0.9850. The solid line shows the
quadratic regression line and the dotted lines represent the 95% confidence interval.
Figure 2.4 Stable isotope ratio of chick downfeathers and dietary reference materials
Figure 3.1: Spatial variation in the egg volume of great skua eggs in a single season (2014)
between four regions with regions in order of lattitude (most northerly region at the top and
the most southerly at the bottom of the vertical axis). Only field measurements included.
Figure 3.2: Spatial variation in great skua egg volume (1980-2014) with regions in order of
lattitude (most northerly region at the top and the most southerly at the bottom of the
vertical axis). Both museum and field measurements were included.
Figure 3.3: Spatial variation in the size of great skua eggs from 1945-1959 measured from
museum eggs. Iceland (n=90), Faroe Islands (n=30), Shetland (n=50)
6
Figure 3.4 a-c: Egg volume data and modelled mean great skua egg sizes (solid lines) in (a)
Faroes, (b) Shetland and (c) Iceland with year as random effect, shown with 95%
confidence interval (dotted lines).
Figure 3.5: Temporal differences in egg volume index of fulmar, great skua and guillemot
eggs from the Faroes. Egg volume index was used to compare egg size between species.
Period 1 is from 1840 – 1909, period 2 from 1910 – 1979, and period 3 from 1980-2014.
Figure 4.1. Showing historic and contemporary (Bloch et al. 1987; Leat et al. 2011; this
study) concentrations of three compounds from great skua eggs as log transformed means.
Open circles are Shetland and filled circles are Faroes.
Figure 5.1. Sample of plastic debris pieces recovered from great skua regurgitated pellets.
A – shows industrial plastics (two small black pellets at the top left), and hard fragment
plastics. B – threadlike plastic pieces. Minor grid paper shows 1 mm by 1 mm dimensions.

7
I won’t be the last
I won’t be the first
Find a way to where the sky meets the earth
It’s all right and all wrong
For me it begins at the end of the road
We come and go…
Eddie Vedder
Acknowledgements.
First and foremost I must thank my supervisors Dr. Ruedi Nager, Prof. Robert W. Furness
and Dr. Maria Dam for their extensive help and support in the work of completing this
thesis. A special thanks to Harry Jensen, Tummas Frank Joensen and Johan Hentze, Inga
Tórarenni and Jóannes Mikkelsen for granting me access to their land and for a friendly
and cooperative spirit throughout my work on Skúvoy. Also thanks to Marius á Geilini for
guidance and interesting conversations in Svínoy and Jóhan Jógvansson in Saksun. Many
thanks to, Líggjas á Váli Smith, Rune Skjold Tjørnløv, Martin Berg, Martin Sirkovsky,
Kees Schreven, Jónheðin Tróndheim, Marius Stokke Sønnedal, Rakul Mortensen, Katrin
Hoydal, that kindly helped me with fieldwork on Skúgvoy. Thanks to all the researchers
who donated their field egg measurements, and museums who kindly measured eggs for
me. Thanks to the staff at the Environment Agency who allowed me to use their facilities
for my sometimes smelly business. Thanks to Rona A. R. McGill and Jason Newton for
hosting my SI analysis at SUERC. Thanks to G.R. Potts, Bergur Olsen and Jens-Kjeld
Jensen for frequent correspondence about seabird ecology and natural history in the
Faroes. Also I’m thankful for all the people I’ve had the pleasure of sharing office 517
with, Eliza Leat, Gemma Jennings, Alex Robbins, Adam D. P. Cross, Bianca Pinto Vieira,
Nina O’Hanlon, James Grecian, Paul Jerem, Laura Allen, Susanne van Donk and Sarah
Alonso. Apologies for the hours of distractions I may have incurred upon you! Last, but
not least I would like to thank Sára P. Rasmussen and my parents Lis and Jógvan Hammer
for their loving support during this chapter in my life, and for always being ready to help
wherever and whenever they can.
8
1. General Introduction
All biological life needs energy for survival, growth and reproduction. Numerous
morphological, physiological and behavioural adaptations have arisen for organisms to
acquire the necessary resources of energy and nutrients. For free-ranging animals, this
generally involves foraging behaviours (Levin 2009). While some organisms are able to
utilise energy and elements directly from the environment - autotrophs, most animals are
heterotrophs and acquire these resources from autotrophs. Resources can be broadly
categorised as substitutable, essential or hemi-essential, and these vary in the degree that
they influence the rate of population growth of the consumer (Tilman 1982). Resources in
this regard are typically considered in pairs. Substitutable resources can be replaced with
one another without loss of time or nutritional value. Essential resources are necessary for
life, and if a pair of essential resources are considered, the maximum growth rate of a
species will be determined by which resource is more limiting. Hemi-essential resources
can be where one resource is nutritionally complete, and others may lack key elements.
From these general categories of resources, there are numerous constellations of resource
pairs, and these can be divided as linear, concave or convex (Tilman 1982). However,
resources shall not be considered solely for their nutritional value, as there are many other
factors, which influence the access and suitability of resources at any given time. Resource
acquisition or foraging can for many animals be limited spatially and temporally, for
example in order to avoid predators, or socially learned behaviour from conspecifics
(Brown 1999). So the value of resources is relative to their accessibility. Optimal foraging
theory proposes that organisms will search for and consume food which is optimal relative
to the time and energy it has spent finding and digesting it (Begon et al. 2006).
One important feature of resources is that they are consumable. If, as it frequently is in
nature, resources are limited in supply consumption of it makes a resource unavailable for
others, which gives rise to resource competition. David Tilman (1982) proposed that if two
or more species require the same resource, the one which has the highest rate of per capita
growth at the lowest resource level, will exclude all other species, and this became known
as the R* rule (Tilman 1982). In other words competition under the R* rule will favour one
until the other is extinct. However, in the natural environment competing species are
widely observed, so there are apparently other mechanisms, which allow for coexistence of
competing species.
9
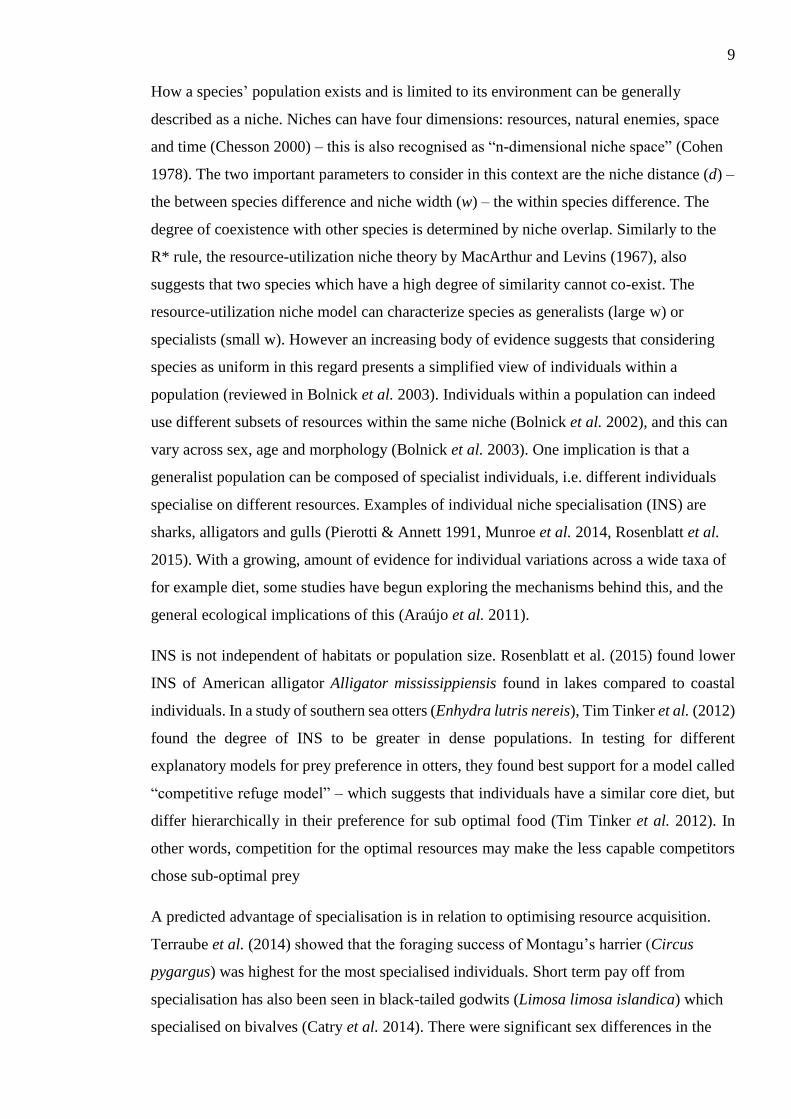
How a species’ population exists and is limited to its environment can be generally
described as a niche. Niches can have four dimensions: resources, natural enemies, space
and time (Chesson 2000) – this is also recognised as “n-dimensional niche space” (Cohen
1978). The two important parameters to consider in this context are the niche distance (d) –
the between species difference and niche width (w) – the within species difference. The
degree of coexistence with other species is determined by niche overlap. Similarly to the
R* rule, the resource-utilization niche theory by MacArthur and Levins (1967), also
suggests that two species which have a high degree of similarity cannot co-exist. The
resource-utilization niche model can characterize species as generalists (large w) or
specialists (small w). However an increasing body of evidence suggests that considering
species as uniform in this regard presents a simplified view of individuals within a
population (reviewed in Bolnick et al. 2003). Individuals within a population can indeed
use different subsets of resources within the same niche (Bolnick et al. 2002), and this can
vary across sex, age and morphology (Bolnick et al. 2003). One implication is that a
generalist population can be composed of specialist individuals, i.e. different individuals
specialise on different resources. Examples of individual niche specialisation (INS) are
sharks, alligators and gulls (Pierotti & Annett 1991, Munroe et al. 2014, Rosenblatt et al.
2015). With a growing, amount of evidence for individual variations across a wide taxa of
for example diet, some studies have begun exploring the mechanisms behind this, and the
general ecological implications of this (Araújo et al. 2011).
INS is not independent of habitats or population size. Rosenblatt et al. (2015) found lower
INS of American alligator Alligator mississippiensis found in lakes compared to coastal
individuals. In a study of southern sea otters (Enhydra lutris nereis), Tim Tinker et al. (2012)
found the degree of INS to be greater in dense populations. In testing for different
explanatory models for prey preference in otters, they found best support for a model called
“competitive refuge model” – which suggests that individuals have a similar core diet, but
differ hierarchically in their preference for sub optimal food (Tim Tinker et al. 2012). In
other words, competition for the optimal resources may make the less capable competitors
chose sub-optimal prey
A predicted advantage of specialisation is in relation to optimising resource acquisition.
Terraube et al. (2014) showed that the foraging success of Montagu’s harrier (Circus
pygargus) was highest for the most specialised individuals. Short term pay off from
specialisation has also been seen in black-tailed godwits (Limosa limosa islandica) which
specialised on bivalves (Catry et al. 2014). There were significant sex differences in the
10
degree of specialisation, and this is likely due to sexual dimorphism. However, the study
also found evidence for specialisation independent on morphology and sex, and found that
specialist feeders had a higher intake rate than non-specialists (Catry et al. 2014)
The degree of specialisation can have implications for the extinction risk of some species to
environmental change (Colles et al. 2009). The relative quantification of specialisation is
receiving increased attention. For example a recent study created a community specialisation
index and applied it to a spatial scale (Vimal & Devictor 2014). The loss of habitat
heterogeneity in Europe would for example has been predicted to result in fewer specialists
and more generalists, but this is not found to be the case universally (Sullivan et al. 2016).
Sullivan et al. (2016) showed a slight increase in UK specialist populations over the past two
decades, and propose that the decline in habitat heterogeneity has resulted in declines of
moderate generalists.
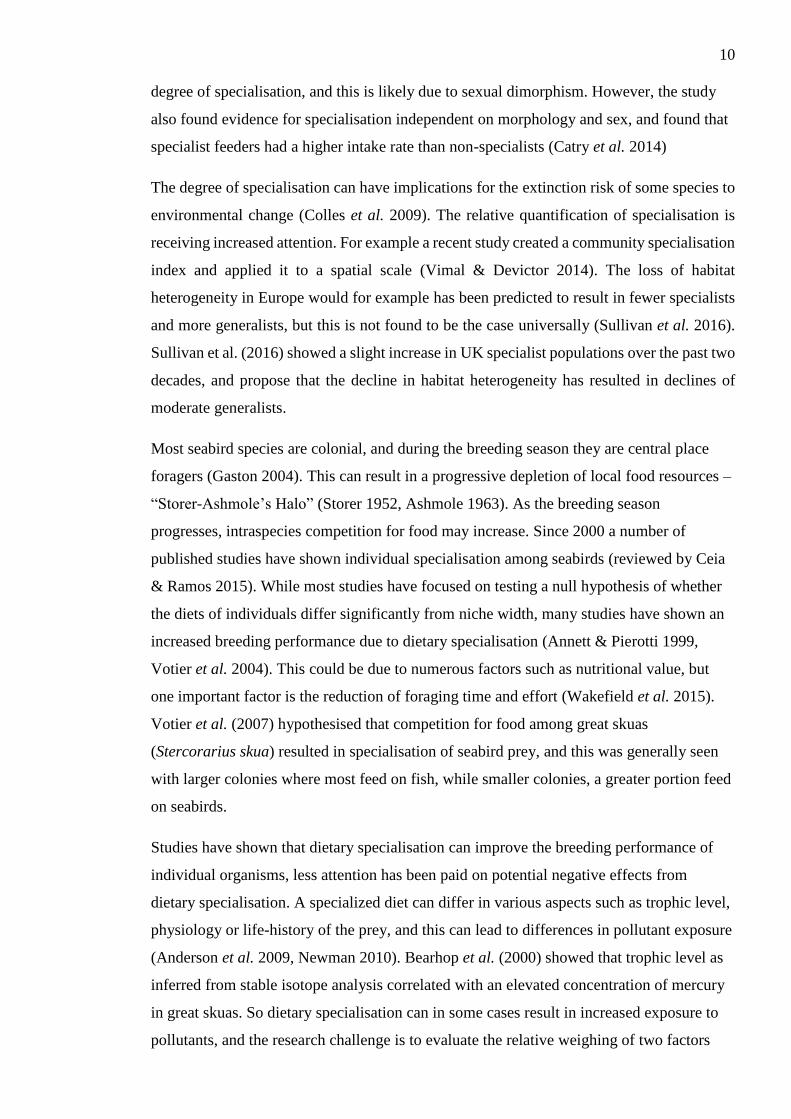
Most seabird species are colonial, and during the breeding season they are central place
foragers (Gaston 2004). This can result in a progressive depletion of local food resources –
“Storer-Ashmole’s Halo” (Storer 1952, Ashmole 1963). As the breeding season
progresses, intraspecies competition for food may increase. Since 2000 a number of
published studies have shown individual specialisation among seabirds (reviewed by Ceia
& Ramos 2015). While most studies have focused on testing a null hypothesis of whether
the diets of individuals differ significantly from niche width, many studies have shown an
increased breeding performance due to dietary specialisation (Annett & Pierotti 1999,
Votier et al. 2004). This could be due to numerous factors such as nutritional value, but
one important factor is the reduction of foraging time and effort (Wakefield et al. 2015).
Votier et al. (2007) hypothesised that competition for food among great skuas
(Stercorarius skua) resulted in specialisation of seabird prey, and this was generally seen
with larger colonies where most feed on fish, while smaller colonies, a greater portion feed
on seabirds.
Studies have shown that dietary specialisation can improve the breeding performance of
individual organisms, less attention has been paid on potential negative effects from
dietary specialisation. A specialized diet can differ in various aspects such as trophic level,
physiology or life-history of the prey, and this can lead to differences in pollutant exposure
(Anderson et al. 2009, Newman 2010). Bearhop et al. (2000) showed that trophic level as
inferred from stable isotope analysis correlated with an elevated concentration of mercury
in great skuas. So dietary specialisation can in some cases result in increased exposure to
pollutants, and the research challenge is to evaluate the relative weighing of two factors
11
which can potentially influence the breeding performance of individuals - dietary
specialisation and pollutant exposure.
Biomonitoring in the Northeast Atlantic
Chemical compounds, whether they are designed with specific purposes such as pesticides
or flame retardants or secondary emissions or by-products from industrial production, enter
into the environment, where they can have unforeseen detrimental effects on a wide
ranging scale from the cellular to ecosystem level within the system in which they are
released (Peakall 2007). Detrimental effects of chemical pollution include suppression of
the immune system, hormonal disturbance, and serious neurological and kidney damage
(Wolfe et al. 1998, de Wit et al. 2002). Due to these detrimental effects of chemical
pollutants, there is concern not only about hazards to human health through consumption,
but also about their possible toxic effects on wildlife (Muir & de Wit 2010). The main
chemical pollutants which have attracted concern are known as persistent organic
pollutants (POPs) (Newman 2010). Although in Europe and North America the use of
some pollutants has been banned or is restricted (e.g. organochlorine insecticides) (Lead et
al. 1997) other emerging pollutants (e.g.brominated flame retardants, perfluorinated
substances (PFAS) and dioxin-like PCBs) are generally found to increase and present a
threat to human and wildlife (Lindström et al. 1999, Lavoie et al. 2010, Muir & de Wit
2010).
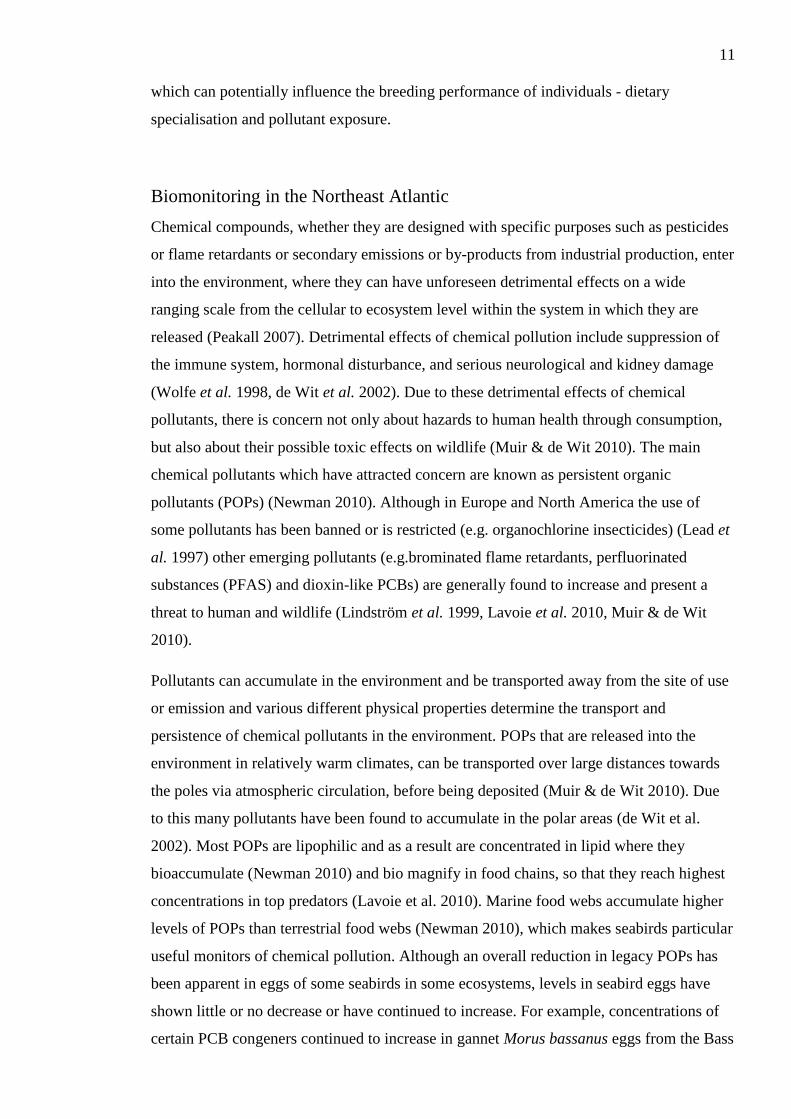
Pollutants can accumulate in the environment and be transported away from the site of use
or emission and various different physical properties determine the transport and
persistence of chemical pollutants in the environment. POPs that are released into the
environment in relatively warm climates, can be transported over large distances towards
the poles via atmospheric circulation, before being deposited (Muir & de Wit 2010). Due
to this many pollutants have been found to accumulate in the polar areas (de Wit et al.
2002). Most POPs are lipophilic and as a result are concentrated in lipid where they
bioaccumulate (Newman 2010) and bio magnify in food chains, so that they reach highest
concentrations in top predators (Lavoie et al. 2010). Marine food webs accumulate higher
levels of POPs than terrestrial food webs (Newman 2010), which makes seabirds particular
useful monitors of chemical pollution. Although an overall reduction in legacy POPs has
been apparent in eggs of some seabirds in some ecosystems, levels in seabird eggs have
shown little or no decrease or have continued to increase. For example, concentrations of
certain PCB congeners continued to increase in gannet Morus bassanus eggs from the Bass
12
Rock, east Scotland from 1990 to 2004 (Braune et al. 2007, Helgason et al. 2008, Pereira
et al. 2009). Because of global spread of POPs to the Arctic, much of the emphasis on
monitoring trends in legacy POPs has focused on Arctic marine ecosystems, while few
data are available from lower latitudes. In the context of the marine ecosystem around the
British Isles for example, Pereira et al. (2009) concluded “The lack of any decline in some
contaminants, for example some of the heavier PCB congeners in gannets at Bass Rock,
highlights a need for further monitoring to determine future risk”. In recent decades, new
“emerging” POPs have also appeared in seabird eggs, including PBDEs and PFAS (Lavoie
et al. 2010). For example in an environmental report by the Nordic Ministers council there
were detectable concentrations of PFOS in fulmar Fulmarus glacialis eggs sampled in the
Faroes (Kallenborn et al. 2004).
In many pollutant monitoring programmes birds eggs are used, as they are generally easier
to sample and standardise, and they require less destructive sampling than sampling for
internal tissues. Many studies have quantified the correlation between egg concentrations
and other tissues of birds (reviewed in Beyer & Meador 2011). For many seabird species
such sampling has been undertaken in the past which allows for examining temporal
differences. Collecting eggshells post hatching may also provide for suitable samples, as
eggshell thickness, pigmentation and the chorioallantoic membranes (CAMs) have all been
used as pollutant indicators in various bird species (Blus et al. 1972, Cobb et al. 2003,
Jagannath et al. 2008). Using eggs also allows for examining maternal transfer of
pollutants, directly and indirectly. Lipophilic compounds are transferred along with fat into
developing eggs, and concentrations in eggs reflect the contaminant burden of the female
at the time of laying, especially the uptake of contaminants from food recently ingested
around the colony (Braune & Norstrom 1989, Becker et al. 2001).
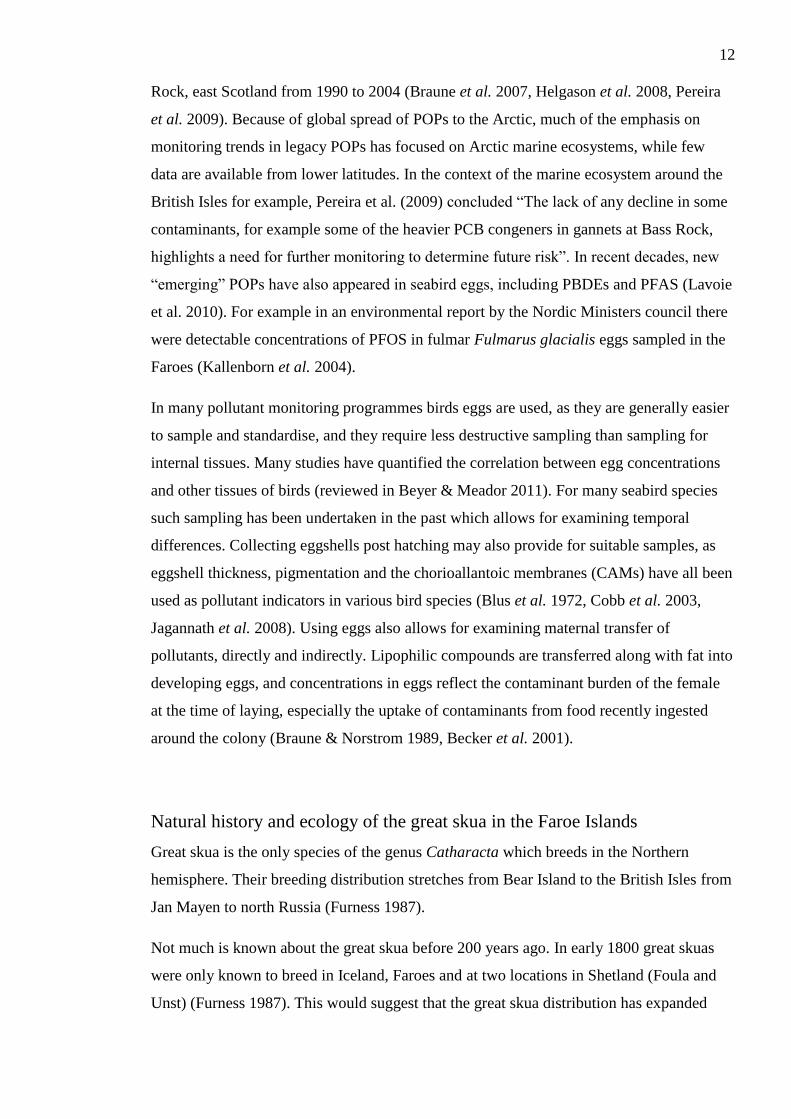
Natural history and ecology of the great skua in the Faroe Islands
Great skua is the only species of the genus Catharacta which breeds in the Northern
hemisphere. Their breeding distribution stretches from Bear Island to the British Isles from
Jan Mayen to north Russia (Furness 1987).
Not much is known about the great skua before 200 years ago. In early 1800 great skuas
were only known to breed in Iceland, Faroes and at two locations in Shetland (Foula and
Unst) (Furness 1987). This would suggest that the great skua distribution has expanded
13
quite markedly southwards in mid 20th century, most likely due to a decline in persecution.
Also their expansion has been northwards over the past 40 years (Furness 1987).
The Faroese great skua population has undergone significant changes over the past 200
years. Such as in Shetland the main driver of this change can be assumed to be persecution
(Furness 1987). From 1742-1881 the bill-tax obliged any man in the Faroes to annualy
submit one beak of raven (Corvus corax), or two of crow (Corvus cornix), greater black-
backed gulls (Larus marinus) or great skuas. The tax was repealed in 1881, but continued
as a reward scheme until 1934 (Bloch 2012). This resulted in a great population decline of
great skuas, who reached as few as four pairs left in 1896 (Salomonsen 1935a). In 1897 a
ban to kill great skuas was passed , and this lasted until 1972 (Bjørk 1963, Føroya Løgting
2014). Following the ban, the general population in the Faroes steadily recovered as seen
with the population on one traditionally large colony - Skúvoy (fig. 1.1). However
following the law change in 1972 which removed the protection of great skuas, there was a
slight dip in the population on Skúvoy, likely due to persecution. The two consequtive
population estimates for Skúvoy (2010 and 2012) suggest that the marked population
growth from 2001 until 2010 has stalled. With no protection, it is quite likely that
persecution may be an important driver of population changes in the Faroes. Anecdotal
evidence would suggest that local persecution increases when the population increases.
The great skua as a species is a generalist feeder. Because it has such a broad repertoire of
strategies such as scavenging, predation or kleptoparasitism, there is a great level of spatial
variation in their primary diet (Furness 1987). The great skuas on the world’s largest
colony on Foula, Shetland live primarily on fish discards (Phillips et al. 1997). Further
North, on Bear Island and Faroes there is a greater proportion of great skuas that prey upon
other seabirds such as black-legged kittiwakes (Rissa tridactyla), common guillemots
(Uria aalge) and Atlantic puffins (Fratercula arctica) (Bayes et al. 1964, Knutsen 2010),
while the Iceland population appears intermediate (Bourgeon et al. 2012). Although great
skuas have been known to prey on terrestrial animals such as rabbits and hares, it is clear
that their primary diet is marine which they acquire directly or indirectly. Votier et al.
(2008) found that seabird predation was density dependent in UK colonies.
Although some historical descriptions have been done of the Faroese great skua, their diet
was not been described in much detail until mid 20th Century. Faroese naturalist Hans-
Christian Muller wrote in 1862 that great skuas feed on herring (Clupea harengus), which
they kleptoparasitise from other birds or which they catch themselves. Further he notes that
14
they feed on whale carcasses, steal eggs, and kill geese, ducks and other birds (Müller
1862). Mikkjal á Ryggi (1978) wrote in 1951 that great skuas pursue lesser black-backed
gulls (Larus fuscus) to get them to regurgitate fish, and it also catches saithe Pollachius
virens and herring itself . He also notes that it is a threat to all seabirds, especially puffins
Fratercula arctica, of which it steals eggs and kills the adults (Ryggi 1978). The first
detailed description of the diet of the Faroese great skua population was done in 1961 by
Bayes et al. (1964).The study which was mainly based on observations, prey remains and
pellets from Svínaskoradalur (N61°15’41 W07°12’15) (fig 1.2b), showed that the majority
of their diet constituted adult kittiwakes and fish. There was a high rate of predation of
adults, eggs and chicks of various seabirds, although they were also observed following
fishing boats for offal or bycatch (Bayes et al. 1964). Pellets collected both at the clubsite
(which typically is close to the colony, where immature individuals and territories was
mostly kittiwake – e.g. all 76 pellets collected early in the breeding season at the clubsite
had kittiwake remains. Eggshells could be found at 13 territories, the great majority from
kittiwake. One territory had as many as 200 kittiwake egg remains. Eight chicks
regurgitated during handling and all but one contained kittiwake liver, one contained
sandeel Ammodytes spp. They also noted observations of chick predation of kittiwake (12),
guillemot (30), fulmar (2), great skua (10), arctic skua (2).
Anders Holm Joensen who did work on Skúvoy (N61°45’57 W06°49’23) (fig 1.2a) also in
1961 noted that great skuas are frequently seen stealing eggs from kittiwakes, guillemots
and Northern fulmars Fulmarus glacialis, and carcasses of these species were also found
around great skua territories (Joensen 1963), but he did not produce an estimate of relative
abundance. As a testimony to the great skuas opportunistic foraging habits, Joensen also
notes that he found the remains of a whimbrel egg, and the great skuas were frequently
seen chasing whimbrels (Numenius phaeopus) and Eurasian oystercatchers (Haematopus
ostralegus) (Joensen 1963).
From the historical accounts of the diet of great skuas in the Faroes, it is worth noting that
they differ in time, but there are also potential small-scale regional differences within the
Faroes. For example Mikkjal á Ryggi’s (1978) note that great skuas are a particular threat
to puffins, could potentially have been biased by observations in the area he was most
familiar with on West-Vágoy and Mykines, where there are large puffin colonies. Indeed
great skuas are still controlled on Mykines for the sake of protecting puffins (Esbern í
Eyðanstovu pers.comm.). Another example of regional variation in great skua feeding
strategy are observations by Alwin Pedersen in 1935 of great skuas kleptoparasitising
15
Northern gannet Morus bassanus on Mykines (Pedersen 1935). The older historic accounts
and the study from 1961 suggest that great skuas in the Faroes predate to a higher extent on
other seabirds compared to Shetland which feed mainly on fish (Furness 1987).
From historic studies on the diet of Faroese great skuas, it appears that they may be feeding
at a higher trophic level than the Shetland population (Bayes et al. 1964, Furness 1979).
Due to the great skua’s opportunistic nature, variation in diet can be expected between
colonies in the Faroes and Shetland, and will give an opportunity to examine whether a
high pollutant load reflects predatory specialisation. The Faroese great skua population has
three main colonies with approximately 100-200 pairs each: Skúvoy (which will be the
main study site), Saksun and Svínoy, with numerous smaller sub-colonies of 5-20 pairs.
Although the monitoring on Skúvoy has shown an overall decline in seabird numbers, prey
availability for skuas can be considered still to be relatively abundant (Olsen 2011b).
Studies of the great skua in Shetland, Iceland and Bear Island, have shown that those
closest to the Arctic (Bear Island) are most polluted with POPs, and the Shetland
population least polluted (Bourgeon et al. 2012). Whether this is due to a difference in diet
or the geographical variation of POPs remains uncertain.
Due to the Faroese great skua’s diet of predominantly seabirds, they can be expected to
accumulate pollutants (heavy metals and POPs) predominantly from marine sources. A
study on pollutant load of Faroese great skuas from 1977 has reported levels of total
mercury, dieldrin, DDE and ∑PCB in 19 great skua eggs (Bloch et al. 1987). These levels
were higher than found in great skuas in Scotland (Leat et al. 2011), presumably at least in
part due to the higher trophic level of great skuas in the Faroes. Although Bourgeon et al.
(2012) did not detect an elevated stress level associated with the high pollutant load in the
Bear Island great skuas, a combined effect of reduced food and high pollutant load,
resulted in reduced reproductive success in great skuas (Bustnes et al. 2015).
Due to the significant spatial variation of great skua diet, gaining more insight into the diet
of Faroese great skuas is important in relation to their pollutant exposure. In addition, the
link between diet specialisation and pollutant load deserves more detailed study.
Globally the great skua population at 16.000 pairs is of “least concern” (BirdLife
International 2012). However its geographically limited distribution means that local
threats at colonies can have disproportionally high impact on the population. An overall
decline in productivity in UK colonies since 2000 (JNCC 2016), will likely result in
population declines over the next decade, and this has been observed for the larger colony
16
on Shetland and Orkney (Furness, pers. comm.,Meek et al. 2011). The population trends in
Iceland remain largely unknown, but in Bear Island, there is a continued population growth
and its breeding range is expanding eastwards towards Russia (Hallvard Strøm pers.
comm.).
In the Faroe Islands, the population has increased markedly between 2000 and 2014. There
exist only regular counts of the colony on Skúvoy (fig 1.1,1.2a), but this increase has by
own observations been observed throughout the Faroes. Ring recoveries suggest that this
population growth could be due to immigration, as there are some spring recoveries of
mature Scottish ringed great skuas (Hammer et al. 2014). Another likely cause of the
increase is likely a reduction in persecution, although there exist no public statistics on
culling. A higher rate of Faroese ring recoveries (5%) compared to Scottish ringed great
skuas (3%) (Wernham et al. 2002), and the fact that 56% of Faroese recoveries are of shot
or otherwise hunted birds (Hammer et al. 2014) would suggest that the degree of
persecution in the Faroes can be relatively high. Great skuas are in the Faroes generally not
hunted for food, but controlled as they are considered a menace to sheep, inland birds and
seabirds, and they are currently not legally protected. Considering recent population
growth, it is therefore likely that there will be an high rate of persecution in the Faroes.
Outside the Faroes, great skuas are not legally killed, so the persecution risk can be
considered rare and sporadic.
For some great skua populations which depend to some extent on fishing activity and
discarding, the recent EU policy to reduce fish discarding can potentially result in
population declines (Bicknell et al. 2013). The fisheries in the Faroes, Iceland and Norway
are separately managed, and have in various ways ensured a lesser degree of discarding
(Johnsen & Eliasen 2011, Gullestad et al. 2015), so the impact of great skua populations
outside the EU can be assumed to be less influenced negatively by a reduction in fish
discards.
17
Fig.1.1 The great skua population on Skúvoy (Salomonsen 1935b, Ferdinand 1947,
Joensen 1963, Bloch 1981, Olsen 2003, 2011a).
Fig 1.2 Map of the Faroe Islands showing the sites of the three largest great skua colonies
a. Skúvoy, b. Svínaskoradalur, c. Svínoy
18
Aims
The initial aim of the thesis is to establish baseline information about diet and pollutant
load of great skuas in the Faroe Islands. With reference to historical accounts, it is possible
that the diet of great skuas in the Faroes differs greatly in relation to the diet of great skuas
in Shetland. If this is found to be so, it opens up an additional avenue of investigation of
diet’s influence on breeding performance and pollutant pathways, An extensive temporal
and spatial analysis of great skua egg sizes will be investigated with these ecological
differences in mind. Also if a significant ecological dissimilarity between great skuas
breeding in Shetland and Faroes can be established, this will allow for a disentanglement
of different pollutant pathways, and in this regard the great skua as a biomonitor is
discussed.
Chapter 2.
Is the breeding benefit of dietary specialisation context specific? Most of the research done
on great skua dietary specialisation has been undertaken in Shetland and Orkney, where the
main diet constitutes of fish. In chapter 2 the aim is to explore if the general diet is
different in the Faroes, and if it is, to test if predating on other seabirds results in improved
breeding performance as has been found in Shetland colonies. If dietary specialisation
results in improved breeding parameters due to meeting a higher nutritional demand, I
would predict that a supplementary feeding experiment should result in improved breeding
performance.
Chapter 3.
Average egg sizes have in some seabird species been found to correlate with food
availability. Egg sizes of great skuas have in the literature been noted to be significantly
smaller now than they were 30 years ago. This led me to explore if this was an overall
declining trend as has been seen in other colonies where food availability has been
declining. By acquiring egg measurements from the field and museum collections this
study can explore long term trends and wide spatial scale of egg sizes of great skuas and
two other seabird species in the Faroes.
Chapter 4.
Last time great skua eggs were analysed for persistent organic pollutants was in 1977, they
showed some of the highest concentrations in Faroese avian biota. While there is good
reason to study pollutant loads of top predators, there is further insight to gain from
19
comparing the pollutant loads of great skuas from the Faroes with those of published
values from Shetland. Although not a long distance away, great skuas in Shetland may
differ trophically compared to the Faroese great skuas, so this study may give insight into
the importance of diet and bio accumulation as a mechanism of transfer of persistent
organic pollutants. The relationship between trophic level and POPs is also demonstrated
with a correlational relationship between nitrogen isotope ratio and POPs concentrations.
Chapter 5.
Plastic is an emerging pollutant in the world’s oceans. My study is the first to observe
plastic in great skua pellets in the North Atlantic. The ratio of pellets which are found
corresponds to seabird prey species which are known to accumulate plastic. This implies
that the plastic found in great skua pellets, is not from direct consumption, but is likely
secondary consumption of the plastic load which the prey carried. While there is no
indication of long-term accumulation of plastic in great skuas, the findings suggest that
great skuas specialising on fulmars, will be exposed to more plastic than generalist feeders
or individuals specialising in other seabird species. The aim of this study is to evaluate if
plastic found in great skua pellets corresponds to the type of prey which is known to
accumulate plastic, and thereby assess the suitability of great skuas as biomonitors of
secondary consumption of marine plastic.
20
2. Diet of great skua in the Faroe Islands
Abstract
Acquiring sufficient food during the breeding period represents a challenge for many
seabird species, since the food is patchily distributed at sea while the birds are spatially
restrained to stay close to their terrestrial breeding territory. For a generalist opportunistic
forager such as the great skua nearby seabird colonies offer access to marine food
resources which they either predate or steal fish from, or they forage for fish out in the sea.
I investigated the diet of a great skua colony in the Faroe Islands during breeding with two
different methods to establish what was their diet, using pellets and stable isotopes of great
skua tissue, and if the diet influenced their breeding performance. Their diet consisted to a
greater extent of seabird species such as kittiwake, Atlantic puffin and fulmar than
elsewhere, but I found no evidence for individual specialisation on seabirds vs fish as had
been demonstrated in other great skua populations. There was no significant correlation
between the occurrence of seabirds in the diet and egg size or clutch size but there was a
relationship with laying date. I also experimentally increased terrestrial food near the nest
by supplementary feeding great skua pairs during the pre egglaying period to see if a ready
supply of nearby terrestrial foods influenced their breeding performance compared to a
control group. I found that the supplementary feeding did not influence egg size or laying
date, but it did reduce the within clutch egg size dimorphism. These results suggest that
there is some breeding benefits of specialising on bird predation, but the relationship does
not appear to result in larger eggs in Faroese great skuas.
Introduction
Food is one of the most important resources for free ranging animals providing the
necessary nutrients and energy for self-maintenance and reproduction (White 2008).
Where resources are limited, the potential for competition with conspecifics arises, and for
animals that breed colonially such as seabirds, this can strengthen the competition (Furness
& Birkhead 1984).Individual specialisation on different resources can be a mechanism to
reduce conspecific competition. However, food items can vary in quality and availability
and specialising on different food types may have fitness consequences(Pierotti & Annett
1990, O’Hanlon et al. 2017). Through the discovery of individual specialisation of
generalist predators (Pierotti & Annett 1991), seabirds have emerged as highly suitable
study models for studying dietary impact on reproduction. Although generalists such as
21
gulls and skuas benefit from a wide choice of potential prey, they will also display signs of
reduced reproductive output such as reduced clutch or egg size during periods of low food
availability or quality (Pierotti & Annett 1987). Some studies have shown evidence of
reproductive consequences for individual dietary specialisation (Votier et al. 2004), while
other have not found support for any clear advantage to specialising or generalising (Woo
et al. 2008).
For many birds, the breeding period can be a particular challenge to mobilise suitable
nutrients and energy to produce eggs. For most seabirds, the breeding period represents the
only period when they are bound to a terrestrial area, and this central place foraging is
another challenge to efficient resource acquisition. Specialisation can be therefore be
expected to occur for high quality food (e.g. high calorific content). However, in addition
to food quality, availability should be considered. For example, the great skua population
on Foula has seen a steady population growth over the past century which is generally
assumed to be associated with high fish availability (Furness 1987). However Phillips et al.
(1997) showed that the great skua population on Hirta, which lacks a similar abundance of
fish showed similarly improved breeding parameters as Foula. Phillips et al.(1997) found
that great skuas, which mainly feed on other seabirds had shorter foraging trips, allowing
more time to defend their territory and offspring. The implication of this would be that
there may be a trade-off between food quality and foraging trips for great skuas.
The great skua displays a rich variety of potential feeding strategies such as generalist
predator, scavenger and kleptoparasite, and their diet is accordingly very varied between
regions. The great skuas can also have very variable foraging trip lengths, ranging from
offshore to coastal foraging. At the larger colonies in Shetland and Orkney, the diet of
great skuas is mainly fish, and fishing discards. In smaller colonies, the greater proportion
of individuals are seabird predators. This density dependent relationship with resource use
was described in Votier et al. (2008a), and suggested that competition and intraspecific
conflict might be an influencing factor in driving larger colonies to feed predominantly on
fish. A study from 1961 on the diet of Faroese great skua, indicated the majority of the
great skua diet to be seabirds (Bayes et al. 1964). Historical notes preceding the diet study
in 1961 (Bayes et al. 1964) suggest that great skuas in the Faroes fed on offal from
fisheries and whaling, and could also be seen fishing at herring shoals (Müller 1862). But
Müller (1862) also notes that they are a threat to other seabirds, which they kill with a
single hit to the head. Although great skuas have always bred in the Faroes, there is no
reliable information about their population size prior to its near extinction due to culling at
22
the end of the 19th Century (Salomonsen 1935a). The population of great skuas appears to
have increased markedly in the Faroes between 2001 and 2011. For example, on Skúvoy
the breeding population has increased from 65 pairs in 2001 (Olsen 2003) to 145 pairs in
2011 (Olsen 2011a). Hence, if there is a density dependent relationship we should expect a
higher proportion of fish consumption compared to the historical information we have on
the Faroese great skua diet.
The historical accounts, and the small scale local differences in diet, illustrates well that the
diet of great skuas is largely opportunistic and therefore diet and feeding strategy can be
influenced by nearby seabird colonies (Furness 1987). However there may also be inter-
pair differences that suggest behavioural foraging specialisation. By collecting remains
from 30 territories, Bayes et al. (1964) found that 10 territories had only kittiwake remains,
15 had only fish, and 5 which had both kittiwake and fish. They also reported, citing a
local source, that around some pair’s territory, there would be a high number of kittiwake
eggs, suggesting that some pairs specialised on egg stealing for a limited period. It is
thought that specialising to forage on seabirds can have reproductive benefits for great
skuas (Votier et al. 2004) because seabirds are either of better nutrition or more readily
available near the skuas’ breeding territory. This is usually investigated by correlating diet
and breeding parameters, although this will not distinguish between effects of nutrition and
availability. Some studies have tested effects of food on breeding parameters
experimentally by supplementary feeding. There are various approaches to test the effect
of nutrition, where the supplementation is based on calorific measures or qualitative
supplement (protein, micronutrients etc) (Nager 2006). One supplementary feeding study
on great skuas showed that it had a detectable effect on egg size of younger breeders (5-10
years) but not of older breeders (11-29 years) (Ratcliffe 1993). Here I quantified diet of
individual breeding pairs using pellet and stable isotope data and supplementary fed a
subsample of these pairs. The supplementary feeding was of a low nutritional quality, in
order to test if availability, more than nutritional quality, influenced breeding parameters. I
want to test whether diet correlates with reproductive traits and whether supplementary
feeding differentially affects pairs with different feeding specialisations.
Method
Fieldwork was carried out on the island of Skúvoy (61°46′N 6°49′W) in the Faroe Islands
(Faroes hereafter). The island hosts approximately 150 great skua pairs in total. During the
breeding season of 2012 territories on the entire island were visited, while during the
23
season of 2013 the focus was mainly on the territories on the southernmost region of the
island, named “Bergið”, which has the most densely populated area (with approximately
100 great skua nests). Territories or apparently occupied territories (AOT) were identified
based on signs of activity such as trampled grass, guano or brood patch feathers (Furness
1987). After a territory has been located, the GPS location was recorded for re-visits.
The first aim was to assess the pairs’ diet in both years using collection of pellets. Each
territory was visited frequently and at each visit all pellets were collected to be analysed
back in the lab. Territories were visited at different frequencies between the two seasons of
2012 and 2013. In 2012 the frequency of visits was on average every 5-8 days, and in 2013
on average every 3-5 days, but each nest was visited at least every 10 days.
After egg laying, a remote controlled noose trap was fitted to trap the breeding adults.
During handling biometrics were measured and blood samples were taken (n=21). In 2012
and 2013, 61 adult breeding great skuas were captured. The biometric measurements taken
were body weight (g) and head+bill (mm). In order to calculate a condition index that takes
into account scale, I use the Scaled Mass Index designed by Peig & Green (2009). Blood
samples were collected for molecular sexing.
After hatching (2-20 days post-hatching), down feather samples were taken from the great
skua chicks with scissors (n=51). Since the down feathers were grown pre-hatching, they
should represent maternal nutrient transfer into egg production (Klaassen et al. 2004).
Supplementary feeding
To test if increasing the accessibility of food resources of some pairs would influence
breeding parameters, I undertook a feeding experiment in 2013. After a territory had been
established, I selected 42 territories to supplementary feed and 52 controls to visit every
second day; experimental and control territories were allocated approximately equal
number of control and feeding territories every day. The defining of clusters of 5-20
territories was done to minimize the possibility of “spill-over” effect from supplementary
fed pairs to control pairs (fig 2.1). Supplemented pairs were fed 200g cat food every
second day during the afternoon at their territory[ control territories were visited with the
same frequency and the same routine was done except the dropping of a food supplement.
The cat food used was from a terrestrial food source – “beef”, in order to isotopically
distinguish it from a more typical marine diet of the great skua. And thus being able to
quantify their uptake of supplementary food by the experimental pairs. The amount
supplemented corresponded to 7.5% of their daily energetic requirement (Kalmbach et al.
24
2001), and the protein content was 7 per 100 g, which is low compared to their typical diet.
Feeding was continued until clutch completion, or at least two days after the first egg was
found. The analysis included only pairs which had been visited or fed at least six times or
more. The prediction was that if the great skuas are constrained by the availability of food,
then a supplementation should have a detectable influence on breeding parameters such as
clutch size, laying date and egg size.
During feeding events, notes were taken where I observed other great skuas stealing food
supplement from the experimental birds and assessed how many thieves fed, and how
much of the feeding portion was taken up by the territorial pair. Control territories were
visited the same way and at the same frequency as treatment territories. The behavioural
notes were then used to assess how well the experimental pairs were capable or motivated
to defend their territory during feeding (1-5), and hence how much of the supplement they
acquired. The score was given as follows: 1- Target pair ate none of the food, 2- pair ate
some of the food, 3-pair ate half of the food, 4-pair ate the majority of the food, 5-pair ate
all the food. At every feeding event, this score would be noted, and we used the mean of
these scores to assess the success rate of each pair defending their food. The observations
were transformed into a continuous variable from 0-1 of how successful the experimental
pairs were at defending and acquiring the food, with 0 the target pair never ate any of the
supplement and 1 when the target pairs always ate all the supplement..
To measure a proxy of the amount of supplementary food actually consumed by the target
pair and was used in egg formation, we located the chicks after hatching. Down feathers
are formed while the chick is in the egg, and therefore they will carry a stable isotope
signature reflecting the diet of the female while she was forming the egg, and if an
experimental bird had access to the food supplement (Klaassen et al. 2001). As the
supplement was intended to have different 15N/14N and 13C/12C ratios than the great skuas
natural prey, the uptake of food supplement can also be inferred from the stable isotope
signature of chick down. Out of the pairs which successfully reared one or two chicks that
could be located between 2 and 20 days post hatching were measured and a sample of
down feathers was collected (n=51, 29 experimental, 22 control).
Assessment of Diet
Pellets
In the study of generalist seabird diets, pellet collection has been an often-used tool .
Numerous studies have used this method to evaluate between pair differences (Resano-
25
Mayor et al. 2014). In my study of great skua diet in the Faroes, pellets are also used.
These pellets are found on territories, and give a good representation of diet during the
breeding season, but since different prey result in different number of pellets this is a
qualitative rather than quantitative assessment (Votier et al. 2001). Experimental feeding
of great skuas has showed that the rate of production differs notably between types of prey
(Votier et al. 2001).
The diet of the great skuas was firstly assessed using pellets and other prey remains that
were found by searching in a circle approximately 5-10 meter radius from the centre of the
territory. During the first territory visit, any pellets found would be collected and
discarded. The pellets were then collected at each territory visit. Using features such as
feather colour, smell and hard material, the prey species were identified to nearest possible
taxa and categorised. All hard material such as fish otoliths, bones, plastics (see Chapter 5)
and unidentified feathers were kept. It was for example not possible to distinguish
guillemots, puffins and razorbills, unless the skulls or whole wings were found, and they
were therefore pooled as auks. It is important to note that pellets are only pair-specific so
there is a potential for underrepresenting specialists since the two parents may have
different specialisations.
Stable Isotope Analysis
Carbon and nitrogen isotope analysis of feathers or blood provides another method of
evaluating diet (Hobson et al. 1994). However, different tissues will reflect different time-
scales of formation. Isotope samples of chick tissue will generally indicate the diet of great
skuas during the breeding season post hatching, however samples of chick down feathers
will indicate the stable isotope signature of the female that went into egg production.
Another well established way to assess diet is through the use of stable isotope analysis
(SIA). This is based on the fractionation rate of different isotopes of carbon (δ13C) and
nitrogen (δ15N) that can leave a dietary signature in the consumer during tissue formation.
C reflects a terrestrial/marine gradient, and N can be used as a proxy of trophic level of the
prey (Hobson & Welch 1992). For this study I analysed blood samples (red blood cells
only), homogenized egg content, and chick down feathers. Knowing the turn-over rate of
tissues all three reflect a similar time scale, namely 2-3 weeks before egg laying (Inger &
Bearhop 2008). Also samples of reference material of typical prey items were collected: 10
kittiwakes, 10 puffins were sourced from local hunters, and 10 fish muscle samples were
acquired from great skua regurgitation during handling. I was unable to identify all the fish
taxa of the samples, but they were all pelagic, mostly mackerel (Scomber scombrus) and
26
blue whiting (Micromesistius poutassou). Also 10 samples of catfood from supplementary
feeding (see below) were included in the analysis. Prior to analysis the samples were
prepared (Bond & Jones 2009); the chick down feathers were washed using washing up
liquid, and rinsed thoroughly in deionised water. Since lipid fractionation can potentially
influence the carbon ratio, the lipid-rich samples (puffin, kittiwake, fish and catfood) were
lipid extracted using a ethanol:chloroform 2:1 solution in a Soxhlet apparatus. After
several full cycles, the samples were dried in an oven at 40 °C >24 hours.
The analyses of the samples for stable isotopes ratios of 13C/12C and 15N/14N was
undertaken at the NERC Life Sciences Mass Spectrometry Facility in East Kilbride,
Glasgow. The analysis was performed by continuous flow isotope ratio mass spectrometry
(CF-IRMS) on an average of 0.8 ± 0.1 mg of sub-sampled material loaded into tin cups and
combusted in a Costech ECS 4010 elemental analyser coupled to a Thermo Finnigan Delta
Plus XP mass spectrometer. Lab standards (gelatin, alanine and glycine) were run between
every 10 samples to correct for instrument drift. Isotope ratios are expressed as parts per
thousand (‰) according to the equation δX = [(Rsample/Rstandard)-1] x1000, where X is 15N or
13C, R is the corresponding 15N/14N or 13C/12C, and Rstandard is the ratio in the international
references (air for nitrogen and belemnite for carbon). Lab standards were calibrated with
these international reference standards and the measurement precision is calculated as the
standard deviation of multiple measurements of internal lab standard material (tryptophan)
which was ±0.209‰ for N and ±0.151 for C.
It is important to note the difference between these two methods of assessing the diet.
Stable isotope analysis reflects individual diet, while pellets are pair specific. The pellets
were collected throughout the season, but for the sake of testing comparability of the two
methods only pellets sampled during the period that was also sampled by the stable isotope
analysis were used, i.e. pellets collected prior to egg-laying.
For the purpose of analysing the diet over the breeding season, the periods were split up
into: pre-laying, incubation, and post-hatching. The diet relationship with egg production
included only pellets collected during the pre-laying period.
Reproductive Traits
Egg Volume
Breeding parameters which I was interested in measuring were egg size, clutch size and
laying date. Egg volume was measured as their maximal length and width and from those a
27
volume calculated using Hoyt’s equation and a taxa-specific constant (length x width2 x
Kv) (Kv=0.507)(Hoyt 1979).
Laying date
Bird’s eggs lose mass through waterloss during incubation (Rahn & Ar 1974), which will
change the ratio between egg mass to egg volume as the latter will not change through
incubation. This makes it possible to predict hatching date of great skuas with egg volume
and egg mass (Furness & Furness 1981). Egg mass was measured using a digital pocket
scale, to the nearest 0.01g. Egg density was calculated as egg mass (g)/egg volume (cm3).
By observing hatching date of 32 eggs which I had measured the mass of (some measured
more than once - 100 measurements in total), I calculated a quadratic regression with “days
until hatching” as response variable and egg density as explanatory variable and eggID as
random factor, using R’s package lmer4 (Bates et al. 2014) and calculated an r2 value for
the model using the method described by Nakagawa & Schielzeth (2013). The quadratic
regression was then fitted to all the other measurements to predict hatching date, and
laying date was assumed as 29 days (the average incubation period of great skuas, Furness
1987) before hatching date.
Egg size dimorphism
Great skuas typically lay two egg clutches. For testing the prediction that some females
may be food limited to produce a full clutch, I analysed the egg size difference in two egg
clutches (Vallarino et al. 2011). If the egg size of the second laid egg is smaller due to
depletion of energy reserves, we would predict the within-clutch dimorphism to be
negatively correlated with % of bird pellets or successful supplementary feeding
(quantified as low δ13C of chick down feathers).
The statistical analysis for this study was done using the core package of R software, and
linear mixed effects models with R package “lme4” (Bates et al. 2015a).
Results
A total of 2323 pellets were collected over the seasons 2012 and 2013. Despite the
differences in frequency of territory visits between the years (described in the
methodology), the ratio of bird and fish pellet occurrence at territories did not differ
significantly between years: (Binomial GLM, Z = 0.164, p = 0.87). The majority of pellets
contained kittiwakes (Table 2.1).
28
Considering the total amount of pellets collected from 322 territories over the two seasons,
including only those territories where we had collected 5 pellets or more, 119 pairs had
over 70% of pellets with bird remains (Fig. 2.2). No pairs consumed predominantly fish or
other prey types. Only three pairs had 40-50% fish pellets around their territory. Among
the pairs that consumed predominantly birds, 22 pairs ate mainly kittiwakes, 2 mainly fed
on fulmar, and 1 on auks. A biomass conversion also supports the greatest proportion of
consumption to be kittiwakes and secondly fulmars. Assuming fish biomass to be 300
grams suggests that skuas consume an approximate equal mass of fish as auks,
Interestingly, there were significant positive correlations between both δ15N and δ13C in
parent blood or egg material with number of pellets collected prior to egg laying, but not
with the proportion of different pellet types (Table 2.2). Due to the relative high occurrence
of bird pellets throughout the colony I used the proportion of bird pellets out of the total
number of pellets produced by that pair as a proxy for a pair’s diet.
To predict the hatching date of all the eggs in my dataset, I calculated a quadratic
regression of the density of the eggs of a known hatching date (Fig 2.3). I estimated laying
dates of 916 eggs with the median laying date being 24 May (± stdev 11).
Pairs visited only five times or less before egg laying were excluded from the subsequent
analyses. All remaining pairs were visited on average 22 ±11 times during the pre-laying
period. There was no significant relationship between nitrogen isotope profile of chick
down feathers and the feeding success on supplementary food (Pearson’s -0.282 t=1.67
df=32 p=0.1051). There was a strong negative correlation between observations of
supplementary feeding success and chick down feather δ13C isotope profile (Pearson’s -
0.609 t=4.34 df=32 p<0.001) with catfood having lower δ13C values than natural prey
types (Fig 2.4). Thus carbon isotope ratio was used further as a proxy for supplementary
feeding.
A linear mixed effect model was run with Laying date, Clutch size, average egg size, egg
size dimorphism as response variables, experimental feeding, proportion of bird pellets,
and their interaction as explanatory variables, and experimental zone (fig. 2.1) as random
effect (table 2.3 & table 2.4). There was a weak negative but non-significant influence of
occurrence of bird pellets on laying date (table 2.3), but no effect from observed
supplementary feeding success. There was no relationship between the proportion of bird
pellet or supplementary feeding and average egg size or clutch size.
29
Another linear mixed effect model was with the same breeding parameters, but with chick
δ13C isotope profile as the proxy for supplementary feeding, and the interaction between
both explanatory variables, and experimental zone (fig. 2.1) as a random effect (table 2.4).
This model showed a significant relationship between occurrence of bird pellets and laying
date (table 2.4). There was no significant relationship between diet and average egg
volume or clutch size, but there was a strong relationship between chick carbon isotope
ratio and egg size dimorphism (table 2.4). This was a positive correlation suggesting the
supplementary resulted in less egg size dimorphism.
Discussion
The diet of Faroese great skuas is in this study found to differ markedly from the diet at
other areas such as Shetland. The diet of great skuas on Skúvoy is dominated by seabirds,
primarily kittiwake, fulmar and auks (table 2.1). There is however also a significant
amount of fish, however we found no evidence of specialisation on a fish diet only. This
relative high occurrence of seabird predators corresponds well with historical notes and
anecdotes. The feeding experiment gave some unpredicted but important insight. Although
we were not able to accurately assess the degree of supplementary feeding observationally,
using stable isotope (especially carbon) we were able to assess the effect of supplementary
feeding on breeding parameters, albeit on a much reduced sample size. What these results
showed were that supplementary feeding did not significantly influence the clutch size or
average egg size, or the laying date. The experiment did however find strong support for
the occurrence of bird pellets has an effect on laying date (table 2.4), suggesting that bird
predatory pairs have an earlier laying date. Also we found that supplementary feeding
negatively influenced the egg size dimorphism, so supplementary feeding reduced the egg
size difference in two egg clutches.
The diet study resulted in a high number of pellets found and analysed, and there was not a
significant difference between the two years, so the pellet data can be assumed to be well
representative for the contemporary diet of great skuas on Skúvoy. However, using pellets
to infer diet must be done with a cautionary interpretation. Since it is possible that some
types of pellets will break up and be less detectable than others, so territory visit frequency
can bias the ratio of pellets found. It should however be noted that we have clear
indications from fresh regurgitates that fish are highly underrepresented in our pellet
30
samples, and that fish whether it is through kleptoparasitism or scavenging from ships will
likely remain a significant portion of their diet.
Due to its opportunistic lifestyles, it is not unexpected that the diet of great skuas can vary
significantly between regions. A study by Votier et al. (2008a) found that small colonies
feed on a greater proportion on seabirds, while larger colonies depend on fish and discards.
This appears to be due to a density dependent competition relationship (Votier et al.
2008a). The Faroese colonies of great skuas have not grown beyond the approximately 200
pairs each. This has been mainly due to persecution, but fish discarding has not happened
around Faroese waters to the same extent as North Sea fisheries, so possibly there is also a
bottom up limit to the Faroese population. It should therefore not be unexpected that a
relative high proportion of the Faroese great skua diet, has and continues to be mainly on
other seabirds.
However in the case of the Faroese great skua colony, bird specialisation at the level of
pairs does appear to be particularly prevalent. In this study 119 pairs out of 322 were found
to have a high occurrence of bird pellets >70%. This would suggest that the probability of
both individuals of 322 pairs are 119 bird specialists, which is 119/322=0.37. The square
root of 0.37= 0.61 suggests as many as 61% of individuals are seabird specialists. Such a
high occurrence of seabird specialists is unusual and unique compared to other colonies in
Shetland and Orkney. But it has been suggested that great skuas to some extent feed on
whatever is available locally, and as such this could signify that despite significant declines
in seabird populations (Olsen 2011b) there are still enough for it to be viable to breed and
feed chicks.
Some studies have shown that dietary specialisation can improve breeding performance
(Votier et al. 2004). In that context I wanted to explore if diet could play a role in breeding
effort. No clear correlation was found between either pellets or stable isotope to suggest a
relationship with breeding parameters such as egg size, clutch size and egg size
dimorphism. However in a subset of samples (table 2.4) there was significant relationship
between bird pellets and laying date, showing that bird specialists have an earlier laying
date. This relationship was also found by Votier et al. (2004), however Votier et al. also
found a relationship with egg volumes, and other studies have shown similar findings in
other birds (Sorensen et al. 2009).
Dietary specialisation does not only influence the pairs, and can in some cases become a
conservation concern for the prey species. For example on Hirta, St. Kilda it has been
31
noted that some great skua pairs have begun nocturnal foraging of Leach’s storm petrels
Oceanodroma leucorhoa (Votier et al. 2006), and that these specialists can have a
disproportionally high influence on prey populations. This has also been raised as a point
of concern in Skúvoy where locals have noted an increase in Manx shearwater carcasses
found near the southern fringe of the great skua colony “Bergið” (Harry Jensen,
pers.comm.).
There were some detectable biases in the observed laying date between the two years. The
laying date was significantly different between the years (GLM t=2.54 p=0.012), but this
difference is likely due to differences in frequency of territory visits and range, which may
have influenced the likelihood of detecting late (second clutch) breeding attempts. The
laying date differed significantly between the two years 2012 and 2013 (p=0.012), with a
mean laying date in 2012 was 20 May (Stdev 12), and in 2013 it was 25 May (Stdev 10).
Due to the experimental work done in 2013 which focused on a very limited area (fig. 2.1),
compared to the entire island of Skúvoy, in 2013 the likelihood of finding late breeding
pairs and potentially re-laying pairs is higher, and may have skewed the mean laying date.
Dietary specialisation is found to have reproductive consequences for seabirds as some
studies have suggested (Votier et al. 2004). In contrast to other great skua colonies, the diet
of Faroese colony studied was a relatively high ratio of bird prey, and less of fish. Here I
explored whether the different diet between different nests of Faroese great skuas was
correlated with breeding parameters, and I found a relationship between bird specialisation
and laying date.
In 2013 an experiment was designed and carried out to test if food supplementation would
influence the breeding parameters such as average egg size, egg size dimorphism and
laying date. The supplementary feeding experiment did not show a significant difference of
laying date, clutch size, and mean egg size between supplementary fed pairs and control
pairs. However stable isotope analysis of chick down feathers showed a significant
correlation between δ13C of chick downfeathers and the within-clutch egg size difference
of those clutches. This contradicts Catry & Furness (1997) which found that within-clutch
difference of great skua eggs was not a reliable measure of individual quality. There are
two likely, and possibly interacting, drivers behind this finding: parental breeding strategy
or energetic/nutrient limited. Great skuas show a degree of egg size dimorphism (Catry &
Furness 1997), and there is a wealth of research trying to disentangle the factors
influencing this dimorphism in various bird species (Badyaev 2002). The parents may
enforce a certain evolutionary strategies in egg size dimorphism (Székely et al. 2000).
32
Alternatively the dimorphism can be due to the second laid egg being smaller as female
nutrient or energy reserves get depleted. However, an experimental removal of great skua
first laid eggs by Kalmbach et al. (2004), found that the second laid clutch was not
significantly smaller, which would suggest that great skuas have normally no trouble
mobilising enough nutrients or compounds to produce a second or even third clutch.
Although the relationship between supplementary feeding and egg size dimorphism is
intriguing, it is not possible in this study to disentangle this relationship much further,
however the feeding experiment clearly suggests that the suppelementary food, albeit
relatively low in protein, did reduce the difference in within clutch egg sizes. Whether it
was the food itself or our feeding activity that resulted in this remains unknown, but would
certainly deserve further study.
This study has shown that the diet of great skuas in the Faroes is to a great proportion other
seabirds – mainly kittiwakes. I found some support for previous studies that bird
specialisation results in earlier laying dates, however I did not detect similar relationships
with other breeding parameters such as egg size or clutch size. In order to test the impact of
diet on these breeding parameters, I carried out a supplementary feeding experiment, in
which we found no support for that the feeding influenced breeding parameters such as
laying date or egg size, but there was a strong negative relationship between supplementary
feeding and egg size dimorphism. This is a first indication that egg size dimorphism can be
influenced by food, but whether this is due to nutritional or energetic properties of the
food, or the experiment influenced female egg investment remains unknown.
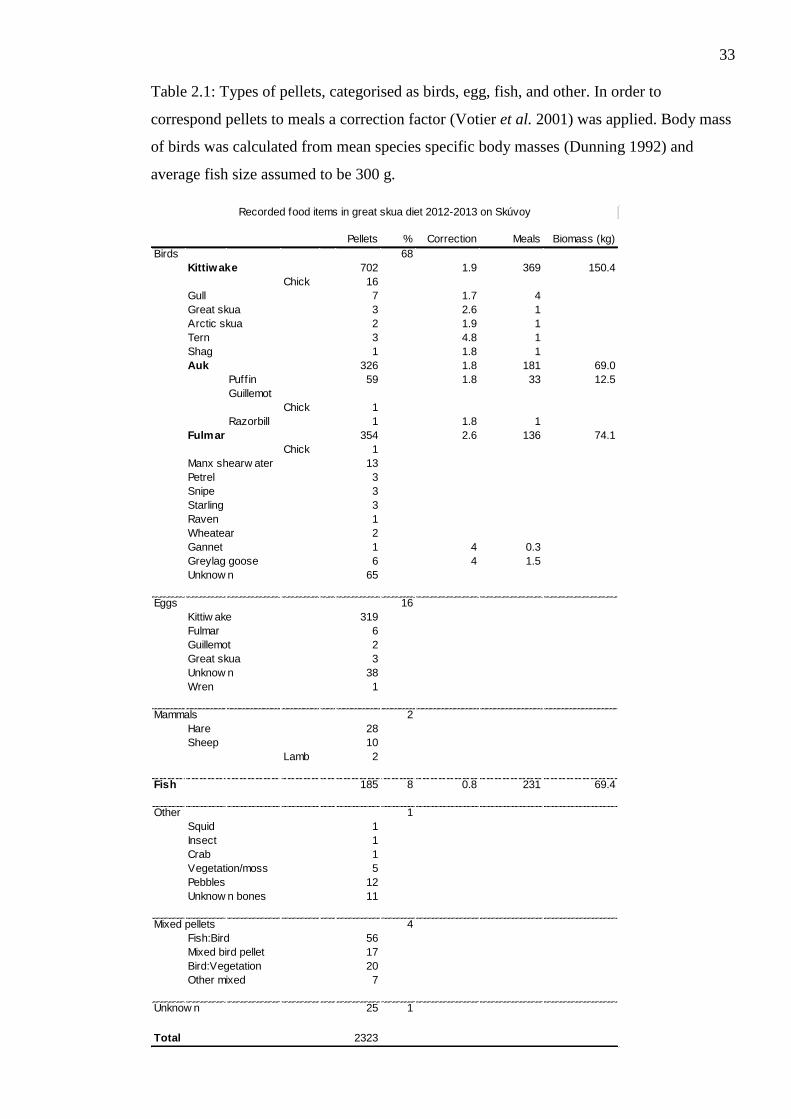
33
Table 2.1: Types of pellets, categorised as birds, egg, fish, and other. In order to
correspond pellets to meals a correction factor (Votier et al. 2001) was applied. Body mass
of birds was calculated from mean species specific body masses (Dunning 1992) and
average fish size assumed to be 300 g.
Pellets % Correction Meals Biomass (kg)
Birds 68
Kittiwake 702 1.9 369 150.4
Chick 16
Gull 7 1.7 4
Great skua 3 2.6 1
Arctic skua 2 1.9 1
Tern 3 4.8 1
Shag 1 1.8 1
Auk 326 1.8 181 69.0
Puffin 59 1.8 33 12.5
Guillemot
Chick 1
Razorbill 1 1.8 1
Fulmar 354 2.6 136 74.1
Chick 1
Manx shearw ater 13
Petrel 3
Snipe 3
Starling 3
Raven 1
Wheatear 2
Gannet 1 4 0.3
Greylag goose 6 4 1.5
Unknow n 65
Eggs 16
Kittiw ake 319
Fulmar 6
Guillemot 2
Great skua 3
Unknow n 38
Wren 1
Mammals 2
Hare 28
Sheep 10
Lamb 2
Fish 185 8 0.8 231 69.4
Other 1
Squid 1
Insect 1
Crab 1
Vegetation/moss 5
Pebbles 12
Unknow n bones 11
Mixed pellets 4
Fish:Bird 56
Mixed bird pellet 17
Bird:Vegetation 20
Other mixed 7
Unknow n 25 1
Total 2323
Recorded food items in great skua diet 2012-2013 on Skúvoy
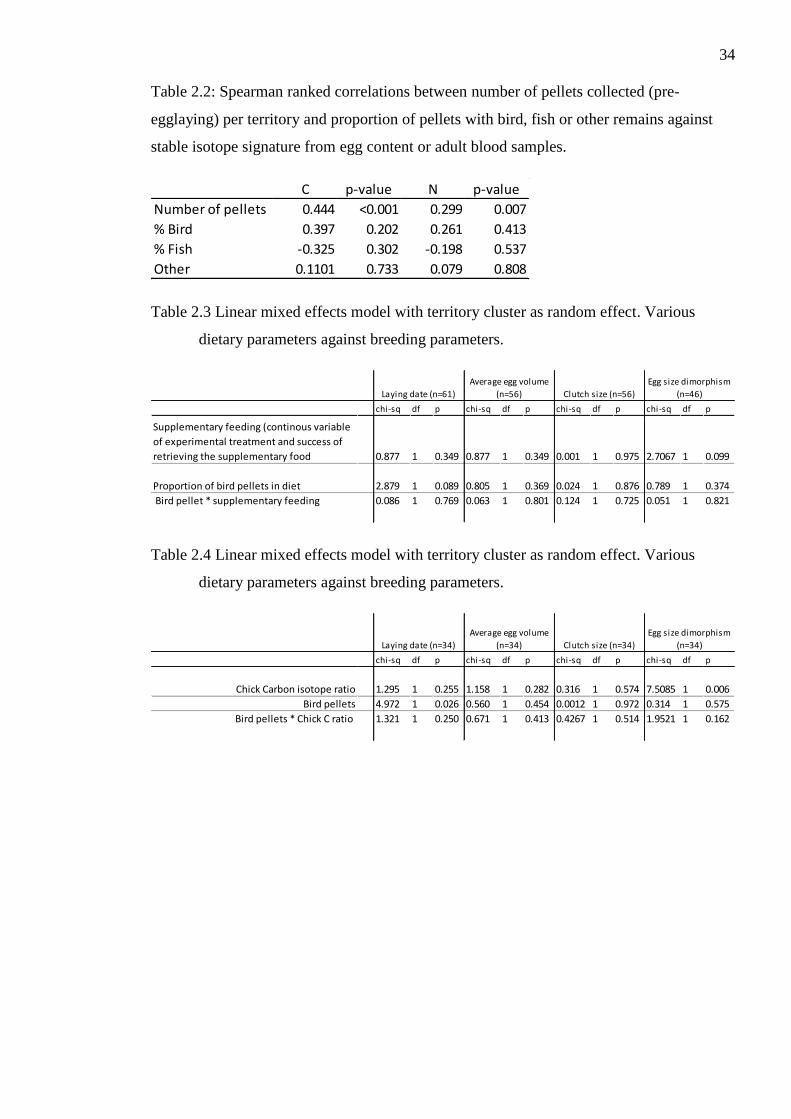
34
Table 2.2: Spearman ranked correlations between number of pellets collected (pre-
egglaying) per territory and proportion of pellets with bird, fish or other remains against
stable isotope signature from egg content or adult blood samples.
Table 2.3 Linear mixed effects model with territory cluster as random effect. Various
dietary parameters against breeding parameters.
Table 2.4 Linear mixed effects model with territory cluster as random effect. Various
dietary parameters against breeding parameters.
C p-value N p-value
Number of pellets 0.444 <0.001 0.299 0.007
% Bird 0.397 0.202 0.261 0.413
% Fish -0.325 0.302 -0.198 0.537
Other 0.1101 0.733 0.079 0.808
chi-sq df p chi-sq df p chi-sq df p chi-sq df p
Supplementary feeding (continous variable
of experimental treatment and success of
retrieving the supplementary food 0.877 1 0.349 0.877 1 0.349 0.001 1 0.975 2.7067 1 0.099
Proportion of bird pellets in diet 2.879 1 0.089 0.805 1 0.369 0.024 1 0.876 0.789 1 0.374
Bird pellet * supplementary feeding 0.086 1 0.769 0.063 1 0.801 0.124 1 0.725 0.051 1 0.821
Laying date (n=61)
Average egg volume
(n=56) Clutch size (n=56)
Egg size dimorphism
(n=46)
chi-sq df p chi-sq df p chi-sq df p chi-sq df p
Chick Carbon isotope ratio 1.295 1 0.255 1.158 1 0.282 0.316 1 0.574 7.5085 1 0.006
Bird pellets 4.972 1 0.026 0.560 1 0.454 0.0012 1 0.972 0.314 1 0.575
Bird pellets * Chick C ratio 1.321 1 0.250 0.671 1 0.413 0.4267 1 0.514 1.9521 1 0.162
Laying date (n=34)
Average egg volume
(n=34) Clutch size (n=34)
Egg size dimorphism
(n=34)
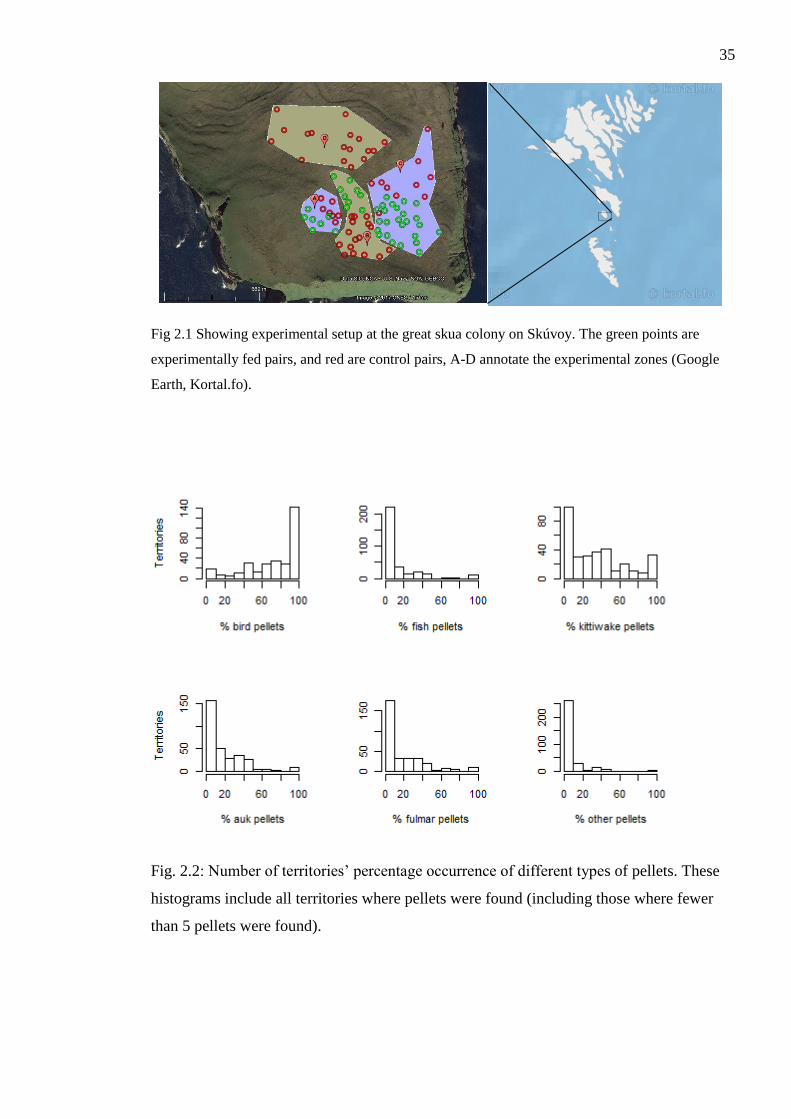
35
Fig 2.1 Showing experimental setup at the great skua colony on Skúvoy. The green points are
experimentally fed pairs, and red are control pairs, A-D annotate the experimental zones (Google
Earth, Kortal.fo).
Fig. 2.2: Number of territories’ percentage occurrence of different types of pellets. These
histograms include all territories where pellets were found (including those where fewer
than 5 pellets were found).
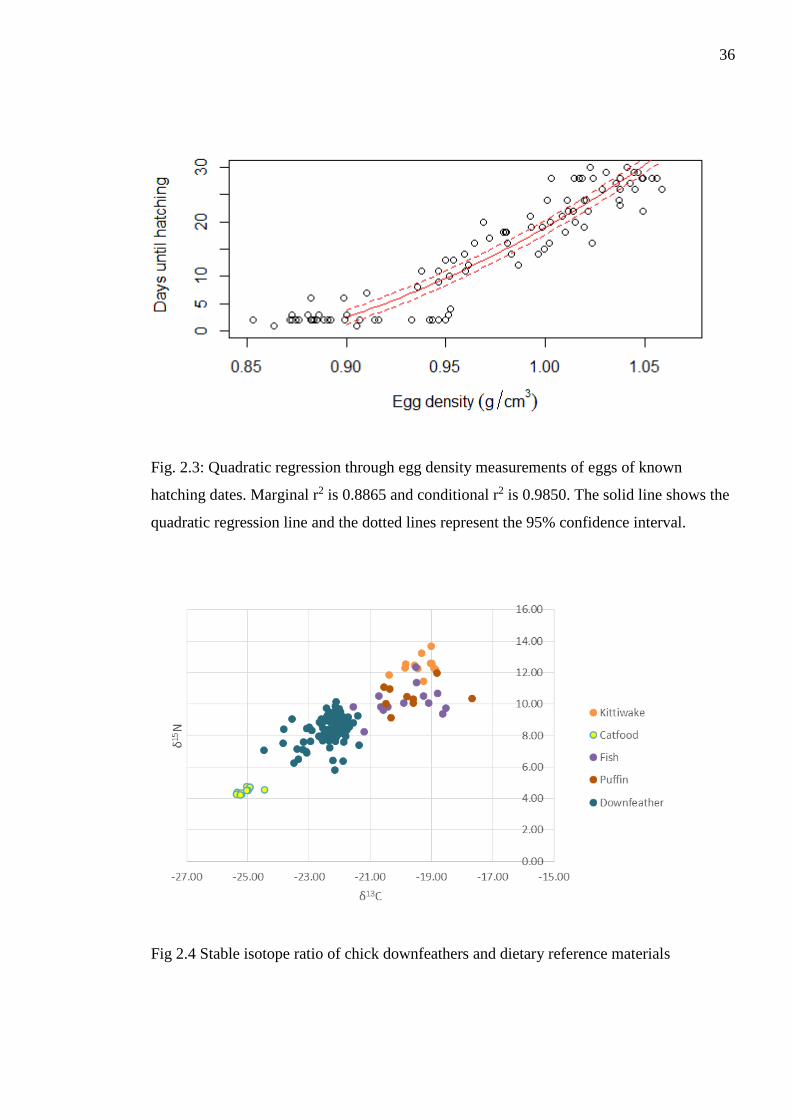
36
Fig. 2.3: Quadratic regression through egg density measurements of eggs of known
hatching dates. Marginal r2 is 0.8865 and conditional r2 is 0.9850. The solid line shows the
quadratic regression line and the dotted lines represent the 95% confidence interval.
Fig 2.4 Stable isotope ratio of chick downfeathers and dietary reference materials
37
3. Temporal and spatial variation in seabird egg sizes
Introduction
In all populations of vertebrate organisms, there is a wide range of body sizes. However
some spatial and temporal trends in vertebrate body sizes have also been observed, and are
frequently interpreted by intrinsic or extrinsic factors (Yom-Tov & Geffen 2011). One
spatial trend that animals in colder or higher latitude areas tend to have a greater body size
has been formulated as Bergmann’s rule (Blackburn et al. 1999). Temporal variation is
also evident, and have been interpreted as environmental variability or climate, which may
influence food availability (Yom-Tov & Geffen 2011).
For many animals the breeding period is a challenging time in terms of resources and time.
It is well established that breeding is a demanding period for birds, and that in particular
egg production can be a costly process (Monaghan & Nager 1997). To meet the energetic
need for egg production is further complicated due to birds laying during a period of food
constraints. If food constraints early in the season are too great then this can result in a
delay in laying date or in smaller eggs (reviewed in Nager 2006). The energetic limitation
of individuals resulting in smaller eggs may be particularly apparent in colonial birds
where there is a strong selection towards having a synchronised start of laying (Nager
2006, Votier et al. 2009, Verboven et al. 2010), but it is also recognised that intrinsic
factors such as female mass, age and experience may influence egg size (Christians 2002).
Egg size can also influence offspring survival (Krist 2011), and may therefore have direct
ecological implications.
Two recent studies have found a long term decline in egg size in glaucous gull Larus
hyperboreus and Atlantic puffin Fratercula arctica, and have hypothesised the cause of
this change to be related to food availability (Blight 2011, Barrett et al. 2012). A study of
great skuas on Foula, Shetland have noted that the eggs measured in 2008 were
significantly smaller than the eggs measured at the same colony in 1980 (Leat et al. 2011).
This reduction in egg sizes coincides with a change in the Shetland great skuas’ diet from
sandeel Ammodytes spp. to less energy-dense fish discards (mainly haddock
Melangrammus aeglefinus and whiting Merlangius merlangus ) (Leat et al. 2011). This
change in egg sizes also coincides with a decline in the great skua population on Foula
(reviewed in Furness 2015). Compared to the population in Shetland, the great skuas in
the Faroes feed and are thought to have done so also in the past to a larger extent on other
38
seabirds such as black-legged kittiwake Rissa tridactyla, Atlantic puffin, guillemot Uria
aalge, and Northern fulmars Fulmarus glacialis.
Few temporal studies of wild bird populations have been ongoing longer than 4-5 decades,
so in particular field measurements on egg size have only been done in recent decades.
However, eggs had been collected for much longer (about 150 years). So in order to study
long-term trends in egg sizes, museum egg collections have become an important resource
(Suarez & Tsutsui 2004). Egg collection began as a respectable past time for naturalists
resulted in extensive private collections built up from 19th Century throughout Europe and
North America in particular (Joseph 2011). Since ethical and ecological concerns grew
around egg collecting, most countries banned egg collecting and most private egg
collections have since been transferred to public natural history museums (Scharlemann
2001, Cole 2016). Museum birds eggs have been used in various ecological studies (Green
& Scharlemann 2003, Pyke & Ehrlich 2010). Most famously museum eggshells were used
to establish the pollutant effect on eggshell thinning (Ratcliffe 1967). Although seabird
eggs are also found in museum collections, few studies have been done with historical
collections of seabird eggs. There can be qualitative differences and biases between egg
measurements taken from museum eggs and field measurements so comparison and
interpretation of these needs critical evaluation. However museum collections allow us to
study longer temporal scales than would otherwise be possible, and will therefore provide
important insights in long-term variation in egg size over large geographical scales.
Museum eggs hold a number of uncertainties and potential biases in how they were
collected and traded, and incorrect metadata which may or may not be intentional (Storer
1930). Depending on the individual collector eggs may have been collected for aestetic or
curisity appeal or general naturalistic interest, but it is unknown if the collectors intent was
to collect typical or atypical eggs. An indication that museum collections may contain
some atypical eggs is exemplified in a higher ratio of “runt” or dwarf eggs in egg
collections than you would otherwise expect to find in the field. Field data, while generally
being undertaken by trained specialists, holds less bias, although there can be biases in how
and when nests are located. For colonial species, perhaps by measuring eggs along the
edge of a colony to minimise disturbance, this introduces possibly a bias towards younger
or poorer quality birds that nest at the periphery of colonies (Wittenberger & Hunt 1985)
and because they are young and lay smaller eggs (Hipfner et al. 1997). If colony visits are
done only once, the date of when the measurements were taken can also bias the size of
39
eggs, since it has been shown that eggs laid later in the breeding season of colonial birds
are smaller (Birkhead & Nettleship 1982).
Bergmann’s rule states that endothermic organisms tend to be larger at higher latitudes,
and some studies have found this to be the case for eggs too. Eggs of Brunnich’s Uria
lomvia and common guillemot were bigger further north (Hipfner et al. 2005) and a
geographic gradient was also found of tropical/subtropical songbirds (Martin 2008), and
among new world flycatchers (Heming & Marini 2015). Although Bermann’s rule explains
the spatial variation to be due to thermal preservation of endothermic organisms or fasting
endurance, the underlying mechanisms behind this spatial variation remains unknown
(Ashton 2002). The most prevalent hypothesis explaining spatial trends in egg size is
similarly related to temperature and parent attendance, but Heming & Marini (2015)
emphasise that environmental temperature also influences parent investment in egg size.
Few studies have looked into temporal variation between different populations, and there is
a growing realisation that inter-colony differences can be very informative in assessing
environmental influence on population demography and growth (Dhondt 2001, Bairlein
2003, Frederiksen et al. 2005, 2010). In this study I aim to describe spatial and temporal
trends in egg sizes of three seabird species. Firstly I compare the pattern of temporal
variation in egg sizes between three different seabird species (great skua, fulmar Fulmarus
glacialis and guillemot Uria aalge) in one region (the Faroes). Secondly I compare spatial
trends of great skua eggs in six different regions, and I also provide a detailed analysis of
temporal variation of great skua egg sizes at three important regions (Iceland, Faroe Islands
and Shetland) with combined use of museum eggshells and field measurements, and
analyse geographic variation of contemporary field measurements across the a wide
breeding range.
Method
Eggs of great skuas, fulmars and common guillemot were sourced from any known
published and unpublished records of field measurements of egg size (Table 3.1) as well as
museum collections (Table 3.2). The field measurements were generally collected as a
standard feature during fieldwork for individual projects in Shetland and the Faroes, or as
part of ongoing population monitoring of populations such as Handa (RSPB) and Bear
Island (NPI). Egg size measurements (length and width) were taken by Vernier calipers to
a precision of 0.1 mm. Egg volume index (EVI) calculated as (length x width2) was
40
calculated for the between species comparison only, as the three species have very
different shape constants. The metric volume of great skua eggs was calculated using
Hoyt’s equation and a taxa-specific constant Kv (length x width2 x Kv) (Kv=0.507) (Hoyt
1979). Unlike guillemot and fulmar that only have single egg clutches, great skuas
typically have two egg clutches. However a large number of great skua museum specimens
were single eggs, although typical clutch size is two eggs with the first-laid egg being
larger than the second-laid one (Furness 1987). I therefore averaged the egg volumes of the
two eggs when measurements from both eggs of a clutch were available. Museum eggs
were included only if collection location and year was known. Locations were grouped into
the following six regions: Bear Island, Iceland, Faroe Islands, Shetland, Orkney, and West
Scotland. Where I had measurements from different colonies within a region from the
same year, I tested within-region differences.
The egg size data for the three species in the Faroes had periodic gaps in the records, and
therefore to analyse temporal variation in egg size two analytical approaches were taken.
Firstly, a linear mixed effect model was fitted with egg size as the response variable and
year as random effect with splines df=2 in a general linear mixed model. The second
approach was to divide the data into 3 periods: 1840-1909, 1910-1979 and 1980-2014. The
data was split into these first two periods in equal length (69 years), and the third and most
recent period is 34 years to attempt and follow the data structure with large temporal gaps,
so that there was a sufficient number of data in each period.
Where possible measurements from museum and field measurements taken in the same
period and region were compared. To make this possible the great skua data were clustered
into one group of eggs from Shetland (1971-1978) and another from Faroes (1940-1960).
Within each of these two groups I compared museum and field measurements. With the
fulmar and guillemot data there were no years or periods where there existed field and
museum measurements from overlapping periods. So interpretation of the guillemot and
fulmar data must consider the possibility of this confounding factor.
Geographic differences
To investigate spatial variation in egg size I compared egg size between the six regions
across the range of great skuas in the northeastern Atlantic for the period 1980-2014. At a
smaller spatial scale (<70 km) I also examined variation in egg size of great skuas between
3 different colonies in the Faroes within a single year (2014), and large spatial scale
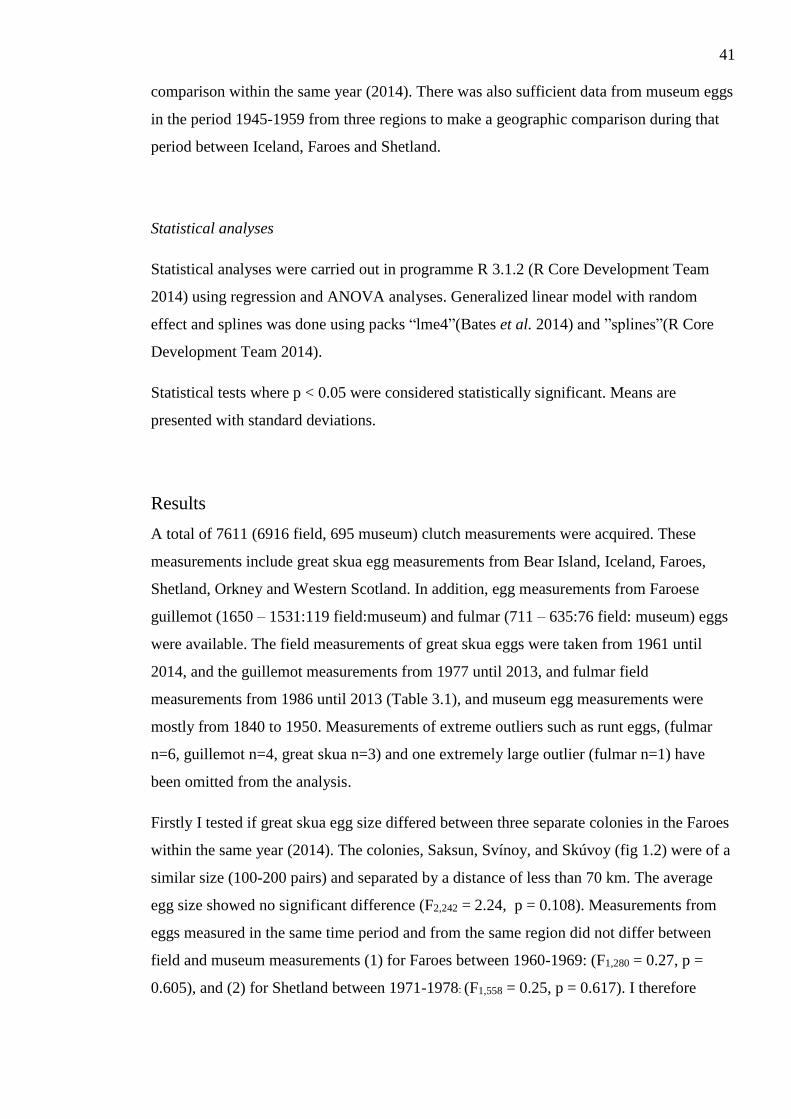
41
comparison within the same year (2014). There was also sufficient data from museum eggs
in the period 1945-1959 from three regions to make a geographic comparison during that
period between Iceland, Faroes and Shetland.
Statistical analyses
Statistical analyses were carried out in programme R 3.1.2 (R Core Development Team
2014) using regression and ANOVA analyses. Generalized linear model with random
effect and splines was done using packs “lme4”(Bates et al. 2014) and ”splines”(R Core
Development Team 2014).
Statistical tests where p < 0.05 were considered statistically significant. Means are
presented with standard deviations.
Results
A total of 7611 (6916 field, 695 museum) clutch measurements were acquired. These
measurements include great skua egg measurements from Bear Island, Iceland, Faroes,
Shetland, Orkney and Western Scotland. In addition, egg measurements from Faroese
guillemot (1650 – 1531:119 field:museum) and fulmar (711 – 635:76 field: museum) eggs
were available. The field measurements of great skua eggs were taken from 1961 until
2014, and the guillemot measurements from 1977 until 2013, and fulmar field
measurements from 1986 until 2013 (Table 3.1), and museum egg measurements were
mostly from 1840 to 1950. Measurements of extreme outliers such as runt eggs, (fulmar
n=6, guillemot n=4, great skua n=3) and one extremely large outlier (fulmar n=1) have
been omitted from the analysis.
Firstly I tested if great skua egg size differed between three separate colonies in the Faroes
within the same year (2014). The colonies, Saksun, Svínoy, and Skúvoy (fig 1.2) were of a
similar size (100-200 pairs) and separated by a distance of less than 70 km. The average
egg size showed no significant difference (F2,242 = 2.24, p = 0.108). Measurements from
eggs measured in the same time period and from the same region did not differ between
field and museum measurements (1) for Faroes between 1960-1969: (F1,280 = 0.27, p =
0.605), and (2) for Shetland between 1971-1978: (F1,558 = 0.25, p = 0.617). I therefore
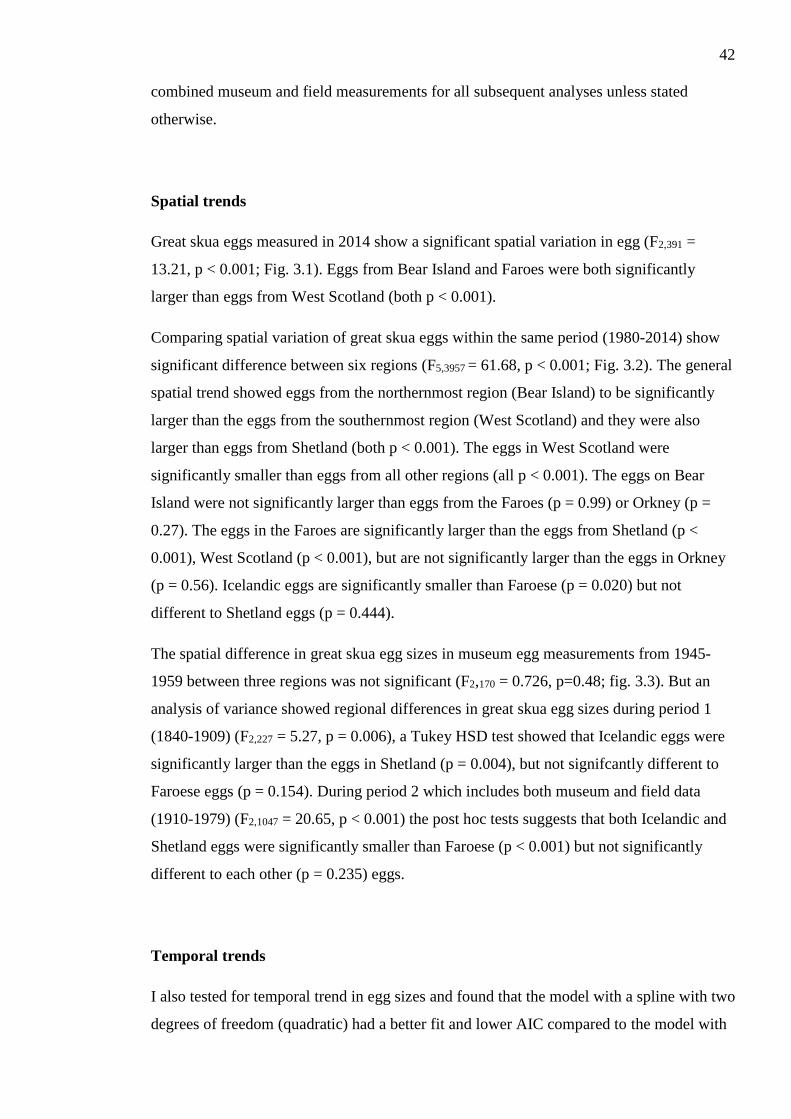
42
combined museum and field measurements for all subsequent analyses unless stated
otherwise.
Spatial trends
Great skua eggs measured in 2014 show a significant spatial variation in egg (F2,391 =
13.21, p < 0.001; Fig. 3.1). Eggs from Bear Island and Faroes were both significantly
larger than eggs from West Scotland (both p < 0.001).
Comparing spatial variation of great skua eggs within the same period (1980-2014) show
significant difference between six regions (F5,3957 = 61.68, p < 0.001; Fig. 3.2). The general
spatial trend showed eggs from the northernmost region (Bear Island) to be significantly
larger than the eggs from the southernmost region (West Scotland) and they were also
larger than eggs from Shetland (both p < 0.001). The eggs in West Scotland were
significantly smaller than eggs from all other regions (all p < 0.001). The eggs on Bear
Island were not significantly larger than eggs from the Faroes (p = 0.99) or Orkney (p =
0.27). The eggs in the Faroes are significantly larger than the eggs from Shetland (p <
0.001), West Scotland (p < 0.001), but are not significantly larger than the eggs in Orkney
(p = 0.56). Icelandic eggs are significantly smaller than Faroese (p = 0.020) but not
different to Shetland eggs (p = 0.444).
The spatial difference in great skua egg sizes in museum egg measurements from 1945-
1959 between three regions was not significant (F2,170 = 0.726, p=0.48; fig. 3.3). But an
analysis of variance showed regional differences in great skua egg sizes during period 1
(1840-1909) (F2,227 = 5.27, p = 0.006), a Tukey HSD test showed that Icelandic eggs were
significantly larger than the eggs in Shetland (p = 0.004), but not signifcantly different to
Faroese eggs (p = 0.154). During period 2 which includes both museum and field data
(1910-1979) (F2,1047 = 20.65, p < 0.001) the post hoc tests suggests that both Icelandic and
Shetland eggs were significantly smaller than Faroese (p < 0.001) but not significantly
different to each other (p = 0.235) eggs.
Temporal trends
I also tested for temporal trend in egg sizes and found that the model with a spline with two
degrees of freedom (quadratic) had a better fit and lower AIC compared to the model with
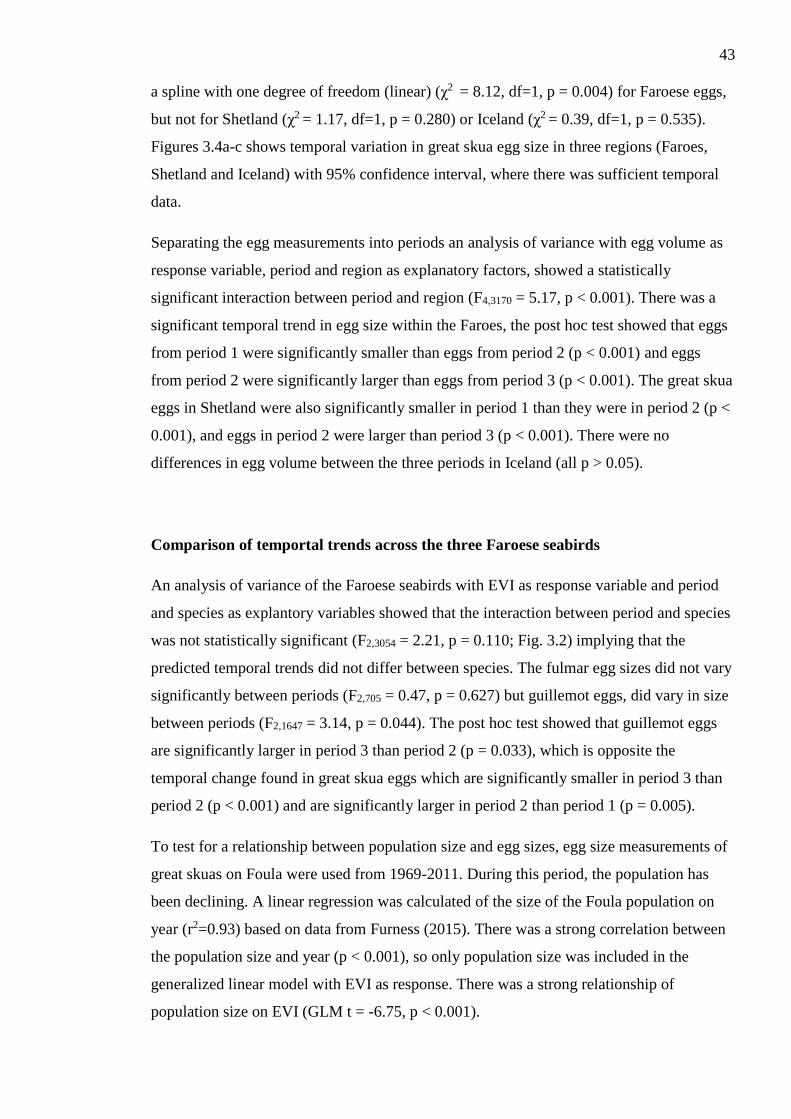
43
a spline with one degree of freedom (linear) (χ2 = 8.12, df=1, p = 0.004) for Faroese eggs,
but not for Shetland (χ2 = 1.17, df=1, p = 0.280) or Iceland (χ2 = 0.39, df=1, p = 0.535).
Figures 3.4a-c shows temporal variation in great skua egg size in three regions (Faroes,
Shetland and Iceland) with 95% confidence interval, where there was sufficient temporal
data.
Separating the egg measurements into periods an analysis of variance with egg volume as
response variable, period and region as explanatory factors, showed a statistically
significant interaction between period and region (F4,3170 = 5.17, p < 0.001). There was a
significant temporal trend in egg size within the Faroes, the post hoc test showed that eggs
from period 1 were significantly smaller than eggs from period 2 (p < 0.001) and eggs
from period 2 were significantly larger than eggs from period 3 (p < 0.001). The great skua
eggs in Shetland were also significantly smaller in period 1 than they were in period 2 (p <
0.001), and eggs in period 2 were larger than period 3 (p < 0.001). There were no
differences in egg volume between the three periods in Iceland (all p > 0.05).
Comparison of temportal trends across the three Faroese seabirds
An analysis of variance of the Faroese seabirds with EVI as response variable and period
and species as explantory variables showed that the interaction between period and species
was not statistically significant (F2,3054 = 2.21, p = 0.110; Fig. 3.2) implying that the
predicted temporal trends did not differ between species. The fulmar egg sizes did not vary
significantly between periods (F2,705 = 0.47, p = 0.627) but guillemot eggs, did vary in size
between periods (F2,1647 = 3.14, p = 0.044). The post hoc test showed that guillemot eggs
are significantly larger in period 3 than period 2 (p = 0.033), which is opposite the
temporal change found in great skua eggs which are significantly smaller in period 3 than
period 2 (p < 0.001) and are significantly larger in period 2 than period 1 (p = 0.005).
To test for a relationship between population size and egg sizes, egg size measurements of
great skuas on Foula were used from 1969-2011. During this period, the population has
been declining. A linear regression was calculated of the size of the Foula population on
year (r2=0.93) based on data from Furness (2015). There was a strong correlation between
the population size and year (p < 0.001), so only population size was included in the
generalized linear model with EVI as response. There was a strong relationship of
population size on EVI (GLM t = -6.75, p < 0.001).
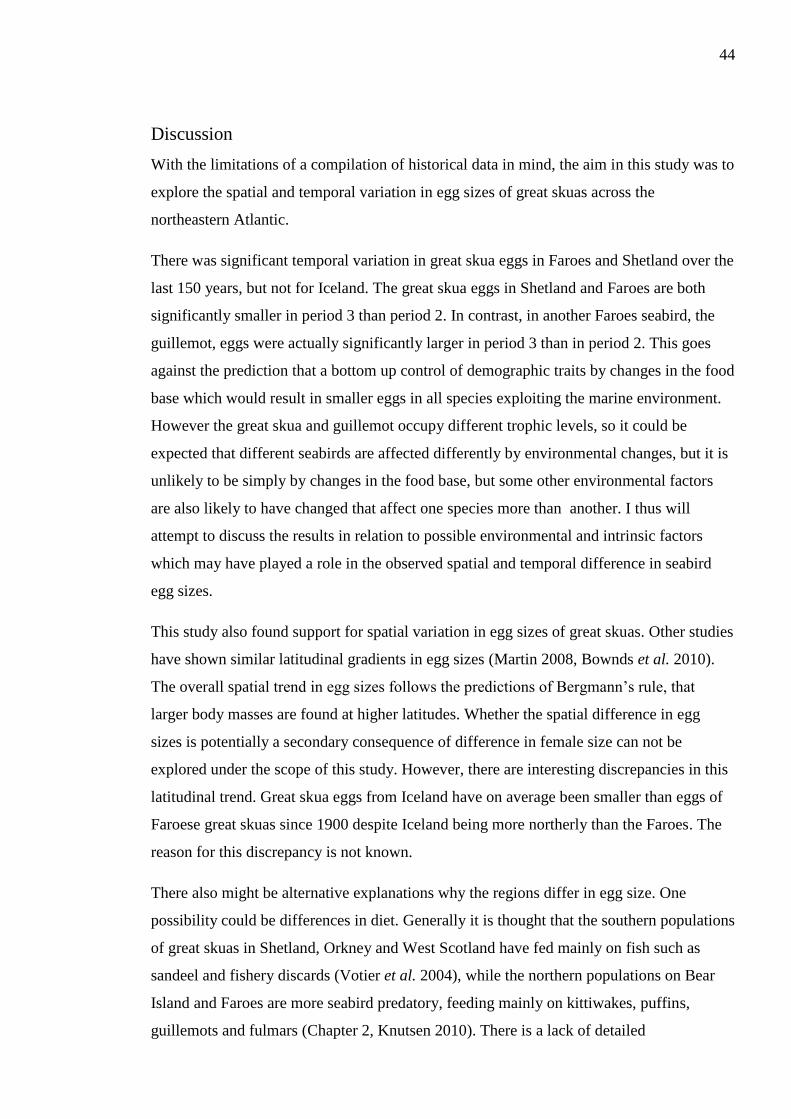
44
Discussion
With the limitations of a compilation of historical data in mind, the aim in this study was to
explore the spatial and temporal variation in egg sizes of great skuas across the
northeastern Atlantic.
There was significant temporal variation in great skua eggs in Faroes and Shetland over the
last 150 years, but not for Iceland. The great skua eggs in Shetland and Faroes are both
significantly smaller in period 3 than period 2. In contrast, in another Faroes seabird, the
guillemot, eggs were actually significantly larger in period 3 than in period 2. This goes
against the prediction that a bottom up control of demographic traits by changes in the food
base which would result in smaller eggs in all species exploiting the marine environment.
However the great skua and guillemot occupy different trophic levels, so it could be
expected that different seabirds are affected differently by environmental changes, but it is
unlikely to be simply by changes in the food base, but some other environmental factors
are also likely to have changed that affect one species more than another. I thus will
attempt to discuss the results in relation to possible environmental and intrinsic factors
which may have played a role in the observed spatial and temporal difference in seabird
egg sizes.
This study also found support for spatial variation in egg sizes of great skuas. Other studies
have shown similar latitudinal gradients in egg sizes (Martin 2008, Bownds et al. 2010).
The overall spatial trend in egg sizes follows the predictions of Bergmann’s rule, that
larger body masses are found at higher latitudes. Whether the spatial difference in egg
sizes is potentially a secondary consequence of difference in female size can not be
explored under the scope of this study. However, there are interesting discrepancies in this
latitudinal trend. Great skua eggs from Iceland have on average been smaller than eggs of
Faroese great skuas since 1900 despite Iceland being more northerly than the Faroes. The
reason for this discrepancy is not known.
There also might be alternative explanations why the regions differ in egg size. One
possibility could be differences in diet. Generally it is thought that the southern populations
of great skuas in Shetland, Orkney and West Scotland have fed mainly on fish such as
sandeel and fishery discards (Votier et al. 2004), while the northern populations on Bear
Island and Faroes are more seabird predatory, feeding mainly on kittiwakes, puffins,
guillemots and fulmars (Chapter 2, Knutsen 2010). There is a lack of detailed
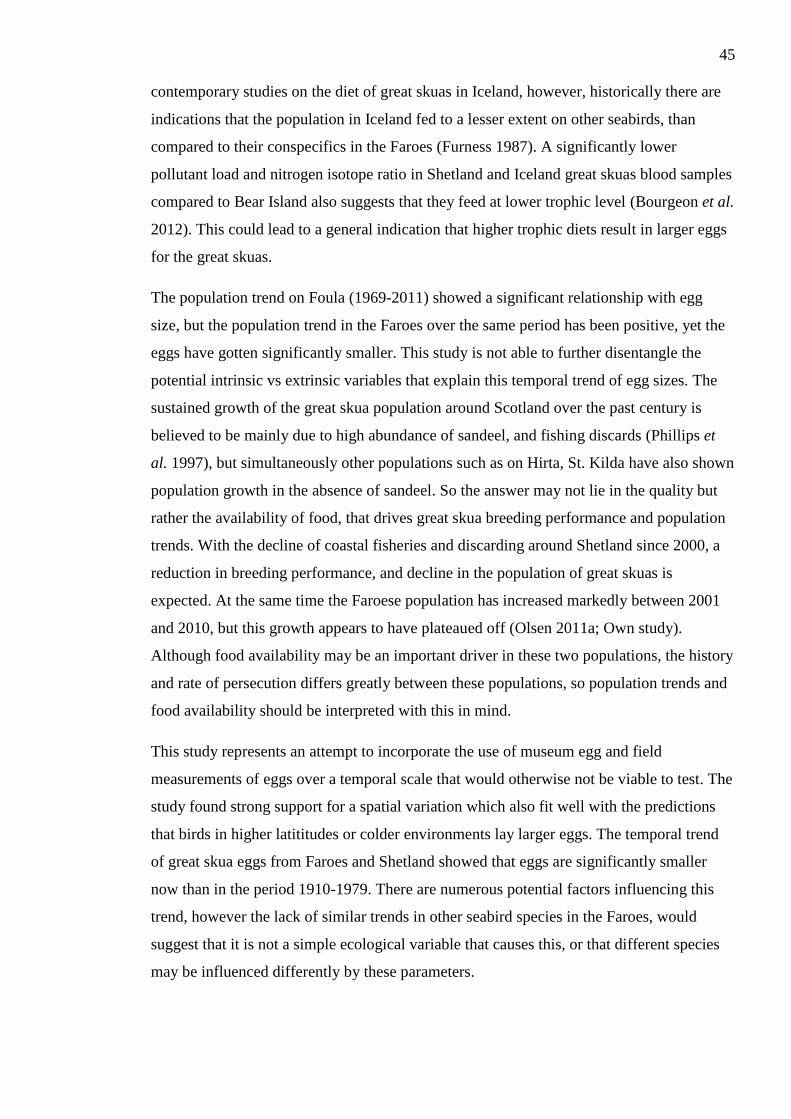
45
contemporary studies on the diet of great skuas in Iceland, however, historically there are
indications that the population in Iceland fed to a lesser extent on other seabirds, than
compared to their conspecifics in the Faroes (Furness 1987). A significantly lower
pollutant load and nitrogen isotope ratio in Shetland and Iceland great skuas blood samples
compared to Bear Island also suggests that they feed at lower trophic level (Bourgeon et al.
2012). This could lead to a general indication that higher trophic diets result in larger eggs
for the great skuas.
The population trend on Foula (1969-2011) showed a significant relationship with egg
size, but the population trend in the Faroes over the same period has been positive, yet the
eggs have gotten significantly smaller. This study is not able to further disentangle the
potential intrinsic vs extrinsic variables that explain this temporal trend of egg sizes. The
sustained growth of the great skua population around Scotland over the past century is
believed to be mainly due to high abundance of sandeel, and fishing discards (Phillips et
al. 1997), but simultaneously other populations such as on Hirta, St. Kilda have also shown
population growth in the absence of sandeel. So the answer may not lie in the quality but
rather the availability of food, that drives great skua breeding performance and population
trends. With the decline of coastal fisheries and discarding around Shetland since 2000, a
reduction in breeding performance, and decline in the population of great skuas is
expected. At the same time the Faroese population has increased markedly between 2001
and 2010, but this growth appears to have plateaued off (Olsen 2011a; Own study).
Although food availability may be an important driver in these two populations, the history
and rate of persecution differs greatly between these populations, so population trends and
food availability should be interpreted with this in mind.
This study represents an attempt to incorporate the use of museum egg and field
measurements of eggs over a temporal scale that would otherwise not be viable to test. The
study found strong support for a spatial variation which also fit well with the predictions
that birds in higher latititudes or colder environments lay larger eggs. The temporal trend
of great skua eggs from Faroes and Shetland showed that eggs are significantly smaller
now than in the period 1910-1979. There are numerous potential factors influencing this
trend, however the lack of similar trends in other seabird species in the Faroes, would
suggest that it is not a simple ecological variable that causes this, or that different species
may be influenced differently by these parameters.
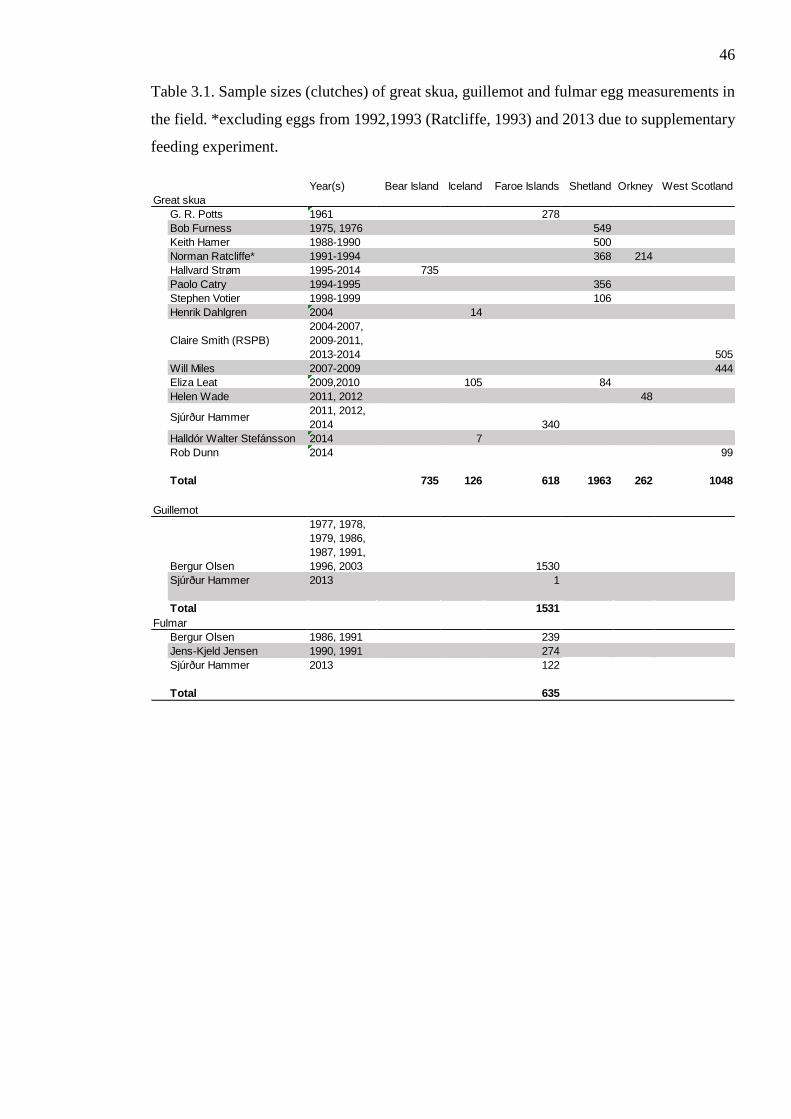
46
Table 3.1. Sample sizes (clutches) of great skua, guillemot and fulmar egg measurements in
the field. *excluding eggs from 1992,1993 (Ratcliffe, 1993) and 2013 due to supplementary
feeding experiment.
Year(s) Bear Island Iceland Faroe Islands Shetland Orkney West Scotland
Great skua
G. R. Potts 1961 278
Bob Furness 1975, 1976 549
Keith Hamer 1988-1990 500
Norman Ratcliffe* 1991-1994 368 214
Hallvard Strøm 1995-2014 735
Paolo Catry 1994-1995 356
Stephen Votier 1998-1999 106
Henrik Dahlgren 2004 14
Claire Smith (RSPB)
2004-2007,
2009-2011,
2013-2014 505
Will Miles 2007-2009 444
Eliza Leat 2009,2010 105 84
Helen Wade 2011, 2012 48
Sjúrður Hammer2011, 2012,
2014 340
Halldór Walter Stefánsson 2014 7
Rob Dunn 2014 99
Total 735 126 618 1963 262 1048
Guillemot
Bergur Olsen
1977, 1978,
1979, 1986,
1987, 1991,
1996, 2003 1530
Sjúrður Hammer 2013 1
Total 1531
Fulmar
Bergur Olsen 1986, 1991 239
Jens-Kjeld Jensen 1990, 1991 274
Sjúrður Hammer 2013 122
Total 635
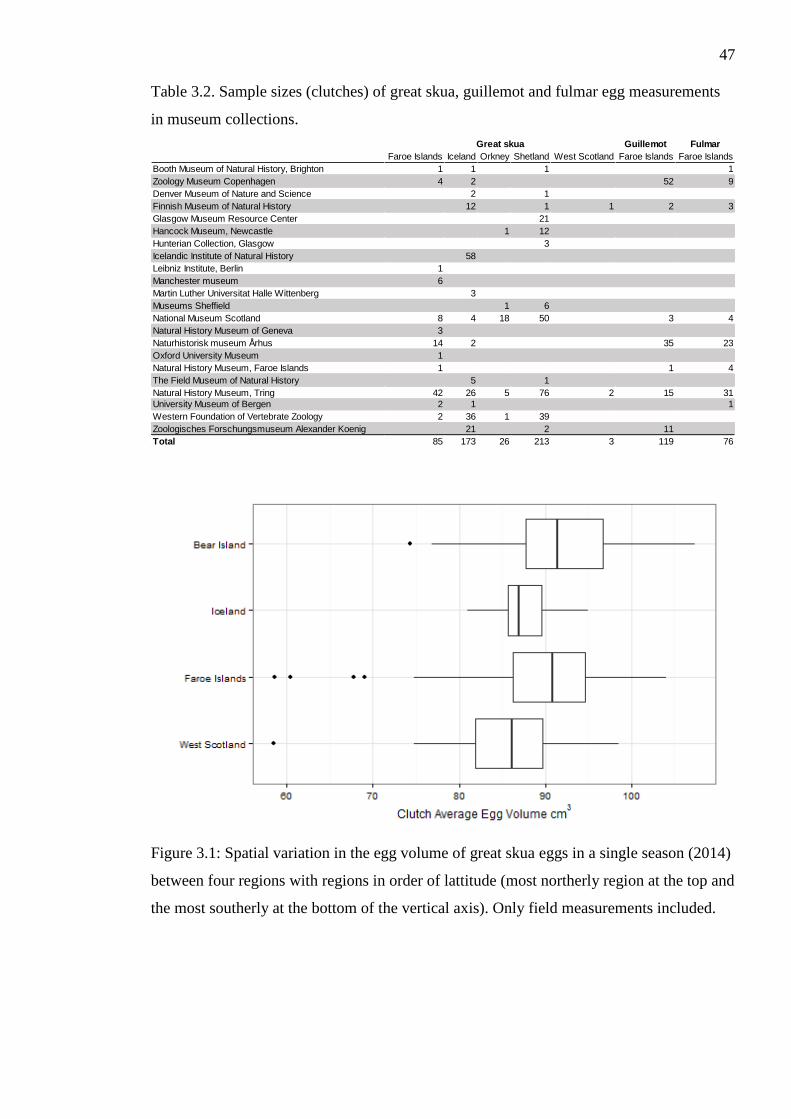
47
Table 3.2. Sample sizes (clutches) of great skua, guillemot and fulmar egg measurements
in museum collections.
Figure 3.1: Spatial variation in the egg volume of great skua eggs in a single season (2014)
between four regions with regions in order of lattitude (most northerly region at the top and
the most southerly at the bottom of the vertical axis). Only field measurements included.
Guillemot Fulmar
Faroe Islands Iceland Orkney Shetland West Scotland Faroe Islands Faroe Islands
Booth Museum of Natural History, Brighton 1 1 1 1
Zoology Museum Copenhagen 4 2 52 9
Denver Museum of Nature and Science 2 1
Finnish Museum of Natural History 12 1 1 2 3
Glasgow Museum Resource Center 21
Hancock Museum, Newcastle 1 12
Hunterian Collection, Glasgow 3
Icelandic Institute of Natural History 58
Leibniz Institute, Berlin 1
Manchester museum 6
Martin Luther Universitat Halle Wittenberg 3
Museums Sheffield 1 6
National Museum Scotland 8 4 18 50 3 4
Natural History Museum of Geneva 3
Naturhistorisk museum Århus 14 2 35 23
Oxford University Museum 1
Natural History Museum, Faroe Islands 1 1 4
The Field Museum of Natural History 5 1
Natural History Museum, Tring 42 26 5 76 2 15 31
University Museum of Bergen 2 1 1
Western Foundation of Vertebrate Zoology 2 36 1 39
Zoologisches Forschungsmuseum Alexander Koenig 21 2 11
Total 85 173 26 213 3 119 76
Great skua
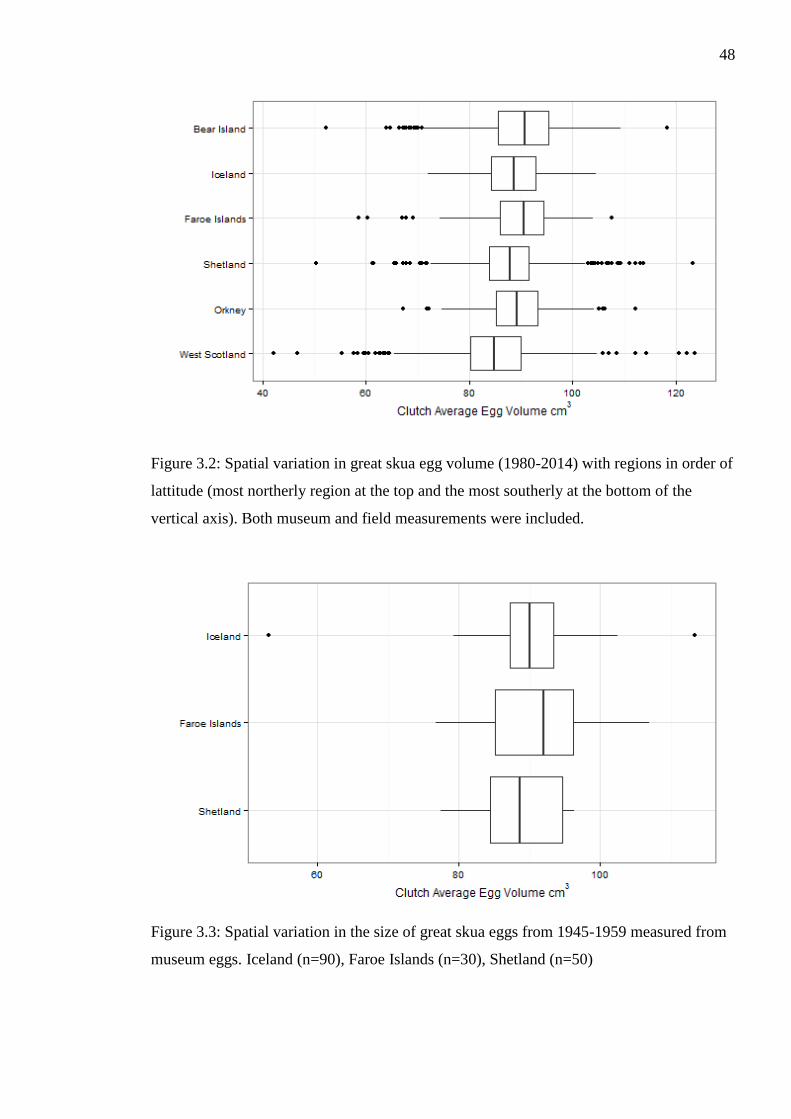
48
Figure 3.2: Spatial variation in great skua egg volume (1980-2014) with regions in order of
lattitude (most northerly region at the top and the most southerly at the bottom of the
vertical axis). Both museum and field measurements were included.
Figure 3.3: Spatial variation in the size of great skua eggs from 1945-1959 measured from
museum eggs. Iceland (n=90), Faroe Islands (n=30), Shetland (n=50)
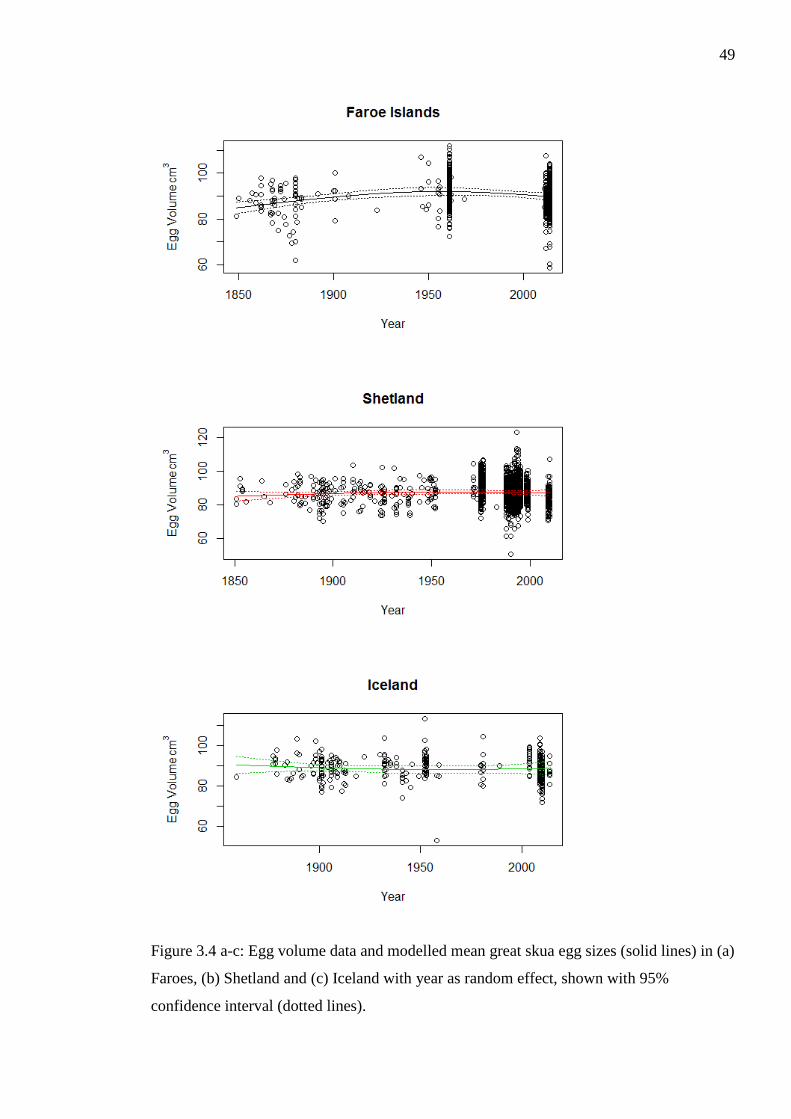
49
Figure 3.4 a-c: Egg volume data and modelled mean great skua egg sizes (solid lines) in (a)
Faroes, (b) Shetland and (c) Iceland with year as random effect, shown with 95%
confidence interval (dotted lines).
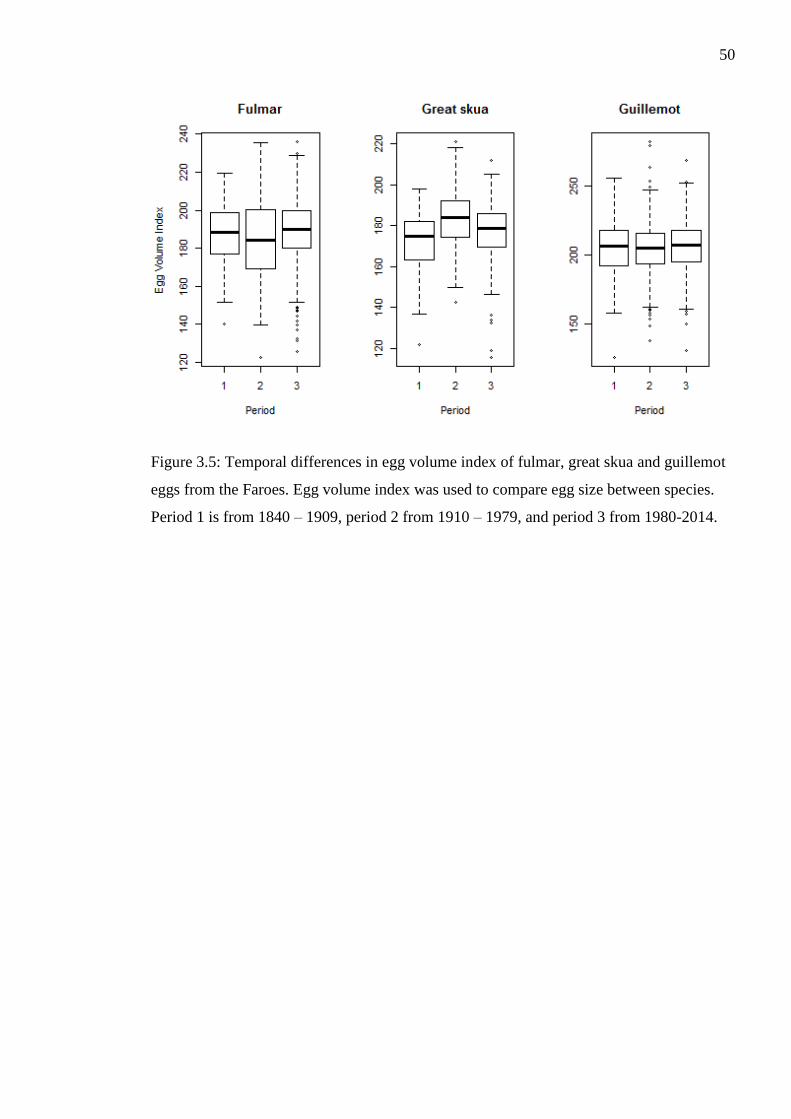
50
Figure 3.5: Temporal differences in egg volume index of fulmar, great skua and guillemot
eggs from the Faroes. Egg volume index was used to compare egg size between species.
Period 1 is from 1840 – 1909, period 2 from 1910 – 1979, and period 3 from 1980-2014.
51
4. Legacy Pollutants are Declining in Great Skuas (Stercorarius
skua) but Remain Higher in Faroe Islands than in Scotland
Abstract
To monitor environmental pollutants in Faroese biota, samples from a top predator were
analysed and put into a spatial and temporal context. Analysis of 20 great skua eggs
sampled in 2012 from the Faroe Islands showed >70% lower concentrations of legacy
persistent organic pollutants (POPs) than in samples analysed in 1977. The 2012 Faroese
eggs showed higher concentrations than for eggs in Shetland from about the same period
(2008). Eggshells were analysed for sub-lethal effects but there were no detectable effects
of legacy POP levels on eggshell colour or thickness. A temporal decline in legacy POPs
would indicate a reduction in the general pollutant levels present in the environment as has
been shown in other areas of the North Atlantic, but there are significant geographic
differences in POPs levels likely due to differences in diet resulting in significantly
different exposures on a relatively limited spatial scale.
Introduction
Top predators are particularly exposed to environmental pollutants which magnify in the
food-chain (Newman 2010), and as such are often used as monitors of pollution levels in
the environment (Furness & Camphuysen 1997). Due to the high trophic position of
seabirds, they have been found to accumulate lipid-soluble persistent organic pollutants
(POPs). There may, however, be strong geographic differences in pollutant concentrations
found in top predators due to various factors such as proximity to pollutant sources,
latitudinal variation in atmospheric deposition, and spatial differences in diet (Bourgeon et
al. 2013).
Eggs from great skuas (Stercorarius skua) a top predator in the Faroese marine ecosystem
were sampled in 1977 showed exceptionally high concentrations in total PCB, DDT and
DDE and four and five orders of magnitude higher concentrations of PCB and DDE
respectively, compared to eggs of fulmars (Fulmarus glacialis) (Bloch et al. 1987). With
the implementation of regulations restricting the use of PCBs in the 1970s and the ban
agreed by the Stockholm convention of 2004, several POPs have been phased out of use
(Hagen & Walls 2001). However, they may still persist in the environment, despite
production having been halted or reduced, and are referred to as legacy POPs. Moreover,
large volumes of PCBs applied prior to the restrictions are today part of buildings and the
52
technosphere in general and leak into the environment (Breivik et al. 2002). Considering
the historic high levels in Faroese great skua eggs, an evaluation of the pollutant status of
great skuas in the Faroe Islands (Faroes hereafter) is timely and important. A recent study
from Shetland comparing great skua eggs from 1980 and 2008 showed a significant
decline in most legacy POPs (Leat et al. 2011). The decline was greatest for the least
persistent pollutants such as DDT and some PCB congeners, suggesting a reduced
presence in the wider marine ecosystem of some of the legacy POPs (Leat et al. 2011). The
aim of the present analysis of eggs collected in the Faroes in 2012 is to determine if there is
also a significant decline in legacy POPs in the Faroese environment, similar to Shetland.
Some pollutants, such as DDT and DDE influence calcium metabolism of birds, and have
been shown to cause eggshell thinning (Ratcliffe 1970). A thinning of eggshells is widely
associated with reduced hatching success (Beyer et al. 1996). The concentrations in
Faroese great skua eggs in the 1970s was at a level that caused eggshell thinning in other
seabird species such as ivory gull (Pagophila eburnea) (Miljeteig et al. 2012). The
potential of DDT and DDE to interfere with the organisms’ calcium metabolism has also
been proposed to have a measurable effect on eggshell colour (Jagannath et al. 2008), and
a recent study on herring gulls (Larus argentatus) detected a relationship between eggshell
colour and POPs levels in the eggs (Hanley & Doucet 2012). Therefore, as a part of our
analysis of pollutant concentrations in great skua eggs, we also measured eggshell
thickness and colour and tested if there was a relationship the egg’s pollutant load.
There was a significant geographic difference in POPs levels between great skua eggs from
Shetland and Faroes in the 1970s (Bloch et al. 1987, Leat et al. 2011). Here we will also
investigate the geographical variation in contemporaneous POP levels between Faroes and
Shetland using published data for Shetland from Leat et al. (2011) and freshly collected
eggs from the Faroes. Among the factors that could contribute to the geographic
differences in POPs concentrations is difference in diet between breeding areas. We expect
populations that forage on a higher trophic level (measured as δ15N stable isotope ratio of
the egg material) accumulate higher POP levels due to bio-accumulation of contaminants
through the food web.
Method
In 2012, 20 eggs from 20 different nests were collected from the great skua colony at
Skúvoy, Faroe Islands (61°46'N 6°49'W). Nesting territories were located and selected
53
randomly throughout the colony, by observing presence and aggressive behaviour of at
least one parent. Within approximately 1 week after laying, single eggs were collected
from two-egg clutches only, and were refrigerated overnight. The next day, eggs were
opened along the long axis and the egg content emptied, homogenized and frozen at -20˚C
until analysis. Eggshells were dried at air temperature and then stored in a dry and dark
condition.
The POPs analysis on egg content was performed by the Centre de Toxicologie du Québec
(Québec, Canada) which is accredited under ISO17025 and participates in the Arctic
Monitoring Assessment Programme (AMAP). The samples were enriched with internal
standards, mixed with dichloromethane and chemically dried using sodium sulphate. The
compounds were then extracted in an ultrasonic bath followed by a filtration. A subset of
the sample was used to determine lipid percentage by gravimetry. The sample for analyses
was concentrated by evaporation and purified using gel permeation chromatography (GPC)
and cleaned-up on Florisil column. The extracts were analysed using an Agilent 5973 gas
chromatograph equipped with a PTV injector and an AutoSpec Ultima High Resolution
Mass Spectrometer (HRMS) from Waters/Micromass. The HRMS was operated at
Resolution 10,000 at 10%. All chromatography was performed on a 60m, 0.25mm DB5
MS capillary column. The analysis was done for the following compounds: PCB congeners
28, 52, 99, 101, 105, 118, 128, 138, 153, 156, 163, 170, 180, 183, 187, PCB arochlor 1260,
o,p’-DDE, α-chlordane, γ-chlordane, cis-nonachlor, trans-nonachlor, hexachlorobenzene,
Mirex, oxychlordane, p,p’-DDE, o,p’-DDT, p,p’-DDT, β-HCH, Toxaphene parlar 26, 32,
50, 62. In order to control for variation in lipid content each sample was divided by lipid
percentage and is reported as wet weight (ww), and all concentrations are reported as
µg/kg. 100% Gamma chlordane and 90% of PCB congener 52 were below their detection
limits of 0.004 µg/kg ww and 13.6 µg/kg ww, respectively,and these compounds were
excluded from further analysis. The sum of PCB congeners is referred to as PCB14.
To assess trophic level of Faroese great skuas during egg formation, stable isotope analysis
of the egg content was undertaken at the NERC Life Sciences Mass Spectrometry Facility.
The egg material was oven-dried at 40°C for >24 hours. Stable nitrogen isotope analyses
can be used as a proxy for the trophic level of ingested prey (Hobson & Welch 1992), and
were performed by continuous flow isotope ratio mass spectrometry (CF-IRMS) on an
average of 0.8 ± 0.1 mg of sub-sampled material loaded into tin cups and combusted in a
Costech ECS 4010 elemental analyser coupled to a Thermo Finnigan Delta Plus XP mass
spectrometer. Lab standards (gelatin, alanine and glycine) were run between every 10
54
samples to correct for instrument drift. Isotope ratios are expressed as parts per thousand
(‰) according to the equation δX = [(Rsample/Rstandard)-1] x1000, where X is 15N, R is the
15N/14N, and Rstandard is the ratio of the international references AIR for nitrogen. Lab
standards were calibrated with international reference standards and the measurement
precision is calculated as the standard deviation of multiple measurements of internal lab
standard material (tryptophan) which was ±0.209 ‰.
Eggshell thickness, included the inner and outer membrane, was measured using a
micrometer with a ballpoint tip, to the nearest 0.01 mm at three different points along the
long axis of the egg (pointed, equator and blunt). Measurements at each location along the
long axis were repeated three times and the repeatability of the measurements at each
location of the egg was tested using Intraclass Correlation Coefficient (ICC package,
Wolak et al 2012; in R version 3.1.2, R Core Team 2014). Measurement repeatabilities
were high at each of the locations - between 0.90 and 0.92. In order to compare with
previously reported thickness values (measured without membranes) we also measured
eggshell thickness without membranes where possible on a subset of samples.
The eggshell background colour was determined using photographs in RAW format taken
by a digital SLR camera (Nikon D7000). The photographs were taken on the intact egg
outside in ambient light during the middle of the day, with the eggs placed on a flat
platform with colour reference material (X-rite ColorChecker Passport, Michigan, US) on
each photograph. Care was taken to shelter each photograph from direct sunlight. From the
image we recorded red (R), green (G) and blue (B) values using the Pixel Inspector Tool
plugin in ImageJ (Rasband 2014) from six different pixels of the standardised grey colours
on the ColorCheckerPassport and from six different pixels at the blunt end of the egg
avoiding maculation and dirt. To control for the effect of variation in light condition on
colour (linearization) we used the standardised greyscale colour from the colour reference
material where RGB values are known. Known and observed RGB values of the
standardised grey colours were regressed against each other and the resulting correction
equation applied to the RGB values of the eggshell. It has been suggested that colour data
are better interpreted as ratios as opposed to absolute values (Bergman & Beehner 2008),
so we analysed R:G as a ratio.
Comparison with published data was done by t-test where appropriate, and Mann-Whitney
U test where the data did not fulfill the normality criteria. Bonferroni correction was
applied where multiple t-tests were carried out on the different POP compounds from the
same eggs. For testing differences in thickness between locations on the eggshell, a linear
55
mixed effect model was created using lme4 package in R (Bates et al. 2015b). A paired t-
test was used to compare eggshell thickness measurements with and without membranes.
To test for associations between POPs concentration and eggshell thickness and color the
Spearman ranked correlations were used. We tested correlations between POP compounds
and trophic level (δ15N). If there is no association between POP and trophic level then
positive and negative correlations are equally likely to occur. To test this we compared the
proportion of observed positive correlations against 50% using a binomial test. All
statistical tests were done in R version 3.1.2 (R Core Team 2016). Means ± 1 standard
deviation are reported and two-tailed p < 0.05 was taken as statistically significant.
Results and Discussion
In the Faroese eggs collected in 2012 had lower DDT, DDE and sum of PCB levels than
eggs in 1977 (table 4.1). The concentrations of other compounds in Faroese eggs from
2012, but not measured in 1977 such as ß-HCH, HCB, Mirex,Cis-Nonachlor,
Oxychlordane, Toxaphene parlar 26, 50, 62, were also significantly higher than in
contemporary eggs from Shetland and none of the compounds were significantly lower in
Faroes compared with Shetland (table 4.1). The reduction in concentrations of legacy POPs
from 1977 to 2012 is so large that we can be confident that this reflects a real and
considerable decline and is not attributed to differences in analytic approach. A similar
temporal decline in legacy POPs concentrations has also been seen in other marine animals
such as black guillemot (Cepphus grylle) eggs, juvenile pilot whale (Globicephala melas)
blubber and cod (Gadus morhua) from the Faroes (Nielsen et al. 2014). A decline in
legacy POPs in the marine environment over the last few decades has also been found in
other regions in the North Atlantic and Arctic (Helgason et al. 2008, Muir & de Wit
2010). The relatively greater decline of DDT (99.5%) in relation to DDE (70.2%, table 4.1)
could be explained by the restriction of DDT use as pesticide, while its metabolite – DDE
– persists in the environment for longer than the parent compound (Peakall 2007). PCBs
also declined by 63.6%. However caution is needed when comparing PCB data between
1977 and 2012 because different quantification methods were used. The egg samples
collected by Bloch et al (1987) were not available to re-analyse alongside contemporary
samples. Nevertheless, we assume the sum PCB as quantified with Clophen A60 in 1977 is
broadly comparable to single congener quantification Aroclor 1260. The sum of 14 PCB
congeners analysed in the 2012 samples is reported in table 4.1, however for comparison
56
with Leat et al (2011) which did not include congener 163 in its sumPCB this congener
was excluded.
The linear mixed effect model showed the mean eggshell thickness to vary along the
longitudinal axis (t = 4.30 ) . A Tukey posthoc test showed the pointed end 0.32 mm
(±0.028) was signficantly thicker than than the blunt end 0.31 mm (±0.023) (p < 0.001),
but the difference was not significant between pointed end and the equator 0.31 mm
(±0.026) (p= 0.58). Other studies have shown similar variation in eggshell thickness along
the length axis with thinner shells at the blunt end than at the equator and pointed end (e.g.
Maurer et al. 2012). Since the difference was small between the locations we used the
mean of the eggshell thickness across all three positions for further analysis and the mean
eggshell thickness of Faroese great skua eggs in 2012 was 0.32 mm (±0.022). Bloch et al
(1987) reported eggshell thickness of 0.28 mm (±0.016) for 19 great skua eggs sampled in
the Faroes in 1977, although location of thickness measure was not specified. However
these measurements were taken without membranes. In our sample we found a difference
between shell thickness with and without the membranes of on average 0.06 mm (± 0.028,
n = 17 eggs; paired- t = 11.84, df = 16, p < 0.001), which means that the membranes
included in the shell thickness measurement could potentially account for the apparent
difference in eggshell thickness between 1977 and 2012.
There was no significant correlation of eggshell thickness with DDE (Spearman rs = 0.17,
n = 20, p = 0.477) or with DDT (Spearman rs = 0.09, n = 20, p = 0.696). There was also no
significant correlation between DDE, DDT or PCB14 and eggshell colour (R:G ratio)
(DDT: Spearman rs = 0.24, p = 0.311, DDE: rs = -0.16, p = 0.504, PCB14: rs = -0.30, p =
0.197). Current DDT concentrations in Faroese great skua eggs are now below the limit
where we would expect to find an effect on eggshell thickness (Beyer & Meador 2011).
The mean DDE concentration of 1823 ±1213 µg/kg ww, is however within the range of
concentrations where eggshell thinning would occur in some birds of prey (>100 µg/kg ww
for golden eagles Aquila chrysaetos) (Newton & Galbraith 1991). However it is well
established that bird species differ in their tolerance of DDE (Beyer & Meador 2011), and
the marine diet is generally richer in calcium than in terrestrial ecosystem (Reynolds &
Perrins 2010), so calcium may not become a limiting factor, despite the detrimental effects
from DDE and DDT on calcium metabolism.
In addition to a decline in POP levels in great skua over a period of 35 years, our data also
showed that Faroese eggs in 2012 had statistically higher POP levels than Shetland great
skua eggs in 2008 (table 4.1, fig.4.1). There might be at least three reasons why Faroese
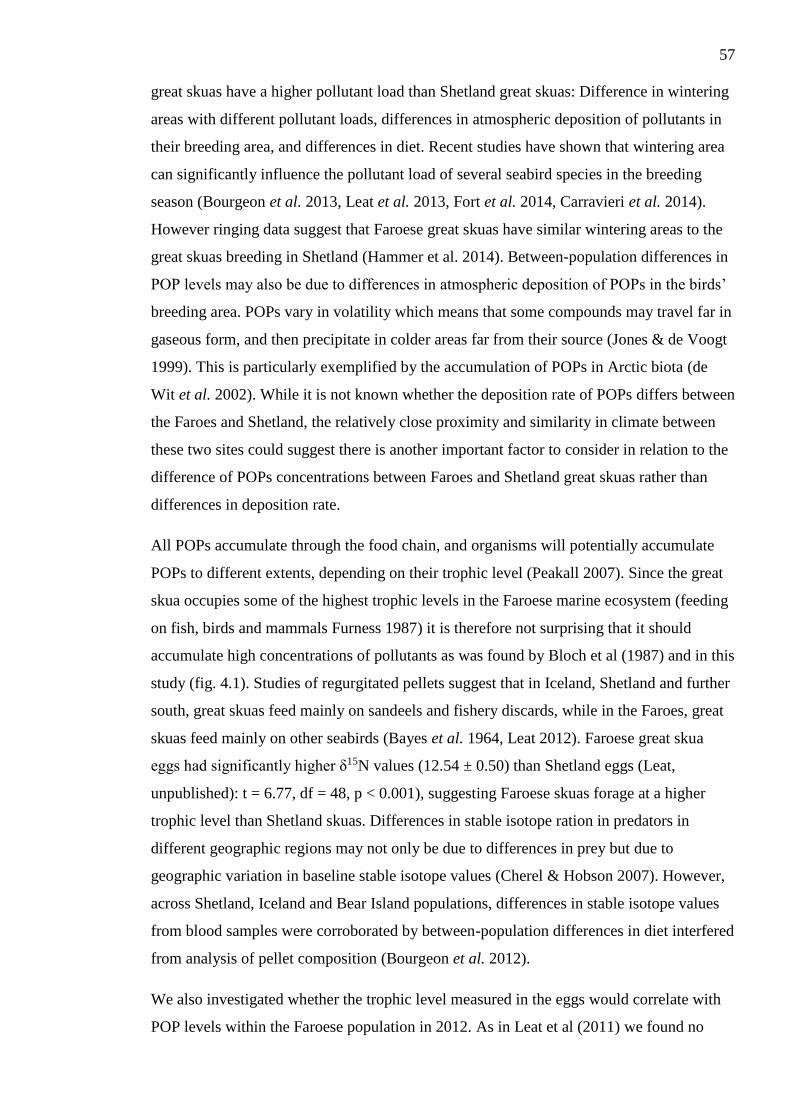
57
great skuas have a higher pollutant load than Shetland great skuas: Difference in wintering
areas with different pollutant loads, differences in atmospheric deposition of pollutants in
their breeding area, and differences in diet. Recent studies have shown that wintering area
can significantly influence the pollutant load of several seabird species in the breeding
season (Bourgeon et al. 2013, Leat et al. 2013, Fort et al. 2014, Carravieri et al. 2014).
However ringing data suggest that Faroese great skuas have similar wintering areas to the
great skuas breeding in Shetland (Hammer et al. 2014). Between-population differences in
POP levels may also be due to differences in atmospheric deposition of POPs in the birds’
breeding area. POPs vary in volatility which means that some compounds may travel far in
gaseous form, and then precipitate in colder areas far from their source (Jones & de Voogt
1999). This is particularly exemplified by the accumulation of POPs in Arctic biota (de
Wit et al. 2002). While it is not known whether the deposition rate of POPs differs between
the Faroes and Shetland, the relatively close proximity and similarity in climate between
these two sites could suggest there is another important factor to consider in relation to the
difference of POPs concentrations between Faroes and Shetland great skuas rather than
differences in deposition rate.
All POPs accumulate through the food chain, and organisms will potentially accumulate
POPs to different extents, depending on their trophic level (Peakall 2007). Since the great
skua occupies some of the highest trophic levels in the Faroese marine ecosystem (feeding
on fish, birds and mammals Furness 1987) it is therefore not surprising that it should
accumulate high concentrations of pollutants as was found by Bloch et al (1987) and in this
study (fig. 4.1). Studies of regurgitated pellets suggest that in Iceland, Shetland and further
south, great skuas feed mainly on sandeels and fishery discards, while in the Faroes, great
skuas feed mainly on other seabirds (Bayes et al. 1964, Leat 2012). Faroese great skua
eggs had significantly higher δ15N values (12.54 ± 0.50) than Shetland eggs (Leat,
unpublished): t = 6.77, df = 48, p < 0.001), suggesting Faroese skuas forage at a higher
trophic level than Shetland skuas. Differences in stable isotope ration in predators in
different geographic regions may not only be due to differences in prey but due to
geographic variation in baseline stable isotope values (Cherel & Hobson 2007). However,
across Shetland, Iceland and Bear Island populations, differences in stable isotope values
from blood samples were corroborated by between-population differences in diet interfered
from analysis of pellet composition (Bourgeon et al. 2012).
We also investigated whether the trophic level measured in the eggs would correlate with
POP levels within the Faroese population in 2012. As in Leat et al (2011) we found no
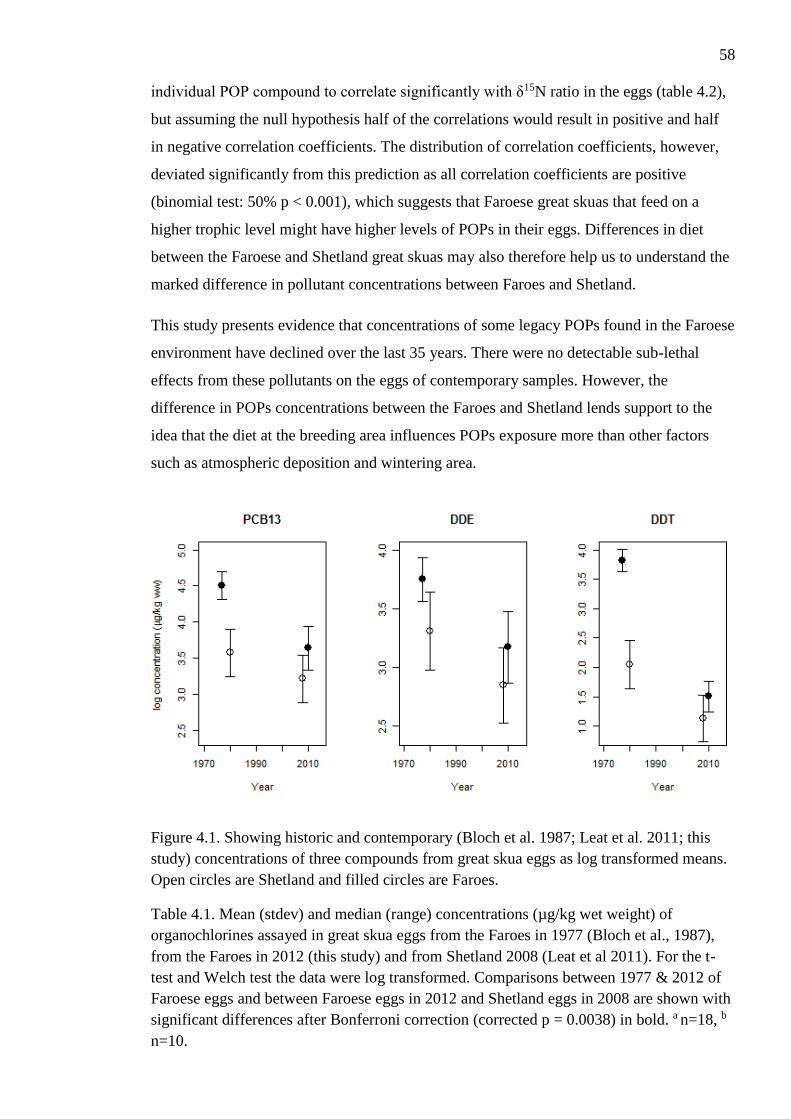
58
individual POP compound to correlate significantly with δ15N ratio in the eggs (table 4.2),
but assuming the null hypothesis half of the correlations would result in positive and half
in negative correlation coefficients. The distribution of correlation coefficients, however,
deviated significantly from this prediction as all correlation coefficients are positive
(binomial test: 50% p < 0.001), which suggests that Faroese great skuas that feed on a
higher trophic level might have higher levels of POPs in their eggs. Differences in diet
between the Faroese and Shetland great skuas may also therefore help us to understand the
marked difference in pollutant concentrations between Faroes and Shetland.
This study presents evidence that concentrations of some legacy POPs found in the Faroese
environment have declined over the last 35 years. There were no detectable sub-lethal
effects from these pollutants on the eggs of contemporary samples. However, the
difference in POPs concentrations between the Faroes and Shetland lends support to the
idea that the diet at the breeding area influences POPs exposure more than other factors
such as atmospheric deposition and wintering area.
Figure 4.1. Showing historic and contemporary (Bloch et al. 1987; Leat et al. 2011; this
study) concentrations of three compounds from great skua eggs as log transformed means.
Open circles are Shetland and filled circles are Faroes.
Table 4.1. Mean (stdev) and median (range) concentrations (µg/kg wet weight) of
organochlorines assayed in great skua eggs from the Faroes in 1977 (Bloch et al., 1987),
from the Faroes in 2012 (this study) and from Shetland 2008 (Leat et al 2011). For the t-
test and Welch test the data were log transformed. Comparisons between 1977 & 2012 of
Faroese eggs and between Faroese eggs in 2012 and Shetland eggs in 2008 are shown with
significant differences after Bonferroni correction (corrected p = 0.0038) in bold. a n=18, b
n=10.
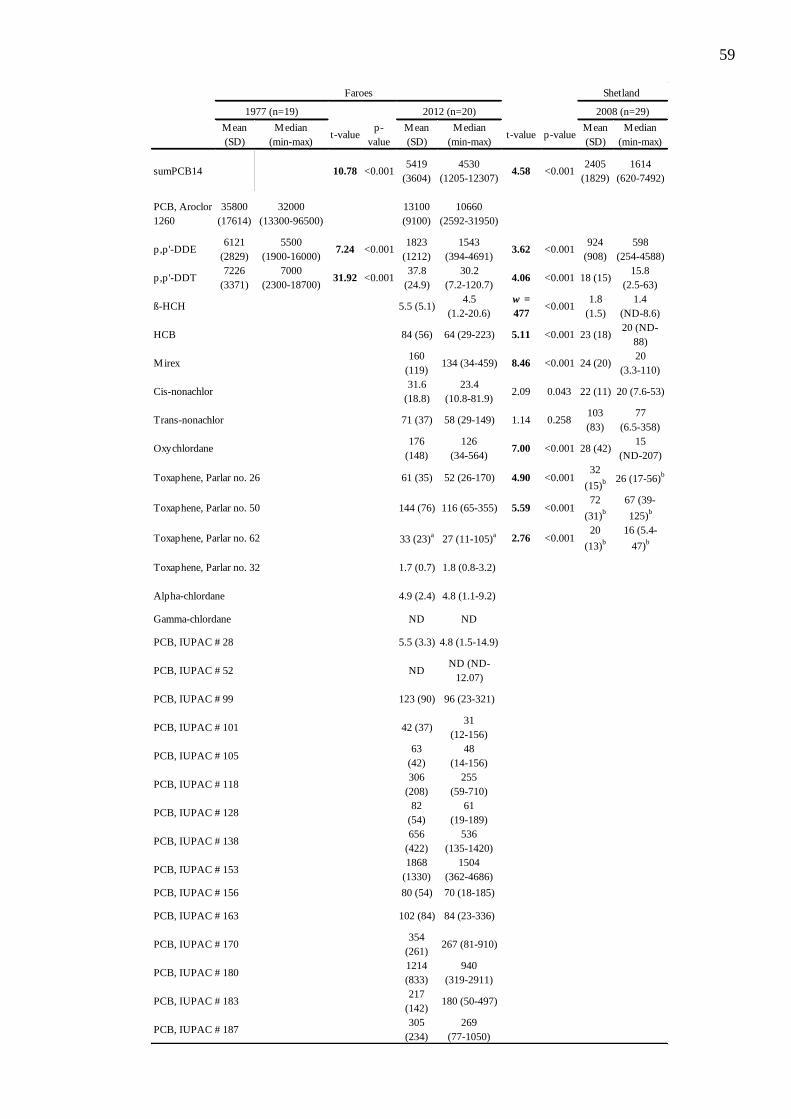
59
Mean
(SD)
Median
(min-max)t-value
p-
value
Mean
(SD)
Median
(min-max)t-value p-value
Mean
(SD)
Median
(min-max)
sumPCB14 10.78 <0.0015419
(3604)
4530
(1205-12307)4.58 <0.001
2405
(1829)
1614
(620-7492)
PCB, Aroclor
1260
35800
(17614)
32000
(13300-96500)
13100
(9100)
10660
(2592-31950)
p,p'-DDE6121
(2829)
5500
(1900-16000)7.24 <0.001
1823
(1212)
1543
(394-4691)3.62 <0.001
924
(908)
598
(254-4588)
p,p'-DDT7226
(3371)
7000
(2300-18700)31.92 <0.001
37.8
(24.9)
30.2
(7.2-120.7)4.06 <0.001 18 (15)
15.8
(2.5-63)
ß-HCH 5.5 (5.1)4.5
(1.2-20.6)
w =
477<0.001
1.8
(1.5)
1.4
(ND-8.6)
HCB 84 (56) 64 (29-223) 5.11 <0.001 23 (18)20 (ND-
88)
Mirex160
(119)134 (34-459) 8.46 <0.001 24 (20)
20
(3.3-110)
Cis-nonachlor31.6
(18.8)
23.4
(10.8-81.9)2.09 0.043 22 (11) 20 (7.6-53)
Trans-nonachlor 71 (37) 58 (29-149) 1.14 0.258103
(83)
77
(6.5-358)
Oxychlordane176
(148)
126
(34-564)7.00 <0.001 28 (42)
15
(ND-207)
Toxaphene, Parlar no. 26 61 (35) 52 (26-170) 4.90 <0.00132
(15)b 26 (17-56)
b
Toxaphene, Parlar no. 50 144 (76) 116 (65-355) 5.59 <0.00172
(31)b
67 (39-
125)b
Toxaphene, Parlar no. 62 33 (23)a
27 (11-105)a 2.76 <0.001
20
(13)b
16 (5.4-
47)b
Toxaphene, Parlar no. 32 1.7 (0.7) 1.8 (0.8-3.2)
Alpha-chlordane 4.9 (2.4) 4.8 (1.1-9.2)
Gamma-chlordane ND ND
PCB, IUPAC # 28 5.5 (3.3) 4.8 (1.5-14.9)
PCB, IUPAC # 52 NDND (ND-
12.07)
PCB, IUPAC # 99 123 (90) 96 (23-321)
PCB, IUPAC # 101 42 (37)31
(12-156)
PCB, IUPAC # 10563
(42)
48
(14-156)
PCB, IUPAC # 118306
(208)
255
(59-710)
PCB, IUPAC # 12882
(54)
61
(19-189)
PCB, IUPAC # 138656
(422)
536
(135-1420)
PCB, IUPAC # 1531868
(1330)
1504
(362-4686)
PCB, IUPAC # 156 80 (54) 70 (18-185)
PCB, IUPAC # 163 102 (84) 84 (23-336)
PCB, IUPAC # 170354
(261)267 (81-910)
PCB, IUPAC # 1801214
(833)
940
(319-2911)
PCB, IUPAC # 183217
(142)180 (50-497)
PCB, IUPAC # 187305
(234)
269
(77-1050)
2008 (n=29)
Shetland
2012 (n=20)
Faroes
1977 (n=19)
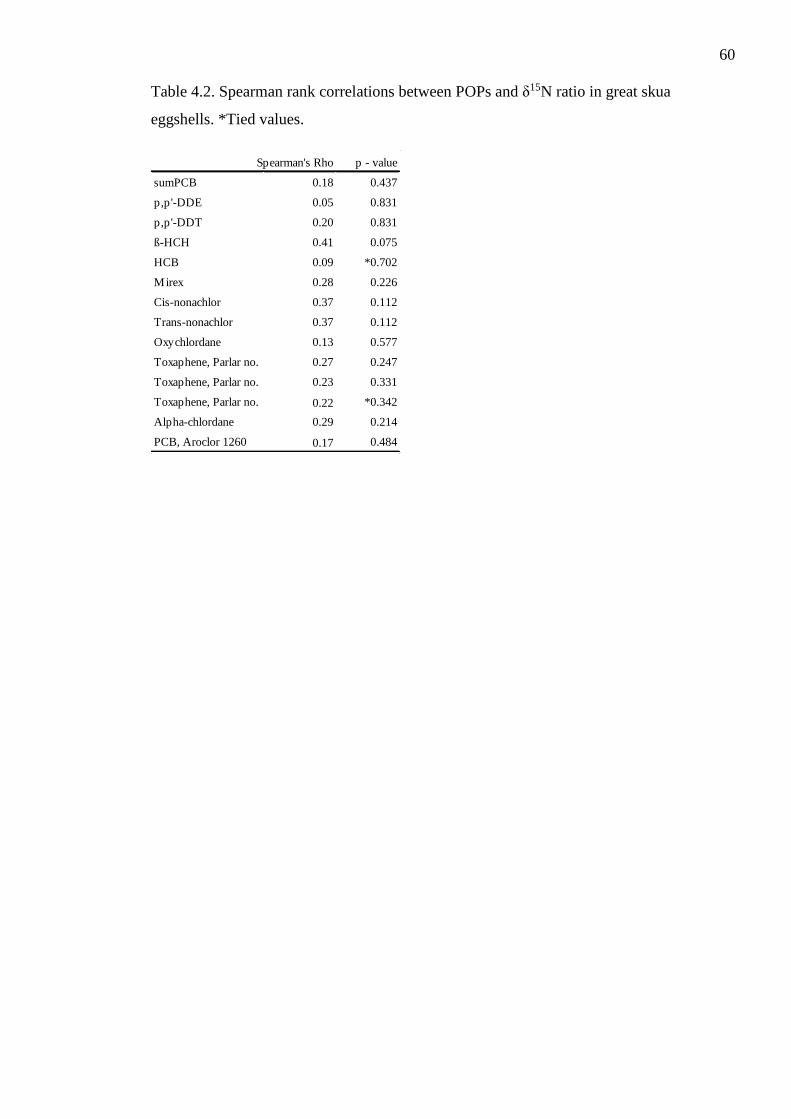
60
Table 4.2. Spearman rank correlations between POPs and δ15N ratio in great skua
eggshells. *Tied values.
Spearman's Rho p - value
sumPCB 0.18 0.437
p,p'-DDE 0.05 0.831
p,p'-DDT 0.20 0.831
ß-HCH 0.41 0.075
HCB 0.09 *0.702
Mirex 0.28 0.226
Cis-nonachlor 0.37 0.112
Trans-nonachlor 0.37 0.112
Oxychlordane 0.13 0.577
Toxaphene, Parlar no. 26 0.27 0.247
Toxaphene, Parlar no. 32 0.23 0.331
Toxaphene, Parlar no. 50 0.22 *0.342
Alpha-chlordane 0.29 0.214
PCB, Aroclor 1260 0.17 0.484
61
5. Plastic debris in great skua (Stercorarius skua) pellets
corresponds to seabird prey species
Abstract
Plastic is a common item in marine environments. Studies assessing seabird ingestion of
plastics have focused on species that ingest plastics mistaken for prey items. Few studies
have examined scavenger and predatory species that are likely to ingest plastics indirectly
through their prey items, such as the great skua (Stercorarius skua). We examined 1,034
regurgitated pellets from a great skua colony in the Faroe Islands for plastics and found
approximately 6% contained plastics. Pellets containing remains of Northern fulmars
(Fulmarus glacialis) had the highest prevalence of plastic. Our findings support previous
work showing that Northern fulmars have higher loads of plastics than other sympatric
species. This study demonstrates that marine plastic debris is transferred from surface
feeding seabird species to predatory great skuas. Examination of plastic ingestion in
species that do not ingest plastics directly can provide insights into how plastic particles
transfer vertically within the food web.
Introduction
Plastic pollution has been recognized as an emerging global environmental issue (UNEP,
2014). Plastic debris is ubiquitous in the marine environment, and has been found in both
highly populated regions, and remote areas of the world such as the Arctic (Obbard et al.,
2014; Vegter et al., 2014). Plastic particles have been regularly found to be ingested by
marine animals, and dozens of seabirds species have now been reported to have ingested
plastic pollution (Gregory, 2009; Laist, 1997). Seabirds have been shown to ingest both
macro- (pieces greater than 5 mm) and micro-plastics (pieces less than 5 mm), making this
group particularly susceptible to marine debris (Provencher et al., 2015; UNEP, 2011,
2014).
Marine plastic debris includes both industrial plastics and user plastics (Moore, 2007).
Industrial plastics are commonly found in the marine environment in the form of hard
plastic pellets (van Franeker et al., 2011). These pellets are formed as precursors to the
formation of consumer products. User plastics come from consumer products, including all
hard plastics (polyethylene) and styrofoam (polystyrene). Once in the environment plastic
pieces are broken down over time due to chemical and physical degradation.
62
Seabirds have been shown to be important for monitoring plastic pollution in the
environment (van Franeker et al., 2011). For example, Northern fulmars (Fulmarus
glacialis) (hereafter fulmar) are part of the North Sea ecological monitoring program
designed to track marine pollution (van Franeker et al., 2011). Ingestion of plastics by most
seabirds is thought to occur because they mistake plastic items for prey in the water
column (Cadee, 2002). There are differences in plastic ingestion between seabirds with
different foraging strategies which has been shown in several studies comparing ingestion
across seabird foraging guilds (Avery-Gomm et al., 2013; Provencher et al., 2014). To
date, much of the work on seabird ingestion of plastics has focused on species that are
thought to directly ingest plastics from the environment when mistaking plastics for prey
items (Avery-Gomm et al., 2013; Cadee, 2002; Donnelly-Greenan et al., 2014; van
Franeker et al., 2011). Less attention has been given to species that risk ingesting plastic
indirectly through their prey items (Furness, 1985; Ryan and Fraser, 1988). Species that
ingest plastics indirectly can play a role in expanding our understanding of marine plastics
pollution in the environment, specifically in tracking how plastics move through the
environment, and what species are affected by plastic pollution, both identified as priorities
for marine debris research (Vegter et al., 2014).
The great skua (Stercorarius skua), is a top predator seabird in the North Atlantic region. It
scavenges, kleptoparasitises or predates on other marine bird species (Furness, 1987;
Phillips et al., 1997), which potentially makes it a suitable model monitor of prevalence of
plastics quantitatively and qualitatively in different components of the food web. Seabirds
that forage at the surface of the water column, where plastic debris often floats, tend to
have higher burdens of ingested plastics than those that forage deeper in the water column
(Avery-Gomm et al., 2013; Bond et al., 2014; Provencher et al., 2014). Some species are
also more prone to accumulating ingested plastic depending on their capability to
regurgitate indigestible stomach content (Furness, 1985). Since plastic ingestion has been
found in several species of seabirds from the Faroe Islands (Faroes hereafter) (van
Franeker et al., 2011, Jensen, 2012; Provencher et al., 2014), we expected great skuas in
the region to show evidence of plastic ingestion, but we expect the prevalence and number
of plastics pieces to vary in respect of the type of prey species the great skuas have
consumed. The diet of Faroese great skuas includes fish, seabirds, and sometimes also
terrestrial birds and mammals (Hammer, unpub. data). The main seabird species they feed
on are black-legged kittiwakes (Rissa tridactyla) (hereafter kittiwake), Atlantic puffins
(Fratercula arctica) (hereafter puffin), and fulmars. In addition to these seabird prey
species, great skuas scavenge fish from behind fishing vessels or steal fish from other birds
63
near the colony (Bayes et al., 1964; Hammer unpub. data). More rarely Faroese great skuas
also feed on common guillemots (Uria aalge), mountain hares (Lepus timidus), Manx
shearwater (Puffinus puffinus), and eggs from various birds (Bayes et al., 1964; Hammer
unpub. data).
The aim of this study is to assess prevalence of plastic ingestion in Faroese great skuas
based on sampling pellets, a common method of assessing great skua diet. Pellets contain
indigestible material such as feathers, bones, hair and plastic (Furness, 1987). Due to the
described foraging strategies of great skuas, it is likely that most ingested plastics from
these birds come from the marine environment (Ryan and Fraser, 1988). First, we examine
the prevalence of plastic debris in the population and whether it depends on the number of
pellets sampled per territory. Second, we compare plastic debris between pellets containing
different prey types, and discuss how our estimates of prevalence in seabird species that
skuas prey on compares to other reported values for those same species collected through
direct sampling of the birds. This allows assessing if sampling through this indirect method
yields similar quantitative results to direct dissection methods.
Method
1,034 regurgitated pellets from 165 great skua territories were collected during the
breeding season April-August 2013, at Skúvoy in the Faroes (61°46'N 6°49'W). Pellets
were collected during territory visits, which occurred 2-3 times a week after first apparent
sign of territory attendance. The median number of pellets found in each territory per visit
was 1 and the highest number of pellets found in a territory during one visit was 36.
Considering how ardently great skuas defend their breeding territories (Furness, 1987), it is
reasonable to assume that the regurgitated pellets found within a great skua colony are
produced only by the great skua pairs within each territory. All pellets were collected and
examined in the field to determine prey type. The prey type was recorded for all pellets and
if plastic material was found, the pellets were individually bagged to prevent mixing of
contents between pellets. If there was no plastic found in the pellet they were collected in a
separate bag. While the content of some pellets were distinguishable to species level by
size and colour of feathers and odour (e.g. fulmar and kittiwake), other pellets could not
readily be identified to species level such as puffin, common guillemot, black guillemot
(Cepphus grylle), and razorbill (Alca torda), but could still be distinguished from other
seabirds as auks. These species were thus grouped as “auks” in this study. Other pellets
which contained fish or mountain hare were also identified. 46 pellets contained more than
one type of prey, and 27 (3.3%) of these contained a mixture of bird and fish and were
64
excluded from all analyses. The remaining mixed pellets (n=12) contained a mixture of
different bird prey (with 6 containing plastic). The mixed bird pellets were included in the
general comparison between (bird, fish and other) types of pellets only, but were excluded
from the comparison between different bird types.
All plastic particles from the pellets were collected, dried, sorted, and processed. Plastic
particles were sorted using the ‘Save the North Sea’ protocol (van Franeker et al., 2011)
into fragments, threadlike, sheetlike, foamed, industrial and other and weighed. Mean
values of plastic weight are reported for the entire sample of pellets including pellets with
no plastic (mass abundance) and only for the pellets which contained plastic (mass
intensity). The colour of each piece was also noted and recorded by a single observer. The
prevalence (presence or absence) and abundance (number of pieces per pellet) of plastics
in each pellet collected is presented, along with the prevalence and abundance of plastics in
each pair’s territory.
Statistical analyses were carried out in program R (R Core Development Team, 2014).
First we looked whether the prevalence of plastics in a territory was related to search effort
(measured in number of pellets collected per territory) to determine if number of collected
pellets influenced the detection of plastic pollution using a generalised linear model (GLM)
with a binomial distribution. The number of plastic pieces in the pellets was compared
between pellets with different prey types using a Generalized Linear Mixed Effects Model
(lme4 Bates et al. 2014) with a binomial distribution, logit link function and territory as
random effect to account for the non-independence of pellets collected from the same
individual birds. Number of plastic pieces per pellet were compared across pellets
containing different bird prey species only (fulmars, kittiwakes and auks). The data contain
a low number of non-zero values. The general mixed model assuming zero-inflation
(glmmADMB Skaug et al. 2013), and a negative binomial distribution, showed no
evidence for zero-inflation (estimated zero-inflation proportion = 0.00002), thus zero-
inflation was no longer considered for further analyses as it is unnecessary and difficult
given the size of the dataset. Among error distributions that could be suitable to fit the
observed distribution of our data (negative binomial and Poisson lognormal), the negative
binomial error distribution had the better fit to our data structure, because the negative
binomial distribution better justified the assumption of homoscedasticity of the Pearson
residuals. However, currently available models that allow the use of a negative binomial
distribution don’t support the inclusion of a random effect. To examine the importance of
territory as random effect, which, if not important, could potentially lead to an overfitted
65
model, we fitted a mixed model with an alternative error distribution (poisson log
distribution) with territory as a random effect. The variance estimate for the random effect
was zero (glmmADMB). It would be therefore justified for our data to exclude territory as
a random effect without compromising the conclusion from a model without random
effect. Hence we used the mixed model with negative binomial (glmmADMB) to compare
number of plastic items per pellet between pellets containing remains of the three seabird
prey remains (fulmar, kittiwake, auk).Statistical tests where p < 0.05 were considered
statistically significant. Means are presented with standard deviations.
Results
On the 165 study territories, between 1 and 63 pellets were collected per territory (median
= 4) over the breeding season and the number of pellets found during a single visit ranged
from 0-32 pellets per territory. Pellets containing at least one piece of plastic (Fig 5.1) were
found on 48 territories (30%). The prevalence of plastics in a territory did not significantly
vary with the number of collected pellets per territory (GLM, Z = 0.97; p = 0.33). From the
total of 1,034 pellets, 59 individual pellets (6 %) contained plastic debris with a total of
179 plastic pieces ranging from 1-15 pieces (median of 2 pieces) per pellet. The plastic
pieces found in the pellets were both from consumer and industrial sources. The most
common plastic type found was hard fragments of user plastics (Table 5.2, Fig 5.1a).
Although many colours of plastics were found, the most common colour of plastic found in
the pellets was white/yellow (68%). Red plastic was the next most common colour found
in the pellets (10%), followed by pink (5%), orange (4%), black (3%), green (2%) and blue
(2%). The final 6% of the plastics were made up of other colours.
The proportion of pellets containing plastic pieces (prevalence) varied between pellets
containing the remains of different prey species (GLMM with binomial error and territory
as random factor (lme4, Bates et al. 2014): F837 = 3.78, df = 6; p < 0.001) (Table 5.1). 86%
of the pellets containing plastics were from bird prey, 7% from fish, 5% from mixed bird
and fish and 2% from mountain hare. Where identification of bird prey type was possible
we found that pellets containing the remains of fulmars had significantly higher prevalence
of plastics (GLMM with binomial error and territory as random factor: Z = 2.79 p = 0.005),
than pellets containing auks (GLMM Z = 7.57 p < 0.001).
The number of plastic items found per pellet also differed between seabird prey species.
Pellets with fulmar remains contained the highest numbers of plastics (range 1-15),
kittiwake pellets had 1-9 and auk pellets had 1-3. The pellets with fulmar remains
66
contained 0.37 (95% CI = 0.17-0.62) plastic pieces which was significantly higher than for
pellets with auks (mean of 0.08 pieces (95% CI = 0.04-0.16) for auks, GLM with negative
binomial error Z = 3.59, p < 0.001).
The total plastic pieces per pellet weighed on average 6.6 (SD=5.97) mg (n=1,034 pellets
including pellets with no plastic, mass abundance). The mean mass of the plastic in great
skua pellets which contained plastic (mass intensity) was 116.5 (SD=225.0) mg per pellet
(n=59). On average mass abundance, fulmar pellets contained 15.9 (SD=54.6) mg of
plastic debris (n = 173), kittiwake pellets contained 2.2 (SD=15.9) mg of plastics (n = 293)
and pellets containing auks remains had on average 5.2 (SD=28.9) mg of plastics (n =
151). Pellets containing fulmar remains did not have a significantly higher mass intensity
of plastics as compared with other types of pellets (GLMM with territory as random effect
Z = 0.916; p = 0.916), but pellets containing auk prey remains had significantly lower mass
intensity compared to other types of pellets (GLMM Z = 2.29 p = 0.022).
Discussion
Less than a third (29%) of the great skua territories showed evidence of plastic ingestion,
suggesting that a minority of great skuas at the Skúvoy breeding colony are exposed to
plastics during the breeding season. This was not simply due to small number of pellets
picked up in some territories as prevalence of plastic in a pair’s diet was independent of the
number of pellets collected. Only a small proportion of regurgitated pellets examined
contained plastics (6%). Both user and industrial plastics were found in skua pellets.
Among user plastics we found hard, threadlike, foamed and sheetlike plastics illustrating
that great skuas are susceptible to multiple types of plastic pollution. Our findings suggest
that plastic ingestion does occur among great skuas in the Faroes, but prevalence and
number of plastic pieces ingested is low compared to other species in the North Atlantic
and the North Sea (Provencher et al., 2014; van Franeker et al., 2011).
We found that the most common colour of plastic pieces in great skua pellets was
white/yellow. Without knowledge of the background availability of plastics in the
environment it cannot be determined if this shows a preference for debris colour among
certain seabird species which the great skua preys on, or simply a sampling of the plastics
available to the seabirds in the area. Future plastics work around the Faroes should
combine at sea surveys of plastics (e.g. Desforges et al., 2014); with seabird assessments to
67
determine if different seabirds selectively ingest different types and colours of plastics
from the environment.
The number and weight of plastic particles found in pellets of great skuas from the Faroes
was also relatively low. It should, however, be noted that individual dietary specialisation,
which is commonly seen among great skuas (Votier et al., 2004), could potentially result in
a low number of pairs taking up a disproportionally high amount of plastic-rich prey. For
example, out of the 48 territories where pellets with plastic were found in this study, 12
territories had pellets with plastic on consecutive territory visits. Unlike petrels which
accumulate plastic in the gizzard, due to their gizzard being separated from the
proventriculus by a sphincter, skuas have an anatomy that allows them to regurgitate both
gizzard and proventriculus contents (Furness, 1985). Although this would suggest that
plastic does not likely accumulate in great skua stomachs (Furness, 1985), we should
consider the implications for great skuas specialising as seabird specialists which may
carry high loads of plastics could result in a chronic exposure to marine debris. Perhaps
more importantly such chronic plastic ingestion could lead to increased exposure to
persistent organic pollutants which are found in and on marine plastics (Hirari et al., 2011).
More work is needed to assess the relationship between the high levels of persistent
organic pollutants and plastics in Faroese great skuas (Teuten et al., 2009).
Plastic debris burden was found to be associated with prey species that are known to ingest
plastics (e.g. fulmars; Jensen, 2012). Similarly, plastic debris was less in pellets that
contained seabird species known to ingest low levels of plastics, for example puffins where
stomach examination of these birds around the Faroes showed only 1-5% to contain
plastic (Bergur Olsen, pers. comm.). Similarly, a recent examination of 14 adult kittiwake
stomachs found 1 plastic thread, in each of two stomachs (Jens-Kjeld Jensen, pers. comm.).
This difference in plastic debris load between species has also been found on a wider
spatial scale (e.g. auks; Bergur Olsen, pers. comm.; Provencher et al., 2014). The
association between plastics and prey type indicates that great skuas are taking in plastics
with their seabird prey meals. Although great skuas may also ingest debris directly when
scavenging, these results suggest that most of the plastic ingestion by great skuas is related
to their seabird prey. Alternatively, if great skuas were ingesting plastics from other
sources frequently, little difference would be expected in the plastics associated with the
prey type; note that we found low levels of ingested plastic in pellets containing fish
remains.
68
Our findings suggest that marine plastic pollution is being transferred up the food chain to
top level predators in the North Atlantic that are likely ingesting most plastics indirectly
through their prey items. Importantly, we show that plastic pollution is transferred to great
skuas mainly through fulmars, although these seabirds are not the main proportion of the
skua diet (Table 5.1). This suggests that plastic pollution may be transferred up the food
chain disproportionately when prey species differ in propensity to accumulate marine
debris. Additionally, these plastic particles are regurgitated on land and the fate and further
implications for the terrestrial ecosystem remains unclear.
In the Faroes 91% of fulmar stomachs examined (n = 699) contained ingested plastics (Jan
van Franker pers. comm.). While it is recognised that each fulmar ingested by a great skua
produces approximately 4-5 pellets (Votier et al., 2001), and several great skuas may share
a fulmar carcass as food at sea, the prevalence of plastic assessed directly in fulmar
stomachs is much higher than we demonstrate for fulmar pellets in this study (13.4%). This
suggests that great skua pellets may not be a reliable tool for quantitative assessment of
plastic of their various prey species. Ryan and Fraser (1988) showed similar findings for
the south polar skua (Stercorarius maccormicki), and suggested that smaller plastic pieces
are not likely incorporated into pellets but pass through to the faeces, or are small enough
to be lost from the pellets before collection. Votier et al. (2001) showed that proportion of
auks consumed are underrepresented in great skua pellet production than larger gulls and
fulmars. Considering this difference in turn-over rate between prey species it could perhaps
suggest that there is more plastic in auks than we would expect, but this contradicts
stomach analysis of Faroese puffins, which suggest that only 1-5% of puffins have plastic
(Bergur Olsen, pers. comm.). Although overall trends of plastics ingestion in marine birds
is found by examining skua pellets, the absolute amount of plastic ingestion is not
quantitatively reflected in pellets.
One pellet containing mountain hare remains also contained plastics. As hares are
herbivores that graze on low lying vegetation, the plastics associated with hare pellets are
therefore unlikely to have come from hares. Thus, ingested plastics in great skuas may not
be completely regurgitated with each meal, and may actually be retained over some period
and regurgitated with future meals. It has been suggested that for instance fulmarine petrels
excrete ca. 75% of plastic particles within a month ingestion (van Franeker and Law, 2015;
but see Ryan, 2015). This may suggest that although great skuas may regurgitate plastics
associated with their meals, plastic debris may remain within the digestive tract of great
skuas beyond the meal and regurgitation, and the difference in plastic prevalence between
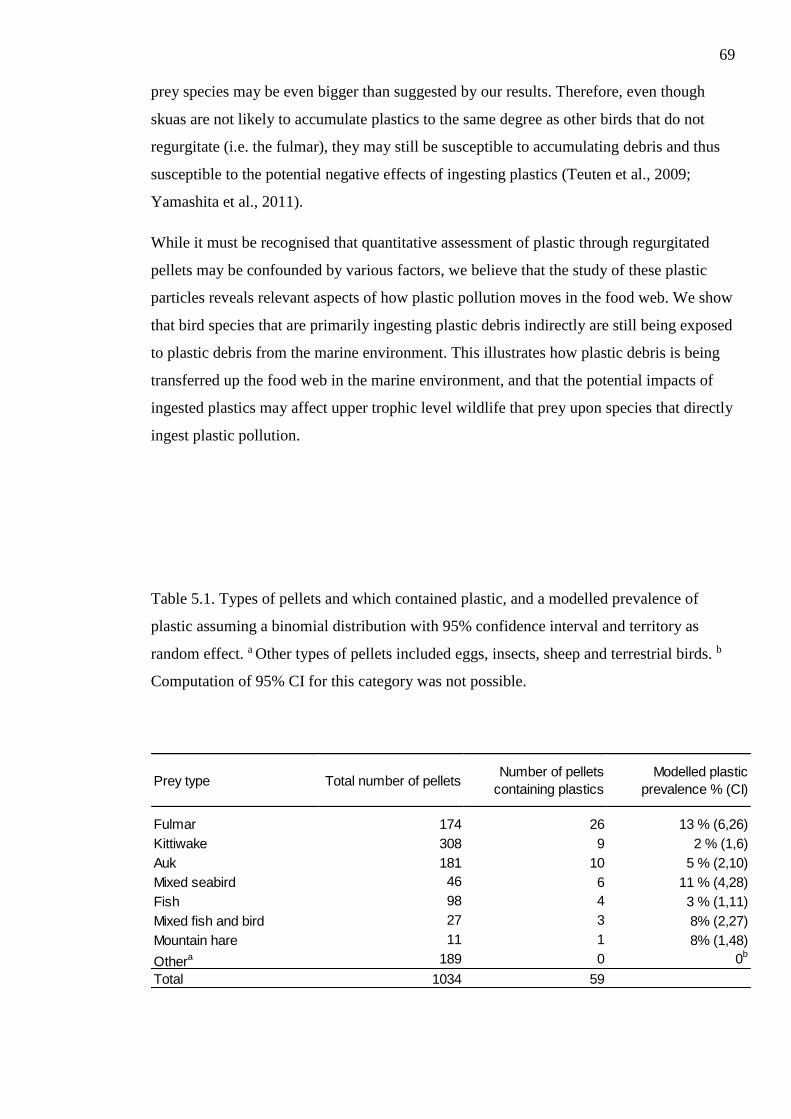
69
prey species may be even bigger than suggested by our results. Therefore, even though
skuas are not likely to accumulate plastics to the same degree as other birds that do not
regurgitate (i.e. the fulmar), they may still be susceptible to accumulating debris and thus
susceptible to the potential negative effects of ingesting plastics (Teuten et al., 2009;
Yamashita et al., 2011).
While it must be recognised that quantitative assessment of plastic through regurgitated
pellets may be confounded by various factors, we believe that the study of these plastic
particles reveals relevant aspects of how plastic pollution moves in the food web. We show
that bird species that are primarily ingesting plastic debris indirectly are still being exposed
to plastic debris from the marine environment. This illustrates how plastic debris is being
transferred up the food web in the marine environment, and that the potential impacts of
ingested plastics may affect upper trophic level wildlife that prey upon species that directly
ingest plastic pollution.
Table 5.1. Types of pellets and which contained plastic, and a modelled prevalence of
plastic assuming a binomial distribution with 95% confidence interval and territory as
random effect. a Other types of pellets included eggs, insects, sheep and terrestrial birds. b
Computation of 95% CI for this category was not possible.
Prey type Total number of pelletsNumber of pellets
containing plastics
Modelled plastic
prevalence % (CI)
Fulmar 174 26 13 % (6,26)
Kittiwake 308 9 2 % (1,6)
Auk 181 10 5 % (2,10)
Mixed seabird 46 6 11 % (4,28)
Fish 98 4 3 % (1,11)
Mixed fish and bird 27 3 8% (2,27)
Mountain hare 11 1 8% (1,48)
Othera 189 0 0b
Total 1034 59
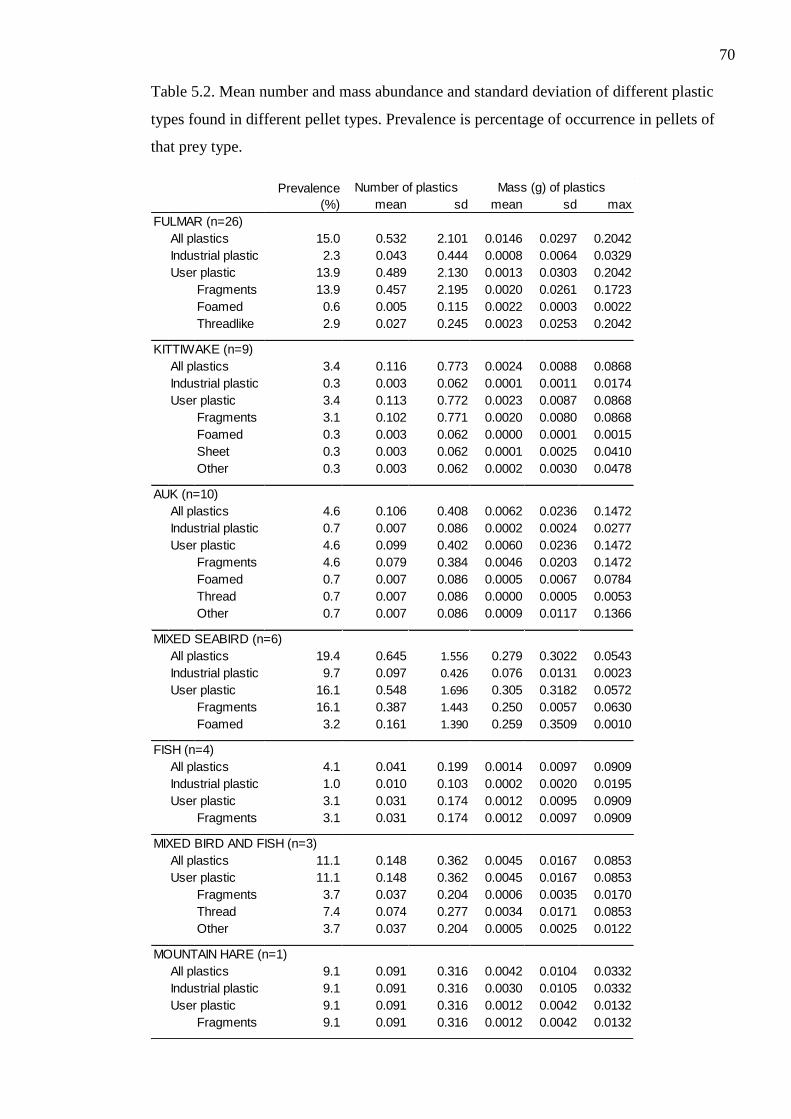
70
Table 5.2. Mean number and mass abundance and standard deviation of different plastic
types found in different pellet types. Prevalence is percentage of occurrence in pellets of
that prey type.
mean sd mean sd max
FULMAR (n=26)
All plastics 15.0 0.532 2.101 0.0146 0.0297 0.2042
Industrial plastic 2.3 0.043 0.444 0.0008 0.0064 0.0329
User plastic 13.9 0.489 2.130 0.0013 0.0303 0.2042
Fragments 13.9 0.457 2.195 0.0020 0.0261 0.1723
Foamed 0.6 0.005 0.115 0.0022 0.0003 0.0022
Threadlike 2.9 0.027 0.245 0.0023 0.0253 0.2042
KITTIWAKE (n=9)
All plastics 3.4 0.116 0.773 0.0024 0.0088 0.0868
Industrial plastic 0.3 0.003 0.062 0.0001 0.0011 0.0174
User plastic 3.4 0.113 0.772 0.0023 0.0087 0.0868
Fragments 3.1 0.102 0.771 0.0020 0.0080 0.0868
Foamed 0.3 0.003 0.062 0.0000 0.0001 0.0015
Sheet 0.3 0.003 0.062 0.0001 0.0025 0.0410
Other 0.3 0.003 0.062 0.0002 0.0030 0.0478
AUK (n=10)
All plastics 4.6 0.106 0.408 0.0062 0.0236 0.1472
Industrial plastic 0.7 0.007 0.086 0.0002 0.0024 0.0277
User plastic 4.6 0.099 0.402 0.0060 0.0236 0.1472
Fragments 4.6 0.079 0.384 0.0046 0.0203 0.1472
Foamed 0.7 0.007 0.086 0.0005 0.0067 0.0784
Thread 0.7 0.007 0.086 0.0000 0.0005 0.0053
Other 0.7 0.007 0.086 0.0009 0.0117 0.1366
MIXED SEABIRD (n=6)
All plastics 19.4 0.645 1.556 0.279 0.3022 0.0543
Industrial plastic 9.7 0.097 0.426 0.076 0.0131 0.0023
User plastic 16.1 0.548 1.696 0.305 0.3182 0.0572
Fragments 16.1 0.387 1.443 0.250 0.0057 0.0630
Foamed 3.2 0.161 1.390 0.259 0.3509 0.0010
FISH (n=4)
All plastics 4.1 0.041 0.199 0.0014 0.0097 0.0909
Industrial plastic 1.0 0.010 0.103 0.0002 0.0020 0.0195
User plastic 3.1 0.031 0.174 0.0012 0.0095 0.0909
Fragments 3.1 0.031 0.174 0.0012 0.0097 0.0909
MIXED BIRD AND FISH (n=3)
All plastics 11.1 0.148 0.362 0.0045 0.0167 0.0853
User plastic 11.1 0.148 0.362 0.0045 0.0167 0.0853
Fragments 3.7 0.037 0.204 0.0006 0.0035 0.0170
Thread 7.4 0.074 0.277 0.0034 0.0171 0.0853
Other 3.7 0.037 0.204 0.0005 0.0025 0.0122
MOUNTAIN HARE (n=1)
All plastics 9.1 0.091 0.316 0.0042 0.0104 0.0332
Industrial plastic 9.1 0.091 0.316 0.0030 0.0105 0.0332
User plastic 9.1 0.091 0.316 0.0012 0.0042 0.0132
Fragments 9.1 0.091 0.316 0.0012 0.0042 0.0132
Number of plastics Mass (g) of plasticsPrevalence
(%)
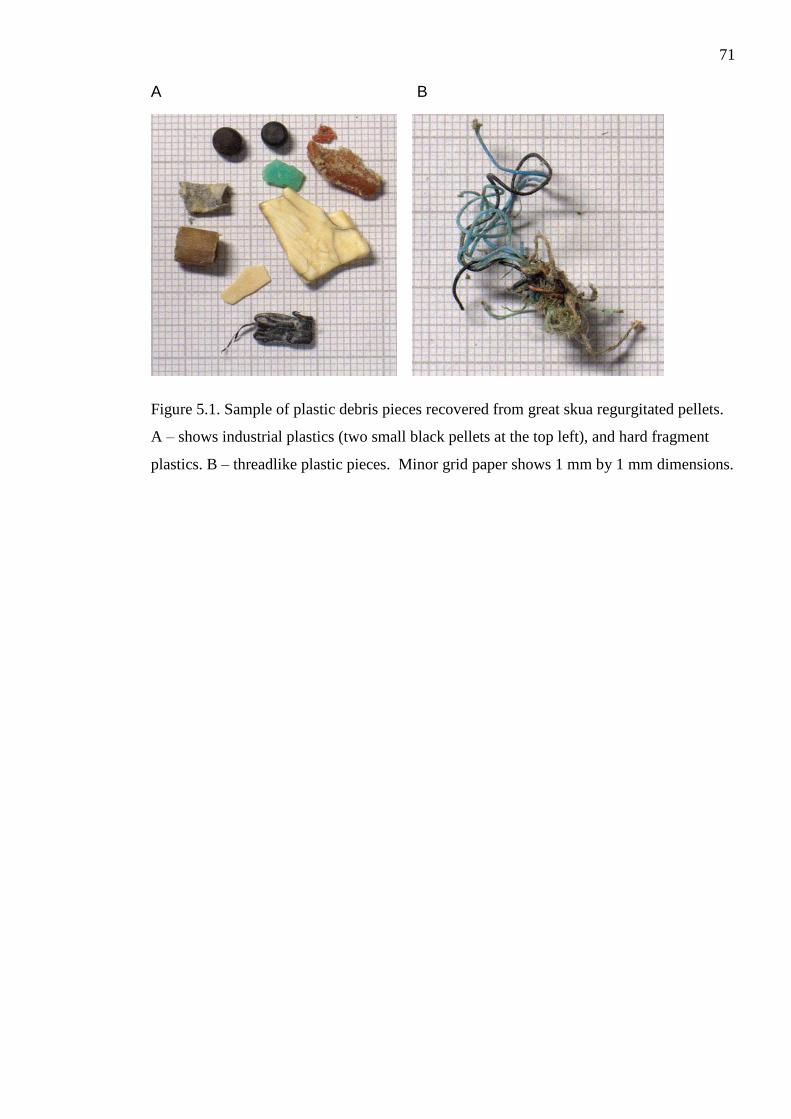
71
A B
Figure 5.1. Sample of plastic debris pieces recovered from great skua regurgitated pellets.
A – shows industrial plastics (two small black pellets at the top left), and hard fragment
plastics. B – threadlike plastic pieces. Minor grid paper shows 1 mm by 1 mm dimensions.
72
6. General discussion
No detailed analysis has been undertaken of great skua breeding biology and diet in the
Faroes for over 50 years. This study has in that regard provided some long overdue
ecological information of a population which counts approximately 3.5-5% of the global
population of great skuas. There are several new questions that can be tackled due to this
gained insight, because despite the Faroes being relatively close to Shetland, the ecology of
the great skuas of these two regions evidently differ quite markedly. The study of
regurgitated pellets on Skúvoy found that a great majority of pellets were of seabirds or
their eggs (84%). This makes this population ecologically quite distinct compared to the
Shetland population, and allows us to test certain predictions in relation to bioaccumulative
POPs (chapter 4). In comparison to Shetland, the Faroese great skuas feed on higher
trophic scale, and this results in higher rates of bioaccumulation.
Individual dietary specialisation has been described in many seabirds including great skuas
in Shetland (Votier et al. 2004), and this specialisation could be foreseen to explain a
difference in pollutant exposure (both POPs and plastics) and in breeding performance
(egg sizes, laying date etc). However, the diet of Faroese we did not find a significant
relationship between occurrence of bird pellets (bird specialisation) and egg size, but we
did find that bird specialist pairs had significantly earlier laying dates. Considering
historical work, if food availability or diet can be the cause of this decline in great skua egg
sizes, we would expect to find a relationship between individual (pair) diets and their egg
sizes. The study of the diet of great skuas on Skúvoy over two consecutive seasons in the
Faroes has shown that although many pairs can be described as bird specialists, they did
not lay significantly larger eggs. Other studies have however shown this (Votier et al.
2004). The feeding experiment was undertaken with this in mind, and my prediction was
that a supplementary food prior to egg laying would result in larger eggs. This was not
observed, but I found that supplementary feeding significantly decreased the egg size
dimorphism. This would suggest that either the second laid egg which usually is slightly
smaller, benefits from the supplementary feeding, or the feeding stimulates a response in
the females egg investment. This would certainly warrant further study. If it is the case that
the second laid egg is smaller due to energetic depletion, then this would suggest that the
second laid egg was a better measure of female quality, and would also possibly have
implications on the use of eggs for biomonitoring of pollutants.
In chapter 3 I investigated the spatial and temporal variation in great skua eggs. While the
spatial variation generally adheres to Bergmann’s rule, there are Reproductive investment
73
can be understood as a compromise between fixed and flexible factors. The fundamental
premise of monitoring breeding ecology is that some factors are flexible and may be
influenced by a combination of intrinsic and extrinsic factors. The main focus of this study
has been to expand our understanding of ecological variables which may or may not
influence the egg production of great skuas. Great skua eggs vary highly in size 84 cm3 –
151 cm3 (1.82 ratio smallest:largest). This variability is large also in comparison to other
birds (Christians 2002), which should provide a promising prospect in understanding the
mechanisms which underlie egg sizes and shapes. This allows for study of some of the
potential causes of these individual variations. Food availability have been hypothesised to
cause an overall decline in egg sizes of puffins and glaucous gulls. Great skua eggs have
also been found to be smaller now than a few decades previously, and I have found this
trend to be consistent both in the Faroes and Shetland.
Both these populations may be under some dietary constraint – in Shetland due to decline
in fisheries and reduction of bycatch discarding, and in the Faroes through the decline of
their typical prey species, kittiwake, puffin, guillemot and perhaps also fulmar. We did also
supplementary feed some pairs, but were not able to detect significant difference in any
breeding parameter. Stable isotope analysis of chick down feathers did however
successfully detect a distinct carbon profile of the pairs which had successfully fed on the
supplementary food. With a relatively low protein content, it is possible that the food was
simply not of a high enough quality to influence the egg sizes.
Stable isotope analysis did also provide an opportunity to investigate post-moult wintering
areas. Considering the importance of trophic level pollutant exposure of great skuas, it
should become a particular priority to disentangle the relationships between wintering area
and breeding the following season. Stable isotopes which have been analysed for this
study, have indicated that great skuas from the Faroes winter in 2 or 3 different areas.
Investigating the impact of these on pollutant uptake, fitness and carryover effects upon
breeding would be an avenue worth pursuing.
The relatively higher trophic level of Faroese great skuas is also the most likely
explanation of the difference found in POPs concentrations between these two regions
(Chapter 5). But this study also found a significant temporal reduction in POPs
concentrations compared to samples from the 1970s. The comparison of nitrogen isotope
values of this study with published values in another study can be contentious, as the lack
of a baseline value makes the data uncomparable. However the POPs concentrations are
74
also significantly higher, which is also consistent with the Faroese great skuas feeding on a
higher trophic level.
Their high trophic level, yet opportunistic lifestyle means that great skuas predate on a
variety of seabirds in the Faroes, and wider region. This would also provide a future
testable hypothesis that great skuas in the Faroes are likely to consume more plastic than
great skuas in Shetland for example, even though the occurrence of plastic is higher around
the North Sea than around the Faroes (van Franeker et al. 2011). It can at least be inferred
that the rate of plastic consumption is lower in Shetland great skuas since plastic in pellets
has so far not been observed to the extent that it has been noted, despite extensive
fieldwork done in Shetland over the past 3 decades. This suggests that diet can potentially
result in differences in pollutant uptake and will get deposited into their eggs. With an
estimated number of plastic in the world’s oceans numbering between 15 and 51 trillion
particles (van Sebille et al. 2015), and especially with a projected “plastic gyre” in the
Barents sea (Cózar et al. 2017), great skuas will be uniquely well suited species to monitor
– assuming that they prey on other seabirds. Chapter 5 lays the foundation for great skuas
to be a top predator monitoring species for seabird ingested plastic in the Northeast
Atlantic, and this area of research could benefit greatly with a more extensive geographic
comparison of regurgitated pellets from across the breeding range of the great skuas.
As top predators in the Faroese ecosystem, great skuas continue to be relevant for
biomonitoring. Future work should emphasise the influence of wintering areas upon
pollutant exposure, and the rise of emergent pollutants such as Bisphenol, pharmaceuticals,
perfluorinated compounds. To understand emission and transport of marine plastic among
seabirds, great skuas pellets from throughout their breeding distribution will be
investigated in the future. Although no indications of acute toxicity such as eggshell
thinning were detected in our study, other studies have shown that a combined effect of
high pollutant load and low food availability can have a negative influence on reproductive
success.
While low reproductive success at some of the largest great skua colonies in Shetland is
the most likely cause of population declines of great skuas, persecution is currently the
most likely driver of population change in the Faroes. The Faroese great skua population is
historically high, and this has over the past years also resulted in an increase in great skua
culling. The perception of the great skua as a threat to sheep and seabirds persists. Future
research focus on the positive aspects of great skuas such as soil enrichment could
potentially alleviate some of the negative sentiment towards them. A growing interest in
75
the Faroes as a tourist destination, could potentially also be beneficial to public perception
of them. Public awareness of the ecological importance of predators and scavengers in
general would probably benefit the conservation of great skuas, arctic skuas, corvids and
gulls in the Faroes.
In conclusion, although this thesis has advanced our understanding of the great skua diet
and how the diet influences their pollutant load, there remains great uncertainty with
regards to explanatory factors behind the temporal variation in great skua egg sizes. The
supplementary feeding experiment did not significantly influence the egg sizes, however it
did reduce the egg dimorphism. I am in this study unable to disentangle if this reduction in
egg size dimorphism was due to the nutritional quality of the supplementary food, or the
act of feeding the female may have manipulated its egg investment. This, in my view is the
most compelling indication that there remain unexplained variables determining egg sizes,
and that this question should be tackled with future experiments or field studies. While the
use of great skuas and their eggs as biomonitors of marine pollution is well established,
this study illustrates the importance of considering potential dietary variation on a
relatively limited spatially scale. Gaining further understanding of the type of plastic which
is consumed by great skua prey, could be developed into a very cost:effective way of
monitoring multiple species in the Northeast Atlantic, and is certainly an avenue worth
pursuing.
76
7. References
Anderson, O.R.J., Phillips, R.A., McDonald, R., Shore, R.F., Mcgill, R.A.R., &
Bearhop, S. 2009. Influence of trophic position and foraging range on mercury levels
within a seabird community. Marine Ecology Progress Series 375: 277–288.
Annett, C.A., & Pierotti, R. 1999. Long-term reproductive output in Western gulls:
consequences of alternate tactics in diet choice. Ecology 80: 288–297.
Araújo, M.S., Bolnick, D.I., & Layman, C.A. 2011. The ecological causes of individual
specialisation. Ecology Letters 14: 948–958.
Ashmole, N.P. 1963. The regulation of numbers of tropical oceanic birds. Ibis 103b: 458–
473.
Ashton, K.G. 2002. Patterns of within-species body size variation of birds: strong
evidence for Bergmann’s rule. Global Ecology and Biogeography 11: 505–523.
Badyaev, A. V. 2002. Growing apart: an ontogenetic perspective on the evolution of
sexual size dimorphism. Trends in Ecology & Evolution 17: 369–378.
Bairlein, F. 2003. Large-scale networks in bird research in Europe: pitfalls and prospects..
Avian Science 3: 49–63.
Barrett, R.T., Nilsen, E., & Anker-Nilssen, T. 2012. Long-term decline in egg size of
Atlantic puffins Fratercula arctica is related to changes in forage fish stocks and
climate conditions. Marine Ecology Progress Series 457: 1–10.
Bates, D., Mächler, M., Bolker, B., & Walker, S. 2014. Fitting Linear Mixed-Effects
Models using lme4. Journal of Statistical Software.
Bates, D., Mächler, M., Bolker, B., & Walker, S. 2015a. Fitting Linear Mixed-Effects
Models Using lme4. Journal of Statistical Software 67.
Bates, D., Maechler, M., Bolker, B., & Walker, S. 2015b. lme4: Linear mixed-effects
models using Eigen and S4.
Bayes, J.C., Dawson, M.J., & Potts, G.R. 1964. The food and feeding behaviour of the
Great Skua in the Faroes. Bird Study 11: 272–279.
Bearhop, S., Phillips, R.A., Thompson, D.R., Waldron, S., & Furness, R.W. 2000.
Variability in mercury concentrations of great skuas Catharacta skua: the influence of
colony, diet and trophic status inferred from stable isotope signature. Marine Ecology
Progress Series: 261–268.
Becker, P.H., Munoz Cifuentes, J., Behrends, B., & Schmieder, K. 2001. Contaminants
in bird eggs in the Wadden Sea. Temporal and spatial trends 1991–2000. Page
Wadden Sea Ecosystem. Wilhelmshaven, Germany.
Begon, M., Townsend, C.R., & Harper, J.L. 2006. Ecology - from individuals to
populations, 4th edition.. Blackwell Publishing Ltd.
Bergman, T.J., & Beehner, J.C. 2008. A simple method for measuring colour in wild
animals: validation and use on chest patch colour in geladas (Theropithecus gelada).
Biological Journal of the Linnean Society 94: 231–240.
Beyer, W.N., Heinz, G.H., & Redmon-Norwood, A.W. 1996. Environmental
contaminants in wildlife: interpreting tissue concentrations. Page SETAC (Society),
SETAC Foundation for Environmental Education. Published by CRC Press.
Beyer, W.N., & Meador, J.P. 2011. Environmental Contaminants in Biota: Interpreting
77
Tissue Concentrations, Second Edition. CRC Press; 2 edition.
Bicknell, A.W.J., Oro, D., Camphuysen, K.C.J., & Votier, S.C. 2013. Potential
consequences of discard reform for seabird communities. Journal of Applied Ecology
50: 649–658.
BirdLife International. 2012. Catharacta skua. http://dx.doi.org/10.2305/IUCN.UK.
Birkhead, T.R., & Nettleship, D.N. 1982. The Adaptive Significance of Egg Size and
Laying Date in Thick-Billed Murres Uria Lomvia. Ecology 63: 300.
Bjørk, E.A. 1963. Nevtollur og nýggjari føroysk lóggáva um oyðing av skaðafugli.
Fróðskaparrit 12: 7–52.
Blackburn, T.M., Gaston, K.J., & Loder, N. 1999. Geographic gradients in body size: a
clarification of Bergmann’s rule.. Diversity and Distributions 5: 165–174.
Blight, L.K. 2011. Egg Production in a Coastal Seabird, the Glaucous-Winged Gull (Larus
glaucescens), Declines during the Last Century. PLoS ONE 6: e22027.
Bloch, D. 1981. Fugletælling på Færøerne sommeren 1981 - foreløbig rapport. Dansk
Ornitologisk Forenings Tidsskrift 75: 1–6.
Bloch, D. 2012. Beak tax to control predatory birds in the Faroe Islands. Archives of
Natural History 39: 126–135.
Bloch, D., Hanusardóttir, M., Davidsen, Á., & Kraul, I. 1987. Mercury and persistent
organochlorines contamination in the marine environment of the Faroe Islands. IWC
SC/39 /O 26.
Blus, L.J., Gish, C.D., Belisle, A.A., & Prouty, R.M. 1972. Logarithmic relationship of
DDE residues to eggshell thinning.. Nature 235: 376–377.
Bolnick, D.I., Svanbäck, R., Fordyce, J.A., Yang, L.H., Davis, J.M., Hulsey, C.D., &
Forister, M.L. 2003. The ecology of individuals: incidence and implications of
individual specialization.. The American naturalist 161: 1–28.
Bolnick, D.I., Yang, L.H., Fordyce, J.A., Davis, J.M., & Svanbäck, R. 2002. Measuring
individual-level resource specialisation. Ecology 83: 2936–2941.
Bond, A.L., & Jones, I. 2009. A practical introduction to stable-isotope analysis for
seabird biologists: approaches, cautions and caveats. Marine Ornithology.
Bourgeon, S., Leat, E.H.K., Furness, R.W., Borgå, K., Hanssen, S.A., & Bustnes, J.O. 2013. Dietary versus maternal sources of organochlorines in top predator seabird
chicks: an experimental approach.. Environmental science & technology 47: 5963–70.
Bourgeon, S., Leat, E.H.K., Magnusdóttir, E., Fisk, A.T., Furness, R.W., Strøm, H.,
Hanssen, S.A., Petersen, A., Olafsdóttir, K., Borgå, K., Gabrielsen, G.W., &
Bustnes, J.O. 2012. Individual variation in biomarkers of health: influence of
persistent organic pollutants in Great skuas (Stercorarius skua) breeding at different
geographical locations.. Environmental research 118: 31–9.
Bownds, C., Wilson, R., & Marshall, D.J. 2010. Why do colder mothers produce larger
eggs? An optimality approach.. The Journal of experimental biology 213: 3796–801.
Braune, B.M., Mallory, M.L., Gilchrist, H.G., Letcher, R.J., & Drouillard, K.G. 2007.
Levels and trends of organochlorines and brominated flame retardants in Ivory Gull
eggs from the Canadian Arctic, 1976 to 2004. Science of the Total Environment 378:
403–417.
78
Braune, B.M., & Norstrom, R.J. 1989. Dynamics of organochlorine compounds in
herring gulls: III. Tissue distribution and bioaccumulation in lake ontario gulls.
Environmental Toxicology and Chemistry 8: 957–968.
Breivik, K., Sweetman, A., Pacyna, J.M., & Jones, K.C. 2002. Towards a global
historical emission inventory for selected PCB congeners - A mass balance approach:
1. Global production and consumption. Science of the Total Environment 290: 181–
198.
Brown, J.S. 1999. Vigilance, patch use and habitat selection: Foraging under predation
risk. Evolutionary Ecology Research 1: 49–71.
Bustnes, J.O., Bourgeon, S., Leat, E.H.K., Magnusdóttir, E., Strøm, H., Hanssen,
S.A., Petersen, A., Olafsdóttir, K., Borgå, K., Gabrielsen, G.W., & Furness, R.W. 2015. Multiple Stressors in a Top Predator Seabird : Potential Ecological
Consequences of Environmental Contaminants , Population Health and Breeding
Conditions. PLoS One 10: 1–18.
Carravieri, A., Bustamante, P., Tartu, S., Meillère, A., Labadie, P., Budzinski, H.,
Peluhet, L., Barbraud, C., Weimerskirch, H., Chastel, O., & Cherel, Y. 2014.
Wandering albatrosses document latitudinal variations in the transfer of persistent
organic pollutants and mercury to Southern Ocean predators.. Environmental science
& technology.
Catry, P., & Furness, R.W. 1997. Egg Volume and Within-Clutch Asymmetry in Great
Skuas: Are They Related to Adult Quality?. Colonial Waterbirds 20: 399.
Catry, T., Alves, J.A., Gill, J.A., Gunnarsson, T.G., & Granadeiro, J.P. 2014.
Individual specialization in a shorebird population with narrow foraging niche. Acta
Oecologica 56: 56–65.
Ceia, F.R., & Ramos, J.A. 2015. Individual specialization in the foraging and feeding
strategies of seabirds: a review. Marine Biology 162: 1923–1938.
Cherel, Y., & Hobson, K.A. 2007. Geographical variation in carbon stable isotope
signatures of marine predators: A tool to investigate their foraging areas in the
Southern Ocean. Marine Ecology Progress Series 329: 281–287.
Chesson, P. 2000. General theory of competitive coexistence in spatially-varying
environments.. Theoretical population biology 58: 211–37.
Christians, J.K. 2002. Avian egg size: variation within species and inflexibility within
individuals.. Biological reviews of the Cambridge Philosophical Society 77: 1–26.
Cobb, G.P., Bargar, T.A., Pepper, C.B., Norman, D.M., Houlis, P.D., & Anderson,
T.A. 2003. Using chorioallantoic membranes for non-lethal assessment of persistent
organic pollutant exposure and effect in oviparous wildlife.. Ecotoxicology 12: 31–45.
Cohen, J.E. 1978. Food webs and niche space.. Page Princeton University Press.
Princeton University Press, Princeton, N. J.
Cole, E. 2016. Blown out: the science and enthusiasm of egg collecting in the Oologists’
Record, 1921–1969. Journal of Historical Geography 51: 18–28.
Colles, A., Liow, L.H., & Prinzing, A. 2009. Are specialists at risk under environmental
change? Neoecological, paleoecological and phylogenetic approaches.. Ecology
letters 12: 849–63.
Cózar, A., Martí, E., Duarte, C.M., García-de-Lomas, J., van Sebille, E., Ballatore,
T.J., Eguíluz, V.M., González-Gordillo, J.I., Pedrotti, M.L., Echevarría, F.,
79
Troublè, R., & Irigoien, X. 2017. The Arctic Ocean as a dead end for floating
plastics in the North Atlantic branch of the Thermohaline Circulation. Science
Advances 3: e1600582.
Dhondt, A.A. 2001. Trade-offs between reproduction and survival in tits. Ardea 89: 155–
166.
Dunning Jr., J.B. 1992. CRC Handbook of Avian Body Masses. Page (J. B. D. Jr, Ed.),
1st edition.. CRC Press, Boca Raton, FL.
Ferdinand, L. 1947. Studier af fuglelivet paa Færøerne. Dansk Ornitologisk Forenings
Tidsskrift 41: 1–37.
Føroya Løgting. 2014. Løgtingslóg um fuglaveiðu v.m., sum seinast broytt við
løgtingslóg. Page frá 15. mai 2014. Føroya Løgting, Tórshavn.
Fort, J., Robertson, G.J., Grémillet, D., Traisnel, G., & Bustamante, P. 2014. Spatial
Ecotoxicology: Migratory Arctic Seabirds Are Exposed to Mercury Contamination
While Overwintering in the Northwest Atlantic. Environmental Science & Technology
48: 11560–11567.
van Franeker, J.A., Blaize, C., Danielsen, J., Fairclough, K., Gollan, J., Guse, N.,
Hansen, P.-L., Heubeck, M., Jensen, J.-K., Le Guillou, G., Olsen, B., Olsen, K.-
O., Pedersen, J., Stienen, E.W.M., & Turner, D.M. 2011. Monitoring plastic
ingestion by the northern fulmar Fulmarus glacialis in the North Sea. Environmental
Pollution 159: 2609–2615.
Frederiksen, M., Edwards, M., Mavor, R.A.R., & Wanless, S. 2010. Regional and
annual variation in black-legged kittiwake breeding productivity is related to sea
surface temperature. Marine Ecology Progress Series 350: 137–143.
Frederiksen, M., Harris, M.P., & Wanless, S. 2005. Inter-population variation in
demographic parameters: A neglected subject?. Oikos 111: 209–214.
Furness, R.W. 1979. Foods of great skuas Catharacta skua at north Atlantic breeding
localities. Ibis.
Furness, R.W. 1987. The skuas1. Edition.. T & AD Poyser Ltd, Staffordshire.
Furness, R.W. 2015. Density dependence in seabirds: Great Skuas Stercorarius skua start
to breed at a younger age when conditions are better. Ringing & Migration 30: 43–50.
Furness, R.W., & Birkhead, T.R. 1984. Seabird colony distributions suggest competition
for food supplies for the breeding season. Nature 311.
Furness, R.W., & Camphuysen, K. (C. J.. 1997. Seabirds as monitors of the marine
environment. ICES Journal of Marine Science 54: 726–737.
Furness, R.W., & Furness, B.L. 1981. A technique for estimating the hatching dates of
eggs of unknown laying date. Ibis 123: 98–102.
Gaston, A.J. 2004. Seabirds: A natural history, 1st edition.. Yale University Press.
Green, R.E., & Scharlemann, J.P.W. 2003. Egg and skin collections as a resource for
long-term ecological studies. Bulletin - British Ornithologists Club 123: 165–176.
Gullestad, P., Blom, G., Bakke, G., & Bogstad, B. 2015. The “Discard Ban Package”:
Experiences in efforts to improve the exploitation patterns in Norwegian fisheries.
Marine Policy 54: 1–9.
Hagen, P.E., & Walls, M.P. 2001. Stockholm Convention on Persistent Organic
80
Pollutants. Natural Resources & Environment 19: 49–52.
Hammer, S., Madsen, J.J., Jensen, J.-K., Petersen, K.T., Bloch, D., & Thorup, K. 2014. Færøsk Trækfugleatlas - The Faroese Bird Migration Atlas. Faroe University
Press, Tórshavn.
Hanley, D., & Doucet, S.M. 2012. Does environmental contamination influence egg
coloration? A long-term study in herring gulls. Journal of Applied Ecology 49: 1055–
1063.
Helgason, L.B., Barrett, R.T., Lie, E., Polder, A., Skaare, J.U., & Gabrielsen, G.W. 2008. Levels and temporal trends (1983–2003) of persistent organic pollutants (POPs)
and mercury (Hg) in seabird eggs from Northern Norway. Environmental Pollution
155: 190–198.
Heming, N.M., & Marini, M.Â. 2015. Ecological and environmental factors related to
variation in egg size of New World flycatchers. Journal of Avian Biology 46: 352–
360.
Hipfner, J.M., Gaston, A.J., & de Forest, L.N. 1997. The Role of Female Age in
Determining Egg Size and Laying Date of Thick-Billed Murres. Journal of Avian
Biology 28: 271.
Hipfner, J.M., Gaston, A.J., & Gilchrist, H. 2005. Variation in egg size and laying date
in thick-billed murre populations breeding in the low Arctic and high Arctic. The
Condor.
Hobson, K.A., Piatt, J.F., & Pitocchelli, J. 1994. Using Stable Isotopes to Determine
Seabird Trophic Relationships. The Journal of Animal Ecology 63: 786.
Hobson, K.A., & Welch, H. 1992. Determination of trophic relationships within a high
Arctic marine food web using δ13C and δ15N analysis. Marine Ecology Progress
Series 84: 9–18.
Hoyt, D.F. 1979. Practical methods of estimating volume and fresh weight of bird eggs.
Auk 96: 73–77.
Inger, R., & Bearhop, S. 2008. Applications of stable isotope analyses to avian ecology.
Ibis 150: 447–461.
Jagannath, A., Shore, R.F., Walker, L.A., Ferns, P.N., & Gosler, A.G. 2008. Eggshell
pigmentation indicates pesticide contamination. Journal of Applied Ecology 45: 133–
140.
JNCC. 2016. Great Skua. http://jncc.defra.gov.uk/page-2879#status.
Joensen, A.H. 1963. Ynglefuglene på Skúvoy, Færøerne, deres udbredelse og antal. Dansk
Ornitologisk Forenings Tidsskrift 57: 1–18.
Johnsen, J.P., & Eliasen, S. 2011. Solving complex fisheries management problems:
What the EU can learn from the Nordic experiences of reduction of discards. Marine
Policy 35: 130–139.
Jones, K.C., & de Voogt, P. 1999. Persistent organic pollutants (POPs): state of the
science. Environmental Pollution 100: 209–221.
Joseph, L. 2011. Museum collections in ornithology: today’s record of avian biodiversity
for tomorrow’s world. Emu 111: i.
Kallenborn, R., Berger, U., & Järnberg, U. 2004. Perfluorinated alkylated substances
(PFAS) in the Nordic environment. Page TemaNord 2004:552. Copenhagen.
81
Kalmbach, E., Griffiths, R., Crane, J.E., & Furness, R.W. 2004. Effects of
experimentally increased egg production on female body condition and laying dates in
the great skua Stercorarius skua. Journal of Avian Biology 35: 501–514.
Kalmbach, E., Nager, R.G., Griffiths, R., & Furness, R.W. 2001. Increased
reproductive effort results in male-biased offspring sex ratio: an experimental study in
a species with reversed sexual size dimorphism.. Proceedings. Biological sciences /
The Royal Society 268: 2175–9.
Klaassen, M., Baarspul, T., Dekkers, T., & van Tienen, P. 2004. The relationship
between carbon stable isotope ratios of hatchling down and egg yolk in Black-headed
Gulls. Journal of Field Ornithology 75: 196–199.
Klaassen, M., Lindström, Å., Meltofte, H., & Piersma, T. 2001. Arctic waders are not
capital breeders. Nature 413: 794–794.
Knutsen, A.E. 2010. Diet and breeding success of Great skuas (cathracta skua) on
Bjørnøya, Norway.
Krist, M. 2011. Egg size and offspring quality: a meta-analysis in birds.. Biological
reviews of the Cambridge Philosophical Society 86: 692–716.
Lavoie, R.A., Champoux, L., Rail, J.-F., & Lean, D.R.S. 2010. Organochlorines,
brominated flame retardants and mercury levels in six seabird species from the Gulf
of St. Lawrence (Canada): relationships with feeding ecology, migration and molt..
Environmental Pollution 158: 2189–2199.
Lead, W.A., Steinnes, E., Bacon, J.R., & Jones, K.C. 1997. Polychlorinated biphenyls in
UK and Norwegian soils: spatial and temporal trends. Science of The Total
Environment 193: 229–236.
Leat, E.H.K. 2012. Persistent organic pollutants in great skuas Stercorarius skua.
University of Glasgow.
Leat, E.H.K., Bourgeon, S., Borgå, K., Strøm, H., Hanssen, S. a, Gabrielsen, G.W.,
Petersen, A., Olafsdottir, K., Magnusdóttir, E., Fisk, A.T., Ellis, S., Bustnes, J.O.,
& Furness, R.W. 2011. Effects of environmental exposure and diet on levels of
persistent organic pollutants (POPs) in eggs of a top predator in the North Atlantic in
1980 and 2008.. Environmental pollution 159: 1222–1228.
Leat, E.H.K., Bourgeon, S., Magnusdottir, E., Gabrielsen, G.W., Grecian, W.J.,
Hanssen, S.A., Olafsdottir, K., Petersen, A., Phillips, R.A., Strøm, H., Ellis, S.,
Fisk, A.T., Bustnes, J.O., Furness, R.W., & Borgå, K. 2013. Influence of wintering
area on persistent organic pollutants in a breeding migratory seabird. Marine Ecology
Progress Series 491: 277–293.
Levin, S.A. 2009. The Princeton Guide to Ecology. Page (S. R. Carpenter, H. C. J.
Godfray, A. P. Kinzig, M. Loreau, J. B. Losos, B. Walker, and D. S. Wilcove, Eds.).
Princeton University Press, Princeton.
Lindström, G., Wingfors, H., Dam, M., & Van Bavel, B. 1999. Identification of 19
polybrominated diphenyl ethers (PBDEs) in long-finned pilot whale (Globicephala
melas) from the Atlantic.. Archives of Environmental Contamination and Toxicology
36: 355–363.
MacArthur, R., & Levins, R. 1967. The Limiting Similarity, Convergence, and
Divergence of Coexisting Species. The American Naturalist 101: 377–385.
Martin, T.E. 2008. Egg size variation among tropical and temperate songbirds: an
82
embryonic temperature hypothesis.. Proceedings of the National Academy of Sciences
of the United States of America 105: 9268–9271.
Maurer, G., Portugal, S.J., & Cassey, P. 2012. A comparison of indices and measured
values of eggshell thickness of different shell regions using museum eggs of 230
European bird species. Ibis 154: 714–724.
Meek, E.R., Bolton, M., Fox, D., & Remp, J. 2011. Breeding skuas in Orkney : a 2010
census indicates density-dependent population change driven by both food supply and
predation. Seabird 24: 1–10.
Miljeteig, C., Gabrielsen, G.W., Strøm, H., Gavrilo, M. V., Lie, E., & Jenssen, B.M. 2012. Eggshell thinning and decreased concentrations of vitamin E are associated
with contaminants in eggs of ivory gulls. Science of the Total Environment 431: 92–
99.
Monaghan, P., & Nager, R.G. 1997, July 7. Why don’t birds lay more eggs? Elsevier.
Muir, D.C.G., & de Wit, C.A. 2010. Trends of legacy and new persistent organic
pollutants in the circumpolar arctic: Overview, conclusions, and recommendations.
Science of The Total Environment 408: 3044–3051.
Müller, H.-C. 1862. Færöernes Fuglefauna med Bemærkninger om Fuglefangsten.
Videnskabelige Meddelelser fra den naturhistoriske Forening i Kjöbenhavn: 1–79.
Munroe, S.E.M., Simpfendorfer, C.A., & Heupel, M.R. 2014. Defining shark ecological
specialisation: concepts, context, and examples. Reviews in Fish Biology and
Fisheries 24: 317–331.
Nager, R.G. 2006. The challenges of making eggs. Ardea 94: 323–346.
Nakagawa, S., & Schielzeth, H. 2013. A general and simple method for obtaining R 2
from generalized linear mixed-effects models. Methods in Ecology and Evolution 4:
133–142.
Newman, M.C. 2010. Fundamentals of Ecotoxicology, Third Edition3rd ed.. CRC Press;
3 edition, Virginia, USA.
Newton, I., & Galbraith, E.A. 1991. Organochlorines and mercury in the eggs of Golden
Eagles, Aquila chrysaetos, from Scotland (UK). Ibis 133: 115–120.
Nielsen, S. í T., Mortensen, R., Hoydal, K., Erenbjerg, S.V., & Dam, M. 2014. AMAP
Faroe Islands Heavy metals and POPs Core programme 2009-2012. Tórshavn.
O’Hanlon, N., McGill, R., & Nager, R. 2017. Increased use of intertidal resources
benefits breeding success in a generalist gull species. Marine Ecology Progress
Series.
Olsen, B. 2011a. Heiðafuglur í Skúvoy 2010. Tórshavn.
Olsen, B. 2011b. Bjargafuglur í Skúvoy 2010. Tórshavn.
Olsen, I. 2003. Bestandsudviklingen af ynglefuglene på Skúvoy, Færøerne, 1961-2001.
Dansk Ornitologisk Forenings Tidsskrift 97: 199–209.
Peakall, D.B. 2007. Principles of Ecotoxicology, 2nd Edition [Kindle Edition], 2nd
edition.. Taylor & Francis; 2 edition.
Pedersen, A. 1935. Myggenæs. Gyldendalske Boghandel, Copenhagen.
Peig, J., & Green, A.J. 2009. New perspectives for estimating body condition from
mass/length data: the scaled mass index as an alternative method. Oikos 118: 1883–
83
1891.
Pereira, M.G., Walker, L. a, Best, J., & Shore, R.F. 2009. Long-term trends in mercury
and PCB congener concentrations in gannet (Morus bassanus) eggs in Britain.
Environmental Pollution 157: 155–163.
Phillips, R.A., Catry, P., Thompson, D., Hamer, K.C., & Furness, R.W. 1997. Inter-
colony variation in diet and reproductive performance of great skuas Catharacta skua.
Marine Ecology Progress Series 152: 285–293.
Pierotti, R., & Annett, C.A. 1987. Reproductive consequences of dietary specialization
and switching in an ecological generalist. Pages 417–442in A. C. Kamil, J. R. Krebs,
and H. R. Pulliam, editors.Foraging Behavior. Plenum Press, New York.
Pierotti, R., & Annett, C.A. 1990. Diet and Reproductive Output in Seabirds. BioScience
40: 568–574.
Pierotti, R., & Annett, C.A. 1991. Diet Choice in the Herring Gull: Constraints Imposed
by Reproductive and Ecological Factors. Ecology 72: 319–328.
Pyke, G.H., & Ehrlich, P.R. 2010. Biological collections and ecological/environmental
research: a review, some observations and a look to the future.. Biological reviews of
the Cambridge Philosophical Society 85: 247–66.
R Core Development Team. 2014. R: A Language and Environment for Statistical
Computing. R Foundation for Statistical Computing, Vienna, Austria.
R Core Team. 2016. R: A language and environment for statistical computing. Vienna,
Austria.
Rahn, H., & Ar, A. 1974. The Avian Egg: Incubation Time and Water Loss. The Condor
76: 147.
Rasband, W.S. 2014. ImageJ. U. S. National Institutes of Health, Bethesda, Maryland.
Ratcliffe, D.A. 1967. Decrease in eggshell weight in certain birds of prey.. Nature 215:
208–210.
Ratcliffe, D.A. 1970. Changes Attributable to Pesticides in Egg Breakage Frequency and
Eggshell Thickness in Some British Birds. Journal of Applied Ecology 7: 67–115.
Ratcliffe, N. 1993. The age-specific breeding performance of great skuas on Shetland.
University of Glasgow.
Resano-Mayor, J., Hernández-Matías, A., Real, J., Parés, F., Inger, R., & Bearhop, S. 2014. Comparing pellet and stable isotope analyses of nestling Bonelli’s Eagle Aquila
fasciata diet. Ibis 156: 176–188.
Reynolds, S.J., & Perrins, C.M. 2010. Dietary Calcium Availability and Reproduction in
Birds. Pages 31–74in C. F. Thompson, editor.Current Ornithology. Springer New
York Dordrecht Heidelberg, London.
Rosenblatt, A.E., Nifong, J.C., Heithaus, M.R., Mazzotti, F.J., Cherkiss, M.S., Jeffery,
B.M., Elsey, R.M., Decker, R.A., Silliman, B.R., Guillette, L.J., Lowers, R.H., &
Larson, J.C. 2015. Factors affecting individual foraging specialization and temporal
diet stability across the range of a large “generalist” apex predator. Oecologia 178: 5–
16.
Ryggi, M.Á. 1978. Fuglabókin, 2nd edition.. P. J. Schmidt, Vojens.
Salomonsen, F. 1935b. Aves - Zoology of the Faroes LXIV. Page (S. Jensen, W.
84
Lundbeck, and T. Mortensen, Eds.). Carlsberg Fund, Copenhagen.
Salomonsen, F. 1935a. Aves. Pages 1–269in S. Jensen, W. Lundbeck, and T. Mortensen,
editors.The Zoology of the Faroes, Volume III, Part II. Andr. Fred. Høst & Søn,
Copenhagen.
Scharlemann, J.P. 2001. Museum egg collections as stores of long-term phenological
data.. International journal of biometeorology 45: 208–11.
van Sebille, E., Wilcox, C., Lebreton, L., Maximenko, N., Hardesty, B.D., van
Franeker, J.A., Eriksen, M., Siegel, D., Galgani, F., & Law, K.L. 2015. A global
inventory of small floating plastic debris. Environmental Research Letters 10:
124006.
Sorensen, M.C., Hipfner, J.M., Kyser, T.K., & Norris, D.R. 2009. Carry-over effects in
a Pacific seabird: Stable isotope evidence that pre-breeding diet quality influences
reproductive success. Journal of Animal Ecology 78: 460–467.
Storer, R.W. 1952. A comparison of variation, behavior and evolution in the sea bird
genera Uria and Cepphus. University of California Press, Berkeley.
Storer, T.I. 1930. A Critique of Oölogical Data on JSTOR. The Auk 47: 329–334.
Suarez, A. V., & Tsutsui, N.D. 2004. The Value of Museum Collections for Research and
Society. BioScience 54: 66.
Sullivan, M.J.P., Newson, S.E., & Pearce-higgins, J.W. 2016. Changing densities of
generalist species underlie apparent homogenization of UK bird communities. Ibis
158: 645–655.
Székely, T., Reynolds, J.D., & Figuerola, J. 2000. Sexual size dimorphism in shorebirds,
gulls and alcids: The influence of sexual and natural selection. Evolution 54: 1404–
1413.
Terraube, J., Guixé, D., & Arroyo, B. 2014. Diet composition and foraging success in
generalist predators: Are specialist individuals better foragers?. Basic and Applied
Ecology 15: 616–624.
Tilman, D. 1982. Resource competition and community structure.
Tinker, M.T., Guimarães, P.R., Novak, M., Marquitti, F.M.D., Bodkin, J.L., Staedler,
M., Bentall, G., & Estes, J.A. 2012. Structure and mechanism of diet specialisation:
testing models of individual variation in resource use with sea otters. Ecology Letters
15: 475–483.
Vallarino, A., Evans, N., Daunt, F., Wanless, S., & Nager, R.G. 2011. Egg components
vary independently of each other in the facultative siblicidal Black-legged Kittiwake
Rissa tridactyla. Journal of Ornithology 153: 513–523.
Verboven, N., Monaghan, P., Nager, R.G., & Evans, N.P. 2010. The effect of maternal
state on the steroid and macronutrient content of lesser black-backed gull eggs..
Physiological and biochemical zoology : PBZ 83: 1009–22.
Vimal, R., & Devictor, V. 2014. Building relevant ecological indicators with basic data :
Species and community specialization indices derived from atlas data. Ecological
Indicators 50: 1–7.
Votier, S.C., Bearhop, S., Crane, J.E., Manuel Arcos, J., & Furness, R.W. 2007.
Seabird predation by great skuas Stercorarius skua– intra-specific competition for
food?. Journal of Avian Biology 38: 234–246.
85
Votier, S.C., Bearhop, S., Fyfe, R., & Furness, R.W. 2008a. Temporal and spatial
variation in the diet of a marine top predator—links with commercial fisheries.
Marine Ecology Progress Series 367: 223–232.
Votier, S.C., Bearhop, S., Ratcliff, N., & Furness, R.W. 2004. Reproductive
consequences for Great Skuas specializing as seabird predators. The Condor 106:
275–287.
Votier, S.C., Bearhop, S., Ratcliffe, N., & Furness, R.W. 2001. Pellets as indicators of
diet in Great Skuas Catharacta skua. Bird Study 48: 373–376.
Votier, S.C., Crane, J.E., Bearhop, S., León, A., Mínguez, E., McSorley, C.A.,
Mitchell, I.P., Parsons, M., Phillips, R.A., & Furness, R.W. 2006. Nocturnal
foraging by great skuas Stercorarius skua: implications for conservation of storm-
petrel populations. Journal of Ornithology 147: 405–413.
Votier, S.C., Hatchwell, B.J., Mears, M., & Birkhead, T.R. 2009. Changes in the timing
of egg-laying of a colonial seabird in relation to population size and environmental
conditions. Marine Ecology Progress Series 393: 225–233.
Votier, S.C., Heubeck, M., & Furness, R.W. 2008b. Using inter-colony variation in
demographic parameters to assess the impact of skua predation on seabird
populations. Ibis 150: 45–53.
Wakefield, E.D., Cleasby, I.R., Bearhop, S., Bodey, T.W., Davies, R.D., Miller, P.I.,
Newton, J., Votier, S.C., & Hamer, K.C. 2015. Long-term individual foraging site
fidelity-why some gannets don’t change their spots. Ecology 96: 3058–3074.
Wernham, C., Siriwardena, G.M., Toms, M., Marchant, J., Clark, J.A., & Baillie, S. 2002. The Migration Atlas: Movements of the Birds of Britain and Ireland.
Christopher Helm Publishers Ltd.
White, T.C.R. 2008. The role of food, weather and climate in limiting the abundance of
animals. Biological Reviews 83: 227–248.
de Wit, C.A., Fisk, A.T., Hobbs, K.E., Muir, D.C.G., Gabrielsen, G.W., Kallenborn,
R., Krahn, M.M., Norstrom, R.J., & Skaare, J.U. 2002. AMAP Assessment 2002.
Persistent Organic Pollutants in the Arctic. Page Arctic Monitoring and Assessment
Programme. Oslo, Norway.
Wittenberger, J.F., & Hunt, G.L. 1985. THE ADAPTIVE SIGNIFICANCE OF
COLONIALITY IN BIRDS. Pages 1–78Avian Biology. Elsevier.
Wolak, M.E., Fairbairn, D.J., & Paulsen, Y.R. 2012. Guidelines for estimating
repeatability. Methods in Ecology and Evolution 3: 129–137.
Wolfe, M.F., Schwarzbach, S., & Sulaiman, R.A. 1998. Effects of mercury on wildlife:
A comprehensive review. Environmental Toxicology and Chemistry 17: 146–160.
Woo, K.J., Elliott, K.H., Davidson, M., Gaston, A.J., & Davoren, G.K. 2008.
Individual specialization in diet by a generalist marine predator reflects specialization
in foraging behaviour. Journal of Animal Ecology 77: 1082–1091.
Yom-Tov, Y., & Geffen, E. 2011. Recent spatial and temporal changes in body size of
terrestrial vertebrates: probable causes and pitfalls. Biological Reviews 86: 531–541.
![Lichens and mosses as polonium and uranium biomonitors ......vascular plants growing in the same habitats [3]. Lichens are well known to accumulate and retain a variety of contaminants,](https://img.pdfslide.us/doc/110x75/61340fbddfd10f4dd73b7db6/lichens-and-mosses-as-polonium-and-uranium-biomonitors-vascular-plants-growing.jpg)


![Can biomonitors effectively detect airborne benzo[a]pyrene? An](https://img.pdfslide.us/doc/110x75/586a1c1f1a28ab532e8b6d8f/can-biomonitors-effectively-detect-airborne-benzoapyrene-an-.jpg)