Embed Size (px)
Citation preview
1
Significant duration prediction and evaluation of the effects of seismological parameters using neural networks
*Hammal Sofiane1), Nouredine Bourahla2) and Laouami Nasser3)
1), 2) Department of Civil Engineering, University of Blida, 09000 Blida, Algeria
3) CGS, National Center of Applied Research in Earthquake Engineering, 01 Rue
Kaddour Rahim BP. 252, Hussein-Dey, Algiers, Algeria 1)
ABSTRACT The characterization of ground motion is a fundamental step in seismic analyses
of structures subject to earthquake ground acceleration. The seismological parameters affecting the seismic action are not explicitly incorporated in current practice.
The aim of this paper is to predict the significant duration and analyze the effects of seismological parameters using feed forward artificial neural network. For this purpose, data collected from the KiK-Net database in Japan have been used and multi-layer perceptron architecture with the error back-propagation learning algorithm has been adopted to develop a relationship correlating the significant duration of ground motion to earthquake magnitude, source to site distance and local site condition. An analysis of the effect of directionality on the significant duration was carried out and found that an extension of the duration may reach up to 40%. This led to incorporate the parameter representing the radial angle at the recording station with respect to the source-epicenter for each set as an input data in the ANN model. In order to evaluate the effect of the different parameters, a sensitivity analysis was made on each of them.
The results indicated that the fitting between the predicted values of significant duration of ground motion by the networks and the observed ones yielded high correlation coefficients. The assessment of the input parameters shows that magnitude and focal depth are first order parameters influencing the significant duration of ground motion compared to distance and site parameters. In conclusion the proposed model can be readily used as alternative to classical models.
Key words: Seismological parameters, Earthquake ground motion, artificial neural
networks, KiK-net network, significant duration.
1) Graduate Student
2) 3)
Professor
2
INTRODUCTION The characterization of ground motion is a fundamental step in seismic analyses of
structures subject to earthquake ground movement. Effects of seismological parameters on the seismic action are not explicitly incorporated in current practice. In recent years, several authors have proposed methods to estimate realistic seismic movements on the basis of a stochastic parameterization in the temporal domain. The ground motion characteristics have an important influence on the seismic behavior of buildings, including ground motion intensity (Dimitrios, 2002) (Tothong, 2007), duration (Martinez, 1999) (Meera, 2013), frequency content (Kumar, 2011). Earthquake ground motions are usually measured by limited number of strong motion recording instruments. The question that then arises is how to estimate the duration of strong motion at a site where no recording station is installed. The ground motion features are influenced by a number of factors which can be classified into three groups: 1) Source characteristics, 2) Path characteristics 3) Site characteristics. Past earthquake records have been used to study some of these influences and several models have been proposed in literature to predict the duration of ground motion (Justin, 2006).
In this article, the artificial neural network (ANN) technique is used as an alternative to regression methods. The ANN with Back-Propagation (BP) learning algorithm is strongly recommended for highly nonlinear modeling problems. This technique has proved its efficiency in solving complex nonlinear problems. In recent years several investigations have been performed using ANN techniques in the field of earthquake engineering. The artificial neural network (ANN) has attracted much attention of research teams, which used this technique to develop methods generating spectrum compatible accelerograms (Ghaboussi, 1998), and for the assessment of damage in concrete beams on the basis of natural frequency measurements (Antony, 2006). The objective of this work is to predict the significant duration of the strong ground motions and analyze the effects of seismological parameters using feed forward artificial neural network (ANN) with a conjugate gradient back-propagation rule for the training. The inputs are the magnitude, the focal depth and the epicentral distance, shear wave velocity and the angle epicenter-station while the target outputs is the SD5-95% “Signficant Duration” . Then, once the model is developed an attempt is made to capture the key physical aspects of the effects of seismological parameters on the characteristics of ground motion.
1. GROUND MOTION DATABASE
Earthquake ground motions are usually recorded by strong motion instruments. The
recorded accelerograms are corrected and integrated to obtain the velocity and displacement time-histories. The maximum values of ground motions (peak ground acceleration, peak ground velocity, and peak ground displacement) are of particular interest in seismic analysis.
Careful selection of data may significantly improve the performance of the trained neural network. The strong motion database developed in this study includes approximately 1296 records from 10 events (range between M= 4.8 to 7.3) that
3
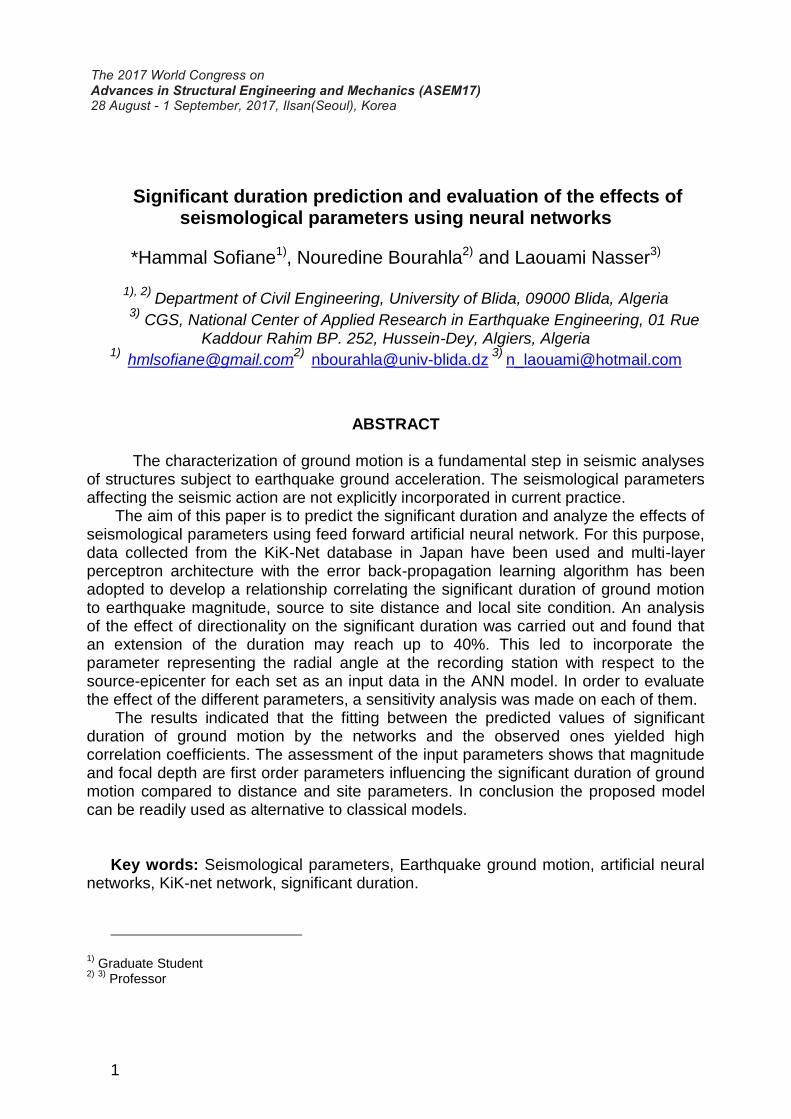
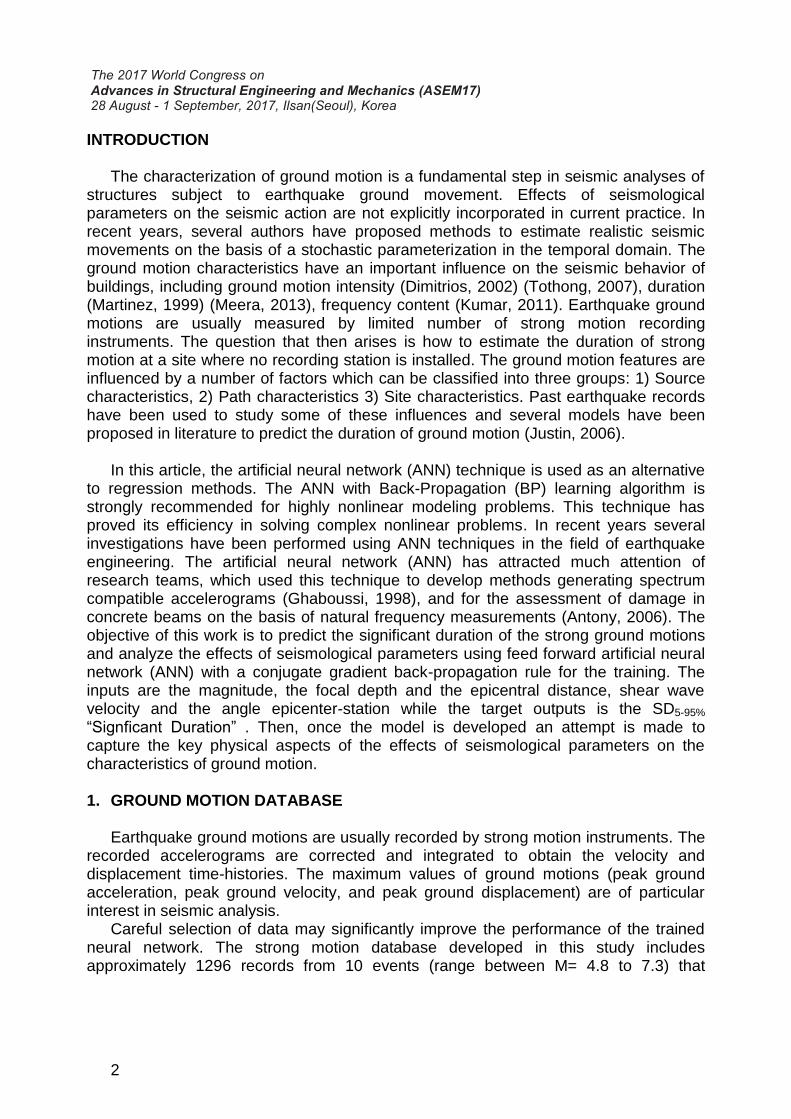
occurred in Japan during the period 2000-2016. The earthquakes were recorded by the Kik-Net nationwide strong motion networks, these acceleration records have been obtained from the site http://www.kyoshin.bosai.go.jp , the distribution of ground motion records versus earthquake magnitude and site class is presented in figure2-3.
ORIGIN TIME LATITUDE LONGITUDE DEPTH MAGNITUDE EARTHQUAKE NAME OR
EPICENTER REGION
2016/04/16-07:23 32.79N 130.77E 012km M4.8
2016/04/16-07:11 33.27N 131.40E 006km M5.4
1998/04/22-20:32 35.17N 136.56E 010km M5.4
2016/04/18-20:42 33.00N 131.20E 009km M5.8
2011/03/23-07:12 37.08N 140.79E 008km M6.0
2003/07/26-07:13 38.40N 141.17E 012km M6.2 Northern Miyagi prefecture
2016/10/21-14:07 35.38N 133.85E 011km M6.6
2004/10/23-17:56 37.29N 138.87E 013km M6.8 The Mid Niigata Prefecture
Earthquake in 2004
2005/03/20-10:53 33.74N 130.18E 009km M7.0 Northwest off Kyushu
2000/10/06-13:30 35.28N 133.35E 011km M7.3 The Western Tottori prefecture
earthquake in 2000
72
98
130
156 174
160
250
122 134
4.8 5.4 5.8 6 6.2 6.6 6.8 7 7.3
Figure 2 Distribution of seismic sequences in data base according to magnitude
Tableau 1 Summury of events used in this investigation
4.50
5.00
5.50
6.00
6.50
7.00
7.50
0.00 200.00 400.00 600.00 800.00M
ag
nit
ud
e
PGA (cm2/s)
Figure 1 Magnitude versus PGA distribution
4
2. SCALING OF INPUT The normalization processing for all data used in development of the ANN is an
important step; the neural network training can be made more efficient if certain preprocessing steps are performed on the network inputs and targets (Howard & Mark ). In addition, the values should be scaled to match the range of the input neurons. This means that along with any other transformations performed on network inputs, each input should be normalized.
Scaling of the training data is performed so that the processed data is in the range of –1 to +1. The training data sets (inputs and targets outputs) are scaled (pre-processed) according to:
𝑃𝑛 = 2 ×(𝑃 − 𝑚𝑖𝑛𝑃)
(𝑚𝑎𝑥𝑃 − 𝑚𝑖𝑛𝑃)− 1
𝑇𝑛 = 2 ×(𝑇 − 𝑚𝑖𝑛𝑇)
(𝑚𝑎𝑥𝑇 − 𝑚𝑖𝑛𝑇)− 1
- P = matrix of the input vectors; - T = matrix of the output vectors; - Pn = matrix of scaled input vectors; - Tn = matrix of scaled target output vectors; - minP = vector containing minimum values of the original input; - maxP = vector containing maximum values of the original input; - minT = vector containing the minimum value of the target output - maxT = vector containing the maximum value of the target output. The scaled data is then used to train the neural network. The data from the output
neuron has to be post-processed to convert the data back into unscaled units to get the significant duration parameter according to
𝑇 = 0.5 . (𝑇𝑛 + 1). (𝑚𝑎𝑥𝑇 + 𝑚𝑖𝑛𝑇) + 𝑚𝑖𝑛𝑇
3. MEASURE OF GROUND MOTION DURATION More than 10 definitions of seismic duration are available in literature; we can
distinguish two classes of definition: bracket duration definition and the significant duration definition. The bracketed duration is defined as the time elapsed between the first and the last excursion of the absolute accelerogram exceeding a specified threshold value. The significant duration are based on the total energy of ground motion are accumulated (Bommer, 2004).
In our study, we have used the significant duration (Trifunac, 1975) which has been used and recommended in a number of past studies. Significant duration represents the time interval over which a specific percentage of the total Arias intensity Ia is defined as:
𝐼𝑎 =1
2𝜋∫ 𝑎2(𝑡)𝑑𝑡
𝑡𝑚𝑎𝑥
0
Where :
a(t) ground motion time history tmax length of accelerogram g gravitational acceleration
5
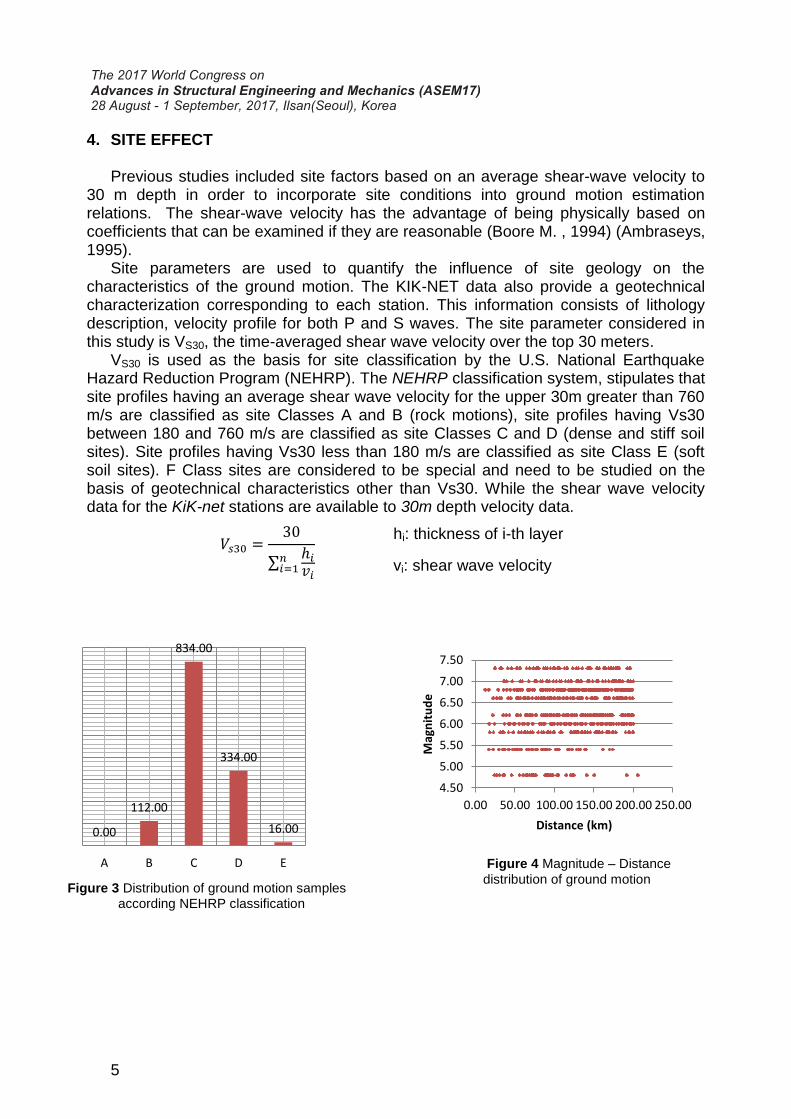
4. SITE EFFECT Previous studies included site factors based on an average shear-wave velocity to
30 m depth in order to incorporate site conditions into ground motion estimation relations. The shear-wave velocity has the advantage of being physically based on coefficients that can be examined if they are reasonable (Boore M. , 1994) (Ambraseys, 1995).
Site parameters are used to quantify the influence of site geology on the characteristics of the ground motion. The KIK-NET data also provide a geotechnical characterization corresponding to each station. This information consists of lithology description, velocity profile for both P and S waves. The site parameter considered in this study is VS30, the time-averaged shear wave velocity over the top 30 meters.
VS30 is used as the basis for site classification by the U.S. National Earthquake Hazard Reduction Program (NEHRP). The NEHRP classification system, stipulates that site profiles having an average shear wave velocity for the upper 30m greater than 760 m/s are classified as site Classes A and B (rock motions), site profiles having Vs30 between 180 and 760 m/s are classified as site Classes C and D (dense and stiff soil sites). Site profiles having Vs30 less than 180 m/s are classified as site Class E (soft soil sites). F Class sites are considered to be special and need to be studied on the basis of geotechnical characteristics other than Vs30. While the shear wave velocity data for the KiK-net stations are available to 30m depth velocity data.
4.50
5.00
5.50
6.00
6.50
7.00
7.50
0.00 50.00 100.00 150.00 200.00 250.00
Mag
nit
ud
e
Distance (km)
Figure 3 Distribution of ground motion samples according NEHRP classification
to site class
Figure 4 Magnitude – Distance
distribution of ground motion
hi: thickness of i-th layer
vi: shear wave velocity
0.00
112.00
834.00
334.00
16.00
A B C D E
𝑉𝑠30 =30
∑ℎ𝑖
𝑣𝑖
𝑛𝑖=1
6
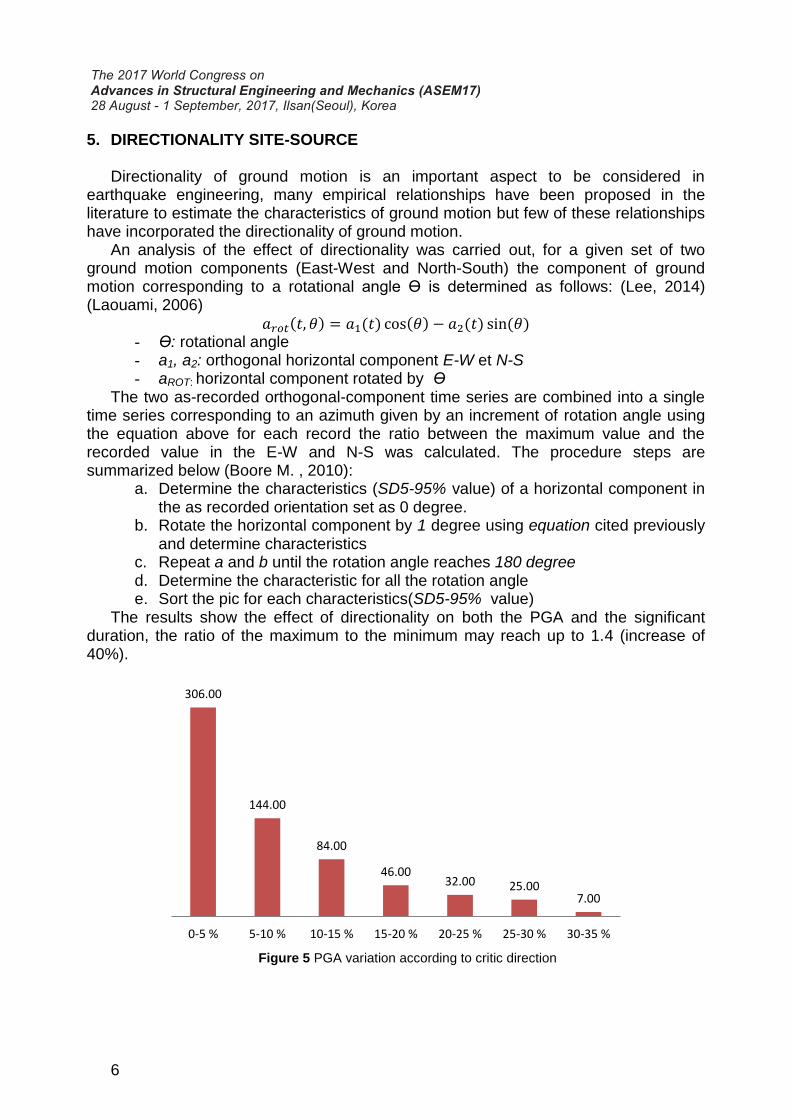
5. DIRECTIONALITY SITE-SOURCE Directionality of ground motion is an important aspect to be considered in
earthquake engineering, many empirical relationships have been proposed in the literature to estimate the characteristics of ground motion but few of these relationships have incorporated the directionality of ground motion.
An analysis of the effect of directionality was carried out, for a given set of two ground motion components (East-West and North-South) the component of ground motion corresponding to a rotational angle Ө is determined as follows: (Lee, 2014) (Laouami, 2006)
𝑎𝑟𝑜𝑡(𝑡, 𝜃) = 𝑎1(𝑡) cos(𝜃) − 𝑎2(𝑡) sin(𝜃) - Ө: rotational angle - a1, a2: orthogonal horizontal component E-W et N-S - aROT: horizontal component rotated by Ө
The two as-recorded orthogonal-component time series are combined into a single time series corresponding to an azimuth given by an increment of rotation angle using the equation above for each record the ratio between the maximum value and the recorded value in the E-W and N-S was calculated. The procedure steps are summarized below (Boore M. , 2010):
a. Determine the characteristics (SD5-95% value) of a horizontal component in the as recorded orientation set as 0 degree.
b. Rotate the horizontal component by 1 degree using equation cited previously and determine characteristics
c. Repeat a and b until the rotation angle reaches 180 degree d. Determine the characteristic for all the rotation angle e. Sort the pic for each characteristics(SD5-95% value)
The results show the effect of directionality on both the PGA and the significant duration, the ratio of the maximum to the minimum may reach up to 1.4 (increase of 40%).
Figure 5 PGA variation according to critic direction
306.00
144.00
84.00
46.00 32.00 25.00
7.00
0-5 % 5-10 % 10-15 % 15-20 % 20-25 % 25-30 % 30-35 %
7
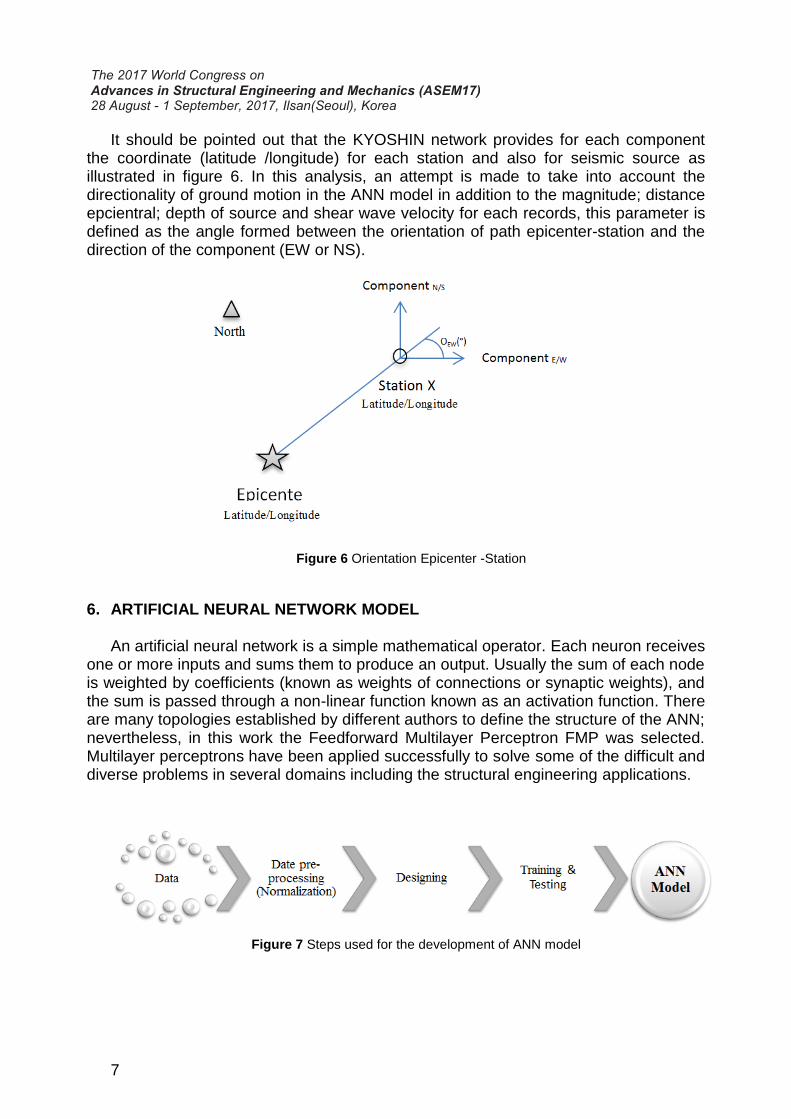
It should be pointed out that the KYOSHIN network provides for each component the coordinate (latitude /longitude) for each station and also for seismic source as illustrated in figure 6. In this analysis, an attempt is made to take into account the directionality of ground motion in the ANN model in addition to the magnitude; distance epcientral; depth of source and shear wave velocity for each records, this parameter is defined as the angle formed between the orientation of path epicenter-station and the direction of the component (EW or NS).
6. ARTIFICIAL NEURAL NETWORK MODEL
An artificial neural network is a simple mathematical operator. Each neuron receives
one or more inputs and sums them to produce an output. Usually the sum of each node is weighted by coefficients (known as weights of connections or synaptic weights), and the sum is passed through a non-linear function known as an activation function. There are many topologies established by different authors to define the structure of the ANN; nevertheless, in this work the Feedforward Multilayer Perceptron FMP was selected. Multilayer perceptrons have been applied successfully to solve some of the difficult and diverse problems in several domains including the structural engineering applications.
Figure 6 Orientation Epicenter -Station
Figure 7 Steps used for the development of ANN model
8
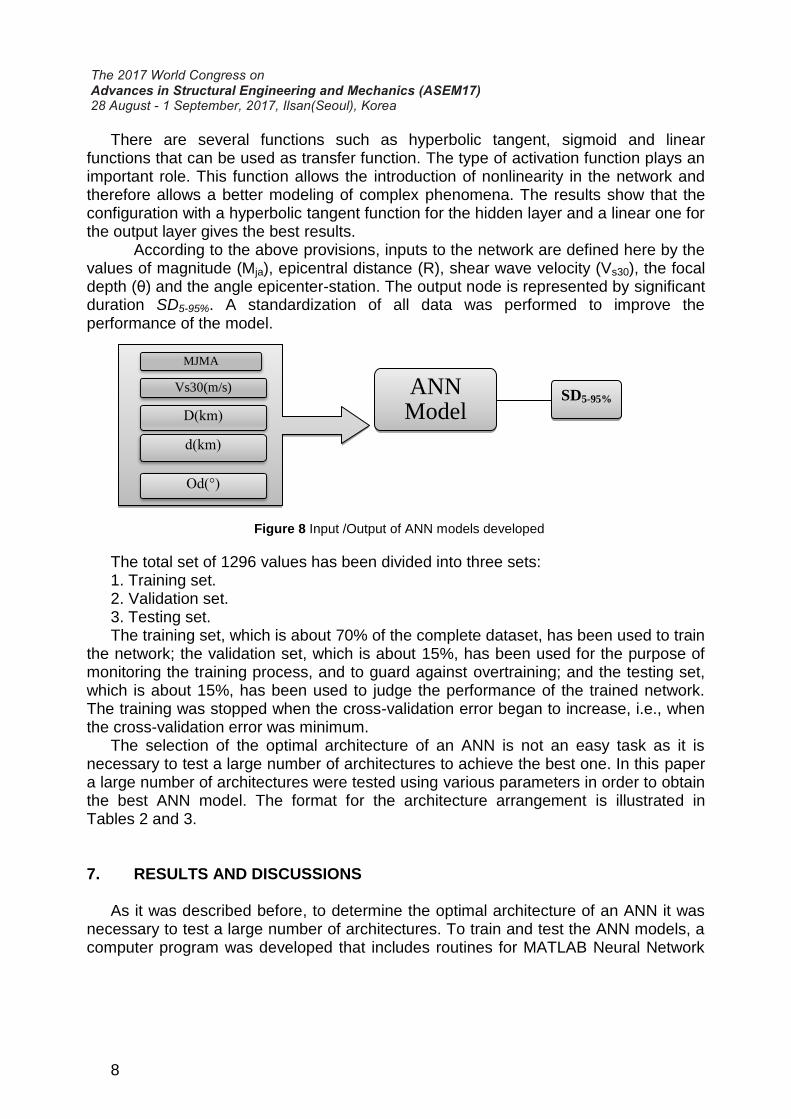
There are several functions such as hyperbolic tangent, sigmoid and linear functions that can be used as transfer function. The type of activation function plays an important role. This function allows the introduction of nonlinearity in the network and therefore allows a better modeling of complex phenomena. The results show that the configuration with a hyperbolic tangent function for the hidden layer and a linear one for the output layer gives the best results.
According to the above provisions, inputs to the network are defined here by the values of magnitude (Mja), epicentral distance (R), shear wave velocity (Vs30), the focal depth (θ) and the angle epicenter-station. The output node is represented by significant duration SD5-95%. A standardization of all data was performed to improve the performance of the model.
The total set of 1296 values has been divided into three sets: 1. Training set. 2. Validation set. 3. Testing set. The training set, which is about 70% of the complete dataset, has been used to train
the network; the validation set, which is about 15%, has been used for the purpose of monitoring the training process, and to guard against overtraining; and the testing set, which is about 15%, has been used to judge the performance of the trained network. The training was stopped when the cross-validation error began to increase, i.e., when the cross-validation error was minimum.
The selection of the optimal architecture of an ANN is not an easy task as it is necessary to test a large number of architectures to achieve the best one. In this paper a large number of architectures were tested using various parameters in order to obtain the best ANN model. The format for the architecture arrangement is illustrated in Tables 2 and 3.
7. RESULTS AND DISCUSSIONS As it was described before, to determine the optimal architecture of an ANN it was
necessary to test a large number of architectures. To train and test the ANN models, a computer program was developed that includes routines for MATLAB Neural Network
ANN Model
SD5-95%
Figure 8 Input /Output of ANN models developed
MJMA
Vs30(m/s)
�
�
9
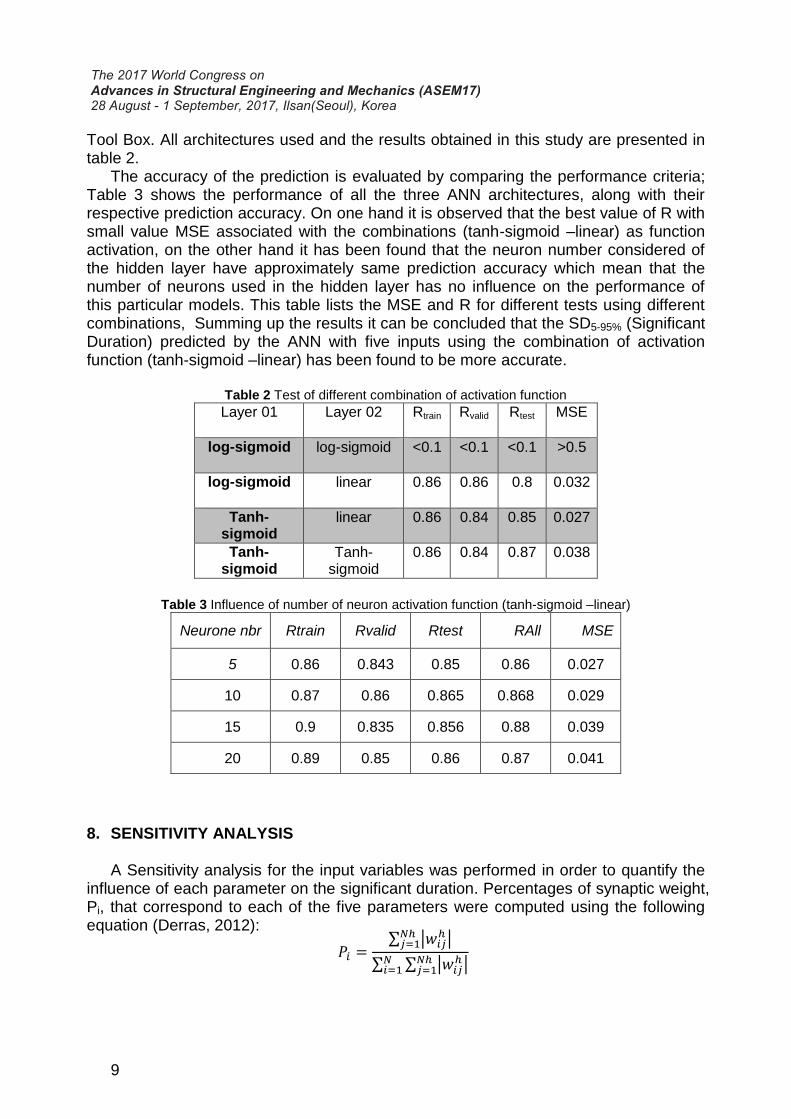
Tool Box. All architectures used and the results obtained in this study are presented in table 2.
The accuracy of the prediction is evaluated by comparing the performance criteria; Table 3 shows the performance of all the three ANN architectures, along with their respective prediction accuracy. On one hand it is observed that the best value of R with small value MSE associated with the combinations (tanh-sigmoid –linear) as function activation, on the other hand it has been found that the neuron number considered of the hidden layer have approximately same prediction accuracy which mean that the number of neurons used in the hidden layer has no influence on the performance of this particular models. This table lists the MSE and R for different tests using different combinations, Summing up the results it can be concluded that the SD5-95% (Significant Duration) predicted by the ANN with five inputs using the combination of activation function (tanh-sigmoid –linear) has been found to be more accurate.
Table 2 Test of different combination of activation function
Layer 01 Layer 02 Rtrain Rvalid Rtest MSE
log-sigmoid log-sigmoid <0.1 <0.1 <0.1 >0.5
log-sigmoid linear 0.86 0.86 0.8 0.032
Tanh-sigmoid
linear 0.86 0.84 0.85 0.027
Tanh-sigmoid
Tanh-sigmoid
0.86 0.84 0.87 0.038
Table 3 Influence of number of neuron activation function (tanh-sigmoid –linear)
Neurone nbr Rtrain Rvalid Rtest RAll MSE
5 0.86 0.843 0.85 0.86 0.027
10 0.87 0.86 0.865 0.868 0.029
15 0.9 0.835 0.856 0.88 0.039
20 0.89 0.85 0.86 0.87 0.041
8. SENSITIVITY ANALYSIS A Sensitivity analysis for the input variables was performed in order to quantify the
influence of each parameter on the significant duration. Percentages of synaptic weight, Pi, that correspond to each of the five parameters were computed using the following equation (Derras, 2012):
𝑃𝑖 =∑ |𝑤𝑖𝑗
ℎ |𝑁ℎ𝑗=1
∑ ∑ |𝑤𝑖𝑗ℎ |𝑁ℎ
𝑗=1𝑁𝑖=1
10
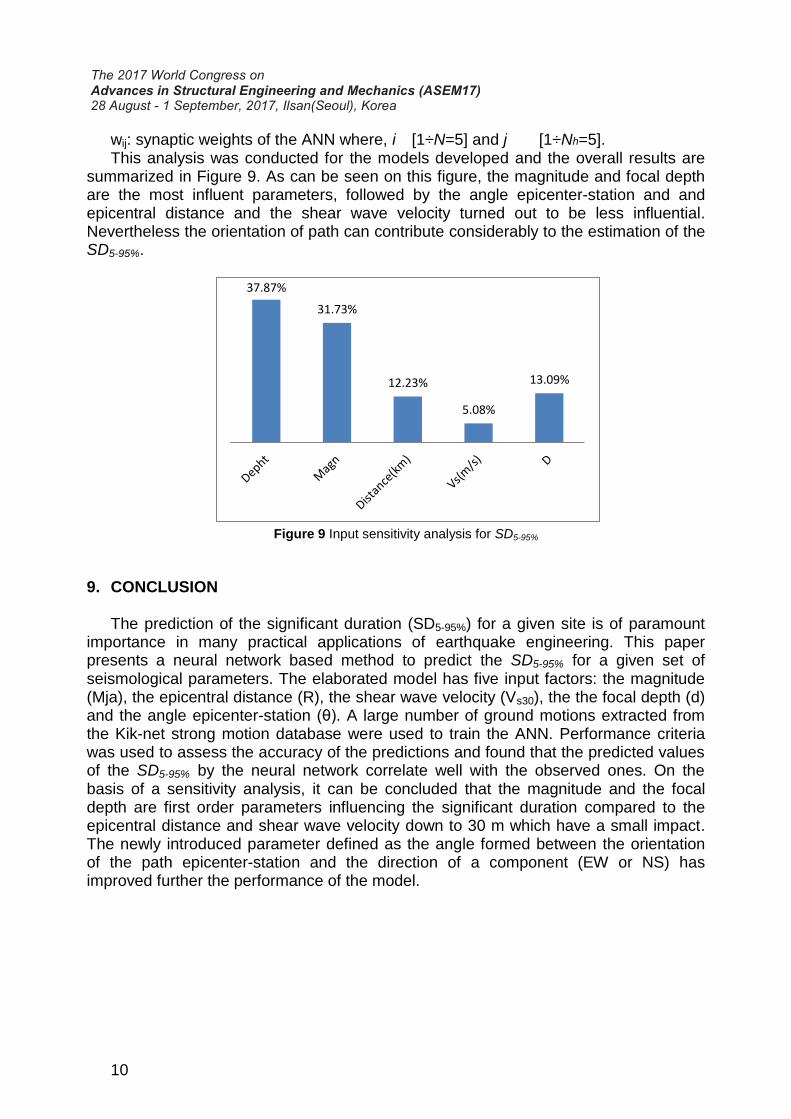
wij: synaptic weights of the ANN where, i [1÷N=5] and j [1÷Nh=5]. This analysis was conducted for the models developed and the overall results are
summarized in Figure 9. As can be seen on this figure, the magnitude and focal depth are the most influent parameters, followed by the angle epicenter-station and and epicentral distance and the shear wave velocity turned out to be less influential. Nevertheless the orientation of path can contribute considerably to the estimation of the SD5-95%.
9. CONCLUSION The prediction of the significant duration (SD5-95%) for a given site is of paramount
importance in many practical applications of earthquake engineering. This paper presents a neural network based method to predict the SD5-95% for a given set of seismological parameters. The elaborated model has five input factors: the magnitude (Mja), the epicentral distance (R), the shear wave velocity (Vs30), the the focal depth (d) and the angle epicenter-station (θ). A large number of ground motions extracted from the Kik-net strong motion database were used to train the ANN. Performance criteria was used to assess the accuracy of the predictions and found that the predicted values of the SD5-95% by the neural network correlate well with the observed ones. On the basis of a sensitivity analysis, it can be concluded that the magnitude and the focal depth are first order parameters influencing the significant duration compared to the epicentral distance and shear wave velocity down to 30 m which have a small impact. The newly introduced parameter defined as the angle formed between the orientation of the path epicenter-station and the direction of a component (EW or NS) has improved further the performance of the model.
37.87%
31.73%
12.23%
5.08%
13.09%
Figure 9 Input sensitivity analysis for SD5-95%
11
REFERENCES
Ambraseys, N. (1995). "The prediction of earthquake peak ground acceleration in Europe". Earthquake Engineering and Structural Dynamics, 24, 467-490.
Antony, J. (2006). "Damage assessment of prestressed concrete beams using artificial neural network (ANN) approach". Computers and Structures, 84, 1709–1718.
Bommer, M. (2004). "The influence of strong motion duration of the seismic response of masonry structures". Bulletin of earthquake engineering(65), 584.626.
Boore, M. (1994). "Estimation of response spectra and peak accelerations from western North American earthquakes".
Boore, M. (2010). "Orientation-Independent, Nongeometric-Mean Measures of Seismic Intensity from Two Horizontal Components of Motion". Bulletin of the Seismological Society of America, 4, 1830–1835.
Derras, B. (2012). "Adapting the Neural Network Approach to PGA Prediction: An Example Based on the KiK-net Data". Bulletin of the Seismological Society of America, 102, 16.
Dimitrios, V. (2002). "Incremental dynamic analysis". Earthquake engineering and Structural Dynamics, 31, 491-514.
Ghaboussi, J. (1998). "New method of generating spectrum compatible accelerograms using neural networks". EARTHQUAKE ENGINEERING AND STRUCTURAL DYNAMICS, 27, 377-396.
Howard, D., & Mark , B. (n.d.). Neural Network Toolbox™ 4 User’s Guide. The MathWorks.
Justin, K. (2006). "Prediction equations for significant duration of earthquake ground motions considering site and near-source effects". Earthquake Spectra, 22(5), 985-1013.
Kumar, M. (2011). "Influence of the mean period of ground motion on the inelastic dynamic response of single and and multi degree of freedom systems". Earthquake Eng Struct Dyn(40), 237-56.
Laouami, N. (2006). "Evidence for fault-related directionality and localized site effects from strong motion recordings of the 2003 Boumerdes (Algeria) earthquake :consequences on damage distribution and the Algerian seismic code". Soil Dynamics and Earthquake Engineering, 26, 991-1003.
Lee, J. (2014). "Directionality of strong ground motion durations". Tenth U.S. National Conference on Earthquake Engineering. Anchorage, Alaska.
Martinez, P. (1999). "The effective duration of earthquake strong motion". Earthquake engineering(3), 127-72.
Meera, R. (2013). "Effect of Ground Motion Duration on Earthquake-Induced Structural Collapse". Struct Saf(41), 119-33.
Tothong, P. (2007). "Probabilistic seismic demand analysis using advanced ground motion intensiy measure". Earthquake engineering structure dynamic(36), 1837-60.
Trifunac, M. (1975). "A study on the duration of strong earthquake ground motion". Bulletin of the seismological Society of Americ(65), 584-626.
12
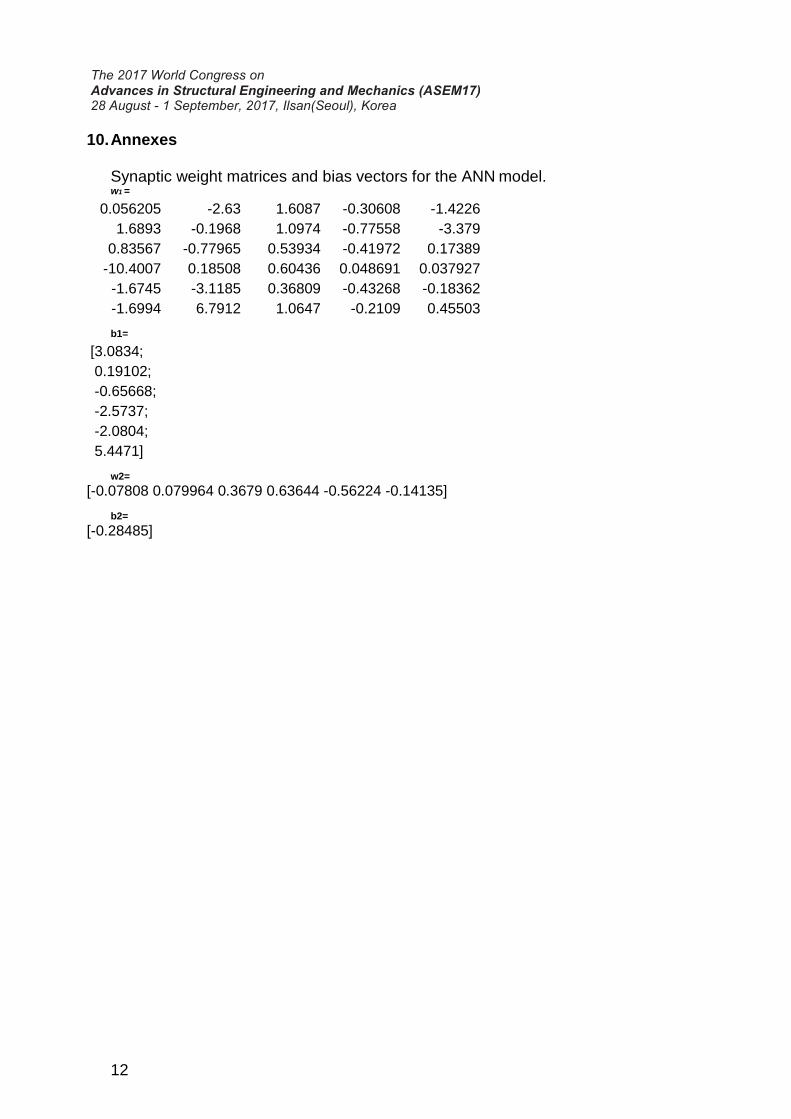
10. Annexes
Synaptic weight matrices and bias vectors for the ANN model. w1 =
0.056205 -2.63 1.6087 -0.30608 -1.4226
1.6893 -0.1968 1.0974 -0.77558 -3.379
0.83567 -0.77965 0.53934 -0.41972 0.17389
-10.4007 0.18508 0.60436 0.048691 0.037927
-1.6745 -3.1185 0.36809 -0.43268 -0.18362
-1.6994 6.7912 1.0647 -0.2109 0.45503 b1=
[3.0834;
0.19102;
-0.65668;
-2.5737;
-2.0804;
5.4471] w2=
[-0.07808 0.079964 0.3679 0.63644 -0.56224 -0.14135] b2=
[-0.28485]


![arXiv:2003.14031v1 [cs.CV] 31 Mar 2020 · Yifeng Chen 1, Guangchen Lin , Songyuan Li , Bourahla Omar , Yiming Wu1, Fangfang Wang 1, Junyi Feng , Mingliang Xu2, Xi Li 1Zhejiang University,](https://img.pdfslide.us/doc/110x75/5f8eda2c2e93897fea7b17e4/arxiv200314031v1-cscv-31-mar-2020-yifeng-chen-1-guangchen-lin-songyuan-li.jpg)


![Pain Recognition Using Spatiotemporal Oriented Energy of Facial … · 2020. 7. 2. · energy of facial muscles is the one developed by Hammal et al. [10]. This system uses a combination](https://img.pdfslide.us/doc/110x75/613b9e21f8f21c0c82691907/pain-recognition-using-spatiotemporal-oriented-energy-of-facial-2020-7-2-energy.jpg)


![Nouredine HADJSAID HLF V1 2 - HLF Giant Grenoble ...hlf-giant-grenoble.org/.../2017/10/...Nouredine_Hadjsaid_Grenoble.pdf · 6rph whqghqflhv rq hqhuj\ v\vwhpv ¾,qwhjudwlqj ghfhqwudol]hg](https://img.pdfslide.us/doc/110x75/5b54a7cb7f8b9ae30b8d8138/nouredine-hadjsaid-hlf-v1-2-hlf-giant-grenoble-hlf-giant-6rph-whqghqflhv.jpg)


![arXiv:1707.07301v1 [cs.CV] 23 Jul 2017Shanshan Zhao 1, Xi Li;2, Omar El Farouk Bourahla 1 Zhejiang University, Hangzhou, China 2 Alibaba-Zhejiang University Joint Institute of Frontier](https://img.pdfslide.us/doc/110x75/601372c8cf7069209c32e49a/arxiv170707301v1-cscv-23-jul-2017-shanshan-zhao-1-xi-li2-omar-el-farouk.jpg)


![Á } d P , } µ Z } o ] v ] À ^ } ] o W } ] } v ^ Ç u M À ... for WEB.pdfArthur Alik-Lagrange, Phillippe Leite, Leila Bourahla, Marie Boulinaud, Michael Denly, ... McCord, 2013;](https://img.pdfslide.us/doc/110x75/5e99f51c34dc933bfd1454b9/-d-p-z-o-v-o-w-v-u-m-for-webpdfarthur.jpg)