Embed Size (px)
Citation preview
Dr. Rüdiger Mrotzek
Hans Richard Schmitz
Conference Call H1 2020 & Strategy update
Niclas Karoff
Hans Richard Schmitz
30 July 2020
Agenda
H1 2020 | 30 July 2020
1 Update on H1 2020 performance
2 Strategy update
2
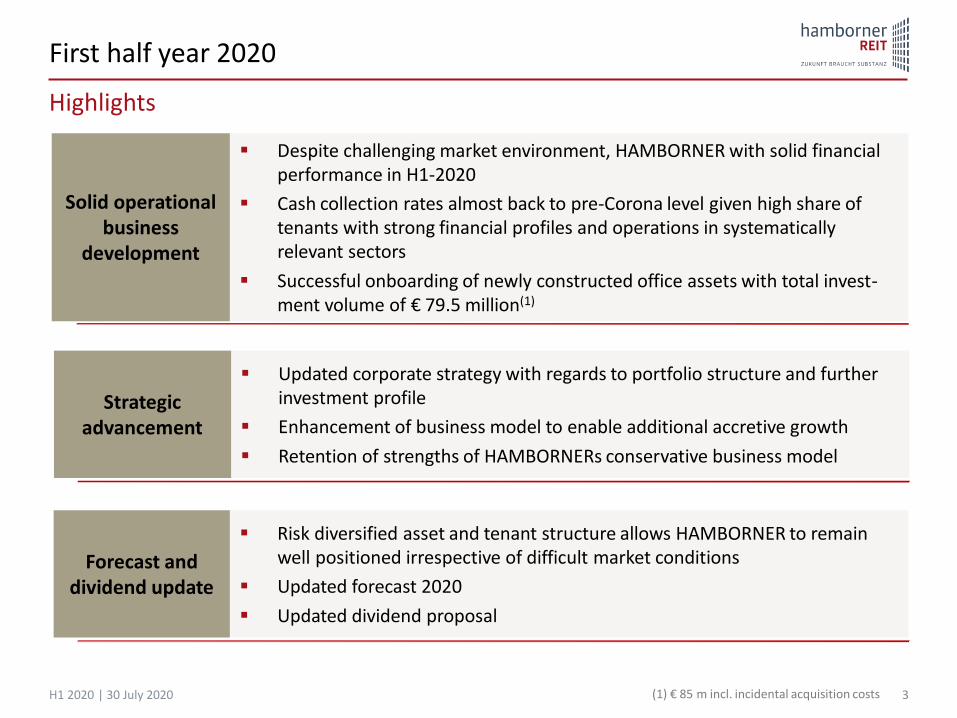
First half year 2020
3H1 2020 | 30 July 2020
Highlights
▪ Updated corporate strategy with regards to portfolio structure and further investment profile
▪ Enhancement of business model to enable additional accretive growth
▪ Retention of strengths of HAMBORNERs conservative business model
Solid operational business
development
Strategic advancement
Forecast and dividend update
▪ Risk diversified asset and tenant structure allows HAMBORNER to remain well positioned irrespective of difficult market conditions
▪ Updated forecast 2020
▪ Updated dividend proposal
▪ Despite challenging market environment, HAMBORNER with solid financial performance in H1-2020
▪ Cash collection rates almost back to pre-Corona level given high share of tenants with strong financial profiles and operations in systematically relevant sectors
▪ Successful onboarding of newly constructed office assets with total invest-ment volume of € 79.5 million(1)
(1) € 85 m incl. incidental acquisition costs
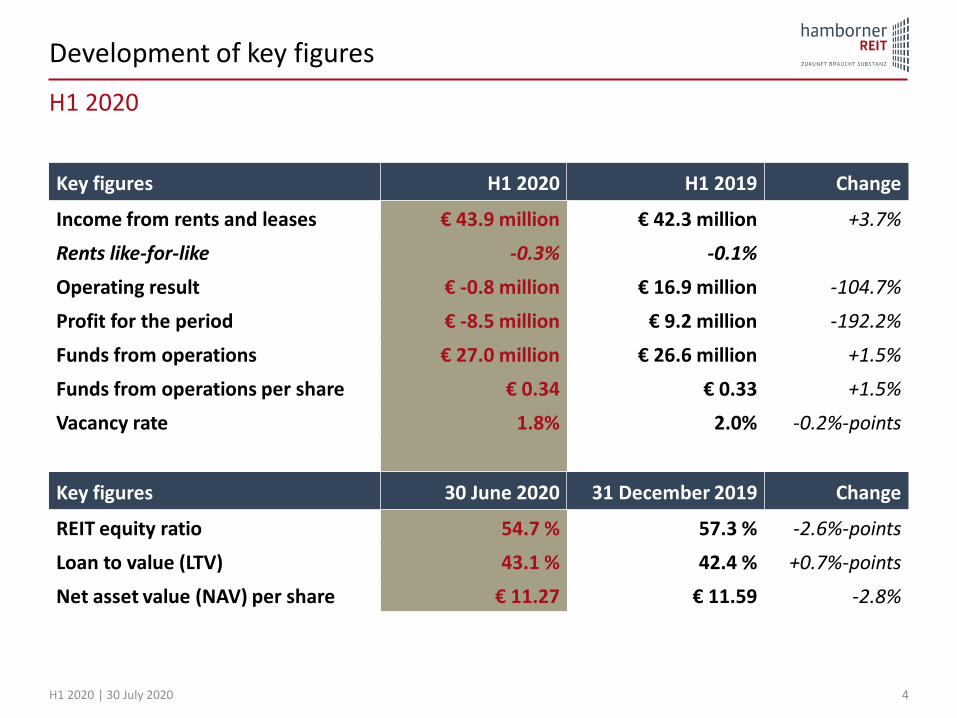
Development of key figures
Key figures H1 2020 H1 2019 Change
Income from rents and leases € 43.9 million € 42.3 million +3.7%
Rents like-for-like -0.3% -0.1%
Operating result € -0.8 million € 16.9 million -104.7%
Profit for the period € -8.5 million € 9.2 million -192.2%
Funds from operations € 27.0 million € 26.6 million +1.5%
Funds from operations per share € 0.34 € 0.33 +1.5%
Vacancy rate 1.8% 2.0% -0.2%-points
Key figures 30 June 2020 31 December 2019 Change
REIT equity ratio 54.7 % 57.3 % -2.6%-points
Loan to value (LTV) 43.1 % 42.4 % +0.7%-points
Net asset value (NAV) per share € 11.27 € 11.59 -2.8%
4H1 2020 | 30 July 2020
H1 2020
Portfolio development
5H1 2020 | 30 July 2020
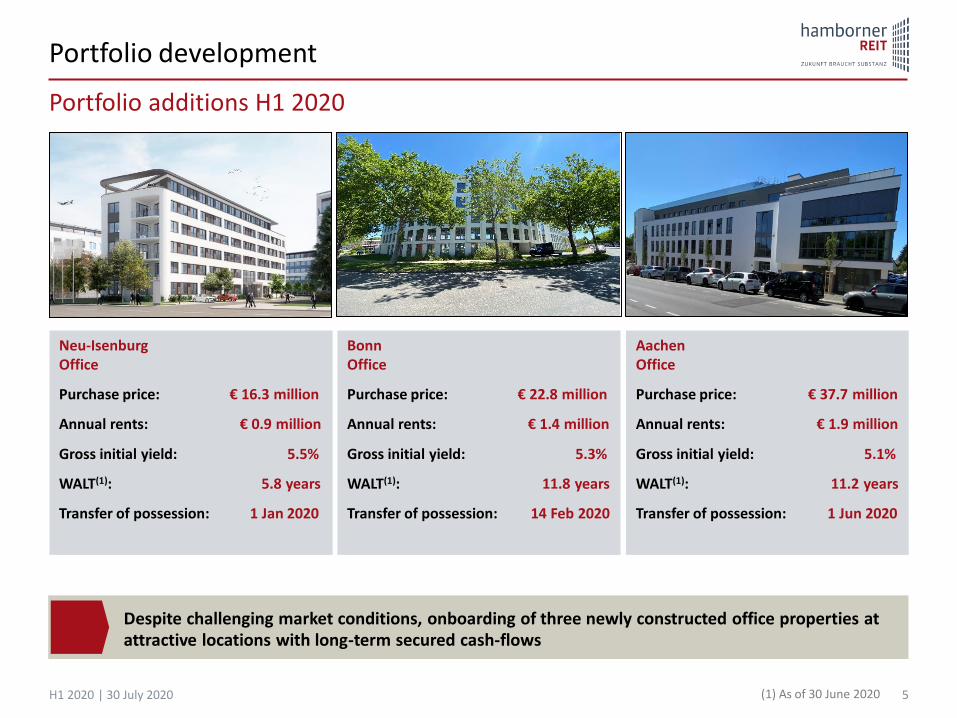
Portfolio additions H1 2020
Despite challenging market conditions, onboarding of three newly constructed office properties at attractive locations with long-term secured cash-flows
Neu-Isenburg Office
Purchase price: € 16.3 million
Annual rents: € 0.9 million
Gross initial yield: 5.5%
WALT(1): 5.8 years
Transfer of possession: 1 Jan 2020
AachenOffice
Purchase price: € 37.7 million
Annual rents: € 1.9 million
Gross initial yield: 5.1%
WALT(1): 11.2 years
Transfer of possession: 1 Jun 2020
BonnOffice
Purchase price: € 22.8 million
Annual rents: € 1.4 million
Gross initial yield: 5.3%
WALT(1): 11.8 years
Transfer of possession: 14 Feb 2020
(1) As of 30 June 2020
Portfolio development
6H1 2020 | 30 July 2020
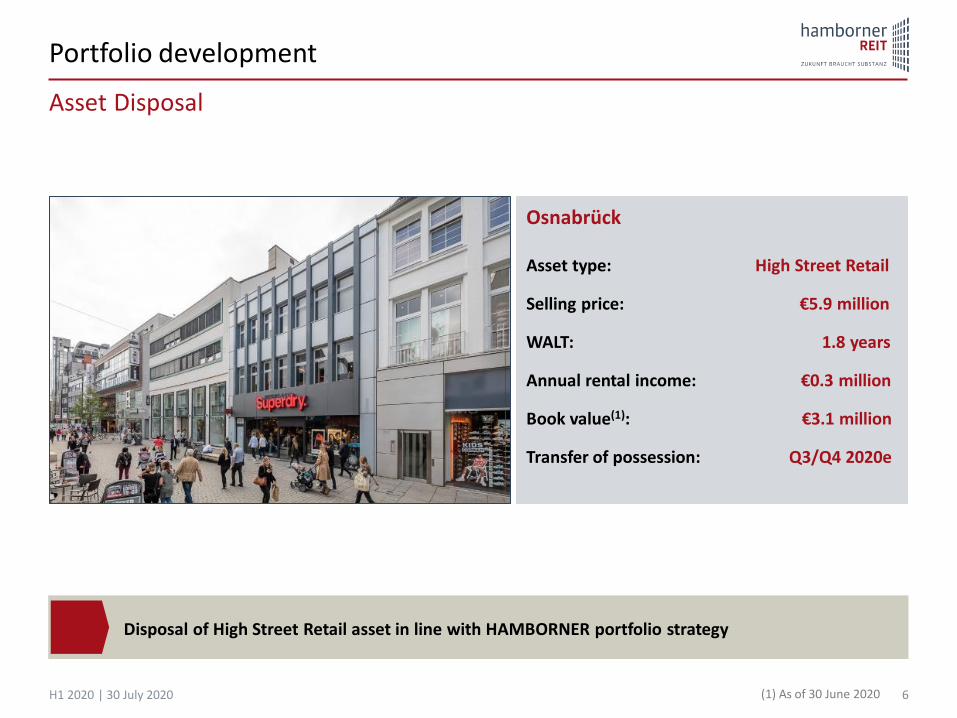
Asset Disposal
Disposal of High Street Retail asset in line with HAMBORNER portfolio strategy
Osnabrück
Asset type: High Street Retail
Selling price: €5.9 million
WALT: 1.8 years
Annual rental income: €0.3 million
Book value(1): €3.1 million
Transfer of possession: Q3/Q4 2020e
(1) As of 30 June 2020

Asset management
7
Tenant structure
H1 2020 | 30 July 2020
Top 10 tenants (as of 30 June 2020)
Tenant Sector Rent(1)
EDEKA Food retail 11.5%
Kaufland Food retail 5.7%
REWE Food retail 5.3%
Real Food retail 5.2%
OBI DIY store 4.8%
Jobcenter Agency of unemployment 3.1%
Barmer Insurance 2.2%
NetCologne IT/Communication 2.0%
Globus DIY store 1.9%
C&A Textile retail 1.5%
Total 43.3%
Food
IT/Communication
Textile
DIY
Finance/Insurance
Real Estate
Drug stores
Authorities
Medical/Pharma
Education
Others (<3%)
Retail Office Other spaces
Sector distribution (as of 30 June 2020)
Sector Rent(1)
(1) % of annualized rents (incl. rent guarantees)
32.4 %
10.0%
9.4%
7.9%
6.8%
4.2%
4.1%
4.0%
3.8%
3.1%
14.3%
HAMBORNER benefits from high share of tenants (approx. 50% of annualized rents) with strong financial profiles and operations in systemically relevant sectors (especially food retail)
8
Asset management
H1 2020 | 30 July 2020
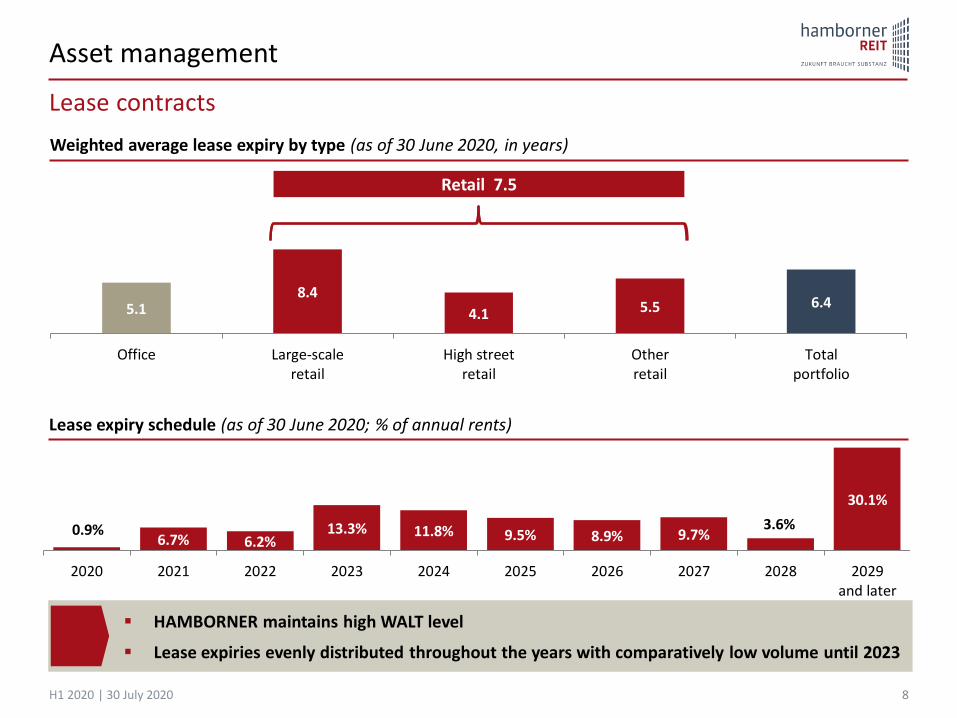
Lease expiry schedule (as of 30 June 2020; % of annual rents)
Weighted average lease expiry by type (as of 30 June 2020, in years)
5.18.4
4.1 5.5 6.4
Office Large-scaleretail
High streetretail
Otherretail
Totalportfolio
Retail 7.5
0.9%6.7% 6.2%
13.3% 11.8% 9.5% 8.9% 9.7%3.6%
30.1%
2020 2021 2022 2023 2024 2025 2026 2027 2028 2029and later
Lease contracts
▪ HAMBORNER maintains high WALT level
▪ Lease expiries evenly distributed throughout the years with comparatively low volume until 2023
9H1 2020 | 30 July 2020
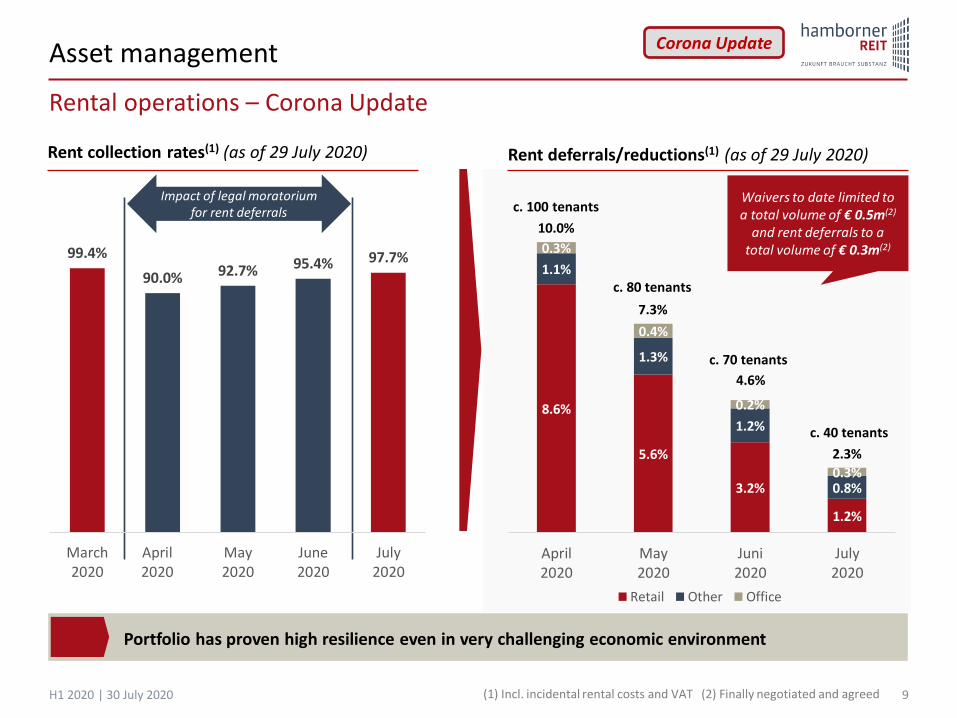
Rent collection rates(1) (as of 29 July 2020)
Asset management
Rental operations – Corona Update
Impact of legal moratorium for rent deferrals
Corona Update
99.4%
90.0% 92.7% 95.4% 97.7%
March2020
April2020
May2020
June2020
July2020
8.6%
5.6%
3.2%
1.2%
1.1%
1.3%
1.2%
0.8%
0.3%
0.4%
0.2%
0.3%
April2020
May2020
Juni2020
July2020
Retail Other Office
Rent deferrals/reductions(1) (as of 29 July 2020)
10.0%
7.3%
4.6%
c. 80 tenants
c. 70 tenants
2.3%
c. 40 tenants
Portfolio has proven high resilience even in very challenging economic environment
Waivers to date limited to a total volume of € 0.5m(2)
and rent deferrals to a total volume of € 0.3m(2)
c. 100 tenants
(1) Incl. incidental rental costs and VAT (2) Finally negotiated and agreed
H1 2020 | 30 July 2020 10
Rental operations – Corona Update
Asset management
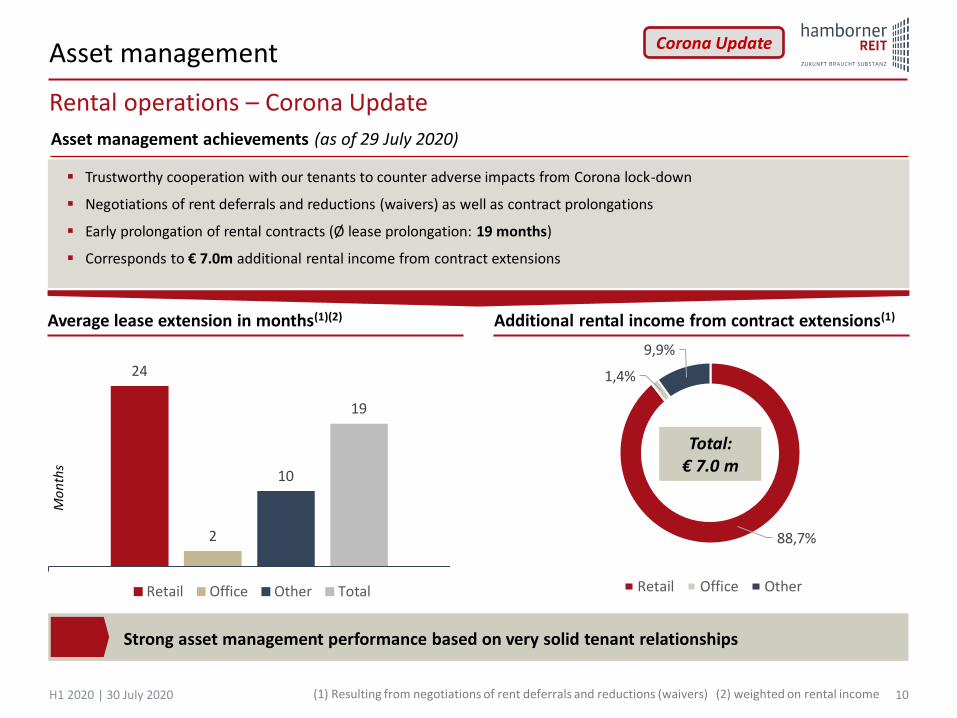
Strong asset management performance based on very solid tenant relationships
▪ Trustworthy cooperation with our tenants to counter adverse impacts from Corona lock-down
▪ Negotiations of rent deferrals and reductions (waivers) as well as contract prolongations
▪ Early prolongation of rental contracts (Ø lease prolongation: 19 months)
▪ Corresponds to € 7.0m additional rental income from contract extensions
Corona Update
Asset management achievements (as of 29 July 2020)
24
2
10
19
Category 1Retail Office Other Total
Average lease extension in months(1)(2) Additional rental income from contract extensions(1)
Mo
nth
s
88,7%
1,4%
9,9%
Retail Office Other
Total: € 7.0 m
(1) Resulting from negotiations of rent deferrals and reductions (waivers) (2) weighted on rental income
Funds from Operations (FFO)
11
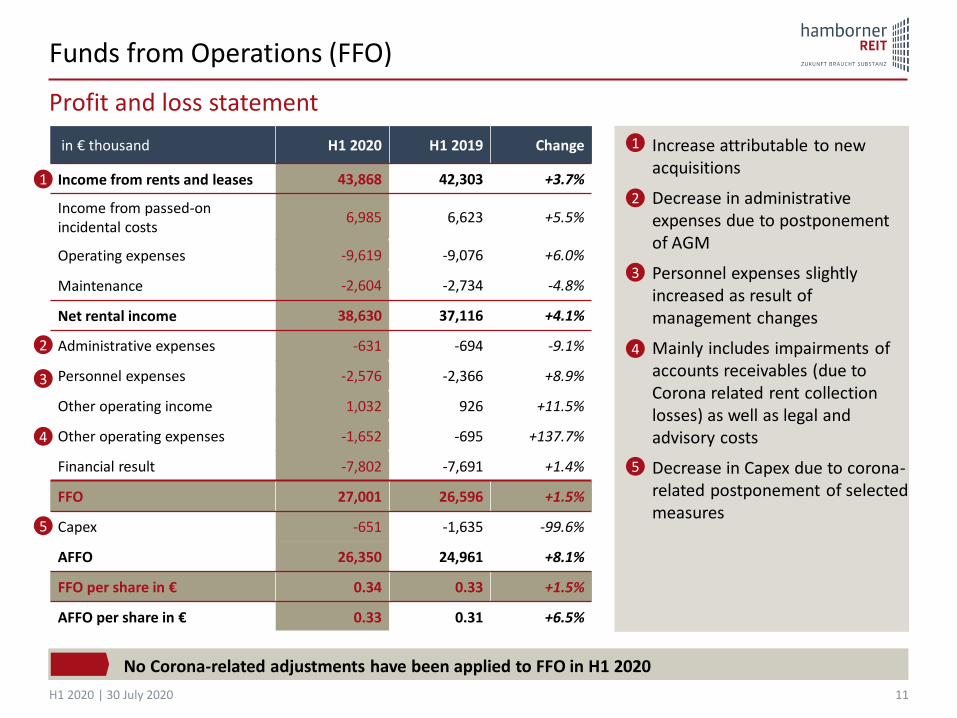
in € thousand H1 2020 H1 2019 Change
Income from rents and leases 43,868 42,303 +3.7%
Income from passed-on incidental costs
6,985 6,623 +5.5%
Operating expenses -9,619 -9,076 +6.0%
Maintenance -2,604 -2,734 -4.8%
Net rental income 38,630 37,116 +4.1%
Administrative expenses -631 -694 -9.1%
Personnel expenses -2,576 -2,366 +8.9%
Other operating income 1,032 926 +11.5%
Other operating expenses -1,652 -695 +137.7%
Financial result -7,802 -7,691 +1.4%
FFO 27,001 26,596 +1.5%
Capex -651 -1,635 -99.6%
AFFO 26,350 24,961 +8.1%
FFO per share in € 0.34 0.33 +1.5%
AFFO per share in € 0.33 0.31 +6.5%
H1 2020 | 30 July 2020
▪ Increase attributable to new acquisitions
▪ Decrease in administrative expenses due to postponement of AGM
▪ Personnel expenses slightly increased as result of management changes
▪ Mainly includes impairments of accounts receivables (due to Corona related rent collection losses) as well as legal and advisory costs
▪ Decrease in Capex due to corona-related postponement of selected measures
Profit and loss statement
1
1
3
2
454
3
42
4
5
No Corona-related adjustments have been applied to FFO in H1 2020
Net Asset Value (NAV)
12
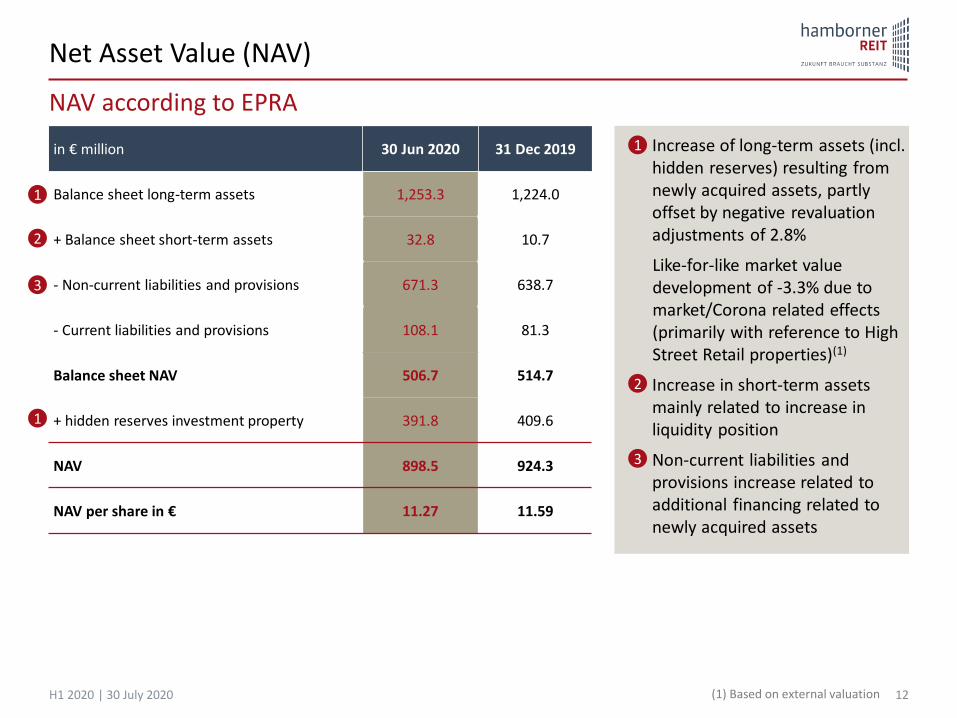
in € million 30 Jun 2020 31 Dec 2019
Balance sheet long-term assets 1,253.3 1,224.0
+ Balance sheet short-term assets 32.8 10.7
- Non-current liabilities and provisions 671.3 638.7
- Current liabilities and provisions 108.1 81.3
Balance sheet NAV 506.7 514.7
+ hidden reserves investment property 391.8 409.6
NAV 898.5 924.3
NAV per share in € 11.27 11.59
H1 2020 | 30 July 2020
NAV according to EPRA
▪ Increase of long-term assets (incl. hidden reserves) resulting from newly acquired assets, partly offset by negative revaluation adjustments of 2.8%
Like-for-like market value development of -3.3% due to market/Corona related effects (primarily with reference to High Street Retail properties)(1)
▪ Increase in short-term assets mainly related to increase in liquidity position
▪ Non-current liabilities and provisions increase related to additional financing related to newly acquired assets
2
1
1
2
3
3
1
(1) Based on external valuation

Balance sheet
13
IFRS
H1 2020 | 30 July 2020
ASSETS € million
30 June 2020
31 Dec 2019
Change
Non-current assets 1,253.3 1,224.0 -0.9%
Investment Properties 1,247.9 1,202.7 +3.8%
Other 5.4 21.3 -74.6%
Current assets 32.8 10.7 +207.3
Trade receivables and other assets 4.2 2.3 +80.0%
Cash and cash equivalents 28.6 8.4 +242.7%
Non-current assets held for sale 0 0
Total assets 1,286.1 1,234.7 +4.2%
Equity and Liabilities € million
30 June 2020
31 Dec 2019
Change
Equity 505.9 513.6 -1.5%
Financial liabilities & derivative instruments 733.4 689.5 +6.4%
Other liabilities and provisions 46.8 31.6 +48.1%
Total equity and liabilities 1,286.1 1234.7 +4.2%
▪ Corona related revaluation adjustment of investment properties offset by inclusion of newly acquired assets in Aachen, Bonn and Neu-Isenburg
▪ Increase due to Corona related rent arrears
▪ Significant increase of liquidity resulting from refinancing and operating cash flow generation. Currently additional undrawn financing facilities of approx. € 50 million available
1
1
2
2
3
3
Financial situation
14H1 2020 | 30 July 2020
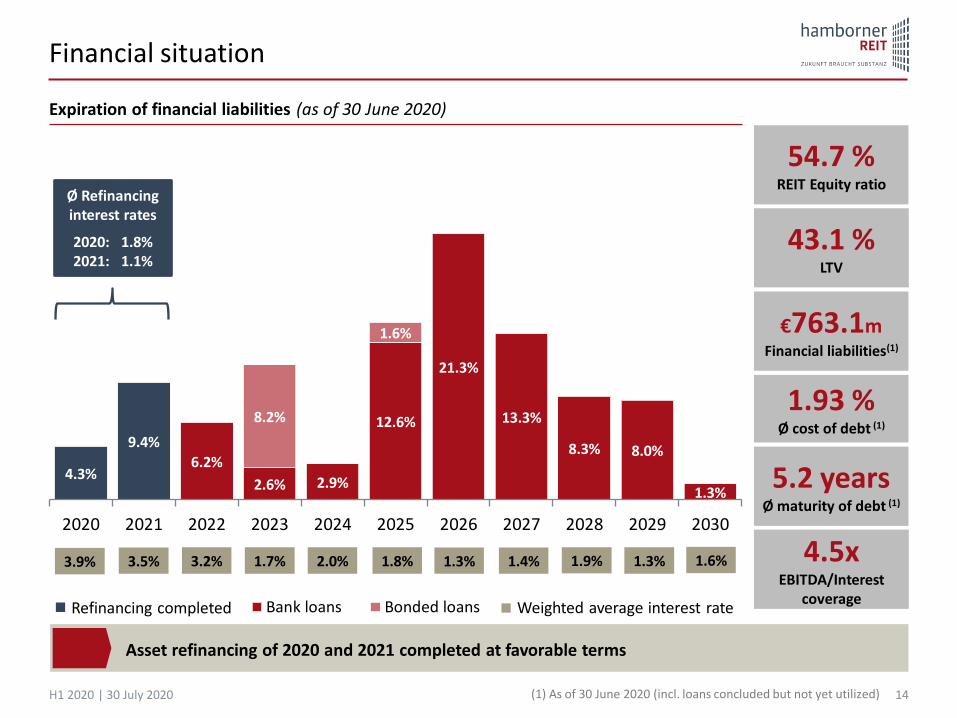
4.3%
9.4%
6.2%
2.6% 2.9%
12.6%
21.3%
13.3%
8.3% 8.0%
1.3%
8.2%
1.6%
2020 2021 2022 2023 2024 2025 2026 2027 2028 2029 2030
Bank loans Bonded loans
Expiration of financial liabilities (as of 30 June 2020)
Ø Refinancing interest rates
2020: 1.8%2021: 1.1%
1.93 %Ø cost of debt (1)
5.2 yearsØ maturity of debt (1)
€763.1mFinancial liabilities(1)
54.7 %REIT Equity ratio
43.1 %LTV
Weighted average interest rate
3.9% 3.5% 3.2% 1.7% 2.0% 1.8% 1.3% 1.4% 1.3%1.9% 1.6% 4.5xEBITDA/Interest
coverage
Asset refinancing of 2020 and 2021 completed at favorable terms
Refinancing completed
(1) As of 30 June 2020 (incl. loans concluded but not yet utilized)
Guidance and outlook
15H1 2020 | 30 July 2020
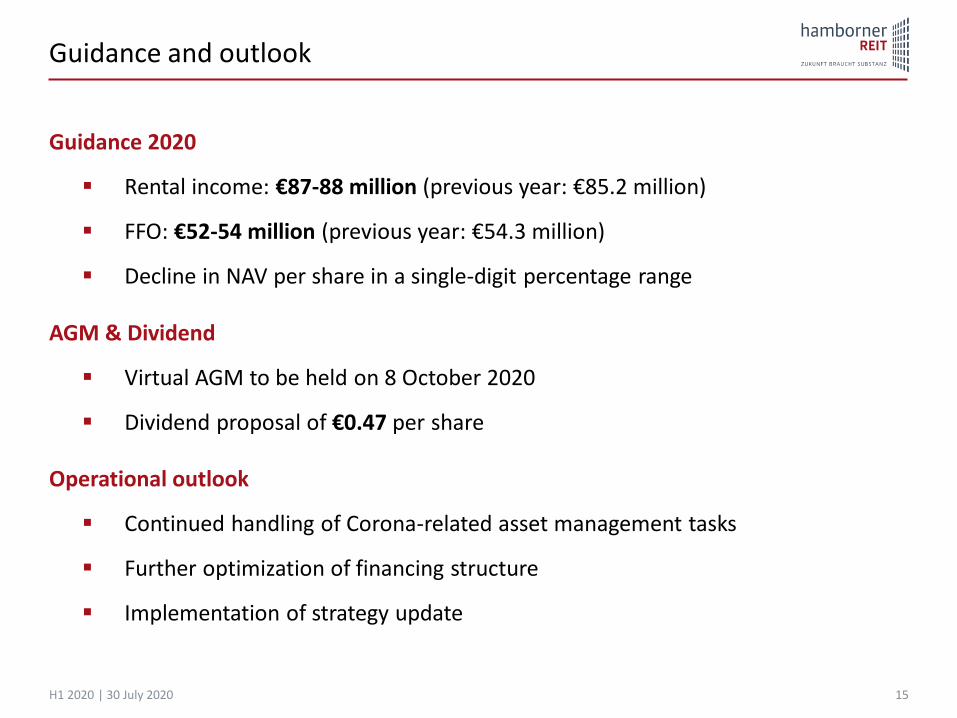
Guidance 2020
▪ Rental income: €87-88 million (previous year: €85.2 million)
▪ FFO: €52-54 million (previous year: €54.3 million)
▪ Decline in NAV per share in a single-digit percentage range
AGM & Dividend
▪ Virtual AGM to be held on 8 October 2020
▪ Dividend proposal of €0.47 per share
Operational outlook
▪ Continued handling of Corona-related asset management tasks
▪ Further optimization of financing structure
▪ Implementation of strategy update
Agenda
H1 2020 | 30 July 2020
1 Update on H1 2020 performance
16
2 Strategy update
Portfolio strategy – Target “two-pillar” portfolio structure
17H1 2020 | 30 July 2020
Office Retail
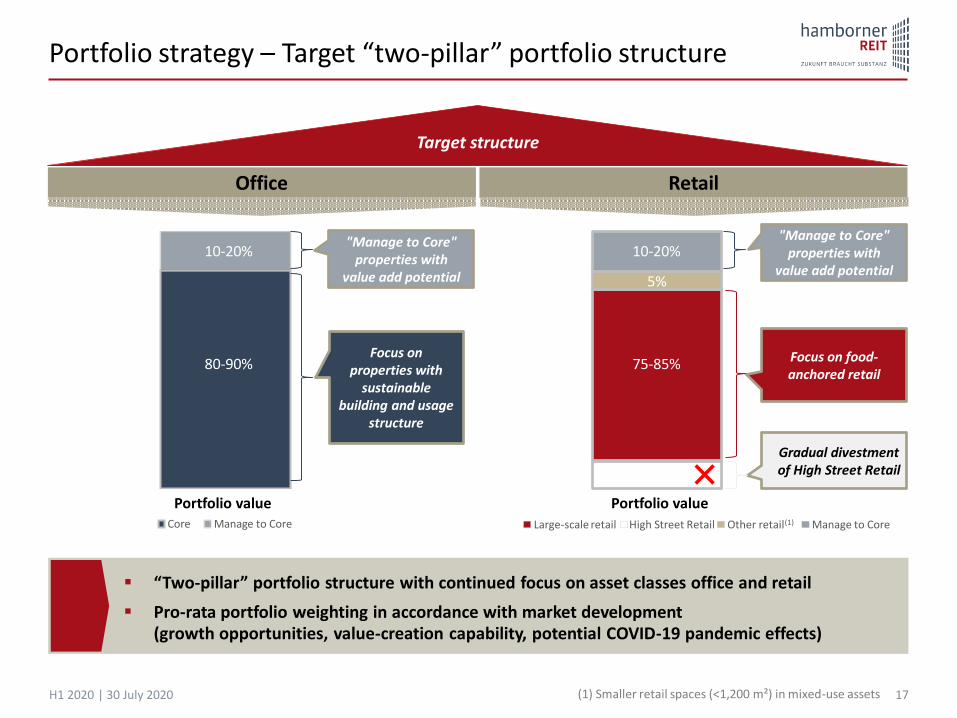
▪ “Two-pillar” portfolio structure with continued focus on asset classes office and retail
▪ Pro-rata portfolio weighting in accordance with market development (growth opportunities, value-creation capability, potential COVID-19 pandemic effects)
Target structure
Core Manage to Core
Focus on food-anchored retail
Gradual divestment of High Street Retail
Focus on properties with
sustainable building and usage
structure
"Manage to Core" properties with
value add potential
10-20%
80-90%
Portfolio value Portfolio value
"Manage to Core" properties with
value add potential
Large-scale retail High Street Retail Other retail(1) Manage to Core
10-20%
75-85%
5%
(1) Smaller retail spaces (<1,200 m²) in mixed-use assets
Portfolio strategy – Updated investment approach
18H1 2020 | 30 July 2020
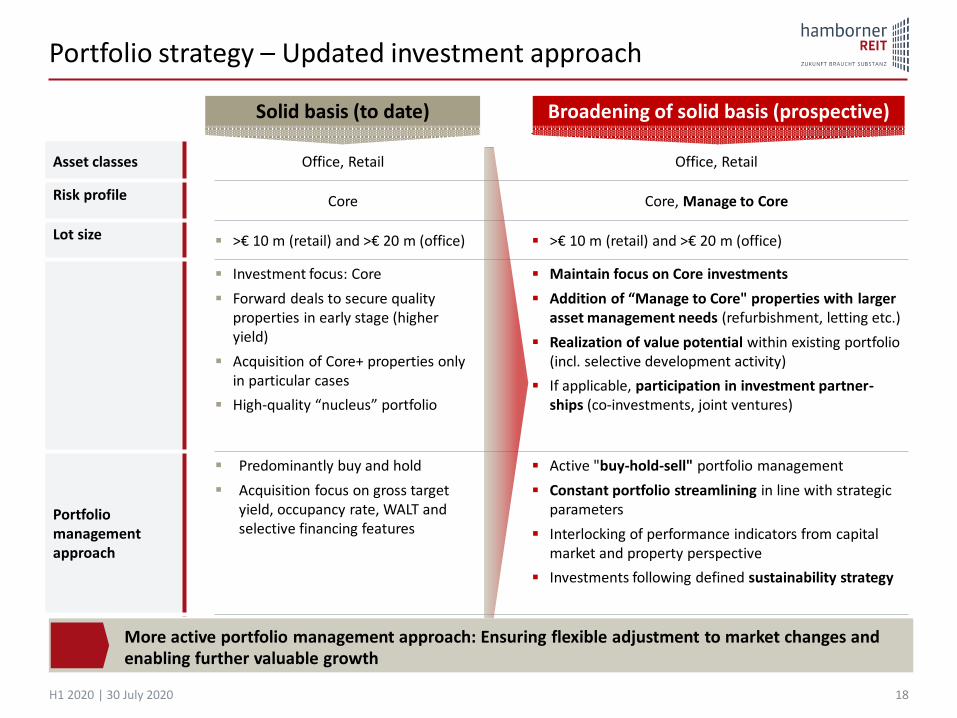
Asset classes Office, Retail Office, Retail
Risk profile Core Core, Manage to Core
Lot size▪ >€ 10 m (retail) and >€ 20 m (office) ▪ >€ 10 m (retail) and >€ 20 m (office)
▪ Investment focus: Core
▪ Forward deals to secure quality properties in early stage (higher yield)
▪ Acquisition of Core+ properties only in particular cases
▪ High-quality “nucleus” portfolio
▪ Maintain focus on Core investments
▪ Addition of “Manage to Core" properties with largerasset management needs (refurbishment, letting etc.)
▪ Realization of value potential within existing portfolio (incl. selective development activity)
▪ If applicable, participation in investment partner-ships (co-investments, joint ventures)
Portfolio management approach
▪ Predominantly buy and hold
▪ Acquisition focus on gross target yield, occupancy rate, WALT and selective financing features
▪ Active "buy-hold-sell" portfolio management
▪ Constant portfolio streamlining in line with strategic parameters
▪ Interlocking of performance indicators from capital market and property perspective
▪ Investments following defined sustainability strategy
Solid basis (to date) Broadening of solid basis (prospective)
More active portfolio management approach: Ensuring flexible adjustment to market changes and enabling further valuable growth
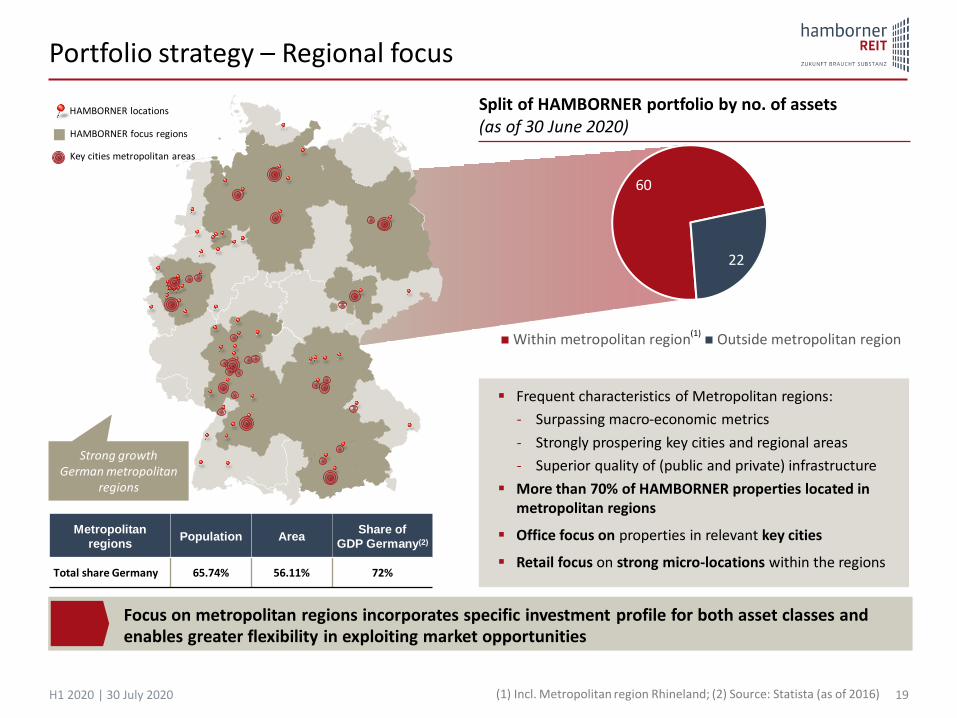
Split of HAMBORNER portfolio by no. of assets(as of 30 June 2020)
Portfolio strategy – Regional focus
19H1 2020 | 30 July 2020
Metropolitan
regionsPopulation Area
Share of
GDP Germany(2)
Total share Germany 65.74% 56.11% 72%
HAMBORNER locations
HAMBORNER focus regions
Focus on metropolitan regions incorporates specific investment profile for both asset classes and enables greater flexibility in exploiting market opportunities
(1)
▪ Frequent characteristics of Metropolitan regions:
- Surpassing macro-economic metrics
- Strongly prospering key cities and regional areas
- Superior quality of (public and private) infrastructure
▪ More than 70% of HAMBORNER properties located in metropolitan regions
▪ Office focus on properties in relevant key cities
▪ Retail focus on strong micro-locations within the regions
Strong growth German metropolitan
regions
Key cities metropolitan areas
60
22
Within metropolitan region Outside metropolitan region
(1) Incl. Metropolitan region Rhineland; (2) Source: Statista (as of 2016)
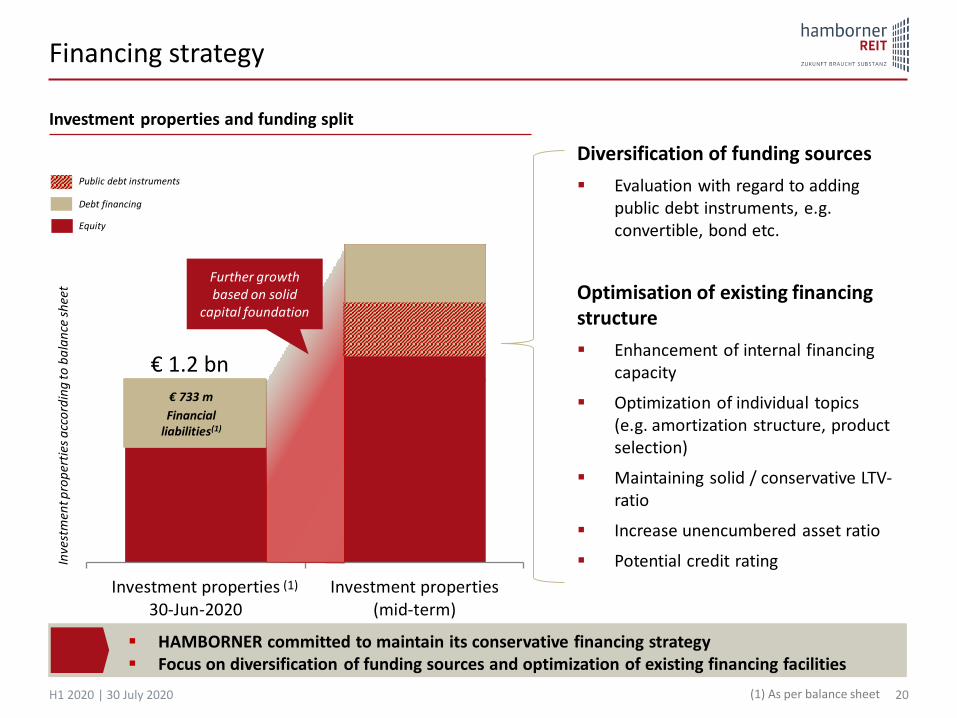
Investment properties30-Jun-2020
Investment properties(mid-term)
Financing strategy
20H1 2020 | 30 July 2020
▪ HAMBORNER committed to maintain its conservative financing strategy▪ Focus on diversification of funding sources and optimization of existing financing facilities
Investment properties and funding split
€ 733 m
Financial liabilities(1)
Diversification of funding sources
▪ Evaluation with regard to adding public debt instruments, e.g. convertible, bond etc.
Optimisation of existing financing structure
▪ Enhancement of internal financing capacity
▪ Optimization of individual topics (e.g. amortization structure, product selection)
▪ Maintaining solid / conservative LTV-ratio
▪ Increase unencumbered asset ratio
▪ Potential credit rating
€ 1.2 bn
Debt financing
Equity
Further growth based on solid
capital foundation
Inve
stm
ent p
rop
erti
es a
cco
rdin
g to
ba
lan
ce s
hee
t
(1)
Public debt instruments
(1) As per balance sheet

Dividend strategy
21H1 2020 | 30 July 2020
Modified dividend strategy: Linked to the development of total return and aligned with overall strategy as well as prevailing market environment
Approach
▪ Increased focus on total return concept▪ Alignment of dividend amount with corporate strategy and market environment▪ Contemplation to offer scrip dividend to shareholders in the future▪ Enhancement of internal financing capability to enable additional accretive growth
Total return concept
Commitment ▪ HAMBORNER committed to pay attractive and sustainable dividend
Going forward
NAV growth Dividends Total return
+ =
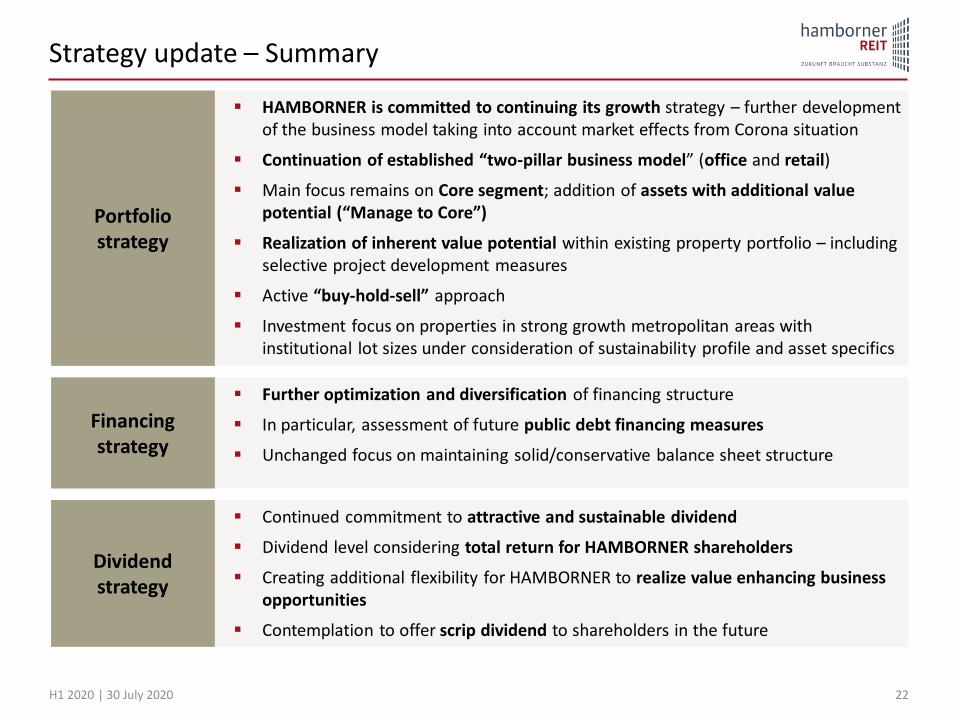
Strategy update – Summary
22H1 2020 | 30 July 2020
Portfolio strategy
▪ HAMBORNER is committed to continuing its growth strategy – further development of the business model taking into account market effects from Corona situation
▪ Continuation of established “two-pillar business model” (office and retail)
▪ Main focus remains on Core segment; addition of assets with additional value potential (“Manage to Core”)
▪ Realization of inherent value potential within existing property portfolio – including selective project development measures
▪ Active “buy-hold-sell” approach
▪ Investment focus on properties in strong growth metropolitan areas with institutional lot sizes under consideration of sustainability profile and asset specifics
Financing strategy
▪ Further optimization and diversification of financing structure
▪ In particular, assessment of future public debt financing measures
▪ Unchanged focus on maintaining solid/conservative balance sheet structure
Dividend strategy
▪ Continued commitment to attractive and sustainable dividend
▪ Dividend level considering total return for HAMBORNER shareholders
▪ Creating additional flexibility for HAMBORNER to realize value enhancing business opportunities
▪ Contemplation to offer scrip dividend to shareholders in the future
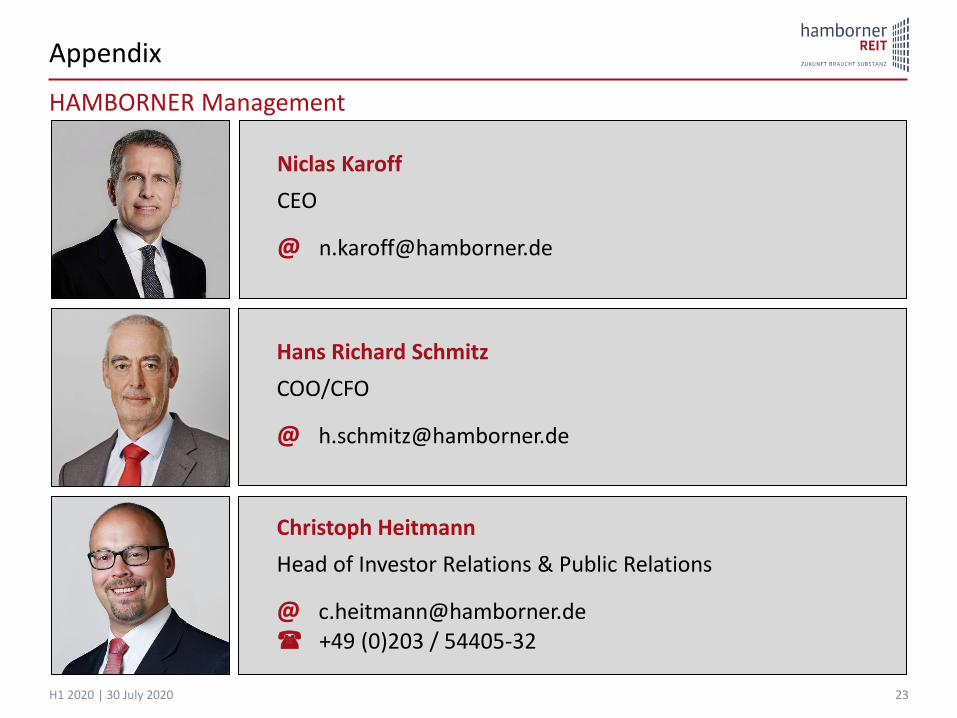
Appendix
23H1 2020 | 30 July 2020
Hans Richard Schmitz
COO/CFO
Christoph Heitmann
Head of Investor Relations & Public Relations
@ [email protected] +49 (0)203 / 54405-32
Niclas Karoff
CEO
HAMBORNER Management

24H1 2020 | 30 July 2020
HAMBORNER REIT AG - Financial Calendar
Quarterly financial statement Q3 2020 11 November 2020
Preliminary figures 2020 4 February 2021
Annual report 2020 17 March 2021
Quarterly financial statement Q1 2021 27 April 2021
Appendix
Financial Calendar
Disclaimer
25
This presentation was exclusively prepared for the addresses specified on the title page and/or the participants at the mentioned event.The information in this presentation is based on both public information and documents as well as information which was made available toHAMBORNER REIT AG by the respectively mentioned companies and third parties.
All statements, opinions and assessments contained in this presentation correspond to the current estimates and/or opinions of HAMBORNERREIT AG and may therefore not be construed as constant, immutable statements. HAMBORNER gives no guarantee with regard to thecorrectness or completeness of the information contained herein. HAMBORNER and its organs, boards, employees or other parties acting onbehalf of HAMBORNER accept no liability whatsoever for the statements made in this presentation.
H1 2020 | 30 July 2020