Embed Size (px)
Citation preview
ISSN 1725–2237
EEA Technical report No 11/2007
Halting the loss of biodiversity by 2010: proposal for a first set of indicators to monitor progress in Europe

EEA Technical report No 11/2007
Halting the loss of biodiversity by 2010: proposal for a first set of indicators to monitor progress in Europe
Cover design: EEALayout: EEA
Legal notice The contents of this publication do not necessarily reflect the official opinions of the European Commission or other institutions of the European Communities. Neither the European Environment Agency nor any person or company acting on behalf of the Agency is responsible for the use that may be made of the information contained in this report.
All rights reserved No part of this publication may be reproduced in any form or by any means electronic or mechanical, including photocopying, recording or by any information storage retrieval system, without the permission in writing from the copyright holder. For translation or reproduction rights please contact EEA (address information below).
Information about the European Union is available on the Internet. It can be accessed through the Europa server (www.europa.eu).
Luxembourg: Office for Official Publications of the European Communities, 2007
ISBN 978-92-9167-931-7ISSN 1725-2237
© EEA, Copenhagen, 2007
European Environment AgencyKongens Nytorv 61050 Copenhagen KDenmarkTel.: +45 33 36 71 00Fax: +45 33 36 71 99Web: eea.europa.euEnquiries: eea.europa.eu/enquiries
3
Contents
Halting the loss of biodiversity by 2010: proposal for a first set of indicators to monitor progress in Europe
Contents
Acknowledgements ................................................................................................... 4
Foreword ................................................................................................................... 5
PART I
1 The 2010 target, the SEBI 2010 process and the first set of European biodiversity indicators .......................................................................................... 7
1.1 Introduction ................................................................................................... 71.2 Biodiversity loss............................................................................................... 71.3 International responses to biodiversity loss ......................................................... 9
2 SEBI 2010 — Streamlining European 2010 Biodiversity Indicators ..................... 12
2.1 Indicators to monitor and help achieve progress to 2010 ......................................122.2 The origins of SEBI 2010 ................................................................................142.3 SEBI 2010: organisation and process ................................................................162.4 Outcomes: the first set ....................................................................................17
3 First discussion of the SEBI 2010 set of indicators ............................................. 21
3.1 The indicators as a set .....................................................................................213.2 Summary discussion of individual indicators .......................................................213.3 Streamlining opportunities offered by the set ......................................................273.4 Future development of the set .........................................................................27
Annex: SEBI 2010 Coordination Team and Expert Groups ....................................... 31
References and further reading ............................................................................... 35
Abbreviations and acronyms ................................................................................... 37
PART II
Technical specifications of the 26 indicators .......................................................... 39
4
Acknowledgements
Halting the loss of biodiversity by 2010: proposal for a first set of indicators to monitor progress in Europe
Acknowledgements
The results of Phase 1 of the Streamlining European 2010 Biodiversity Indicators (SEBI 2010) project have been achieved thanks to the work of all experts and reviewers involved. The annex to this report lists members of the Coordination Team, the Expert Groups and the participants in the November 2006 workshop, which constituted the first broad discussion of the candidate indicators for the first set at that stage.
Our thanks also go to experts and colleagues who have informally contributed to the process, through their advice and comments.
The project and production of this report were managed by Rania Spyropoulou and Frederik Schutyser under supervision of Ivone Pereira Martins, Head of the EEA's Biodiversity and Ecosystems group, Jock Martin, Head of the EEA Programme on
Biodiversity, Spatial Analysis and Scenarios and Gordon McInnes, SEBI 2010 Coordinator. The report was based on a first draft by Lawrence Jones-Walters of ECNC. Valuable input and comments were provided by Ben ten Brink and others in the drafting team. Eva Carlson and Vibeke Horlyck provided expert organisational support in the early stages of SEBI 2010. Later, Joanna Karlsen ensured the smooth organisation of all meetings and provided invaluable editorial help in the production of this report.
Finally, the draft report was subject to a wide consultation process through an online commenting tool, hosted on the EC Biodiversity Clearing House Mechanism. Comments could be posted from 20 April until 25 May 2007. More than 250 comments were received and were addressed as far as possible. The comments significantly improved the first draft of the report.
5
Foreword
Halting the loss of biodiversity by 2010: proposal for a first set of indicators to monitor progress in Europe
Foreword
This report documents the achievements of the first phase (2005–2007) of the Streamlining European 2010 Biodiversity Indicators (SEBI 2010) project on the development of indicators to monitor progress towards, and help achieve the European target to halt the loss of biodiversity by 2010.
Human actions are fundamentally, and, to a significant extent irreversibly, changing the diversity of life on Earth. Most ecosystems and the biodiversity contained within them have become exposed to multiple pressures, such as habitat destruction, pollution, overexploitation and climate change. In 2005, the Millennium Ecosystem Assessment illustrated the severe global impacts that our lifestyles have had over the last 50 years on ecosystems and their ability to deliver the goods and services on which societies and economies depend. The EU-27 share of the world's ecological footprint (i.e. a measure of how much biologically productive land and water area is required to produce all the biological resources the world consumes and to absorb the waste it generates) is more than twice its share of the global population.
Europe is a huge, diverse region and the relative importance of different threats varies widely across its bio-geographic regions and countries. Perhaps more than in any other continent, the diversity of Europe's species greatly depends on man-made landscapes and extensive, small-scale agricultural land use. Remarkably few areas of even the highest conservation value are truly natural today. Therefore, the continuation of traditional methods of land management is essential for the survival of many species.
The 2010 target has brought together many actors involved in biodiversity policy, monitoring and research in Europe to work on the development of a common assessment framework based on indicators. Having been privileged to receive the steering role for the SEBI 2010 project, the EEA has, in this first phase, observed the major progress made towards achieving consensus on the indicator framework, analytical methods and quality assured data flows. Therefore, I would like to take this opportunity to thank all those involved in the work so far, especially the SEBI 2010 Coordination Team and Expert Groups, and those NGOs who under difficult financial circumstances continue to deliver excellent
quality-assured data flows on many species of priority interest in Europe.
The set of indicators documented in this report is not intended to be comprehensive. Nevertheless, it constitutes a first set with which to monitor progress towards 2010. Some of the indicators directly track the impact on a component of biodiversity, whereas others reflect threats to biodiversity, its sustainable use and integrity. And the set as a whole can be used to help assess the effect of various sectors and sectoral policies on biodiversity.
Different combinations of indicators facilitate different views, which can be used to answer key policy questions, such as: What is the current status? What are the causes? Why is it important? What action can be taken? The relationship between the messages from the different indicators is naturally complex, but careful assessment will afford policy makers insight into where efforts should be concentrated or existing policies changed.
The SEBI 2010 indicators can also complement other sets of indicators designed to assess progress in other policy sectors (e.g. agriculture, forestry, poverty reduction, health, trade and sustainable development as well as those describing the abiotic environment) and utilise indicators from existing sets. By doing this, existing resources can be used more efficiently and space can hopefully be created for effective investment in new dataflows and analytical methods.
We would like to encourage critical study of the proposed indicators, methods and dataflows and hope that you will provide us with constructive feedback or suggestions for further improvements. Please submit your comments via e-mail to [email protected].
It is hoped that through the publication of this report and associated activities, the SEBI 2010 process can help bring about increased investment and improve the evidence base for assessing progress towards the 2010 target. The monitoring, conservation and assessment of biodiversity depend to a much greater degree on NGO activities than other environmental issues. Also, funding for biodiversity monitoring substantially lags behind investments made by countries in other environmental issues, such as air and water quality and atmospheric emissions. Yet
6
Foreword
Halting the loss of biodiversity by 2010: proposal for a first set of indicators to monitor progress in Europe
biodiversity is arguably as important as climate change for future policy action.
At the same time, not all actions require major additional investment in order for improvements to be made. Improved collaboration and coordination between the vast array of actors and existing data and methodologies is one way forward. And we have already seen the greater levels of efficiency reached during this phase of SEBI 2010 by tapping into on-going activities in other sectors. I believe that much more is yet to come from future phases.
Having a common approach towards habitats classification, for example, requires both a policy and scientific consensus across Europe, not new investments in research. Improvements in species data can be realised through better organisation and interoperability of databases as well as agreements with data custodians on data access and use. Many methodologies have been developed under national and EU research programmes but have still not reached their potential. Either they have not been applied fully due to shortcomings in data availability or there has been a lack of consensus on a particular method's application.
Four methodological areas where methods either exist or are currently being developed deserve particular attention due to their pertinence to future phases of SEBI 2010: accounting for the physical stocks and flows of ecosystem goods and services; the valuation of ecosystem goods and services; biodiversity and climate change impacts and adaptation links; and, modelling future trends for biodiversity and ecosystems in Europe and in the global context.
Action, however, is not entirely cost-free, but well worth the investments needed as it can provide a long-term, sustainable evidence base for biodiversity policy. The EEA stands ready to play its part and contribute to the shared system through SEBI 2010 and other initiatives. Moreover, it looks forward to engaging in future work with the EU as well as PEBLDS and their member countries and putting in place the requisite 'soft' policies needed to underpin the implementation of a successful shared information system which fully reflects biodiversity needs.
Professor Jacqueline McGlade Executive Director
European Environment Agency
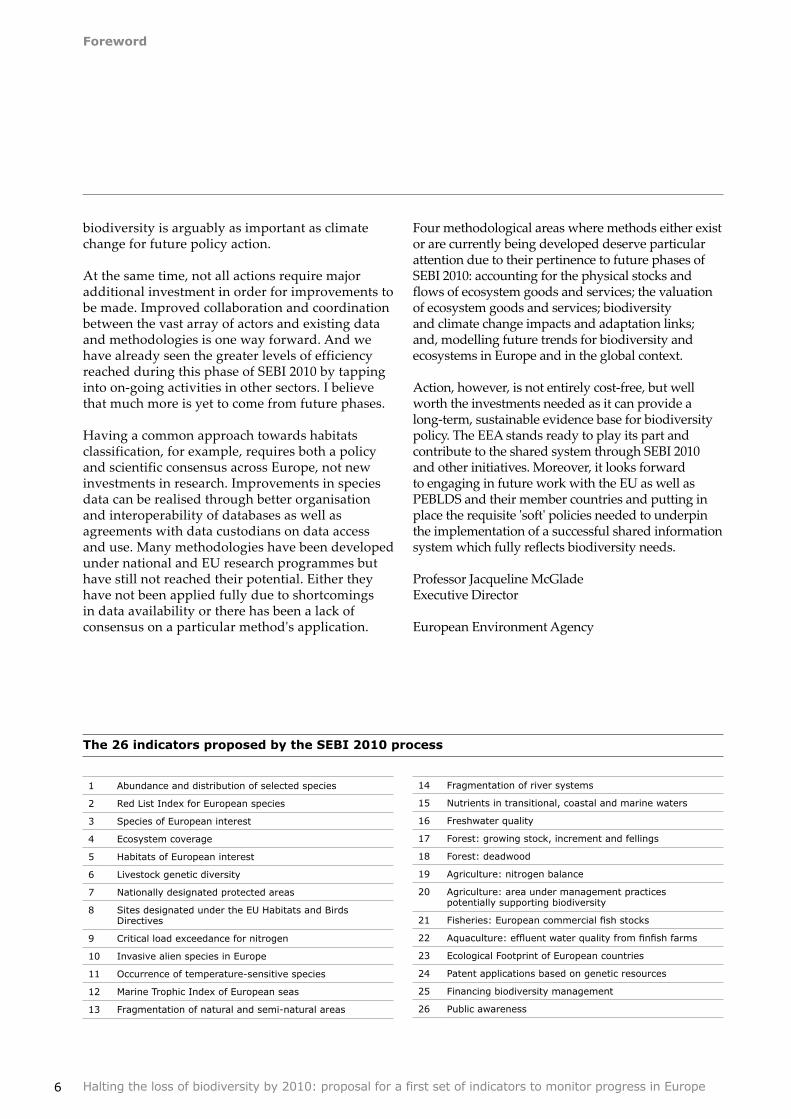
The 26 indicators proposed by the SEBI 2010 process
1 Abundance and distribution of selected species
2 Red List Index for European species
3 Species of European interest
4 Ecosystem coverage
5 Habitats of European interest
6 Livestock genetic diversity
7 Nationally designated protected areas
8 Sites designated under the EU Habitats and Birds Directives
9 Critical load exceedance for nitrogen
10 Invasive alien species in Europe
11 Occurrence of temperature-sensitive species
12 Marine Trophic Index of European seas
13 Fragmentation of natural and semi-natural areas
14 Fragmentation of river systems
15 Nutrients in transitional, coastal and marine waters
16 Freshwater quality
17 Forest: growing stock, increment and fellings
18 Forest: deadwood
19 Agriculture: nitrogen balance
20 Agriculture: area under management practices potentially supporting biodiversity
21 Fisheries: European commercial fish stocks
22 Aquaculture: effluent water quality from finfish farms
23 Ecological Footprint of European countries
24 Patent applications based on genetic resources
25 Financing biodiversity management
26 Public awareness
7
The 2010 target, the SEBI 2010 process and the first set of European biodiversity indicators
Halting the loss of biodiversity by 2010: proposal for a first set of indicators to monitor progress in Europe
1 The 2010 target, the SEBI 2010 process and the first set of European biodiversity indicators
1.1 Introduction
This report documents the achievements of the first phase (2005–2007) of the SEBI 2010 project. It shows progress with the development of the SEBI 2010 indicator framework, and comprises two parts.
Part I discusses the following issues:
• Why are biodiversity and biodiversity loss so important, not just for the environment but also for our social and economic well-being?
• How is Europe and the world responding to the challenge of biodiversity loss through policy initiatives (namely the targets to reduce/halt loss by 2010)?
• How did the SEBI 2010 process evolve in the first phase towards an agreed set of indicators?
Finally, it summarises the challenges of making the indicators proposed within SEBI 2010 a high quality, operational set in future phases.
Part II (available on-line only) provides detailed, technical specifications of the 26 proposed indicators. These follow a consistent template based on criteria used by for example the EEA and OECD for establishing their respective core and headline sets of environmental indicators and by the Convention on Biological Diversity (CBD) in its biodiversity indicator work. This criteria-based approach supports consistency and transparency across the set, enables the reader to easily gauge the strengths and weaknesses of each indicator and assess why the approach is the best currently available. In addition, it shows where each indicator lies within its development curve and gives a sense of how the indicators are maturing as a set.
The report not only reinforces the importance of conserving biodiversity and of measuring progress towards achieving the 2010 target, it also proposes a set of currently available indicators, a reliable tool for measuring and helping achieve progress towards the target. In 2008, a broader indicator-based assessment will be developed within the SEBI 2010 process. This will give both a comprehensive analysis of the progress made towards the 2010 target, and indicate where Europe needs to take
further action in order to meet its target. Additional EEA reports will also use the indicators proposed by SEBI 2010. In 2010, the indicators will form the basis of the biodiversity section in the 'The European environment — State and outlook 2005' (SOER), which is produced every five years and covers all EEA member countries. In 2012, when the first data for 2010 become available across Europe, the state of progress relative to the 2010 target will be assessed. The indicators will further contribute to an ecosystem assessment for Europe (planned for 2012). The set will also be used to monitor progress on the biodiversity action plan, annexed to the 2006 European Commission Communication on halting the loss of biodiversity, and to monitor progress in the pan-European region.
1.2 Biodiversity loss
Biodiversity is the variety of life on Earth, covering everything from polar bears to old apple varieties, green algae to the tundra. The protection and careful use of the world's finite resources is central to the idea of sustainable development. Biodiversity is a part of those limited resources and, perhaps more than any other aspect, can inspire and motivate people to act for the environment.
For a technical definition of biodiversity, the 1992 United Nations Convention on Biological Diversity, Article 2 defines 'biological diversity' as: 'the variability among living organisms from all sources including, inter alia, terrestrial, marine and other aquatic ecosystems and the ecological complexes of which they are part; this includes diversity within species, between species and of ecosystems'.
Five major biodiversity extinction events have been recorded in the Earth's history; each of them leading to profound shifts in the life forms on earth. Scientific research suggests we might now be close to a sixth biodiversity crisis, as a result of human activities (Thomas et al., 2004, American Museum of Natural History, 2005). With the exception of the last 1 000 years, global biodiversity has been relatively constant over most of human history, with the estimated magnitude of background rates of extinction at about 0.1–1.0 extinctions per million species per year (Note: these rates may be underestimates as they are largely derived from
The 2010 target, the SEBI 2010 process and the first set of European biodiversity indicators
8 Halting the loss of biodiversity by 2010: proposal for a first set of indicators to monitor progress in Europe
taxa that are abundant and widespread in the fossil record). However, current extinction rates may be much higher. According to information based on recorded extinctions of known species over the past 100 years, extinction rates around 100 times greater than rates characteristic of species in the fossil record have occurred (MA, 2005).
Today, biodiversity loss is due to increasing levels of human activities all over the world. The process is generally characterised by a decrease in abundance of many species due to a variety of pressures (see below). Extinction is the last step of a long degradation process in which countless local extinctions precede final global extinction. Often 'species richness' increases initially due to new invading species or because of fragmentation resulting in many patches and edge habitats. Because some species, either favoured by humans or capable of taking advantage of human-induced changes, are becoming more and more dominant, ecosystems lose their regional specifics and become more and more alike — the homogenisation process (Pauly et al., 1998; ten Brink, 2000, 2007; Lockwood and McKinney, 2001; Meyers and Worm, 2003; Scholes and Biggs, 2005; MA, 2005). Once lost, the same species can never be recreated, and destroyed habitats may take decades before they become re-established.
Biodiversity also underpins the delivery by healthy ecosystems of a wide range of ecosystem 'services' which humans benefit from. The Millennium Ecosystem Assessment (MA, 2003) classified such services as:
• provisioning services, e.g. food;
• regulating services, e.g. water purification;
• cultural services, e.g. recreation;
• supporting services, e.g. nutrient cycling and soil formation.
The Millennium Ecosystem Assessment (MA) recognises both the overlap between some of these categories and the intrinsic value of biodiversity itself. We often take these services for granted and forget that they are all ultimately dependent on the proper functioning of ecosystems in the natural world. This in turn is underpinned by biodiversity. Both the diversity and the identity of the various species fundamentally influence the magnitude and the stability of ecological processes that occur at ecosystem level. Changes in species or habitat diversity also affect the ability of ecosystems to
recover from disturbances, and thus underpin the resilience of ecosystems (e.g. alleviating the impacts of climate change) as well as the human societies that depend on the services provided.
Human actions are fundamentally, and to a significant extent irreversibly, changing the diversity of life on Earth. Most ecosystems and the biodiversity within them have become exposed to multiple pressures, such as habitat destruction, pollution, overexploitation and climate change. Consequently, they may now be on the point of failing or already ceased to provide the quality and quantity of services we have come to expect from them. Loss of ecosystem functions and the services derived from them often occurs long before global extinction (MA, 2005).
Perhaps more than in any other continent, the diversity of Europe's species is to a large extent dependent upon landscapes created by human activity. Europe is a huge, diverse region and the relative importance of different threats varies widely across bio-geographic regions and countries (see Box 1.1 and Table 4.1 in the fourth assessment of Europe's environment — the Belgrade report, EEA, 2007). For centuries, most of Europe's land surface has been used to produce food and timber or provide space for living. Currently, in western Europe, less than one fifth of the surface is not managed directly. Much of this area is under pressure. Almost all biodiversity in western Europe is to a large extent dependent on extensive, small-scale agricultural land use. Remarkably few areas of even the highest conservation value are truly natural. Areas defined by ecologists as 'semi-natural' farmland, forest and grassland habitats are home to many of the continent's most valued species. Therefore, the continuation of traditional methods of land management is essential to the survival and wellbeing of species in these areas.
Europe's high rates of consumption and waste production also impact on biodiversity far beyond its own borders and shores. We use materials from across the globe to feed, clothe, house and transport ourselves. Our waste and water pollution are spread around the world — on the winds, down rivers and via ocean currents. The EU's share of the world's ecological footprint (i.e. a measure of how much biologically productive land and water area is required to produce all the biological resources the world consumes and to absorb the waste it generates) is more than twice its share of the global population. Such calculations are inevitably crude and not without controversy. Nonetheless, they act as a warning about managing
The 2010 target, the SEBI 2010 process and the first set of European biodiversity indicators
9Halting the loss of biodiversity by 2010: proposal for a first set of indicators to monitor progress in Europe
and sharing the planetary resources and ecological services on which we all depend.
1.3 International responses to biodiversity loss
With the signature of the UN Convention on Biological Diversity (CBD) in 1992, concern for biodiversity was awarded a higher political profile. Based on the widespread recognition of biodiversity loss and its significance to society, the international community committed itself to addressing biodiversity loss.
In 1995, a pan-European response to the CBD was provided through the endorsement of the Pan-European Biological and Landscape Diversity Strategy by the more than 50 countries covered by the United Nations Economic Commission for Europe. Being embedded in the ministerial 'Environment for Europe' process, this strategy provided the only platform for pan-European cooperation on tackling biodiversity loss.
In the European Union, the EC Biodiversity Conservation Strategy (ECBS) was adopted in 1998, and provided a comprehensive response to the many requirements of the CBD. The four
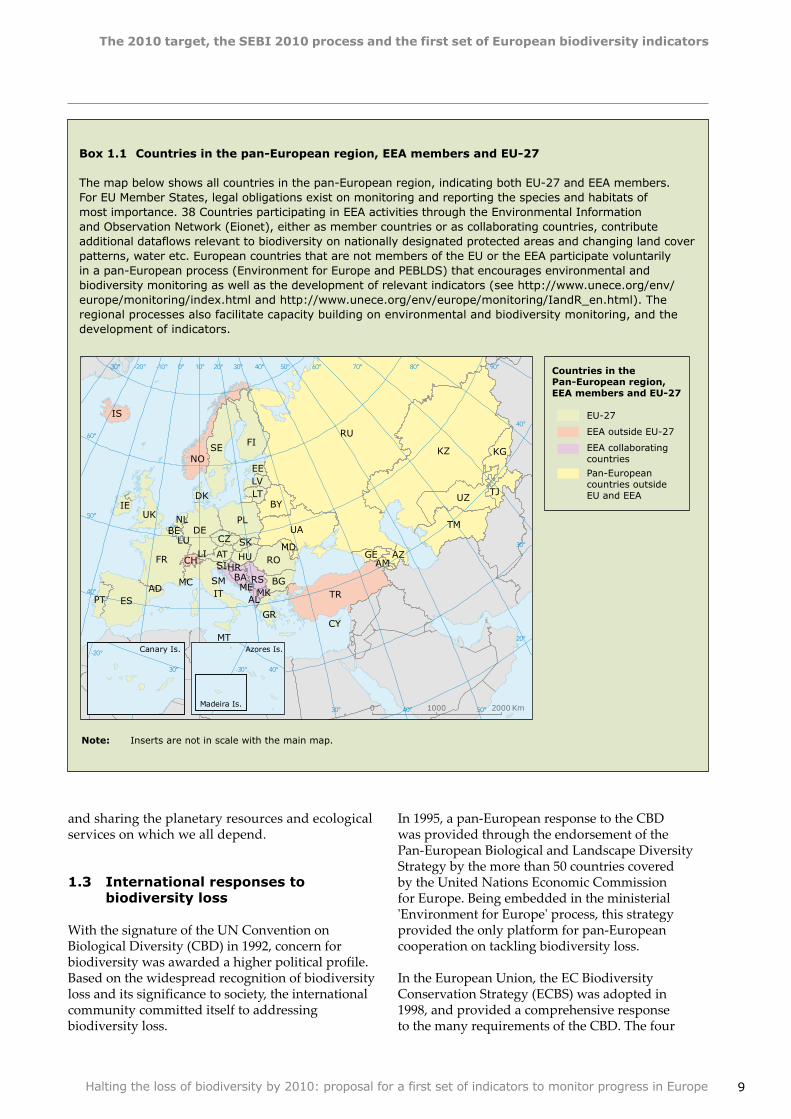
Box 1.1 Countries in the pan-European region, EEA members and EU-27
The map below shows all countries in the pan-European region, indicating both EU-27 and EEA members. For EU Member States, legal obligations exist on monitoring and reporting the species and habitats of most importance. 38 Countries participating in EEA activities through the Environmental Information and Observation Network (Eionet), either as member countries or as collaborating countries, contribute additional dataflows relevant to biodiversity on nationally designated protected areas and changing land cover patterns, water etc. European countries that are not members of the EU or the EEA participate voluntarily in a pan-European process (Environment for Europe and PEBLDS) that encourages environmental and biodiversity monitoring as well as the development of relevant indicators (see http://www.unece.org/env/europe/monitoring/index.html and http://www.unece.org/env/europe/monitoring/IandR_en.html). The regional processes also facilitate capacity building on environmental and biodiversity monitoring, and the development of indicators.
RU
KZ
DZLY
TR
UA
FR
FI
ES
UZ
SE
TM
IT
DEPL
MA
NO
RO
BY
IS
IE
AT
UK
KG
TJ
BG
GR
PT
HU
RS
AZ
LT
CZ
LV
GE
BA
SK
HR
EE
CH
NL
AL
BE
MD
SI AM
DK
MKME
CY
LU
AD
MT
SMMC
90°80°70°60°
50°
50°
40°
40°
30°
30°
20°
20°
10°
10°
0°
0°-10°-20°-30°
50°
60°
40°
40°
30°
30°
20°
-20°
30°
Canary Is.
-30°
-30° 40°
Azores Is.
Madeira Is. 0 1000 2000 Km
LI
EEA collaboratingcountries
Pan-Europeancountries outsideEU and EEA
EU-27
EEA outside EU-27
Countries in the Pan-European region,EEA members and EU-27
Note: Inserts are not in scale with the main map.
The 2010 target, the SEBI 2010 process and the first set of European biodiversity indicators
10 Halting the loss of biodiversity by 2010: proposal for a first set of indicators to monitor progress in Europe
(1) Decision No 1600/2002/EC of the European Parliament and of the Council of 22 July 2002 laying down the Sixth Community Environment Action Programme.
biodiversity action plans (natural resources, agriculture, fisheries and development), adopted in 2001, laid out in detail what actions should be taken to implement the strategy. A review of the implementation of ECBS was initiated in 2004 and led, via the 'Message from Malahide', to the EC Communication on halting the loss of biodiversity by 2010 (CEC, 2006).
The objective of 'managing natural resources more responsibly: to protect and restore habitats and natural systems and halt the loss of biodiversity by 2010' was first adopted by the EU in its Strategy for Sustainable Development (2001). The conservation of biodiversity is also one of the four main issues to be tackled along with climate change, environment, health and quality of life, and natural resources and waste within the EU Sixth environmental action programme 'Our future, our choice', adopted in 2002 (1).
The CBD (2002) and the Johannesburg Summit on Sustainable Development (2002) endorsed a 2010 target at global level by agreeing to achieve a significant reduction of the current rate of biodiversity loss by 2010. Finally, in 2003 pan-European environment ministers agreed to halt the loss of biodiversity by 2010 in the Kiev Resolution on Biodiversity (Note: when this report refers to 'the 2010 target', it refers to the EU and pan-European target to halt the loss of biodiversity by 2010).
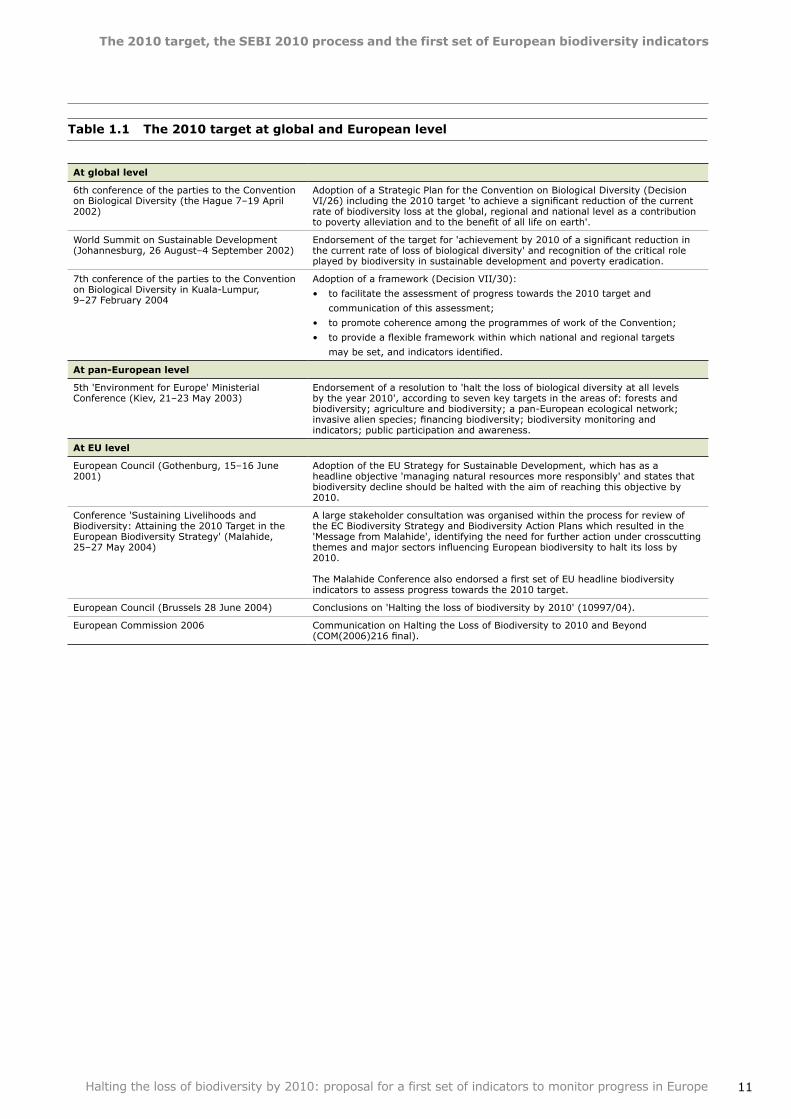
Table 1.1 provides an overview of international events and commitments related to the 2010 target. At national level, several countries have also
included the 2010 target as part of their national biodiversity strategies.
This political agreement on the 2010 target has been accompanied by a growing consensus on the need for long-term, structured, global and European coordination of biodiversity monitoring, indicators, assessment and reporting efforts as a sound funding basis. Having set a target to halt the loss of biodiversity by 2010, it became essential to examine and report on progress. To make this process meaningful to a range of audiences, a set of indicators was needed. This would provide a quick, easy-to-understand progress reference point for both technical and non-technical audiences alike. The indicators would be underpinned by sound scientific knowledge and analysis.
In June 2004, the EU Environment Council welcomed the set of biodiversity indicators referred to in the 'Message from Malahide' (produced under the Irish Presidency of the EU that year), based on the first set of indicators adopted globally earlier in 2004 at the CBD 7th Conference of the Parties in Kuala Lumpur. The Council also urged the European Commission to develop, test and finalise the EU set. The same framework of 16 headline indicators was also adopted by the PEBLDS (Pan-European Biological and Landscape Diversity Strategy) Council in 2005. The Streamlining European 2010 Biodiversity Indicators (SEBI 2010) project was set up to oversee implementation of the adopted framework at both EU and pan-European level. Its aim was to ensure maximum streamlining between national, regional and global-level indicators.
The 2010 target, the SEBI 2010 process and the first set of European biodiversity indicators
11Halting the loss of biodiversity by 2010: proposal for a first set of indicators to monitor progress in Europe
Table 1.1 The 2010 target at global and European level
At global level
6th conference of the parties to the Convention on Biological Diversity (the Hague 7–19 April 2002)
Adoption of a Strategic Plan for the Convention on Biological Diversity (Decision VI/26) including the 2010 target 'to achieve a significant reduction of the current rate of biodiversity loss at the global, regional and national level as a contribution to poverty alleviation and to the benefit of all life on earth'.
World Summit on Sustainable Development (Johannesburg, 26 August–4 September 2002)
Endorsement of the target for 'achievement by 2010 of a significant reduction in the current rate of loss of biological diversity' and recognition of the critical role played by biodiversity in sustainable development and poverty eradication.
7th conference of the parties to the Convention on Biological Diversity in Kuala-Lumpur, 9–27 February 2004
Adoption of a framework (Decision VII/30):
• to facilitate the assessment of progress towards the 2010 target and
communication of this assessment;
• to promote coherence among the programmes of work of the Convention;
• to provide a flexible framework within which national and regional targets
may be set, and indicators identified.
At pan-European level
5th 'Environment for Europe' Ministerial Conference (Kiev, 21–23 May 2003)
Endorsement of a resolution to 'halt the loss of biological diversity at all levels by the year 2010', according to seven key targets in the areas of: forests and biodiversity; agriculture and biodiversity; a pan-European ecological network; invasive alien species; financing biodiversity; biodiversity monitoring and indicators; public participation and awareness.
At EU level
European Council (Gothenburg, 15–16 June 2001)
Adoption of the EU Strategy for Sustainable Development, which has as a headline objective 'managing natural resources more responsibly' and states that biodiversity decline should be halted with the aim of reaching this objective by 2010.
Conference 'Sustaining Livelihoods and Biodiversity: Attaining the 2010 Target in the European Biodiversity Strategy' (Malahide, 25–27 May 2004)
A large stakeholder consultation was organised within the process for review of the EC Biodiversity Strategy and Biodiversity Action Plans which resulted in the 'Message from Malahide', identifying the need for further action under crosscutting themes and major sectors influencing European biodiversity to halt its loss by 2010.
The Malahide Conference also endorsed a first set of EU headline biodiversity indicators to assess progress towards the 2010 target.
European Council (Brussels 28 June 2004) Conclusions on 'Halting the loss of biodiversity by 2010' (10997/04).
European Commission 2006 Communication on Halting the Loss of Biodiversity to 2010 and Beyond (COM(2006)216 final).
12
SEBI 2010 — Streamlining European 2010 Biodiversity Indicators
Halting the loss of biodiversity by 2010: proposal for a first set of indicators to monitor progress in Europe
2 SEBI 2010 — Streamlining European 2010 Biodiversity Indicators
SEBI 2010 was established in 2005 as a process to select and streamline a set of biodiversity indicators to monitor progress towards the 2010 target of halting biodiversity loss and help achieve progress towards the target.
The activities addressed by SEBI 2010 are explicitly linked to four policy contexts:
1. European Union: SEBI 2010 responds to the 'Message from Malahide' and the EU Council Conclusions of 28 June 2004 (10997/04) by developing, testing and finalising a first set of EU headline biodiversity indicators. It will also underpin and ensure consistent biodiversity indicators and information required under the Lisbon Agenda, the sustainable development strategy, the EU Habitats (92/43/EEC) and Birds (79/409/EEC) Directives and the biodiversity strategy.
2. Pan-European: SEBI 2010 is consistent with the action plan developed as a follow-up to the Kiev Resolution on Biodiversity and hence responds to requirements under the UNECE Environment for Europe process and the Pan-European Biological and Landscape Diversity Strategy (PEBLDS).
3. Global: the EU biodiversity headline indicators are derived from the Convention on Biological Diversity (CBD) indicators, adopted as part of CBD decision VII/30 in February 2004 (and updated by CBD decision VIII/15), and customised to European needs and data availability. SEBI 2010 works in conjunction with the 2010 Biodiversity Indicators Partnership to ensure consistency with the work on indicator development at global level. (Note: UNEP-WCMC is coordinating 2010BIP, the GEF-funded project, which involves more than 40 partner organisations around the world).
4. National: many countries have also developed indicators to monitor their biodiversity. SEBI 2010 proposes indicators that may be adopted at national level if this has not yet been done. However, there is no obligation for countries to do so.
The envisaged outputs of SEBI 2010 are :
Completed outputs:• to provide an initial set of indicators available at
EU and pan-European levels (Note: some of the indicators are still being tested and finalised in 2007).
On-going:
• to provide a coherent European programme for the progressive development of biodiversity indicators, including the exploration of funding mechanisms for timely production and delivery of agreed indicators;
• to provide proposals and guidance on the development, production and delivery of agreed indicators;
• to provide proposals, guidance, recommendations and information for presentation to the appropriate European governance groups developing biodiversity policy for formal adoption;
• to provide information to the CBD Secretariat, advisory and governance processes on the results of the work being undertaken.
Future work:
• to provide a recommendation for an approach to using the agreed indicators for measuring the progress of national governments, the EU and the pan-European community towards achieving the 2010 target;
• to provide advice on relating changes in biodiversity at EU and pan-European level to policy measures adopted at these levels, so as to help the EU and countries to adjust or strengthen the measures concerned.
This chapter now discusses the importance of indicators as a tool, before describing the organisation of SEBI 2010 in detail.
2.1 Indicators to monitor and help achieve progress to 2010
Indicators serve four basic functions: simplification, quantification, standardisation and communication. They summarise complex and often disparate sets
SEBI 2010 — Streamlining European 2010 Biodiversity Indicators
13Halting the loss of biodiversity by 2010: proposal for a first set of indicators to monitor progress in Europe
of data and thereby simplify information. Their selection should be based on logical frameworks (see Box 2.1 on DPSIR) and comparable scientific observations or statistical measures. Moreover,
they should provide a clear message that can be communicated to and used by decision makers and the general public. Indicators differ from raw data and statistics in that they should relate the past,
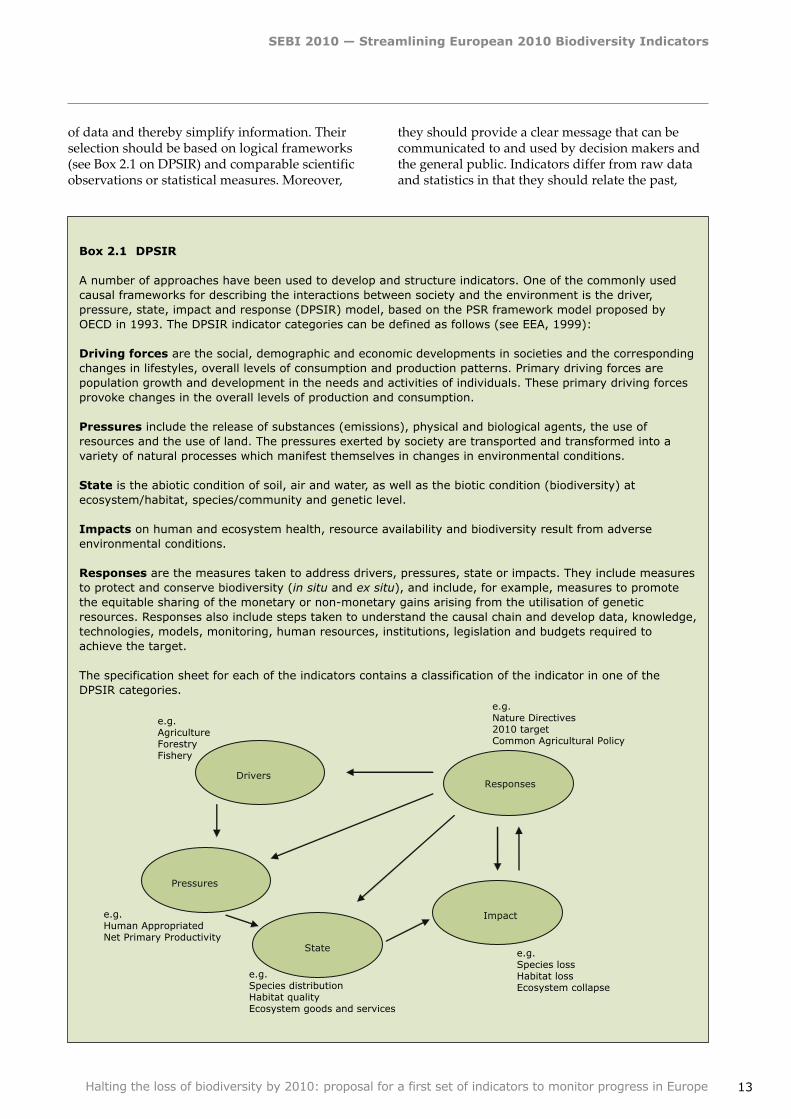
Box 2.1 DPSIR
A number of approaches have been used to develop and structure indicators. One of the commonly used causal frameworks for describing the interactions between society and the environment is the driver, pressure, state, impact and response (DPSIR) model, based on the PSR framework model proposed by OECD in 1993. The DPSIR indicator categories can be defined as follows (see EEA, 1999):
Driving forces are the social, demographic and economic developments in societies and the corresponding changes in lifestyles, overall levels of consumption and production patterns. Primary driving forces are population growth and development in the needs and activities of individuals. These primary driving forces provoke changes in the overall levels of production and consumption.
Pressures include the release of substances (emissions), physical and biological agents, the use of resources and the use of land. The pressures exerted by society are transported and transformed into a variety of natural processes which manifest themselves in changes in environmental conditions.
State is the abiotic condition of soil, air and water, as well as the biotic condition (biodiversity) at ecosystem/habitat, species/community and genetic level.
Impacts on human and ecosystem health, resource availability and biodiversity result from adverse environmental conditions.
Responses are the measures taken to address drivers, pressures, state or impacts. They include measures to protect and conserve biodiversity (in situ and ex situ), and include, for example, measures to promote the equitable sharing of the monetary or non-monetary gains arising from the utilisation of genetic resources. Responses also include steps taken to understand the causal chain and develop data, knowledge, technologies, models, monitoring, human resources, institutions, legislation and budgets required to achieve the target.
The specification sheet for each of the indicators contains a classification of the indicator in one of the DPSIR categories.
Drivers
Impact
Responses
State
Pressures
e.g.AgricultureForestryFishery
e.g. Human Appropriated Net Primary Productivity
e.g.Species distributionHabitat qualityEcosystem goods and services
e.g.Nature Directives2010 targetCommon Agricultural Policy
e.g.Species lossHabitat lossEcosystem collapse
SEBI 2010 — Streamlining European 2010 Biodiversity Indicators
14 Halting the loss of biodiversity by 2010: proposal for a first set of indicators to monitor progress in Europe
current or future state with a reference or baseline value. Reference values can be threshold values, a historical year, a target, or a particular ideal or maximum state. Reference or baseline values put indicators into context (CBD/SBSTTA/9/inf/7), but are not yet available for all proposed indicators. However, given the target of halting biodiversity loss by 2010, the temporal trend of an indicator without a reference value can still be meaningful.
Indicators provide a link from monitoring and research to support evidence-based policy making. Scientists and policy makers select a set of relevant indicators, which reflects both scientific and societal perspectives. Policy makers set targets and measures, while scientists identify specific parameters and establish corresponding monitoring programmes, baseline values and cause-effect relationships. The current state and trends are determined from monitoring, while models of cause-effect relationships provide information explaining trends, showing the effectiveness of measures and suggesting possible responses. The choice of time frames and spatial scales for monitoring and modelling is often crucial for ensuring that the indicators are relevant for policy objectives and decisions-making, and are cost-effective.
Indicator-based information must also be communicated quickly in a simple and intelligible way, like for example a temperature gauge displayed in the cockpit of a plane. The gauge shows the pilot that the plane is operating smoothly without the need to understand the full complexity of the plane's functionality. Nevertheless, in the event of a malfunction the pilot can take immediate action. Similarly, an instrument set is not just a random set, but is carefully designed and selected to provide the pilot with a range of interrelated information which allows the plane to be flown safely. Speed, distance to the target, fuel level, fuel consumption and direction may be relevant individually, but they also need to be interpreted as complementary elements, too. This same logic applies to the indicators in a biodiversity set.
The CBD agreed upon a first headline indicator list in 2004, grouped in seven focal areas (Decision VII/30). This list was adapted to the European context and presented in the 'Message from Malahide' (2004) as a first set of 15 European headline biodiversity indicators. Following
recommendations by the tenth meeting of SBSTTA held in early 2005, CBD COP8 (Annex 2 of decision VIII/15) updated the list of indicators. For example, the 'ecological footprint' was added to the CBD framework. A similar list of headline indicators derived from the CBD set was also adopted within the Pan-European Biological and Landscape Diversity Strategy in 2005 (STRA-CO(2005)12).
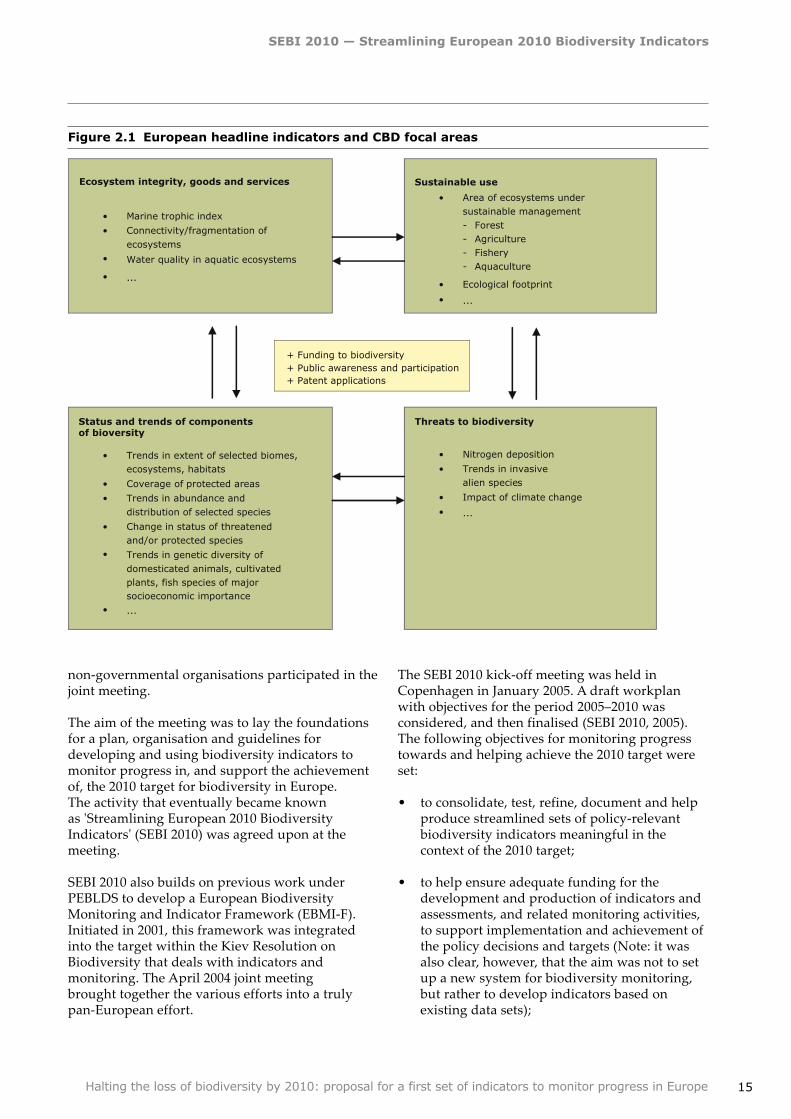
Figure 2.1 shows how 13 of the 16 headline indicators are grouped within four interlinked CBD focal areas. The three remaining indicators — on patents, funding, and public awareness — have a bearing on responses to the messages provided by the other 13.
This list provided the headlines, which then required further elaboration into detailed technical indicator designs, i.e. specific indicators needed to be selected for each headline. For some headline indicators, such specific indicators were relatively well-developed, for others it will take some time to source data before they can be fully produced. Work within SEBI 2010 was focused initially on eight of the indicators in six Expert Groups (Note: these eight indicators are highlighted in italics in the diagram below). The SEBI 2010 Coordination Team itself reviewed requirements for the other eight headline indicators (2).
2.2 The origins of SEBI 2010
In April 2004, the European Environment Agency (EEA) and the European Centre for Nature Conservation (ECNC), with the Regional Office for Europe of the United Nations Environment Programme (UNEP/ROE) and the Council of Europe, organised a joint meeting of the European Environmental Information and Observation Network (Eionet), the International Working Group on Biodiversity Monitoring and Indicators (IWG-BioMIN) and the Pan-European Biological and Landscape Diversity Strategy (PEBLDS).
Some 70 representatives from 30 countries (13 EU Member States, five EU acceding countries, eight additional EEA member/participating countries and four EECCA countries), European Environment Agency (including its ETC on nature protection and biodiversity), European Commission (DG Environment and Joint Research Centre), Council of Europe, UNEP, ECNC, UNECE, FAO, IUCN, several research programmes and
(2) Section 2.3 discusses in more detail the organisational structure of SEBI 2010.
SEBI 2010 — Streamlining European 2010 Biodiversity Indicators
15Halting the loss of biodiversity by 2010: proposal for a first set of indicators to monitor progress in Europe
Figure 2.1 European headline indicators and CBD focal areas
Ecosystem integrity, goods and services
• Marine trophic index
• Connectivity/fragmentation of ecosystems
Sustainable use
• Area of ecosystems under sustainable management - Forest - Agriculture - Fishery - Aquaculture
• Ecological footprint
Status and trends of components of bioversity
• Trends in extent of selected biomes, ecosystems, habitats
• Coverage of protected areas
• Trends in abundance and distribution of selected species
• Change in status of threatened and/or protected species
Trends in genetic diversity of domesticated animals, cultivated plants, fish species of major socioeconomic importance
Threats to biodiversity
•
Nitrogen deposition
•
Trends in invasive alien species
•
Impact of climate change
+ Funding to biodiversity+ Public awareness and participation+ Patent applications
• Water quality in aquatic ecosystems
• ...
• ...
•
• ...
• ...
non-governmental organisations participated in the joint meeting.
The aim of the meeting was to lay the foundations for a plan, organisation and guidelines for developing and using biodiversity indicators to monitor progress in, and support the achievement of, the 2010 target for biodiversity in Europe. The activity that eventually became known as 'Streamlining European 2010 Biodiversity Indicators' (SEBI 2010) was agreed upon at the meeting.
SEBI 2010 also builds on previous work under PEBLDS to develop a European Biodiversity Monitoring and Indicator Framework (EBMI-F). Initiated in 2001, this framework was integrated into the target within the Kiev Resolution on Biodiversity that deals with indicators and monitoring. The April 2004 joint meeting brought together the various efforts into a truly pan-European effort.
The SEBI 2010 kick-off meeting was held in Copenhagen in January 2005. A draft workplan with objectives for the period 2005–2010 was considered, and then finalised (SEBI 2010, 2005). The following objectives for monitoring progress towards and helping achieve the 2010 target were set:
• to consolidate, test, refine, document and help produce streamlined sets of policy-relevant biodiversity indicators meaningful in the context of the 2010 target;
• to help ensure adequate funding for the development and production of indicators and assessments, and related monitoring activities, to support implementation and achievement of the policy decisions and targets (Note: it was also clear, however, that the aim was not to set up a new system for biodiversity monitoring, but rather to develop indicators based on existing data sets);
SEBI 2010 — Streamlining European 2010 Biodiversity Indicators
16 Halting the loss of biodiversity by 2010: proposal for a first set of indicators to monitor progress in Europe
• to improve coordination, exchange of information, collaboration and international streamlining of biodiversity-related indicators and monitoring activities, building on current activities and good practice;
• to consider the wider use of the indicators, and their applicability within other relevant indicator frameworks and assessment processes; SEBI 2010 would link to existing indicator processes such as the EEA Core Set of Indicators, IRENA for agriculture, EMMA for marine ecosystems, MCPFE for forest ecosystems and the EU Sustainable Development Indicators.
2.3 SEBI 2010: organisation and process
All SEBI 2010 documents and minutes of Coordination Team meetings have been made available on the EU Clearing House Mechanism at http://biodiversity-chm.eea.europa.eu/information/indicator/F1090245995.
Work within SEBI 2010 is being developed in four phases. The publication of this report constitutes one of the final outputs from Phase 1.
• Phase 1 (2005 to mid 2007): development, documentation and endorsement of the first set (selection of the indicators, not yet the actual production);
• Phase 2 (mid-2007 to end 2008): update of data in the agreed SEBI 2010 set, and further progress on integrated assessment of progress to target;
• Phase 3 (2009 to end 2010): continued update of agreed SEBI 2010 set and revision of the first set where appropriate. Further details will be developed;
• Phase 4 (end 2010 to end 2012): continued update of the agreed SEBI 2010 set. Further details will be developed.
During these four phases, the EEA will help provide access to the indicators via the EEA Indicator Management System and make use of the set of indicators to produce the following reports:
• Phase 1: this technical report and an EEA briefing on progress towards the 2010 target based on indicators from the first set;
• Phase 2: an EEA indicator-based assessment report, the first assessment based on the set;
• Phase 3: a biodiversity integrated assessment in the EEA's SOER 2010, based on the set of indicators;
• Phase 4: the assessment on the achievement of the 2010 target as part of the planned ecosystem assessment for Europe.
Via an on-going approach, the EEA will also use the set to help the European Commission in its reporting under the Biodiversity Communication (CEC, 2006).
SEBI 2010 is an open, participatory process with data and indicator producers and users all involved in the review, development and documentation of proposals for specific indicators. Hence, it is well placed to support the recognition and endorsement of the proposals from SEBI 2010 by the appropriate EU and Pan-European bodies.
Over 120 experts participate in the SEBI 2010 process. Most participate directly in the meetings of the Expert Groups, others participate indirectly by commenting on the draft papers and reports.
The operational framework of SEBI 2010 in Phase 1 was built around a small Coordination Team and six Expert Groups who considered specific groups of indicators. A full list of members of the Coordination Team and Expert Groups as of June 2007 is included in Annex 1.
The SEBI 2010 Coordination Team is led by the European Environment Agency with representatives from ECNC, UNEP-WCMC, DG Environment, PEBLDS Joint Secretariat and Czech Republic (as lead country for the Kiev Resolution action plan on biodiversity indicators) plus the chairs and coordinators of the six Expert Groups in Phase 1, with support from the European topic centre on biological diversity (ETC/BD).
The Coordination Team's mandate was established in the PEBLDS action plan for biodiversity monitoring and indicators (STRA-CO(2004)3f revised) adopted by the PEBLDS Bureau in May 2004 and in the 'Message from Malahide' and the Malahide main paper on indicators.
The Expert Groups were established with a specific mandate and timetable for their work, relating to one (or more) of the indicators. They consisted of a small number of interested experts from across the
SEBI 2010 — Streamlining European 2010 Biodiversity Indicators
17Halting the loss of biodiversity by 2010: proposal for a first set of indicators to monitor progress in Europe
pan-European region and from international NGOs and IGOs. Each group provided a range of technical expertise and geographical coverage in order to help ensure that:
• current practice was fully considered;
• national, international and specific technical requirements and limitations were fully taken into account;
• the development and implementation of indicators was streamlined as far as possible across the national, EU, pan-European and global levels.
Each of the six Expert Groups met 3–5 times to discuss: the options for inclusion in the pan-European set, the availability of suitable data within Europe, and strengths and weaknesses of the various options both individually and as part of an interlinked set. The Annex provides an overview of the Expert Groups and the headline indicators they covered.
The Coordination Team developed guidance for the Expert Groups on evaluating and documenting candidate indicators, reviewing progress, discussing how to frame the first indicators as an interconnected set, and planning the next steps. They met eight times during the period 2005 to mid 2007. Members of the Coordination Team also participated in a range of relevant stakeholder meetings.
In Phase 2 of SEBI 2010, the six Expert Groups will be replaced by three working groups that will respectively address data and inter linkages across the set of indicators; climate change impact related indicators; and communication (3). In addition to the general coordination role, the Coordination Team will in Phase 2 focus on securing data flows, political endorsement and expert contributions to the assessment report and other reporting; ensuring expansion of data coverage (spatial and temporal); quality control of the delivered indicators; advice on developing funding for indicators; and helping ensure links to national and global activities.
The SEBI 2010 activities have been funded as far as possible through the European Environment Agency's core and additional budgets for work with EEA member countries (EU-27 Member States, Turkey, Iceland, Liechtenstein, Norway,
and Switzerland). Further funding — through EEA and PEBLDS Joint Secretariat (provided by Norway, Switzerland, and UNEP) — was used to extend support to West Balkan countries (Albania, Bosnia-Herzegovina, Croatia, FYR of Macedonia, Serbia, and Montenegro) and EECCA countries (Eastern Europe, Caucasus and Central Asia). The Coordination Team prioritised the use of available funds to ensure a good balance of expertise and geographical coverage.
Discussions are continuing to confirm funding needed to ensure delivery of the first set of indicators from 2007 onwards.
2.4 Outcomes: the first set
The Coordination Team met in October 2006 to decide which of the 70+ indicators under consideration would be ready by the end of 2006, and hence could be proposed for inclusion into a first set. Approximately 50 indicators were deemed sufficiently developed to be discussed at a workshop held in Copenhagen in November 2006.
The SEBI 2010 workshop convened biodiversity experts and policy makers to:
• develop and discuss the communication and presentation of the first set of headline biodiversity indicators, including interconnections and possible stories across the indicators;
• commence discussions on the next phase of work of SEBI 2010, including the endorsement of the set, their availability and use.
The indicators were considered both individually and as sets in terms of whether they:
• monitor progress towards achieving the 2010 target;
• can help achieve the 2010 target;
• contain a clear message.
Selection criteria (see Box 2.2) were derived from those adopted by the CBD (4) and those used for the EEA Core Set of Indicators (5) to evaluate the
(3) Terms of Reference for the new Working Groups can be found on the Clearing House Mechanism at http://biodiversity-chm.eea.europa.eu/information/indicator/F1090245995/fol471291.
(4) UNEP/CBD/SBSTTA/9/10.(5) http://themes.eea.europa.eu/IMS/About/CSI-criteria.pdf.
SEBI 2010 — Streamlining European 2010 Biodiversity Indicators
18 Halting the loss of biodiversity by 2010: proposal for a first set of indicators to monitor progress in Europe
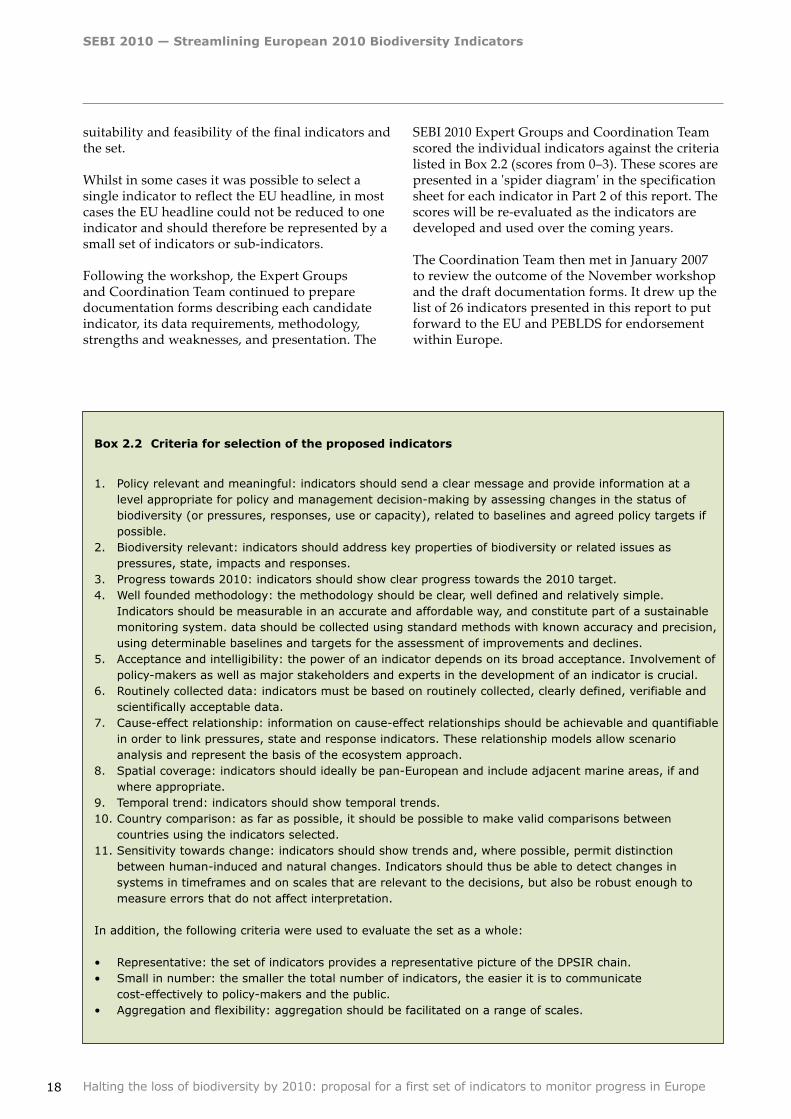
Box 2.2 Criteria for selection of the proposed indicators
1. Policy relevant and meaningful: indicators should send a clear message and provide information at a level appropriate for policy and management decision-making by assessing changes in the status of biodiversity (or pressures, responses, use or capacity), related to baselines and agreed policy targets if possible.
2. Biodiversity relevant: indicators should address key properties of biodiversity or related issues as pressures, state, impacts and responses.
3. Progress towards 2010: indicators should show clear progress towards the 2010 target.4. Well founded methodology: the methodology should be clear, well defined and relatively simple.
Indicators should be measurable in an accurate and affordable way, and constitute part of a sustainable monitoring system. data should be collected using standard methods with known accuracy and precision, using determinable baselines and targets for the assessment of improvements and declines.
5. Acceptance and intelligibility: the power of an indicator depends on its broad acceptance. Involvement of policy-makers as well as major stakeholders and experts in the development of an indicator is crucial.
6. Routinely collected data: indicators must be based on routinely collected, clearly defined, verifiable and scientifically acceptable data.
7. Cause-effect relationship: information on cause-effect relationships should be achievable and quantifiable in order to link pressures, state and response indicators. These relationship models allow scenario analysis and represent the basis of the ecosystem approach.
8. Spatial coverage: indicators should ideally be pan-European and include adjacent marine areas, if and where appropriate.
9. Temporal trend: indicators should show temporal trends. 10. Country comparison: as far as possible, it should be possible to make valid comparisons between
countries using the indicators selected.11. Sensitivity towards change: indicators should show trends and, where possible, permit distinction
between human-induced and natural changes. Indicators should thus be able to detect changes in systems in timeframes and on scales that are relevant to the decisions, but also be robust enough to measure errors that do not affect interpretation.
In addition, the following criteria were used to evaluate the set as a whole:
• Representative: the set of indicators provides a representative picture of the DPSIR chain. • Small in number: the smaller the total number of indicators, the easier it is to communicate
cost-effectively to policy-makers and the public. • Aggregation and flexibility: aggregation should be facilitated on a range of scales.
suitability and feasibility of the final indicators and the set.
Whilst in some cases it was possible to select a single indicator to reflect the EU headline, in most cases the EU headline could not be reduced to one indicator and should therefore be represented by a small set of indicators or sub-indicators.
Following the workshop, the Expert Groups and Coordination Team continued to prepare documentation forms describing each candidate indicator, its data requirements, methodology, strengths and weaknesses, and presentation. The
SEBI 2010 Expert Groups and Coordination Team scored the individual indicators against the criteria listed in Box 2.2 (scores from 0–3). These scores are presented in a 'spider diagram' in the specification sheet for each indicator in Part 2 of this report. The scores will be re-evaluated as the indicators are developed and used over the coming years.
The Coordination Team then met in January 2007 to review the outcome of the November workshop and the draft documentation forms. It drew up the list of 26 indicators presented in this report to put forward to the EU and PEBLDS for endorsement within Europe.
SEBI 2010 — Streamlining European 2010 Biodiversity Indicators
19Halting the loss of biodiversity by 2010: proposal for a first set of indicators to monitor progress in Europe
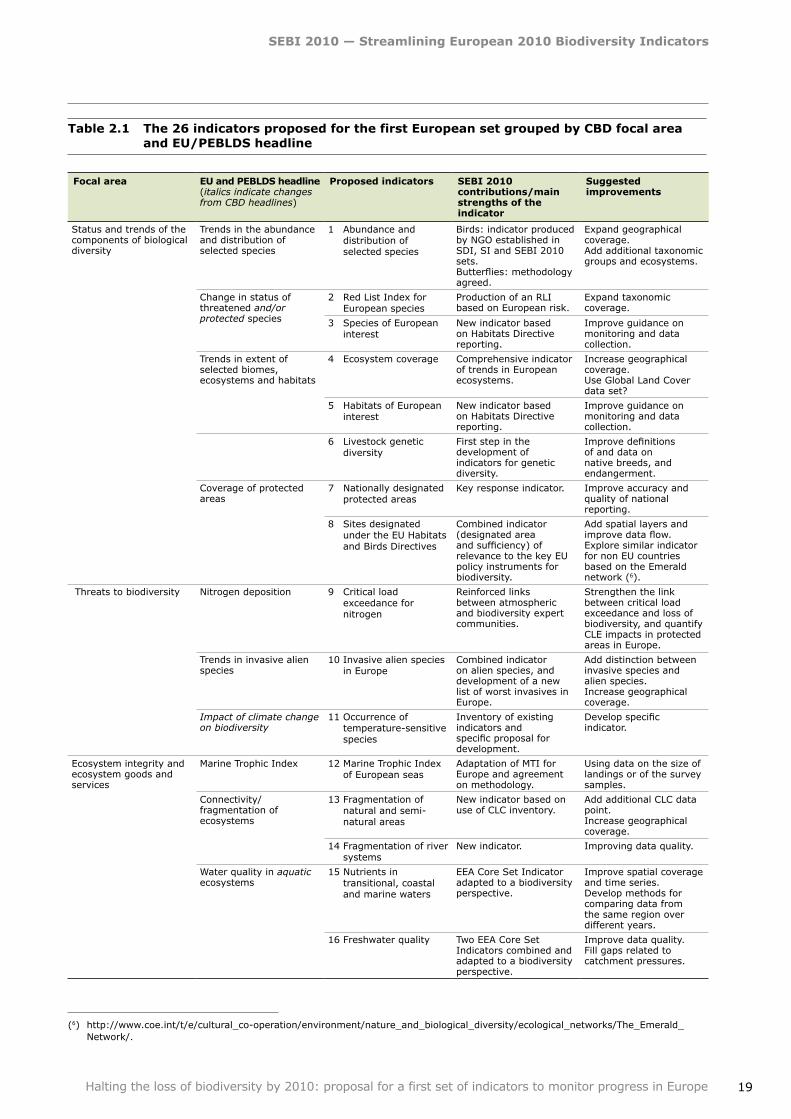
Table 2.1 The 26 indicators proposed for the first European set grouped by CBD focal area and EU/PEBLDS headline
Focal area EU and PEBLDS headline (italics indicate changes from CBD headlines)
Proposed indicators SEBI 2010 contributions/main strengths of the indicator
Suggested improvements
Status and trends of the components of biological diversity
Trends in the abundance and distribution of selected species
1 Abundance and distribution of selected species
Birds: indicator produced by NGO established in SDI, SI and SEBI 2010 sets.Butterflies: methodology agreed.
Expand geographical coverage.Add additional taxonomic groups and ecosystems.
Change in status of threatened and/or protected species
2 Red List Index for European species
Production of an RLI based on European risk.
Expand taxonomic coverage.
3 Species of European interest
New indicator based on Habitats Directive reporting.
Improve guidance on monitoring and data collection.
Trends in extent of selected biomes, ecosystems and habitats
4 Ecosystem coverage Comprehensive indicator of trends in European ecosystems.
Increase geographical coverage.Use Global Land Cover data set?
5 Habitats of European interest
New indicator based on Habitats Directive reporting.
Improve guidance on monitoring and data collection.
6 Livestock genetic diversity
First step in the development of indicators for genetic diversity.
Improve definitions of and data on native breeds, and endangerment.
Coverage of protected areas
7 Nationally designated protected areas
Key response indicator. Improve accuracy and quality of national reporting.
8 Sites designated under the EU Habitats and Birds Directives
Combined indicator (designated area and sufficiency) of relevance to the key EU policy instruments for biodiversity.
Add spatial layers and improve data flow.Explore similar indicator for non EU countries based on the Emerald network (6).
Threats to biodiversity Nitrogen deposition 9 Critical load exceedance for nitrogen
Reinforced links between atmospheric and biodiversity expert communities.
Strengthen the link between critical load exceedance and loss of biodiversity, and quantify CLE impacts in protected areas in Europe.
Trends in invasive alien species
10 Invasive alien species in Europe
Combined indicator on alien species, and development of a new list of worst invasives in Europe.
Add distinction between invasive species and alien species.Increase geographical coverage.
Impact of climate change on biodiversity
11 Occurrence of temperature-sensitive species
Inventory of existing indicators and specific proposal for development.
Develop specific indicator.
Ecosystem integrity and ecosystem goods and services
Marine Trophic Index 12 Marine Trophic Index of European seas
Adaptation of MTI for Europe and agreement on methodology.
Using data on the size of landings or of the survey samples.
Connectivity/ fragmentation of ecosystems
13 Fragmentation of natural and semi-natural areas
New indicator based on use of CLC inventory.
Add additional CLC data point.Increase geographical coverage.
14 Fragmentation of river systems
New indicator. Improving data quality.
Water quality in aquatic ecosystems
15 Nutrients in transitional, coastal and marine waters
EEA Core Set Indicator adapted to a biodiversity perspective.
Improve spatial coverage and time series.Develop methods for comparing data from the same region over different years.
16 Freshwater quality Two EEA Core Set Indicators combined and adapted to a biodiversity perspective.
Improve data quality.Fill gaps related to catchment pressures.
(6) http://www.coe.int/t/e/cultural_co-operation/environment/nature_and_biological_diversity/ecological_networks/The_Emerald_Network/.
SEBI 2010 — Streamlining European 2010 Biodiversity Indicators
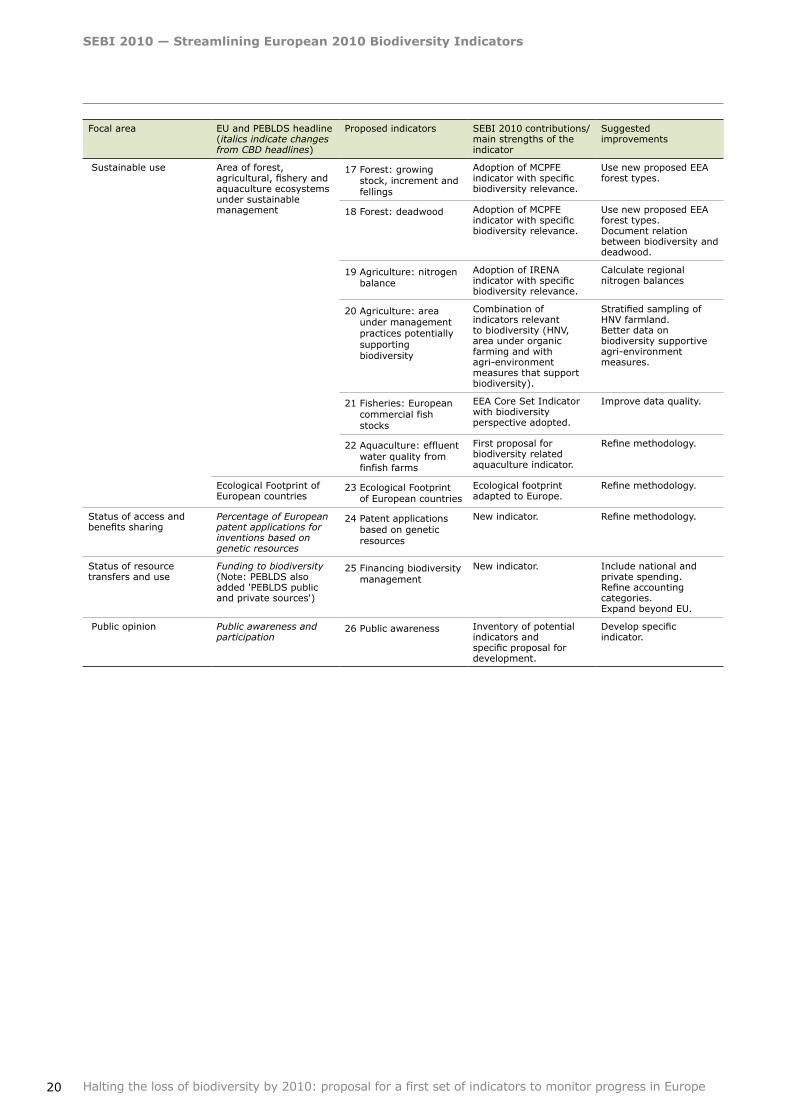
20 Halting the loss of biodiversity by 2010: proposal for a first set of indicators to monitor progress in Europe
Focal area EU and PEBLDS headline (italics indicate changes from CBD headlines)
Proposed indicators SEBI 2010 contributions/main strengths of the indicator
Suggested improvements
Sustainable use Area of forest, agricultural, fishery and aquaculture ecosystems under sustainable management
17 Forest: growing stock, increment and fellings
Adoption of MCPFE indicator with specific biodiversity relevance.
Use new proposed EEA forest types.
18 Forest: deadwood Adoption of MCPFE indicator with specific biodiversity relevance.
Use new proposed EEA forest types.Document relation between biodiversity and deadwood.
19 Agriculture: nitrogen balance
Adoption of IRENA indicator with specific biodiversity relevance.
Calculate regional nitrogen balances
20 Agriculture: area under management practices potentially supporting biodiversity
Combination of indicators relevant to biodiversity (HNV, area under organic farming and with agri-environment measures that support biodiversity).
Stratified sampling of HNV farmland.Better data on biodiversity supportive agri-environment measures.
21 Fisheries: European commercial fish stocks
EEA Core Set Indicator with biodiversity perspective adopted.
Improve data quality.
22 Aquaculture: effluent water quality from finfish farms
First proposal for biodiversity related aquaculture indicator.
Refine methodology.
Ecological Footprint of European countries
23 Ecological Footprint of European countries
Ecological footprint adapted to Europe.
Refine methodology.
Status of access and benefits sharing
Percentage of European patent applications for inventions based on genetic resources
24 Patent applications based on genetic resources
New indicator. Refine methodology.
Status of resource transfers and use
Funding to biodiversity (Note: PEBLDS also added 'PEBLDS public and private sources')
25 Financing biodiversity management
New indicator. Include national and private spending.Refine accounting categories.Expand beyond EU.
Public opinion Public awareness and participation
26 Public awareness Inventory of potential indicators and specific proposal for development.
Develop specific indicator.
21
First discussion of the SEBI 2010 set of indicators
Halting the loss of biodiversity by 2010: proposal for a first set of indicators to monitor progress in Europe
3 First discussion of the SEBI 2010 set of indicators
3.1 The indicators as a set
The 26 indicators presented in this report are proposed for inclusion in the set of European biodiversity indicators. They have been selected on the basis of the criteria presented earlier, and are currently considered the best available. The set of indicators was not designed to be comprehensive, but to provide a first set, based on available data, to monitor progress to 2010.
Some of the indicators directly track an impact on a component of biodiversity, whereas others reflect threats to biodiversity, its sustainable use and integrity. The set as a whole can be used to help assess the effect of various sectors and sectoral policies on biodiversity. As Figure 2.1 shows, indicators describing the state and trends of biodiversity are important, but this is only one of the key focal areas. Using sub-sets from the set, it is possible to look at trends and impacts in various ecosystems (e.g. agricultural, marine, freshwater) and economic sectors (e.g. for agriculture, fisheries or forestry) or in relation to various environmental pressures (water quality, eutrophication, land use) and assess progress towards the 2010 target.
While there is room for improvement (as indicated in Table 2.1), the current set offers good coverage of biodiversity issues and should be a useful tool to track progress towards the 2010 target. The indicators can be used both individually and in combination to provide a consistent framework for assessment. The set is intended to be as representative as possible and flexible. Different combinations of indicators enable different views and can be used to answer key policy questions, such as: What is happening?, What are the causes? Why is it important? What can we do about it? This flexibility also facilitates a 'zoom' function, which allows the user to focus on details or the big picture, from national to European level. Depending on the question, existing indicators from the socio-economic field can be added to complete the picture when assessments are being made.
Relations between the messages from the different indicators are naturally complex, but careful assessment can give policy makers insight into where efforts should be concentrated or existing policies changed. Future activities will focus on
developing and implementing methods that enable datasets to be further integrated, so as to produce indicators that respond more directly to policy concerns (see Section 3.4 for further details on future challenges).
3.2 Summary discussion of individual indicators
This section contains a summary description of each indicator in the set, explains why the 26 indicators were selected and how they fit within the different focal areas. For detailed information, as well as suggested graphical representation and interpretation, see Part II Technical specifications of the 26 indicators.
Focal area: status and trends of the components of biological diversity
Knowing what exists and what is happening to biodiversity is a fundamental aspect addressed by this focal area. It provides the minimum required information on the current status and the likely change in status for selected species groups, individually threatened and protected species, selected ecosystems and habitats, genetic diversity of species of socio-economic importance, and coverage of protected areas.
1. Headline indicator: trends in the abundance and distribution of selected species
The specific indicator selected is 'Abundance and distribution of selected species', which initially covers:
• common birds;
• butterflies.
Population trend indicators, based on aggregated data for a number of species, provide a tangible basis for measuring progress towards the 2010 target. The sensitivity of this indicator can allow policy makers to assess and respond to changes in the environment, and rapidly review the effectiveness of their actions. Birds and butterflies are excellent barometers for the health of the environment. They occur in many habitats, reflect
First discussion of the SEBI 2010 set of indicators
22 Halting the loss of biodiversity by 2010: proposal for a first set of indicators to monitor progress in Europe
changes in other animals and plants, are sensitive to environmental change and have great resonance with the public. Both birds and butterflies are the focus of volunteer efforts and the involvement of communities in monitoring schemes and action. More species groups may be added in the future. The farmland bird index has already been adopted as a long list structural indicator and a sustainable development indicator by the EU as well as a baseline indicator under the Rural Development Regulation (7) , which obliges all EU Member States to monitor farmland birds in the context of agri-environment measures.
2. Headline indicator: change in status of threatened and/or protected species
The two specific indicators selected are:
• Red List Index for European species;
• Species of European interest.
Extinction is the most fundamental form of biodiversity loss. Indicators for threatened species measure the effectiveness of targeted conservation action. The Red List Index measures trends in the extinction risk for European species. Therefore, this indicator indirectly links to the drivers for biodiversity loss and has resonance with both the public and decision makers. It has clear relevance to ecological processes and ecological function, for instance, habitat degradation, invasive species, unsustainable exploitation, pollution and climate change. The indicator on species of European interest will be available in 2008 (based on reporting under article 17 of the Habitats Directive during 2007) and will initially provide a measure of the success of the implementation of the EU Birds and Habitats Directives. This indicator could be extended to include species of interest beyond the EU at a later stage.
3. Headline indicator: trends in extent of selected biomes, ecosystems and habitats
The two specific indicators selected are:
• Ecosystem coverage;
• Habitats of European interest.
The ecosystem coverage indicator looks at changes in major ecosystems in Europe since 1990. The indicator gives a complete picture of the distribution
of major ecosystem types in Europe. A particular ecosystem will support a characteristic set of species and habitats. If the ecosystem is encroached upon and decreases in area, the species and habitats it supports may be put at risk and may not be able to sustain viable population levels. The indicator will be supplemented where appropriate by additional details on a number of specific ecosystems and habitats, drawing from other datasets, such as forests. This will include a forest status indicator and an indicator on the naturalness of forest area, providing information on the share of natural, extensively used and intensively used forests. Other ecosystems include: glaciers, sea-ice, cropland, wetlands and seagrasses. The indicator on habitats of European interest will initially be based on reporting under the EU Habitats Directive and hence be available in 2008. This indicator could be extended to include species of interest beyond the EU at a later stage.
4. Headline indicator: trends in genetic diversity of domesticated animals, cultivated plants, and fish species of major socio‑economic importance
The specific indicator selected is:
• Livestock genetic diversity.
The available data and indicators on genetic resources have been reviewed. Data are much better developed and more accessible for domesticated animals than for other groups, such as crops, trees and fish.
Animal breeds constitute a pool of genetic resources of considerable potential value in a changing society and environment. One of the on-going challenges for the conservation of animal genetic diversity for a country is the maintenance of viable populations of native breeds, for which it has a special responsibility. There is also concern over the loss of genetic diversity within breeds. Many of these old native breeds are being replaced by a few highly specialised breeds, which are often being introduced by man. Although less productive, the old native breeds are generally very well adapted to local circumstances and resources, and may increase resilience in the long-term.
The indicator shows the share of native as well as introduced cattle and sheep breeds per country and the proportion of breeds native to a country which are endangered. At this stage, the indicator
(7) Council Regulation (EC) No 1698/2005 on support for rural development by the European Agricultural Fund for Rural Development (EAFRD).
First discussion of the SEBI 2010 set of indicators
23Halting the loss of biodiversity by 2010: proposal for a first set of indicators to monitor progress in Europe
measures breed diversity, rather than full genetic diversity.
5. Headline indicator: coverage of protected areas
The two specific indicators selected are:
• Nationally designated protected areas;
• Sites designated under the EU Habitats and Birds Directives.
The establishment and management of protected areas is a direct response to concerns over biodiversity loss and reflects measures taken to safeguard biodiversity. The indicator on nationally designated protected areas illustrates the rate of growth in protected areas over time. Comprehensive data on officially designated areas are regularly compiled. The focus is placed on nationally designated areas ranging from national parks to forest reserves and from strict nature reserves to resource reserves. For the EU, the indicator on sites designated under the Habitats and Birds Directives will present an assessment of completeness of the EU network.
In future, indicators of management effectiveness and the condition of protected areas may be developed.
Focal area: threats to biodiversity
Of the six main threats to biodiversity (habitat degradation, invasive alien species, population pressure, pollution, overexploitation and climate change), this focal area covers invasive species, pollution and climate change. Focal areas on the status and trends of the components of biological diversity, ecosystem integrity and ecosystem goods and services, and sustainable use, cover habitat degradation, overexploitation and other aspects of pollution respectively.
6. Headline indicator: nitrogen deposition
The specific indicator selected is:
• Critical load exceedance for nitrogen.
Excess nitrogen is one of the major threats to biodiversity. Excessive levels of reactive forms of nitrogen in the biosphere and atmosphere represent a major threat to biodiversity in terrestrial, aquatic and coastal ecosystems. On land, it causes loss of sensitive species by favouring a few nitrogen tolerant species over less tolerant ones. In coastal
waters, it leads to algal blooms and deoxygenated dead zones in which only a few bacteria can survive. Across Europe it is now becoming clear that nitrogen deposition is predominantly caused by agricultural releases, mainly ammonia. Therefore, future action must also take into account reduced forms of nitrogen (Note: past efforts have focussed on reducing the oxides of nitrogen).
7. Headline indicator: trends in invasive alien species
The specific indicator selected is:
• Invasive alien species in Europe.
This indicator includes two aspects: the 'Cumulative number of alien species in Europe since 1900', (which shows the cumulative number of alien species established in Europe since 1900, and uses 10-year intervals), and information from a list of 'worst invasive species threatening biodiversity in Europe'. The increasing potential threat that alien species pose to biological diversity can be illustrated in the cumulative number of alien species. Although not all alien species become invasive, the number of alien species introduced into an environment has a direct correlation with the number of species which may become invasive at a later date. The list of 'worst invasive species threatening biodiversity in Europe' contains genuinely problematic invasive alien species, which will help to prioritise action and communicate the issue to a wider general public. Work on the costs of invasive alien species is on-going and may be included in this headline indicator at a later stage.
8. Headline indicator: impact of climate change on biodiversity
The specific indicator selected is:
• Occurrence of temperature-sensitive species.
This indicator has been the subject of extensive discussion, not least because the link between biodiversity and climate change has become an increasingly important issue during the SEBI 2010 process. Many biodiversity-related indicators of climate change use a component of biodiversity to illustrate that climate change is happening (e.g. change in egg laying patterns or plant phenology). Rarely however do they address the direct negative impacts of climate change on biodiversity. A proposed indicator is to be developed that represents the abundance of a selected set of species which are specifically sensitive to climate change (because they either live in ephemeral habitats or
First discussion of the SEBI 2010 set of indicators
24 Halting the loss of biodiversity by 2010: proposal for a first set of indicators to monitor progress in Europe
have limited capacity for dispersal). The indicator proposed for initial inclusion in the set reflects potentially negative impacts (e.g. the spread of thermophilic species may stress existing local plant species). However, in future this indicator should be replaced by one that measures impacts more directly.
Focal area: ecosystem integrity and ecosystem goods and services
Ecosystem integrity and the goods and services provided are directly linked. Reduced integrity reduces goods and services. In other words, the loss of ecosystem function will stop the production of the types of goods and services we often take for granted. Many of the indicators in this focal area relate to economic sectors and hence to the policies developed for these areas.
9. Headline indicator: Marine Trophic Index
The specific indicator selected is:
• Marine Trophic Index of European seas.
The intensification of fishing has led to the decline of large, high value predatory fishes, such as tuna, cod, sea bass and swordfish; fish which rank highly in the food chain. As a consequence, fisheries, since 1950, have increasingly relied upon smaller fish with shorter life spans and on the invertebrates from the lower parts of both marine and freshwater food webs. If the decline in trophic levels continues at the current rate, the preferred fish for human consumption will become increasingly rare. The Marine Trophic Index measures this effect.
10. Headline indicator: connectivity/fragmentation of ecosystems
The two specific indicators selected are:
• Fragmentation of natural and semi-natural areas;
• Fragmentation of river systems.
The first indicator shows the change in the average size of patches of natural and semi natural areas, on the basis of land cover maps produced by photo-interpretation of satellite imagery. Average patch size is related to the 'functionality' of the habitat. This is the extent to which the habitat is able to support viable populations of plants and animals. If it is too small or not sufficiently connected to other habitat blocks, it may not provide the necessary conditions for many species. In addition, if a habitat
is not sufficiently large or connected it may not provide services to humans, including climate change adaptation and mitigation functions.
In assessing the impact of fragmentation, changes in the patch size of land cover units needs to be considered jointly with the position of a given unit on a gradient from natural to artificial. Fragmentation is a major threat to the biodiversity of natural and semi-natural areas. Natural and semi-natural areas are critically important, as they support the full range of ecosystem services as well as the majority of species and habitats in each ecosystem. If such areas become increasingly fragmented and the average size decreases, the integrity of the whole ecosystem is affected. However, in intensively managed ecosystems (e.g. intense agricultural production or plantation forest) a decrease in patch size may in some cases have a beneficial effect on biodiversity (e.g. increased habitat and species diversity) and/or the services the ecosystem supports.
Work is on-going with indicators that focus on change in spatial patterns in ecosystems (and include information on for example core habitat, edge, isolated patches, and corridors) and have the potential to be linked to functional aspects that are meaningful for biodiversity.
The indicator on river fragmentation shows fragmentation due to the presence of artificial structures that a) may affect the passage of migratory fish and so restrict their range and/or abundance and b) changes substantially the natural habitat distribution within rivers and modifies their ecological capacity.
11. Headline indicator: water quality in aquatic ecosystems
The two specific indicators selected are:
• Nutrients in transitional, coastal and marine waters;
• Freshwater quality.
Nutrients are problematic for biodiversity in both marine and fresh water. Nitrogen and phosphorous enrichment causes a train of undesirable effects. Essentially, excess nutrients lead to the direct loss of animal and plant species and changes in the composition of ecosystems. Algal bloom in water bodies, occasionally toxic to humans and therefore of relevance to drinking water sources, are not uncommon. They can be caused by agricultural
First discussion of the SEBI 2010 set of indicators
25Halting the loss of biodiversity by 2010: proposal for a first set of indicators to monitor progress in Europe
intensification, coastal fish farming and a range of related factors.
Focal area: sustainable use
It is essential that ecosystems and species are managed in a sustainable manner. Overexploitation of wild resources may be less important as a threat to biodiversity in Europe. However, unsustainable management in productive sectors dependent on ecosystem services can have disastrous effects. Integrating biodiversity concerns into such productive sectors is therefore a key response to biodiversity loss. The complexity of this area necessitates the use of a suite of indicators which link to ecosystem status, the delivery of policy and the implementation of action.
12. Headline indicator: area of forest, agricultural, fishery and aquaculture ecosystems under sustainable management
Within the SEBI 2010 process, it was not possible to define a simple indicator on 'Area of forest, agriculture, fishery and aquaculture ecosystems under sustainable management'. Sustainability is a multi-dimensional concept that is not easily covered by one single indicator. It covers both ecological (e.g. the size of the yielded stock, the state and production capability of the ecosystem, and damage outside and inside the ecosystem due to leaching, emissions, extraction, over-exploitation and impact (footprint) outside Europe) and socio-economic aspects (e.g. does the yield meet the human needs? Is the activity profitable in monetary terms? How many people does the sector employ?).
As sustainable management comprises these multiple dimensions, the indicators need to reflect this. Moreover, they may not always have a direct link to biodiversity. However, they do provide essential information with which to assess the sustainability of the different production sectors, of which the impact on biodiversity and ecosystems is a key element.
Within this headline, one or two specific indicators have been selected to address each of the listed ecosystems separately.
Forest:
• Growing stock, increment and fellings;
• Deadwood.
The indicator, 'Growing stock, increment and fellings' provides information on the stock size, wood production and its production capability. 'Deadwood' provides additional information on the state of the ecosystem, as a proxy for the state of many invertebrate species which are difficult to measure.
Agriculture:
• Nitrogen balance (input/output);
• Area under management practices potentially supporting biodiversity.
In contrast to forestry and fisheries, it makes less sense to select an 'exploited stock' indicator for agriculture. Nitrogen-balance provides information about the pressure on biodiversity from outside agri-ecosystems and its component nitrogen-input informs about the pressure on biodiversity inside the agri-ecosystem. The area under management practices potentially supporting biodiversity provides information on high nature value farmland (i.e. agricultural land with a high biodiversity value) as well as on specific responses that aim to have a beneficial effect on biodiversity within and outside agricultural areas (e.g. organic farming and agri-environment schemes that support biodiversity).
Fisheries/aquaculture:
• European commercial fish stocks;
• Effluent water quality from finfish farms.
The indicator, 'European commercial fish stocks' provides information on the stock size, production and production capability. 'Effluent water quality from finfish farms' provides information on the damage to the marine ecosystem by leakage. An indicator on damage by fishing methods is not available yet, but may be included in the future.
A full assessment of sustainable management requires analysis of the relationships between the ecosystem specific indicators and other relevant indicators from the proposed set (ecosystem coverage, common birds and butterflies, Red List Index, livestock genetic diversity, nationally designated protected areas, Marine Trophic Index and ecological footprint) as well as information from other sectoral indicator sets (e.g. IRENA, MCPFE) not included in the European biodiversity set, and socio-economic indicators, such as employment.
First discussion of the SEBI 2010 set of indicators
26 Halting the loss of biodiversity by 2010: proposal for a first set of indicators to monitor progress in Europe
The development and use of a broad range of indicators, both within and beyond the European biodiversity headline set, for the assessment of the sustainable management of the various economic sectors has been elaborated by Expert Group six and summarised elsewhere (8). These ideas will be developed further in the preparation of the indicator based assessment report to be published in 2008.
13. Headline indicator: ecological footprint of European countries
The specific indicator selected is:
• Ecological footprint of European countries.
Europe impacts on biodiversity far beyond its own borders and shores. The ecological footprint indicator was added to the CBD and European headline list for this reason. It is a key indicator in the set, as it measures, albeit indirectly, the potential impact of Europe's production and consumption on biodiversity outside Europe.
Focal area: status of access and benefits sharing
There is much political and public concern that the genetic resources provided by biodiversity must be exploited for human wellbeing and that benefits are equally shared in society. This focal area specifically targets this issue.
14. Headline indicator: percentage of European patent applications for inventions based on genetic resources
The specific indicator selected is:
• Patent applications based on genetic resources.
Many medicinal, pharmaceutical and health products are based on genetic resources. This raises issues about access to genetic resources and benefit-sharing, and also relates to public awareness of the services delivered by biodiversity. This indicator is pertinent to the contributions that biodiversity makes to human wellbeing and prosperity, and shows the scale and trends in European patent applications for inventions based on genetic resources. The indicator currently proposed merely shows the extent to which inventions are based on biodiversity, which as such does not indicate a positive or negative impact
on biodiversity. Further development should also enable the indicator to capture the issues of access and benefit-sharing.
Focal area: status of resource transfers and use
Funding to biodiversity demonstrates political and private commitment to the conservation of local and global biodiversity.
15. Headline indicator: funding to biodiversity
The specific indicator selected is:
• Financing biodiversity management.
This indicator represents a compilation of the amounts of specific expenditure relating to biodiversity within the EU budget. Once these amounts have been obtained, it can be expressed as a ratio in terms of the overall EU budget in addition to its expression in absolute terms. According to the headline, the indicator needs to be further developed to include transfers of money, e.g. support to biodiversity in overseas development cooperation. In addition, the indicator could cover funding from national budgets as well as private sources.
Focal area: public opinion (European focal area not included by the CBD)
Public opinion is a vital factor in influencing politicians and decision makers. It provides a barometer for public support and interest. Moreover, it constitutes a source of motivation for individuals at all levels to act.
16. Headline indicator: public awareness and participation
• Public awareness.
Several indicators were reviewed, for example, 'Volunteering for practical management activities on nature reserves', 'Paying for membership of wildlife NGOs or for wildlife campaigns', 'Nature watch programmes on television' or 'Visits to areas of natural beauty or nature reserves'. However, the availability of data and information are limited at this stage. The indicator proposed will be based on the Eurobarometer survey on biodiversity, and results are expected in September/October 2007.
(8) http://biodiversity-chm.eea.europa.eu/information/indicator/F1090245995/F1115193194.
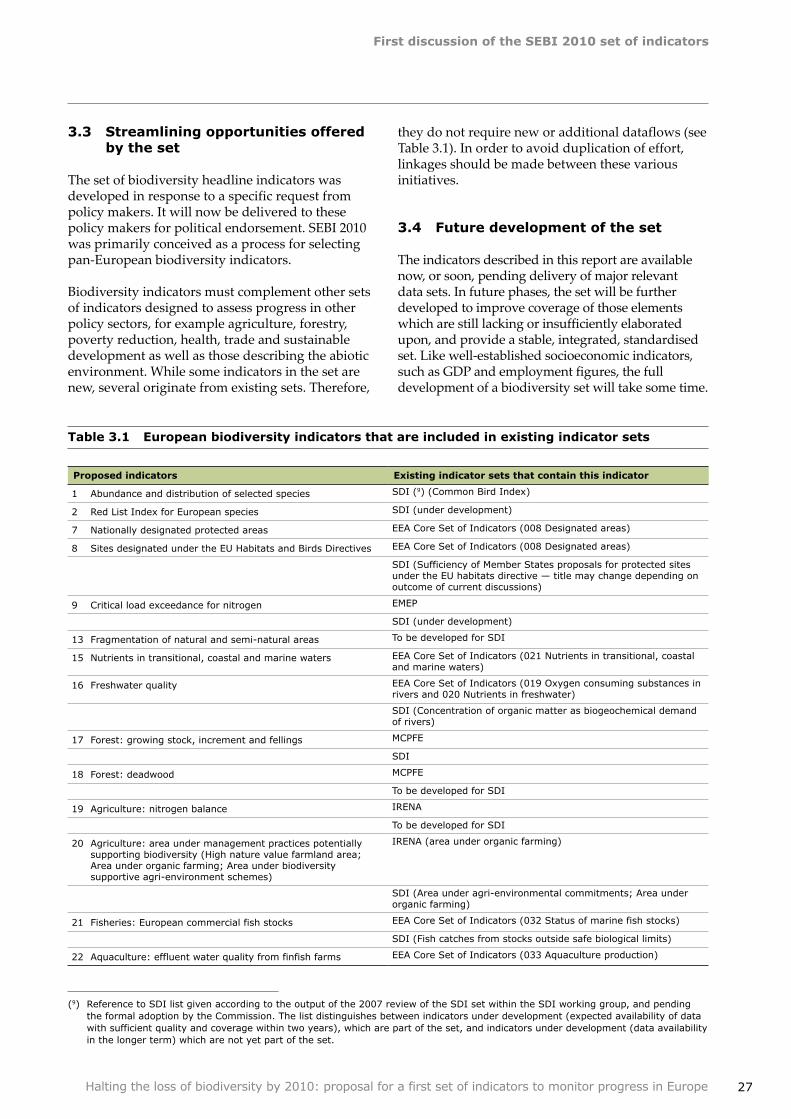
First discussion of the SEBI 2010 set of indicators
27Halting the loss of biodiversity by 2010: proposal for a first set of indicators to monitor progress in Europe
3.3 Streamlining opportunities offered by the set
The set of biodiversity headline indicators was developed in response to a specific request from policy makers. It will now be delivered to these policy makers for political endorsement. SEBI 2010 was primarily conceived as a process for selecting pan-European biodiversity indicators.
Biodiversity indicators must complement other sets of indicators designed to assess progress in other policy sectors, for example agriculture, forestry, poverty reduction, health, trade and sustainable development as well as those describing the abiotic environment. While some indicators in the set are new, several originate from existing sets. Therefore,
they do not require new or additional dataflows (see Table 3.1). In order to avoid duplication of effort, linkages should be made between these various initiatives.
3.4 Future development of the set
The indicators described in this report are available now, or soon, pending delivery of major relevant data sets. In future phases, the set will be further developed to improve coverage of those elements which are still lacking or insufficiently elaborated upon, and provide a stable, integrated, standardised set. Like well-established socioeconomic indicators, such as GDP and employment figures, the full development of a biodiversity set will take some time.
Table 3.1 European biodiversity indicators that are included in existing indicator sets
Proposed indicators Existing indicator sets that contain this indicator
1 Abundance and distribution of selected species SDI (9) (Common Bird Index)
2 Red List Index for European species SDI (under development)
7 Nationally designated protected areas EEA Core Set of Indicators (008 Designated areas)
8 Sites designated under the EU Habitats and Birds Directives EEA Core Set of Indicators (008 Designated areas)
SDI (Sufficiency of Member States proposals for protected sites under the EU habitats directive — title may change depending on outcome of current discussions)
9 Critical load exceedance for nitrogen EMEP
SDI (under development)
13 Fragmentation of natural and semi-natural areas To be developed for SDI
15 Nutrients in transitional, coastal and marine waters EEA Core Set of Indicators (021 Nutrients in transitional, coastal and marine waters)
16 Freshwater quality EEA Core Set of Indicators (019 Oxygen consuming substances in rivers and 020 Nutrients in freshwater)
SDI (Concentration of organic matter as biogeochemical demand of rivers)
17 Forest: growing stock, increment and fellings MCPFE
SDI
18 Forest: deadwood MCPFE
To be developed for SDI
19 Agriculture: nitrogen balance IRENA
To be developed for SDI
20 Agriculture: area under management practices potentially supporting biodiversity (High nature value farmland area; Area under organic farming; Area under biodiversity supportive agri-environment schemes)
IRENA (area under organic farming)
SDI (Area under agri-environmental commitments; Area under organic farming)
21 Fisheries: European commercial fish stocks EEA Core Set of Indicators (032 Status of marine fish stocks)
SDI (Fish catches from stocks outside safe biological limits)
22 Aquaculture: effluent water quality from finfish farms EEA Core Set of Indicators (033 Aquaculture production)
(9) Reference to SDI list given according to the output of the 2007 review of the SDI set within the SDI working group, and pending the formal adoption by the Commission. The list distinguishes between indicators under development (expected availability of data with sufficient quality and coverage within two years), which are part of the set, and indicators under development (data availability in the longer term) which are not yet part of the set.
First discussion of the SEBI 2010 set of indicators
28 Halting the loss of biodiversity by 2010: proposal for a first set of indicators to monitor progress in Europe
Learning by doing will be an indispensable part of this process. Using the indicators will help to determine priorities for improvement. Nevertheless, some consideration has already been given to the first set and the development of its components, so as to provide a better basis for monitoring progress towards the 2010 target. The 26 indicators do not directly address drivers of change but cover all the elements in the DPSIR model.
The driving forces belong to the socioeconomic domain and were not included in this first set of biodiversity headline indicators. In future, work will focus on improving linkages between the driving forces, such as agriculture, transport, forestry, tourism, that most directly contribute to the degradation of ecosystems and loss of ecosystem services resulting from such degradation. Ecosystem accounting methods anchored in the UN System of Economic and Environmental Accounting (SEEA) will become the framework within which such integrated analysis of both physical and monetary stocks and flows will be tested.
The main pressures on biodiversity are included in the first set: habitat loss (ecosystem extent), fragmentation of (semi) natural habitats and rivers, invasive alien species, pollution (freshwater quality, nutrients in marine waters, effluent water quality of fish farms, nitrogen deposition, nitrogen balance and input), and overexploitation ( forest growing stock, increment and fellings and ecological footprint of European countries).
The state indicators on the components of biodiversity at the levels of genes, species, and ecosystems are relatively well covered. At ecosystem level, 'ecosystem coverage' covers the change in extent of all major ecosystem types. 'Habitats of European interest' provides details on specific habitats within the major ecosystem types and reflects the policy response.
At species level, the European birds and butterflies indicators are available now, as well as the 'Red List Index'. More taxonomic groups may be included in the near future in order to provide a more representative picture of changes within the ecosystems. 'Species of European interest' provides details on specific species within the major ecosystem types, and, as for Habitats, reflects the policy response.
The indicator on genetic diversity only relates to species of economic importance, as decided by the CBD COP. Furthermore, the current selected indicator only captures a part of the domesticated
genetic diversity (livestock) and should be supplemented with information on crops, trees and fish genetic diversity in the near future.
These indicators are highly complementary and provide trends on key aspects of the homogenisation process. 'Ecosystem coverage' provides information on how much of the ecosystem is left (quantity), whereas the European birds and butterflies indicators and the 'Red List Index' provide information on the remaining (average) quality within these ecosystems.
Several other indicators in the set give additional information on components of biodiversity. The 'Marine Trophic Index' shows a specific aspect of the homogenisation process of marine ecosystems: the loss of the species at the top of the food chain. The number of commercial fish stocks outside safe biological limits also contributes information on the state of biodiversity, so too does 'deadwood' as a surrogate for approximately 50 % of the forest species. 'Alien invasive species' indicates replacement of the original species by non-natives.
Impacts on biodiversity are covered in the set by indicators such as the 'status of commercial fish stocks' and the 'Marine Trophic Index'. The indicators of 'ecosystem integrity and goods and services' are relevant indicators for the impact of biodiversity loss on society.
Indicators can reflect a pressure or impact, even though strictly speaking they are state indicators. An example in the set is the indicator on occurrence of 'temperature sensitive species' included under the headline 'impact of climate change on biodiversity'. An improved indicator for the impact of climate change on biodiversity would measure abundance of specific sensitive species, thus showing an impact on healthy systems caused by climate change. For climate change impact, further development of the proposed indicator is also required in order to for example extend geographical coverage, address other changes in distribution, and be clearer about actual effects on biodiversity.
In a future phase of work, analysis of additional ecosystem goods and services may be considered as well as the application of accounting-based methods to track changes in the physical stocks and flows of such services, and assigning economic values to such changes.
As for pressure, state and impact indicators, response indicators are also distributed across several focal areas. The following indicators
First discussion of the SEBI 2010 set of indicators
29Halting the loss of biodiversity by 2010: proposal for a first set of indicators to monitor progress in Europe
directly measure a response: 'nationally designated protected areas'; 'sites designated under the EU Habitats and Birds Directives'; 'financing biodiversity management'; agricultural area under management practices potentially supporting biodiversity' (biodiversity supportive agri-environmental schemes and organic farming); and 'public awareness'.
Some indicators are so closely linked to existing policies which are not targeted at biodiversity conservation (e.g. Common Agricultural Policy or Common Fisheries Policy ), that they also directly reflect the impacts of current policies, even though they may be indicators of state or pressure. Six specific indicators are included for the headline indicator on area of forest, agricultural, fishery and aquacultural ecosystems under sustainable management. This is essential from a response point of view, given the importance of including biodiversity concerns into productive sectors.
Some indicators in the current set record trends (e.g. population trends), others measure policy changes (e.g. designated sites). In future, it may be useful to develop indicators that enable the effect of policy interventions on trends to be measured.
The response indicators for biodiversity are arguably the weakest area of the set, both conceptually and in terms of methodologies and data available for constructing more useful and resonant indicators. Even though there is no separate focal area on responses, assessing the effect of responses is essential if progress to target is to be measured. Response indicators are therefore a key priority. For example, for the EU it is hoped that an information base will result from the expected reporting by European Union Member States under Article 17 of the Habitats Directive as well as the Biodiversity Action Plan under the Biodiversity Communication.
Looking more generically across the set, greater attention will be paid in future SEBI 2010 phases to the issue of the spatial scales at which indicators are calculated, presented and analysed. Four scales are envisaged: the European scale; the national scale; major ecosystem types (e.g. forest, grassland, inland water, marine, tundra, urban, agriculture); and bio-geographical regions (e.g. Boreal, Atlantic, Continental, Mediterranean, Alpine, Arctic).
Greater attention will also be given to indicator integration through the broader application of data modelling techniques and the development of aggregate and composite indicators, e.g. ecosystem
accounts or composite species indices. Baselines are also a vital consideration if indicators are to be meaningful when assessing changes over time. For instance, showing that there are 1 000 seals in the Wadden Sea has no real meaning in its own right. The statement only becomes meaningful when the figure is compared to a baseline, e.g. 500 seals as the minimum vital population, 100 seals as the threshold for the category 'critically endangered', comparison with 2 000 seals in 1995, or 6 000 seals in a low impacted intact ecosystem of similar size etc.
Finally, the core information on biodiversity loss and the change in species abundance of selected species needs further elaboration. This can be achieved by extending the number of species and groups towards a more representative set for each of the major ecosystem types. Improved coordination and organisation of available databases under the umbrella of a shared information system for biodiversity could greatly help at relatively little additional cost. Obtaining a consensus amongst policy and scientific stakeholders on the adoption of available datasets and analytical methods could also contribute to improving the set. Work has to be carried out to improve and streamline existing monitoring programmes, so that biodiversity is on a level footing with other environmental priorities, such as climate change, air quality and water. Action would include: improving European coverage and resolution in order to fill gaps, harmonise baselines and explore the determination of critical levels for sustainable management.
Making progress will require addressing financial issues related to the corresponding monitoring systems and especially those managed by NGOs where the financial constraints are clear. It is hoped that the SEBI 2010 process through the publication of this report and associated activities can help bring about increased investment in improving the evidence base for assessing progress towards the 2010 target. As mentioned earlier, monitoring, conservation and assessment of biodiversity depend to a much larger degree on NGO activities than is the case for other environmental issues. Funding for biodiversity monitoring substantially lags behind investments made by countries in other environmental issues, such as air and water quality and atmospheric emissions. Yet biodiversity is arguably as important as climate change for future policy action.
One of the on-going objectives of SEBI 2010 is to help ensure adequate funding, and much work still remains to be carried out. Very productive
First discussion of the SEBI 2010 set of indicators
30 Halting the loss of biodiversity by 2010: proposal for a first set of indicators to monitor progress in Europe
relationships have been developed with the NGO community as holders of key datasets, and further work on possible funding mechanisms to ensure sustained dataflows in this area is needed. Where available, the documentation in Section 2 contains details for each indicator on the cost of further development and production.
Accurate, systematic and adequately-funded monitoring systems should be considered for tracking changes over time across the indicators, and so ensuring the long-term viability and credibility of the system. Monitoring should be designed to ensure adequate species/habitat representativity,
sampling frequency, geographical coverage, and spatial resolution.
At the same time, not all actions require substantial additional investments in order for improvements to be realised. For example, improved collaboration and coordination between the vast array of actors and the already collected and developed data and methodologies is one possible action. Huge efficiencies have already been made during this phase of SEBI 2010 as a result of tapping into ongoing activities in other sectors, and many more can be realised in future phases especially within the biodiversity domain.
31
Annex: SEBI 2010 Coordination Team and Expert Groups
Halting the loss of biodiversity by 2010: proposal for a first set of indicators to monitor progress in Europe
Annex: SEBI 2010 Coordination Team and Expert Groups
The Coordination Team, as initially established in January 2005, consisted of a representative of the EEA, covering EU/EEA countries, of ECNC, covering other PEBLDS countries and of UNEP-WCMC, covering links to the global/CBD activities. During 2005, the Team was expanded to include (initially informally, eventually more formally) the coordinators and chairs of the six Phase 1 Expert Groups plus representatives of DG Environment of the European Commission, PEBLDS joint secretariat and the Czech Republic (as lead country for the PEBLDS action plan on biodiversity indicators):
Gordon McInnes (EEA): SEBI 2010 Coordinator, Frederik Schutyser (EEA): SEBI 2010 secretariat, Vibeke Horlyck: SEBI 2010 secretariat (2005 and early 2006), Ivone Pereira Martins (EEA), Lawrence Jones-Walters (and Ben Delbaere in 2005 and 2006) (ECNC), Jerry Harrison (UNEP-WCMC), Anne Teller (European Commission DG Environment), Ivonne Higuero (PEBLDS Joint Secretariat), Jan Plesnik (Czech Republic).
Expert Group 1: Coordinator — Sophie Condé (ETC-BD), Chair — James Williams (the United Kingdom, ETC-BD).
Expert Group 2: Coordinator — Rania Spyropoulou (EEA), Chair — Laurent Duhautois (France).
Expert Group 3: Coordinator — Dominique Richard (ETC-BD), Chair — Ulla Pinborg (Denmark)
Expert Group 4: Coordinator — Ben Delbaere (ECNC), Chair — Simon Bareham (the United Kingdom, ETC-BD)
Expert Group 5: Coordinator — Tor-Björn Larsson (EEA), Chair — Snorri Baldursson (Iceland).
Expert Group 6: Coordinator — Ivonne Higuero (PEBLDS) Chair — Ben ten Brink (the Netherlands).
The Expert Groups and Coordination Team covered the following headline indicators:
EU headline indicator EG or CT responsible
Trends in the abundance and distribution of selected species
EG1
Change in status of threatened and/or protected species
EG1
Trends in extent of selected biomes, ecosystems and habitats
EG2
Trends in genetic diversity of domesticated animals, cultivated plants, and fish species of major socioeconomic importance
EG3
Coverage of protected areas CT
Nitrogen deposition EG4
Trends in invasive alien species EG5
Impact of climate change on biodiversity CT
Marine Trophic Index CT
Connectivity/fragmentation of ecosystems EG2
Water quality in aquatic ecosystems CT
Area of forest, agricultural, fishery and aquaculture ecosystems under sustainable management
EG6
Ecological Footprint of European countries CT
Percentage of European patent applications for inventions based on genetic resources
CT
Funding to biodiversity CT
Public awareness and participation CT
Members of the different Expert Groups are listed below:
EG 1
Larisa Nikolaevna Aleinikova, Ministry of Natural Resources (Russia), Ian Burfield, BirdLife International, Stuart Butchart, BirdLife International, Denis Couvert, Muséum National d'Histoire Naturelle (France), Luc De Bruyn, Flemish government, Mireille De Heer, (formerly) Environment Assessment Agency (the Netherlands), Jan Dušek, Agency for Nature Conservation and Landscape Protection (Czech Republic), Christoph Eichen, Ministry for the Environment (Germany), Erik Framstad, Institute for Nature Research (Norway),
Note: EG = Expert Group, CT = Coordination Team.
Annex: SEBI 2010 Coordination Team and Expert Groups
32 Halting the loss of biodiversity by 2010: proposal for a first set of indicators to monitor progress in Europe
Marie Therese Gambin, Environment and Planning Authority (Malta), Ward Hagemeijer, Wetlands International, Borja Heredia, Ministerio de Medio Ambiente (Spain), Maria Ingimarsdottir, Institute of Natural History (Iceland), Nevana Ivanova, Executive Environment Agency (Bulgaria), Romain Julliard, Muséum National d'Histoire Naturelle (France), Fons Koomen, Ministry of Agriculture, Nature & Food Quality (the Netherlands), Ulla-Maija Liukko, Environment Institute (Finland), Jonathan Loh, WWF International, Grégoire Loïs, European Topic Centre on Biological Diversity, Edmund McManus, (formerly) UNEP-WCMC, now CEFAS (the United Kingdom), Svetozar Petkovski, BIOECO (FYR of Macedonia), Didier Pont, National Centre for Scientific Research (France), Liutauras Raudonikis, Institute of Ecology of Vilnius (Lithuania), Angelika Rubin, European Commission, DG Environment, Norber Sauberer, Umweltbundesamt (Austria), Andrej Saxa, State Nature Conservancy (Slovakia), Larry Speers, GBIF, Andreas Streit, UNEP/EUROBATS, Andrew Terry, IUCN — The World Conservation Union, Dace Vainauska, Environment Agency (Latvia), Chris van Swaay, Butterfly Conservation Europe BCE/Dutch Butterfly Conservation, Ildikó Varga, Ministry of Environment and Water (Hungary), Adrian Zangger, BDM Coordination Office (Switzerland), Hanno Zingel, Environment Information Centre (Estonia).
EG 2
Danial Baláž, State Nature Conservancy (Slovakia), Pavla Bortlova, European Landowners Association, Irene Bouwma, Centre for Geo-Information (the Netherlands), Robertina Brajanoska, Ministry of environment and physical planning (FYR of Macedonia), Geert De Blust, ECOLAND Institute of Nature Conservation (Belgium), Ellen Dieme, Wetlands International, Edward Mackay, Scottish Natural Heritage (the United Kingdom), Ásrún Elmarsdóttir, Institute of Natural History (Iceland),
Franz Essl, Umweltbundesamt (Austria), Christine Estreguil, Joint Research Centre, Livia Kisné, Ministry of Environment and Water (Hungary), Georg Frank, BFW (Austria), Lauri Klein, Environment Information Centre (Estonia), Marco Marchetti, AISF-UNIMOL, Irina Merzlyakova, Biodiversity Conservation Centre (Russia), Tine Nielsen Skafte, Forest and Nature Agency (Denmark), Bruno Petriccione, National Forest Service (Italy), Pavol Polák, State Nature Conservancy (Slovakia), Radoslav Stanchev, Executive Environment Agency (Bulgaria), Jesus San Miguel Ayanz, Joint Research Centre, Duncan Stone, Scottish Natural Heritage (the United Kingdom), Jo van Brusselen, European Forest Institute, Joost Van der Velde, European Commission DG Environment, Peter Veen, Royal Dutch Society for Nature Conservation, Peter Vogt, Joint Research Centre, Jean-Louis Weber, EEA, Ad hoc invited marine experts
Antti Räike, Ministry of Environment (Finland), Beate Werner, EEA, Christoffer Bostroem, Åbo Akademi University (Finland), Corinna Ravilious, UNEP-WCMC, Eva Gelabert, EEA, Graham Saunders, Scottish Heritage (the United Kingdom), Harald Aasmus, Alfred Wegener Institute (Germany), Hermanni Backer, HELCOM (Finland), Ian Payne, MRAG (the United Kingdom), John Pinnegar, CEFAS (the United Kingdom), Jørgen Nørrevang Jensen, ICES, Leonardo Tunesi, ICRAM, Lobna Ben Nakhla, UNEP, Panagiotis Panagiotidis, National Centre for Marine Research, Reg Watson, UBC Fisheries Centre, Aquatic Ecosystems Research Laboratory (Canada), Sabine Christiansen, WWF, Schrimph Wolfram, Joint Research Centre.
EG 3
Sreten Andonov, Faculty of Agriculture and Food Science (FYR of Macedonia), Bart Barten, FAO,
Annex: SEBI 2010 Coordination Team and Expert Groups
33Halting the loss of biodiversity by 2010: proposal for a first set of indicators to monitor progress in Europe
Frank Begemann, Bundesanstalt für Landwirtschaft und Ernährung (Germany), Eleonore Charvolin, Bureau des ressources génétiques (France), Sónia Dias, Bioversity International, Brian Ford-Lloyd, School of Biosciences, University of Birmingham, Samy Gaiji, Bioversity International, Sipke-Joost Hiemstra, Centre for Genetic Resources Wageningen University (the Netherlands), Nigel Maxted, School of Biosciences University of Birmingham (the United Kingdom), Dominique Planchenault, Bureau des Resources Génétiques (France), Dimitri Politov, Academy of Sciences (Russia), Giovanni Giuseppe Vendramin, Plant Genetic Institute (Italy).
EG 4
Simon Bareham, European Topic Centre on Biological Diversity, Sergey Alexandr Blagodatsky, Academy of Science (Russia), Albert Bleeker, Energy Research Centre for the Netherlands, Etienne Dambrine, National Institute for Agricultural Research (France), Thomas Dirnboeck, Umweltbundesamt (Austria), Alan Feest, WEMRC Bristol University, (the United Kingdom), Maarten Hens, Institute for Nature Conservation (Belgium), Ljubcho Melovski, Institute of Biology (FYR of Macedonia), Michel Sponar, European Commission, DG Environment, Mark Sutton, Centre for Ecology and Hyrdrology (the United Kingdom), Arjen van Hinsberg, Environmental Assessment Agency (the Netherlands).
EG 5
Alicia Acosta, Agency for Environmental Protection and Technical Services (Italy), Laura Celesti-Grapow, University of Rome (Italy), Andras Demeter, European Commission, DG Environment, Yury Dgebuadze, Academy of Science (Russia), Ema Gojdicova, Nature Conservancy (Slovakia), Philip Hulme, Centre for Ecology and Hydrology (the United Kingdom), Melanie Josefsson, Environmental Protection Agency (Sweden), Kaarina Kauhala, Game and Fisheries Research Institute (Finland),
Martin Krivanek, Academy of Science (Czech Republic), Grégory Mahy, Gembloux Agricultural University (Belgium), Ian McLean, Joint Nature Conservation Committee, Serge Muller, University of Metz (France), Wolfgang Rabitsch, Umweltbundesamt (Austria), Jose M. Rico, Universidad de Oviedo (Spain), Hans Erik Svart, Forest and Nature Agncy (Denmark), Vladimir Vladimirov, Institute of Botany (Bulgaria) Argyro Zenetos, Hellenic Centre for Marine Research (Greece).
EG 6
Marie Belling, European Landowners Association, Robin du Parc, European Landowners Association, Myriam Dumortier, Institute for Nature Conservation (Belgium), Anders Hildingsson, National Board of Forestry (Sweden), Stefanie Linser, Umweltbundesamt (Austria), Linas Ložys, Institute of Ecology (Lithuania), Leticia Martinez-Aguilar, European Commission, DG Fisheries, Carlos Martin-Novella, Ministerio de Medio Ambiente (Spain), Roman Michalak, Liaison Unit of the Ministerial Conference on the Protection of Forests in Europe, Maria Luisa Paracchini, Joint Research Centre, Jari Parviainen, Forest Research Institute (Finland), Jan-Erik Petersen, EEA, Claudio Piccini, Agency for Environmental Protection and Technical Services (Italy), Pasi Rautio, European Commission, DG Environment, Ieva Ruchevska, UNEP, Andrej A. Sirin, Academy of Science (Russia), Nikos Streftaris, Hellenic Centre for Marine Research (Greece), Katja Troeltzsch, European Forest Institute , Gerard Van Dijk, Ministry of Agriculture (the Netherlands).
In addition to EG members, the following people contributed through participation in the November 2006 workshop:
Ari-Pekka Auvinen, Ministry of Environment (Finland), Françoise Breton, European Topic Centre on Terrestrial Environment, Zoe Cokeliss, UNEP-WCMC, Christophe Derzelle, European Commission, DG Agriculture, Gorm Dige, EEA, Lars Gaudal, University of Copenhagen (Denmark),
Annex: SEBI 2010 Coordination Team and Expert Groups
34 Halting the loss of biodiversity by 2010: proposal for a first set of indicators to monitor progress in Europe
Roy Haines Young, Nottingham University (the United Kingdom), Joerg Hoffman, Agricultural Research Centre (Germany), Robert Hoft, UNEP-SCBD, Ludo Holsbeek, EEA Management Board, Ybele Hoogeveen, EEA, Justin Kitzes, Global Footprint Network, Laure Ledoux, Eurostat, Els Martens, Agency for Nature and Forests, Flemish Government, Mark Marissink, Environmental Protection Agency (Sweden), Pierre Nadin, Eurostat, Szabolcs Nagy, Wetlands International, Jos Noteboom, Environment Assessment Agency (the Netherlands),
Tore Opdahl, Directorate for Nature Management (Norway), Július Oszlányi, EEA Scientific Committee, Stefan Schröder, Agency for Agriculture and Food (Germany), Hélène Souan, Ministry of Ecology (France), Andrew Stott, Department for Environment, Food and Rural Affairs (the United Kingdom), Beatriz Torres, GBIF, Angheluta Vadineanu, National University Research Council (Romania), Jelle van Minnen, European Topic Centre on Air and Climate Change, Eva Viestova, European Commission DG Environment.
35
References and further reading
Halting the loss of biodiversity by 2010: proposal for a first set of indicators to monitor progress in Europe
References and further reading
American Museum of Natural History, 2005. The current mass extinction. http://www.well.com/user/ davidu/extinction.html. Last accessed 02/05/2006.
Background paper for the joint meeting of Eionet, IWG-BioMIN and PEBLDS 'Development of plan and guidelines for indicators and monitoring to help achieve the 2010 target for biodiversity in Europe', 21–23 April 2004, EEA, Copenhagen, Denmark. http://biodiversity-chm.eea.eu.int/information/indicator/F1078143615.
CBD, 2004. Decision VII/30 of the Seventh Conference of the Parties to the Convention on Biological Diversity (CBD/COP7) 'Strategic Plan: future evaluation of progress'. http://www.biodiv.org/decisions/default.aspx?dec=VII/30.
CEC, 2006. Halting the loss of biodiversity by 2010 and beyond, sustaining ecosystem services for human wellbeing. COM(2006)216 final. Brussels, Commission of the European Communities.
Delbaere, B., 2002. Biodiversity Indicators and Monitoring: Moving towards implementation. Tilburg, ECNC, European Centre for Nature Conservation. http://www.ecnc.org/jump/page/150/biodindi.html.
EEA, 1999. Environmental indicators: Typology and overview. Technical report No 25. Luxembourg, Office for Official Publications of the European Communities.
EEA, 2004a. An inventory of biodiversity indicators in Europe. Technical report No 92. Luxembourg, Office for Official Publications of the European Communities. http://reports.eea.eu.int/technical_report_2004_92/en/Technical92_for_web.pdf.
EEA, 2004b. Impacts of Europe's changing climate, An indicator‑based assessment. EEA Report No 2/2004. Luxembourg, Office for Official Publications of the European Communities.
EEA, 2006. Progress towards halting the loss of biodiversity by 2010. EEA Report No 5/2006. Luxembourg, Office for Official Publications of the European Communities.
EEA, 2007. Europe's environment — The fourth assessment. Luxembourg, Office for Official Publications of the European Communities.
ETC/NPB, 2003. An inventory of European site-based biodiversity monitoring networks. Final draft report, prepared by ECNC — European Centre for Nature Conservation. Copenhagen, European Environment Agency. http://biodiversity.eionet.eu.int/activities/products/report_folder/monitoring.pdf.
EU Council conclusions of 28 June 2004 on Halting the loss of biodiversity by 2010 (10997/04) which endorsed the list of EU headline biodiversity indicators. http://register.consilium.eu.int/pdf/en/04/st10/st10997.en04.pdf.
European Parliament, 2004. Seminar report 'Europe joining forces to reach the 2010 biodiversity target — the need for coordinated monitoring', 23 March 2004, European Parliament, Brussels, Belgium. http://www.ecnc.nl/doc/ecnc/publicat/EP_Seminar_Report.pdf.
Kyiv action plan on biodiversity monitoring and indicators, endorsed by the Task Force and Bureau of the Pan-European Biological and Landscape Diversity Strategy (PEBLDS), 14 May 2004, Strasbourg, France. http://www.strategyguide.org/docs/bureau/may2004/STRA-CO(2004)3f_Rev_E.doc.
MA, 2003. Millennium Ecosystem Assessment. Ecosystems and human well‑being : a framework for assessment. Island Press, Washington, DC.
MA, 2005. Millennium Ecosystem Assessment, 2005. Ecosystems and Human Well‑being: Biodiversity Synthesis. World Resources Institute, Washington, DC.
Message from Malahide, 2004. Outcome of the EU Presidency stakeholder conference 'Biodiversity and the EU — Sustaining life, sustaining livelihoods', 25–27 May 2004, Malahide, Ireland. http://ec.europa.eu/environment/nature/biodiversity/develop_biodiversity_policy/malahide_conference/pdf/conference_report.pdf and background paper on the list of EU headline biodiversity indicators. http://ec.europa.eu/environment/nature/biodiversity/
References and further reading
36 Halting the loss of biodiversity by 2010: proposal for a first set of indicators to monitor progress in Europe
develop_biodiversity_policy/malahide_conference/pdf/malahide_mp_indicators.pdf.
SEBI 2010, 2005. Workplan. http://biodiversity-chm.eea.europa.eu/information/indicator/F1090245995/F1109571466/1109571594.
ten Brink, B.J.E., 2000. Biodiversity indicators for the OECD Environmental outlook and Strategy, a feasibility study. RIVM report 402001014, in cooperation with WCMC, Cambridge/Bilthoven.
ten Brink, B.J.E., et al., 2007. Cross‑roads of Life on Earth. Exploring means to meet the 2010 Biodiversity Target. Secretariat of the Convention on Biological Diversity, Montreal, Technical series no. 31.
Thomas J.A., Telfer M. G., Roy D. B., Preston C. D., Greenwood J. J. D., Asher J., Fox R., Clarke R. T., and J. H. Lawton, 2004. Comparative Losses of British Butterflies, Birds, and Plants and the Global Extinction Crisis. Science 303: 1879–1881.
Pauly, D., Christensen, V., Dalsgaard, J., Froese, R. & Torres, F.C., Jr., 1998. Fishing down marine food webs. Science 279: 860–863.
Pauly, D., 1995. Anecdotes and the shifting baseline syndrome of fisheries. Trends in Ecology and Evolution, Vol. 10, No 10, p. 430.
Lockwood, J.L., McKinney M.L., 2001. Biotic Homogenization. Kluwer Academic/Plenum Publishers.
Myers, R.A., Worm, B., 2003. Rapid worldwide depletion of predatory fish communities. Nature 423: 280–283.
Scholes, R.J. and Biggs, R., 2005. A biodiversity intactness index. Nature 434: 45–49.
37
Abbreviations and acronyms
Halting the loss of biodiversity by 2010: proposal for a first set of indicators to monitor progress in Europe
Abbreviations and acronyms
2010BIP 2010 Biodiversity Indicators Partnership
BAPs Biodiversity action plans
Birds Directive Council Directive 79/409/EEC of 2 April 1979 on the conservation of wild birds
CAP EU's Common Agricultural Policy
CBD UN Convention on Biological Diversity
CFP EU's Common Fisheries Policy
CLC Corine land cover
CLE Critical Load Exceedance
COP Conference of the Parties
DG Directorate General
DPSIR Driver, pressure, state, impact and response (DPSIR) model of indicators
EBMI-F European Biodiversity Monitoring and Indicator Framework
EC European Commission
ECBS EC Biodiversity Conservation Strategy
ECNC European Centre for Nature Conservation
EEA European Environment Agency
EECCA Eastern Europe, Caucasus and Central Asia (Armenia, Azerbaijan, Belarus, Georgia, Kazakhstan, Kyrgyzstan, Moldova, Russian Federation, Tajikistan, Turkmenistan, Ukraine and Uzbekistan)
Eionet European Environment Information and Observation Network
EMMA European Marine Monitoring and Assessment
ETC European Topic Centre
ETC/BD European Topic Centre on Biological Diversity (established in support of EEA)
EU-27 Austria, Belgium, Bulgaria, Cyprus, Czech Republic, Denmark, Estonia, Finland, France, Germany, Greece, Hungary, Ireland, Italy, Latvia, Lithuania, Luxembourg, Malta, Poland, Portugal, Romania, Slovakia, Slovenia, Spain, Sweden, the Netherlands, the United Kingdom
FAO UN Food and Agriculture Organisation
Abbreviations and acronyms
38 Halting the loss of biodiversity by 2010: proposal for a first set of indicators to monitor progress in Europe
Habitats Directive
Council Directive 92/43/EEC of 21 May 1992 on the conservation of natural habitats and of wild fauna and flora
GEF Global Environment Facility
HNV High nature value (farmland)
IGO Intergovernmental Organisation
IRENA Indicator reporting on the integration of environmental concerns into agriculture policy (EU)
IUCN The World Conservation Union
IWG-BioMIN International Working Group on Biodiversity Monitoring and Indicators
MA Millennium Ecosystem Assessment
MCPFE The Ministerial Conference for Protection of Forests in Europe
MTI Marine Trophic Index
NGO Non Governmental organisation
OECD Organisation for Economic Co-operation and Development
PEBLDS Pan-European Biological and Landscape Diversity Strategy (Council of Europe)
PSR Pressure State Response
SBSTTA The CBD's Subsidiary Body on Scientific, Technical and Technological Advice
SDI Sustainable Development Indicators
SEBI 2010 Streamlining European 2010 Biodiversity Indicators
UN United Nations
UNECE United Nations Economic Commission for Europe
UNEP United Nations Environment Programme
UNEP/ROE United Nations Environment Programme Regional office for Europe
UNEP-WCMC United Nations Environment Programme World Conservation Monitoring Centre
WWF World Wide Fund for Nature
39
Contents
Halting the loss of biodiversity by 2010: proposal for a first set of indicators to monitor progress in Europe
Part II — Technical specifications of the 26 indicators
Contents
1 Abundanceanddistributionofselectedspecies:a.commonbirdsandb.butterflies.........40
2 RedListIndexforEuropeanspecies.................................................................................51
3 SpeciesofEuropeaninterest............................................................................................58
4 Ecosystemcoverage.........................................................................................................62
5 HabitatsofEuropeaninterest...........................................................................................70
6 Livestockgeneticdiversity................................................................................................74
7 Nationallydesignatedprotectedareas..............................................................................80
8 SitesdesignatedundertheEUHabitatsandBirdsDirectives............................................84
9 Criticalloadexceedancefornitrogen................................................................................89
10 InvasivealienspeciesinEurope.......................................................................................95
11 Occurrenceoftemperature‑sensitivespecies.................................................................110
12 MarineTrophicIndexofEuropeanseas..........................................................................113
13 Fragmentationofnaturalandsemi‑naturalareas...........................................................117
14 Fragmentationofriversystems......................................................................................122
15 Nutrientsintransitional,coastalandmarinewaters......................................................128
16 Freshwaterquality..........................................................................................................132
17 Forest:growingstock,incrementandfellings................................................................137
18 Forest:deadwood...........................................................................................................143
19 Agriculture:nitrogenbalance.........................................................................................147
20 Agriculture:areaundermanagementpracticespotentiallysupportingbiodiversity........150
21 Fisheries:Europeancommercialfishstocks....................................................................156
22 Aquaculture:effluentwaterqualityfromfinfishfarms...................................................159
23 EcologicalfootprintofEuropeancountries......................................................................162
24 Patentapplicationsbasedongeneticresources..............................................................168
25 Financingbiodiversitymanagement...............................................................................176
26 Publicawareness............................................................................................................180
This part contains the detailed technical specifications for the individual indicators, with details on policy context, data availability, and methodology. Please note:
these specifications are evolving, and may be updated; the 'policy questions' should be seen as questions the indicators help answer, and not as questions to which the indicators can give a complete answer;the graphical representation suggested for each indicator is often based on dummy data and the information in the graphs should not be used to make assessments.
••
•
40
1Abundanceanddistributionofselectedspecies
Halting the loss of biodiversity by 2010: proposal for a first set of indicators to monitor progress in Europe
Focalarea Status and trends of the components of biological diversity
Europeanindicatorheadline
Trends in abundance and distribution of selected species
Keypolicyquestion Which species are being reduced in abundance and distribution, and what actions are being taken to reverse these negative trends?
Definitionoftheindicator
This indicator shows trends in the abundance of common birds and butterflies over time across their European ranges.
Indicatortype(DPSIR) State
Context a.commonbirds
Composite population trend indicators, such as the common bird index, provide a tangible basis for measuring progress towards the European target of halting biodiversity loss by 2010, and thus towards the global target of reducing the current rate of biodiversity loss by 2010. The strength of this approach is its simplicity, statistical rigor, sensitivity to change, and ease of update (which is possible annually). The purpose of the common bird index is to enable policy makers to assess and respond to changes in the environment, and then to review the effectiveness of their actions through time. The index complements other trend information on species, sites and habitats. The farmland bird index has been adopted as a structural indicator, as a Sustainable Development Indicator by the EU, and as a baseline indicator under the Rural Development Regulation (Council Regulation (EC) No 1698/2005 on support for rural development by the European Agricultural Fund for Rural Development (EAFRD)), which obliges all EU Member States to monitor farmland birds in the context of agri‑environment measures.
b. butterflies
Insects are by far the most species‑rich group of animals, representing over 50 % of terrestrial biodiversity. Contrary to most other groups of insects, butterflies are well documented, easy to recognize and popular with the general public. Butterflies use the landscape at a fine scale and react quickly to changes in management, intensification or abandonment. Furthermore, a sustainable butterfly population relies on a network of breeding habitats scattered over the landscape, where species exist in a metapopulation structure. This makes butterflies especially vulnerable to habitat fragmentation. Moreover, many butterflies are highly sensitive to climate change and nitrogen deposition and, because data from fine‑scale mapping is available in many countries, they have been used in models predicting the impact of climate change on wildlife. Butterflies have been counted in Butterfly Monitoring Schemes since 1976.
Relationoftheindicatortothefocalarea
a.commonbirds
Each species reacts differently to the various anthropogenic pressures that potentially impact on the population size. By monitoring a large enough number of populations from different birds groups, different biogeographic regions and areas subjected to different types and levels of pressures, this indicator has a potential to alert decision makers of the decline of populations in relation to environmental and geographic factors, as well as their potential drivers.
b. butterflies
The European Butterfly Indicator will be able to deliver a reliable measurement of changes in the size of European butterfly populations. Since butterfly trends are a good indicator of changes in the insect group as a whole, which in turn represents more than 50 % of Europe's biodiversity, the European Butterfly Indicator is a useful proxy for a wider understanding of biodiversity changes.
1 Abundanceanddistributionofselectedspecies:a.commonbirdsandb.butterflies
1Abundanceanddistributionofselectedspecies
41Halting the loss of biodiversity by 2010: proposal for a first set of indicators to monitor progress in Europe
Data sources and methodologyDataavailability a.commonbirds
From EU‑27 countries it is available in: Austria, Belgium, Czech Republic, Denmark, Finland, France, Germany, Hungary, Ireland, Italy, Latvia, Netherlands, Poland, Spain, Sweden and United Kingdom.
From PEBLDS countries it is available in: Norway and Switzerland.
New schemes are in operation in Bulgaria and Portugal, and in time these data will be used by the Pan‑European Common Bird Monitoring (PECBM) scheme (1). Good trend information is also available from Estonia but capacity problems have proved a barrier to use by the PECBM scheme, so information is not yet available for this country.
b. butterflies
United Kingdom: all species since 1976, annually from hundreds of sites.Transcarpathia (Ukraine): field data collected for all species at 20–30 sites since 1983, but at present only analysed for one species (Erynnis tages).Germany: in the Pfalz region there is monitoring data on three habitat directive species (Maculinea teleius, M. nausithous and Lycaena dispar) available since 1989 from almost 100 sites.Germany: Nordrhein‑Westfalen, all species since 2001. In 2005 data from over 100 sites is available.Germany: in 2005 a nationwide monitoring scheme was launched. In the first year, counts were made at a few hundred sites.The Netherlands: all species monitored since 1990. In 2005 data are available from 600 sites.Belgium (Flanders): all species since 1991 from 10–20 sites.Spain (Catalunya): all species since 1994 from 50–60 sites.Switzerland (Aargau): all species since 1998 from over 100 sites.Switzerland: in the rest of the country butterfly monitoring data have been collected since 2000 from at least 100 sites annually.Finland: all species monitored since 1999 from approximately 100 sites.France (Doubs and Dordogne): all species monitored since 2001 from ten sites.France: all occurring species from 2005 onwards.Jersey (Channel Islands): all species since 2004 from 25 sites.Estonia: all species on seven transects since 2004.
There are well‑established plans in Slovenia and Portugal to start up nationwide butterfly monitoring from 2007 or 2008 onwards.
••
•
•
•
•
••••
•••••
(1) The PECBM scheme is a partnership involving the European Bird Census Council, the Royal Society for the Protection of Birds, BirdLife International and Statistics Netherlands that aims to deliver policy relevant biodiversity indicators for Europe.
1Abundanceanddistributionofselectedspecies
42 Halting the loss of biodiversity by 2010: proposal for a first set of indicators to monitor progress in Europe
Methodology a.commonbirds
Trend information is derived from annually operated national breeding bird surveys spanning different periods from 18 European countries, obtained through the Pan‑European Common Bird Monitoring scheme (PECBM) (1). A software package named TRIM (Trends and Indices for Monitoring data) (which allows for missing counts in the time series and yields unbiased yearly indices and standard errors using Poisson regression) is used to calculate national species' indices and then to combine these into supranational indices for species, weighted by estimates of national population sizes. Weighting allows for the fact that different countries hold different proportions of each species' European population. Updated population size estimates, derived from BirdLife International (2004) are used for weighting. Although national schemes differ in count methods in the field, these differences do not influence the supranational results because the indices are standardised before being combined. An improved hierarchical imputation procedure was introduced in 2005 to calculate supranational indices. Supranational indices for species were then combined on a geometric scale to create multi‑species indicators. For more details see Gregory et al. 2005.
Listofspecies
Common farmland birds, Europe:Alauda arvensis, Burhinus oedicnemus, Carduelis carduelis, Columba palumbus, Emberiza citrinella, Falco tinnunculus, Galerida cristata, Hirundo rustica, Lanius collurio, Lanius senator, Limosa limosa, Miliaria calandra, Motacilla flava, Passer montanus, Saxicola rubetra, Streptopelia turtur, Sturnus vulgaris, Sylvia communis, Vanellus vanellus.
Common forest birds, Europe:Anthus trivialis, Bonasa bonasia, Carduelis flammea, Carduelis spinus, Certhia brachydactyla, Certhia familiaris, Coccothraustes coccothraustes, Dendrocopos minor, Dryocopus martius, Ficedula albicollis, Ficedula hypoleuca, Fringilla montifringilla, Garrulus glandarius, Hippolais icterina, Jynx torquilla, Lullula arborea, Luscinia megarhynchos, Muscicapa striata, Oriolus oriolus, Parus ater, Parus caeruleus, Parus montanus, Parus palustris, Phoenicurus phoenicurus, Phylloscopus collybita, Phylloscopus sibilatrix, Picus canus, Picus viridis, Prunella modularis, Pyrrhula pyrrhula, Regulus regulus, Sitta europaea, Sylvia borin.
Other common birds, Europe:Accipiter nisus, Aegithalos caudatus, Buteo buteo, Carduelis cannabina, Carduelis chloris, Cettia cetti, Cisticola juncidis, Corvus corone corone/cornix, Corvus monedula, Cuculus canorus, Dendrocopos major, Emberiza schoeniclus, Erithacus rubecula, Fringilla coelebs, Motacilla alba, Parus major, Phylloscopus trochilus, Pica pica, Sylvia atricapilla, Sylvia melanocephala, Troglodytes troglodytes, Turdus merula, Turdus philomelos, Turdus viscivorus, Upupa epops.
Rationale for species selection:
For the indicator as produced in June 2005, the species selection was based on BirdLife's Habitats for birds in Europe (Tucker and Evans 1997) — arguably the most comprehensive treatment of habitats and habitat use by birds. It quantitatively assesses the proportion of each species' population that occurs in predefined habitat types across Europe. The overall assessment, while mostly quantitative, also relied to some degree on expert judgment through habitat working groups.
In the PECBM scheme, species were classified to habitat using the assessment of Tucker and Evans (1997), with the exception that montane grassland, (originally included as a sub‑class of agricultural habitats) was classified as a separate habitat. All species with more than 75 % of their population occurring in one of the following eight habitats were classified as specialists of that habitat: marine; coastal; inland wetland; tundra, mires and moorland; boreal and temperate forests; Mediterranean forest, shrubland and rocky habitats; agricultural and grassland (excluding montane grassland); and montane grassland (Tucker and Evans 1997).
1Abundanceanddistributionofselectedspecies
43Halting the loss of biodiversity by 2010: proposal for a first set of indicators to monitor progress in Europe
In addition, species with 10–75 % of their population using only one of the above were classed as specialists in that habitat, according either to Tucker and Evans (1997) for Species of European Conservation Concern (SPECs), or according to the description of Snow and Perrins (1998) for non‑SPECs. Species with 10–75 % of their population in three or more woodland or farmland sub‑categories in Tucker and Evans (1997) and 10– 75 % of their population in only one other habitat category were classified as woodland or farmland specialist species respectively.
Remaining species with more than 10 % of their population occurring on more than one habitat were classed as non‑specialists. Any species that did not meet the above criteria (due to insufficient data) remained unclassified. Tucker and Evans (1997) include a further habitat of lowland Atlantic heathland; however, no species met the criteria to be classed as a specialist of this habitat.
This species‑habitat classification is being used in a number of BirdLife analyses — for example, of farmland birds and long‑distance migrants using Bird in Europe 2 trends (Donald et al., 2006; Sanderson et al., 2006). The PECBM scheme also explores a biogeographical approach to species selection and habitat choice knowing that some species may have different habitat preferences according to the biogeographic context.
b. butterflies
The field method is based on the British Butterfly Monitoring Scheme (Pollard and Yates, 1993), in use in the United Kingdom since 1976.
Counts are made on a line transect of 5 or 10 m wide with homogeneous vegetation and vegetation structure. From March or April to September or October all butterflies 2.5 m to the left and right of the recorder and 5 m in front and above should be counted under standardised weather conditions. The frequency varies from weekly to three or four visits during the season. Most of the sites are recorded by skilled volunteers. All recorders have a good knowledge of the butterfly fauna at their transect, and their results are checked by butterfly experts. Feest (2006) and van Swaay and Feest (in prep.) show that the butterfly survey data can be used to generate biodiversity quality indices for sites such that trends in biodiversity quality can be deduced. This will provide evidence of change more quickly than simple assessments and in a stastically robust way.
The main objective of the monitoring schemes is to assess changes in abundance at national and regional levels of butterflies, including species of the Habitat Directive.
A European index and trend is produced for each species by combining national results for that species. The individual European species indices are combined (averaged) to create multi‑species supranational indicators. This method is based on the one for bird indicators (Gregory et al., 2005):
At National level: the indices for each species are produced for each country, using TRIM (Pannekoek and Van Strien, 2003). TRIM is a computer programme to analyse time‑series of counts with missing observations using Poisson regression.
At Supranational level: to generate European trends, the difference in national population size of each species in each country has to be taken into account. This weighting allows for the fact that different countries hold different proportions of a species' European population (Van Strien et al., 2001). A weighting factor is established as the proportion of the country (or region) in the European distribution (Van Swaay and Warren, 1999). The missing year totals are estimated by TRIM in a way equivalent to imputing missing counts for particular sites within countries (Van Strien et al., 2001).
At multi‑species level: for each year the geometric mean of the supranational indices is calculated.
1.
2.
3.
1Abundanceanddistributionofselectedspecies
44 Halting the loss of biodiversity by 2010: proposal for a first set of indicators to monitor progress in Europe
Evaluation of the indicatorMainadvantagesoftheindicator
Policy relevance: this indicator contributes to the assessment of biodiversity conservation policy, land use policy, as well as overarching factors such as climate change and European policies measures such as the Birds and Habitats Directives.Biodiversity relevant: birds and butterflies can be excellent barometers of the health of the environment. They occur in many habitats, can reflect changes in other animals and plants, and are sensitive to environmental change.Scientifically sound and methodological well founded: methods used are being harmonised (national systems may differ but indices are standardised before being combined), proven and statistically robust.Progress towards target: this indicator provides a tangible basis for measuring progress towards the 2010 target.Broad acceptance and understandability: this indicator reports on birds and butterflies, familiar groups of species and well known to the public. The Common Birds indicator has already been adopted by the European Union as a structural indicator, a sustainable development indicator and as a baseline indicator under the Rural Development Regulation (Council Regulation (EC) No 1698/2005). It was recommended for immediate use by the European Academics Science Advisory Council.Affordable monitoring, available and routinely collected data: the PECBM scheme collates national data in a harmonised way from a European network of expert ornithologists. At present, butterfly monitoring Schemes are active in ten countries. Each year, new schemes join in. As almost all field data is collected by volunteers, the costs are only those of coordination, data management and analysis.
•
•
•
•
•
•
Maindisadvantagesoftheindicator
a.commonbirdsTemporal coverage: until the early 1990s, rather few European countries had common bird monitoring schemes in place, which restricts how far back in time representative trends can be calculated.Spatial coverage: coverage of western and central Europe is now almost complete, but a few gaps remain, and a further expansion eastwards is desired; efforts to fill them are underway.
b. butterfliesLimited geographical coverage.
•
•
•
Analysisofoptions As another candidate indicator for the headline indicator, the living planet index (LPI) was considered. The weakness of the LPI is that it relies on data that are biased towards well‑monitored vertebrates in temperate latitudes, including many species that have been/are subject to ongoing conservation action, and thus is not representative of biodiversity as a whole. It relies on a limited amount of reliable time‑series data gathered from a variety of sources published in scientific journals, NGO literature, or on the worldwide web. Work is ongoing to strenghten the LPI.
The PECBM indicator work is based on generic sampling of species, with no a priori bias on their selection. It has been presented and well‑received at international conferences and meetings.
Options for other biodiversity species‑based indicators are being considered.
Suggestionsforimprovement
Expand to other countries, especially in eastern and southern Europe, and other types of ecosystems (for butterflies woodland, heathland and bogs/moors/wetlands).
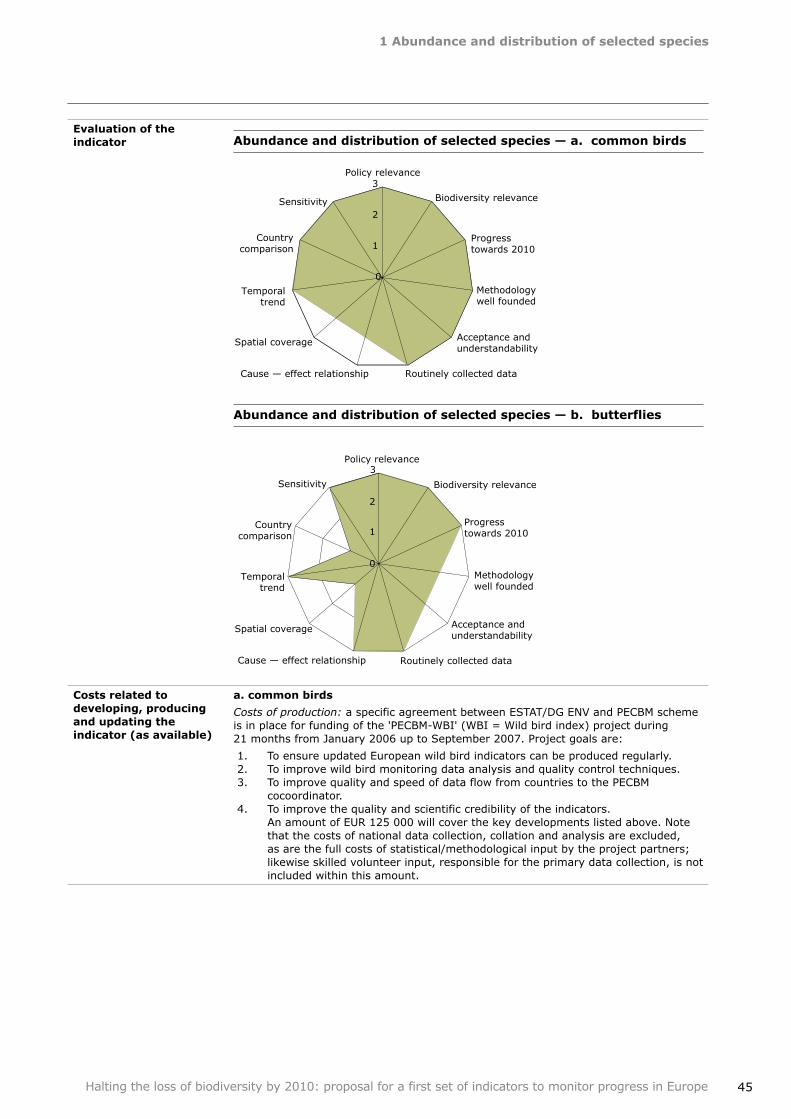
1Abundanceanddistributionofselectedspecies
45Halting the loss of biodiversity by 2010: proposal for a first set of indicators to monitor progress in Europe
Evaluationoftheindicator Abundanceanddistributionofselectedspecies—a.commonbirds
Abundanceanddistributionofselectedspecies—b.butterflies
Costsrelatedtodeveloping,producingandupdatingtheindicator(asavailable)
a.commonbirds
Costs of production: a specific agreement between ESTAT/DG ENV and PECBM scheme is in place for funding of the 'PECBM‑WBI' (WBI = Wild bird index) project during 21 months from January 2006 up to September 2007. Project goals are:
To ensure updated European wild bird indicators can be produced regularly. To improve wild bird monitoring data analysis and quality control techniques. To improve quality and speed of data flow from countries to the PECBM
cocoordinator. To improve the quality and scientific credibility of the indicators.
An amount of EUR 125 000 will cover the key developments listed above. Note that the costs of national data collection, collation and analysis are excluded, as are the full costs of statistical/methodological input by the project partners; likewise skilled volunteer input, responsible for the primary data collection, is not included within this amount.
1.2.3.
4.
0
1
2
3Policy relevance
Biodiversity relevance
Progresstowards 2010
Methodologywell founded
Acceptance andunderstandability
Routinely collected dataCause — effect relationship
Spatial coverage
Temporaltrend
Countrycomparison
Sensitivity
Policy relevance
Biodiversity relevance
Progresstowards 2010
Methodologywell founded
Acceptance andunderstandability
Routinely collected dataCause — effect relationship
Spatial coverage
Temporaltrend
Countrycomparison
Sensitivity
0
1
2
3
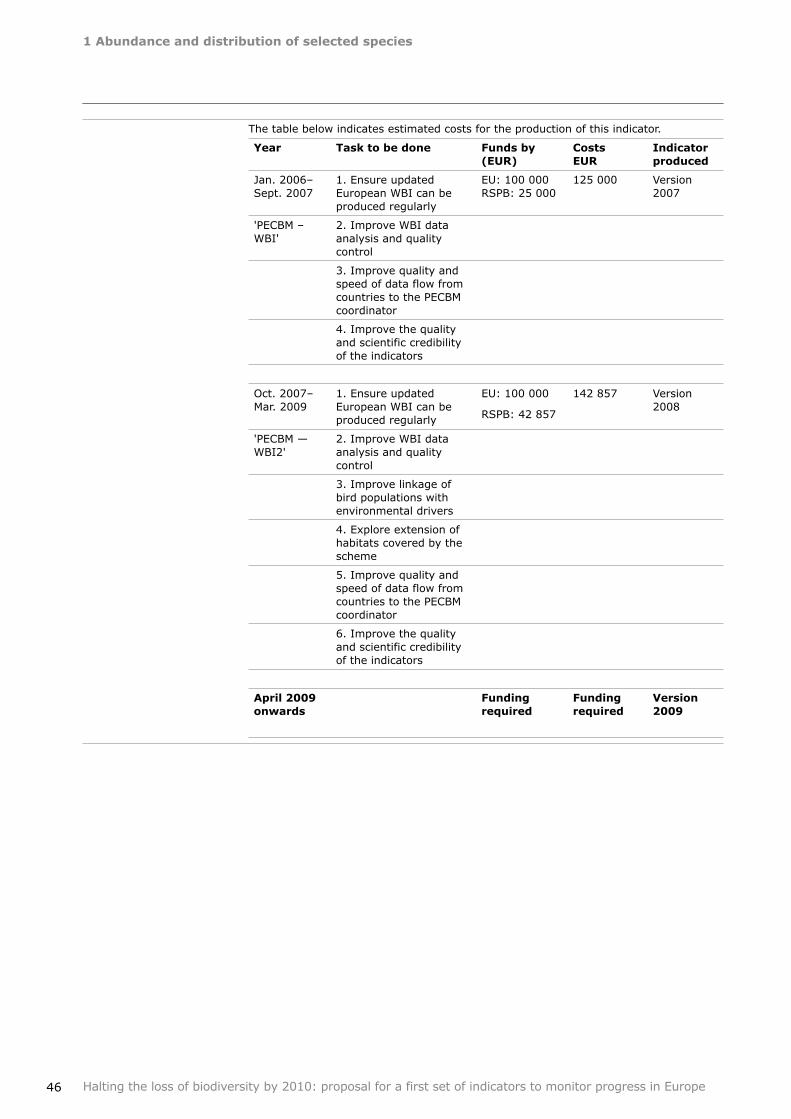
1Abundanceanddistributionofselectedspecies
46 Halting the loss of biodiversity by 2010: proposal for a first set of indicators to monitor progress in Europe
The table below indicates estimated costs for the production of this indicator.
Year Tasktobedone Fundsby(EUR)
CostsEUR
Indicatorproduced
Jan. 2006–Sept. 2007
1. Ensure updated European WBI can be produced regularly
EU: 100 000 RSPB: 25 000
125 000 Version 2007
'PECBM –WBI'
2. Improve WBI data analysis and quality control
3. Improve quality and speed of data flow from countries to the PECBM coordinator
4. Improve the quality and scientific credibility of the indicators
Oct. 2007–Mar. 2009
1. Ensure updated European WBI can be produced regularly
EU: 100 000
RSPB: 42 857
142 857 Version 2008
'PECBM —WBI2'
2. Improve WBI data analysis and quality control
3. Improve linkage of bird populations with environmental drivers
4. Explore extension of habitats covered by the scheme
5. Improve quality and speed of data flow from countries to the PECBM coordinator
6. Improve the quality and scientific credibility of the indicators
April2009onwards
Fundingrequired
Fundingrequired
Version2009
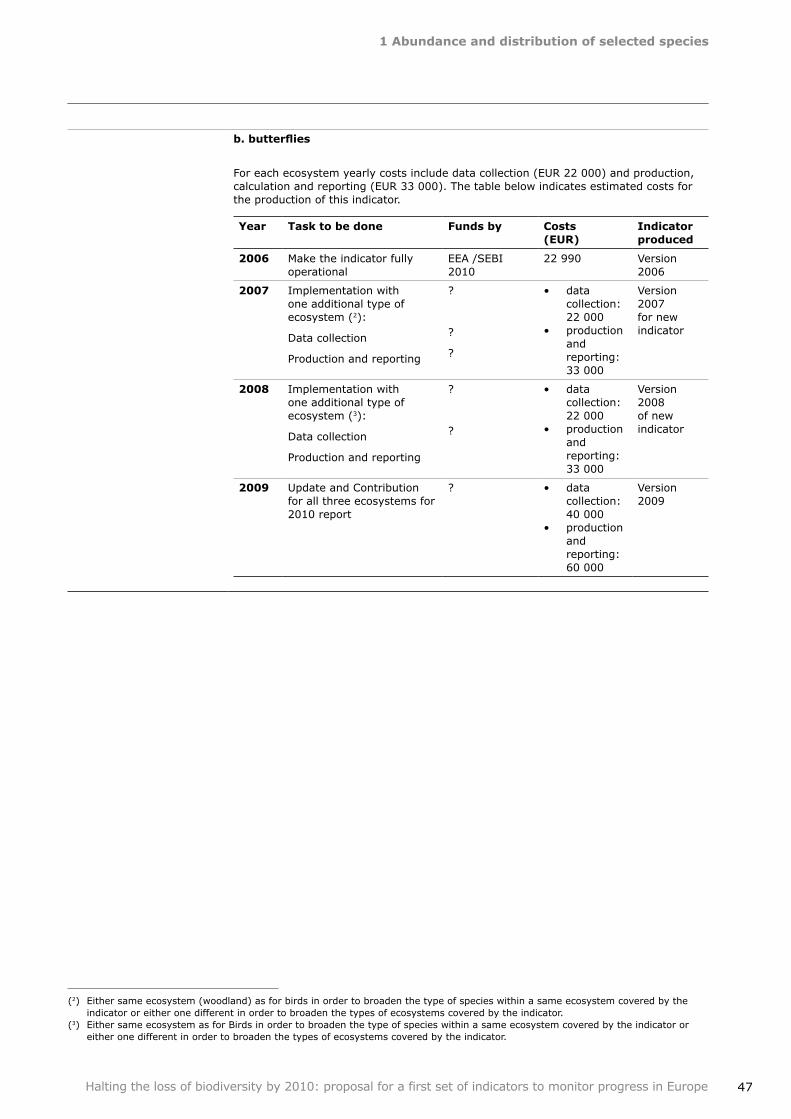
1Abundanceanddistributionofselectedspecies
47Halting the loss of biodiversity by 2010: proposal for a first set of indicators to monitor progress in Europe
b. butterflies
For each ecosystem yearly costs include data collection (EUR 22 000) and production, calculation and reporting (EUR 33 000). The table below indicates estimated costs for the production of this indicator.
Year Tasktobedone Fundsby Costs(EUR)
Indicatorproduced
2006 Make the indicator fully operational
EEA /SEBI 2010
22 990 Version 2006
2007 Implementation with one additional type of ecosystem (2):
Data collection
Production and reporting
?
?
?
data collection: 22 000production and reporting: 33 000
•
•
Version 2007 for new indicator
2008 Implementation with one additional type of ecosystem (3):
Data collection
Production and reporting
?
?
data collection: 22 000production and reporting: 33 000
•
•
Version 2008 of new indicator
2009 Update and Contribution for all three ecosystems for 2010 report
? data collection: 40 000production and reporting: 60 000
•
•
Version 2009
(2) Either same ecosystem (woodland) as for birds in order to broaden the type of species within a same ecosystem covered by the indicator or either one different in order to broaden the types of ecosystems covered by the indicator.
(3) Either same ecosystem as for Birds in order to broaden the type of species within a same ecosystem covered by the indicator or either one different in order to broaden the types of ecosystems covered by the indicator.
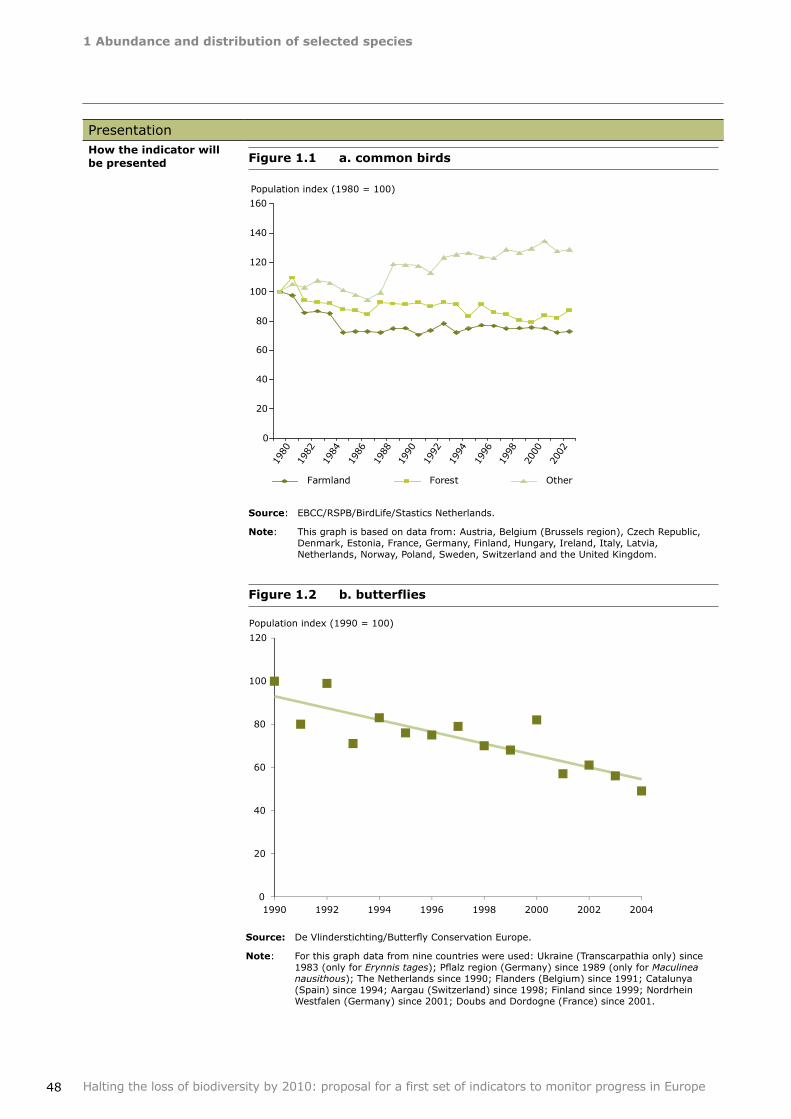
1Abundanceanddistributionofselectedspecies
48 Halting the loss of biodiversity by 2010: proposal for a first set of indicators to monitor progress in Europe
PresentationHowtheindicatorwillbepresented Figure1.1 a.commonbirds
Source: EBCC/RSPB/BirdLife/Stastics Netherlands.
Note: This graph is based on data from: Austria, Belgium (Brussels region), Czech Republic, Denmark, Estonia, France, Germany, Finland, Hungary, Ireland, Italy, Latvia, Netherlands, Norway, Poland, Sweden, Switzerland and the United Kingdom.
Figure1.2 b.butterflies
0
20
40
60
80
100
120
1990
Population index (1990 = 100)
1992 1994 1996 1998 2000 2002 2004
0
20
40
60
80
100
120
140
160
1980
1982
1984
1986
1988
1990
1992
1994
1996
1998
2000
2002
Farmland Forest Other
Population index (1980 = 100)
Source: De Vlinderstichting/Butterfly Conservation Europe.
Note: For this graph data from nine countries were used: Ukraine (Transcarpathia only) since 1983 (only for Erynnis tages); Pflalz region (Germany) since 1989 (only for Maculinea nausithous); The Netherlands since 1990; Flanders (Belgium) since 1991; Catalunya (Spain) since 1994; Aargau (Switzerland) since 1998; Finland since 1999; Nordrhein Westfalen (Germany) since 2001; Doubs and Dordogne (France) since 2001.
1Abundanceanddistributionofselectedspecies
49Halting the loss of biodiversity by 2010: proposal for a first set of indicators to monitor progress in Europe
Howtheindicatorshouldbeinterpreted
a.commonbirds
If the index goes down, this shows reduction of species populations (which can be linked to different factors), and biodiversity is lost. If the line is level, there is no change.
If the line in the graph above goes up, this can be a sign of halting of biodiversity loss. However, positive trends are not necessarily a good signal for biodiversity. An increase means that there are more species whose populations have increased than species whose populations have decreased: it does not necessarily mean that the overall population has increased. It can be due to expansion of some species at the cost of other species or habitats. Detailed data must then be used to assess the signal.
b. butterflies
The indicator shows changes in the population size of butterflies. A downward trend means biodiversity loss. An upward slope means the loss of biodiversity is being reversed, and a horizontal line shows loss has been halted. If the line in the graph above goes up, this can be a sign of halting biodiversity loss. However, positive trends are not necessarily a good signal for biodiversity. It can be due to expansion of some species at the cost of other species or habitats. Detailed data must then be used to assess the signal.
MetadataSummarytechnicalinformationontheindicator
a.commonbirdsTitle: Abundance and ditribution of selected species: common birds.Status: adopted by EU in list of SIs and SDIs.Definition: this indicator shows trends in the abundance of common birds over time across their European ranges.Geographical coverage: from EU‑27: Austria, Belgium, Czech Republic, Denmark, (Estonia), France, Germany, Hungary, Ireland, Italy, Latvia, Netherlands, Poland, Spain, Sweden and United Kingdom. From PEBLBS: Norway and Switzerland. Coverage will increase, e.g the next countries reporting could be Portugal and Bulgaria which started their monitoring in 2004.Temporal coverage: 1980–ongoing.Update frequency: could be annually if regularly funded at European level and if national monitoring is supported at national level.Identified experts: Petr Vorisek, (Czech Society for Ornithology); Richard Gregory (RSPB); Arco van Strien (Statistics Netherlands — CBS); Ian Burfield (BirdLife International).
b. butterfliesTitle: Abundance and ditribution of selected species: butterflies.Status: proposal.Definition: this indicator shows trends in the abundance of common birds and butterflies over time across their European ranges.Geographical coverage: Belgium, Estonia, Finland, France, Germany, Netherlands, Slovenia, Spain, Switzerland, Ukraine, United Kingdom. Temporal coverage: since 1976 in United Kingdom, other European data from 1990 onwards.Update frequency: annual (if funded).Identified experts: Alan Feest (Ecosulis consulting, United Kingdom), Chris van Swaay (Dutch Butterfly Conservation and Butterfly Conservation Europe), Arco van Strien (Statistics Netherlands — CBS).
•••
•
••
•
•••
•
•
••
1Abundanceanddistributionofselectedspecies
50 Halting the loss of biodiversity by 2010: proposal for a first set of indicators to monitor progress in Europe
References a.commonbirds
BirdLife International (2004). Birds in Europe: population estimates, trends and conservation status. Cambridge, United Kingdom: BirdLife International (BirdLife Conservation Series No. 12).
Donald, P. F., Sanderson, F. J., Burfield, I. J., van Bommel, F. P. J. (2006). Further evidence of continent‑wide impacts of agricultural intensification on European farmland birds, 1990–2000. Agriculture, Ecosystems and Environment 116 (2006) 189–196.
Gregory, R. D., van Strien, A., Vorisek, P., Meyling, A. W. G., Noble, D. G., Foppen, R. P. B. and Gibbons, D. W. (2005) Developing indicators for European birds. Phil.Trans. R. Soc. B. 360, 269–288.
Sanderson, F. J., Donald, P. F., Paina, D. J., Burfield, I. J., van Bommel, F. P. J. (2006). Long‑term population declines in Afro‑Palearctic migrant birds. Biological Conservation 131 (2006) 93–105.
Snow, D. W., Perrins, C. M., (1998). The Birds of the Western Palearctic: Concise Edition. Oxford University Press, Oxford, United Kingdom.
Strategy for the Wider Environment. BirdLife International, Cambridge, United Kingdom.
Tucker, G. M., Evans, M. I., (1997). Habitats for Birds in Europe: A Conservation.
b. butterflies
Feest, A. (2006) Establishing baseline indices for the environmental quality of the biodiversity of restored habitats using a standardised sampling process. Restoration Ecology, 14:112–122.
Gregory, R. D., Van Strien, A. J., Vorisek, P., Gmelig Meyling, A. W., Noble, D. G., Foppen, R. P. B. and Gibbons, D. W. (2005) Developing indicators for European birds. Phil. Trans. R. Soc. B. 360, 269–288.
Pannekoek, J. and Van Strien, A. J. (2003) TRIM 3 manual. Trends and Indices for Monitoring data. CBS, Statistics Netherlands, Voorburg, Netherlands.
Pollard, E. and Yates, T. J. (1995) Monitoring butterflies for ecology and conservation. Chapman and Hall, Londen.
Thomas, J. A., Telfer, M. G., Roy, D. B., Preston, C. D., Greenwood, J. J. D., Asher, J., Fox, R., Clarke, R. T. and Lawton, J. H. (2004) Comparitive losses of British Butterflies, Birds, and Plants and the Global Extinction Crisis. Science 303, 1879–1881.
Thomas, J. A. (2005) Monitoring change in the abundance and distribution of insects using butterflies and other indicator groups. Phil. Trans. Soc. B. 360, 339–357.
Van Strien, A. J., Pannekoek, J. and Gibbons, D. W. (2001) Indexing European bird population trends using results of national monitoring schemes: a trial of a new method. Bird Study 48, 200–213.
Van Swaay, C. A. M. and Warren, M. S. (1999) Red Data Book of European Butterflies (Rhopalocera). Nature and Environment series, No. 99, Council of Europe, Strasbourg.
51
2RedListIndexforEuropeanspecies
Halting the loss of biodiversity by 2010: proposal for a first set of indicators to monitor progress in Europe
Focalarea Status and trends of the components of biological diversity
Europeanindicatorheadline
Change in status of threatened and/or protected species
Keypolicyquestion Which European species are under threat, and where should conservation actions be targeted?
Definition of the indicator
The Red List Index shows trends in the overall threat status of European species. Specifically the index relates to the proportion of species expected to remain extant in the near future in the absence of additional conservation action.
Indicatortype(DPSIR) State
Context The RLI measures trends in the threat status (relative projected extinction risk) of European species, indicating the proportion of species expected to remain extant in the next few decades in the absence of additional conservation action. Extinction is a key measure of biodiversity loss that has resonance with the public and decision makers, and which has clear relevance to ecological processes and ecosystem function.
The main pressures affecting the trend in the RLI and biodiversity in general are: habitat loss, unsustainable exploitation, alien invasive species, pollution and climate change. The precise drivers can be determined from the data used to generate the RLI.
There are two variants of this indicator for which the state of development is different:
(1) An RLI for European species based on global extinction risk (i.e. a European subset of the global RLI);
(2) An RLI based on regional extinction risk at either the pan‑European or EU scale.
Both variants of the RLI should be developed and could be presented together with appropriate interpretation. However, because of its more direct relevance to European policies, variant (2) is proposed for inclusion here.
Relationoftheindicatortothefocalarea
Extinction is a naturally occurring process, but there is little doubt that humans are increasing the rate of extinctions by 100–1 000 times the historical 'background' rate. Extinction is perhaps the most fundamental form of biodiversity loss. The RLI measures trends in extinction risk for sets of species. In the European context, this indicator will provide a useful measure of the success of the implementation of the EU Birds and Habitats Directives, and the Bern Convention (particularly for threatened birds covered by Species Action Plans, which EU Member States and Convention Parties have endorsed, and thereby agreed to implement specific recovery measures).
Data sources and methodologyDataavailability This indicator uses data from regional applications of the IUCN Red List criteria to
assess regional extinction risk.
At present this assessment has only been made for birds at the pan‑European and EU‑15 scales, producing data points for 1994 and 2004 using the data collated by BirdLife International for the two editions of the assessment Birds in Europe (Tucker and Heath 1994, BirdLife International 2004). If funding is secured to cover the costs of coordinating another data collection exercise during 2007–2009, the regional extinction risk of birds in Europe could be assessed again, yielding three data points before 2010.
2 RedListIndexforEuropeanspecies
2RedListIndexforEuropeanspecies
52 Halting the loss of biodiversity by 2010: proposal for a first set of indicators to monitor progress in Europe
Methodology MethodologyusedfortheGlobalRedListIndexThe Red List Index (RLI) has been developed by the Red List partnership (IUCN, Species Survival Commission, BirdLife International, Conservation International‑Centre of Applied Biodiversity Science and NatureServe).
It uses data from the IUCN Red List of threatened species (www.iucnredlist.org) and shows overall changes in threat status (relative projected extinction risk) of representative sets of species. Red List categories are extinct, extinct in the wild, critically endangered, endangered, vulnerable, near threatened, least concern, data deficient, and not evaluated.
RLIs can be calculated for any set of species for which Red List assessments have been carried out on all species at least twice. To date, a RLI has been developed for all bird species for 1988–2004 (Butchart et al. 2004) and a preliminary RLI has been developed for all amphibian species for 1980–2004 (Butchart et al. 2005). A more recent publication has described revisions and improvements to the RLI formula and its application in response to lessons learned from its initial application (Butchart et al. 2007).
The RLI is related to the rate of biodiversity loss, rather than a measure of the state of biodiversity. Although some of the Red List criteria are based on absolute population size or range size, others are based on rates of decline in these values or combinations of absolute size and rates of decline. These criteria are used to assign species to Red List categories that can be ranked according to relative projected extinction risk, and the RLI is calculated from changes between these categories. Hence, an RLI value relates to the proportion of species expected to remain extant in the near future in the absence of additional conservation action. The timeframe for this cannot be specified exactly, because it depends on generation time (10 years or three generations, whichever is longer) and is calculated over many species with a variety of generation times, but it can be taken to be in the range of 10–50 years.
The RLI is based on the proportion of species in each Red List category, and the proportion moving between categories in different assessments owing to genuine improvements and deterioration in status only (i.e. category changes owing to revised taxonomy or improved knowledge are excluded). At any particular point in time, the number of species in each Red List Category is multiplied by a weight (ranging from one for near threatened up to five for extinct and extinct in the Wild) and these products are then summed. The total is then divided by a 'maximum threat score' (the number of species multiplied by the weight assigned to the extinct category). This final value is subtracted from 1 to give the IUCN RLI value, so that when all species are Least Concern the IUCN RLI is equal to 1, and when all species are extinct the IUCN RLI is equal to 0.
It is important to note that the RLI is based on changes in the status of all species (including those classified as Least Concern): a species moving from 'least concern' to 'near threatened' contributes as much to the changing index value as a 'critically endangered' species becoming extinct. Hence this indicator is not based solely on 'changes in the status of threatened species'. Nevertheless, the category 'least concern' is very broad, so a common species may have to undergo quite large changes in status in order to qualify as near threatened and hence influence the RLI trend.
MethodologyproposedfortheEuropeanRedListIndexThe IUCN Red List categories and criteria can be applied at regional level to determine categories for regional extinction risk (IUCN 2003). Using assessments of regional extinction risk to construct a European RLI for a particular taxonomic group increases its robustness. This is because more species tend to qualify as 'threatened' or 'near threatened' when assessed for their regional (as compared to global) extinction risk, because of their inherently smaller ranges and population sizes when assessed at this spatial scale. Consequently, more species move between Red List categories in repeated assessments, so the RLI trends are driven by a larger number of species. It may also be the case that less uncertainty is associated with quantitative population size and trends estimates at the European, rather than global, scale leading to greater confidence in the accuracy of Red List categorisations at the European scale.
In Europe, to date, only birds have been assessed for their regional extinction risk using this methodology (BirdLife International 2004a, b). At a pan‑European level, 67 species are considered to be 'threatened', 159 'near threatened', and 300 of 'least concern'. At the level of the EU‑25, 54 species are considered to be 'threatened', 162 'near threatened', and 232 of 'least concern'.
2RedListIndexforEuropeanspecies
53Halting the loss of biodiversity by 2010: proposal for a first set of indicators to monitor progress in Europe
In 2006, BirdLife International applied the RLI methods retrospectively to published population and range data from 1970–1990 (Tucker and Heath 1994) to calculate the first regional RLI for European birds, with data points in 1994 and 2004. It is currently proposed that more data will be collected and the regional extinction risk of birds in 2007–2009 will be assessed again, yielding three data points before 2010, although this work remains dependent on extra funding.
It should be noted that although many individual European countries have published national Red Data books or lists, these cannot be used directly to calculate pan‑European RLIs. Countries often use a variety of different systems to assign categories that cannot be compared directly between countries, and regional extinction risk cannot be determined by simply aggregating national assessments (although national data on population and range sizes and trends are often aggregated in order to determine supranational estimates for these parameters, to which the IUCN Red List criteria are then applied).
Evaluation of the indicatorMainadvantagesoftheindicator
Policy relevance: it is highly relevant to the 2010 target, explicitly addressing a key component of biodiversity loss, that of species extinctions. It can also be scaled down at any European level, including EU. It gives a clear signal of the effectiveness of EU policies in improving the status of threatened species. Biodiversity relevance: highly relevant as a measure of the state of biodiversity, relating to the rate at which species are slipping towards extinction, and to the proportion of species expected to remain extant in the near future in the absence of additional conservation action. Scientific methodology: the methodology has been published in peer‑reviewed scientific articles (Butchart et al. 2004, 2005) and further revisions and improvements were published recently (Butchart et al. 2007). Progress towards target: trends in the RLI provide a clear measure of progress towards the 2010 target (see below).Acceptance and understandability: the RLI is based on a very simple concept that is easy to grasp, as it shows net changes in extinction risk for sets of species, as measured by the IUCN Red List categories. Affordable modelling: threats are coded for all species on the Red List, and genuine category changes (upon which the RLI is based) require justifications and explanations, so information is easily available to interpret the drivers of trends in the RLI.
•
•
•
•
•
•
Maindisadvantagesoftheindicator
There are two main disadvantages to an RLI for European species based on regional extinction risk:
RLIs have relatively coarse temporal resolution because species may have to undergo quite significant changes in population and range size/trend in order to qualify for higher or lower Red List categories, and RLIs can only practically be updated every four years (when all species in the taxonomic group are reassessed); Within a particular taxonomic group a regional RLI for European species is more robust than an RLI for European species based on global extinction risk; however, suitable data are available currently for birds only (and, potentially by 2010 for mammals and amphibians).
•
•
Analysisofoptions Global population trend‑based indicators (such as the Living Planet Index) show higher temporal resolution (being sensitive to relatively small population changes on an annual basis) than the RLI, but are much less geographically representative, as monitoring of species' populations is largely concentrated in developed countries, particularly in northern temperate regions.
Suggestionsforimprovement
Improvements needed for the RLI relate to expanding its taxonomic coverage, assessing further taxonomic groups, and reassessing those already fully evaluated.
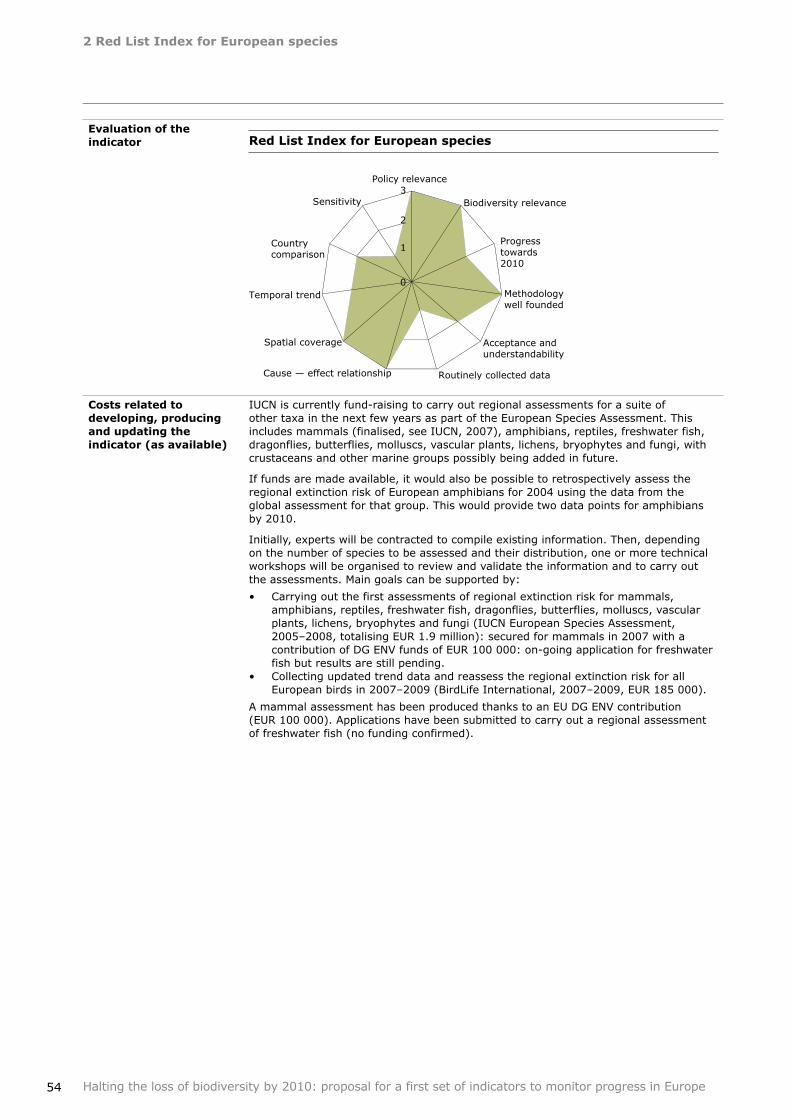
2RedListIndexforEuropeanspecies
54 Halting the loss of biodiversity by 2010: proposal for a first set of indicators to monitor progress in Europe
Evaluationoftheindicator RedListIndexforEuropeanspecies
Costsrelatedtodeveloping,producingandupdatingtheindicator(asavailable)
IUCN is currently fund‑raising to carry out regional assessments for a suite of other taxa in the next few years as part of the European Species Assessment. This includes mammals (finalised, see IUCN, 2007), amphibians, reptiles, freshwater fish, dragonflies, butterflies, molluscs, vascular plants, lichens, bryophytes and fungi, with crustaceans and other marine groups possibly being added in future.
If funds are made available, it would also be possible to retrospectively assess the regional extinction risk of European amphibians for 2004 using the data from the global assessment for that group. This would provide two data points for amphibians by 2010.
Initially, experts will be contracted to compile existing information. Then, depending on the number of species to be assessed and their distribution, one or more technical workshops will be organised to review and validate the information and to carry out the assessments. Main goals can be supported by:
Carrying out the first assessments of regional extinction risk for mammals, amphibians, reptiles, freshwater fish, dragonflies, butterflies, molluscs, vascular plants, lichens, bryophytes and fungi (IUCN European Species Assessment, 2005–2008, totalising EUR 1.9 million): secured for mammals in 2007 with a contribution of DG ENV funds of EUR 100 000: on‑going application for freshwater fish but results are still pending.Collecting updated trend data and reassess the regional extinction risk for all European birds in 2007–2009 (BirdLife International, 2007–2009, EUR 185 000).
A mammal assessment has been produced thanks to an EU DG ENV contribution (EUR 100 000). Applications have been submitted to carry out a regional assessment of freshwater fish (no funding confirmed).
•
•
0
1
2
3Policy relevance
Biodiversity relevance
Progresstowards2010
Methodologywell founded
Acceptance andunderstandability
Routinely collected dataCause — effect relationship
Spatial coverage
Temporal trend
Countrycomparison
Sensitivity
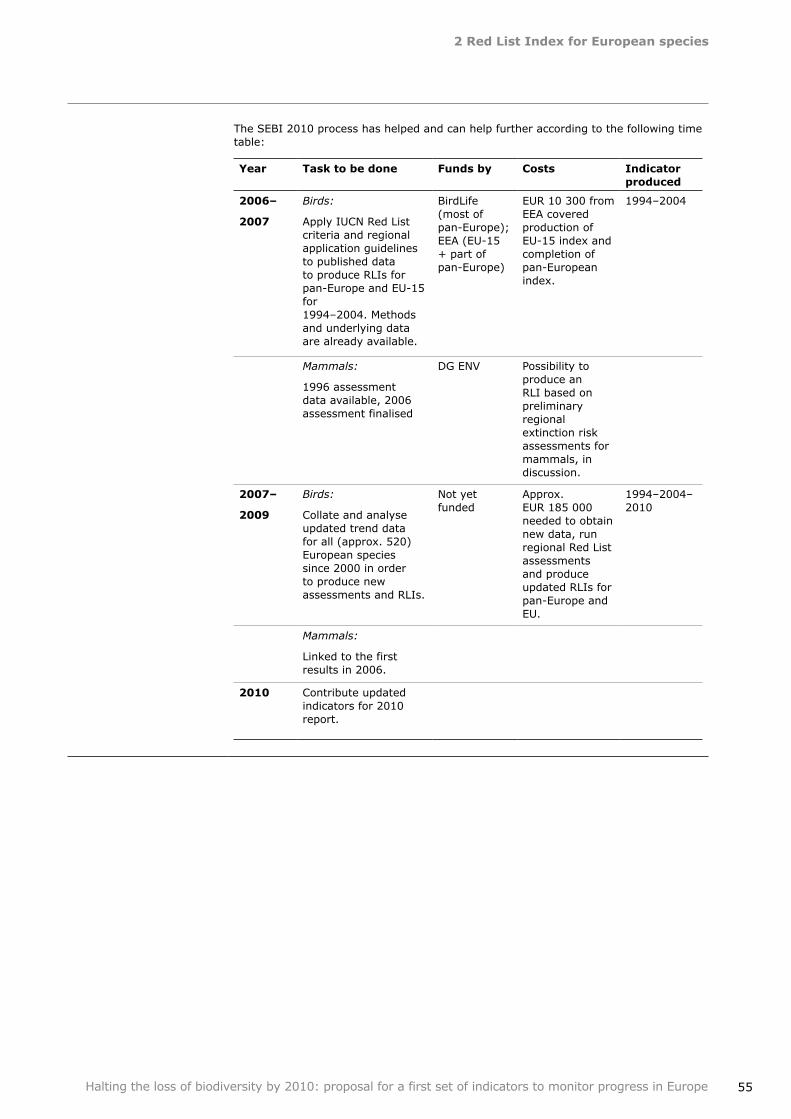
2RedListIndexforEuropeanspecies
55Halting the loss of biodiversity by 2010: proposal for a first set of indicators to monitor progress in Europe
The SEBI 2010 process has helped and can help further according to the following time table:
Year Tasktobedone Fundsby Costs Indicatorproduced
2006–
2007
Birds:
Apply IUCN Red List criteria and regional application guidelines to published data to produce RLIs for pan‑Europe and EU‑15 for 1994–2004. Methods and underlying data are already available.
BirdLife (most of pan‑Europe); EEA (EU‑15 + part of pan‑Europe)
EUR 10 300 from EEA covered production of EU‑15 index and completion of pan‑European index.
1994–2004
Mammals:
1996 assessment data available, 2006 assessment finalised
DG ENV Possibility to produce an RLI based on preliminary regional extinction risk assessments for mammals, in discussion.
2007–
2009
Birds:
Collate and analyse updated trend data for all (approx. 520) European species since 2000 in order to produce new assessments and RLIs.
Not yet funded
Approx. EUR 185 000 needed to obtain new data, run regional Red List assessments and produce updated RLIs for pan‑Europe and EU.
1994–2004–2010
Mammals:
Linked to the first results in 2006.
2010 Contribute updated indicators for 2010 report.
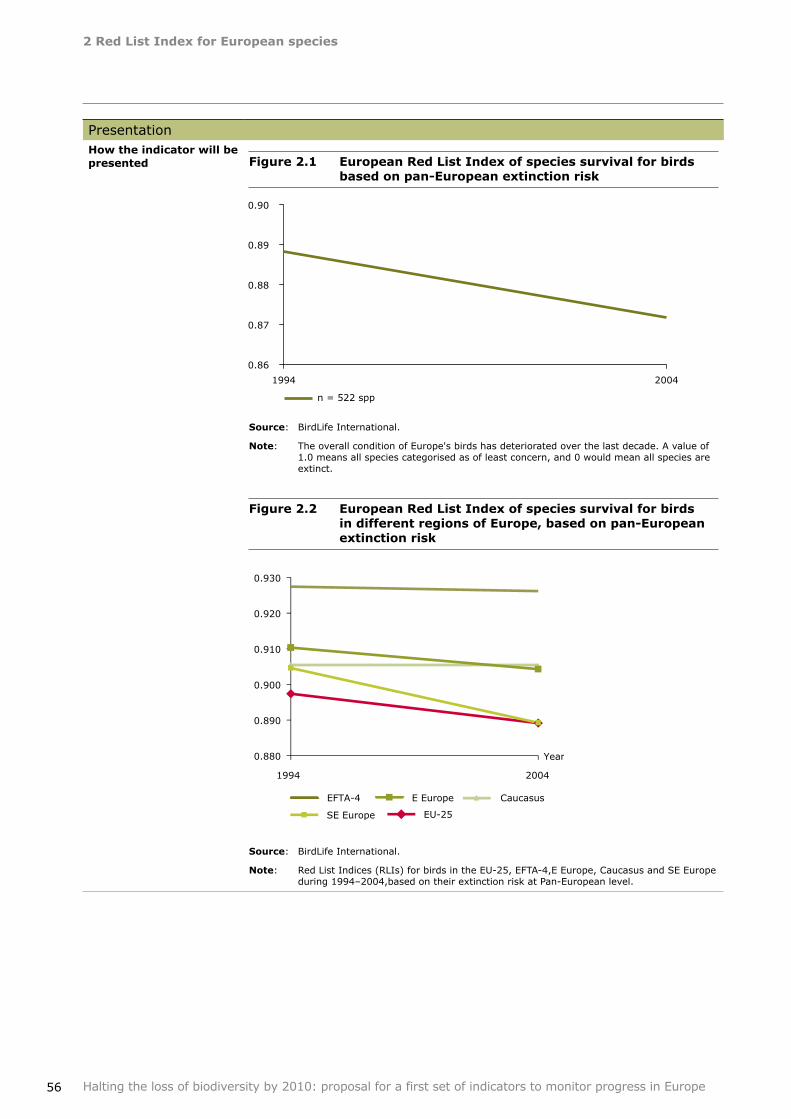
2RedListIndexforEuropeanspecies
56 Halting the loss of biodiversity by 2010: proposal for a first set of indicators to monitor progress in Europe
PresentationHowtheindicatorwillbepresented Figure2.1 EuropeanRedListIndexofspeciessurvivalforbirds
basedonpan‑Europeanextinctionrisk
Source: BirdLife International.
Note: The overall condition of Europe's birds has deteriorated over the last decade. A value of 1.0 means all species categorised as of least concern, and 0 would mean all species are extinct.
Figure2.2 EuropeanRedListIndexofspeciessurvivalforbirdsindifferentregionsofEurope,basedonpan‑Europeanextinctionrisk
Source: BirdLife International.
Note: Red List Indices (RLIs) for birds in the EU‑25, EFTA‑4,E Europe, Caucasus and SE Europe during 1994–2004,based on their extinction risk at Pan‑European level.
n = 522 spp
0.86
0.87
0.88
0.89
0.90
1994 2004
0.880
0.890
0.900
0.910
0.920
0.930
1994 2004
Year
EU-25
Caucasus
SE Europe
E EuropeEFTA-4
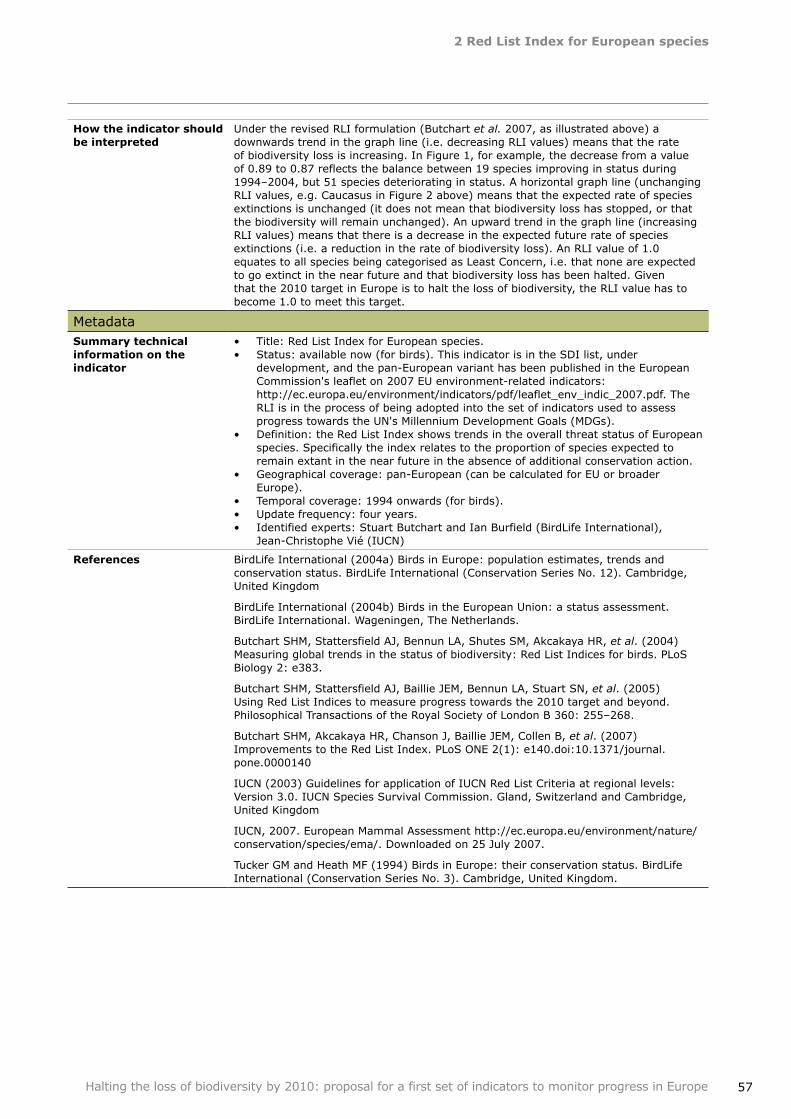
2RedListIndexforEuropeanspecies
57Halting the loss of biodiversity by 2010: proposal for a first set of indicators to monitor progress in Europe
Howtheindicatorshouldbeinterpreted
Under the revised RLI formulation (Butchart et al. 2007, as illustrated above) a downwards trend in the graph line (i.e. decreasing RLI values) means that the rate of biodiversity loss is increasing. In Figure 1, for example, the decrease from a value of 0.89 to 0.87 reflects the balance between 19 species improving in status during 1994–2004, but 51 species deteriorating in status. A horizontal graph line (unchanging RLI values, e.g. Caucasus in Figure 2 above) means that the expected rate of species extinctions is unchanged (it does not mean that biodiversity loss has stopped, or that the biodiversity will remain unchanged). An upward trend in the graph line (increasing RLI values) means that there is a decrease in the expected future rate of species extinctions (i.e. a reduction in the rate of biodiversity loss). An RLI value of 1.0 equates to all species being categorised as Least Concern, i.e. that none are expected to go extinct in the near future and that biodiversity loss has been halted. Given that the 2010 target in Europe is to halt the loss of biodiversity, the RLI value has to become 1.0 to meet this target.
MetadataSummarytechnicalinformationontheindicator
Title: Red List Index for European species.Status: available now (for birds). This indicator is in the SDI list, under development, and the pan‑European variant has been published in the European Commission's leaflet on 2007 EU environment‑related indicators: http://ec.europa.eu/environment/indicators/pdf/leaflet_env_indic_2007.pdf. The RLI is in the process of being adopted into the set of indicators used to assess progress towards the UN's Millennium Development Goals (MDGs).Definition: the Red List Index shows trends in the overall threat status of European species. Specifically the index relates to the proportion of species expected to remain extant in the near future in the absence of additional conservation action.Geographical coverage: pan‑European (can be calculated for EU or broader Europe).Temporal coverage: 1994 onwards (for birds).Update frequency: four years.Identified experts: Stuart Butchart and Ian Burfield (BirdLife International), Jean‑Christophe Vié (IUCN)
••
•
•
•••
References BirdLife International (2004a) Birds in Europe: population estimates, trends and conservation status. BirdLife International (Conservation Series No. 12). Cambridge, United Kingdom
BirdLife International (2004b) Birds in the European Union: a status assessment. BirdLife International. Wageningen, The Netherlands.
Butchart SHM, Stattersfield AJ, Bennun LA, Shutes SM, Akcakaya HR, et al. (2004) Measuring global trends in the status of biodiversity: Red List Indices for birds. PLoS Biology 2: e383.
Butchart SHM, Stattersfield AJ, Baillie JEM, Bennun LA, Stuart SN, et al. (2005) Using Red List Indices to measure progress towards the 2010 target and beyond. Philosophical Transactions of the Royal Society of London B 360: 255–268.
Butchart SHM, Akcakaya HR, Chanson J, Baillie JEM, Collen B, et al. (2007) Improvements to the Red List Index. PLoS ONE 2(1): e140.doi:10.1371/journal.pone.0000140
IUCN (2003) Guidelines for application of IUCN Red List Criteria at regional levels: Version 3.0. IUCN Species Survival Commission. Gland, Switzerland and Cambridge, United Kingdom
IUCN, 2007. European Mammal Assessment http://ec.europa.eu/environment/nature/conservation/species/ema/. Downloaded on 25 July 2007.
Tucker GM and Heath MF (1994) Birds in Europe: their conservation status. BirdLife International (Conservation Series No. 3). Cambridge, United Kingdom.
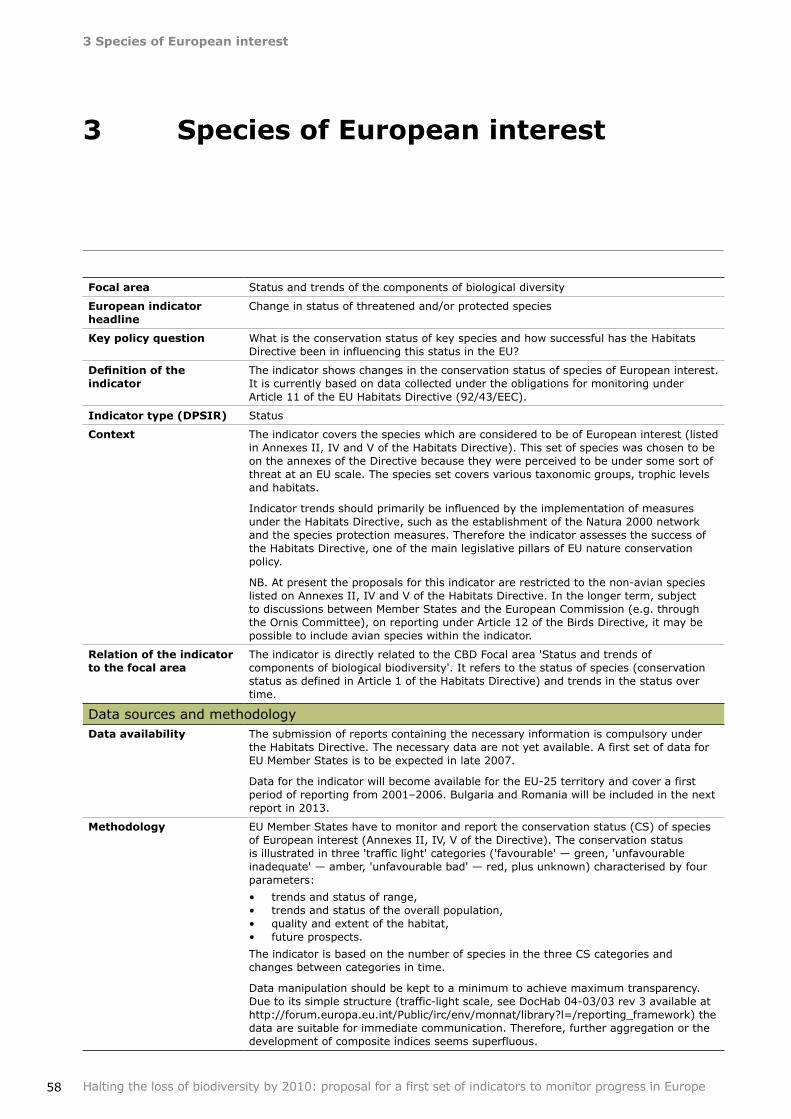
58
3SpeciesofEuropeaninterest
Halting the loss of biodiversity by 2010: proposal for a first set of indicators to monitor progress in Europe
Focalarea Status and trends of the components of biological diversity
Europeanindicatorheadline
Change in status of threatened and/or protected species
Keypolicyquestion What is the conservation status of key species and how successful has the Habitats Directive been in influencing this status in the EU?
Definition of the indicator
The indicator shows changes in the conservation status of species of European interest. It is currently based on data collected under the obligations for monitoring under Article 11 of the EU Habitats Directive (92/43/EEC).
Indicatortype(DPSIR) Status
Context The indicator covers the species which are considered to be of European interest (listed in Annexes II, IV and V of the Habitats Directive). This set of species was chosen to be on the annexes of the Directive because they were perceived to be under some sort of threat at an EU scale. The species set covers various taxonomic groups, trophic levels and habitats.
Indicator trends should primarily be influenced by the implementation of measures under the Habitats Directive, such as the establishment of the Natura 2000 network and the species protection measures. Therefore the indicator assesses the success of the Habitats Directive, one of the main legislative pillars of EU nature conservation policy.
NB. At present the proposals for this indicator are restricted to the non‑avian species listed on Annexes II, IV and V of the Habitats Directive. In the longer term, subject to discussions between Member States and the European Commission (e.g. through the Ornis Committee), on reporting under Article 12 of the Birds Directive, it may be possible to include avian species within the indicator.
Relationoftheindicatortothefocalarea
The indicator is directly related to the CBD Focal area 'Status and trends of components of biological biodiversity'. It refers to the status of species (conservation status as defined in Article 1 of the Habitats Directive) and trends in the status over time.
Data sources and methodologyDataavailability The submission of reports containing the necessary information is compulsory under
the Habitats Directive. The necessary data are not yet available. A first set of data for EU Member States is to be expected in late 2007.
Data for the indicator will become available for the EU‑25 territory and cover a first period of reporting from 2001–2006. Bulgaria and Romania will be included in the next report in 2013.
Methodology EU Member States have to monitor and report the conservation status (CS) of species of European interest (Annexes II, IV, V of the Directive). The conservation status is illustrated in three 'traffic light' categories ('favourable' — green, 'unfavourable inadequate' — amber, 'unfavourable bad' — red, plus unknown) characterised by four parameters:
trends and status of range, trends and status of the overall population, quality and extent of the habitat, future prospects.
The indicator is based on the number of species in the three CS categories and changes between categories in time.
Data manipulation should be kept to a minimum to achieve maximum transparency. Due to its simple structure (traffic‑light scale, see DocHab 04‑03/03 rev 3 available at http://forum.europa.eu.int/Public/irc/env/monnat/library?l=/reporting_framework) the data are suitable for immediate communication. Therefore, further aggregation or the development of composite indices seems superfluous.
••••
3 SpeciesofEuropeaninterest
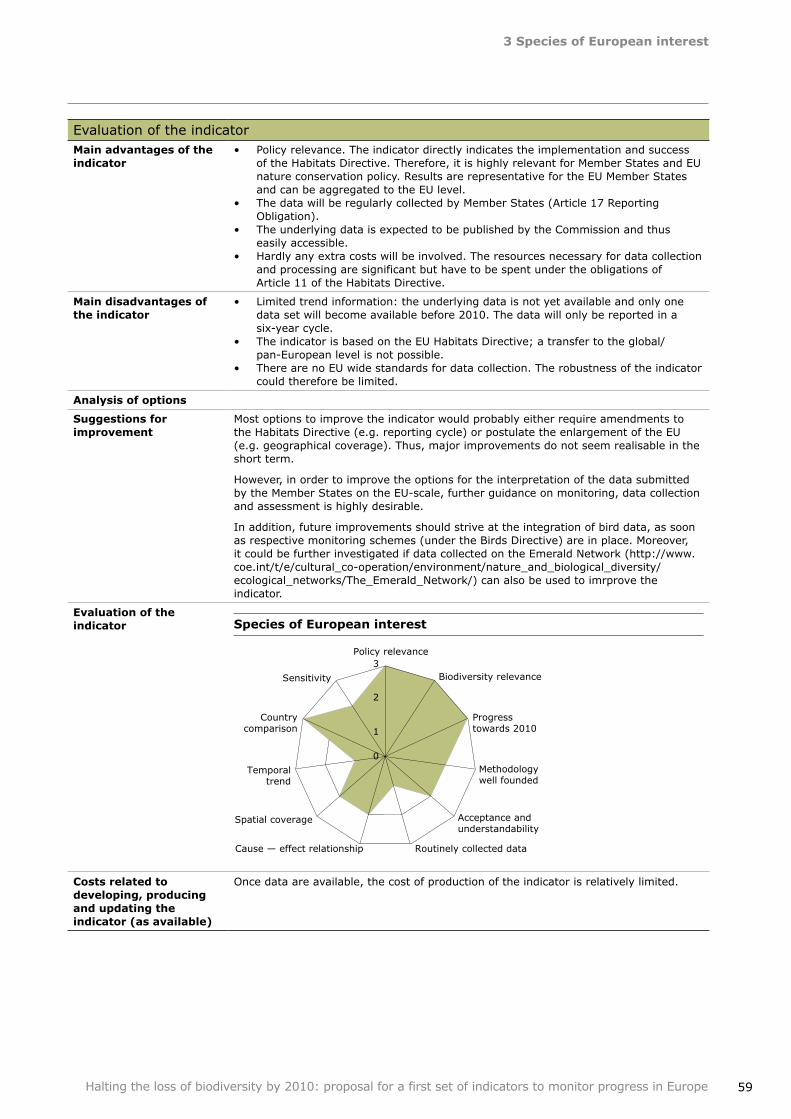
3SpeciesofEuropeaninterest
59Halting the loss of biodiversity by 2010: proposal for a first set of indicators to monitor progress in Europe
Evaluation of the indicatorMainadvantagesoftheindicator
Policy relevance. The indicator directly indicates the implementation and success of the Habitats Directive. Therefore, it is highly relevant for Member States and EU nature conservation policy. Results are representative for the EU Member States and can be aggregated to the EU level.The data will be regularly collected by Member States (Article 17 Reporting Obligation).The underlying data is expected to be published by the Commission and thus easily accessible.Hardly any extra costs will be involved. The resources necessary for data collection and processing are significant but have to be spent under the obligations of Article 11 of the Habitats Directive.
•
•
•
•
Maindisadvantagesoftheindicator
Limited trend information: the underlying data is not yet available and only one data set will become available before 2010. The data will only be reported in a six‑year cycle.The indicator is based on the EU Habitats Directive; a transfer to the global/pan‑European level is not possible.There are no EU wide standards for data collection. The robustness of the indicator could therefore be limited.
•
•
•
Analysisofoptions
Suggestionsforimprovement
Most options to improve the indicator would probably either require amendments to the Habitats Directive (e.g. reporting cycle) or postulate the enlargement of the EU (e.g. geographical coverage). Thus, major improvements do not seem realisable in the short term.
However, in order to improve the options for the interpretation of the data submitted by the Member States on the EU‑scale, further guidance on monitoring, data collection and assessment is highly desirable.
In addition, future improvements should strive at the integration of bird data, as soon as respective monitoring schemes (under the Birds Directive) are in place. Moreover, it could be further investigated if data collected on the Emerald Network (http://www.coe.int/t/e/cultural_co‑operation/environment/nature_and_biological_diversity/ecological_networks/The_Emerald_Network/) can also be used to imrprove the indicator.
Evaluationoftheindicator SpeciesofEuropeaninterest
Costsrelatedtodeveloping,producingandupdatingtheindicator(asavailable)
Once data are available, the cost of production of the indicator is relatively limited.
0
1
2
3Policy relevance
Biodiversity relevance
Progresstowards 2010
Methodologywell founded
Acceptance andunderstandability
Routinely collected dataCause — effect relationship
Spatial coverage
Temporaltrend
Countrycomparison
Sensitivity
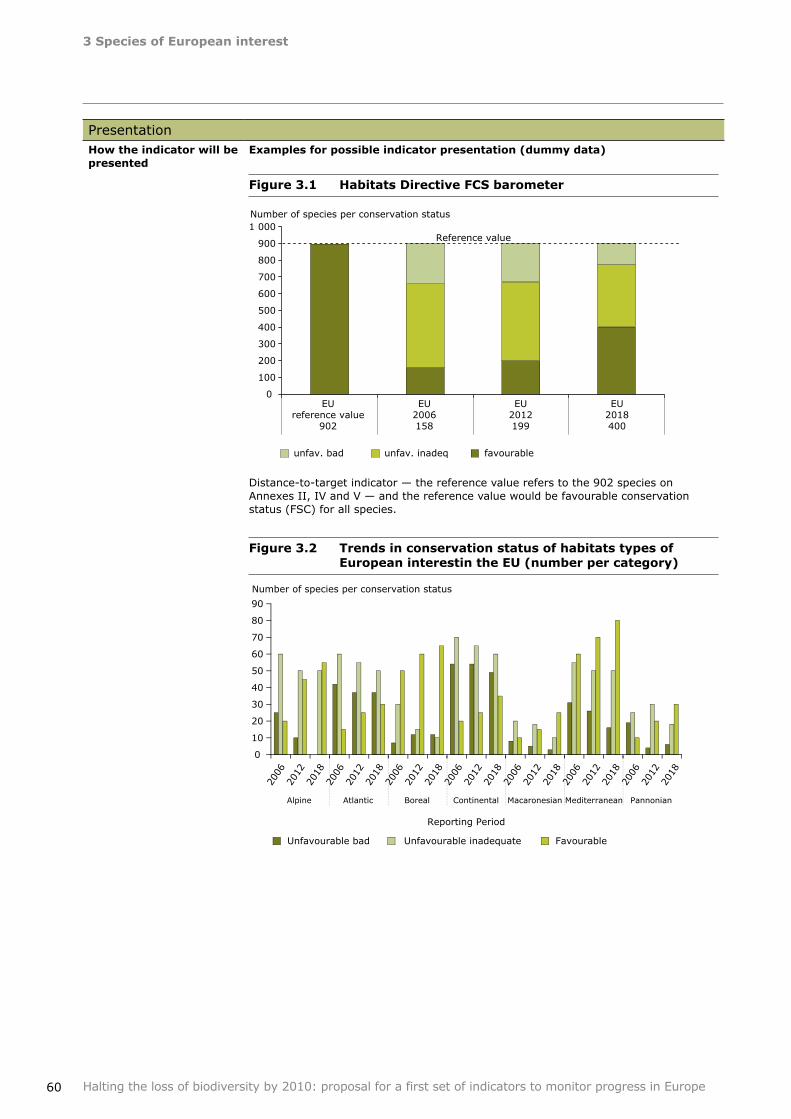
3SpeciesofEuropeaninterest
60 Halting the loss of biodiversity by 2010: proposal for a first set of indicators to monitor progress in Europe
PresentationHowtheindicatorwillbepresented
Examplesforpossibleindicatorpresentation(dummydata)
Figure3.1 HabitatsDirectiveFCSbarometer
Distance‑to‑target indicator — the reference value refers to the 902 species on Annexes II, IV and V — and the reference value would be favourable conservation status (FSC) for all species.
Figure3.2 TrendsinconservationstatusofhabitatstypesofEuropeaninterestintheEU(numberpercategory)
Number of species per conservation status
0
100
200
300
400
500
600
700
800
900
1 000Reference value
unfav. bad
EUreference value
902
EU2006158
EU2012199
EU2018400
unfav. inadeq favourable
Reporting Period
0
10
20
30
40
50
60
70
80
90
2006
2012
2018
2006
2012
2018
2006
2012
2018
2006
2012
2018
2006
2012
2018
2006
2012
2018
2006
2012
2018
Alpine Atlantic Boreal Continental Macaronesian Mediterranean Pannonian
Number of species per conservation status
Unfavourable bad Unfavourable inadequate Favourable
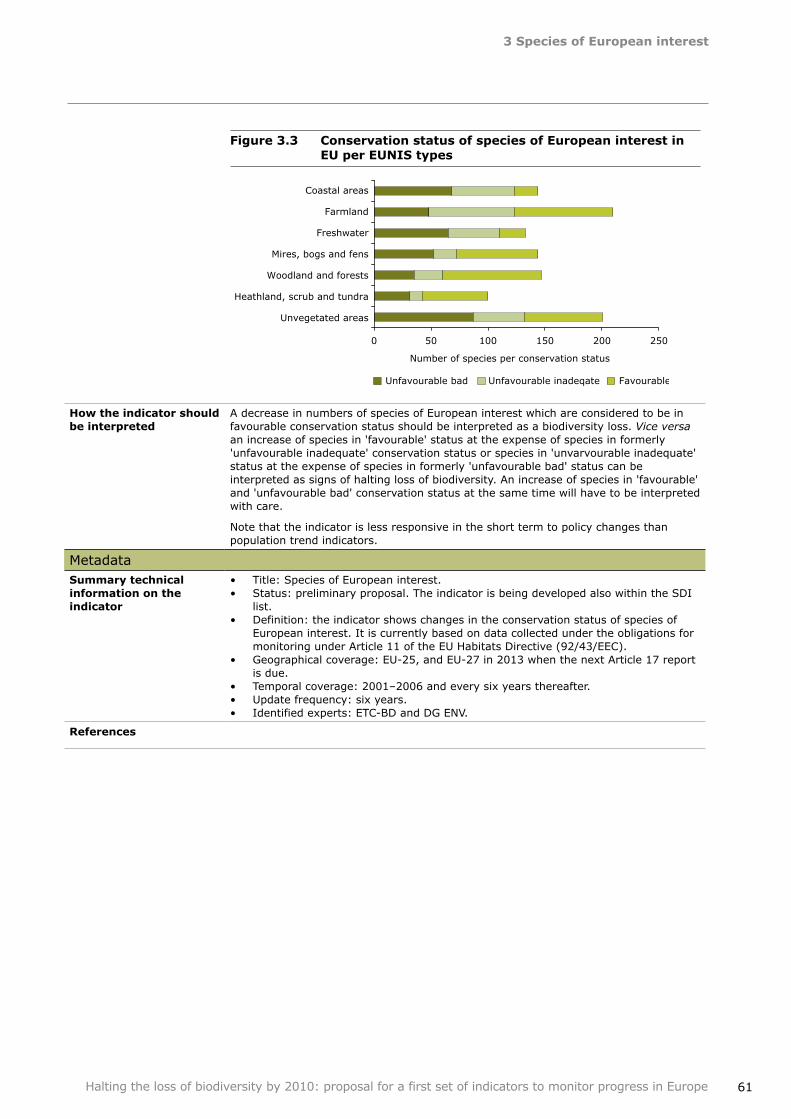
3SpeciesofEuropeaninterest
61Halting the loss of biodiversity by 2010: proposal for a first set of indicators to monitor progress in Europe
Figure3.3 ConservationstatusofspeciesofEuropeaninterestinEUperEUNIStypes
Howtheindicatorshouldbeinterpreted
A decrease in numbers of species of European interest which are considered to be in favourable conservation status should be interpreted as a biodiversity loss. Vice versa an increase of species in 'favourable' status at the expense of species in formerly 'unfavourable inadequate' conservation status or species in 'unvarvourable inadequate' status at the expense of species in formerly 'unfavourable bad' status can be interpreted as signs of halting loss of biodiversity. An increase of species in 'favourable' and 'unfavourable bad' conservation status at the same time will have to be interpreted with care.
Note that the indicator is less responsive in the short term to policy changes than population trend indicators.
MetadataSummarytechnicalinformationontheindicator
Title: Species of European interest.Status: preliminary proposal. The indicator is being developed also within the SDI list.Definition: the indicator shows changes in the conservation status of species of European interest. It is currently based on data collected under the obligations for monitoring under Article 11 of the EU Habitats Directive (92/43/EEC).Geographical coverage: EU‑25, and EU‑27 in 2013 when the next Article 17 report is due. Temporal coverage: 2001–2006 and every six years thereafter.Update frequency: six years.Identified experts: ETC‑BD and DG ENV.
••
•
•
•••
References
Unvegetated areas
Heathland, scrub and tundra
Woodland and forests
Mires, bogs and fens
Freshwater
Farmland
Coastal areas
Number of species per conservation status
Unfavourable bad Unfavourable inadeqate Favourable
0 50 100 150 200 250
62
4Ecosystemcoverage
Halting the loss of biodiversity by 2010: proposal for a first set of indicators to monitor progress in Europe
Focalarea Status and trends of the components of biological diversity
Europeanindicatorheadline
Trends in extent of selected biomes, ecosystems and habitats
Keypolicyquestion What is the status of Europe's ecosystems and habitats and how can land use policy be used to preserve natural and semi natural areas?
Definition of the indicator
Proportional and absolute change in extent and turnover of land cover categories aggregated to relate to main ecosystem types in Europe from 1990 to 2000.
The 13 ecosystem types discussed represent forests, cropland, semi natural vegetation, wetlands, inland water systems, glaciers, permanent snow and urban/constructed/industrial /artificial areas. This indicator is based on photo‑interpretation of satellite imagery, and gives a 'wall to wall' picture of the changes and dynamics in Europe with respect to ecosystems. Additional indicators can be used to further highlight trends in extent and state of each of the ecosystem types mentioned above using computations from other data sources. A sub‑indicator of change in seagrass coverage of the European Seas can also be used as a proxy for the marine/coastal ecosystems.
Indicatortype(DPSIR) State
Context This indicator uses photo‑interpretation of satellite imagery to give a rough picture of the trend in area and proportion of the major ecosystems in Europe since 1990. Satellite imagery offers the potential to characterise land cover over very large areas efficiently and very cost effectively. It is possible to produce land cover maps from satellite imagery based on the spectral properties of each pixel within a scene. By grouping pixels into classes with similar spectral properties and associating these classes with particular land cover types, it is possible to produce maps which delineate land cover. Land cover change is then used to indicate the trends in the extent of major ecosystems, such as forests, croplands, wetlands, etc. For this indicator we use data from the Corine land cover database (CooRdinate Information on the Environment — Corine.
At present, data are available from 23 countries providing Corine land cover (CLC) data in 1990 and 2000 and changes between 1990 and 2000. The CLC data are based on 44 land cover classes that are aggregated into 13 ecosystem types for the purpose of this indicator (see Annex 1). Spectral properties allow the CLC project to distinguish between land cover classes. For example, CLC has three classes showing forest land cover: broad‑leaved forest, coniferous forest, and mixed forest. By aggregating the information of these three land cover classes we have information on the extent of the forest ecosystem within the limitations of the CLC data (see section on main disadvantages). The CLC data however are the best available at present to cover large areas of Europe in a harmonised way.
Relationoftheindicatortothefocalarea
This indicator is highly relevant for the CBD focal area on 'Status and trends of the components of biological diversity' as ecosystems are a major component of biological diversity. A particular ecosystem supports a particular set of species and their habitats. If an ecosystem is encroached upon and therefore decreases in area, the species and habitats it supports are at risk and they may not be able to sustain a viable population size. This indicator gives information on the trend in area of several ecosystems at the pan‑European level, through the trend in extent of the related land cover. It shows whether the area of an ecosystem has decreased or increased between 1990 and 2000. It can also show if the total area of any ecosystem has remained stable but with a large turnover to and from other categories. Albeit rough, the trends in ecosystem area provide information on the space available for the species and habitats of that particular ecosystem.
4 Ecosystemcoverage
4Ecosystemcoverage
63Halting the loss of biodiversity by 2010: proposal for a first set of indicators to monitor progress in Europe
Data sources and methodologyDataavailability Data source is the Corine land cover database 1990, 2000 and derived changes
1990–2000. The CLC is based on photo interpretation of satellite images (Landsat 7) by national teams in participating countries. The resulting national land cover inventories are integrated into a European database based on standard methodology and nomenclature with 44 classes, from urban areas to seas.
CLC data are available from the following 23 countries in Europe at present: Austria, Belgium, Bulgaria, Czech Republic, Germany, Denmark, Estonia, Spain, France, Greece, Hungary, Ireland, Italy, Lithuania, Luxembourg, Latvia, The Netherlands, Poland, Portugal, Romania, Slovenia, Slovakia, and United Kingdom.
The changes in land cover from 1990 to 2000 are given in the change database created for this specific purpose. In the Land Cover change database, change is calculated on a standard polygon size of 5 hectares in response to user needs. However, the accuracy of this information is determined by the CLC minimum polygon size, which is 25 hectares. These data have been processed and turned into a readily accessible spreadsheet file called Land Cover and Ecosystem Accounts (LEAC) created and managed by the EEA. An update of CLC is underway for 2006 and this should provide a third data point for tracking trends prior to 2010.
Methodology 1. The methodology of data processing is rather simple as the area of a particular ecosystem in 1990 is found by summing up the area of all CLC classes belonging to that ecosystem type. Changes have also been assessed exploring particular land cover changes from one land cover type to another. For more details on Corine methodology and production of the land cover map, see Corine land cover manuals at http://reports.eea.europa.eu/COR0‑landcover/en. The 13 ecosystem types discussed represent forests (forest and tall woodland, transitional woodland), cropland (regularly/ recently cultivated and mosaics), semi natural vegetation (heathland/ scrub/ tundra, grassland/tall forb, sparcely vegetated land) (4), wetlands (mire/bog/fen, coastal, marine), inland water systems, glaciers/ permanent snow and urban/constructed/industrial/artificial areas.
2. By use of the Land and Ecosystem Account (LEAC) database, analyses are made of the changes between CLC1990 and CLC2000 for 23 countries. The area of a particular CLC class is given in hectares. With reference to the aggregation table annexed to this form, the areas of various CLC classes have been aggregated to a total area for a particular ecosystem.
Evaluation of the indicatorMainadvantagesoftheindicator
Policy relevance: the indicator is highly relevant for the 2010 target. Ecosystems are components of biodiversity as defined by the Convention on Biological Diversity. Biodiversity relevance: the indicator has a high relevance for biodiversity because it indicates the area of available habitats and ecosystems across Europe. If an area decreases drastically it will have a negative influence on the species dependent on that habitat. In that sense this indicator is particularly important for specialist species and endemic species that are dependent on particular habitats in the ecosystem and cannot survive in other ecosystems. Well established methodology: the CLC methodology is widely accepted and more countries are expected to provide CLC data in the future thereby expanding the data coverage of this indicator. The indicator is easy to understand and gives a simple and clear overview of the trends in ecosystems.Geographical and temporal coverage: Corine land cover data is available from 23 EU Member States as two data points, i.e. year 1990 and 2000. For details on temporal coverage per country, see http://dataservice.eea.europa.eu/download.asp?id=16336andfiletype=.pdf. Additional countries have joined the network and have a first data point in 2000. With an updated version of CLC, more countries can therefore be assessed some with three data points, others with two. The latest update of Corine land cover data is for the year 2006.Aggregation possibilities to different scales/levels: the CLC data can easily be aggregated at different scales according to user needs. The data unit is hectares.
•
•
•
•
•
(4) 26 of the 44 Corine land cover classes are considered as natural and semi natural for the purpose of this indicator (see Annex 1 to indicator 'Fragmentation of natural and semi‑natural areas').
4Ecosystemcoverage
64 Halting the loss of biodiversity by 2010: proposal for a first set of indicators to monitor progress in Europe
Maindisadvantagesoftheindicator
The use of remote sensing data implies that some degree of detail is lost. The Corine land cover data set is based on a minimal unit of 25 hectares and this implies that smaller areas of certain habitat types and linear features may not be adequately detected. Other data sets (e.g. statistical offices reporting for forests, cropland, grassland area) cannot be combined in this indicator calculation because the different definitions used as well as the different frequencies in updating will produce incomparable trends.
•
Analysisofoptions The CBD indicator selected under this heading is on Trends of forest area based on FAO data. It focuses very much on global forests, including mangroves and tropical forests, and does not give information on other ecosystem types.
The present indicator on ecosystem trends is more appropriate for Europe because it gives a more detailed picture of the European ecosystems and it provides a broader picture of all ecosystems, not only forests.
The information from this indicator based on land cover data, can for assessment purposes be complemented by calculations (based on satellite imagery or statistical information) to provide more detailed information on the following ecosystems:
Ecosystem/habitat Datasetstobeused
Forests UN‑ECE/FAO Forest Resource Assessment (http://www.fao.org/forestry/site/fra/en/)indicator 4.3. 'naturalness' of the MCPFE set (http://www.mcpfe.org/documents/r_2007/),and a forest status indicator that is being developed (based on surrogate measures for biodiversity, taking into account concepts like quality, functionality and integrity of forest ecosystems).
•
•
•
Cropland Area of cropland collected by FAO (FAO Production Yearbook, http://faostat.fao.org/faostat/)
Wetlands Satellite data on wetlands (methodology to be tested) and data from the Ramsar List of Wetlands of International Importance (http://www.ramsar.org/index_list.htm)
Glaciers Fluctuations of Glaciers (FoG) — series, published by the World glacier monitoring service (http://www.geo.unizh.ch/wgms/fog.html)
Sea‑ice Data set on Sea Ice at the National Snow and Ice Data Center (http://nsidc.org/data/seaice_index/)
Seagrasses There are no baseline data sets on coverage readily available at the level of the European seas. Relevant information exists in the World Atlas of Seagrasses, which is publicly available and maintained by UNEP/ WCMC, but has gaps with regard to the European coastline (http://www.wcmc.org.uk/marine/seagrassatlas/introduction.htm).
A voluntary data flow on seagrasses is proposed by the EEA to its member countries.
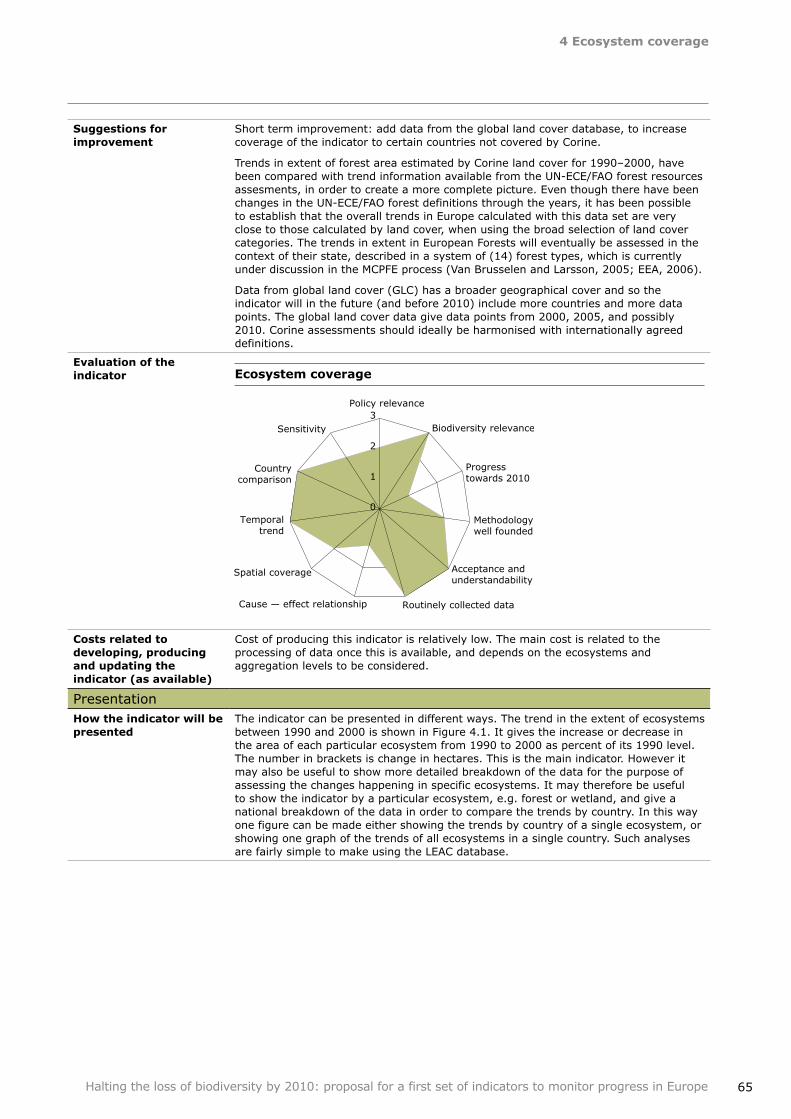
4Ecosystemcoverage
65Halting the loss of biodiversity by 2010: proposal for a first set of indicators to monitor progress in Europe
Suggestionsforimprovement
Short term improvement: add data from the global land cover database, to increase coverage of the indicator to certain countries not covered by Corine.
Trends in extent of forest area estimated by Corine land cover for 1990–2000, have been compared with trend information available from the UN‑ECE/FAO forest resources assesments, in order to create a more complete picture. Even though there have been changes in the UN‑ECE/FAO forest definitions through the years, it has been possible to establish that the overall trends in Europe calculated with this data set are very close to those calculated by land cover, when using the broad selection of land cover categories. The trends in extent in European Forests will eventually be assessed in the context of their state, described in a system of (14) forest types, which is currently under discussion in the MCPFE process (Van Brusselen and Larsson, 2005; EEA, 2006).
Data from global land cover (GLC) has a broader geographical cover and so the indicator will in the future (and before 2010) include more countries and more data points. The global land cover data give data points from 2000, 2005, and possibly 2010. Corine assessments should ideally be harmonised with internationally agreed definitions.
Evaluationoftheindicator Ecosystemcoverage
Costsrelatedtodeveloping,producingandupdatingtheindicator(asavailable)
Cost of producing this indicator is relatively low. The main cost is related to the processing of data once this is available, and depends on the ecosystems and aggregation levels to be considered.
PresentationHowtheindicatorwillbepresented
The indicator can be presented in different ways. The trend in the extent of ecosystems between 1990 and 2000 is shown in Figure 4.1. It gives the increase or decrease in the area of each particular ecosystem from 1990 to 2000 as percent of its 1990 level. The number in brackets is change in hectares. This is the main indicator. However it may also be useful to show more detailed breakdown of the data for the purpose of assessing the changes happening in specific ecosystems. It may therefore be useful to show the indicator by a particular ecosystem, e.g. forest or wetland, and give a national breakdown of the data in order to compare the trends by country. In this way one figure can be made either showing the trends by country of a single ecosystem, or showing one graph of the trends of all ecosystems in a single country. Such analyses are fairly simple to make using the LEAC database.
0
1
2
3Policy relevance
Biodiversity relevance
Progresstowards 2010
Methodologywell founded
Acceptance andunderstandability
Routinely collected dataCause — effect relationship
Spatial coverage
Temporaltrend
Countrycomparison
Sensitivity
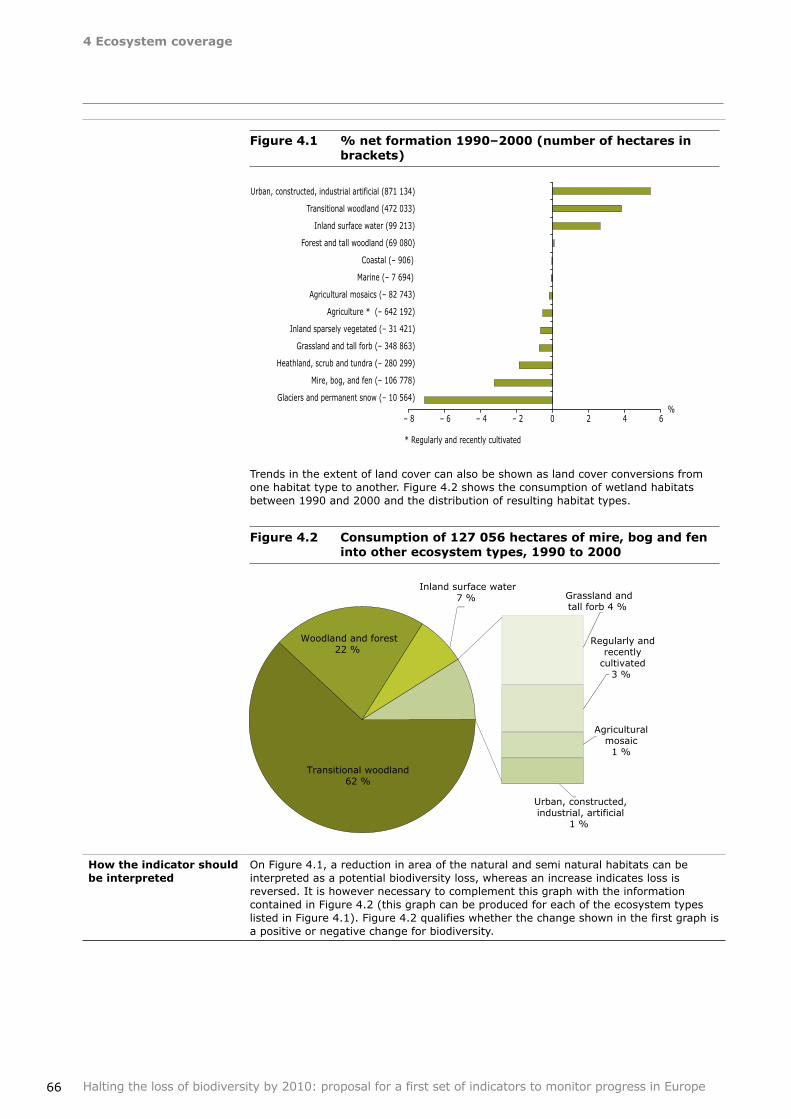
4Ecosystemcoverage
66 Halting the loss of biodiversity by 2010: proposal for a first set of indicators to monitor progress in Europe
Figure4.1 %netformation1990–2000(numberofhectaresinbrackets)
Trends in the extent of land cover can also be shown as land cover conversions from one habitat type to another. Figure 4.2 shows the consumption of wetland habitats between 1990 and 2000 and the distribution of resulting habitat types.
Figure4.2 Consumptionof127056hectaresofmire,bogandfenintootherecosystemtypes,1990to2000
Howtheindicatorshouldbeinterpreted
On Figure 4.1, a reduction in area of the natural and semi natural habitats can be interpreted as a potential biodiversity loss, whereas an increase indicates loss is reversed. It is however necessary to complement this graph with the information contained in Figure 4.2 (this graph can be produced for each of the ecosystem types listed in Figure 4.1). Figure 4.2 qualifies whether the change shown in the first graph is a positive or negative change for biodiversity.
Urban, constructed, industrial artificial (871 134)
Transitional woodland (472 033)
Inland surface water (99 213)
Forest and tall woodland (69 080)
Coastal (– 906)
Marine (– 7 694)
Agricultural mosaics (– 82 743)
Agriculture * (– 642 192)
Inland sparsely vegetated (– 31 421)
Grassland and tall forb (– 348 863)
Heathland, scrub and tundra (– 280 299)
Mire, bog, and fen (– 106 778)
Glaciers and permanent snow (– 10 564)
– 8 – 6 – 4 – 2 0 2 4 6%
* Regularly and recently cultivated
Woodland and forest22 %
Transitional woodland62 %
Inland surface water7 % Grassland and
tall forb 4 %
Urban, constructed,industrial, artificial
1 %
Agriculturalmosaic
1 %
Regularly andrecently
cultivated3 %
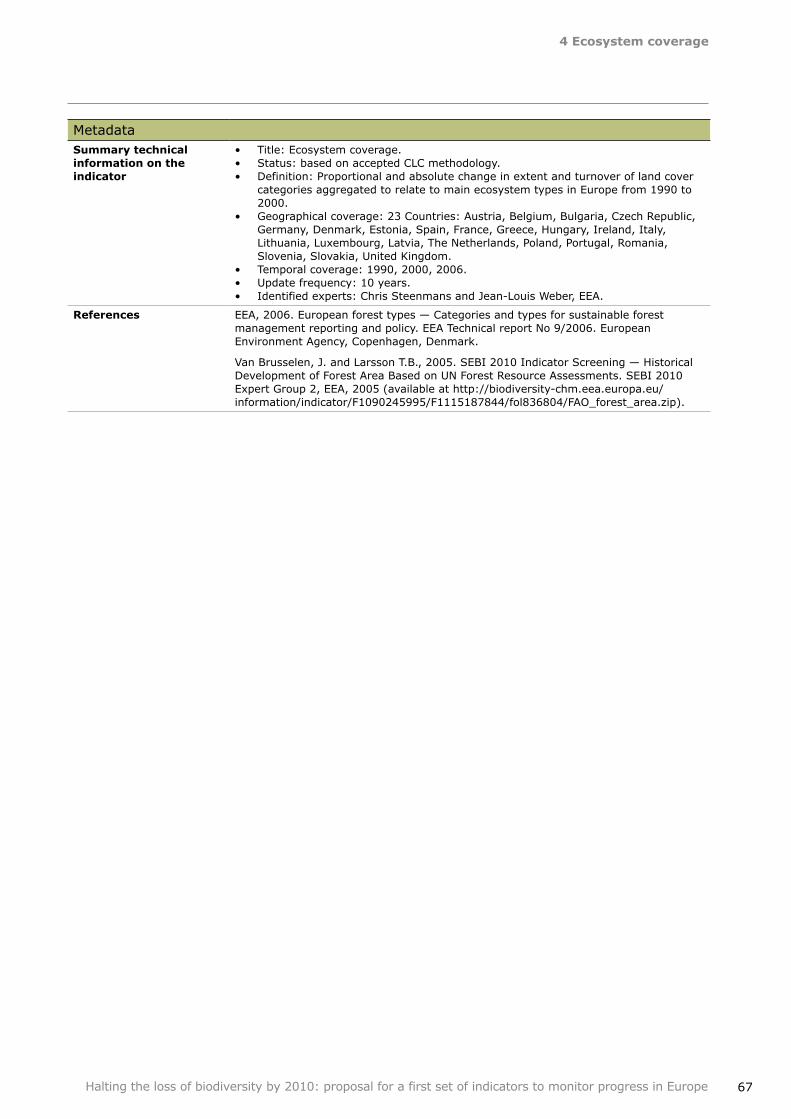
4Ecosystemcoverage
67Halting the loss of biodiversity by 2010: proposal for a first set of indicators to monitor progress in Europe
MetadataSummarytechnicalinformationontheindicator
Title: Ecosystem coverage.Status: based on accepted CLC methodology.Definition: Proportional and absolute change in extent and turnover of land cover categories aggregated to relate to main ecosystem types in Europe from 1990 to 2000.Geographical coverage: 23 Countries: Austria, Belgium, Bulgaria, Czech Republic, Germany, Denmark, Estonia, Spain, France, Greece, Hungary, Ireland, Italy, Lithuania, Luxembourg, Latvia, The Netherlands, Poland, Portugal, Romania, Slovenia, Slovakia, United Kingdom.Temporal coverage: 1990, 2000, 2006.Update frequency: 10 years.Identified experts: Chris Steenmans and Jean‑Louis Weber, EEA.
•••
•
•••
References EEA, 2006. European forest types — Categories and types for sustainable forest management reporting and policy. EEA Technical report No 9/2006. European Environment Agency, Copenhagen, Denmark.
Van Brusselen, J. and Larsson T.B., 2005. SEBI 2010 Indicator Screening — Historical Development of Forest Area Based on UN Forest Resource Assessments. SEBI 2010 Expert Group 2, EEA, 2005 (available at http://biodiversity‑chm.eea.europa.eu/information/indicator/F1090245995/F1115187844/fol836804/FAO_forest_area.zip).
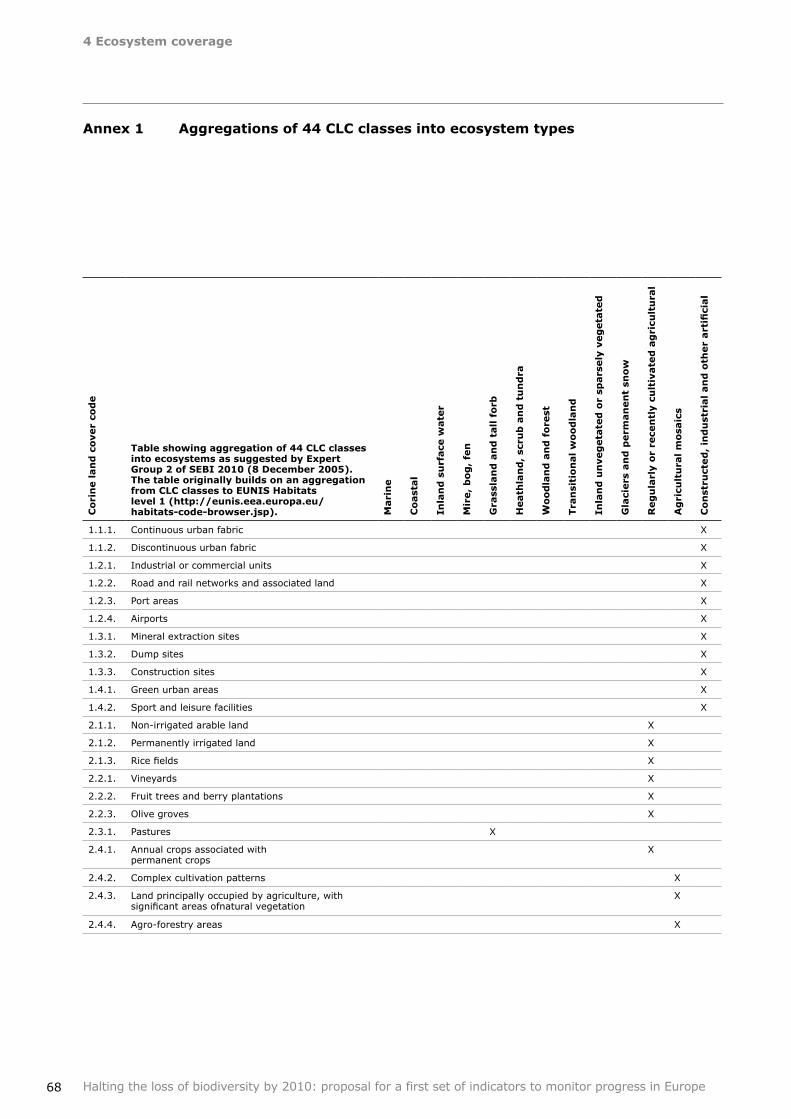
4Ecosystemcoverage
68 Halting the loss of biodiversity by 2010: proposal for a first set of indicators to monitor progress in Europe
Annex1 Aggregationsof44CLCclassesintoecosystemtypes
Co
rin
el
an
dc
over
cod
e
Tableshowingaggregationof44CLCclassesintoecosystemsassuggestedbyExpertGroup2ofSEBI2010(8December2005).ThetableoriginallybuildsonanaggregationfromCLCclassestoEUNISHabitatslevel1(http://eunis.eea.europa.eu/habitats‑code‑browser.jsp). M
ari
ne
Co
ast
al
Inla
nd
su
rface
wate
r
Mir
e,
bo
g,
fen
Gra
ssla
nd
an
dt
all
fo
rb
Heath
lan
d,
scru
ba
nd
tu
nd
ra
Wo
od
lan
da
nd
fo
rest
Tra
nsi
tio
nal
wo
od
lan
d
Inla
nd
un
veg
eta
ted
or
spars
ely
veg
eta
ted
Gla
ciers
an
dp
erm
an
en
tsn
ow
Reg
ula
rlyo
rre
cen
tlyc
ult
ivate
da
gri
cult
ura
l
Ag
ricu
ltu
ral
mo
saic
s
Co
nst
ruct
ed
, in
du
stri
al an
d o
ther
art
ifici
al
1.1.1. Continuous urban fabric X
1.1.2. Discontinuous urban fabric X
1.2.1. Industrial or commercial units X
1.2.2. Road and rail networks and associated land X
1.2.3. Port areas X
1.2.4. Airports X
1.3.1. Mineral extraction sites X
1.3.2. Dump sites X
1.3.3. Construction sites X
1.4.1. Green urban areas X
1.4.2. Sport and leisure facilities X
2.1.1. Non‑irrigated arable land X
2.1.2. Permanently irrigated land X
2.1.3. Rice fields X
2.2.1. Vineyards X
2.2.2. Fruit trees and berry plantations X
2.2.3. Olive groves X
2.3.1. Pastures X
2.4.1. Annual crops associated with permanent crops
X
2.4.2. Complex cultivation patterns X
2.4.3. Land principally occupied by agriculture, with significant areas ofnatural vegetation
X
2.4.4. Agro‑forestry areas X
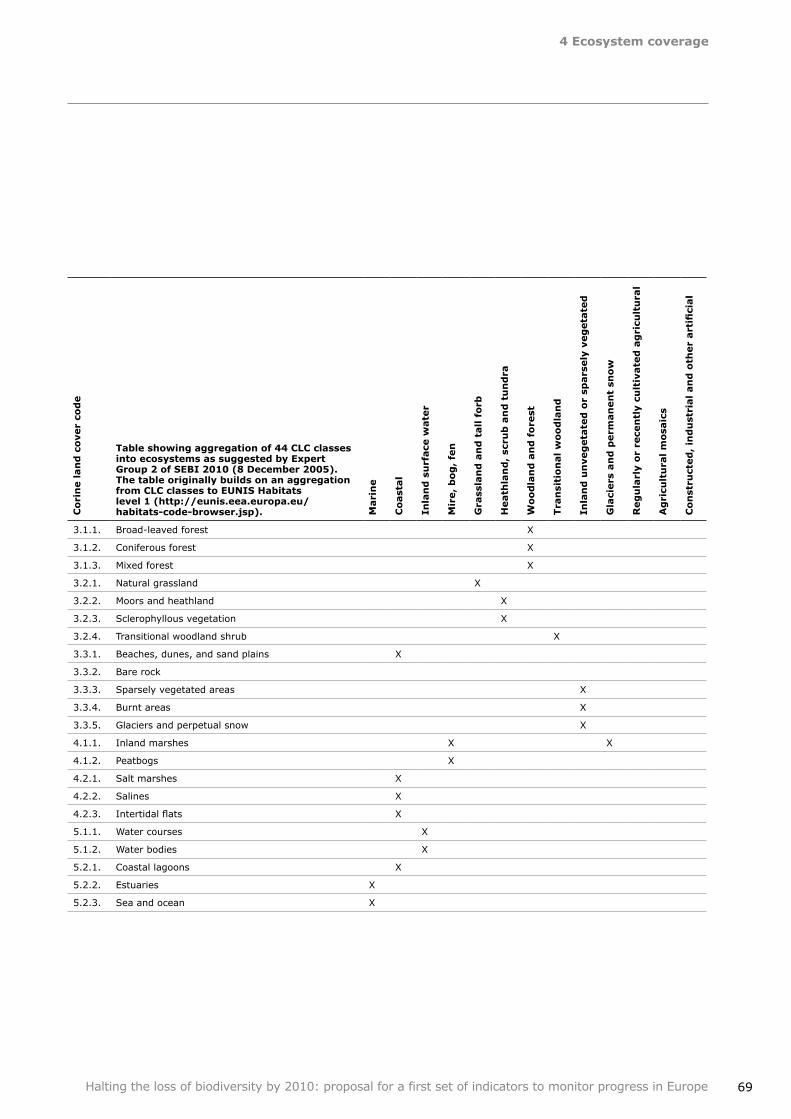
4Ecosystemcoverage
69Halting the loss of biodiversity by 2010: proposal for a first set of indicators to monitor progress in Europe
Co
rin
el
an
dc
over
cod
e
Tableshowingaggregationof44CLCclassesintoecosystemsassuggestedbyExpertGroup2ofSEBI2010(8December2005).ThetableoriginallybuildsonanaggregationfromCLCclassestoEUNISHabitatslevel1(http://eunis.eea.europa.eu/habitats‑code‑browser.jsp). M
ari
ne
Co
ast
al
Inla
nd
su
rface
wate
r
Mir
e,
bo
g,
fen
Gra
ssla
nd
an
dt
all
fo
rb
Heath
lan
d,
scru
ba
nd
tu
nd
ra
Wo
od
lan
da
nd
fo
rest
Tra
nsi
tio
nal
wo
od
lan
d
Inla
nd
un
veg
eta
ted
or
spars
ely
veg
eta
ted
Gla
ciers
an
dp
erm
an
en
tsn
ow
Reg
ula
rlyo
rre
cen
tlyc
ult
ivate
da
gri
cult
ura
l
Ag
ricu
ltu
ral
mo
saic
s
Co
nst
ruct
ed
, in
du
stri
al an
d o
ther
art
ifici
al
3.1.1. Broad‑leaved forest X
3.1.2. Coniferous forest X
3.1.3. Mixed forest X
3.2.1. Natural grassland X
3.2.2. Moors and heathland X
3.2.3. Sclerophyllous vegetation X
3.2.4. Transitional woodland shrub X
3.3.1. Beaches, dunes, and sand plains X
3.3.2. Bare rock
3.3.3. Sparsely vegetated areas X
3.3.4. Burnt areas X
3.3.5. Glaciers and perpetual snow X
4.1.1. Inland marshes X X
4.1.2. Peatbogs X
4.2.1. Salt marshes X
4.2.2. Salines X
4.2.3. Intertidal flats X
5.1.1. Water courses X
5.1.2. Water bodies X
5.2.1. Coastal lagoons X
5.2.2. Estuaries X
5.2.3. Sea and ocean X
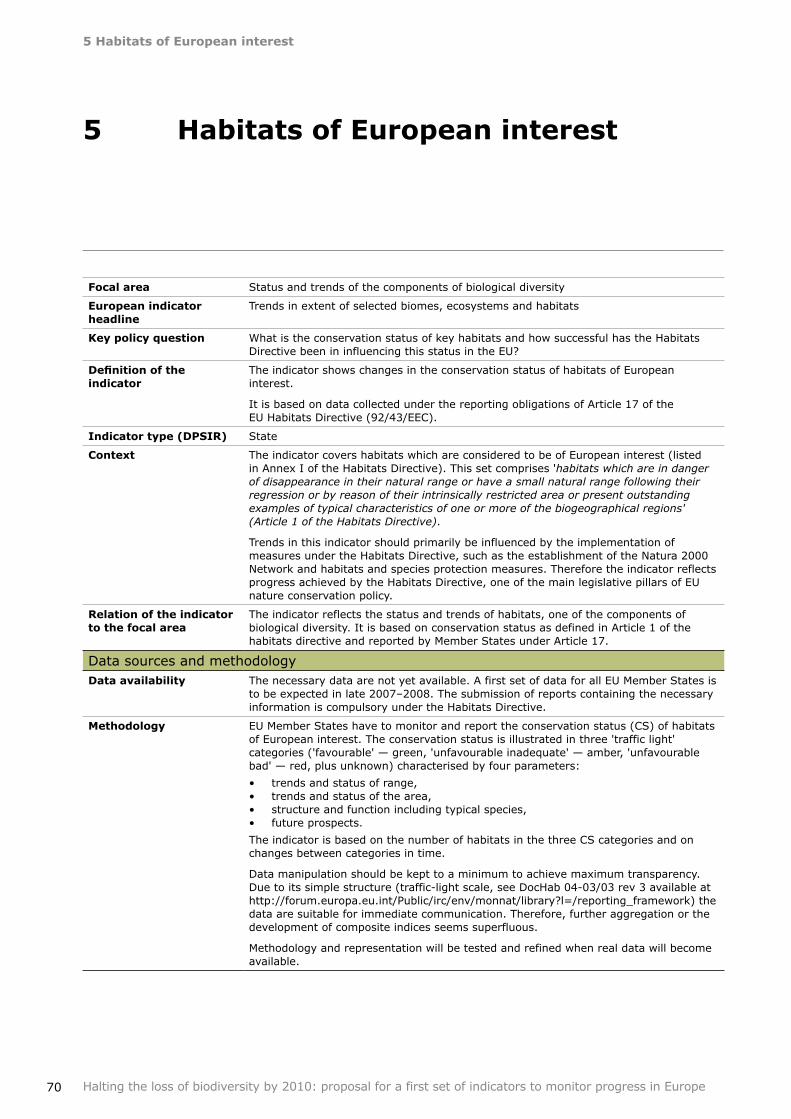
70
5HabitatsofEuropeaninterest
Halting the loss of biodiversity by 2010: proposal for a first set of indicators to monitor progress in Europe
Focalarea Status and trends of the components of biological diversity
Europeanindicatorheadline
Trends in extent of selected biomes, ecosystems and habitats
Keypolicyquestion What is the conservation status of key habitats and how successful has the Habitats Directive been in influencing this status in the EU?
Definition of the indicator
The indicator shows changes in the conservation status of habitats of European interest.
It is based on data collected under the reporting obligations of Article 17 of the EU Habitats Directive (92/43/EEC).
Indicatortype(DPSIR) State
Context The indicator covers habitats which are considered to be of European interest (listed in Annex I of the Habitats Directive). This set comprises 'habitats which are in danger of disappearance in their natural range or have a small natural range following their regression or by reason of their intrinsically restricted area or present outstanding examples of typical characteristics of one or more of the biogeographical regions' (Article 1 of the Habitats Directive).
Trends in this indicator should primarily be influenced by the implementation of measures under the Habitats Directive, such as the establishment of the Natura 2000 Network and habitats and species protection measures. Therefore the indicator reflects progress achieved by the Habitats Directive, one of the main legislative pillars of EU nature conservation policy.
Relationoftheindicatortothefocalarea
The indicator reflects the status and trends of habitats, one of the components of biological diversity. It is based on conservation status as defined in Article 1 of the habitats directive and reported by Member States under Article 17.
Data sources and methodologyDataavailability The necessary data are not yet available. A first set of data for all EU Member States is
to be expected in late 2007–2008. The submission of reports containing the necessary information is compulsory under the Habitats Directive.
Methodology EU Member States have to monitor and report the conservation status (CS) of habitats of European interest. The conservation status is illustrated in three 'traffic light' categories ('favourable' — green, 'unfavourable inadequate' — amber, 'unfavourable bad' — red, plus unknown) characterised by four parameters:
trends and status of range, trends and status of the area, structure and function including typical species,future prospects.
The indicator is based on the number of habitats in the three CS categories and on changes between categories in time.
Data manipulation should be kept to a minimum to achieve maximum transparency. Due to its simple structure (traffic‑light scale, see DocHab 04‑03/03 rev 3 available at http://forum.europa.eu.int/Public/irc/env/monnat/library?l=/reporting_framework) the data are suitable for immediate communication. Therefore, further aggregation or the development of composite indices seems superfluous.
Methodology and representation will be tested and refined when real data will become available.
••••
5 HabitatsofEuropeaninterest
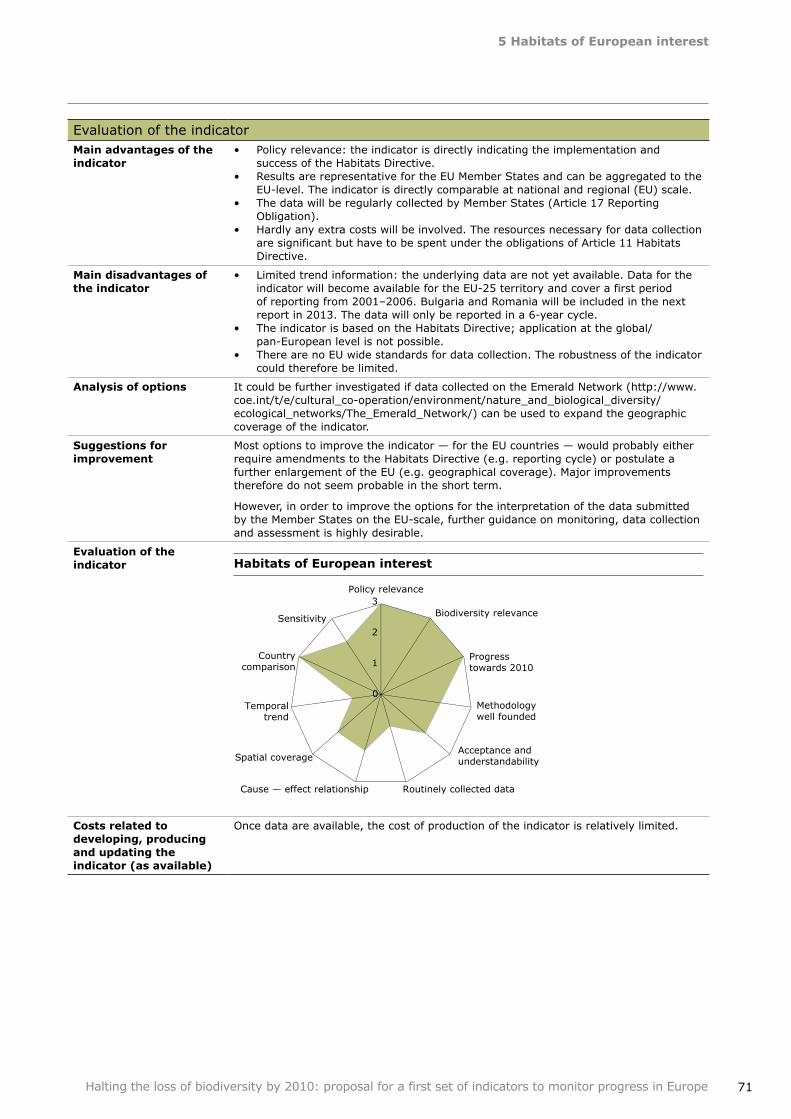
5HabitatsofEuropeaninterest
71Halting the loss of biodiversity by 2010: proposal for a first set of indicators to monitor progress in Europe
Evaluation of the indicatorMainadvantagesoftheindicator
Policy relevance: the indicator is directly indicating the implementation and success of the Habitats Directive. Results are representative for the EU Member States and can be aggregated to the EU‑level. The indicator is directly comparable at national and regional (EU) scale.The data will be regularly collected by Member States (Article 17 Reporting Obligation).Hardly any extra costs will be involved. The resources necessary for data collection are significant but have to be spent under the obligations of Article 11 Habitats Directive.
•
•
•
•
Maindisadvantagesoftheindicator
Limited trend information: the underlying data are not yet available. Data for the indicator will become available for the EU‑25 territory and cover a first period of reporting from 2001–2006. Bulgaria and Romania will be included in the next report in 2013. The data will only be reported in a 6‑year cycle.The indicator is based on the Habitats Directive; application at the global/pan‑European level is not possible.There are no EU wide standards for data collection. The robustness of the indicator could therefore be limited.
•
•
•
Analysisofoptions It could be further investigated if data collected on the Emerald Network (http://www.coe.int/t/e/cultural_co‑operation/environment/nature_and_biological_diversity/ecological_networks/The_Emerald_Network/) can be used to expand the geographic coverage of the indicator.
Suggestionsforimprovement
Most options to improve the indicator — for the EU countries — would probably either require amendments to the Habitats Directive (e.g. reporting cycle) or postulate a further enlargement of the EU (e.g. geographical coverage). Major improvements therefore do not seem probable in the short term.
However, in order to improve the options for the interpretation of the data submitted by the Member States on the EU‑scale, further guidance on monitoring, data collection and assessment is highly desirable.
Evaluationoftheindicator HabitatsofEuropeaninterest
Costsrelatedtodeveloping,producingandupdatingtheindicator(asavailable)
Once data are available, the cost of production of the indicator is relatively limited.
0
1
2
3 Policy relevance
Biodiversity relevance
Progress towards 2010
Methodology well founded
Acceptance and understandability
Routinely collected data Cause — effect relationship
Spatial coverage
Temporal trend
Country comparison
Sensitivity
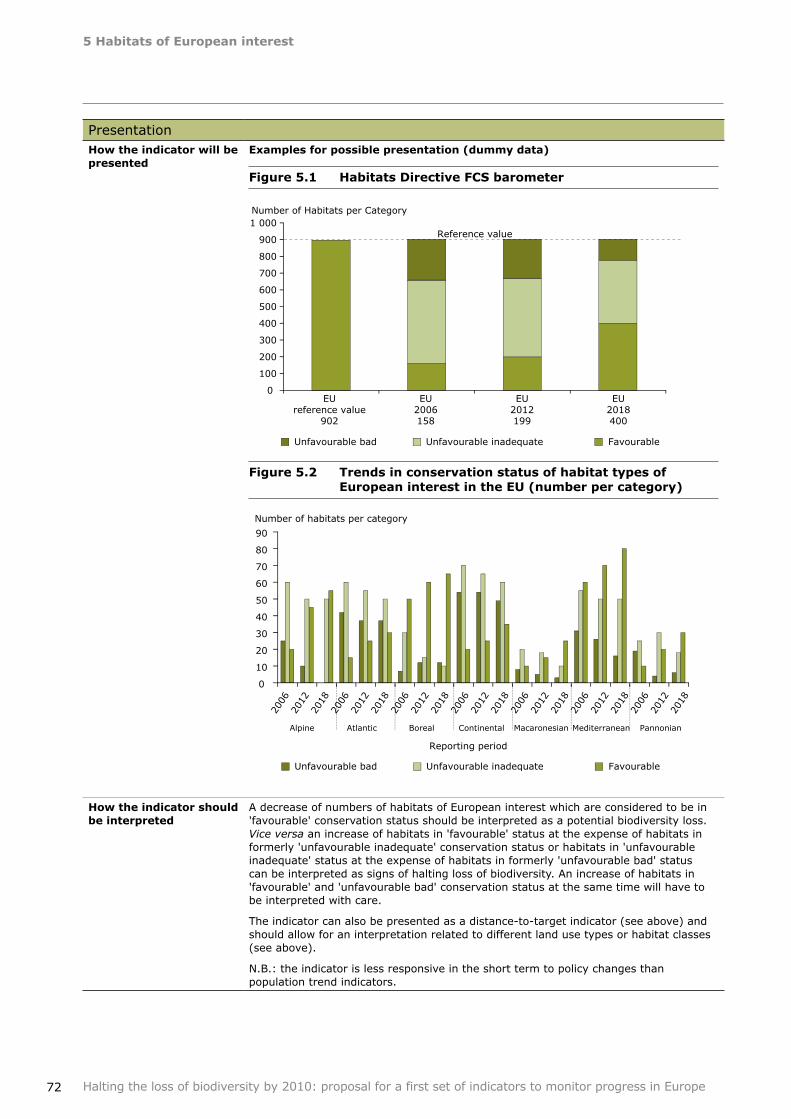
5HabitatsofEuropeaninterest
72 Halting the loss of biodiversity by 2010: proposal for a first set of indicators to monitor progress in Europe
PresentationHowtheindicatorwillbepresented
Examplesforpossiblepresentation(dummydata)
Figure5.1 HabitatsDirectiveFCSbarometer
Figure5.2 TrendsinconservationstatusofhabitattypesofEuropeaninterestintheEU(numberpercategory)
Howtheindicatorshouldbeinterpreted
A decrease of numbers of habitats of European interest which are considered to be in 'favourable' conservation status should be interpreted as a potential biodiversity loss. Vice versa an increase of habitats in 'favourable' status at the expense of habitats in formerly 'unfavourable inadequate' conservation status or habitats in 'unfavourable inadequate' status at the expense of habitats in formerly 'unfavourable bad' status can be interpreted as signs of halting loss of biodiversity. An increase of habitats in 'favourable' and 'unfavourable bad' conservation status at the same time will have to be interpreted with care.
The indicator can also be presented as a distance‑to‑target indicator (see above) and should allow for an interpretation related to different land use types or habitat classes (see above).
N.B.: the indicator is less responsive in the short term to policy changes than population trend indicators.
Number of Habitats per Category
0
100
200
300
400
500
600
700
800
900
1 000Reference value
Unfavourable bad
EUreference value
902
EU2006158
EU2012199
EU2018400
Unfavourable inadequate Favourable
0
10
20
30
40
50
60
70
80
90
Reporting period
2006
2012
2018
2006
2012
2018
2006
2012
2018
2006
2012
2018
2006
2012
2018
2006
2012
2018
2006
2012
2018
Alpine Atlantic Boreal Continental Macaronesian Mediterranean Pannonian
Number of habitats per category
Unfavourable bad Unfavourable inadequate Favourable
5HabitatsofEuropeaninterest
73Halting the loss of biodiversity by 2010: proposal for a first set of indicators to monitor progress in Europe
MetadataSummarytechnicalinformationontheindicator
Title: Habitats of European interest.Status: preliminary proposalDefinition: the indicator shows changes in the conservation status of habitats of European interest. It is based on data collected under the reporting obligations of Article 17 of the EU Habitats Directive (92/43/EEC).Geographical coverage: EU‑25, (EU‑27 in 2013).Temporal coverage: 2001–2006 and every six years thereafter.Update frequency: six years.Identified experts: persons in charge for Article 11 and Article 17 implementation on Member States‑level, ETC‑BD, EEA and DG‑ENV.
•••
••••
References
74
6Livestockgeneticdiversity
Halting the loss of biodiversity by 2010: proposal for a first set of indicators to monitor progress in Europe
Focalarea Status and trends of the components of biological diversity
Europeanindicatorheadline
Trends in genetic diversity of domesticated animals, cultivated plants, fish species and trees of major socioeconomic importance
Keypolicyquestion What is the status of genetic diversity in European livestock breeds, and how can countries ensure conservation of breeds for which they have a special responsibility?
Definition of the indicator
The present indicator shows the share of breeding female population between introduced and native breed species (namely, cattle and sheep) per country, as a proxy to assess the genetic diversity of these species.
In addition, it shows the proportion of native breeds which is threatened due to low breeding female population.
Indicatortype(DPSIR) State
Context Animal breeds constitute a pool of genetic resources of considerable potential value in a changing society and environment.
A large number of breeds which were exploited in the beginning of the 20th century are now threatened with decline due to a lack of economic interest. Their population becomes too low to ensure their viability. Simultaneously, intensification, uniformisation and modernisation of production methods have led to the selection and widespread use (thus large populations) of a small number of highly performing breeds which to a large extent can fulfill European needs for agricultural products. Many of these breeds are introduced (i.e. non‑native). The widespread use of introduced cattle breeds, whose population tends to become dominant in some countries, is called the 'holsteineisation effect'.
In Europe, apart from food purposes, there is an increase in the use of animals for other goals like hobby farming and the use of animals for sports (horses). These developments also require a large variability in the genetic variation of the species used for these purposes.
While old native breeds may be less productive than highly specialised breeds, they are generally very well adapted to local circumstances and resources and may increase resilience in the long term. Considering the share of native breeds populations within each country highlights the national responsibility for conservation of the related breeds. Breeds with a low population are in general more vulnerable than those with a high population. The indicator shows the share of breeding female population between introduced and native breeds (for cattle and sheep) per country. In addition its shows the proportion of native breeds which is threatened due to low breeding female population.
Conservation of livestock breeds — among other genetic resources — is addressed:
Atinternationallevel
in the Convention on Biological Diversity (Article 1), 1992. According to the CBD, countries remain sovereign over their natural resources.in the FAO Global Strategy for the management of farm animal genetic resources, 1997 (http://dad.fao.org/en/TOOLS/Present/p‑aid.pdf).
AtEUlevel
in the European Community Biodiversity Strategy (1998). in the corresponding Biodiversity Action Plan on Agriculture ((COM (2001) 162), which called for a new Community programme on the conservation, characterization, collection and utilisation of genetic resources in agriculture.in the Message from the stakeholders conference held in Malahide in May 2004.
•
•
••
•
6 Livestockgeneticdiversity
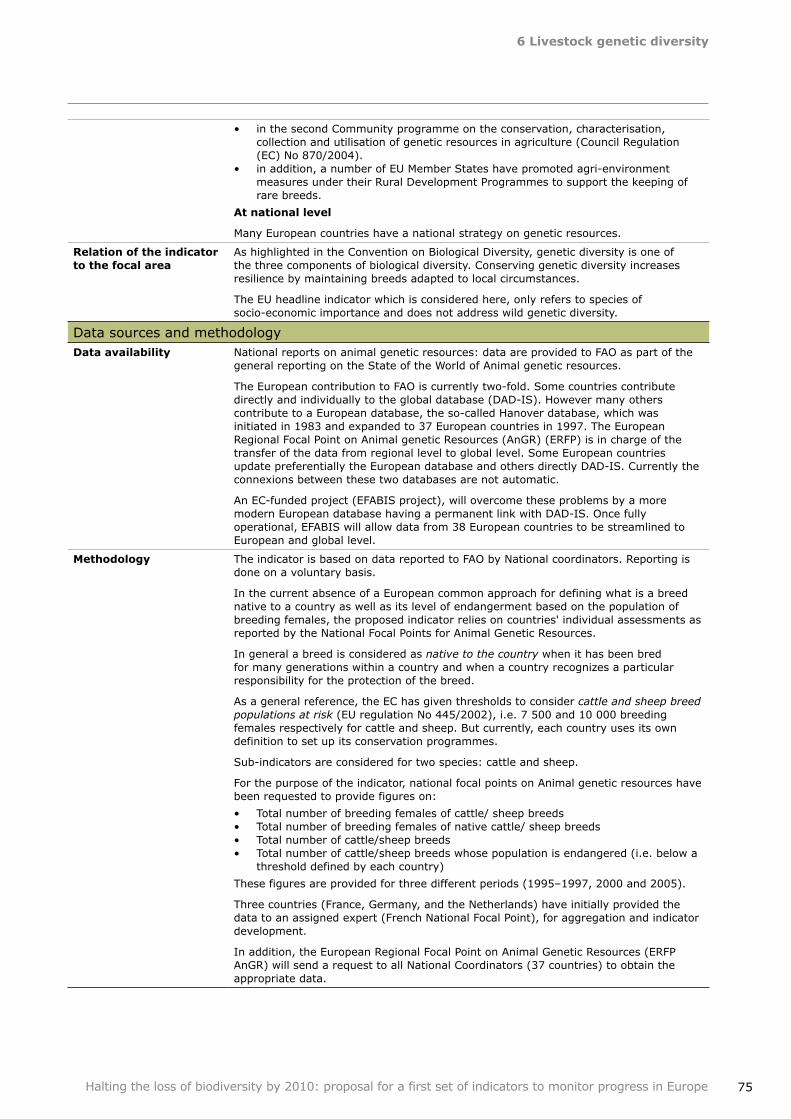
6Livestockgeneticdiversity
75Halting the loss of biodiversity by 2010: proposal for a first set of indicators to monitor progress in Europe
in the second Community programme on the conservation, characterisation, collection and utilisation of genetic resources in agriculture (Council Regulation (EC) No 870/2004).in addition, a number of EU Member States have promoted agri‑environment measures under their Rural Development Programmes to support the keeping of rare breeds.
Atnationallevel
Many European countries have a national strategy on genetic resources.
•
•
Relationoftheindicatortothefocalarea
As highlighted in the Convention on Biological Diversity, genetic diversity is one of the three components of biological diversity. Conserving genetic diversity increases resilience by maintaining breeds adapted to local circumstances.
The EU headline indicator which is considered here, only refers to species of socio‑economic importance and does not address wild genetic diversity.
Data sources and methodologyDataavailability National reports on animal genetic resources: data are provided to FAO as part of the
general reporting on the State of the World of Animal genetic resources.
The European contribution to FAO is currently two‑fold. Some countries contribute directly and individually to the global database (DAD‑IS). However many others contribute to a European database, the so‑called Hanover database, which was initiated in 1983 and expanded to 37 European countries in 1997. The European Regional Focal Point on Animal genetic Resources (AnGR) (ERFP) is in charge of the transfer of the data from regional level to global level. Some European countries update preferentially the European database and others directly DAD‑IS. Currently the connexions between these two databases are not automatic.
An EC‑funded project (EFABIS project), will overcome these problems by a more modern European database having a permanent link with DAD‑IS. Once fully operational, EFABIS will allow data from 38 European countries to be streamlined to European and global level.
Methodology The indicator is based on data reported to FAO by National coordinators. Reporting is done on a voluntary basis.
In the current absence of a European common approach for defining what is a breed native to a country as well as its level of endangerment based on the population of breeding females, the proposed indicator relies on countries' individual assessments as reported by the National Focal Points for Animal Genetic Resources.
In general a breed is considered as native to the country when it has been bred for many generations within a country and when a country recognizes a particular responsibility for the protection of the breed.
As a general reference, the EC has given thresholds to consider cattle and sheep breed populations at risk (EU regulation No 445/2002), i.e. 7 500 and 10 000 breeding females respectively for cattle and sheep. But currently, each country uses its own definition to set up its conservation programmes.
Sub‑indicators are considered for two species: cattle and sheep.
For the purpose of the indicator, national focal points on Animal genetic resources have been requested to provide figures on:
Total number of breeding females of cattle/ sheep breedsTotal number of breeding females of native cattle/ sheep breedsTotal number of cattle/sheep breedsTotal number of cattle/sheep breeds whose population is endangered (i.e. below a threshold defined by each country)
These figures are provided for three different periods (1995–1997, 2000 and 2005).
Three countries (France, Germany, and the Netherlands) have initially provided the data to an assigned expert (French National Focal Point), for aggregation and indicator development.
In addition, the European Regional Focal Point on Animal Genetic Resources (ERFP AnGR) will send a request to all National Coordinators (37 countries) to obtain the appropriate data.
••••
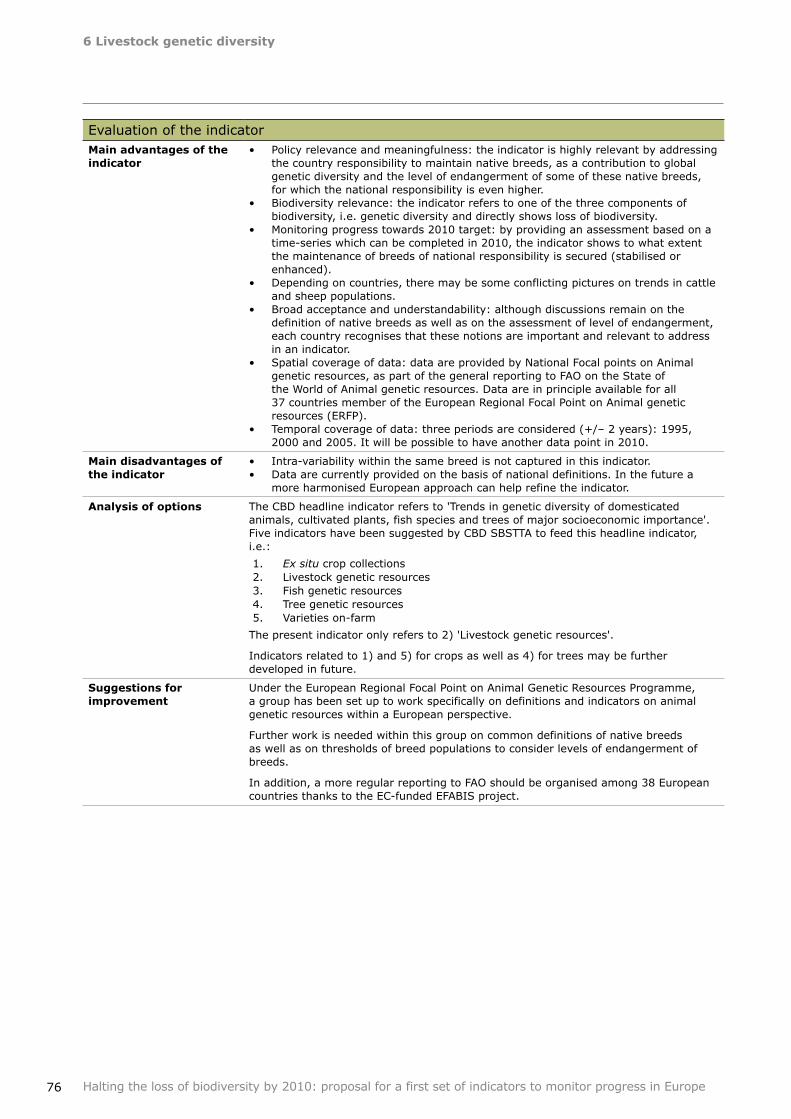
6Livestockgeneticdiversity
76 Halting the loss of biodiversity by 2010: proposal for a first set of indicators to monitor progress in Europe
Evaluation of the indicatorMainadvantagesoftheindicator
Policy relevance and meaningfulness: the indicator is highly relevant by addressing the country responsibility to maintain native breeds, as a contribution to global genetic diversity and the level of endangerment of some of these native breeds, for which the national responsibility is even higher.Biodiversity relevance: the indicator refers to one of the three components of biodiversity, i.e. genetic diversity and directly shows loss of biodiversity.Monitoring progress towards 2010 target: by providing an assessment based on a time‑series which can be completed in 2010, the indicator shows to what extent the maintenance of breeds of national responsibility is secured (stabilised or enhanced).Depending on countries, there may be some conflicting pictures on trends in cattle and sheep populations.Broad acceptance and understandability: although discussions remain on the definition of native breeds as well as on the assessment of level of endangerment, each country recognises that these notions are important and relevant to address in an indicator. Spatial coverage of data: data are provided by National Focal points on Animal genetic resources, as part of the general reporting to FAO on the State of the World of Animal genetic resources. Data are in principle available for all 37 countries member of the European Regional Focal Point on Animal genetic resources (ERFP).Temporal coverage of data: three periods are considered (+/– 2 years): 1995, 2000 and 2005. It will be possible to have another data point in 2010.
•
•
•
•
•
•
•
Maindisadvantagesoftheindicator
Intra‑variability within the same breed is not captured in this indicator.Data are currently provided on the basis of national definitions. In the future a more harmonised European approach can help refine the indicator.
••
Analysisofoptions The CBD headline indicator refers to 'Trends in genetic diversity of domesticated animals, cultivated plants, fish species and trees of major socioeconomic importance'. Five indicators have been suggested by CBD SBSTTA to feed this headline indicator, i.e.:
Ex situ crop collections Livestock genetic resources Fish genetic resources Tree genetic resources Varieties on‑farm
The present indicator only refers to 2) 'Livestock genetic resources'.
Indicators related to 1) and 5) for crops as well as 4) for trees may be further developed in future.
1.2.3.4.5.
Suggestionsforimprovement
Under the European Regional Focal Point on Animal Genetic Resources Programme, a group has been set up to work specifically on definitions and indicators on animal genetic resources within a European perspective.
Further work is needed within this group on common definitions of native breeds as well as on thresholds of breed populations to consider levels of endangerment of breeds.
In addition, a more regular reporting to FAO should be organised among 38 European countries thanks to the EC‑funded EFABIS project.
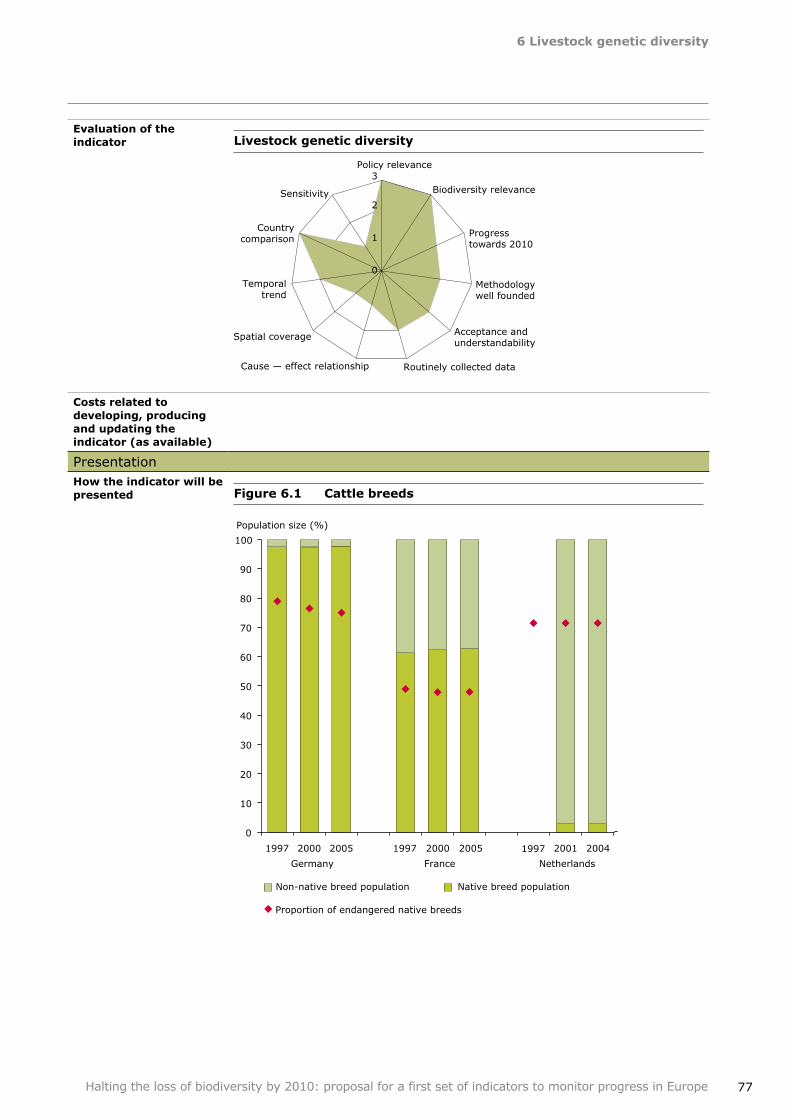
6Livestockgeneticdiversity
77Halting the loss of biodiversity by 2010: proposal for a first set of indicators to monitor progress in Europe
Evaluationoftheindicator Livestockgeneticdiversity
Costsrelatedtodeveloping,producingandupdatingtheindicator(asavailable)
PresentationHowtheindicatorwillbepresented Figure6.1 Cattlebreeds
0
1
2
3 Policy relevance
Biodiversity relevance
Progress towards 2010
Methodology well founded
Acceptance and understandability
Routinely collected data Cause — effect relationship
Spatial coverage
Temporal trend
Country comparison
Sensitivity
Population size (%)
0
10
20
30
40
50
60
70
80
90
100
Non-native breed population
Germany France Netherlands
1997 2000 2005 1997 2000 2005 1997 2001 2004
Native breed population
Proportion of endangered native breeds
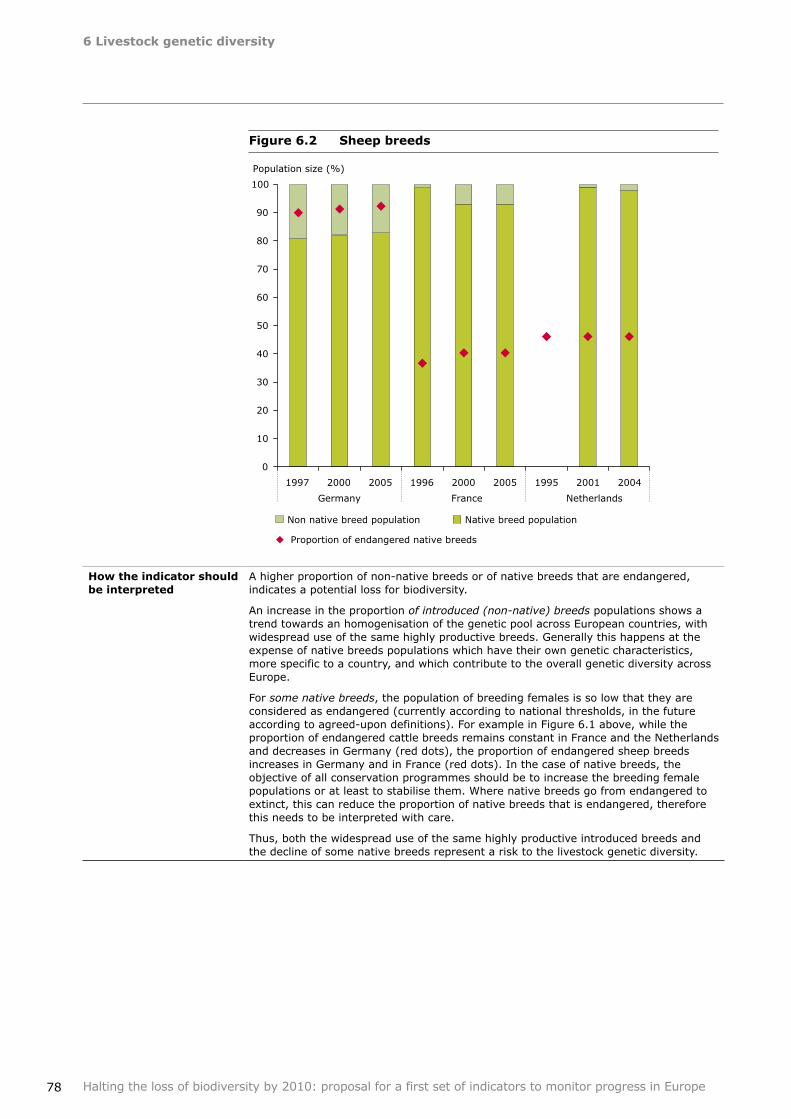
6Livestockgeneticdiversity
78 Halting the loss of biodiversity by 2010: proposal for a first set of indicators to monitor progress in Europe
Figure6.2 Sheepbreeds
Howtheindicatorshouldbeinterpreted
A higher proportion of non‑native breeds or of native breeds that are endangered, indicates a potential loss for biodiversity.
An increase in the proportion of introduced (non‑native) breeds populations shows a trend towards an homogenisation of the genetic pool across European countries, with widespread use of the same highly productive breeds. Generally this happens at the expense of native breeds populations which have their own genetic characteristics, more specific to a country, and which contribute to the overall genetic diversity across Europe.
For some native breeds, the population of breeding females is so low that they are considered as endangered (currently according to national thresholds, in the future according to agreed‑upon definitions). For example in Figure 6.1 above, while the proportion of endangered cattle breeds remains constant in France and the Netherlands and decreases in Germany (red dots), the proportion of endangered sheep breeds increases in Germany and in France (red dots). In the case of native breeds, the objective of all conservation programmes should be to increase the breeding female populations or at least to stabilise them. Where native breeds go from endangered to extinct, this can reduce the proportion of native breeds that is endangered, therefore this needs to be interpreted with care.
Thus, both the widespread use of the same highly productive introduced breeds and the decline of some native breeds represent a risk to the livestock genetic diversity.
0
10
20
30
40
50
60
70
80
90
100
Non native breed population
Proportion of endangered native breeds
Native breed population
Germany France Netherlands
1997 2000 2005 1996 2000 2005 1995 2001 2004
Population size (%)
6Livestockgeneticdiversity
79Halting the loss of biodiversity by 2010: proposal for a first set of indicators to monitor progress in Europe
MetadataSummarytechnicalinformationontheindicator
Title: Livestock genetic diversity.Status: proposal.Definition: the present indicator shows the share of breeding female population between introduced and native breeds species (namely, cattle and sheep) per country, as a proxy to assess the genetic diversity of these species. In addition, it shows the proportion of native breeds which is threatened due to low breeding female population.Geographical coverage: currently three countries but potentially 37 countries. Temporal coverage: : since 1995. Update frequency: 1995/1997, 2000, 2005…2010.Identified experts: Sreten Andonov (Faculty of Agriculture and Food Sciences, Macedonia), Frank Begeman (Federal Agency for Agriculture and Food, Information and Coordination Centre for Biological Diversity, Germany), Eléonore Charvollin (Bureau des Ressources Génétiques, France), Sipke Joost Hiemstra (Centre for Genetic Resources, the Netherlands), Dominique Planchenault (Bureau des Ressources Génétiques, France), Mike Roper (DEFRA, United Kingdom).
•••
••••
References
80
7Nationallydesignatedprotectedareas
Halting the loss of biodiversity by 2010: proposal for a first set of indicators to monitor progress in Europe
Focalarea Status and trends of the components of biological diversity
Europeanindicatorheadline
Coverage of protected areas
Keypolicyquestion How effective has the designation of protected areas been as a tool to protect biodiversity and as a response to biodiversity loss?
Definition of the indicator
The indicator illustrates the rate of growth in the number and total area of nationally protected areas over time. The indicator can be disaggregated by IUCN category, biogeographic region and country.
Indicatortype(DPSIR) Response
Context Establishment of protected areas is a direct response to concerns over biodiversity loss, so an indicator in protected area coverage is a valuable indication of commitment to conserving biodiversity and reducing loss at a range of levels.
Comprehensive data on officially designated protected areas are regularly compiled. The data include information on all nationally designated sites, ranging from national parks to forest reserves and from strict nature reserves to resource reserves. When reporting on protected areas, countries have been asked to cluster the different designation‑types according to three main categories: Category A: Designation types used with the intention to protect fauna, flora, habitats and landscapes (the latter as far as relevant for fauna, flora and for habitat protection). Category B: Statutes under sectoral, particularly forestry, legislative and administrative acts providing an adequate protection relevant for fauna, flora and habitat conservation. Category C: Private statute providing durable protection for fauna, flora or habitats.
It is important to note for this indicator, and for any other indicators based on the Common Database on Designated Areas (http://www.eionet.eu.int/Topic_Areas/Biological_Biodiversity/cdda2005), that information on national protection is based not on protected areas sensu stricto but on designated areas, and that a number of included sites may not meet internationally adopted definitions of protected areas (see IUCN 1994. Guidelines for Protected Area Management Categories at http://www.iucn.org/themes/wcpa/pubs/pdfs/pacategories.pdf and the CBD at http://www.biodiv.org/convention/articles.asp).
For forest protected areas, the final report of the COST E27 project contains quantitative comparisons of national data according the different definitions of forest protection categories (IUCN, MCPFE and EEA) (Frank et al. 2007).
Relationoftheindicatortothefocalarea
This indicator demonstrates the change over time in one form of protection afforded to components of biodiversity.
Data sources and methodologyDataavailability Data are available through the World Database on Protected Areas (WDPA) and the
Common Database on Designated Areas (CDDA).
7 Nationallydesignatedprotectedareas
7Nationallydesignatedprotectedareas
81Halting the loss of biodiversity by 2010: proposal for a first set of indicators to monitor progress in Europe
Methodology Information is collected from national authorities according to a shared agreement between EEA and UNEP‑WCMC. EEA is responsible for data collection from EEA member and collaborating countries (38), while UNEP‑WCMC is responsible for collection of data from other European countries (15). Methodology and process are defined in http://themes.eea.europa.eu/IMS/IMS/ISpecs/ISpecification20041007131611/full_spec.
Currently, the cumulative area of nationally designated areas over time in European countries for the period XXXX‑YYYY is calculated in km2 by adding the absolute surface areas reported by countries. This leads to double counting in cases where some protected areas are included in a bigger one (for example two small nature reserves in a big national park). In the future, the calculation of the surface area should be done using the following next steps:
Spatial data on sites with known designation year and boundaries processed in GIS systems using an equal area projection (not yet available for all sites).Data on sites with no boundary data available, but with location data (latitude/longitude), are recorded in the CDDA Proportional polygons (circles with the area equal to officially designated protected area size and centered at a known site location) are generated in an equal area projection using GIS. Sample formula applied (syntaxes may vary depending of the GIS applied):Circle.Make([X‑coord]@[Y‑coord], (([Area_km2] * 1000/(Number.GetPi))^0.5)).as polygon. Both sets of polygons (based on actual boundary data and proportional circles) are overlaid to produce a single coverage statistic.Sites area totals are to be estimated yearly with overlapping areas analysed in a manner to ensure that they are counted only once.
•
•
•
•
Evaluation of the indicatorMainadvantagesoftheindicator
There is international acceptance of the indicator at a global, regional and national scale. The indicator provides information and can be used at different scales.Information on sites that have been designated for conservation purposes is, in theory, readily available in every country. For 38 countries participating in the EEA work programme a reporting obligation on designated areas exists.
•
•
Maindisadvantagesoftheindicator
The indicator does not describe the quality of management or whether the areas are protected from incompatible uses. The indicator needs to be complemented by information on management effectiveness or funding, or other elements that would indicate the potential of the designated area in protecting biodiversity.The spatial data and designation date data sets are not complete. A logistical problem is that information is generally held by a range of different institutions, both governmental and non‑governmental and simultaneous delivery of information on year, size, boundary or at least approximate (latitude/longitude) location of protected areas requires constant efforts for information flow (currently maintained by the EEA through its ETC/BD).
•
•
Analysisofoptions Initially, eight possible indicators were proposed under the Headline Indicator:
Trends in national establishment of protected areas Trends in proposals for protected sites under the EU Habitats Directive Trends in nomination of wetlands of international importance (Ramsar sites) Coverage of Important Bird Areas by protected areas EU Habitats Directive: sufficiency of Member State proposals for protected sites Indicator on infra‑structural support for designated areas in Europe Status of species and habitats in protected sites under the EU Habitats Directive Indicator on private protected areas in Europe
Eventually, two indicators are being proposed (Nationally designated protected areas and Sites designated sites under the EU Habitats and Birds Directives (a combination of 2 and 5 above)). The other indicators proposed were either not ready (e.g. 6 and 8), not nationally recognised (e.g. 4) or are being covered under other headline indicators (e.g. 7).
1.2.3.4.5.6.7.8.
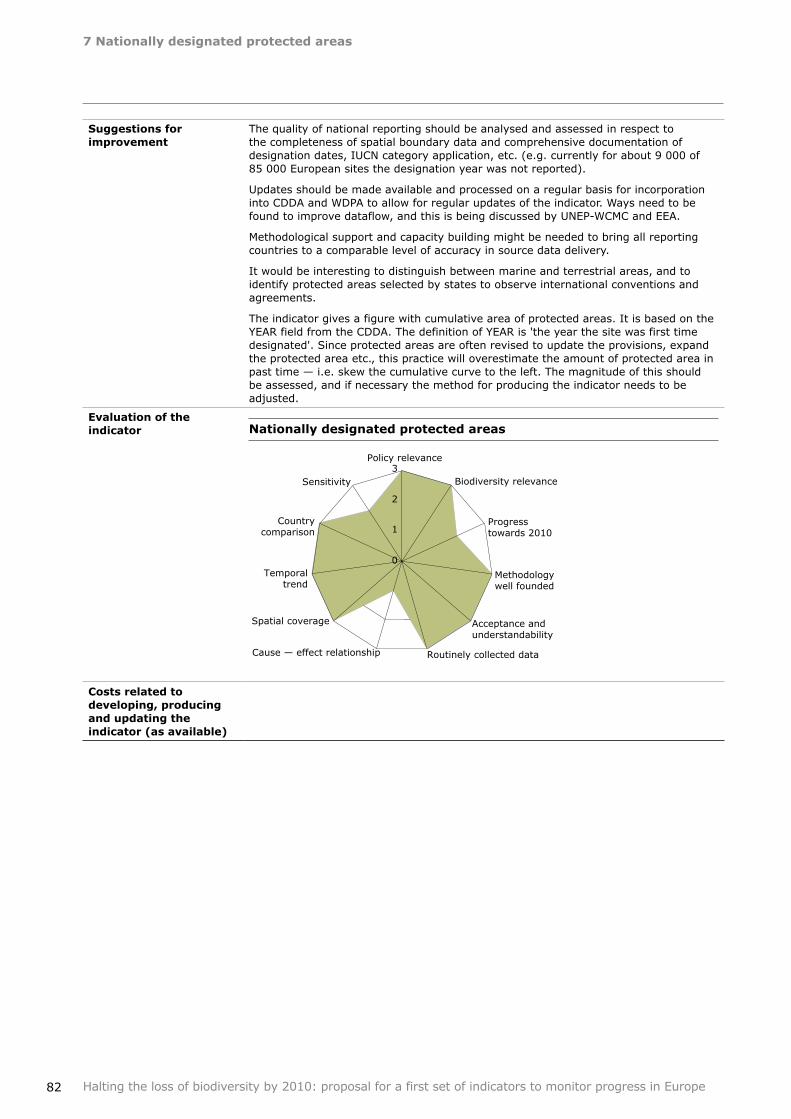
7Nationallydesignatedprotectedareas
82 Halting the loss of biodiversity by 2010: proposal for a first set of indicators to monitor progress in Europe
Suggestionsforimprovement
The quality of national reporting should be analysed and assessed in respect to the completeness of spatial boundary data and comprehensive documentation of designation dates, IUCN category application, etc. (e.g. currently for about 9 000 of 85 000 European sites the designation year was not reported).
Updates should be made available and processed on a regular basis for incorporation into CDDA and WDPA to allow for regular updates of the indicator. Ways need to be found to improve dataflow, and this is being discussed by UNEP‑WCMC and EEA.
Methodological support and capacity building might be needed to bring all reporting countries to a comparable level of accuracy in source data delivery.
It would be interesting to distinguish between marine and terrestrial areas, and to identify protected areas selected by states to observe international conventions and agreements.
The indicator gives a figure with cumulative area of protected areas. It is based on the YEAR field from the CDDA. The definition of YEAR is 'the year the site was first time designated'. Since protected areas are often revised to update the provisions, expand the protected area etc., this practice will overestimate the amount of protected area in past time — i.e. skew the cumulative curve to the left. The magnitude of this should be assessed, and if necessary the method for producing the indicator needs to be adjusted.
Evaluationoftheindicator Nationallydesignatedprotectedareas
Costsrelatedtodeveloping,producingandupdatingtheindicator(asavailable)
0
1
2
3 Policy relevance
Biodiversity relevance
Progress towards 2010
Methodology well founded
Acceptance and understandability
Routinely collected data Cause — effect relationship
Spatial coverage
Temporal trend
Country comparison
Sensitivity
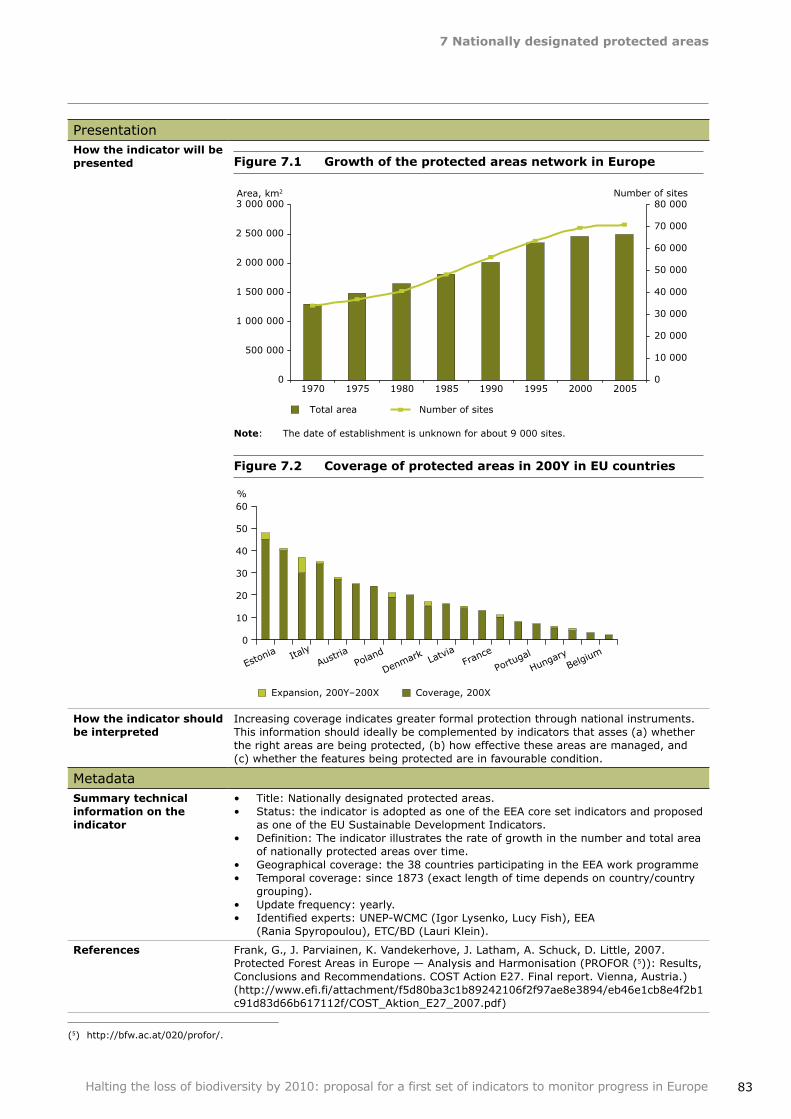
7Nationallydesignatedprotectedareas
83Halting the loss of biodiversity by 2010: proposal for a first set of indicators to monitor progress in Europe
PresentationHowtheindicatorwillbepresented Figure7.1 GrowthoftheprotectedareasnetworkinEurope
Note: The date of establishment is unknown for about 9 000 sites.
Figure7.2 Coverageofprotectedareasin200YinEUcountries
Howtheindicatorshouldbeinterpreted
Increasing coverage indicates greater formal protection through national instruments. This information should ideally be complemented by indicators that asses (a) whether the right areas are being protected, (b) how effective these areas are managed, and (c) whether the features being protected are in favourable condition.
MetadataSummarytechnicalinformationontheindicator
Title: Nationally designated protected areas.Status: the indicator is adopted as one of the EEA core set indicators and proposed as one of the EU Sustainable Development Indicators. Definition: The indicator illustrates the rate of growth in the number and total area of nationally protected areas over time. Geographical coverage: the 38 countries participating in the EEA work programmeTemporal coverage: since 1873 (exact length of time depends on country/country grouping).Update frequency: yearly.Identified experts: UNEP‑WCMC (Igor Lysenko, Lucy Fish), EEA (Rania Spyropoulou), ETC/BD (Lauri Klein).
••
•
••
••
References Frank, G., J. Parviainen, K. Vandekerhove, J. Latham, A. Schuck, D. Little, 2007. Protected Forest Areas in Europe — Analysis and Harmonisation (PROFOR (5)): Results, Conclusions and Recommendations. COST Action E27. Final report. Vienna, Austria.) (http://www.efi.fi/attachment/f5d80ba3c1b89242106f2f97ae8e3894/eb46e1cb8e4f2b1c91d83d66b617112f/COST_Aktion_E27_2007.pdf)
0
500 000
1 000 000
1 500 000
2 000 000
2 500 000
3 000 000Area, km2 Number of sites
1970 1975 1980 1985 1990 1995 2000 20050
10 000
20 000
30 000
40 000
50 000
60 000
70 000
80 000
Total area Number of sites
0
10
20
30
40
50
60
Expansion, 200Y–200X
Estonia Italy
Austria
Poland
Denmark LatviaFra
nce
Portugal
HungaryBelgium
Coverage, 200X
%
(5) http://bfw.ac.at/020/profor/.
84
8SitesdesignatedundertheEUHabitatsandBirdsDirective
Halting the loss of biodiversity by 2010: proposal for a first set of indicators to monitor progress in Europe
Focalarea Status and trends of the components of biological diversity
Europeanindicatorheadline
Coverage of protected areas
Keypolicyquestion Have countries proposed sufficient sites under the Habitats and Birds Directives?
Definition of the indicator
The indicator shows the current status of implementation of the Habitats (92/43/EEC) and Birds Directives (79/409/EEC) by EU Member States. It does this by showing (a) trends in spatial coverage of proposals of sites and (b) by calculating a sufficiency index based on those proposals.
Indicatortype(DPSIR) Response
Context Establishment of sites designated under the Habitats and Birds Directives is a direct response to concerns over biodiversity loss, so an indicator on increase in coverage is a valuable indication of commitment to conserving biodiversity and reducing its loss.
It is however essential that indicators of coverage are also combined with indicators demonstrating the extent to which these protected areas adequately cover components of biodiversity.
The EC Habitats Directive and Birds Directive aim to conserve natural habitats and wild fauna and flora within the European Union. Member States must propose sites for protection of the habitats and species listed in the Annexes to the Directive. The first sub‑indicator 'Trends in spatial coverage of proposals for sites designated under the EU Habitats and Birds Directives' presents the change in area coverage of sites proposed by Member States in km2.
The objective of the second sub‑indicator 'sufficiency index' is to show how close Member States are to the target of having proposed sufficient sites. Member States with a 100 percent sufficiency have proposed sufficient sites according to the European Commission for all Annex I terrestrial habitat types and Annex II terrestrial species of Community interest occurring in their territory as assessed according to the specifications of the relevant Directive.
Relationoftheindicatortothefocalarea
EU action relevant to protected areas network expansion began under the 1979 Birds Directive and was followed by the 1992 Habitats Directive. The 1998 EU biodiversity strategy was designed in accordance with the Convention on Biodiversity (CBD) and the commitments taken under the CBD have been carried forward into the EU Sixth Environment Action Programme, maintaining the aim of a gradual and constant strengthening of in situ conservation in Europe.
Member States have been given six years following the adoption of the list of sites of community importance (SCIs) to develop and enforce the measures necessary to protect and manage identified sites and in doing so designate them as special areas for conservation or protected areas.
Data sources and methodologyDataavailability Trends in proposals for sites designated under the EU Habitats and Birds
Directives: Natura 2000 Database, data submitted by the Member States. Sufficiency Index: Conclusions of the Natura 2000 biogeographic seminars (index at this stage only done for Habitats Directive).
•
•
8 SitesdesignatedundertheEUHabitatsandBirdsDirectives
8SitesdesignatedundertheEUHabitatsandBirdsDirective
85Halting the loss of biodiversity by 2010: proposal for a first set of indicators to monitor progress in Europe
Methodology TrendsinproposalsforsitesdesignatedundertheEUHabitatsandBirdsDirectives
Sum of area in km2 of each site registered in the annual versions of Natura 2000 database and grouped per year ofproposal/designation.
Information is collected from national authorities by DG Environment and processed by the EEA‑ETC/BD (European Topic Centre on Biological Diversity). Further improvements on dataflows are under discussion.
Sufficiency Index
For each biogeographical region, seminars are organised by the European Commission and the EEA European Topic Centre on Biological Diversity, gathering Member State representatives of the region and scientific experts. The goal of the seminars is to assess if each habitat and each species of Annexes I and II occurring in the region is sufficiently represented in the sites proposed as being of Community interest on the national list presented by a Member State (pSCIs). The conclusions of the biogeographical seminars provide data for development of this indicator. The submission of proposals for protected sites is a continuous process until all countries reach sufficiency.
The indicator calculates the sum, by biogeographical region and per country, of the proportion of Annex I habitats and Annex II species that are sufficiently represented in the pSCIs in relation to the number of species and habitats on the Commission's Reference lists of habitat types and species for each biogeographic region. The sufficiency of a Member State is weighted by the proportion of the biogeographical region's area within the Member State. The weighting compensates for the relatively higher burden of a large biogeographical area in the country. This is because it is more demanding to propose sufficient sites for a large biogeographical area than for a smaller biogeographical area in the same country.
Sufficiency is then calculated as follows for each Member State:
SUFFMS = SUM(i=1 to i=n) ((habi/ HABi + spi/SPi)/2)(Area(Bi)/Area(MS))
SUFFMS : Sufficiency index for a Member State by summing up SUFF for each biogeographic region. n = number of biogeographical regions within a Member State habi = number of Annex I habitats sufficiently represented for the biogeographical region i HABi = Number of Annex I habitats listed in the Commission's Reference List spi = number of Annex II species sufficiently represented for the biogeographical region i SPi = Number of Annex II species listed in the Commission's Reference List Area(Bi) = Surface area of biogeographical region i within a Member State (km2).
Evaluation of the indicatorMainadvantagesoftheindicator
Policy relevance: the indicator is directly indicating the implementation of the Habitats and Birds Directives. Therefore it is highly relevant for Member States and EU nature conservation policy.Established mechanism and methodology: within EU Member States there are already processes in place for compilation of information on Natura 2000 sites at both national and regional levels. The indicator is clear and shows growth in total area and sufficiency of designation per country over time.
•
•
Maindisadvantagesoftheindicator
Only covers EU Member States.The process for the Sufficiency Index is not fully automated at present i.e. national agencies cannot provide data through an automated procedure. Instead, the process depends on the outcomes of the biogeographic seminars mentioned earlier.
••
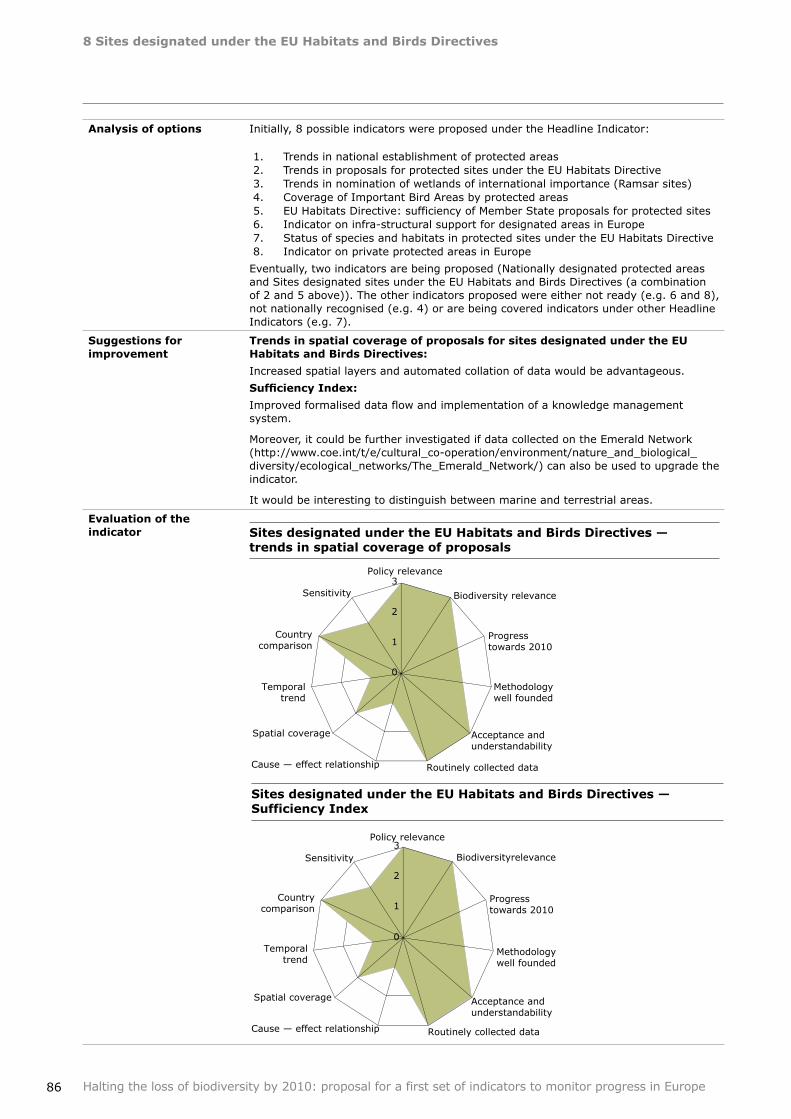
8SitesdesignatedundertheEUHabitatsandBirdsDirectives
86 Halting the loss of biodiversity by 2010: proposal for a first set of indicators to monitor progress in Europe
Analysisofoptions Initially, 8 possible indicators were proposed under the Headline Indicator:
Trends in national establishment of protected areas Trends in proposals for protected sites under the EU Habitats Directive Trends in nomination of wetlands of international importance (Ramsar sites) Coverage of Important Bird Areas by protected areas EU Habitats Directive: sufficiency of Member State proposals for protected sites Indicator on infra‑structural support for designated areas in Europe Status of species and habitats in protected sites under the EU Habitats Directive Indicator on private protected areas in Europe
Eventually, two indicators are being proposed (Nationally designated protected areas and Sites designated sites under the EU Habitats and Birds Directives (a combination of 2 and 5 above)). The other indicators proposed were either not ready (e.g. 6 and 8), not nationally recognised (e.g. 4) or are being covered indicators under other Headline Indicators (e.g. 7).
1.2.3.4.5.6.7.8.
Suggestionsforimprovement
TrendsinspatialcoverageofproposalsforsitesdesignatedundertheEUHabitatsandBirdsDirectives:
Increased spatial layers and automated collation of data would be advantageous.
Sufficiency Index:
Improved formalised data flow and implementation of a knowledge management system.
Moreover, it could be further investigated if data collected on the Emerald Network (http://www.coe.int/t/e/cultural_co‑operation/environment/nature_and_biological_diversity/ecological_networks/The_Emerald_Network/) can also be used to upgrade the indicator.
It would be interesting to distinguish between marine and terrestrial areas.
Evaluationoftheindicator SitesdesignatedundertheEUHabitatsandBirdsDirectives—
trendsinspatialcoverageofproposals
0
1
2
3 Policy relevance
Biodiversity relevance
Progress towards 2010
Methodology well founded
Acceptance and understandability
Routinely collected data Cause — effect relationship
Spatial coverage
Temporal trend
Country comparison
Sensitivity
0
1
2
3 Policy relevance
Biodiversityrelevance
Progress towards 2010
Methodologywell founded
Acceptance and understandability
Routinely collected data Cause — effect relationship
Spatial coverage
Temporal trend
Country comparison
Sensitivity
SitesdesignatedundertheEUHabitatsandBirdsDirectives—SufficiencyIndex
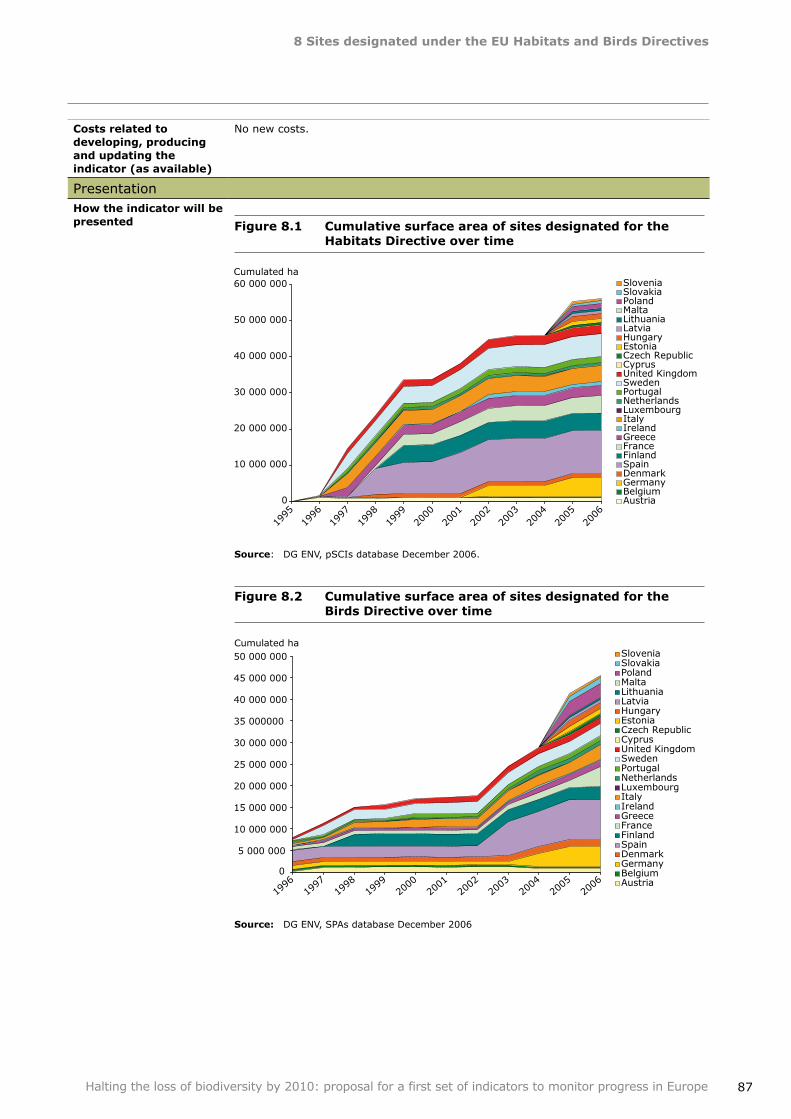
8SitesdesignatedundertheEUHabitatsandBirdsDirectives
87Halting the loss of biodiversity by 2010: proposal for a first set of indicators to monitor progress in Europe
Costsrelatedtodeveloping,producingandupdatingtheindicator(asavailable)
No new costs.
PresentationHowtheindicatorwillbepresented Figure8.1 Cumulativesurfaceareaofsitesdesignatedforthe
HabitatsDirectiveovertime
Source: DG ENV, pSCIs database December 2006.
Figure8.2 CumulativesurfaceareaofsitesdesignatedfortheBirdsDirectiveovertime
Source: DG ENV, SPAs database December 2006
0
10 000 000
20 000 000
30 000 000
40 000 000
50 000 000
60 000 000
1995
1996
1997
1998
1999
2000
2001
2002
2003
2004
2005
2006
Cumulated haSloveniaSlovakiaPolandMaltaLithuaniaLatviaHungaryEstoniaCzech RepublicCyprusUnited KingdomSwedenPortugalNetherlandsLuxembourgItalyIrelandGreeceFranceFinlandSpainDenmarkGermanyBelgiumAustria
0
5 000 000
10 000 000
15 000 000
20 000 000
25 000 000
30 000 000
35 000000
40 000 000
45 000 000
50 000 000
1996
1997
1998
1999
2000
2001
2002
2003
2004
2005
2006
Cumulated haSloveniaSlovakiaPolandMaltaLithuaniaLatviaHungaryEstoniaCzech RepublicCyprusUnited KingdomSwedenPortugalNetherlandsLuxembourgItalyIrelandGreeceFranceFinlandSpainDenmarkGermanyBelgiumAustria
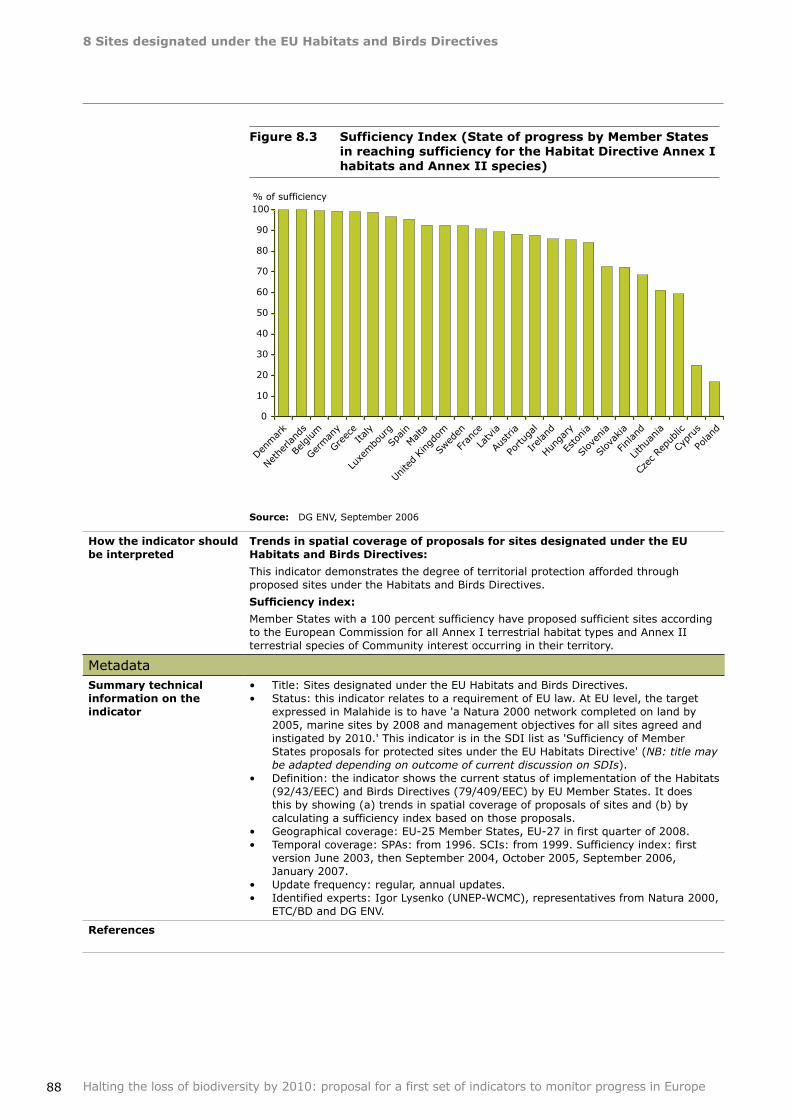
8SitesdesignatedundertheEUHabitatsandBirdsDirectives
88 Halting the loss of biodiversity by 2010: proposal for a first set of indicators to monitor progress in Europe
Figure8.3 SufficiencyIndex(StateofprogressbyMemberStatesinreachingsufficiencyfortheHabitatDirectiveAnnexIhabitatsandAnnexIIspecies)
Source: DG ENV, September 2006
Howtheindicatorshouldbeinterpreted
TrendsinspatialcoverageofproposalsforsitesdesignatedundertheEUHabitatsandBirdsDirectives:
This indicator demonstrates the degree of territorial protection afforded through proposed sites under the Habitats and Birds Directives.
Sufficiency index:
Member States with a 100 percent sufficiency have proposed sufficient sites according to the European Commission for all Annex I terrestrial habitat types and Annex II terrestrial species of Community interest occurring in their territory.
MetadataSummarytechnicalinformationontheindicator
Title: Sites designated under the EU Habitats and Birds Directives.Status: this indicator relates to a requirement of EU law. At EU level, the target expressed in Malahide is to have 'a Natura 2000 network completed on land by 2005, marine sites by 2008 and management objectives for all sites agreed and instigated by 2010.' This indicator is in the SDI list as 'Sufficiency of Member States proposals for protected sites under the EU Habitats Directive' (NB: title may be adapted depending on outcome of current discussion on SDIs).Definition: the indicator shows the current status of implementation of the Habitats (92/43/EEC) and Birds Directives (79/409/EEC) by EU Member States. It does this by showing (a) trends in spatial coverage of proposals of sites and (b) by calculating a sufficiency index based on those proposals.Geographical coverage: EU‑25 Member States, EU‑27 in first quarter of 2008. Temporal coverage: SPAs: from 1996. SCIs: from 1999. Sufficiency index: first version June 2003, then September 2004, October 2005, September 2006, January 2007.Update frequency: regular, annual updates.Identified experts: Igor Lysenko (UNEP‑WCMC), representatives from Natura 2000, ETC/BD and DG ENV.
••
•
••
••
References
0
10
20
30
40
50
60
70
80
90
100
Denmar
k
Neth
erland
s
Belgium
German
y
Greec
eIta
ly
Luxe
mbo
urg
SpainMal
ta
Unite
d King
dom
Swed
en
Fran
ce
Latvia
Austria
Portu
gal
Ireland
Hunga
ry
Esto
nia
Slov
enia
Slov
akia
Finland
Lithu
ania
Czec
Rep
ublic
Cypr
us
Poland
% of sufficiency
89
9Criticalloadexceedancefornitrogen
Halting the loss of biodiversity by 2010: proposal for a first set of indicators to monitor progress in Europe
Focalarea Threats to Biodiversity
Europeanindicatorheadline
Nitrogen Deposition
Keypolicyquestion Where in Europe do levels on nitrogen deposition occur that threaten biodiversity? How important is nitrogen pollution as a source of biodiversity loss?
Definition of the indicator
Exceedance of critical loads for nitrogen deposition indicating risks for biodiversity loss in (semi)‑natural ecosystems.
Indicatortype(DPSIR) Pressure
Context The availability of nutrients is one of the most important abiotic factors that determine plant species composition in ecosystems. Nitrogen is the limiting nutrient for plant growth in many natural and semi‑natural ecosystems. Most of the plant species from oligotrophic and mesotrophic habitats are adapted to nutrient‑poor conditions, and can only survive or compete successfully on soils with low nitrogen availability. High nitrogen deposition causes changes in vegetation composition and vegetation structure. These changes in turn affect the fauna composition (UNECE, 2003).
High variations in sensitivity to atmospheric nitrogen deposition have been observed between and within different natural and semi‑natural ecosystems. Critical loads are used to describe this sensitivity. A critical load is defined as 'a quantitative estimate of an exposure to one or more pollutants below which significant harmful effects on specified sensitive elements of the environment do not occur according to present knowledge' (Nilsson and Grennfelt, 1988). Exceedances of critical loads by current or future nitrogen loads indicate risks for adverse effects on biodiversity.
Because of short‑ and long‑range atmospheric transport, nitrogen (N) deposition has increased in many natural and semi‑natural ecosystems across the world. The emissions of ammonia (NH3) and nitrogen oxides (NOX) strongly increased in Europe in the second half of the 20th century. Ammonia is volatilised from intensive agricultural systems, whereas nitrogen oxides originate mainly from burning of fossil fuel by traffic and industry (UNEP, 2005).
Significant geographical variability occurs in emissions and deposition of nitrogen compounds across Europe. Historically emission control strategies have focussed on reducing the emission of oxides of nitrogen. However across Europe it is now clear that nitrogen deposition is dominated by agricultural releases, predominantly ammonia. Therefore, while past effort has focussed predominately on reducing the oxides of nitrogen, future effort must also take into account reduced forms of nitrogen.
Relationoftheindicatortothefocalarea
Excess nitrogen is one of the major threats to biodiversity. Excessive levels of reactive forms of nitrogen in the biosphere and atmosphere constitute a major threat to biodiversity in terrestrial, aquatic and coastal ecosystems. On land it causes loss of sensitive species and hence biodiversity by favouring a few nitrogen tolerant species over less tolerant ones. In coastal waters it leads to algal blooms and deoxygenated dead zones in which only a few bacteria may survive.
9 Criticalloadexceedancefornitrogen
9Criticalloadexceedancefornitrogen
90 Halting the loss of biodiversity by 2010: proposal for a first set of indicators to monitor progress in Europe
Data sources and methodologyDataavailability The indicator is calculated from deposition data and critical loads.
Deposition maps on a European scale (including EU‑27) are available from the Cooperative Programme for Monitoring and Evaluation of the long‑range transmission of air pollutants in Europe (EMEP) (www.emep.int). Historical data and scenarios are available from EMEP and through the relevant EU programmes.
National critical load maps can be obtained from National Focal Centres (NFCs) and the International Cooperative Programme on the Modelling and Mapping of Critical Levels and Loads and Air Pollution Effects, Risks and Trends (ICP MandM). European critical loads maps including EU Member States and UNECE Parties are available from the Coordination Centre of Effects (CCE; www.mnp.nl/cce) that is the Programme Centre of the ICP MandM. Knowledge on critical loads for protection of biodiversity is also available in this network under the Convention on Long‑range Transboundary Air Pollution (LRTAP Convention).
Methodology Deposition loads are modelled as part of EMEP; on a European scale, the EMEP Unified Model is used (see http://www.emep.int/index_model.html). Monitoring of nitrogen deposition is used to calibrate the models.
European critical loads are assessed using scientifically reviewed methods and data. There are various endpoints (protection aims) for setting critical loads. The ICP MandM and CCE have developed methods to derive critical loads for protecting (semi)‑natural ecosystems (www.mnp.nl/cce):
Critical loads based on empirical data; Critical loads based on dynamic ecosystem models; Critical loads based on steady state modelling.
Methods 1 and 2 are particularly relevant for setting critical loads for protecting biodiversity.
Below are described the methodologies helping to produce the different maps/graphs relevant for this indicator.
(1) Europeanmapsofpercentagenaturalareawithcriticalloadexceedances• Combine recent European deposition map (EMEP) with recent European
critical load map (CCE).• Sum in each 50 x 50 km EMEP‑grid the total natural area where the
deposition (in mol/ha/yr) exceeds the critical loads (in mol/ha/yr) and divide this by the total natural area. Use the ecosystem specific deposition rates.
• Plot the percentage area with exceeded critical loads within each EMEP‑grid.
(2) EuropeanmapsofthepercentagenaturalareaprotectedundertheEUHabitatdirectivewithcriticalloadexceedances
See steps described above
(3) Europeanmapsoftheheightoftheexceedanceinnaturalareasorprotectedareas
• Combine recent European deposition map (EMEP) with recent European critical load map (CCE).
• Sum in each 50 x 50 km EMEP‑grid the deposition which exceeds the critical load. Use the ecosystem specific deposition rates.
• Plot the calculated sum of excess of deposition within each EMEP‑grid.
(4)Graphsofchangesinpercentagenaturalareawithcriticalloadexceedancesorheightoftheexceedances
Combine a number of recent European deposition maps with the recent European critical load map (CCE).Sum per year, in all European EMEP‑grids the total natural area where the deposition (in mol/ha/yr) exceeds the critical loads (in mol/ha/yr) and divide this by the total natural area in Europe. Use the ecosystem specific deposition rates. Similar calculations can be made for individual countries.Plot the calculated percentage per year in a graph.Similar calculations can be made for the excess of deposition.
1.2.3.
•
•
••
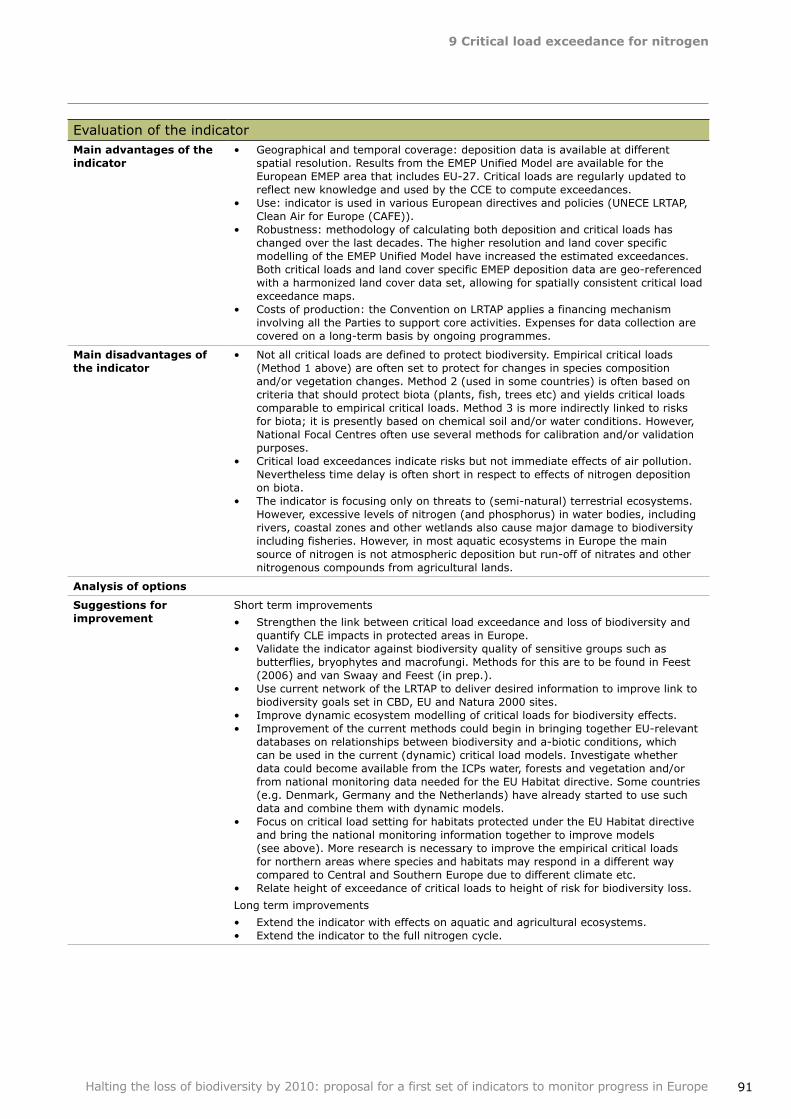
9Criticalloadexceedancefornitrogen
91Halting the loss of biodiversity by 2010: proposal for a first set of indicators to monitor progress in Europe
Evaluation of the indicatorMainadvantagesoftheindicator
Geographical and temporal coverage: deposition data is available at different spatial resolution. Results from the EMEP Unified Model are available for the European EMEP area that includes EU‑27. Critical loads are regularly updated to reflect new knowledge and used by the CCE to compute exceedances.Use: indicator is used in various European directives and policies (UNECE LRTAP, Clean Air for Europe (CAFE)). Robustness: methodology of calculating both deposition and critical loads has changed over the last decades. The higher resolution and land cover specific modelling of the EMEP Unified Model have increased the estimated exceedances. Both critical loads and land cover specific EMEP deposition data are geo‑referenced with a harmonized land cover data set, allowing for spatially consistent critical load exceedance maps.Costs of production: the Convention on LRTAP applies a financing mechanism involving all the Parties to support core activities. Expenses for data collection are covered on a long‑term basis by ongoing programmes.
•
•
•
•
Maindisadvantagesoftheindicator
Not all critical loads are defined to protect biodiversity. Empirical critical loads (Method 1 above) are often set to protect for changes in species composition and/or vegetation changes. Method 2 (used in some countries) is often based on criteria that should protect biota (plants, fish, trees etc) and yields critical loads comparable to empirical critical loads. Method 3 is more indirectly linked to risks for biota; it is presently based on chemical soil and/or water conditions. However, National Focal Centres often use several methods for calibration and/or validation purposes.Critical load exceedances indicate risks but not immediate effects of air pollution. Nevertheless time delay is often short in respect to effects of nitrogen deposition on biota.The indicator is focusing only on threats to (semi‑natural) terrestrial ecosystems. However, excessive levels of nitrogen (and phosphorus) in water bodies, including rivers, coastal zones and other wetlands also cause major damage to biodiversity including fisheries. However, in most aquatic ecosystems in Europe the main source of nitrogen is not atmospheric deposition but run‑off of nitrates and other nitrogenous compounds from agricultural lands.
•
•
•
Analysisofoptions
Suggestionsforimprovement
Short term improvements
Strengthen the link between critical load exceedance and loss of biodiversity and quantify CLE impacts in protected areas in Europe.Validate the indicator against biodiversity quality of sensitive groups such as butterflies, bryophytes and macrofungi. Methods for this are to be found in Feest (2006) and van Swaay and Feest (in prep.). Use current network of the LRTAP to deliver desired information to improve link to biodiversity goals set in CBD, EU and Natura 2000 sites.Improve dynamic ecosystem modelling of critical loads for biodiversity effects. Improvement of the current methods could begin in bringing together EU‑relevant databases on relationships between biodiversity and a‑biotic conditions, which can be used in the current (dynamic) critical load models. Investigate whether data could become available from the ICPs water, forests and vegetation and/or from national monitoring data needed for the EU Habitat directive. Some countries (e.g. Denmark, Germany and the Netherlands) have already started to use such data and combine them with dynamic models.Focus on critical load setting for habitats protected under the EU Habitat directive and bring the national monitoring information together to improve models (see above). More research is necessary to improve the empirical critical loads for northern areas where species and habitats may respond in a different way compared to Central and Southern Europe due to different climate etc.Relate height of exceedance of critical loads to height of risk for biodiversity loss.
Long term improvements
Extend the indicator with effects on aquatic and agricultural ecosystems.Extend the indicator to the full nitrogen cycle.
•
•
•
••
•
•
••
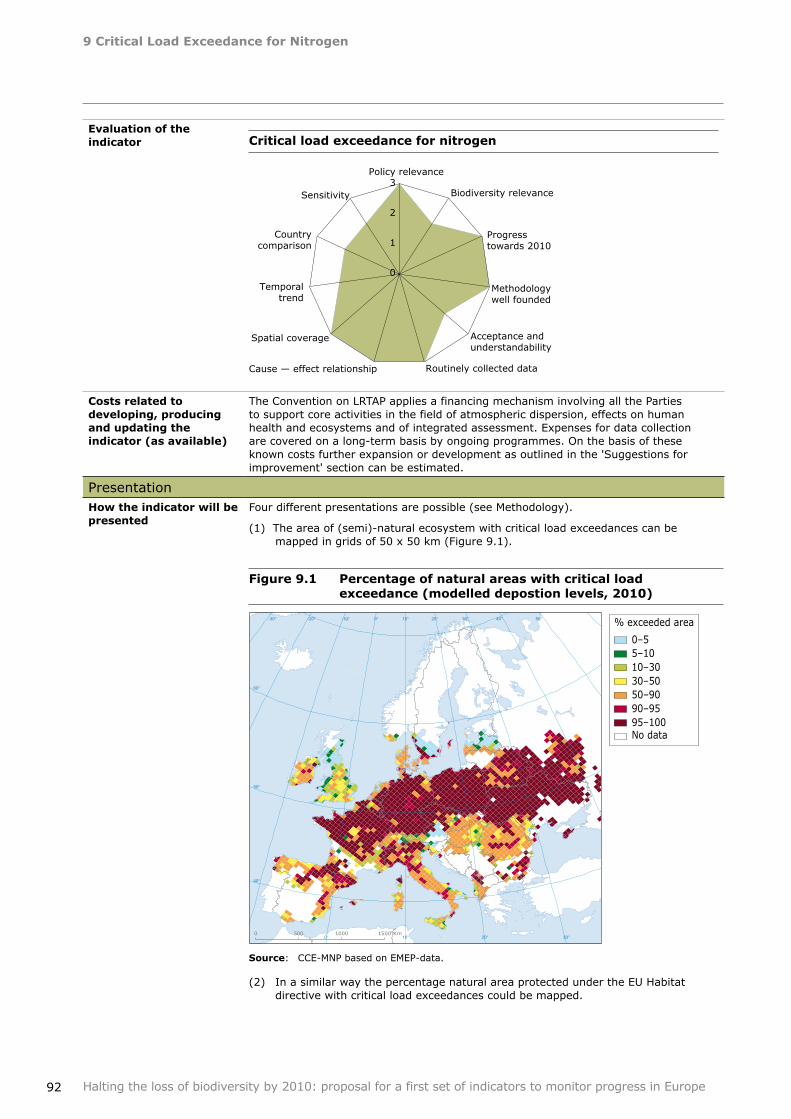
9CriticalLoadExceedanceforNitrogen
92 Halting the loss of biodiversity by 2010: proposal for a first set of indicators to monitor progress in Europe
Evaluationoftheindicator Criticalloadexceedancefornitrogen
0
1
2
3 Policy relevance
Biodiversity relevance
Progress towards 2010
Methodology well founded
Acceptance and understandability
Routinely collected data Cause — effect relationship
Spatial coverage
Temporal trend
Country comparison
Sensitivity
Costsrelatedtodeveloping,producingandupdatingtheindicator(asavailable)
The Convention on LRTAP applies a financing mechanism involving all the Parties to support core activities in the field of atmospheric dispersion, effects on human health and ecosystems and of integrated assessment. Expenses for data collection are covered on a long‑term basis by ongoing programmes. On the basis of these known costs further expansion or development as outlined in the 'Suggestions for improvement' section can be estimated.
PresentationHowtheindicatorwillbepresented
Four different presentations are possible (see Methodology).
(1) The area of (semi)‑natural ecosystem with critical load exceedances can be mapped in grids of 50 x 50 km (Figure 9.1).
60°
60°
50°
40°
50°40°
30°
30°
20°
20°
10°
10°
0°
0°-10°-20°-30°
60°
50°
40°
0 500 1000 1500 Km
0–5 5–1010–30 30–50 50–9090–9595–100No data
% exceeded area
Figure9.1 Percentageofnaturalareaswithcriticalloadexceedance(modelleddepostionlevels,2010)
Source: CCE‑MNP based on EMEP‑data.
(2) In a similar way the percentage natural area protected under the EU Habitat directive with critical load exceedances could be mapped.
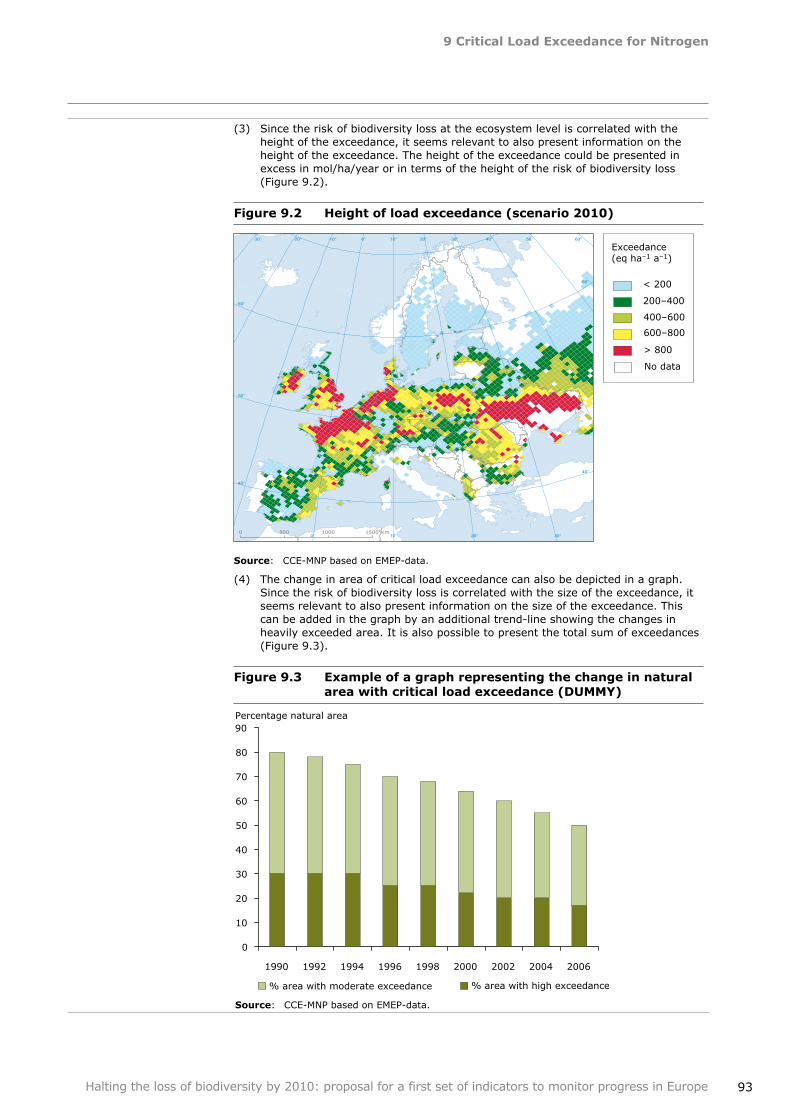
9CriticalLoadExceedanceforNitrogen
93Halting the loss of biodiversity by 2010: proposal for a first set of indicators to monitor progress in Europe
(3) Since the risk of biodiversity loss at the ecosystem level is correlated with the height of the exceedance, it seems relevant to also present information on the height of the exceedance. The height of the exceedance could be presented in excess in mol/ha/year or in terms of the height of the risk of biodiversity loss (Figure 9.2).
Figure9.2 Heightofloadexceedance(scenario2010)
Source: CCE‑MNP based on EMEP‑data.
(4) The change in area of critical load exceedance can also be depicted in a graph. Since the risk of biodiversity loss is correlated with the size of the exceedance, it seems relevant to also present information on the size of the exceedance. This can be added in the graph by an additional trend‑line showing the changes in heavily exceeded area. It is also possible to present the total sum of exceedances (Figure 9.3).
Figure9.3 Exampleofagraphrepresentingthechangeinnaturalareawithcriticalloadexceedance(DUMMY)
60°50°40°
30°
30°
20°
20°
10°
10°
0°
0°-10°-20°-30°
60°
60°
50°
50°
40°
40°
0 500 1000 1500 Km
< 200
200–400
400–600
600–800
> 800
No data
Exceedance(eq ha–1 a–1)
Percentage natural area
0
10
20
30
40
50
60
70
80
90
1990 1992 1994 1996 1998 2000 2002 2004 2006
% area with moderate exceedance % area with high exceedance
Source: CCE‑MNP based on EMEP‑data.
9CriticalLoadExceedanceforNitrogen
94 Halting the loss of biodiversity by 2010: proposal for a first set of indicators to monitor progress in Europe
Howtheindicatorshouldbeinterpreted
Increasing exceedances indicate risk of adverse effects and therefore of biodiversity loss. Reduction of exceedances indicates reduced risk, therefore possibly a halt of biodiversity loss. Status quo means a continuous pressure at current level.
In accordance with the principles of the critical load concept the magnitude of the exceedance is positively correlated with negative effects on biodiversity.
MetadataSummarytechnicalinformationontheindicator
Title: Critical Load Exceedance for Nitrogen.Status: in the SDI list, under development.Definition: exceedance of critical loads for nitrogen deposition indicating risks for biodiversity loss in (semi)‑natural ecosystems.Geographical coverage: tesults from the EMEP Unified Model (50x50km) are available for the European EMEP area that includes EU‑25.Temporal coverage: since 1980. vritical loads are regularly updated to reflect new knowledge and used by the CCE to compute exceedances. Update frequency: annually (depositions and exceedances are modelled for the EMEP‑region in annual time steps (data is available after 2 years).Identified experts: Network of LRTAP. Contact: CCE, Prof. Dr Jean‑Paul Hettelingh, [email protected].
•••
•
•
•
•
References Feest, A. (2006) Establishing baseline indices for the environmental quality of the biodiversity of restored habitats using a standardised sampling process. Restoration Ecology, 14:112–122.
Nilsson, J. and Grennfelt, P. (1988) Critical loads for sulphur and nitrogen. Report from a workshop held at Skokloster, Sweden, 19–24 March 1988.
UN/ECE, 2003. Empirical Critical Loads for Nitrogen. Expert workshop 2002.
UNEP, 2005. Indicators for assessing progress towards the 2010 target: Nitrogen deposition. UNEP/CBD/SBSTTA/10/INF/16.
95
10InvasivealienspeciesinEurope
Halting the loss of biodiversity by 2010: proposal for a first set of indicators to monitor progress in Europe
Focalarea Threats to biodiversity
Europeanindicatorheadline
Trends in invasive alien species
Keypolicyquestion Are the main pathways for invasive alien species establishing in Europe successfully controlled?
Are management actions for invasive alien species prioritizing the species that create the largest negative impact on biodiversity?
Definition of the indicator
The indicator 'Invasive alien species in Europe' comprises two elements: 'Cumulative number of alien species in Europe since 1900', which shows trends in species that can potentially become invasive alien species, and 'Worst invasive alien species threatening biodiversity in Europe', a list of invasive species with demonstrated negative impacts.
1. 'Cumulative number of alien species in Europe since 1900'
The cumulative number of alien species established in Europe from 1900 onwards is estimated in 10‑year intervals. Pre‑1900 introductions are also estimated. Information is broken down by major ecosystems (terrestrial, freshwater and marine) and selected 'taxonomic' groups: vertebrates, invertebrates, primary producers (vascular plants, bryophytes and algae) and fungi.
2. 'Worst invasive alien species threatening biodiversity in Europe'
The list of worst invasive alien species threatening biodiversity in Europe distinguishes a number of the most harmful invasive alien species in Europe, across ecosystems and major taxonomic groups, with respect to their impacts upon European biodiversity and changing abundance or range. The list of worst invasive alien species threatening biodiversity in Europe covers the pan‑European area. Two criteria were used to select species for the list:
The species is recognized by experts (6) to have a serious adverse impact on biological diversity of Europe.
The species, in addition to its adverse impact on biodiversity, may have negative consequences for human activities, health and/or economic interests.
A.
B.
Indicatortype(DPSIR) Pressure
Context The Convention on Biological Diversity defines (7) an alien species to be 'a species, subspecies or lower taxon, introduced outside its natural past or present distribution; includes any part, gametes, seeds, eggs, or propagules of such species that might survive and subsequently reproduce' while an invasive alien species is 'an alien species whose introduction and/or spread threaten biological diversity'.
The potential threat that alien species pose to biological diversity can be illustrated in the cumulative number of alien species. Although not all alien species become invasive, the number of alien species introduced to an environment has a direct correlation with the number of species which may become invasive at a later date.
(6) Note: this recognition is based on expert view rather than quantifiable data and is therefore subject to debate. The reason for this is lack of quantitative data that lends itself to analysis and comparison among species.
(7) See http://www.biodiv.org/invasive/terms.shtml (Accessed March 2007).
10 InvasivealienspeciesinEurope
10InvasivealienspeciesinEurope
96 Halting the loss of biodiversity by 2010: proposal for a first set of indicators to monitor progress in Europe
Invasive alien species may affect and reduce native biodiversity in various ways, such as through competition for food and space, predation, disease transfer, and changing habitat structure and functions. Many invasive alien species are weeds and animal pests in agriculture/aquaculture and forestry. Invasive alien micro‑organisms may create severe problems to human health and to production crops. Intentionally introduced alien species for production in agriculture, forestry and fisheries/aquaculture, horticulture or for biological control, can also become invasive, causing negative impact on native biodiversity. There is a growing concern that with climate change and further deterioration in the environment, invasive alien species may benefit and increasingly compete with native species to the latter's disadvantage.
Increase in trade and tourism and transport on land and in particular at sea, as well as developments in agriculture, plantation forestry, aquaculture, fisheries, game management and the pet trade, have provided new and enhanced pathways for the spread of invasive alien species. Although European states have a comprehensive regulatory framework to protect economic interests against diseases and pests, these are often inadequate to safeguard against species that threaten native biodiversity.
Although, over time, thousands of alien species have been introduced to Europe, most are considered more or less harmless (8) and only a relatively few genuinely problematic. There is no precise limit to draw the line between 'invasive' and 'non‑invasive' alien species. Hence, it is presently impossible to compile a complete inventory of invasive alien species in Europe. The genuinely problematic ones are more easily identifiable and there are several reasons to consider those worst invasive alien species to prioritize actions and to be able to communicate the issue to a wider public
(9).
Relationoftheindicatortothefocalarea
Invasive Alien Species have been recognised as one of the major threats to biodiversity. The indicator 'Invasive alien species in Europe' covers significant aspects of the CBD/EU indicator 'Trends in invasive alien species (Numbers and costs of invasive alien species)'.
Data sources and methodologyDataavailability As regards the indicator element 'Cumulative number of alien species in
Europe since 1900' the data of the eleven Nordic and Baltic countries is delivered by the 'North European and Baltic Countries Network on Invasive Alien Species (NOBANIS) supported by the Nordic Council of Ministers, see http://www.nobanis.org. The data on marine and estuarine species is delivered by ETC/WTR and the Hellenic Centre of Marine Research (HCMR). The marine data have been verified in a dedicated SEBI 2010 workshop supported by the EEA (carried out in Athens, June 2006 (10)) and are updated until December 2006. They cover all European countries with sea borders plus North African and Middle Eastern countries surrounding the Mediterranean Sea. In 2007, data are planned to be added to comprise more countries, cf. below 'Suggestions for further improvement'. Currently there is no single data set available but in 2007 a discussion towards creating an operational database to serve the Eionet/EEA data service should be initiated.There is presently no single objective data base available of 'Worst invasive alien species threatening biodiversity in Europe'. Several sources were used compiling the list. The SEBI 2010 Expert Group on trends in invasive alien species elaborated, as a first step in the selection of species, fact sheets (ca 500) with information on for example biodiversity impact.
•
•
(8) See e.g. http://www.gisp.org/ecology/threat.asp.(9) The IUCN Invasive Species Specialist Group has thus presented a global list of '100 of the worlds worst invasive species' with a
main objective to create awareness of the wide range of invasive species from different taxonomic groups and of impacts caused, see http://www.iucn.org/dbtw‑wpd/edocs/2000‑126.pdf.
(10) http://biodiversity‑chm.eea.europa.eu/information/indicator/F1090245995/F1115192484/F1115817422/fol536223 (Accessed March 2007).
10InvasivealienspeciesinEurope
97Halting the loss of biodiversity by 2010: proposal for a first set of indicators to monitor progress in Europe
Methodology Two different approaches were used in compiling the elements for the indicator 'Invasive alien species in Europe':
CumulativenumberofalienspeciesinEuropesince1900
Data were compiled by existing networks according to the following criteria specified by the SEBI 2010 Expert Group on IAS:
The indicator is populated with data 1900–2007 at 10‑year intervals and older 'pre‑1900 aliens'.
Only the first record in the wild of a particular alien species for the different regions in Europe is included (i.e. no multiple records).
Only verified (by experts) records will be included. 'Casuals' (organisms that are introduced to the wild but do not reproduce) are
excluded (11). Synonyms are checked.
The basis for the calculation of the terrestrial and freshwater data was the 11 country lists recording the alien species of different taxa with information on year of establishment. First year of establishment recorded in a country was considered to be the year the species established in Europe. The cumulative species numbers for the main taxonomic groups was then calculated.
The marine data were compiled in cooperation with main experts on the European regional seas, see above. Each regional sea was considered separately; otherwise the calculations were performed as above (12).
WorstinvasivealienspeciesthreateningbiodiversityinEurope:
Candidates for a tentative list were initially selected from national lists and other sources by experts in the SEBI 2010 Expert group on trends in invasive alien species. Species were selected from the terrestrial, freshwater and marine environments as well as from a range of taxonomic groups. The criteria used were the following:
1. The species is recognised by experts to have a serious impact on biological diversity of Europe. 'Serious' refers to, e.g.:
severe impacts on ecosystem structure and function;replacement of a native species throughout a significant proportion of its range;hybridisation with native species;threats to unique biodiversity (e.g. endemic species).
2. The species, in addition to its impact on biodiversity, may have negative consequences for human activities, health and/or economic interests (e.g. is a pest, pathogen or a vector of disease).
The list was then subject to an informal technical specialist consultation involving e.g. the Bern Convention's Group of Experts on Invasive Alien Species, contacts at IUCN/GISP (Global Invasive Species Programme), the partners of relevant EU and regional research networks (e.g. NOBANIS, DAISIE) and other experts. Additional information was provided in a technical consultation on the EC Clearing House Mechanism in February–March 2006. This technical specialist review added a few new species and removed another few. The 2006 list was finally established at a meeting of the SEBI 2010 Expert Group on trends on invasive alien species in October 2006. (13)
Maintaining, revising and updating the list should be the responsibility of the SEBI 2010 Expert Group on trends on invasive alien species or a similar forum of experts nominated by countries. The list should be updated every five years (14).
1.
2.
3.4.
5.
••••
(11) However, the marine data include a number of 'casuals', i.e. species which have not be proven to establish and/or breed through records over a number of years.
(12) Actually, for marine data also accidentally recorded species are presently included.(13) http://biodiversity‑chm.eea.europa.eu/information/indicator/F1090245995/F1115192484/F1115817422/fol521326 (Accessed March
2007).(14) A first review may be necessary already by end 2007, as significant additional information is expected to be published by the EU
DAISIE project in 2007, see http://www.daisie.ceh.ac.uk/.
10InvasivealienspeciesinEurope
98 Halting the loss of biodiversity by 2010: proposal for a first set of indicators to monitor progress in Europe
Mainadvantagesoftheindicator
The main advantages of the 'Cumulative number of alien species in Europe since 1900' are:
sound underlying assumption, i.e. that the risk of establishment, spread, ecological and socioeconomic damage of invasive alien species increases with the number of alien species and individual introductions;consistent with the ideas developed within CBD and in line with other international initiatives;it is robust, shows trend over time and is easily communicated to a wide target group.
Main advantages of the list of worst invasive species threatening biodiversity in Europe are that:
it is easily communicated to policy‑makers, stakeholders and the wider public;it helps prioritise management actions to control IAS;it provides a basis for regional collaboration with respect to IAS control; it provides a simple and affordable, although subjective, indication of impact of invasive alien species, which are otherwise hard to measure; it provides a basis for monitoring additional aspects, such as more detailed mapping of expansion and impact, of IAS, ultimately aiming at establishing early warning systems and/or to evaluate policy‑effectiveness.
•
•
•
••••
•
Maindisadvantagesoftheindicator
CumulativenumberofalienspeciesinEuropesince1900
The indicator covers alien species without distinguishing those aliens that have become invasive. Although there is a relation between total number of alien species established and the number of invasive alien species, it is desirable to focus on the latter. Presently, this is not possible as no harmonized and officially accepted criteria to identify the share of invasives are available.The limited geographical coverage for the freshwater and terrestrial environments does not provide a representative indicator for European‑level assessments. The eleven Nordic and Baltic countries have specific climatic and biogeographical features — being the northern part of Europe — which differ considerably from other regions. For a limited number of species the time of introduction is not known.
WorstinvasivealienspeciesthreateningbiodiversityinEuropeThese species have been identified in an extensive and open expert consultation. In spite of this there is an element of subjectivity in the selection of species. The indicator 'Invasive alien species in Europe' presently also suffers from not more precisely measuring the impacts of the invasive alien species, including costs, details on the geographical spread of (at least selected) species within Europe and on management and other response measures.
•
•
•
•
Analysisofoptions The suggested sub‑indicator 'Cumulative number of alien species in Europe since 1900' has been designed to show development according to the three main ecosystems — marine, freshwater and terrestrial. Data can also be broken down to more specific environments (wetlands, forests, agricultural lands, urban areas etc.). Another option is to present the indicator according to means of introduction, thus connecting to driving forces.
The list of 'Worst invasive alien species threatening biodiversity in Europe' could alternatively include also species which (mainly) threaten human interests. Some of these are of great economic importance and widely known. The advantage from an awareness point of view of expanding the list to include these species should be balanced against the objective of presenting effects on native biodiversity (the present list).
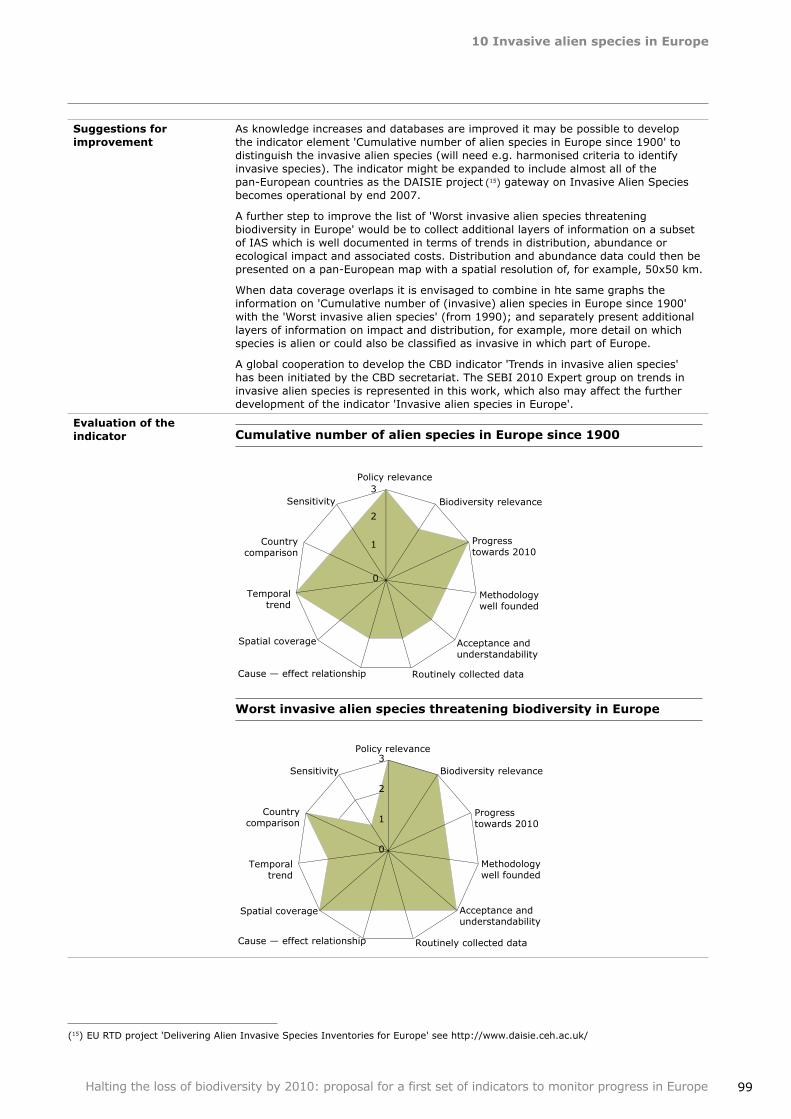
10InvasivealienspeciesinEurope
99Halting the loss of biodiversity by 2010: proposal for a first set of indicators to monitor progress in Europe
Suggestionsforimprovement
As knowledge increases and databases are improved it may be possible to develop the indicator element 'Cumulative number of alien species in Europe since 1900' to distinguish the invasive alien species (will need e.g. harmonised criteria to identify invasive species). The indicator might be expanded to include almost all of the pan‑European countries as the DAISIE project (15) gateway on Invasive Alien Species becomes operational by end 2007.
A further step to improve the list of 'Worst invasive alien species threatening biodiversity in Europe' would be to collect additional layers of information on a subset of IAS which is well documented in terms of trends in distribution, abundance or ecological impact and associated costs. Distribution and abundance data could then be presented on a pan‑European map with a spatial resolution of, for example, 50x50 km.
When data coverage overlaps it is envisaged to combine in hte same graphs the information on 'Cumulative number of (invasive) alien species in Europe since 1900' with the 'Worst invasive alien species' (from 1990); and separately present additional layers of information on impact and distribution, for example, more detail on which species is alien or could also be classified as invasive in which part of Europe.
A global cooperation to develop the CBD indicator 'Trends in invasive alien species' has been initiated by the CBD secretariat. The SEBI 2010 Expert group on trends in invasive alien species is represented in this work, which also may affect the further development of the indicator 'Invasive alien species in Europe'.
Evaluationoftheindicator CumulativenumberofalienspeciesinEuropesince1900
WorstinvasivealienspeciesthreateningbiodiversityinEurope
0
1
2
3 Policy relevance
Biodiversity relevance
Progress towards 2010
Methodology well founded
Acceptance and understandability
Routinely collected data Cause — effect relationship
Spatial coverage
Temporal trend
Country comparison
Sensitivity
0
1
2
3 Policy relevance
Biodiversity relevance
Progress towards 2010
Methodology well founded
Acceptance and understandability
Routinely collected data Cause — effect relationship
Spatial coverage
Temporal trend
Country comparison
Sensitivity
(15) EU RTD project 'Delivering Alien Invasive Species Inventories for Europe' see http://www.daisie.ceh.ac.uk/
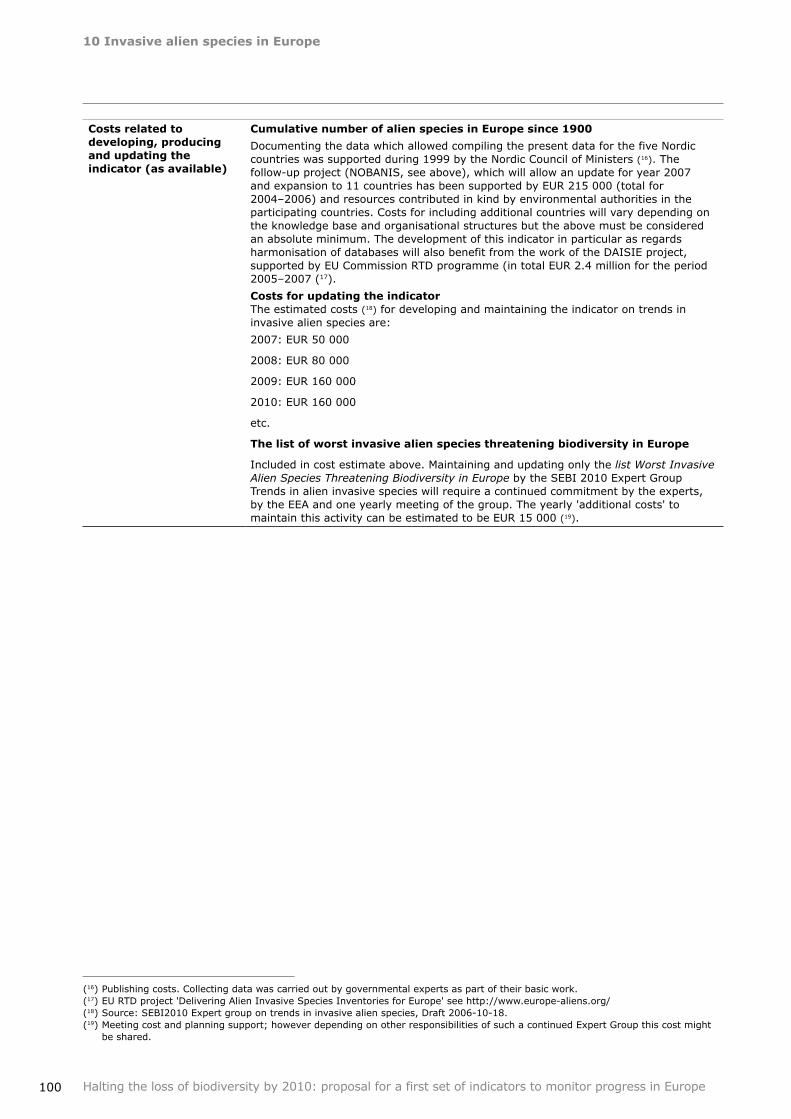
10InvasivealienspeciesinEurope
100 Halting the loss of biodiversity by 2010: proposal for a first set of indicators to monitor progress in Europe
Costsrelatedtodeveloping,producingandupdatingtheindicator(asavailable)
CumulativenumberofalienspeciesinEuropesince1900
Documenting the data which allowed compiling the present data for the five Nordic countries was supported during 1999 by the Nordic Council of Ministers (16). The follow‑up project (NOBANIS, see above), which will allow an update for year 2007 and expansion to 11 countries has been supported by EUR 215 000 (total for 2004–2006) and resources contributed in kind by environmental authorities in the participating countries. Costs for including additional countries will vary depending on the knowledge base and organisational structures but the above must be considered an absolute minimum. The development of this indicator in particular as regards harmonisation of databases will also benefit from the work of the DAISIE project, supported by EU Commission RTD programme (in total EUR 2.4 million for the period 2005–2007 (17).
CostsforupdatingtheindicatorThe estimated costs (18) for developing and maintaining the indicator on trends in invasive alien species are:
2007: EUR 50 000
2008: EUR 80 000
2009: EUR 160 000
2010: EUR 160 000
etc.
ThelistofworstinvasivealienspeciesthreateningbiodiversityinEurope
Included in cost estimate above. Maintaining and updating only the list Worst Invasive Alien Species Threatening Biodiversity in Europe by the SEBI 2010 Expert Group Trends in alien invasive species will require a continued commitment by the experts, by the EEA and one yearly meeting of the group. The yearly 'additional costs' to maintain this activity can be estimated to be EUR 15 000 (19).
(16) Publishing costs. Collecting data was carried out by governmental experts as part of their basic work.(17) EU RTD project 'Delivering Alien Invasive Species Inventories for Europe' see http://www.europe‑aliens.org/(18) Source: SEBI2010 Expert group on trends in invasive alien species, Draft 2006‑10‑18.(19) Meeting cost and planning support; however depending on other responsibilities of such a continued Expert Group this cost might
be shared.
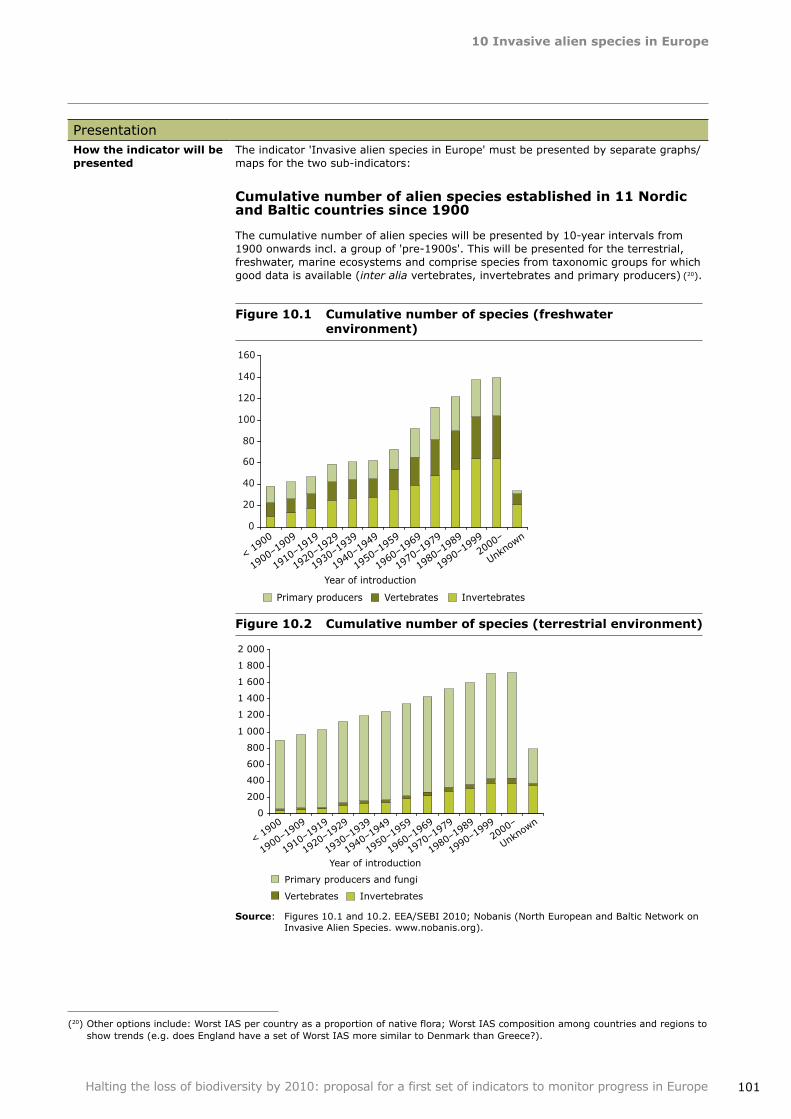
10InvasivealienspeciesinEurope
101Halting the loss of biodiversity by 2010: proposal for a first set of indicators to monitor progress in Europe
PresentationHowtheindicatorwillbepresented
The indicator 'Invasive alien species in Europe' must be presented by separate graphs/maps for the two sub‑indicators:
Cumulativenumberofalienspeciesestablishedin11NordicandBalticcountriessince1900
The cumulative number of alien species will be presented by 10‑year intervals from 1900 onwards incl. a group of 'pre‑1900s'. This will be presented for the terrestrial, freshwater, marine ecosystems and comprise species from taxonomic groups for which good data is available (inter alia vertebrates, invertebrates and primary producers) (20).
Figure10.1 Cumulativenumberofspecies(freshwaterenvironment)
Figure10.2 Cumulativenumberofspecies(terrestrialenvironment)
Source: Figures 10.1 and 10.2. EEA/SEBI 2010; Nobanis (North European and Baltic Network on Invasive Alien Species. www.nobanis.org).
Year of introduction
< 1900
1900
–190
9
1910
–191
9
1920
–192
9
1930
–193
9
1940
–194
9
1950
–195
9
1960
–196
9
1970
–197
9
1980
–198
9
1990
–199
920
00–
0
20
40
60
80
100
120
140
160
Primary producers Vertebrates Invertebrates
Unkno
wn
0
200
400
600
800
1 000
1 200
1 400
1 600
1 800
2 000
Primary producers and fungi
Vertebrates Invertebrates
< 1900
1900
–190
9
1910
–191
9
1920
–192
9
1930
–193
9
1940
–194
9
1950
–195
9
1960
–196
9
1970
–197
9
1980
–198
9
1990
–199
920
00–
Unkno
wn
Year of introduction
(20) Other options include: Worst IAS per country as a proportion of native flora; Worst IAS composition among countries and regions to show trends (e.g. does England have a set of Worst IAS more similar to Denmark than Greece?).
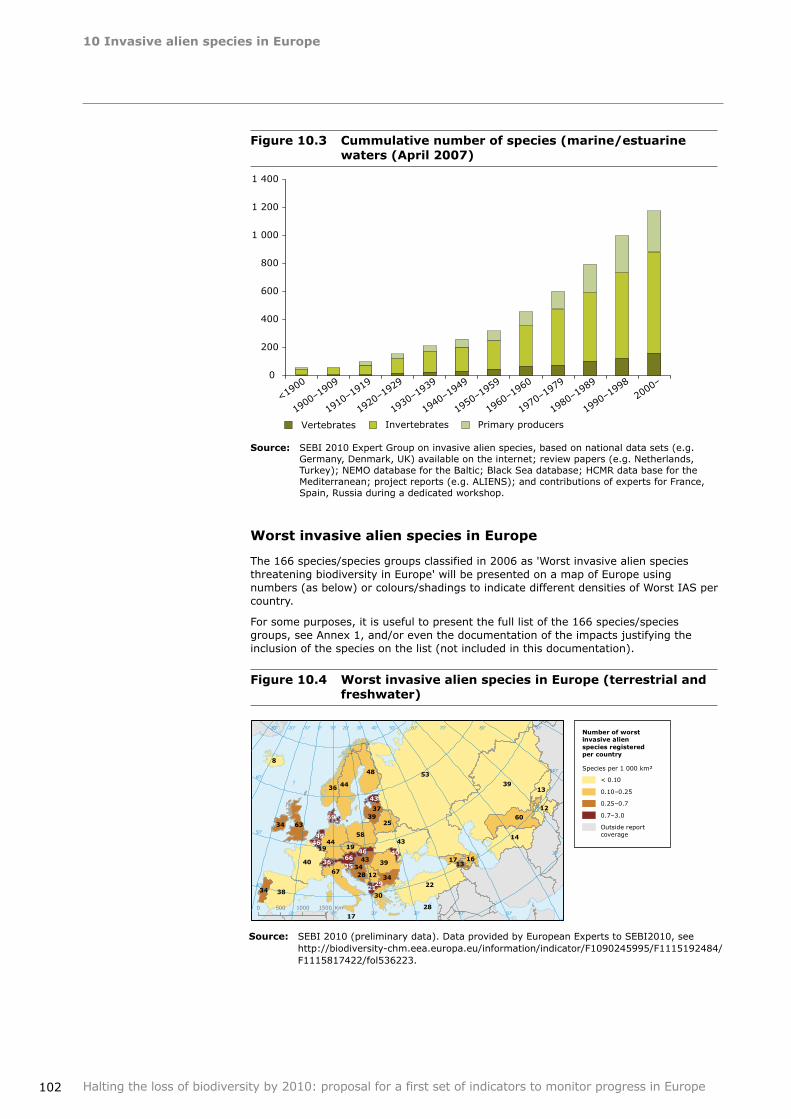
10InvasivealienspeciesinEurope
102 Halting the loss of biodiversity by 2010: proposal for a first set of indicators to monitor progress in Europe
Figure10.3 Cummulativenumberofspecies(marine/estuarinewaters(April2007)
Source: SEBI 2010 Expert Group on invasive alien species, based on national data sets (e.g. Germany, Denmark, UK) available on the internet; review papers (e.g. Netherlands, Turkey); NEMO database for the Baltic; Black Sea database; HCMR data base for the Mediterranean; project reports (e.g. ALIENS); and contributions of experts for France, Spain, Russia during a dedicated workshop.
WorstinvasivealienspeciesinEurope
The 166 species/species groups classified in 2006 as 'Worst invasive alien species threatening biodiversity in Europe' will be presented on a map of Europe using numbers (as below) or colours/shadings to indicate different densities of Worst IAS per country.
For some purposes, it is useful to present the full list of the 166 species/species groups, see Annex 1, and/or even the documentation of the impacts justifying the inclusion of the species on the list (not included in this documentation).
Figure10.4 WorstinvasivealienspeciesinEurope(terrestrialandfreshwater)
0
200
400
600
800
1 000
1 200
1 400
<1900
1900
–190
9
1910
–191
9
1920
–192
9
1930
–193
9
1940
–194
9
1950
–195
9
1960
–196
0
1970
–197
9
1980
–198
9
1990
–199
820
00–
Vertebrates Invertebrates Primary producers
53
39
22
43
40
38
14
60
44
44
48
58
36
6739
25
8
13
3412
66
63
12
30
43
34
16
19
17
3439
37
3428
46
43
36
40
4946
13
2129
69
35
28
19
17
-10°-20°-30°
0°
0°
10°
10° 20°
20°
30°
30°
40°
40°
50°
50°
60° 70° 80° 90°
40°
40°
50°
60°
30°
0 500 1000 1500 Km
Number of worstinvasive alien species registered per country
< 0.10
0.10–0.25
0.25–0.7
0.7–3.0
Outside report coverage
Species per 1 000 km²
Source: SEBI 2010 (preliminary data). Data provided by European Experts to SEBI2010, see http://biodiversity‑chm.eea.europa.eu/information/indicator/F1090245995/F1115192484/F1115817422/fol536223.
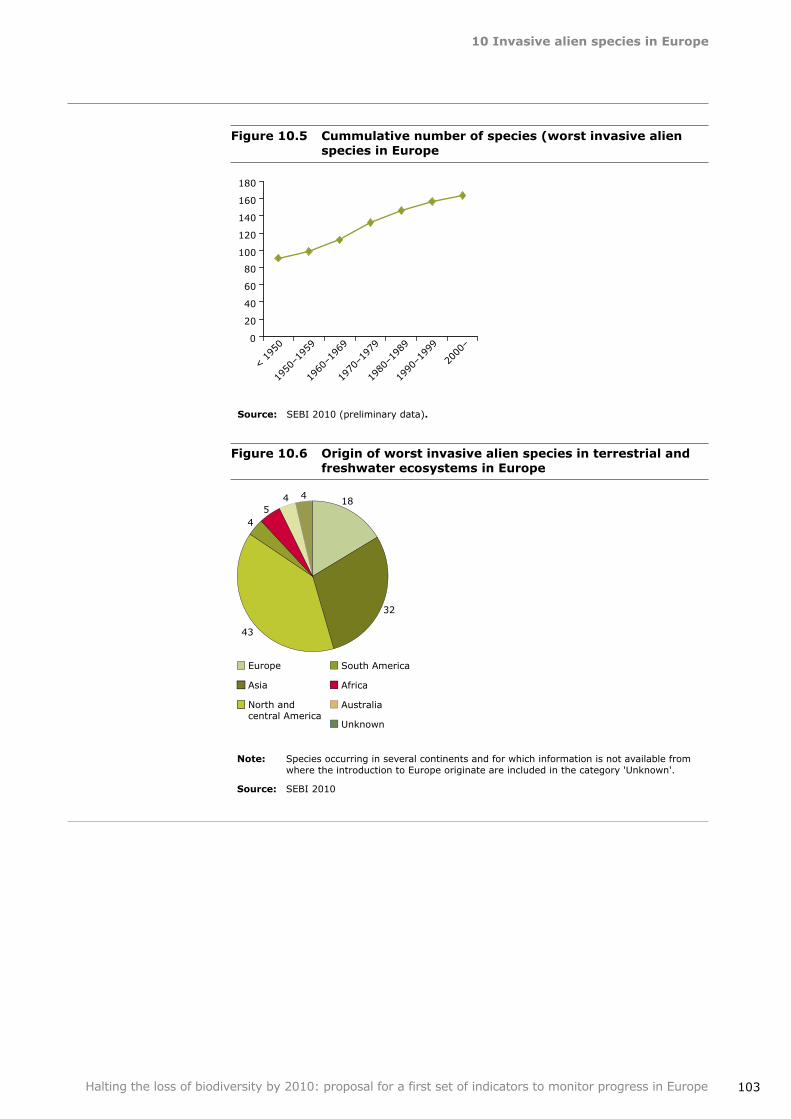
10InvasivealienspeciesinEurope
103Halting the loss of biodiversity by 2010: proposal for a first set of indicators to monitor progress in Europe
0
20
40
60
80
100
120
140
160
180
1980
–198
9
1990
–199
9
2000
–
1970
–197
9
1960
–196
9
1950
–195
9
< 195
0
18
32
43
4 5
4 4
Europe
Asia
North and central America
South America
Africa
Australia
Unknown
Figure10.5 Cummulativenumberofspecies(worstinvasivealienspeciesinEurope
Source: SEBI 2010 (preliminary data).
Note: Species occurring in several continents and for which information is not available from where the introduction to Europe originate are included in the category 'Unknown'.
Source: SEBI 2010
Figure10.6 OriginofworstinvasivealienspeciesinterrestrialandfreshwaterecosystemsinEurope
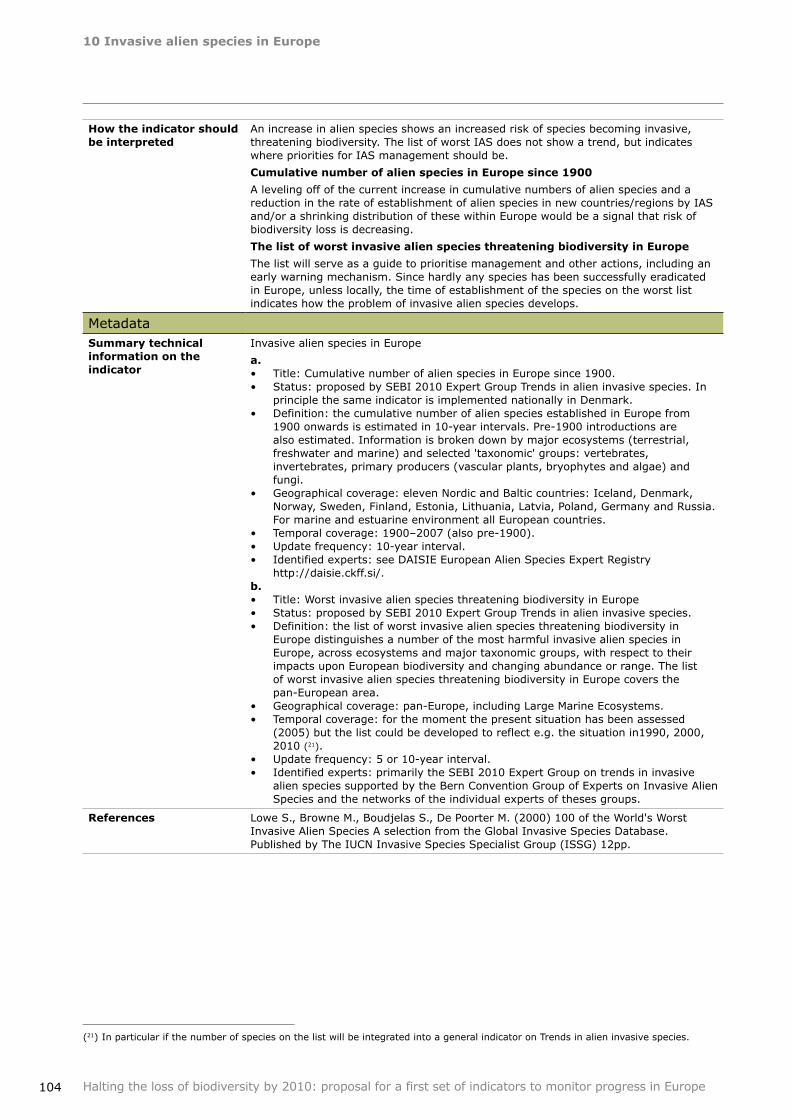
10InvasivealienspeciesinEurope
104 Halting the loss of biodiversity by 2010: proposal for a first set of indicators to monitor progress in Europe
Howtheindicatorshouldbeinterpreted
An increase in alien species shows an increased risk of species becoming invasive, threatening biodiversity. The list of worst IAS does not show a trend, but indicates where priorities for IAS management should be.
CumulativenumberofalienspeciesinEuropesince1900
A leveling off of the current increase in cumulative numbers of alien species and a reduction in the rate of establishment of alien species in new countries/regions by IAS and/or a shrinking distribution of these within Europe would be a signal that risk of biodiversity loss is decreasing.
ThelistofworstinvasivealienspeciesthreateningbiodiversityinEurope
The list will serve as a guide to prioritise management and other actions, including an early warning mechanism. Since hardly any species has been successfully eradicated in Europe, unless locally, the time of establishment of the species on the worst list indicates how the problem of invasive alien species develops.
MetadataSummarytechnicalinformationontheindicator
Invasive alien species in Europe
a.Title: Cumulative number of alien species in Europe since 1900.Status: proposed by SEBI 2010 Expert Group Trends in alien invasive species. In principle the same indicator is implemented nationally in Denmark. Definition: the cumulative number of alien species established in Europe from 1900 onwards is estimated in 10‑year intervals. Pre‑1900 introductions are also estimated. Information is broken down by major ecosystems (terrestrial, freshwater and marine) and selected 'taxonomic' groups: vertebrates, invertebrates, primary producers (vascular plants, bryophytes and algae) and fungi. Geographical coverage: eleven Nordic and Baltic countries: Iceland, Denmark, Norway, Sweden, Finland, Estonia, Lithuania, Latvia, Poland, Germany and Russia. For marine and estuarine environment all European countries. Temporal coverage: 1900–2007 (also pre‑1900).Update frequency: 10‑year interval.Identified experts: see DAISIE European Alien Species Expert Registry http:/ / daisie.ckff.si/.
b.Title: Worst invasive alien species threatening biodiversity in EuropeStatus: proposed by SEBI 2010 Expert Group Trends in alien invasive species. Definition: the list of worst invasive alien species threatening biodiversity in Europe distinguishes a number of the most harmful invasive alien species in Europe, across ecosystems and major taxonomic groups, with respect to their impacts upon European biodiversity and changing abundance or range. The list of worst invasive alien species threatening biodiversity in Europe covers the pan‑European area. Geographical coverage: pan‑Europe, including Large Marine Ecosystems.Temporal coverage: for the moment the present situation has been assessed (2005) but the list could be developed to reflect e.g. the situation in1990, 2000, 2010 (21). Update frequency: 5 or 10‑year interval. Identified experts: primarily the SEBI 2010 Expert Group on trends in invasive alien species supported by the Bern Convention Group of Experts on Invasive Alien Species and the networks of the individual experts of theses groups.
••
•
•
•••
•••
••
••
References Lowe S., Browne M., Boudjelas S., De Poorter M. (2000) 100 of the World's Worst Invasive Alien Species A selection from the Global Invasive Species Database. Published by The IUCN Invasive Species Specialist Group (ISSG) 12pp.
(21) In particular if the number of species on the list will be integrated into a general indicator on Trends in alien invasive species.
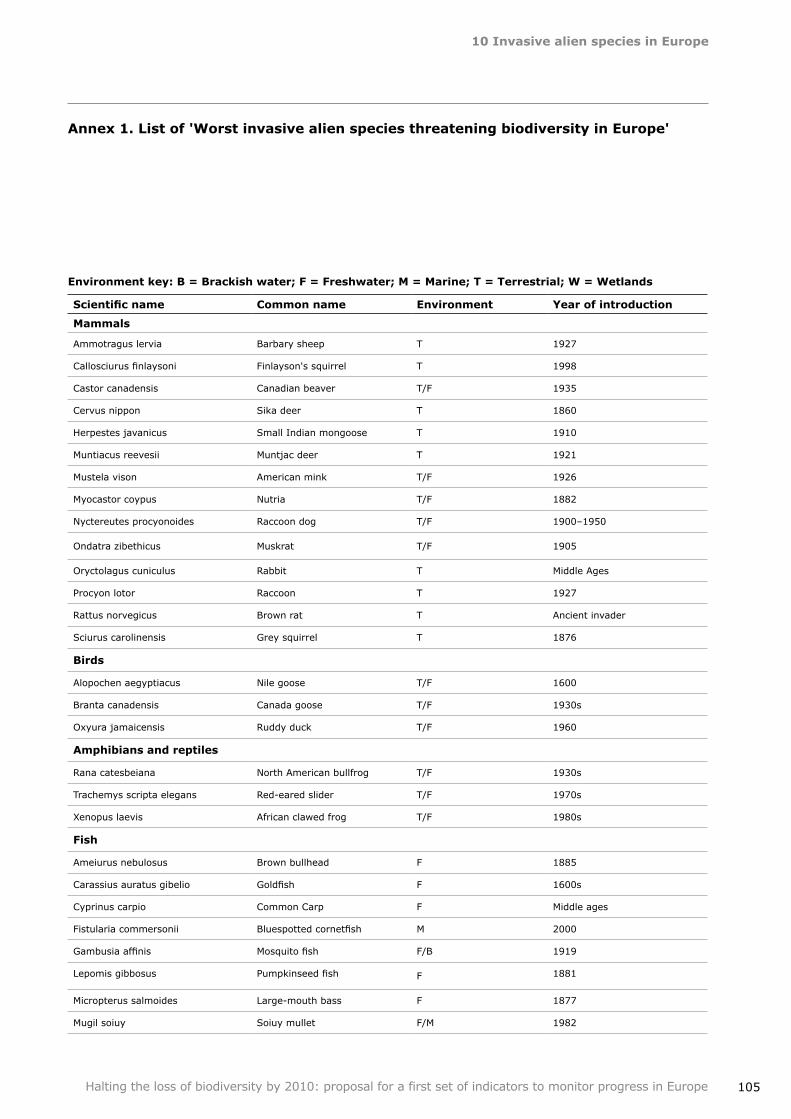
10InvasivealienspeciesinEurope
105Halting the loss of biodiversity by 2010: proposal for a first set of indicators to monitor progress in Europe
Annex1.Listof'WorstinvasivealienspeciesthreateningbiodiversityinEurope'
Environmentkey:B=Brackishwater;F=Freshwater;M=Marine;T=Terrestrial;W=Wetlands
Scientific name Commonname Environment Yearofintroduction
Mammals
Ammotragus lervia Barbary sheep T 1927
Callosciurus finlaysoni Finlayson's squirrel T 1998
Castor canadensis Canadian beaver T/F 1935
Cervus nippon Sika deer T 1860
Herpestes javanicus Small Indian mongoose T 1910
Muntiacus reevesii Muntjac deer T 1921
Mustela vison American mink T/F 1926
Myocastor coypus Nutria T/F 1882
Nyctereutes procyonoides Raccoon dog T/F 1900–1950
Ondatra zibethicus Muskrat T/F 1905
Oryctolagus cuniculus Rabbit T Middle Ages
Procyon lotor Raccoon T 1927
Rattus norvegicus Brown rat T Ancient invader
Sciurus carolinensis Grey squirrel T 1876
Birds
Alopochen aegyptiacus Nile goose T/F 1600
Branta canadensis Canada goose T/F 1930s
Oxyura jamaicensis Ruddy duck T/F 1960
Amphibiansandreptiles
Rana catesbeiana North American bullfrog T/F 1930s
Trachemys scripta elegans Red‑eared slider T/F 1970s
Xenopus laevis African clawed frog T/F 1980s
Fish
Ameiurus nebulosus Brown bullhead F 1885
Carassius auratus gibelio Goldfish F 1600s
Cyprinus carpio Common Carp F Middle ages
Fistularia commersonii Bluespotted cornetfish M 2000
Gambusia affinis Mosquito fish F/B 1919
Lepomis gibbosus Pumpkinseed fish F 1881
Micropterus salmoides Large‑mouth bass F 1877
Mugil soiuy Soiuy mullet F/M 1982
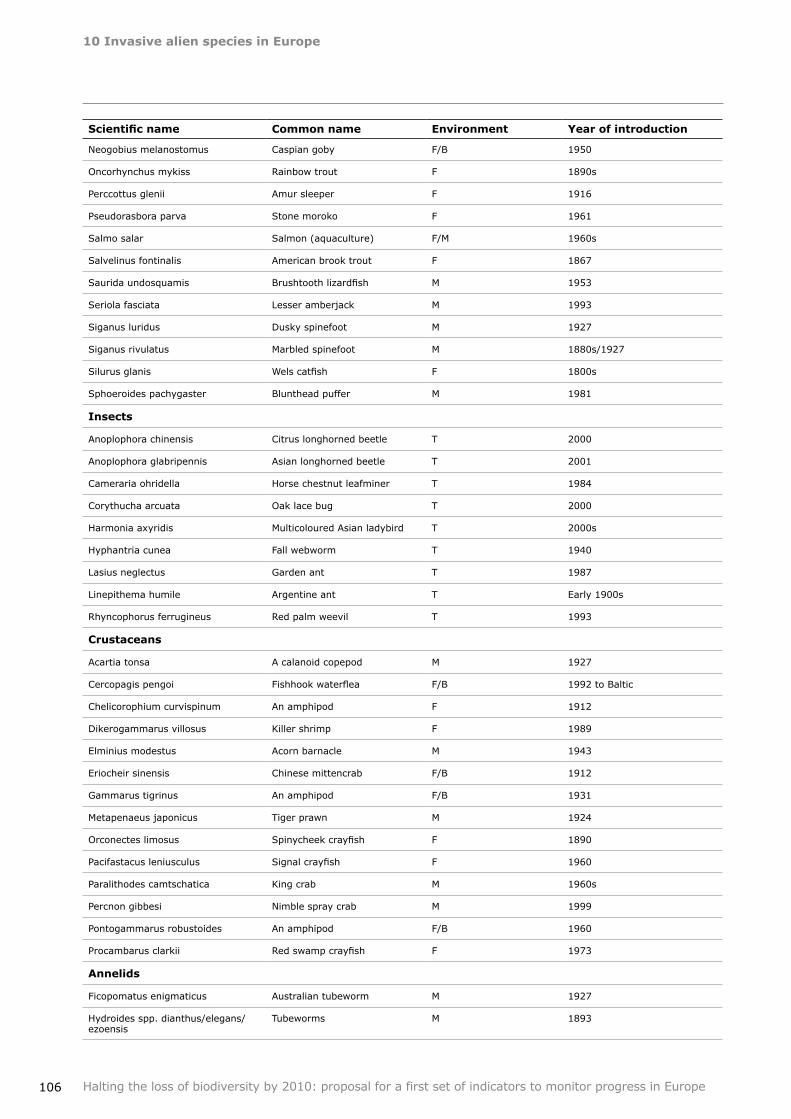
10InvasivealienspeciesinEurope
106 Halting the loss of biodiversity by 2010: proposal for a first set of indicators to monitor progress in Europe
Scientific name Commonname Environment Yearofintroduction
Neogobius melanostomus Caspian goby F/B 1950
Oncorhynchus mykiss Rainbow trout F 1890s
Perccottus glenii Amur sleeper F 1916
Pseudorasbora parva Stone moroko F 1961
Salmo salar Salmon (aquaculture) F/M 1960s
Salvelinus fontinalis American brook trout F 1867
Saurida undosquamis Brushtooth lizardfish M 1953
Seriola fasciata Lesser amberjack M 1993
Siganus luridus Dusky spinefoot M 1927
Siganus rivulatus Marbled spinefoot M 1880s/1927
Silurus glanis Wels catfish F 1800s
Sphoeroides pachygaster Blunthead puffer M 1981
Insects
Anoplophora chinensis Citrus longhorned beetle T 2000
Anoplophora glabripennis Asian longhorned beetle T 2001
Cameraria ohridella Horse chestnut leafminer T 1984
Corythucha arcuata Oak lace bug T 2000
Harmonia axyridis Multicoloured Asian ladybird T 2000s
Hyphantria cunea Fall webworm T 1940
Lasius neglectus Garden ant T 1987
Linepithema humile Argentine ant T Early 1900s
Rhyncophorus ferrugineus Red palm weevil T 1993
Crustaceans
Acartia tonsa A calanoid copepod M 1927
Cercopagis pengoi Fishhook waterflea F/B 1992 to Baltic
Chelicorophium curvispinum An amphipod F 1912
Dikerogammarus villosus Killer shrimp F 1989
Elminius modestus Acorn barnacle M 1943
Eriocheir sinensis Chinese mittencrab F/B 1912
Gammarus tigrinus An amphipod F/B 1931
Metapenaeus japonicus Tiger prawn M 1924
Orconectes limosus Spinycheek crayfish F 1890
Pacifastacus leniusculus Signal crayfish F 1960
Paralithodes camtschatica King crab M 1960s
Percnon gibbesi Nimble spray crab M 1999
Pontogammarus robustoides An amphipod F/B 1960
Procambarus clarkii Red swamp crayfish F 1973
Annelids
Ficopomatus enigmaticus Australian tubeworm M 1927
Hydroides spp. dianthus/elegans/ezoensis
Tubeworms M 1893
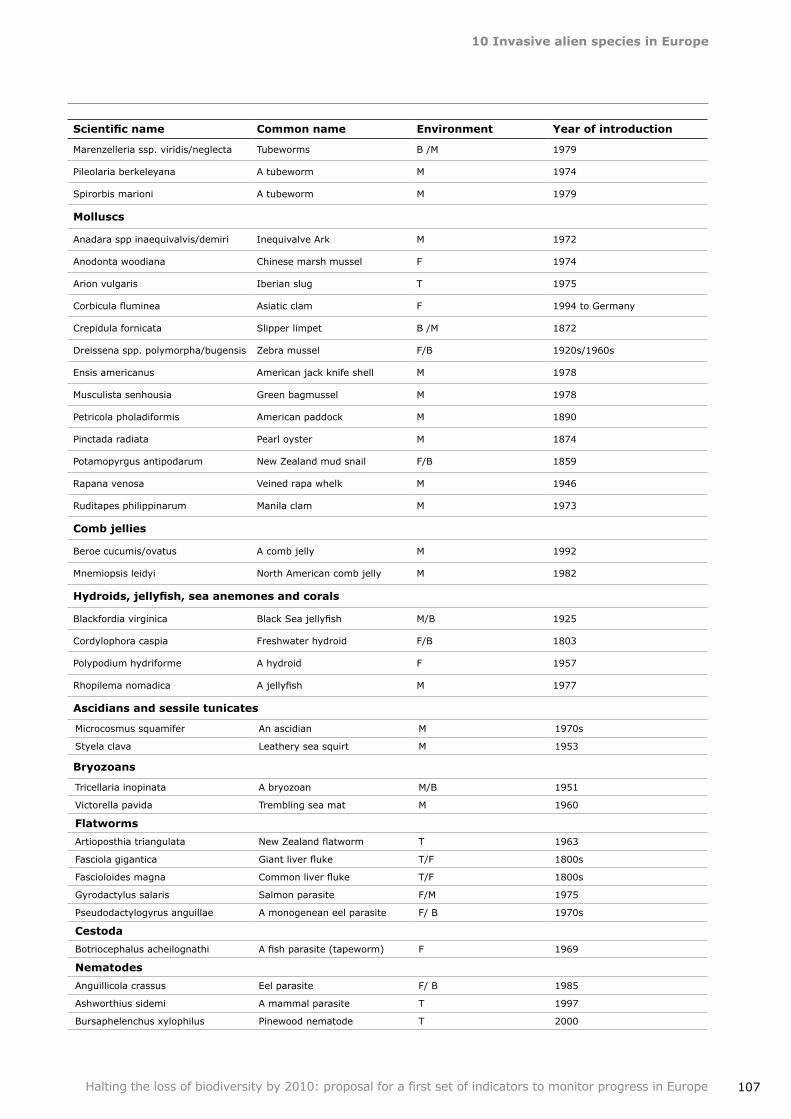
10InvasivealienspeciesinEurope
107Halting the loss of biodiversity by 2010: proposal for a first set of indicators to monitor progress in Europe
Scientific name Commonname Environment Yearofintroduction
Marenzelleria ssp. viridis/neglecta Tubeworms B /M 1979
Pileolaria berkeleyana A tubeworm M 1974
Spirorbis marioni A tubeworm M 1979
Molluscs
Anadara spp inaequivalvis/demiri Inequivalve Ark M 1972
Anodonta woodiana Chinese marsh mussel F 1974
Arion vulgaris Iberian slug T 1975
Corbicula fluminea Asiatic clam F 1994 to Germany
Crepidula fornicata Slipper limpet B /M 1872
Dreissena spp. polymorpha/bugensis Zebra mussel F/B 1920s/1960s
Ensis americanus American jack knife shell M 1978
Musculista senhousia Green bagmussel M 1978
Petricola pholadiformis American paddock M 1890
Pinctada radiata Pearl oyster M 1874
Potamopyrgus antipodarum New Zealand mud snail F/B 1859
Rapana venosa Veined rapa whelk M 1946
Ruditapes philippinarum Manila clam M 1973
Combjellies
Beroe cucumis/ovatus A comb jelly M 1992
Mnemiopsis leidyi North American comb jelly M 1982
Hydroids, jellyfish, sea anemones and corals
Blackfordia virginica Black Sea jellyfish M/B 1925
Cordylophora caspia Freshwater hydroid F/B 1803
Polypodium hydriforme A hydroid F 1957
Rhopilema nomadica A jellyfish M 1977
Ascidiansandsessiletunicates
Microcosmus squamifer An ascidian M 1970s
Styela clava Leathery sea squirt M 1953
Bryozoans
Tricellaria inopinata A bryozoan M/B 1951
Victorella pavida Trembling sea mat M 1960
Flatworms
Artioposthia triangulata New Zealand flatworm T 1963
Fasciola gigantica Giant liver fluke T/F 1800s
Fascioloides magna Common liver fluke T/F 1800s
Gyrodactylus salaris Salmon parasite F/M 1975
Pseudodactylogyrus anguillae A monogenean eel parasite F/ B 1970s
Cestoda
Botriocephalus acheilognathi A fish parasite (tapeworm) F 1969
Nematodes
Anguillicola crassus Eel parasite F/ B 1985
Ashworthius sidemi A mammal parasite T 1997
Bursaphelenchus xylophilus Pinewood nematode T 2000
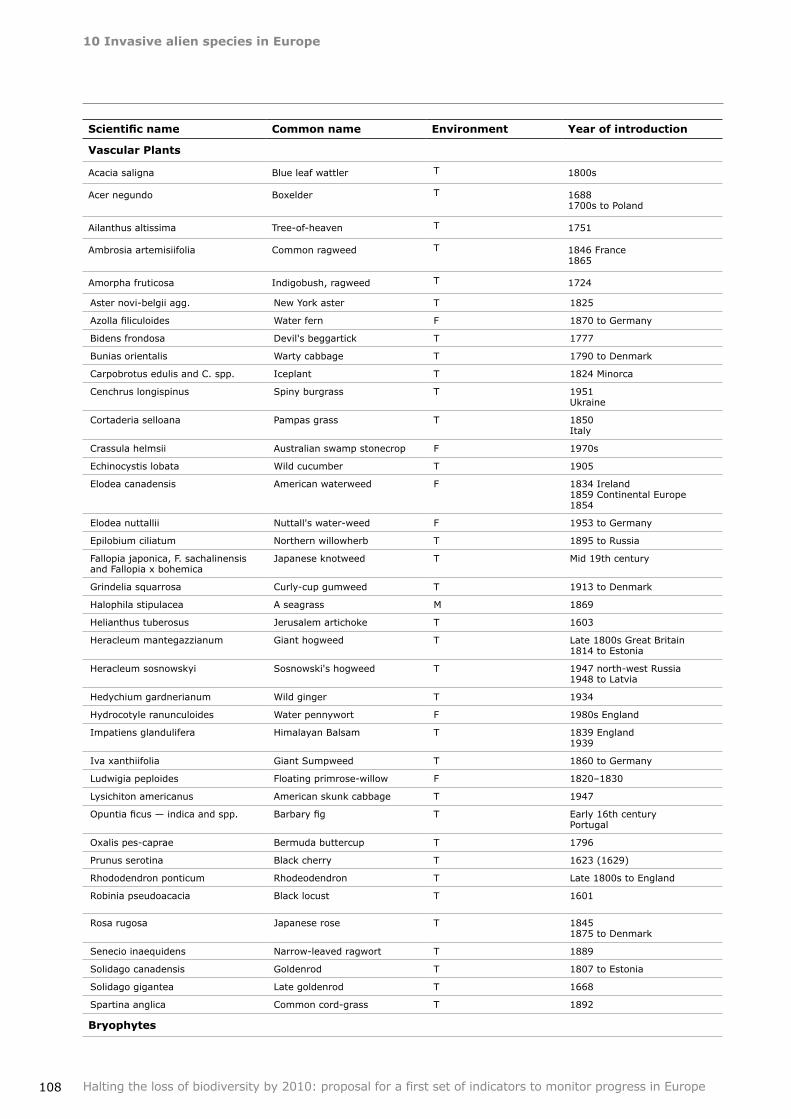
10InvasivealienspeciesinEurope
108 Halting the loss of biodiversity by 2010: proposal for a first set of indicators to monitor progress in Europe
Scientific name Commonname Environment Yearofintroduction
VascularPlants
Acacia saligna Blue leaf wattler T 1800s
Acer negundo Boxelder T 1688 1700s to Poland
Ailanthus altissima Tree‑of‑heaven T 1751
Ambrosia artemisiifolia Common ragweed T 1846 France 1865
Amorpha fruticosa Indigobush, ragweed T 1724
Aster novi‑belgii agg. New York aster T 1825
Azolla filiculoides Water fern F 1870 to Germany
Bidens frondosa Devil's beggartick T 1777
Bunias orientalis Warty cabbage T 1790 to Denmark
Carpobrotus edulis and C. spp. Iceplant T 1824 Minorca
Cenchrus longispinus Spiny burgrass T 1951 Ukraine
Cortaderia selloana Pampas grass T 1850 Italy
Crassula helmsii Australian swamp stonecrop F 1970s
Echinocystis lobata Wild cucumber T 1905
Elodea canadensis American waterweed F 1834 Ireland 1859 Continental Europe 1854
Elodea nuttallii Nuttall's water‑weed F 1953 to Germany
Epilobium ciliatum Northern willowherb T 1895 to Russia
Fallopia japonica, F. sachalinensis and Fallopia x bohemica
Japanese knotweed T Mid 19th century
Grindelia squarrosa Curly‑cup gumweed T 1913 to Denmark
Halophila stipulacea A seagrass M 1869
Helianthus tuberosus Jerusalem artichoke T 1603
Heracleum mantegazzianum Giant hogweed T Late 1800s Great Britain 1814 to Estonia
Heracleum sosnowskyi Sosnowski's hogweed T 1947 north‑west Russia 1948 to Latvia
Hedychium gardnerianum Wild ginger T 1934
Hydrocotyle ranunculoides Water pennywort F 1980s England
Impatiens glandulifera Himalayan Balsam T 1839 England 1939
Iva xanthiifolia Giant Sumpweed T 1860 to Germany
Ludwigia peploides Floating primrose‑willow F 1820–1830
Lysichiton americanus American skunk cabbage T 1947
Opuntia ficus — indica and spp. Barbary fig T Early 16th century Portugal
Oxalis pes‑caprae Bermuda buttercup T 1796
Prunus serotina Black cherry T 1623 (1629)
Rhododendron ponticum Rhodeodendron T Late 1800s to England
Robinia pseudoacacia Black locust T 1601
Rosa rugosa Japanese rose T 1845 1875 to Denmark
Senecio inaequidens Narrow‑leaved ragwort T 1889
Solidago canadensis Goldenrod T 1807 to Estonia
Solidago gigantea Late goldenrod T 1668
Spartina anglica Common cord‑grass T 1892
Bryophytes
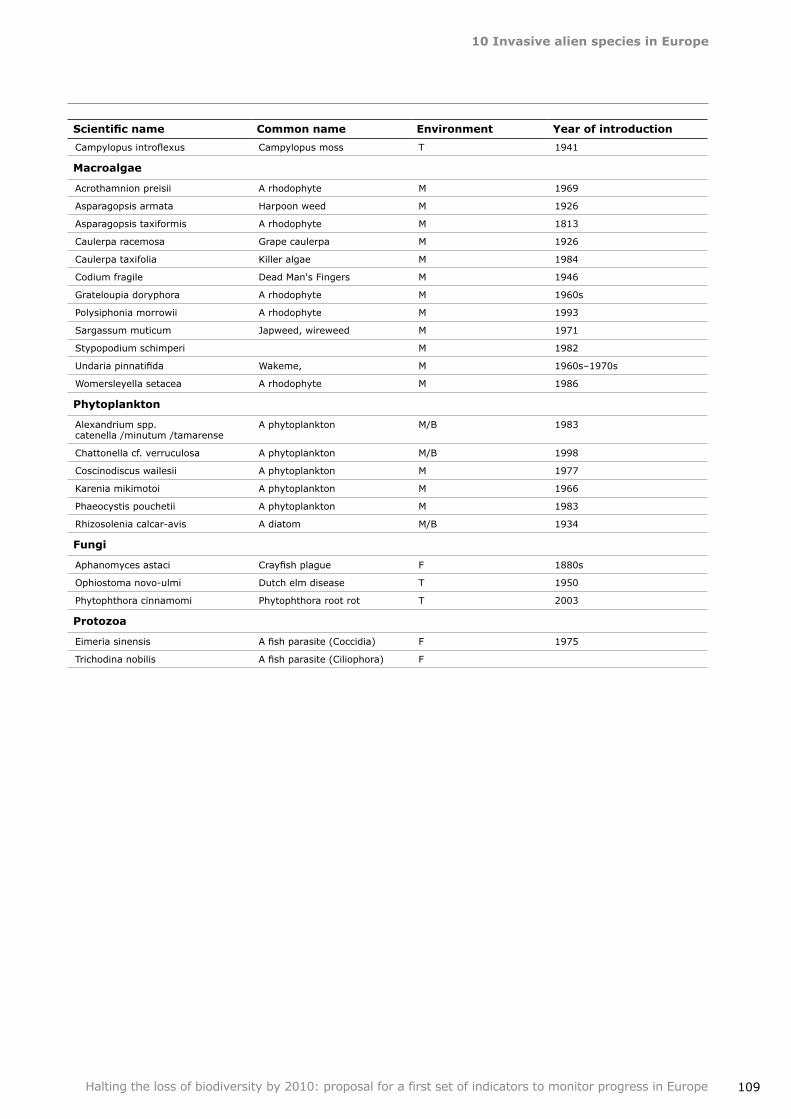
10InvasivealienspeciesinEurope
109Halting the loss of biodiversity by 2010: proposal for a first set of indicators to monitor progress in Europe
Scientific name Commonname Environment Yearofintroduction
Campylopus introflexus Campylopus moss T 1941
Macroalgae
Acrothamnion preisii A rhodophyte M 1969
Asparagopsis armata Harpoon weed M 1926
Asparagopsis taxiformis A rhodophyte M 1813
Caulerpa racemosa Grape caulerpa M 1926
Caulerpa taxifolia Killer algae M 1984
Codium fragile Dead Man's Fingers M 1946
Grateloupia doryphora A rhodophyte M 1960s
Polysiphonia morrowii A rhodophyte M 1993
Sargassum muticum Japweed, wireweed M 1971
Stypopodium schimperi M 1982
Undaria pinnatifida Wakeme, M 1960s–1970s
Womersleyella setacea A rhodophyte M 1986
Phytoplankton
Alexandrium spp. catenella /minutum /tamarense
A phytoplankton M/B 1983
Chattonella cf. verruculosa A phytoplankton M/B 1998
Coscinodiscus wailesii A phytoplankton M 1977
Karenia mikimotoi A phytoplankton M 1966
Phaeocystis pouchetii A phytoplankton M 1983
Rhizosolenia calcar‑avis A diatom M/B 1934
Fungi
Aphanomyces astaci Crayfish plague F 1880s
Ophiostoma novo‑ulmi Dutch elm disease T 1950
Phytophthora cinnamomi Phytophthora root rot T 2003
Protozoa
Eimeria sinensis A fish parasite (Coccidia) F 1975
Trichodina nobilis A fish parasite (Ciliophora) F
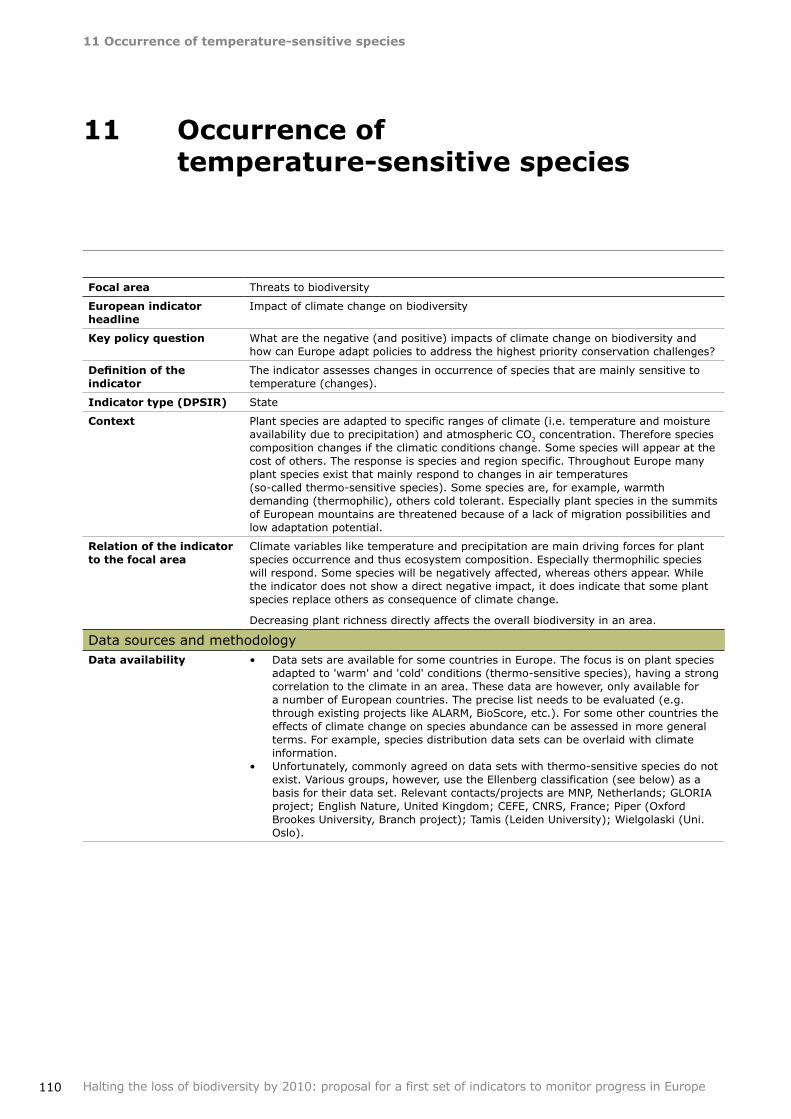
110
11Occurrenceoftemperature‑sensitivespecies
Halting the loss of biodiversity by 2010: proposal for a first set of indicators to monitor progress in Europe
Focalarea Threats to biodiversity
Europeanindicatorheadline
Impact of climate change on biodiversity
Keypolicyquestion What are the negative (and positive) impacts of climate change on biodiversity and how can Europe adapt policies to address the highest priority conservation challenges?
Definition of the indicator
The indicator assesses changes in occurrence of species that are mainly sensitive to temperature (changes).
Indicatortype(DPSIR) State
Context Plant species are adapted to specific ranges of climate (i.e. temperature and moisture availability due to precipitation) and atmospheric CO2 concentration. Therefore species composition changes if the climatic conditions change. Some species will appear at the cost of others. The response is species and region specific. Throughout Europe many plant species exist that mainly respond to changes in air temperatures (so‑called thermo‑sensitive species). Some species are, for example, warmth demanding (thermophilic), others cold tolerant. Especially plant species in the summits of European mountains are threatened because of a lack of migration possibilities and low adaptation potential.
Relationoftheindicatortothefocalarea
Climate variables like temperature and precipitation are main driving forces for plant species occurrence and thus ecosystem composition. Especially thermophilic species will respond. Some species will be negatively affected, whereas others appear. While the indicator does not show a direct negative impact, it does indicate that some plant species replace others as consequence of climate change.
Decreasing plant richness directly affects the overall biodiversity in an area.
Data sources and methodologyDataavailability Data sets are available for some countries in Europe. The focus is on plant species
adapted to 'warm' and 'cold' conditions (thermo‑sensitive species), having a strong correlation to the climate in an area. These data are however, only available for a number of European countries. The precise list needs to be evaluated (e.g. through existing projects like ALARM, BioScore, etc.). For some other countries the effects of climate change on species abundance can be assessed in more general terms. For example, species distribution data sets can be overlaid with climate information.Unfortunately, commonly agreed on data sets with thermo‑sensitive species do not exist. Various groups, however, use the Ellenberg classification (see below) as a basis for their data set. Relevant contacts/projects are MNP, Netherlands; GLORIA project; English Nature, United Kingdom; CEFE, CNRS, France; Piper (Oxford Brookes University, Branch project); Tamis (Leiden University); Wielgolaski (Uni. Oslo).
•
•
11 Occurrenceoftemperature‑sensitivespecies
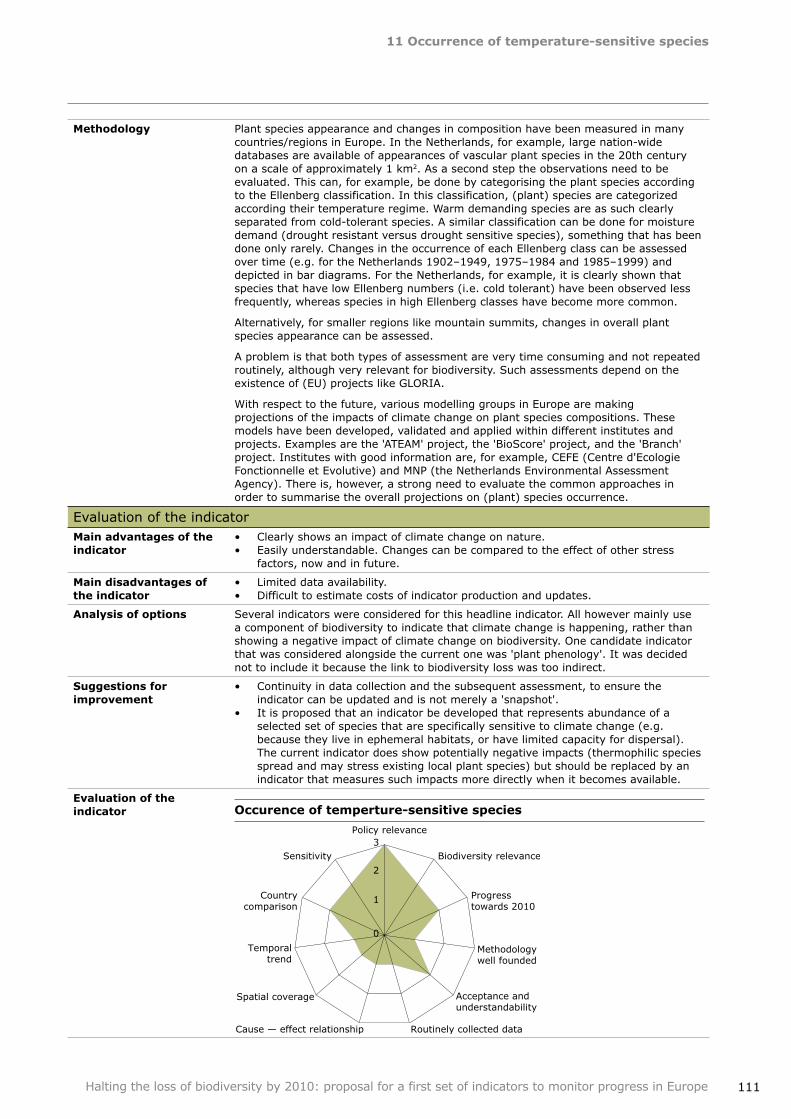
11Occurrenceoftemperature‑sensitivespecies
111Halting the loss of biodiversity by 2010: proposal for a first set of indicators to monitor progress in Europe
Methodology Plant species appearance and changes in composition have been measured in many countries/regions in Europe. In the Netherlands, for example, large nation‑wide databases are available of appearances of vascular plant species in the 20th century on a scale of approximately 1 km2. As a second step the observations need to be evaluated. This can, for example, be done by categorising the plant species according to the Ellenberg classification. In this classification, (plant) species are categorized according their temperature regime. Warm demanding species are as such clearly separated from cold‑tolerant species. A similar classification can be done for moisture demand (drought resistant versus drought sensitive species), something that has been done only rarely. Changes in the occurrence of each Ellenberg class can be assessed over time (e.g. for the Netherlands 1902–1949, 1975–1984 and 1985–1999) and depicted in bar diagrams. For the Netherlands, for example, it is clearly shown that species that have low Ellenberg numbers (i.e. cold tolerant) have been observed less frequently, whereas species in high Ellenberg classes have become more common.
Alternatively, for smaller regions like mountain summits, changes in overall plant species appearance can be assessed.
A problem is that both types of assessment are very time consuming and not repeated routinely, although very relevant for biodiversity. Such assessments depend on the existence of (EU) projects like GLORIA.
With respect to the future, various modelling groups in Europe are making projections of the impacts of climate change on plant species compositions. These models have been developed, validated and applied within different institutes and projects. Examples are the 'ATEAM' project, the 'BioScore' project, and the 'Branch' project. Institutes with good information are, for example, CEFE (Centre d'Ecologie Fonctionnelle et Evolutive) and MNP (the Netherlands Environmental Assessment Agency). There is, however, a strong need to evaluate the common approaches in order to summarise the overall projections on (plant) species occurrence.
Evaluation of the indicatorMainadvantagesoftheindicator
Clearly shows an impact of climate change on nature.Easily understandable. Changes can be compared to the effect of other stress factors, now and in future.
••
Maindisadvantagesoftheindicator
Limited data availability.Difficult to estimate costs of indicator production and updates.
••
Analysisofoptions Several indicators were considered for this headline indicator. All however mainly use a component of biodiversity to indicate that climate change is happening, rather than showing a negative impact of climate change on biodiversity. One candidate indicator that was considered alongside the current one was 'plant phenology'. It was decided not to include it because the link to biodiversity loss was too indirect.
Suggestionsforimprovement
Continuity in data collection and the subsequent assessment, to ensure the indicator can be updated and is not merely a 'snapshot'.It is proposed that an indicator be developed that represents abundance of a selected set of species that are specifically sensitive to climate change (e.g. because they live in ephemeral habitats, or have limited capacity for dispersal). The current indicator does show potentially negative impacts (thermophilic species spread and may stress existing local plant species) but should be replaced by an indicator that measures such impacts more directly when it becomes available.
•
•
Evaluationoftheindicator Occurenceoftemperture‑sensitivespecies
0
1
2
3Policy relevance
Biodiversity relevance
Progresstowards 2010
Methodologywell founded
Acceptance andunderstandability
Routinely collected dataCause — effect relationship
Spatial coverage
Temporaltrend
Countrycomparison
Sensitivity
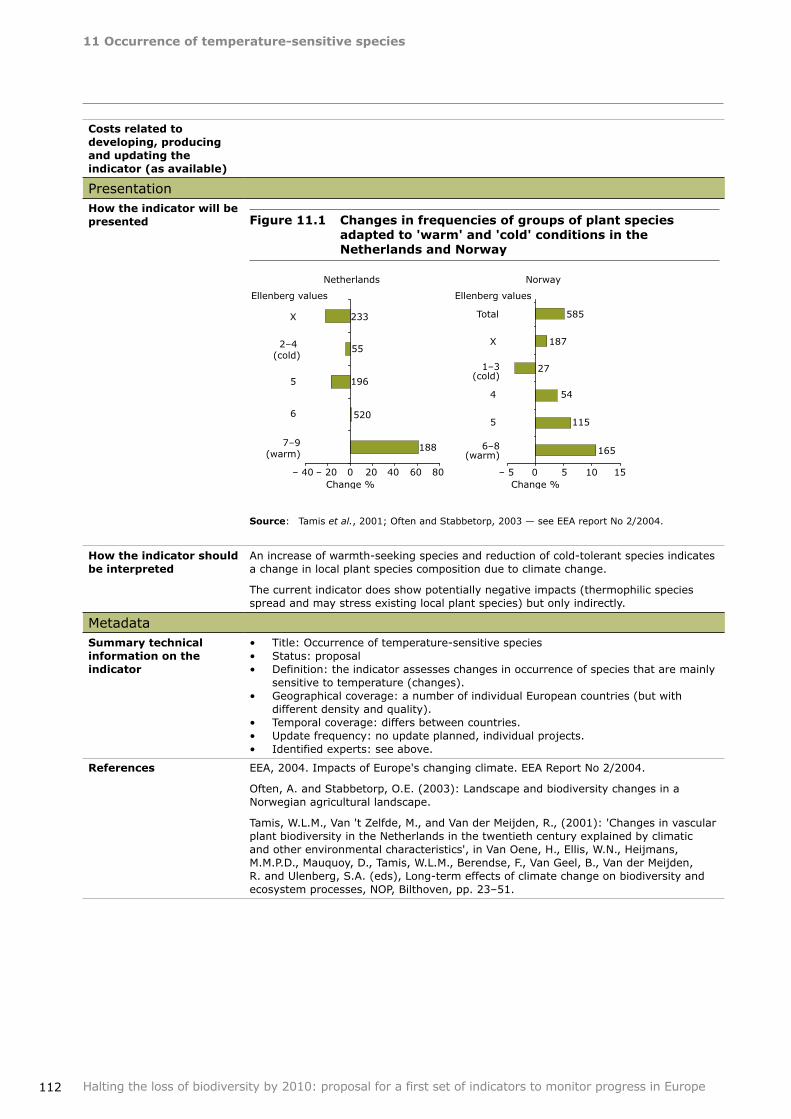
11Occurrenceoftemperature‑sensitivespecies
112 Halting the loss of biodiversity by 2010: proposal for a first set of indicators to monitor progress in Europe
Costsrelatedtodeveloping,producingandupdatingtheindicator(asavailable)
PresentationHowtheindicatorwillbepresented Figure11.1 Changesinfrequenciesofgroupsofplantspecies
adaptedto'warm'and'cold'conditionsintheNetherlandsandNorway
Source: Tamis et al., 2001; Often and Stabbetorp, 2003 — see EEA report No 2/2004.
Howtheindicatorshouldbeinterpreted
An increase of warmth‑seeking species and reduction of cold‑tolerant species indicates a change in local plant species composition due to climate change.
The current indicator does show potentially negative impacts (thermophilic species spread and may stress existing local plant species) but only indirectly.
MetadataSummarytechnicalinformationontheindicator
Title: Occurrence of temperature‑sensitive speciesStatus: proposalDefinition: the indicator assesses changes in occurrence of species that are mainly sensitive to temperature (changes).Geographical coverage: a number of individual European countries (but with different density and quality).Temporal coverage: differs between countries.Update frequency: no update planned, individual projects.Identified experts: see above.
•••
•
•••
References EEA, 2004. Impacts of Europe's changing climate. EEA Report No 2/2004.
Often, A. and Stabbetorp, O.E. (2003): Landscape and biodiversity changes in a Norwegian agricultural landscape.
Tamis, W.L.M., Van 't Zelfde, M., and Van der Meijden, R., (2001): 'Changes in vascular plant biodiversity in the Netherlands in the twentieth century explained by climatic and other environmental characteristics', in Van Oene, H., Ellis, W.N., Heijmans, M.M.P.D., Mauquoy, D., Tamis, W.L.M., Berendse, F., Van Geel, B., Van der Meijden, R. and Ulenberg, S.A. (eds), Long‑term effects of climate change on biodiversity and ecosystem processes, NOP, Bilthoven, pp. 23–51.
– 40 – 20 0 20 40 60 80
7–9(warm)
6
5
2–4 (cold)
X
Change %
188
520
196
55
233
Ellenberg values
Change %
Ellenberg values
– 5 0 5 10 15
6–8(warm)
5
4
1–3(cold)
X
Total
165
115
54
27
187
585
Netherlands Norway
113
12MarineTrophicIndexofEuropeanseas
Halting the loss of biodiversity by 2010: proposal for a first set of indicators to monitor progress in Europe
Focalarea Ecosystem Integrity and ecosystem goods and Services
Europeanindicatorheadline
Marine Trophic Index
Keypolicyquestion What is the impact of existing fisheries and maritime policies on the health of fish stocks in European seas?
Definition of the indicator
Trends in mean trophic levels of fisheries landings per European sea
Indicatortype(DPSIR) State
Context It has been suggested that high trophic levels reflect a high level of evolved biodiversity.
Preferred fish catches consist of large, high value predatory fishes, such as tuna, cod, sea bass and swordfish. The intensification of fishing has led to the decline of these large fishes, which are high up in the food chain. As predators are removed, the relative number of small fish and invertebrates lower in the food chain increases, and the mean trophic level (i.e. the mean position of the catch in the food chain) of fisheries landings, goes down.
Fisheries, since 1950, are increasingly relying on the smaller, short‑lived fish and on the invertebrates from the lower parts of both marine and freshwater food webs. If decline in trophic levels continues at the current rate, the preferred fish for human consumption will become increasingly rare, forcing a shift for fisheries and human consumption to smaller fish and invertebrates.
The mean trophic level of a species is a calculated value which reflects the species abundance balance across a trophic range from large long lived and slow growing predators to fast growing microscopic primary producers and is therefore a reflection of the biodiversity status of the system. It is derived by assigning a numerical trophic level to selected taxa, established by size, diet or nitrogen isotope levels.
Relationoftheindicatortothefocalarea
If decline in mean trophic levels of fisheries landings continues, the resulting smaller food chains leave marine ecosystems increasingly vulnerable to natural and human induced stresses, and reduce the overall supply of fish for human consumption. Thus the indicator is well suited to illustrate the focal area on ecosystem integrity and the provision of goods and services provided by biodiversity in support of human well being.
Data sources and methodologyDataavailability Available data for development of the Marine Trophic Index of European seas are
contained in:
1. FAO National Statistics landings data (1950–2005) separated in two areas: a) Northeast Atlantic (incl. the Baltic Sea); b) Mediterranean and Black Sea (http://www.fao.org/fi/website/FIRetrieveAction.do?xml=FIDI_STAT_org.xmlanddom=organdlang=enandxp_nav=3,1,2 ).
2. ICES‑EUROSTAT landings data (1973–2005) from the different ICES divisions (http://www.ices.dk/fish/statlant.asp).
3. Research vessel data on surveys in the ICES DATRAS database on fish surveys (http://www.ices.dk/datacentre/datras/public.asp).
Complementary data for further work for the European Seas can be used from national fisheries survey data and scientific sampling results related to fish size, diet or nitrogen isotope levels.
12 MarineTrophicIndexofEuropeanseas
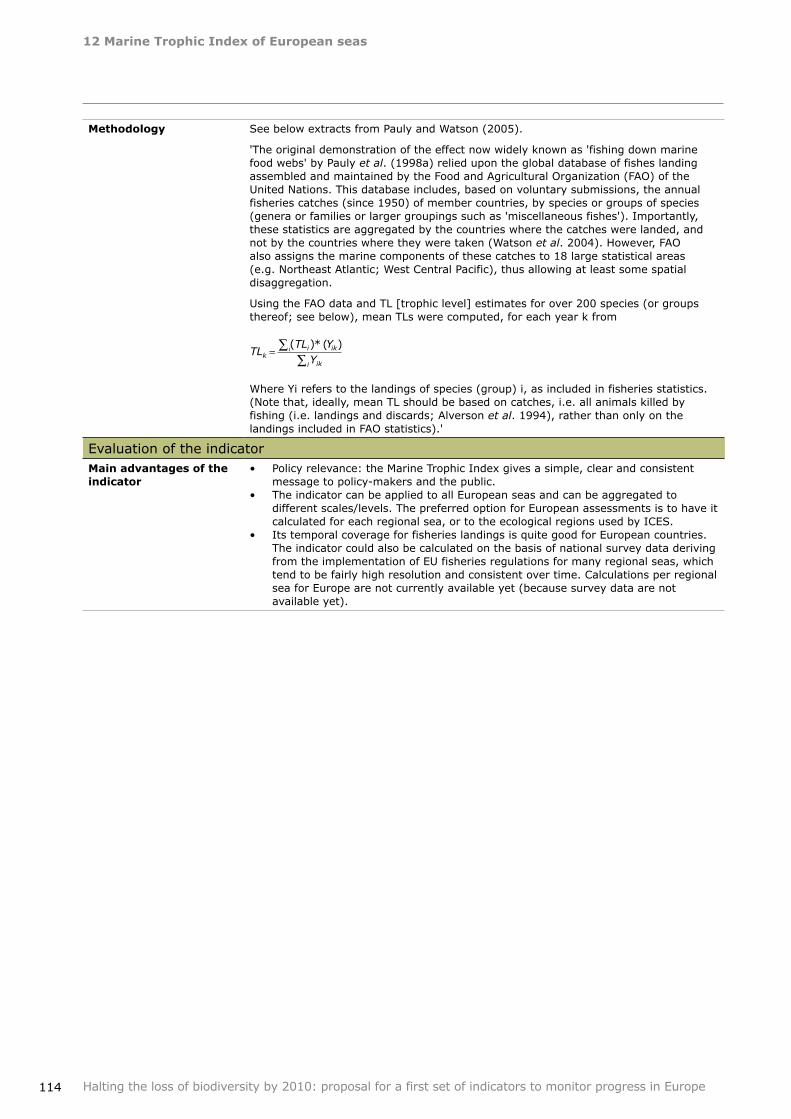
12MarineTrophicIndexofEuropeanseas
114 Halting the loss of biodiversity by 2010: proposal for a first set of indicators to monitor progress in Europe
Methodology See below extracts from Pauly and Watson (2005).
'The original demonstration of the effect now widely known as 'fishing down marine food webs' by Pauly et al. (1998a) relied upon the global database of fishes landing assembled and maintained by the Food and Agricultural Organization (FAO) of the United Nations. This database includes, based on voluntary submissions, the annual fisheries catches (since 1950) of member countries, by species or groups of species (genera or families or larger groupings such as 'miscellaneous fishes'). Importantly, these statistics are aggregated by the countries where the catches were landed, and not by the countries where they were taken (Watson et al. 2004). However, FAO also assigns the marine components of these catches to 18 large statistical areas (e.g. Northeast Atlantic; West Central Pacific), thus allowing at least some spatial disaggregation.
Using the FAO data and TL [trophic level] estimates for over 200 species (or groups thereof; see below), mean TLs were computed, for each year k from
Where Yi refers to the landings of species (group) i, as included in fisheries statistics. (Note that, ideally, mean TL should be based on catches, i.e. all animals killed by fishing (i.e. landings and discards; Alverson et al. 1994), rather than only on the landings included in FAO statistics).'
Evaluation of the indicatorMainadvantagesoftheindicator
Policy relevance: the Marine Trophic Index gives a simple, clear and consistent message to policy‑makers and the public. The indicator can be applied to all European seas and can be aggregated to different scales/levels. The preferred option for European assessments is to have it calculated for each regional sea, or to the ecological regions used by ICES.Its temporal coverage for fisheries landings is quite good for European countries. The indicator could also be calculated on the basis of national survey data deriving from the implementation of EU fisheries regulations for many regional seas, which tend to be fairly high resolution and consistent over time. Calculations per regional sea for Europe are not currently available yet (because survey data are not available yet).
•
•
•
TLTL YYki iki
iki
= ∑∑
( )* ( )
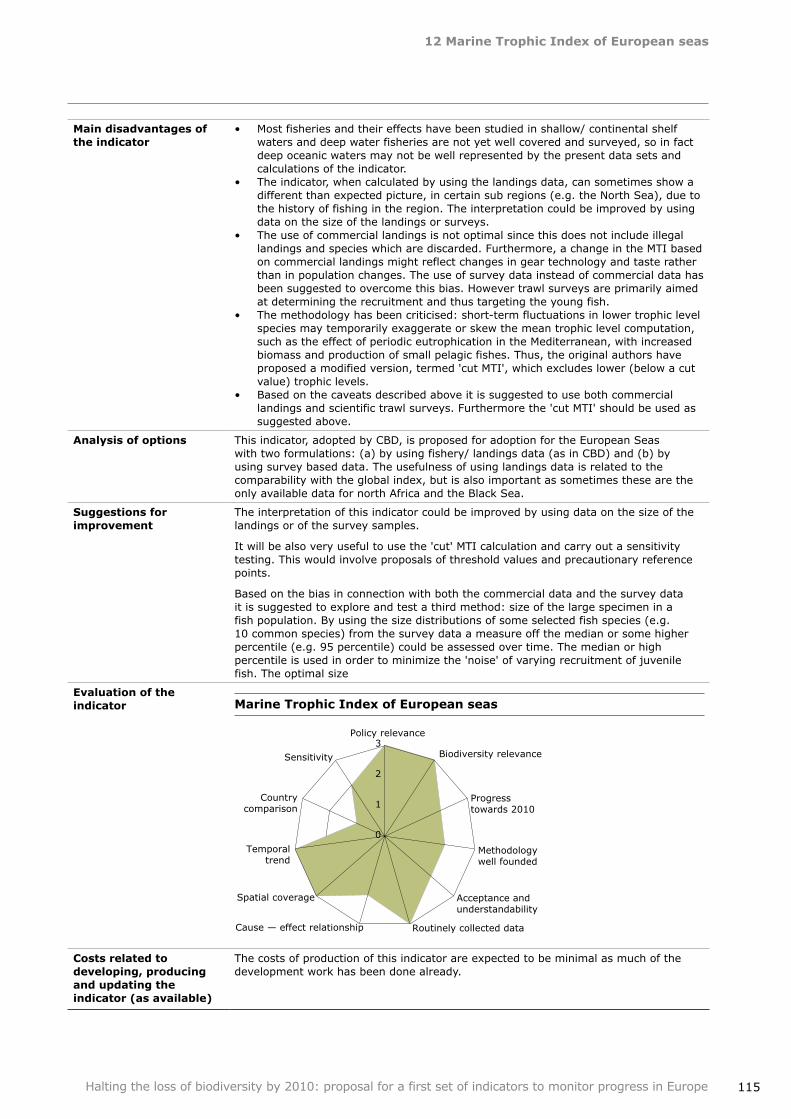
12MarineTrophicIndexofEuropeanseas
115Halting the loss of biodiversity by 2010: proposal for a first set of indicators to monitor progress in Europe
Maindisadvantagesoftheindicator
Most fisheries and their effects have been studied in shallow/ continental shelf waters and deep water fisheries are not yet well covered and surveyed, so in fact deep oceanic waters may not be well represented by the present data sets and calculations of the indicator. The indicator, when calculated by using the landings data, can sometimes show a different than expected picture, in certain sub regions (e.g. the North Sea), due to the history of fishing in the region. The interpretation could be improved by using data on the size of the landings or surveys. The use of commercial landings is not optimal since this does not include illegal landings and species which are discarded. Furthermore, a change in the MTI based on commercial landings might reflect changes in gear technology and taste rather than in population changes. The use of survey data instead of commercial data has been suggested to overcome this bias. However trawl surveys are primarily aimed at determining the recruitment and thus targeting the young fish. The methodology has been criticised: short‑term fluctuations in lower trophic level species may temporarily exaggerate or skew the mean trophic level computation, such as the effect of periodic eutrophication in the Mediterranean, with increased biomass and production of small pelagic fishes. Thus, the original authors have proposed a modified version, termed 'cut MTI', which excludes lower (below a cut value) trophic levels. Based on the caveats described above it is suggested to use both commercial landings and scientific trawl surveys. Furthermore the 'cut MTI' should be used as suggested above.
•
•
•
•
•
Analysisofoptions This indicator, adopted by CBD, is proposed for adoption for the European Seas with two formulations: (a) by using fishery/ landings data (as in CBD) and (b) by using survey based data. The usefulness of using landings data is related to the comparability with the global index, but is also important as sometimes these are the only available data for north Africa and the Black Sea.
Suggestionsforimprovement
The interpretation of this indicator could be improved by using data on the size of the landings or of the survey samples.
It will be also very useful to use the 'cut' MTI calculation and carry out a sensitivity testing. This would involve proposals of threshold values and precautionary reference points.
Based on the bias in connection with both the commercial data and the survey data it is suggested to explore and test a third method: size of the large specimen in a fish population. By using the size distributions of some selected fish species (e.g. 10 common species) from the survey data a measure off the median or some higher percentile (e.g. 95 percentile) could be assessed over time. The median or high percentile is used in order to minimize the 'noise' of varying recruitment of juvenile fish. The optimal size
Evaluationoftheindicator MarineTrophicIndexofEuropeanseas
Costsrelatedtodeveloping,producingandupdatingtheindicator(asavailable)
The costs of production of this indicator are expected to be minimal as much of the development work has been done already.
0
1
2
3 Policy relevance
Biodiversity relevance
Progress towards 2010
Methodology well founded
Acceptance and understandability
Routinely collected data Cause — effect relationship
Spatial coverage
Temporal trend
Country comparison
Sensitivity
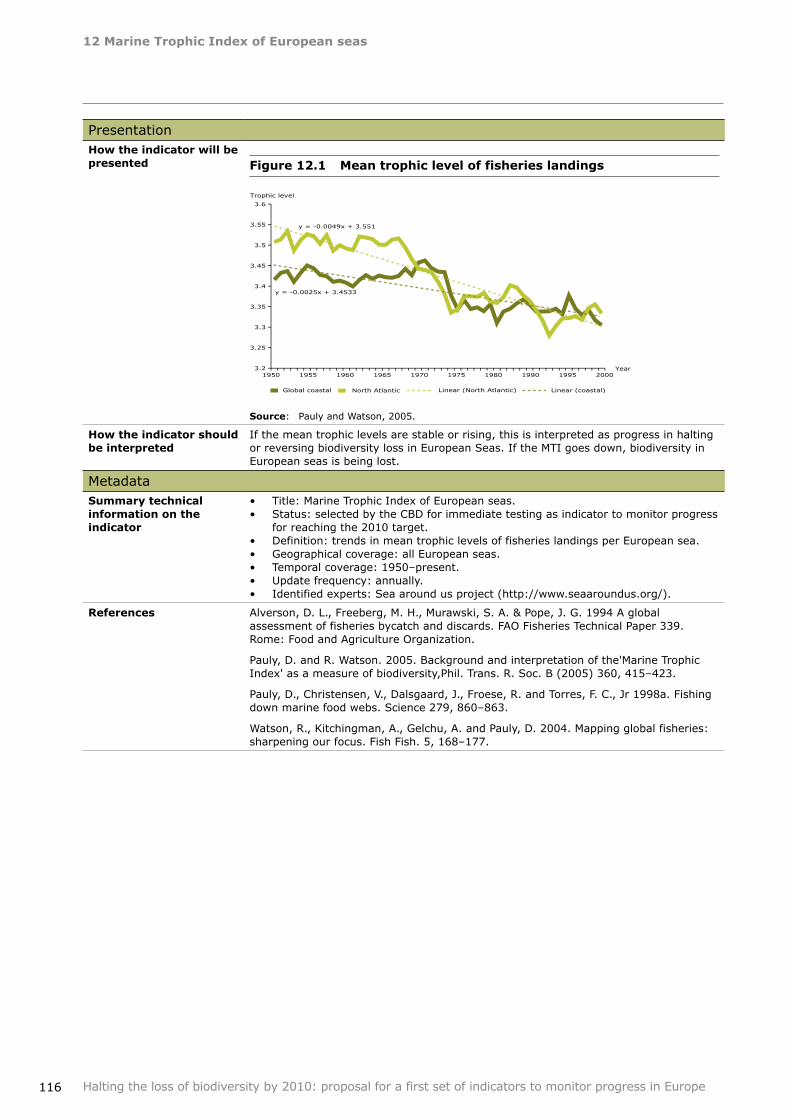
12MarineTrophicIndexofEuropeanseas
116 Halting the loss of biodiversity by 2010: proposal for a first set of indicators to monitor progress in Europe
PresentationHowtheindicatorwillbepresented Figure12.1 Meantrophicleveloffisherieslandings
Source: Pauly and Watson, 2005.
Howtheindicatorshouldbeinterpreted
If the mean trophic levels are stable or rising, this is interpreted as progress in halting or reversing biodiversity loss in European Seas. If the MTI goes down, biodiversity in European seas is being lost.
MetadataSummarytechnicalinformationontheindicator
Title: Marine Trophic Index of European seas.Status: selected by the CBD for immediate testing as indicator to monitor progress for reaching the 2010 target.Definition: trends in mean trophic levels of fisheries landings per European sea.Geographical coverage: all European seas.Temporal coverage: 1950–present.Update frequency: annually.Identified experts: Sea around us project (http://www.seaaroundus.org/).
••
•••••
References Alverson, D. L., Freeberg, M. H., Murawski, S. A. & Pope, J. G. 1994 A global assessment of fisheries bycatch and discards. FAO Fisheries Technical Paper 339. Rome: Food and Agriculture Organization.
Pauly, D. and R. Watson. 2005. Background and interpretation of the'Marine Trophic Index' as a measure of biodiversity,Phil. Trans. R. Soc. B (2005) 360, 415–423.
Pauly, D., Christensen, V., Dalsgaard, J., Froese, R. and Torres, F. C., Jr 1998a. Fishing down marine food webs. Science 279, 860–863.
Watson, R., Kitchingman, A., Gelchu, A. and Pauly, D. 2004. Mapping global fisheries: sharpening our focus. Fish Fish. 5, 168–177.
y = -0.0049x + 3.551
y = -0.0025x + 3.4533
3.2
3.25
3.3
3.35
3.4
3.45
3.5
3.55
3.6
1950 1955 1960 1965 1970 1975 1980 1990 1995 2000 Year
Trophic level
Global coastal North Atlantic Linear (North Atlantic) Linear (coastal)
117
13Fragmentationofnaturalandsemi‑naturalareas
Halting the loss of biodiversity by 2010: proposal for a first set of indicators to monitor progress in Europe
Focalarea Ecosystem integrity and ecosystem goods and services
Europeanindicatorheadline
Connectivity/ Fragmentation of ecosystems
Keypolicyquestion How fragmented are European natural and semi natural landscapes, and what can be done to preserve biodiversity despite fragmentation?
Definition of the indicator
The indicator shows the change in average size of patches of natural and semi natural areas, on the basis of land cover maps produced by photo‑interpretation of satellite imagery.
Indicatortype(DPSIR) Pressure
Context The indicator is intended to address the question of ecosystem integrity by providing a measurement of 'disintegration' of the countryside across Europe.
Land use in Europe has changed substantially during the past century. The changes in land use have in turn affected the size of natural and semi‑natural patches of land and have introduced fast growing fragmentation of the wider countryside. This indicator gives information on the trends in patch size of natural and semi natural areas at the pan‑European level, by calculation of values derived from land cover maps.
Land cover maps are developed from satellite imagery based on the spectral properties of each pixel within a scene. For this indicator we use data from the Corine land cover database (CooRdinate Information on the Environment — Corine). The CLC data are based on 44 land cover classes of which 26 are considered as natural and semi natural for the purpose of this indicator (see Annex 1). These can be grouped into forests, pasture, agricultural mosaics, semi‑natural land, inland waters and wetlands.
By calculation of size values for areas belonging to these land cover classes, we have information on the extent of fragmentation which has occurred in the natural and semi‑natural areas, within the limitations of the CLC data (see Section on main disadvantages).
Relationoftheindicatortothefocalarea
Natural and semi‑natural areas represent an important integrity component of any given ecosystem, by supporting the full range of ecosystem services and the majority of species and habitats to be found in this type of ecosystem. If the size of such areas decreases, the integrity of the whole ecosystem is at risk. This in turn might affect the potential of the given ecosystem to deliver goods and services.
Data sources and methodologyDataavailability 1. The indicator can be produced immediately with CLC1990 and 2000; and updated
with CLC2006. The CLC is based on photo interpretation of satellite images (Landsat 7) by national teams in participating countries. The resulting national land cover inventories are integrated into a European database based on standard methodology and nomenclature with 44 classes, from urban areas to seas.
CLC data are at present available from the following 23 countries in Europe: Austria, Belgium, Bulgaria, Czech Republic, Germany, Denmark, Estonia, Spain, France, Greece, Hungary, Ireland, Italy, Lithuania, Luxembourg, Latvia, The Netherlands, Poland, Portugal, Romania, Slovenia, Slovakia and United Kingdom.
Retrospective analysis (back to 1975) for European coasts and 4 PHARE countries is also possible.
2. The use of GLC (Global Land Cover) 2000 with its next version for pan‑Europe is also possible.
13 Fragmentationofnaturalandsemi‑naturalareas
13Fragmentationofnaturalandsemi‑naturalareas
118 Halting the loss of biodiversity by 2010: proposal for a first set of indicators to monitor progress in Europe
Methodology Natural and semi‑natural areas are represented by selected land cover categories which are forests, pasture, agricultural mosaics, semi‑natural land, inland waters and wetlands. For a given region/ country, the change in average patch size of the selected land cover categories is the difference between two dates in their mean value, calculated as their quadratic mean.
The indicator is produced by using a simple mathematical calculation, the quadratic mean between the mean values of the patch size of a given area between two dates. By using the quadratic mean, the size of the individual objects matters as much as their number: in most cases, strong fragmentation of the larger areas matters more than fragmentation of small ones. At the same time, when a small patch in an area disappears completely (in time 2), the mean value for that area will be greater than at the time it was still present (time 1), unless the number of patches (n) in time 2 can not be less than in time 1. That means that patches with size = 0 have to be taken into account too.
The Quadratic Mean or Root Mean Square (RMS) is the square root of the mean square value of a variable so it is a statistical measure of the magnitude of a varying quantity. It can be calculated for a series of discrete values or for a continuously varying function, using the following formula:
Quadratic Mean or Root Mean Square = SQRT (1/n ((X1)² + (X2)² + (X3)² +........+ (Xn)² ) where X = Individual score and n = Sample size (number of scores or units)
The values are calculated from the available Corine land cover data following the selection of classes considered as natural or semi‑natural areas. The classes proposed here are listed in Annex 1.
Calculation can be done by NUTS level 2 or 3, or by river basin, as well as by country and biogeographical zone. The analysis can be done separately for different classes of patch size (e.g. large, medium and small), in order to capture specific trends and avoid some bias mentioned previously. The analysis can also be performed as aggregated for all selected classes (e.g. those selected for the Green Background Index, see EEA, 2006) or separately by broad habitat types (proxy: land cover types).
Evaluation of the indicatorMainadvantagesoftheindicator
Methodology: this indicator is based on a simple methodology including mathematical calculations and GIS analyses on the Corine land cover data (CLC).Biodiversity relevance: the indicator has a high relevance for biodiversity because it indicates changes in the patch size of natural and semi‑natural areas of any type of ecosystem across Europe. If the patch size of these areas decreases drastically it will have a negative influence on the habitat types present and the species dependent on these habitat types.Geographical and temporal coverage: Corine land cover data is available from 23 EU Member States (see metadata for full list). For these 23 countries, data are available as two data points i.e. year 1990 and 2000. For details on temporal coverage per country, see http://dataservice.eea.europa.eu/download.asp?id=16336andfiletype=.pdf. The data can provide for country benchmarking. Additional countries have joined the network and have a first data point in 2000. With an updated CLC2010 more countries can therefore be assessed, some with three data points, others with two. The next update of Corine land cover data will be for the year 2006.
•
•
•
Maindisadvantagesoftheindicator
Methodology: one remaining difficulty with the use of the quadratic mean is with the mere disappearance of small areas (smaller than the arithmetic average) which pushes the indicator up. This means that in the case of smaller areas disappearing completely, which should be interpreted as a loss of diversity in the landscape, it may be expected that the larger areas have increased in size and this will be then interpreted as a positive sign for biodiversity.This can be neglected when dealing with a large number of areas but it may be a problem with a small number of units and a high standard deviation. But even in that case, the distortion is less important with the quadratic mean than with the arithmetic average. A second remark is that this highlights again the multimodal character of the distribution: averaging large areas with small areas is to some extent arbitrary and should be kept to the purpose of a high level indicator only.Data set resolution: the main disadvantage of using the CLC data set is that fragmentation occurring below the threshold of minimum resolution of 25 Ha is not detectable. The CLC data however are the best available at present to cover large areas of Europe in a harmonised way.Biodiversity relevance: the indicator does not provide direct information on the impact of habitat fragmentation on the status of species populations.
•
•
•
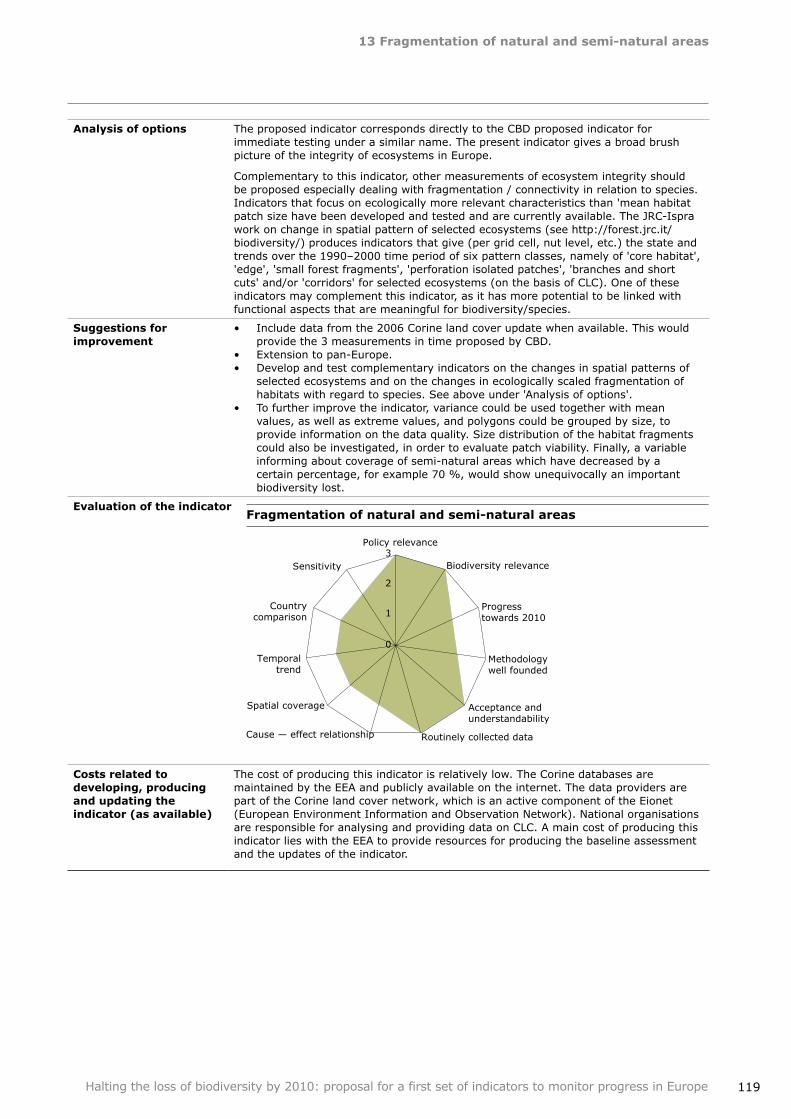
13Fragmentationofnaturalandsemi‑naturalareas
119Halting the loss of biodiversity by 2010: proposal for a first set of indicators to monitor progress in Europe
Analysisofoptions The proposed indicator corresponds directly to the CBD proposed indicator for immediate testing under a similar name. The present indicator gives a broad brush picture of the integrity of ecosystems in Europe.
Complementary to this indicator, other measurements of ecosystem integrity should be proposed especially dealing with fragmentation / connectivity in relation to species. Indicators that focus on ecologically more relevant characteristics than 'mean habitat patch size have been developed and tested and are currently available. The JRC‑Ispra work on change in spatial pattern of selected ecosystems (see http://forest.jrc.it/biodiversity/) produces indicators that give (per grid cell, nut level, etc.) the state and trends over the 1990–2000 time period of six pattern classes, namely of 'core habitat', 'edge', 'small forest fragments', 'perforation isolated patches', 'branches and short cuts' and/or 'corridors' for selected ecosystems (on the basis of CLC). One of these indicators may complement this indicator, as it has more potential to be linked with functional aspects that are meaningful for biodiversity/species.
Suggestionsforimprovement
Include data from the 2006 Corine land cover update when available. This would provide the 3 measurements in time proposed by CBD.Extension to pan‑Europe.Develop and test complementary indicators on the changes in spatial patterns of selected ecosystems and on the changes in ecologically scaled fragmentation of habitats with regard to species. See above under 'Analysis of options'.To further improve the indicator, variance could be used together with mean values, as well as extreme values, and polygons could be grouped by size, to provide information on the data quality. Size distribution of the habitat fragments could also be investigated, in order to evaluate patch viability. Finally, a variable informing about coverage of semi‑natural areas which have decreased by a certain percentage, for example 70 %, would show unequivocally an important biodiversity lost.
•
••
•
Evaluationoftheindicator
Costsrelatedtodeveloping,producingandupdatingtheindicator(asavailable)
The cost of producing this indicator is relatively low. The Corine databases are maintained by the EEA and publicly available on the internet. The data providers are part of the Corine land cover network, which is an active component of the Eionet (European Environment Information and Observation Network). National organisations are responsible for analysing and providing data on CLC. A main cost of producing this indicator lies with the EEA to provide resources for producing the baseline assessment and the updates of the indicator.
0
1
2
3 Policy relevance
Biodiversity relevance
Progress towards 2010
Methodology well founded
Acceptance and understandability
Routinely collected data Cause — effect relationship
Spatial coverage
Temporal trend
Country comparison
Sensitivity
Fragmentationofnaturalandsemi‑naturalareas
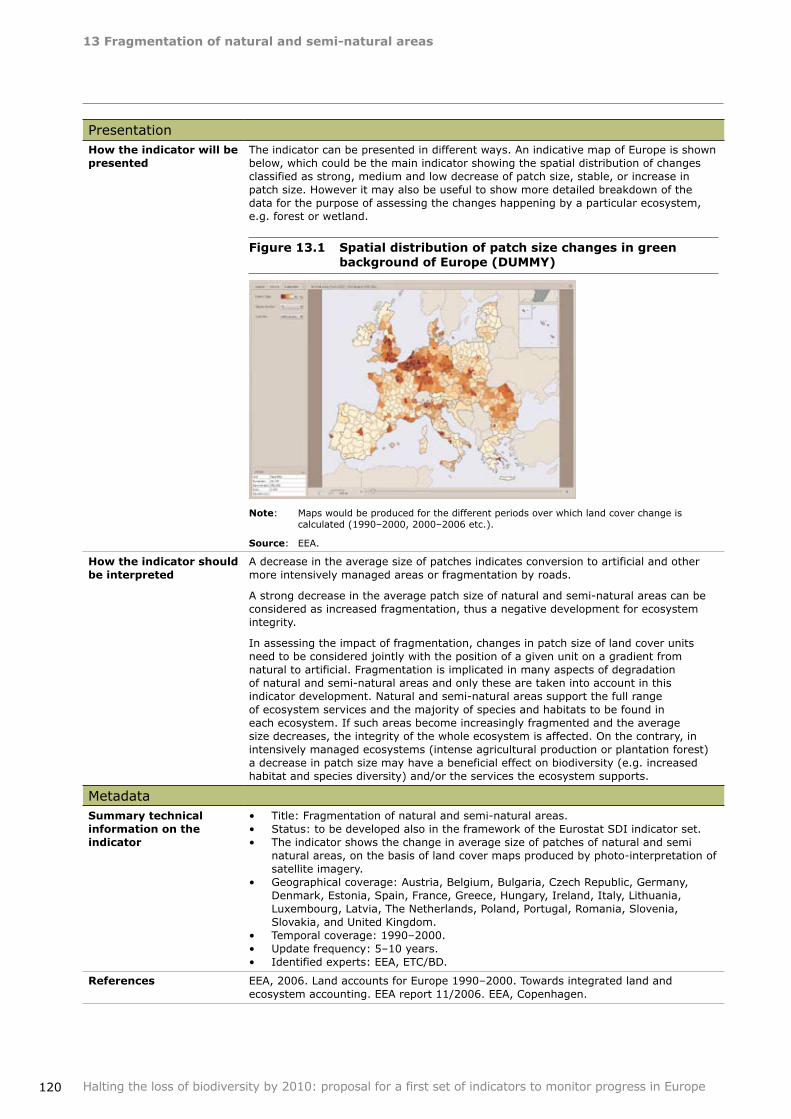
13Fragmentationofnaturalandsemi‑naturalareas
120 Halting the loss of biodiversity by 2010: proposal for a first set of indicators to monitor progress in Europe
PresentationHowtheindicatorwillbepresented
The indicator can be presented in different ways. An indicative map of Europe is shown below, which could be the main indicator showing the spatial distribution of changes classified as strong, medium and low decrease of patch size, stable, or increase in patch size. However it may also be useful to show more detailed breakdown of the data for the purpose of assessing the changes happening by a particular ecosystem, e.g. forest or wetland.
Figure13.1 SpatialdistributionofpatchsizechangesingreenbackgroundofEurope(DUMMY)
Note: Maps would be produced for the different periods over which land cover change is calculated (1990–2000, 2000–2006 etc.).
Source: EEA.
Howtheindicatorshouldbeinterpreted
A decrease in the average size of patches indicates conversion to artificial and other more intensively managed areas or fragmentation by roads.
A strong decrease in the average patch size of natural and semi‑natural areas can be considered as increased fragmentation, thus a negative development for ecosystem integrity.
In assessing the impact of fragmentation, changes in patch size of land cover units need to be considered jointly with the position of a given unit on a gradient from natural to artificial. Fragmentation is implicated in many aspects of degradation of natural and semi‑natural areas and only these are taken into account in this indicator development. Natural and semi‑natural areas support the full range of ecosystem services and the majority of species and habitats to be found in each ecosystem. If such areas become increasingly fragmented and the average size decreases, the integrity of the whole ecosystem is affected. On the contrary, in intensively managed ecosystems (intense agricultural production or plantation forest) a decrease in patch size may have a beneficial effect on biodiversity (e.g. increased habitat and species diversity) and/or the services the ecosystem supports.
MetadataSummarytechnicalinformationontheindicator
Title: Fragmentation of natural and semi‑natural areas.Status: to be developed also in the framework of the Eurostat SDI indicator set.The indicator shows the change in average size of patches of natural and semi natural areas, on the basis of land cover maps produced by photo‑interpretation of satellite imagery. Geographical coverage: Austria, Belgium, Bulgaria, Czech Republic, Germany, Denmark, Estonia, Spain, France, Greece, Hungary, Ireland, Italy, Lithuania, Luxembourg, Latvia, The Netherlands, Poland, Portugal, Romania, Slovenia, Slovakia, and United Kingdom. Temporal coverage: 1990–2000.Update frequency: 5–10 years.Identified experts: EEA, ETC/BD.
•••
•
•••
References EEA, 2006. Land accounts for Europe 1990–2000. Towards integrated land and ecosystem accounting. EEA report 11/2006. EEA, Copenhagen.
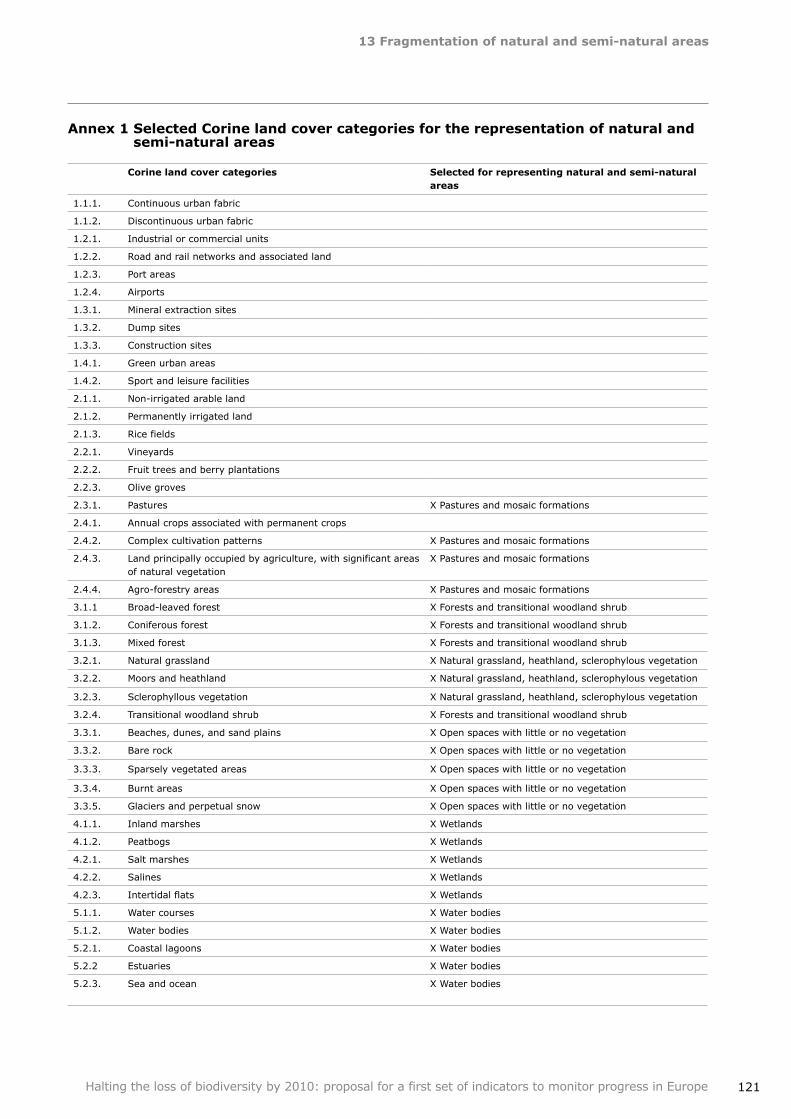
13Fragmentationofnaturalandsemi‑naturalareas
121Halting the loss of biodiversity by 2010: proposal for a first set of indicators to monitor progress in Europe
Annex1SelectedCorinelandcovercategoriesfortherepresentationofnaturalandsemi‑naturalareas
Corinelandcovercategories Selectedforrepresentingnaturalandsemi‑naturalareas
1.1.1. Continuous urban fabric
1.1.2. Discontinuous urban fabric
1.2.1. Industrial or commercial units
1.2.2. Road and rail networks and associated land
1.2.3. Port areas
1.2.4. Airports
1.3.1. Mineral extraction sites
1.3.2. Dump sites
1.3.3. Construction sites
1.4.1. Green urban areas
1.4.2. Sport and leisure facilities
2.1.1. Non‑irrigated arable land
2.1.2. Permanently irrigated land
2.1.3. Rice fields
2.2.1. Vineyards
2.2.2. Fruit trees and berry plantations
2.2.3. Olive groves
2.3.1. Pastures X Pastures and mosaic formations
2.4.1. Annual crops associated with permanent crops
2.4.2. Complex cultivation patterns X Pastures and mosaic formations
2.4.3. Land principally occupied by agriculture, with significant areas of natural vegetation
X Pastures and mosaic formations
2.4.4. Agro‑forestry areas X Pastures and mosaic formations
3.1.1 Broad‑leaved forest X Forests and transitional woodland shrub
3.1.2. Coniferous forest X Forests and transitional woodland shrub
3.1.3. Mixed forest X Forests and transitional woodland shrub
3.2.1. Natural grassland X Natural grassland, heathland, sclerophylous vegetation
3.2.2. Moors and heathland X Natural grassland, heathland, sclerophylous vegetation
3.2.3. Sclerophyllous vegetation X Natural grassland, heathland, sclerophylous vegetation
3.2.4. Transitional woodland shrub X Forests and transitional woodland shrub
3.3.1. Beaches, dunes, and sand plains X Open spaces with little or no vegetation
3.3.2. Bare rock X Open spaces with little or no vegetation
3.3.3. Sparsely vegetated areas X Open spaces with little or no vegetation
3.3.4. Burnt areas X Open spaces with little or no vegetation
3.3.5. Glaciers and perpetual snow X Open spaces with little or no vegetation
4.1.1. Inland marshes X Wetlands
4.1.2. Peatbogs X Wetlands
4.2.1. Salt marshes X Wetlands
4.2.2. Salines X Wetlands
4.2.3. Intertidal flats X Wetlands
5.1.1. Water courses X Water bodies
5.1.2. Water bodies X Water bodies
5.2.1. Coastal lagoons X Water bodies
5.2.2 Estuaries X Water bodies
5.2.3. Sea and ocean X Water bodies
122
14Fragmentationofriversystems
Halting the loss of biodiversity by 2010: proposal for a first set of indicators to monitor progress in Europe
Focalarea Ecosystem integrity and ecosystem goods and services
Europeanindicatorheadline
Connectivity/ fragmentation of ecosystems
Keypolicyquestion How fragmented are rivers in Europe, thus potentially affecting the fish species living in them? How can rivers be used in a way that limits threats to biodiversity?
Definition of the indicator
The indicator shows in spatial and quantitative terms, fragmentation due to the presence of artificial structures that a) may affect the passage of migratory fish and so restrict their range and/or abundance and b) changes substantially the natural habitat distribution within rivers and modify their ecological capacity.
It thus describes the difference between the potential range and actual range of migratory fish in river systems due to artificial obstacles on the one hand and the change in habitats on the other hand.
Indicatortype(DPSIR) Pressure
Context To be healthy, fish communities require free access to river systems and healthy rivers that offer the different ranges of habitats required to fulfill their life cycles. River fragmentation is understood as more threatening to fish (aquatic) communities than pollution.
All fish species migrate in the water system. Most are short‑distance migrants with requirements in the range of 10 to some 100 km Some are amphibiotic and their life cycle requires journeying between sea and specific rivers. For example, anadromous migratory fish (adults living in the sea and migrating up rivers to spawn in freshwater), such as Atlantic salmon (Salmo salar) and sea trout (Salmo trutta), rely for their movement and life cycle upon a favourable conservation status of their waterbodies, including unimpeded access to freshwater spawning sites and adequate river conditions during their fresh‑water life. The European eel (Anguilla anguilla) is catadromous (migrating to the sea to spawn and growing in rivers), and relies similarly on movement between the sea where it breeds and within the rivers in which it grows. Obstacles of any kind (dams, cascades, diversions, quality, etc.) affect not only the movement of fish but other groups as well (invertebrates, mammals, plants, etc.).
Several types of habitat modification alter fish populations. A key change is related to the presence of numerous small dams, changing flowing rivers into stretches of river with still water conditions. Even though fish may actually pass the dam wall, they may find adverse living conditions upstream, which may make passing facilities ineffective at the population level.
All causes together alter fish communities by disrupting their structures (size components of the community, functional groups, species diversity and relative abundance) and in extreme cases result in the extinction of a population or even of the species.
Due to data constraints, the first produced indicators will be biased: non‑large dams in the height range of 2.5 to 14 meters are impervious to fish journeying upstream; hence they have to be considered as a minimum pressure (underestimated) and not actual pressure. In parallel, comparisons with catchments where all dams are registered will be carried out.
Relationoftheindicatortothefocalarea
Unfragmented rivers support a full range of ecosystem services and the majority of species and habitats within the river. Fragmentation decreases the size of undisturbed rivers and puts the integrity of the ecosystem at risk. This in turn might affect the potential of the river to deliver services.
14 Fragmentationofriversystems
14Fragmentationofriversystems
123Halting the loss of biodiversity by 2010: proposal for a first set of indicators to monitor progress in Europe
Data sources and methodologyDataavailability 1. A geometrically accurate, comprehensive, connected and routed GIS river
system, currently under construction from the Eurogeographics data sets and use of CCM2 (Catchment Characterisation and Modelling) layer made by the JRC.
2. Historical extension of migratory fish in European rivers. The data is not currently available for all dates in the past. The envisaged key periods to consider are 16–17th centuries (negligible damming before) , 19th (strong change in damming rate), to be completed by present analysis of its extension. The ETC/BD coordinates data collection from national sources.
3. The position and equipment (e.g. fish ladders) of all obstacles in rivers.
Three potential sources of information for Europe are a database of large dams (as built and continuously updated by the EEA from ICOLD (International Commissions on large dams), the risk assessment and water body characterisation results as provided for the Water Framework Directive, that has to be collected and the national data sets built in each country to fulfil WFD requirements and for other purposes. This last source is important because it comprises all the partly surmountable dams whose accumulation results in total locking of rivers and major changes in river habitats.
Methodology The CBD Subsidiary Body on Scientific, Technical and Technological Advice (SBSTTA) has reported on river fragmentation globally (UNEP/CBD/SBSTTA/10/INF/20, 17 December 2004), based on a fragmentation analysis by the World Resources Institute.
The French authorities, with special mention to the Loire‑Bretagne Water Agency has developed a specific approach and carried out surveys on the Loire and Britany systems where LIFE supports Atlantic salmon and European eel habitat and population restorations.
The current development carried out at the EEA consists of implementing in a geographical database system the calculation of migratory routes and the impact of the three variables that affect migration of any kind and apply in both directions:
Permeability (multiplicative function expressed as % of passing per obstacle), depending on fish biology and obstacle features. This expresses whether or not a population can reach a target area;Delay (additive function expressing time needed to pass one obstacle), expressing if the targeted area is reached in due time;Fatigue (subtractive function expressing the decrease in physiological status resulting from passing one obstacle), expressing if the fish reaches its target in acceptable condition.
The variables apply individually or jointly on a river system for each species and allow assessing chains of small obstacles. The simplest application consists in assessing to what extent it is possible to access the spawning areas for anadromous fish along time, only based on permeability of large dams.
In a first step, the indicator focuses on the difference between the potential range and actual range of migratory fish in river systems due to artificial barriers and on the change of river structure resulting from works. Salmonids are the most emblematic fishes whose reproductive migration is jeopardised by physical obstacles. Their requirements and routes are the best documented.
By locating and counting the obstacles (large dams first, abstractions and small dams in a second step), the indicator defines the difference between the potential extension and actual range of migratory fish in river systems due to man‑made obstacles. The indicator of passing considers both directions of migration because most obstacles do not have a symmetric impact on movement — they may not pose a problem for upstream movement but a problem for downstream movement, or vice versa.
•
•
•
14Fragmentationofriversystems
124 Halting the loss of biodiversity by 2010: proposal for a first set of indicators to monitor progress in Europe
Evaluation of the indicatorMainadvantagesoftheindicator
This is a direct measure of the impact of fragmentation on biodiversity which is both policy‑relevant and resonant with the general public.The second part of the indicator aims at capturing the silent effects of river damming to avoid ill‑targeted policy responses (imposing fish ladders everywhere for example) disregarding the habitat destruction resulting from impoundment.
•
•
Maindisadvantagesoftheindicator
From a policy point of view, the absence of explicit targets makes the status assessment possibly controversial (what is the acceptable or sustainable degree of fragmentation vs. the advantages of water impoundment, hydropower production, flood protection, etc?). However, it is the absence of addressing the issue that is the cause of existing gaps in policy that might be documented by the development of the indicators.Data availability: the lack of comprehensive data sets makes it necessary to model most descriptors. To tackle this issue, the model application has been featured with scenario capabilities that facilitate discussion with experts, confrontation of results and improvements.The possible uncertainty (possibly inaccurate indicator) that results from considering either only large rivers or all rivers systems is unknown: for example Atlantic salmon, the most 'tolerant' to obstacles, can be eradicated by dams on small rivers where its spawning areas are situated even though the main river stems are free of obstacles. Hence, a large bias might be experienced if, at the European scale, an arbitrary threshold on data collection is used, for any reason.The large dams represent a subset of obstacles because most dams in the range of 10– 15 m high are not recorded as large dams and none below 10 m height should be. In number, large dams represent about 10 % only of the total number of dams potentially making obstacles. Hence, at the country scale, these are likely to miss many smaller structures of importance in rivers and streams, such as the accumulation of flow across catchments from diversion reservoirs. They should be investigated, e.g. through the Water Framework Directive risk assessments as a starting point.
•
•
•
•
Analysisofoptions Fish is only one dimension of river fragmentation impacts, along with changes in sediment flow and alteration of hydrological cycles. The environmental impacts must be addressed as well because meeting the targets of renewable energy triggers the development of small hydropower plants. These other dimensions however are less directly relevant to biodiversity.
Migratory fish populations may be influenced by a range of pressures and management measures, at sea and within rivers. As a wider biodiversity indicator, the status of fish populations in river systems should be assessed (e.g. as under the Water Framework Directive/Natura 2000 riverine habitats).
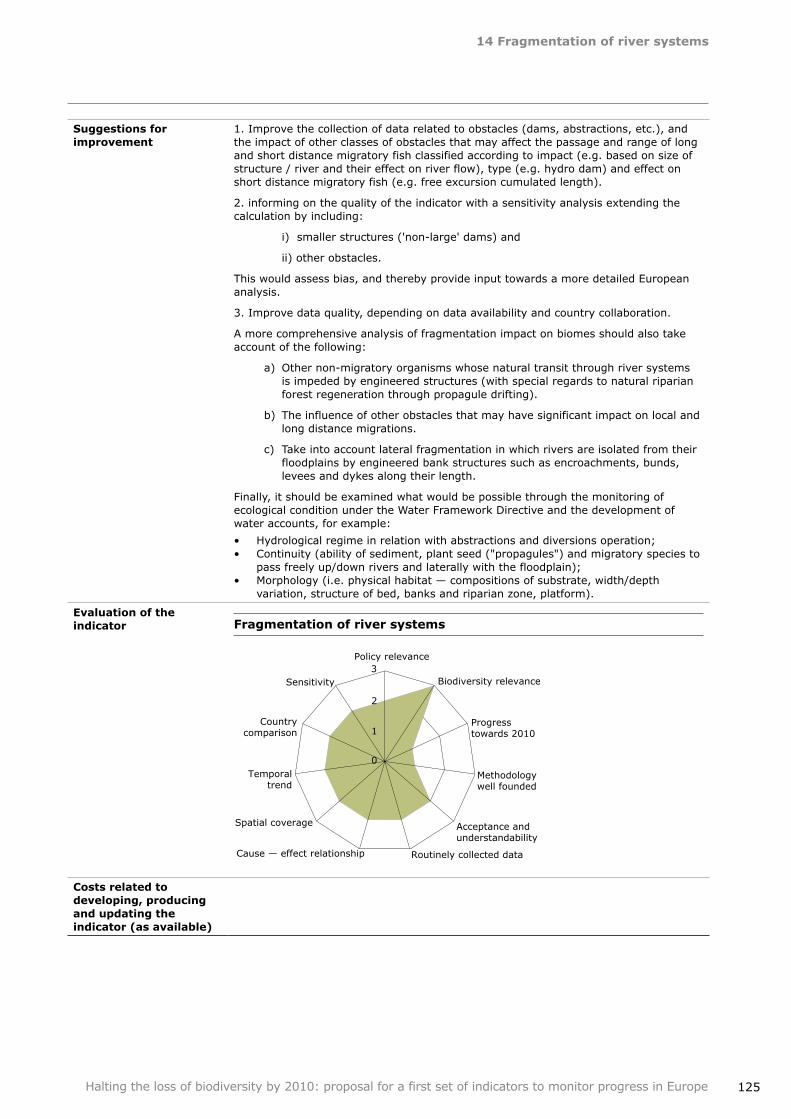
14Fragmentationofriversystems
125Halting the loss of biodiversity by 2010: proposal for a first set of indicators to monitor progress in Europe
Suggestionsforimprovement
1. Improve the collection of data related to obstacles (dams, abstractions, etc.), and the impact of other classes of obstacles that may affect the passage and range of long and short distance migratory fish classified according to impact (e.g. based on size of structure / river and their effect on river flow), type (e.g. hydro dam) and effect on short distance migratory fish (e.g. free excursion cumulated length).
2. informing on the quality of the indicator with a sensitivity analysis extending the calculation by including:
i) smaller structures ('non‑large' dams) and
ii) other obstacles.
This would assess bias, and thereby provide input towards a more detailed European analysis.
3. Improve data quality, depending on data availability and country collaboration.
A more comprehensive analysis of fragmentation impact on biomes should also take account of the following:
a) Other non‑migratory organisms whose natural transit through river systems is impeded by engineered structures (with special regards to natural riparian forest regeneration through propagule drifting).
b) The influence of other obstacles that may have significant impact on local and long distance migrations.
c) Take into account lateral fragmentation in which rivers are isolated from their floodplains by engineered bank structures such as encroachments, bunds, levees and dykes along their length.
Finally, it should be examined what would be possible through the monitoring of ecological condition under the Water Framework Directive and the development of water accounts, for example:
Hydrological regime in relation with abstractions and diversions operation; Continuity (ability of sediment, plant seed ("propagules") and migratory species to pass freely up/down rivers and laterally with the floodplain); Morphology (i.e. physical habitat — compositions of substrate, width/depth variation, structure of bed, banks and riparian zone, platform).
••
•
Evaluationoftheindicator Fragmentationofriversystems
Costsrelatedtodeveloping,producingandupdatingtheindicator(asavailable)
0
1
2
3 Policy relevance
Biodiversity relevance
Progress towards 2010
Methodology well founded
Acceptance and understandability
Routinely collected data Cause — effect relationship
Spatial coverage
Temporal trend
Country comparison
Sensitivity
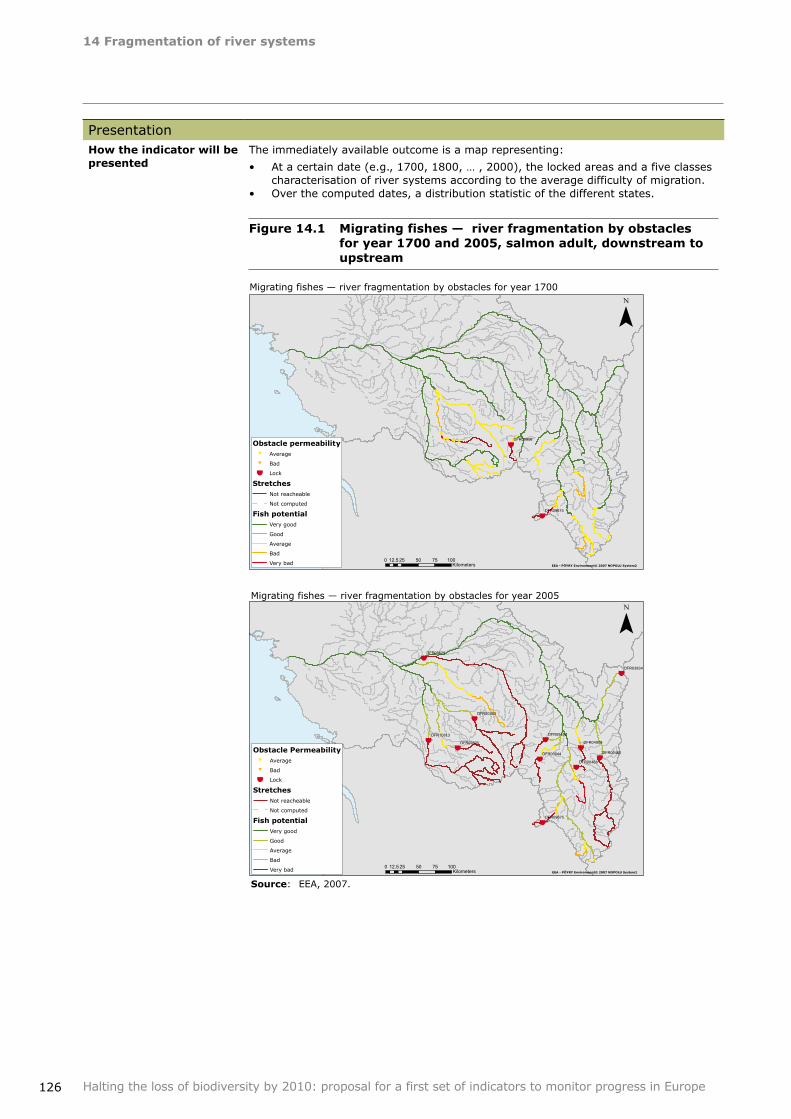
14Fragmentationofriversystems
126 Halting the loss of biodiversity by 2010: proposal for a first set of indicators to monitor progress in Europe
PresentationHowtheindicatorwillbepresented
The immediately available outcome is a map representing:
At a certain date (e.g., 1700, 1800, … , 2000), the locked areas and a five classes characterisation of river systems according to the average difficulty of migration.Over the computed dates, a distribution statistic of the different states.
Figure14.1 Migratingfishes—riverfragmentationbyobstaclesforyear1700and2005,salmonadult,downstreamtoupstream
•
•
DFR09856
DFR09675
Obstacle permeabilityAverage
Bad
Lock
StretchesNot reacheable
Not computed
Fish potentialVery good
Good
Average
Bad
Very bad0 25 50 75 10012.5
Kilometers EEA - PÖYRY Environment© 2007 NOPOLU System2
Migrating fishes — river fragmentation by obstacles for year 1700
DFR10813
DFR09835
DFR09675
DFR09457
DFR06629
DFR04909
DFR03834
DFR00468
DFR00460
DFR00393
DFR00044Obstacle Permeability
Average
Bad
Lock
StretchesNot reacheable
Not computed
Fish potentialVery good
Good
Average
Bad
Very bad0 25 50 75 10012.5
Kilometers EEA - PÖYRY Environment© 2007 NOPOLU System2
Migrating fishes — river fragmentation by obstacles for year 2005
Source: EEA, 2007.
14Fragmentationofriversystems
127Halting the loss of biodiversity by 2010: proposal for a first set of indicators to monitor progress in Europe
The sample chart above can be made for upstream, downstream, species, etc. If year ranges are narrow enough, it can be animated. Charts for Europe and by country, summarising the extent of obstructed and unobstructed river systems will be provided along with i) availability of river system ii) dam positioning and iii) reference routes availability.
It must be considered republishing the indicators along with the upgrading of data sets (those published in 2007 will be more uncertain than those published in 2009).
Similar maps can be envisaged in a second stage to show the change of lotic to lentic systems along time. This is not fully ready yet, because data will result from processing the river system along with elevation values from a digital elevation model (DEM).
Howtheindicatorshouldbeinterpreted
The more a river is fragmented, the less the natural range of fish species is maintained, and the bigger the potential threat to the species' survival.
a) Assuming the migratory routes, and even though the figure is very rough, the ratio of remaining area to the initial area is a measure (optimistic) of the degree of threat. In many river systems, the ratio is less than 1 % (sturgeon in France) to 30 to 40 % (very rough) for eel. This is a first measure of loss of ecosystem capacity.
b) Assuming the lotic to lentic ratio (length of lotic at time t / (total length)) it measures the percentage of habitat suitable for all fishes of ecological interest.
MetadataSummarytechnicalinformationontheindicator
Title: Fragmentation of river systems.Status: this is a new indicator which responds to a need of the CBD. In decision III/9 on the implementation of Articles 6 and 8 of the Convention, the Conference of the Parties considered fragmentation, along with species loss and habitat degradation, as factors that call for conservation, sustainable use and habitat restoration. Background descriptors are currently under consultation and use at detailed level by member States, as part of programmes of restoration measures.Definition: the indicator shows in spatial and quantitative terms, fragmentation due to the presence of artificial structures that a) may affect the passage of migratory fish and so restrict their range and/or abundance and b) changes substantially the natural habitat distribution within rivers and modify their ecological capacity. It thus describes the difference between the potential range and actual range of migratory fish in river systems due to artificial obstacles on the one hand and the change in habitats on the other hand.Geographical coverage: EU‑27 and EEA member countries to be covered in two years, with the progressive availability of the river system.Temporal coverage: 2006 onwards, but with long retrospective: mid 19th century to present is quite accurately covered considering the large dams. Update frequency: Once established, the database should be updated as new information becomes available. In effect, it would be current at any time and a fragmentation indicator could be calculated at any time. A two‑year publication seems reasonable as a routine production. Identified experts: Philippe Crouzet (EEA).
••
•
•
•
•
•
References
128
15Nutrientsintransitional,coastalandmarinewaters
Halting the loss of biodiversity by 2010: proposal for a first set of indicators to monitor progress in Europe
Focalarea Ecosystem integrity and ecosystem goods and services
Europeanindicatorheadline
Water quality in aquatic ecosystems
Keypolicyquestion What is the status of transitional, marine and coastal waters in Europe, and what actions are most effective for limiting nutrient and organic pollution?
Definition of the indicator
The indicator illustrates trends in, and concentrations of, winter nitrate and phosphate (microgram/l), as well as Nitrogen/Phosphorous ratio in the seas of Europe.
Indicatortype(DPSIR) Pressure
Context Nitrogen (N) and phosphorus (P) enrichment can result in a chain of undesirable effects, starting from excessive growth of plankton algae that increases the amount of organic matter settling to the bottom. This may be enhanced by changes in species composition and functioning of the pelagic food web (e.g. growth of small flagellates rather than larger diatoms), which leads to lower grazing by copepods and increased sedimentation. The consequent increase in oxygen consumption can, in areas with stratified water masses, lead to oxygen depletion, changes in community structure and death of the benthic fauna. Eutrophication can also increase the risk of algal blooms, some of them consisting of harmful species that cause the death of benthic fauna, wild and caged fish, or shellfish poisoning of humans. Increased growth and dominance of fast‑growing filamentous macroalgae in shallow sheltered areas is another effect of nutrient overload which can change the coastal ecosystem, increase the risk of local oxygen depletion and reduce biodiversity and nurseries for fish.
Measures to reduce the adverse effects of excess anthropogenic inputs of nutrients and protect the marine environment are being taken through various initiatives at all levels — global, European, national, regional conventions and Ministerial Conferences.
There are a number of EU Directives aimed at reducing the loads and impacts of nutrients, including the Nitrates Directive (91/676/EEC); the Urban Waste Water Treatment Directive (91/271/EEC); the Integrated Pollution Prevention and Control Directive (96/61/EEC); and the Water Framework Directive (2000/60/EC) which requires the achievement of good ecological status or good ecological potential of transitional and coastal waters across the EU by 2015.
The EU Thematic Strategy on the Protection and Conservation of the Marine Environment and its associated proposed Marine Strategy Directive are of key relevance with regards to the achievement of good environmental status in marine waters.
Additional measures arise from international initiatives and policies including: the UN Global Programme of Action for the Protection of the Marine environment against Land‑Based Activities; the Mediterranean Action Plan (MAP) 1975; the Helsinki Convention 1992 (HELCOM); the OSPAR Convention 1998 (Convention for the Protection of the Marine Environment of the North‑East Atlantic); and the Black Sea Environmental Programme (BSEP).
Relationoftheindicatortothefocalarea
Undesirable effects caused by Nitrogen (N) and phosphorus (P) (have a direct impact on ecosystem integrity and functioning (e.g. changes in species composition, oxygen depletion, changes in community structure) and the delivery of ecosystem services (death of commercial fish species or shellfish poisoning).
15 Nutrientsintransitional,coastalandmarinewaters
15Nutrientsintransitional,coastalandmarinewaters
129Halting the loss of biodiversity by 2010: proposal for a first set of indicators to monitor progress in Europe
Data sources and methodologyDataavailability EEA Waterbase — Transitional, coastal and marine waters, an Eionet priority data
flow. In addition, HELCOM , OSPAR, UNEP MAP and Black Sea Environmental Programme data are used.The data in Waterbase are collected through the Eionet‑Water process and from the marine conventions and are therefore sub‑samples of national data assembled for the purpose of providing comparable indicators of state and impact of transitional, coastal and marine waters (TCM‑data) on a Europe‑wide scale.Data are updated annually.
•
•
•
Methodology Consistent time series are used as the basis for assessment of trends over time. The trend analyses are based on time series 1985–2004/2005 from stations having at least 3 years data in the period 1999–2004 and at least five years data in all. For nitrogen the combined concentrations of nitrate and nitrite are used, but gaps may be populated with nitrate alone to complete the time series.
Winter concentrations are used because in summer all inorganic nutrients are used for plankton growth.
The following steps are undertaken for the calculation. For a detailed description of methodology, reference is made to the EEA core set indicator 'Nutrients in transitional, coastal and marine waters' (http://themes.eea.europa.eu/IMS/IMS/ISpecs/ISpecification20041007132008/full_spec).
1. PrimaryaggregationofseawaterTCMdata
The primary aggregation consists of identifying stations and assigning them to countries and sea regions and creating statistical estimates for each combination of station and year.
2. Geographical classification: sea region, coastal/offshore
All geographical positions defined in the data are assigned to sea region by coordinates, and classified as coastal or off‑shore (> 20 km from coast) by checking them against the coastal contour.
3. Defining stations
Eionet‑Water stationsTCM data reported directly from countries are assigned to station identifiers that are listed with coordinates. For these data, which are mostly along the coast of the reporting country, stations are kept as defined.
Marine convention data from ICESThe data reported through ICES has no consistent station identifiers (i.e. station names), only geographical coordinates (longitude and latitude).
•
•
Evaluation of the indicatorMainadvantagesoftheindicator
The indicator is based in a well‑established data flow from a wide geographic coverage of countries and regional seas.The indicator is based on an EEA priority data flow and the information is timely as it is updated annually.The data are in Waterbase and are freely available on the EEA website. The EEA is Europe's water data centre and hosts the Water Information System for Europe (WISE) which will incorporate Waterbase. The data flows for Marine Conventions may also be incorporated into WISE in the future.
•
•
•
Maindisadvantagesoftheindicator
Data for this assessment are still scarce considering the large spatial and temporal variations inherent to the European transitional, coastal and marine waters. Long stretches of European coastal waters are not covered in the analysis due to lack of data. Trend analyses are consistent only for the North Sea and the Baltic Sea (data updated yearly within the OSPAR and HELCOM conventions) and Italian coastal waters. The accuracy on regional level is largely influenced by the number of stations for which data are available.
•
Analysisofoptions The indicator is an EEA core set indicator. The information basis for the indicator and the assessments possible will improve in time as the WFD and Marine Strategy Directive assessments are implemented by Member States.
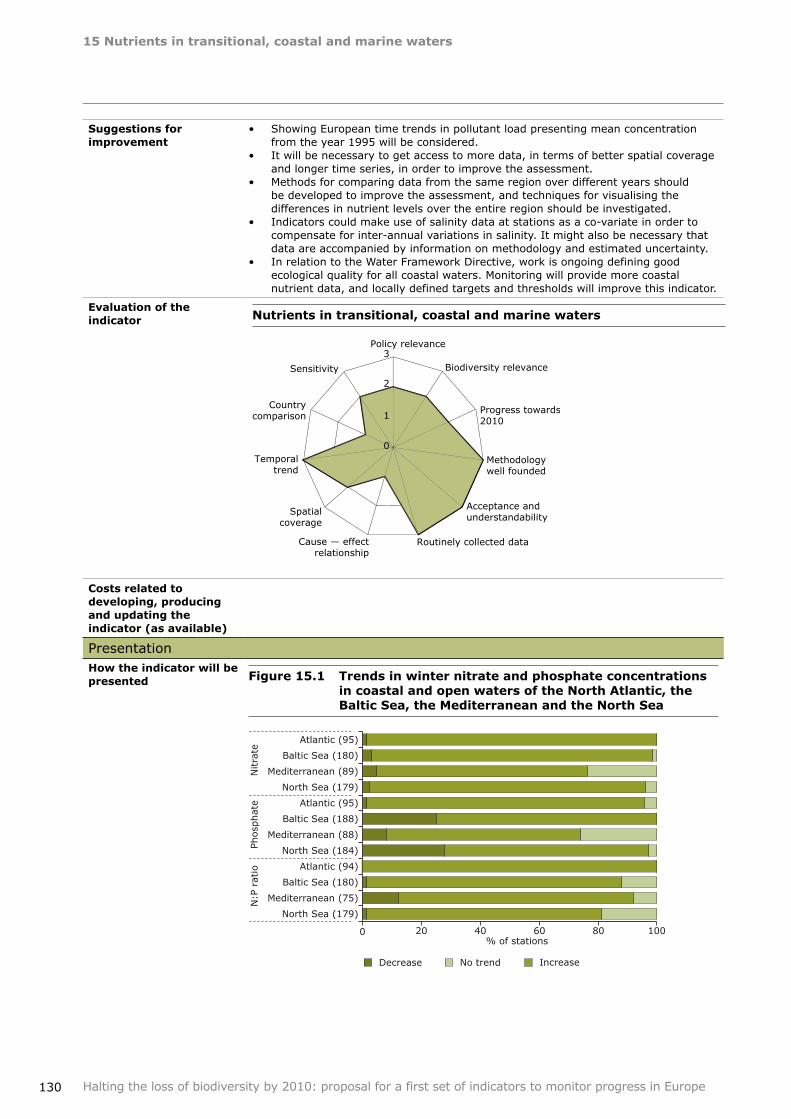
15Nutrientsintransitional,coastalandmarinewaters
130 Halting the loss of biodiversity by 2010: proposal for a first set of indicators to monitor progress in Europe
Suggestionsforimprovement
Showing European time trends in pollutant load presenting mean concentration from the year 1995 will be considered.It will be necessary to get access to more data, in terms of better spatial coverage and longer time series, in order to improve the assessment. Methods for comparing data from the same region over different years should be developed to improve the assessment, and techniques for visualising the differences in nutrient levels over the entire region should be investigated. Indicators could make use of salinity data at stations as a co‑variate in order to compensate for inter‑annual variations in salinity. It might also be necessary that data are accompanied by information on methodology and estimated uncertainty.In relation to the Water Framework Directive, work is ongoing defining good ecological quality for all coastal waters. Monitoring will provide more coastal nutrient data, and locally defined targets and thresholds will improve this indicator.
•
•
•
•
•
Evaluationoftheindicator
Costsrelatedtodeveloping,producingandupdatingtheindicator(asavailable)
PresentationHowtheindicatorwillbepresented Figure15.1 Trendsinwinternitrateandphosphateconcentrations
incoastalandopenwatersoftheNorthAtlantic,theBalticSea,theMediterraneanandtheNorthSea
Decrease No trend Increase
0 20 40 60 80 100
North Sea (179)
Mediterranean (75)
Baltic Sea (180)
Atlantic (94)
North Sea (184)
Mediterranean (88)
Baltic Sea (188)
Atlantic (95)
North Sea (179)
Mediterranean (89)
Baltic Sea (180)
Atlantic (95)
Nitra
tePh
osp
hat
eN
:P r
atio
% of stations
0
1
2
3 Policy relevance
Biodiversity relevance
Progress towards2010
Methodology well founded
Acceptance and understandability
Routinely collected data Cause — effectrelationship
Spatial coverage
Temporal trend
Country comparison
Sensitivity
Nutrientsintransitional,coastalandmarinewaters
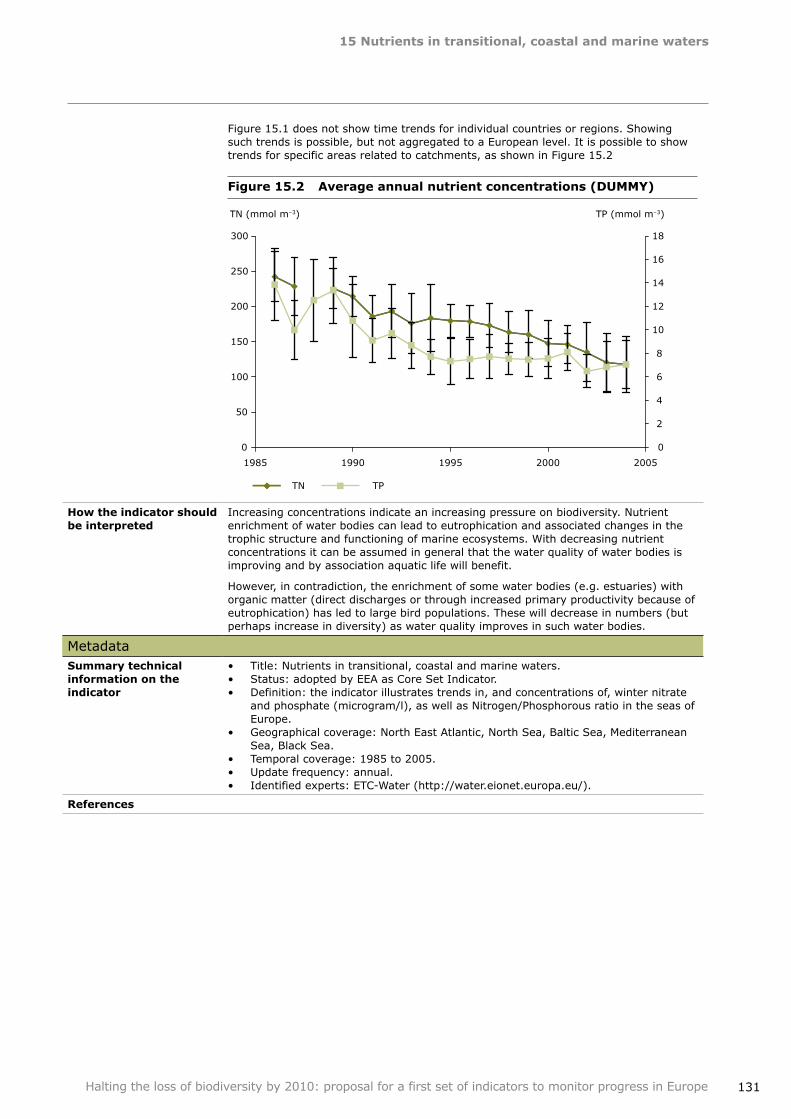
15Nutrientsintransitional,coastalandmarinewaters
131Halting the loss of biodiversity by 2010: proposal for a first set of indicators to monitor progress in Europe
Figure 15.1 does not show time trends for individual countries or regions. Showing such trends is possible, but not aggregated to a European level. It is possible to show trends for specific areas related to catchments, as shown in Figure 15.2
Figure15.2 Averageannualnutrientconcentrations(DUMMY)
Howtheindicatorshouldbeinterpreted
Increasing concentrations indicate an increasing pressure on biodiversity. Nutrient enrichment of water bodies can lead to eutrophication and associated changes in the trophic structure and functioning of marine ecosystems. With decreasing nutrient concentrations it can be assumed in general that the water quality of water bodies is improving and by association aquatic life will benefit.
However, in contradiction, the enrichment of some water bodies (e.g. estuaries) with organic matter (direct discharges or through increased primary productivity because of eutrophication) has led to large bird populations. These will decrease in numbers (but perhaps increase in diversity) as water quality improves in such water bodies.
MetadataSummarytechnicalinformationontheindicator
Title: Nutrients in transitional, coastal and marine waters.Status: adopted by EEA as Core Set Indicator.Definition: the indicator illustrates trends in, and concentrations of, winter nitrate and phosphate (microgram/l), as well as Nitrogen/Phosphorous ratio in the seas of Europe. Geographical coverage: North East Atlantic, North Sea, Baltic Sea, Mediterranean Sea, Black Sea.Temporal coverage: 1985 to 2005.Update frequency: annual.Identified experts: ETC‑Water (http://water.eionet.europa.eu/).
•••
•
•••
References
0
50
100
150
200
250
300
1985 1990 1995 2000 2005
TN (mmol m–3) TP (mmol m–3)
0
2
4
6
8
10
12
14
16
18
TN TP
132
16Freshwaterquality
Halting the loss of biodiversity by 2010: proposal for a first set of indicators to monitor progress in Europe
Focalarea Ecosystem integrity and ecosystem goods and services
Europeanindicatorheadline
Water quality in aquatic ecosystems
Keypolicyquestion What is the status of freshwater in Europe, and what actions are most effective for limiting nutrient and organic pollution?
Definition of the indicator
This indicator shows:
1. Annual median concentrations in rivers of Biological Oxygen Demand (BOD) and ammonium (NH4).
2. Trends in concentrations of orthophosphate and nitrate in rivers, total phosphorus and nitrate in lakes, and nitrate in groundwater bodies.
Indicatortype(DPSIR) Pressure
Context Ammonium concentrations are normally raised as a result of organic pollution, caused by discharges from waste water treatment plants, industrial effluents and agricultural runoff. Ammonium exerts a demand on oxygen in water since it is transformed to oxidised forms of nitrogen. In addition it is toxic to aquatic life at certain concentrations dependent on water temperature, salinity and pH. Background concentrations of ammonium are around 15 µg/l (as N) (Meybeck, 1982, quoted in EEA, 1999).
BOD is a key indicator of the oxygenation status of water bodies. BOD is the oxygen demand brought about by organisms in water and sediment acting on oxidisable organic matter. In most European countries the BOD5 test is used where oxygen consumption is measured after five days incubation under controlled conditions. In other, mainly Northern Europe countries, the BOD7 test is used where samples are incubated for seven days. High BOD is usually a result of organic pollution, caused by discharges from wastewater treatment plants, industrial effluents and agricultural run‑off. High BOD has several effects on the aquatic environment including reducing river water chemical and biological quality, reducing biodiversity of aquatic communities and reducing the microbiological quality of waters. Background levels are difficult to quantify and are likely to be at or below the detection limit of the analytical method used i.e. between 1 and 2 mg O2/l.
Large inputs of nitrogen and phosphorus to water bodies can lead to eutrophication causing ecological changes that result in a loss of plant and animal species (reduction in biodiversity and ecological status), and have negative impacts on the use of water for human consumption and other purposes.
There are a number of EU Directives aimed at reducing the loads and impacts of organic matter. These include:
Nitrates Directive (91/676/EEC).Urban Waste Water Treatment Directive (91/71/EEC).Integrated Pollution Prevention and Control Directive (96/61/EEC).Water Framework Directive.Drinking Water Directive (98/83/EC).
•••••
16 Freshwaterquality
16Freshwaterquality
133Halting the loss of biodiversity by 2010: proposal for a first set of indicators to monitor progress in Europe
Relationoftheindicatortothefocalarea
Ammonium, BOD, and N and P concentrations indicate water quality. If concentrations are high, quality goes down, threatening aquatic biodiversity and reducing the integrity of the ecosystem and its capacity to deliver ecosystem services.
Enrichment of water bodies with organic matter can lead to oxygen depletion and changes in the trophic structure and functioning of aquatic ecosystems. Until the WFD establishes reference conditions and good status for water bodies — including, for water bodies impacted by organic matter discharges, type‑specific concentrations equivalent to good ecological status, it will not be possible to relate the indicator to specific impacts on ecological status or biodiversity. However, with decreasing concentrations of oxygen consuming substances and nutrient concentrations it can be assumed in general that the water quality of water bodies is improving and by association aquatic life will benefit.
Groundwater is also important as it can be a source of nitrate in rivers adversely affecting associated river and lake water bodies, wetlands and dependent terrestrial ecosystems. Groundwater is also a very important source of drinking water in many countries, and hence it is important to protect its quality also from a human health perspective.
Data sources and methodologyDataavailability Waterbase: Data is collected annually from EEA member and participating countries
through the Eionet‑Water process. Data are processed and validated by the ETC‑WTR and then delivered to the EEA for incorporation in Waterbase and publication on the EEA website. Data are therefore freely and publicly available.
Methodology The data in Waterbase are collected through the Eionet‑Water process and are therefore sub‑samples of national data assembled for the purpose of providing comparable indicators of pressures, state and impact of waters on a Europe‑wide scale and the data sets are not intended for assessing compliance with any European Directive or any other legal instrument.
Detailed description of the methodology can be found in the specification sheets for EEA core set indicator 019 'Oxygen consuming substances in rivers' (http://ims.eionet.europa.eu/IMS/ISpecs/ISpecification20041007131940/full_spec) and 020 'Nutrients in freshwater' (http://ims.eionet.europa.eu/IMS/ISpecs/ISpecification20041007131957/full_spec).
Evaluation of the indicatorMainadvantagesoftheindicator
Biodiversity relevance: the indicator gives an assessment of water quality which fundamentally determines the structure and functioning of aquatic and associated terrestrial ecosystems and dependent organisms.Country comparison: the indicator is quantitative and representative of the situation in countries. Well established data flow and methodology.The indicator is updated annually. The data are in Waterbase and are freely available through the EEA data service.
•
•
•••
Maindisadvantagesoftheindicator
The main disadvantage is that the indicator is at present not directly related to effects on aquatic ecosystems: this should improve when WFD assessments are fully implemented (see below for more details).The current selection of stations for Eionet‑Water is for assessments at the country level, and representative assessments of individual catchments may not necessarily be obtained. This is being improved as part of the WISE process and development. Information on specific (but not all) water bodies can however be obtained. Another disadvantage of indicators focussing on assessing the water quality (oxygen demand) may be different uses throughout Europe. Some countries use indexes on species level, others on family level. The intercalibration exercise of the EU Joint Research Centre on newly developed assessment systems in Europe to fulfil the requirements of the WFD have recently generated some 'Intercalibration Metrics' that are being widely used throughout Europe to compare country‑specific assessment results. See, e.g., Birk and Hering (2006) and Birk et al. (2006).
•
•
•
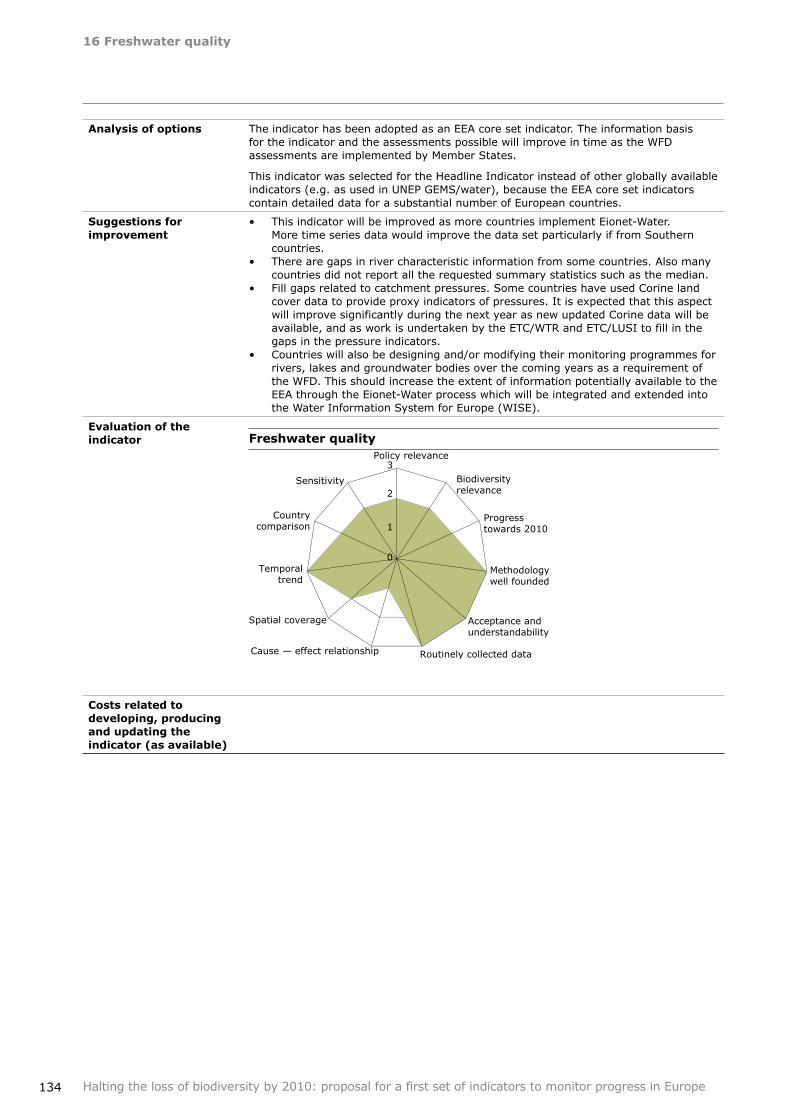
16Freshwaterquality
134 Halting the loss of biodiversity by 2010: proposal for a first set of indicators to monitor progress in Europe
Analysisofoptions The indicator has been adopted as an EEA core set indicator. The information basis for the indicator and the assessments possible will improve in time as the WFD assessments are implemented by Member States.
This indicator was selected for the Headline Indicator instead of other globally available indicators (e.g. as used in UNEP GEMS/water), because the EEA core set indicators contain detailed data for a substantial number of European countries.
Suggestionsforimprovement
This indicator will be improved as more countries implement Eionet‑Water. More time series data would improve the data set particularly if from Southern countries.There are gaps in river characteristic information from some countries. Also many countries did not report all the requested summary statistics such as the median. Fill gaps related to catchment pressures. Some countries have used Corine land cover data to provide proxy indicators of pressures. It is expected that this aspect will improve significantly during the next year as new updated Corine data will be available, and as work is undertaken by the ETC/WTR and ETC/LUSI to fill in the gaps in the pressure indicators. Countries will also be designing and/or modifying their monitoring programmes for rivers, lakes and groundwater bodies over the coming years as a requirement of the WFD. This should increase the extent of information potentially available to the EEA through the Eionet‑Water process which will be integrated and extended into the Water Information System for Europe (WISE).
•
•
•
•
Evaluationoftheindicator Freshwaterquality
Costsrelatedtodeveloping,producingandupdatingtheindicator(asavailable)
0
1
2
3 Policy relevance
Biodiversity relevance
Progress towards 2010
Methodologywell founded
Acceptance and understandability
Routinely collected data Cause — effect relationship
Spatial coverage
Temporal trend
Country comparison
Sensitivity
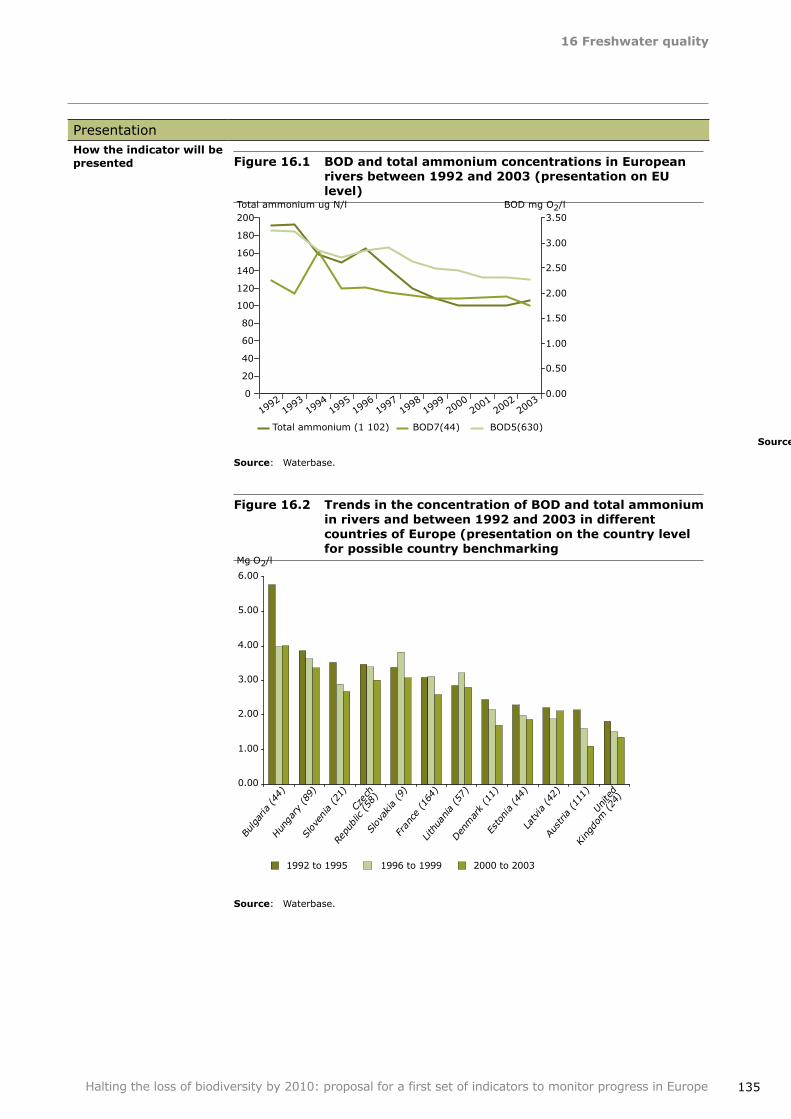
16Freshwaterquality
135Halting the loss of biodiversity by 2010: proposal for a first set of indicators to monitor progress in Europe
PresentationHowtheindicatorwillbepresented Figure16.1 BODandtotalammoniumconcentrationsinEuropean
riversbetween1992and2003(presentationonEUlevel)
Source: Waterbase.
Figure16.2 TrendsintheconcentrationofBODandtotalammoniuminriversandbetween1992and2003indifferentcountriesofEurope(presentationonthecountrylevelforpossiblecountrybenchmarking
Source: Waterbase.
0
20
40
60
80
100
120
140
160
180
200
1992
1993
1994
1995
1996
1997
1998
1999
2000
2001
2002
2003
Total ammonium ug N/l
0.00
0.50
1.00
1.50
2.00
2.50
3.00
3.50BOD mg O2/l
Total ammonium (1 102) BOD7(44) BOD5(630)
0.00
1.00
2.00
3.00
4.00
5.00
6.00
Bulgaria (44
)
Hung
ary (89)
Slov
enia (21
)
Czec
h
Rep
ublic (58
)
Slov
akia (9)
Fran
ce (16
4)
Lithua
nia (57)
Denm
ark (11)
Estonia (44)
Latvia (42
)
Austria
(11
1)
Unite
d
Kingd
om (24
)
Mg O2/l
1992 to 1995 1996 to 1999 2000 to 2003
Source: Waterbase.
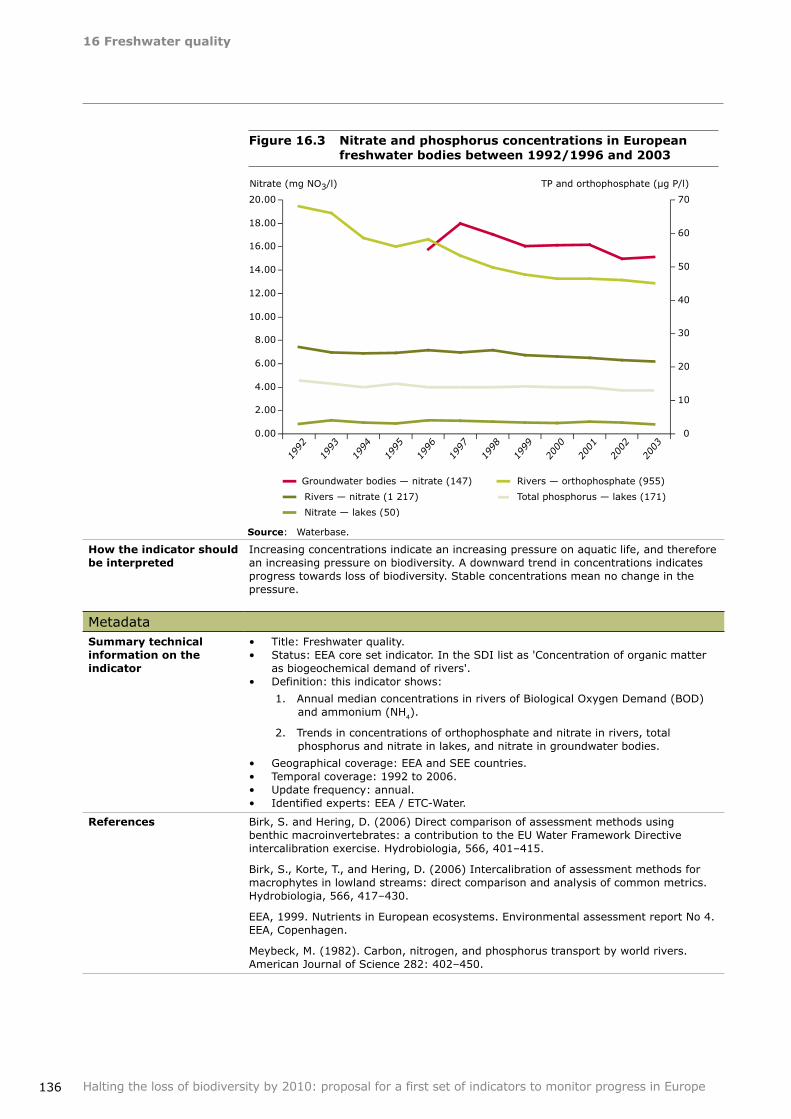
16Freshwaterquality
136 Halting the loss of biodiversity by 2010: proposal for a first set of indicators to monitor progress in Europe
Figure16.3 NitrateandphosphorusconcentrationsinEuropeanfreshwaterbodiesbetween1992/1996and2003
Howtheindicatorshouldbeinterpreted
Increasing concentrations indicate an increasing pressure on aquatic life, and therefore an increasing pressure on biodiversity. A downward trend in concentrations indicates progress towards loss of biodiversity. Stable concentrations mean no change in the pressure.
MetadataSummarytechnicalinformationontheindicator
Title: Freshwater quality.Status: EEA core set indicator. In the SDI list as 'Concentration of organic matter as biogeochemical demand of rivers'.Definition: this indicator shows:
1. Annual median concentrations in rivers of Biological Oxygen Demand (BOD) and ammonium (NH4).
2. Trends in concentrations of orthophosphate and nitrate in rivers, total phosphorus and nitrate in lakes, and nitrate in groundwater bodies.
Geographical coverage: EEA and SEE countries.Temporal coverage: 1992 to 2006.Update frequency: annual.Identified experts: EEA / ETC‑Water.
••
•
••••
References Birk, S. and Hering, D. (2006) Direct comparison of assessment methods using benthic macroinvertebrates: a contribution to the EU Water Framework Directive intercalibration exercise. Hydrobiologia, 566, 401–415.
Birk, S., Korte, T., and Hering, D. (2006) Intercalibration of assessment methods for macrophytes in lowland streams: direct comparison and analysis of common metrics. Hydrobiologia, 566, 417–430.
EEA, 1999. Nutrients in European ecosystems. Environmental assessment report No 4. EEA, Copenhagen.
Meybeck, M. (1982). Carbon, nitrogen, and phosphorus transport by world rivers. American Journal of Science 282: 402–450.
0.00
2.00
4.00
6.00
8.00
10.00
12.00
14.00
16.00
18.00
20.00
1992
1993
1994
1995
1996
1997
1998
1999
2000
2001
2002
2003
Nitrate (mg NO3/l)
0
10
20
30
40
50
60
70
TP and orthophosphate (µg P/l)
Rivers — nitrate (1 217)
Groundwater bodies — nitrate (147)
Nitrate — lakes (50)
Rivers — orthophosphate (955)
Total phosphorus — lakes (171)
Source: Waterbase.
137
17Forest:growingstock,incrementandfellings
Halting the loss of biodiversity by 2010: proposal for a first set of indicators to monitor progress in Europe
Focalarea Sustainable use
Europeanindicatorheadline
Area of forest, agriculture, fishery and aquaculture ecosystems under sustainable management
Keypolicyquestion Is forestry in Europe sustainable in terms of the balance between increment and fellings?
Definition of the indicator
Growing stock in forest and other wooded land, classified by forest type and by availability for wood supply, and balance between net annual increment and annual fellings of wood on forest available for wood supply.
Indicatortype(DPSIR) Pressure
Context Growing stock is one of the basic statistics of any forest inventory and useful for various purposes. The standing volume of growing stock can by applying biomass expansion factors be converted into estimates of above and below‑ground woody biomass. Data on growing stock, increment and fellings are crucial for the calculation of carbon budgets in the forest sector.
Relationoftheindicatortothefocalarea
The balance between increment and fellings highlights the sustainability of timber production over time as well as the current availability and the potential for future availability of timber. For a long‑run sustainability the annual fellings must not exceed the net annual increment.
An increase in the growing stock, relative to forest area, is an indication of maturing forests. The balance between the growth and felling in production forests is the best indicator to understand both potential for wood production possibilites, and conditions of biodiversity, health, recreation and other functions of forests. The quality of this indicator with regard to biodiversity would improve considerably if suggestions for improvements (see below) would be implemented.
Data sources and methodologyDataavailability Sources [periodicity] :
National forest inventories collect data on growing stock and increments and often also on fellings, although the types of organisations that nationally collect data on fellings differs from country to country. The UN‑ECE/FAO is the main data collector for all variables covered by this indicator.
UN‑ECE/FAO Forest Resources Assessments [growing stock: 5 yearly — latest: 2005; increment: 10 yearly — latest: 2000; fellings: 10 yearly — latest: 2000].UN‑ECE/FAO/Eurostat/OECD Joint Forest Sector Questionnaire [fellings: yearly].MCPFE/UN‑ECE/FAO [growing stock, increment, fellings: +/– 5 yearly — latest: 2003, 2007].National forest inventories (growing stock, increment: typically 10‑yearly at regional level and at national level — some countries publish annually updated forest inventory data).
•
••
•
17 Forest:growingstock,incrementandfellings
17Forest:growingstock,incrementandfellings
138 Halting the loss of biodiversity by 2010: proposal for a first set of indicators to monitor progress in Europe
Methodology Definition of terms:
Growingstock:The living tree component of the standing volume.
The standing volume refers to the volume of standing trees, living or dead, above‑stump measured overbark to top (0 cm). Includes all trees with diameter over 0 cm diameter breast height (d.b.h. — typically at 130 cm above stump). Includes: tops of stems, large branches, dead trees lying on the ground which can still be used for fibre or fuel. Excludes: Small branches, twigs and foliage. (UNECE/FAO (2000)).
Grossannualincrement:Average annual volume of increment over the reference period of all trees, measured to a minimum d.b.h. of 0 cm. Includes: the increment on trees which have been felled or die during the reference period (UNECE/FAO (2000)).
Netannualincrement:Average annual volume over the given reference period of gross increment less that of natural losses on all trees to a minimum diameter of 0 cm (d.b.h.) (UNECE/FAO (2000)).
Annualfellings:Average annual standing volume of all trees, living or dead, measured overbark to a minimum diameter of 0 cm (d.b.h.) that are felled during the given reference period, including the volume of trees or parts of trees that are not removed from the forest, other wooded land or other felling site. Includes: silvicultural and pre‑commercial thinnings and cleanings left in the forest; and natural losses that are recovered (harvested) (UNECE/FAO (2000)).
Various methods exist in countries to estimate fellings. Fellings are measured from the standing trees, already felled trees, at factory gates, or a combination of techniques. Typically a problem is posed by estimates of fellings for energy and especially the fraction of fellings for domestic firewood. Another issue in some countries is illegal logging and ranges for the volume of illegally felled wood is difficult to assess and with a large error margin.
Combined with forest scenario modelling, it is also possible to create cautious outlooks into the future development of this indicator. Such data are developed under auspices of UN‑ECE/FAO as part of its European Forest Sector Outlook Studies (formerly: European Timber Trends Studies).
Measurementunitsforgrowingstock:
Status: m³.
Changes: m³/yr.
Status: m3/ha.
Changes: m3/ha/yr.
Measurementunitsforincrementandfellings:
Status: m³.
Changes: m³/yr.
Evaluation of the indicatorMainadvantagesoftheindicator
Growing stock is an important and well‑accepted proxy for biodiversity. Sustainable development of growing stock in forests and other wooded land, through comparison of fellings and net annual increment is possible thanks to reliable and long‑term available data and for all pan‑European countries.The information is easily understandable.
•
•
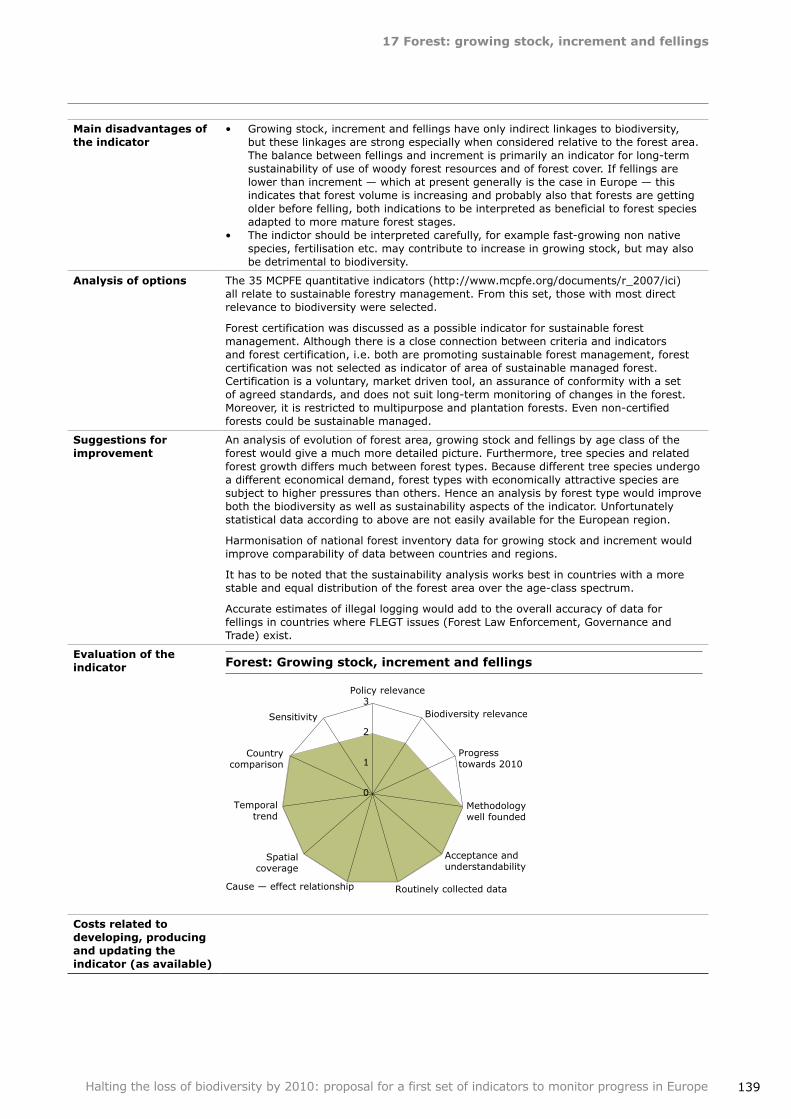
17Forest:growingstock,incrementandfellings
139Halting the loss of biodiversity by 2010: proposal for a first set of indicators to monitor progress in Europe
Maindisadvantagesoftheindicator
Growing stock, increment and fellings have only indirect linkages to biodiversity, but these linkages are strong especially when considered relative to the forest area. The balance between fellings and increment is primarily an indicator for long‑term sustainability of use of woody forest resources and of forest cover. If fellings are lower than increment — which at present generally is the case in Europe — this indicates that forest volume is increasing and probably also that forests are getting older before felling, both indications to be interpreted as beneficial to forest species adapted to more mature forest stages. The indictor should be interpreted carefully, for example fast‑growing non native species, fertilisation etc. may contribute to increase in growing stock, but may also be detrimental to biodiversity.
•
•
Analysisofoptions The 35 MCPFE quantitative indicators (http://www.mcpfe.org/documents/r_2007/ici) all relate to sustainable forestry management. From this set, those with most direct relevance to biodiversity were selected.
Forest certification was discussed as a possible indicator for sustainable forest management. Although there is a close connection between criteria and indicators and forest certification, i.e. both are promoting sustainable forest management, forest certification was not selected as indicator of area of sustainable managed forest. Certification is a voluntary, market driven tool, an assurance of conformity with a set of agreed standards, and does not suit long‑term monitoring of changes in the forest. Moreover, it is restricted to multipurpose and plantation forests. Even non‑certified forests could be sustainable managed.
Suggestionsforimprovement
An analysis of evolution of forest area, growing stock and fellings by age class of the forest would give a much more detailed picture. Furthermore, tree species and related forest growth differs much between forest types. Because different tree species undergo a different economical demand, forest types with economically attractive species are subject to higher pressures than others. Hence an analysis by forest type would improve both the biodiversity as well as sustainability aspects of the indicator. Unfortunately statistical data according to above are not easily available for the European region.
Harmonisation of national forest inventory data for growing stock and increment would improve comparability of data between countries and regions.
It has to be noted that the sustainability analysis works best in countries with a more stable and equal distribution of the forest area over the age‑class spectrum.
Accurate estimates of illegal logging would add to the overall accuracy of data for fellings in countries where FLEGT issues (Forest Law Enforcement, Governance and Trade) exist.
Evaluationoftheindicator Forest:Growingstock,incrementandfellings
Costsrelatedtodeveloping,producingandupdatingtheindicator(asavailable)
0
1
2
3 Policy relevance
Biodiversity relevance
Progress towards 2010
Methodology well founded
Acceptance and understandability
Routinely collected data Cause — effect relationship
Spatial coverage
Temporal trend
Country comparison
Sensitivity
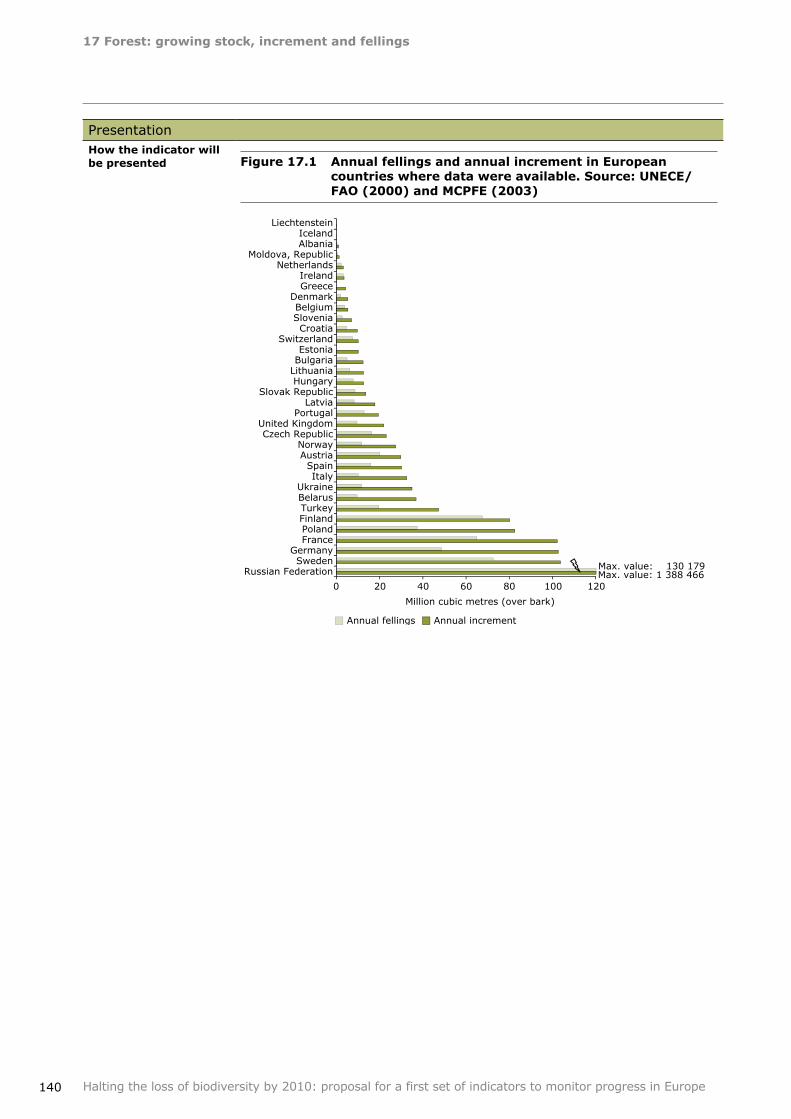
17Forest:growingstock,incrementandfellings
140 Halting the loss of biodiversity by 2010: proposal for a first set of indicators to monitor progress in Europe
PresentationHowtheindicatorwillbepresented Figure17.1 AnnualfellingsandannualincrementinEuropean
countrieswheredatawereavailable.Source:UNECE/FAO(2000)andMCPFE(2003)
Russian Federation Sweden
Germany France Poland Finland Turkey Belarus Ukraine
Italy Spain
Austria Norway
Czech Republic United Kingdom
Portugal Latvia
Slovak Republic Hungary Lithuania Bulgaria Estonia
Switzerland Croatia
Slovenia Belgium
Denmark Greece Ireland
Netherlands Moldova, Republic
Albania Iceland
Liechtenstein
Million cubic metres (over bark)
0 20 40 60 80 100 120
Annual fellings Annual increment
Max. value: 130 179Max. value: 1 388 466
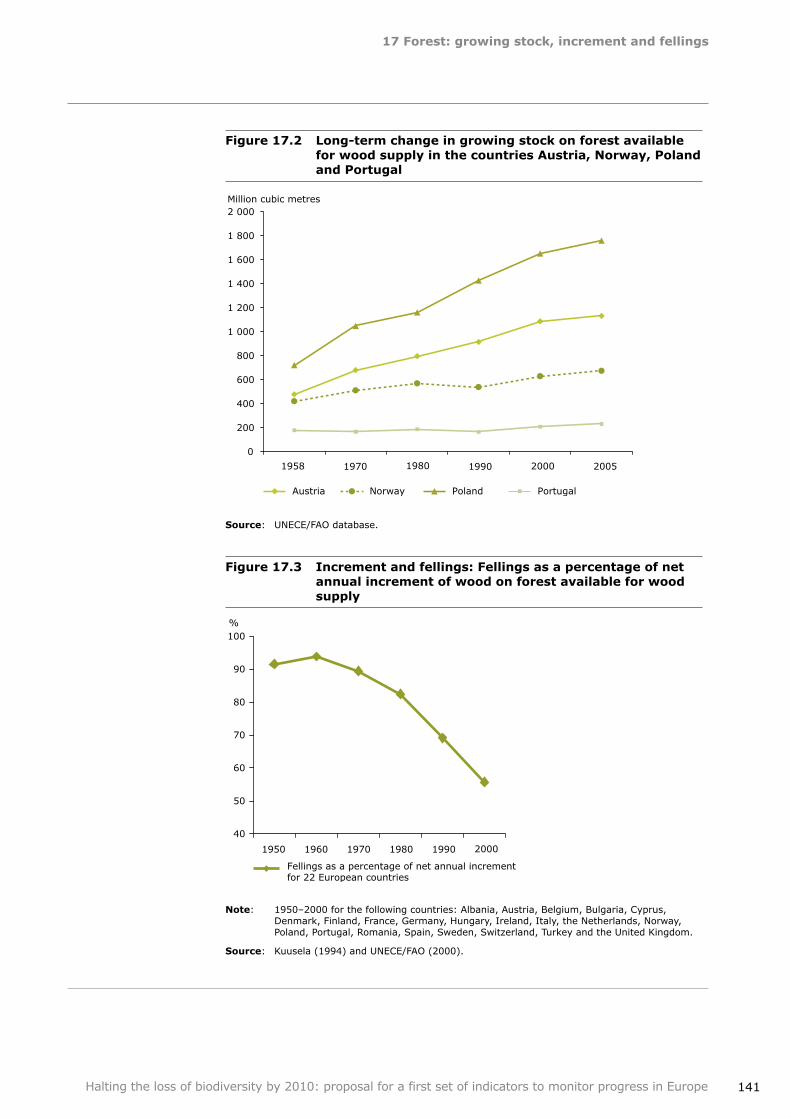
17Forest:growingstock,incrementandfellings
141Halting the loss of biodiversity by 2010: proposal for a first set of indicators to monitor progress in Europe
Figure17.2 Long‑termchangeingrowingstockonforestavailableforwoodsupplyinthecountriesAustria,Norway,PolandandPortugal
Source: UNECE/FAO database.
Figure17.3 Incrementandfellings:Fellingsasapercentageofnetannualincrementofwoodonforestavailableforwoodsupply
Note: 1950–2000 for the following countries: Albania, Austria, Belgium, Bulgaria, Cyprus, Denmark, Finland, France, Germany, Hungary, Ireland, Italy, the Netherlands, Norway, Poland, Portugal, Romania, Spain, Sweden, Switzerland, Turkey and the United Kingdom.
Source: Kuusela (1994) and UNECE/FAO (2000).
0
200
400
600
800
1 000
1 200
1 400
1 600
1 800
2 000
Austria
Million cubic metres
1958 1970 1980 1990 2000 2005
Norway Poland Portugal
40
50
60
70
80
90
100
1950 1960 1970 1980 1990 2000
%
Fellings as a percentage of net annual incrementfor 22 European countries
17Forest:growingstock,incrementandfellings
142 Halting the loss of biodiversity by 2010: proposal for a first set of indicators to monitor progress in Europe
Howtheindicatorshouldbeinterpreted
Use of the forest resource is sustainable (in a narrow sense: not endangering future supply) when not more is harvested than that the forests grow in a year. When interpreting the indicator for biodiversity, the disadvantages of the indicator, discussed earlier, need to be considered.
MetadataSummarytechnicalinformationontheindicator
Title : Forest: growing stock, increment and fellings.Status: adopted by the pan‑European Ministers responsible for forests (MCPFE); MCPFE, UNECE/FAO reporting obligation. In SDI list.Definition: Growing stock in forest and other wooded land, classified by forest type and by availability for wood supply, and balance between net annual increment and annual fellings of wood on forest available for wood supply.Geographical coverage: Albania, Andorra, Austria, Belarus, Belgium, Bosnia and Herzegovina, Bulgaria, Croatia, Cyprus, Czech Republic, Denmark, Estonia, Finland, France, Georgia, Germany, Greece, Holy See, Hungary, Iceland, Ireland, Italy, Latvia, Liechtenstein, Lithuania, Luxembourg, Malta, Moldova, Monaco , Montenegro, Netherlands, Norway, Poland, Portugal, Romania, Russian Federation, Serbia, Slovakia, Slovenia, Spain, Sweden, Switzerland, The former Yugoslav Republic of Macedonia, Turkey, Ukraine, United Kingdom.Temporal coverage: 1990, 2000, 2003, 2005, (2007, 2010 expected).Update frequency: since 2000, about every 3 years.Identified experts: MCPFE Advisory Group; GFRA Advisory Group (FAO); UNECE/FAO Team of Specialists on Sustainable Forest Management; COST Action E43.
••
•
•
•••
References FBI 2003 (Forest biodiversity indicators in the Nordic countries), status based on national forest inventories. http://www.norden.org/pub/ebook/2003‑514.pdf
FRA 2005 (Global forest resources assessment update) (2005): Terms and definitions (Final version). FAO Forestry Department. Rome, 2004. http://www.fao.org/documents/show_cdr.asp?url_file=/docrep/007/ae156e/ae156e00.htm
IUFRO (2000): Terminology of Forest Management. Terms and Definitions in English. IUFRO World Series Vol. 9‑en. IUFRO Secretariat Vienna. (Or: SilvaTerm Database. Available at http://iufro.boku.ac.at/iufro/silvavoc/svdatabase.htm).
Kuusela, K. 1994. Forest resources in Europe 1950–1990. Cambridge University Press.
MCPFE (2000): TBFRA Supplementary Enquiry for Data on Protected and Protective Forests and Other Wooded Land. MCPFE and UNECE, Geneva.
MCPFE (2002): MCPFE Assessment Guidelines for Protected and Protective Forest and Other Wooded Land in Europe as adopted by the MCPFE Expert Level Meeting, 10–11 June 2002, Vienna, Austria.
MCPFE (2003): State of Europe's Forests 2003. The MCPFE Report on Sustainable Forest Management in Europe. Jointly prepared by MCPFE Liaison Unit Vienna and UNECE/FAO. Vienna.
SEC(2005) 161 final: Communication from Mr. Almunia to the members of the Commission. Sustainable Development Indicators to monitor the implementation of the EU Sustainable Development Strategy.
UNECE/FAO (2000): Forest Resources of Europe, CIS, North America, Australia, Japan and New Zealand (TBFRA 2000). Main report. UNECE/FAO Contribution to the Global Forest Resources Assessment 2000. United Nations, New York and Geneva.
UNECE/FAO (2005): Global Forest Resources Assessment 2005, Data for Europe. United Nations, New York and Geneva.
143
18Forest:deadwood
Halting the loss of biodiversity by 2010: proposal for a first set of indicators to monitor progress in Europe
Focalarea Sustainable use
Europeanindicatorheadline
Area of forest, agriculture, fishery and aquaculture ecosystems under sustainable management
Keypolicyquestion How can forests be sustainably managed for biodiversity?
Definition of the indicator
Volume of standing and lying deadwood in forest and other wooded land, classified by forest type (Ministerial Conference on the Protection of Forests in Europe (MCPFE) (MCPFE) definition). In national forest inventories, countries generally classify according to type (standing, snags, lying, species and state of decay).
Indicatortype(DPSIR) State
Context Deadwood (coarse woody debris) in form of snags (dead standing trees) and logs (dead lying trees) is a habitat for a wide array of organisms and after humification an important component of forest soil. Some species are dependent, during some part of their life cycle, to find a place to live, either on the surface or in cavities/protected places of dead or dying wood of moribund or dead trees (standing and fallen), or upon wood‑inhabiting fungi or other species. Because of lack of deadwood in multipurpose forests many of the species dependent on deadwood are endangered.
At present it is still debated what amount of deadwood is required in order to maintain the most valuable species and under what circumstances the accumulated deadwood component may give rise to a risk for insect outbreaks.
Relationoftheindicatortothefocalarea
Decaying wood habitats are important components of biodiversity in European forests and recognised as an indicator for assessing and monitoring biodiversity as well as sustainable forest management.
Data sources and methodologyDataavailability As regards collection of data this is carried out by the National Forest Inventories of
most European countries. There is a large variation in the methodology to collect data. The COST E43 action is currently working towards harmonising the data collection.
A more limited, albeit fully harmonised, data set is also collected the Forest Focus biodiversity pilot studies (ForestBiota, Biosoil) on ICP Forest (International Co‑operative Programme on Assessment and Monitoring of Air Pollution Effects on Forests) Level 1 and Level 2 plots. Proposal to continue this is in a future European Forest Monitoring System (EFMS) is currently being developed.
Current periodicity of data availability: about 5 years.
International data provider: UNECE/FAO/MCPFE.
Pan European coverage.
18 Forest:deadwood
18Forest:deadwood
144 Halting the loss of biodiversity by 2010: proposal for a first set of indicators to monitor progress in Europe
Methodology Definition of terms:
Terminology is well defined for international reporting by MCPFE. Dead wood (coarse woody debris) as such as well as the methodology for reporting of volume are thus defined by MCPFE.
On a national scale monitoring of deadwood is carried out in several National forest Inventories (NFIs). Work towards harmonisation of terminology is carried out by the COST E43 action. This comprises type classification (standing, bending, lying) as well as potentially important additional parameter (Uprooted stems, Clearcut stems, Pieces of stems, Cut branches, Uprooted staves, Logging residues, Fine woody debris, Intact snags, Broken snags, Broken, lying stems without uprooting). There are several approaches to register state of decay, most commonly this is classified in 5 classes. Noting the tree species is desirable but data are not collected by everybody.
MCPFE has defined the following reporting of the indicator "Deadwood":
Measurementunits
Status: m³/ha.Changes: m³/ha/yr.
Figurestobereportedon
Volume of dead standing trees (snags) and lying trees (logs) on forest area and other wooded land, classified by forest type.
Minimumlengthanddiameterofstandingandlyingdeadtrees
Length: 2 m.Diameter: It is up to the countries to define the minimum size of diameter to be reported. It is recommended that the minimum size be:
Standing deadwood: 10 cm d.b.h. Lying deadwood: 10 cm mean diameter.
Foresttype
A European Forest Types classification has been proposed to MCPFE (EEA, 2006).
••
•
••
••
Evaluation of the indicatorMainadvantagesoftheindicator
Biodiversity relevance: deadwood is a measure of habitat quality relevant for thousands of European forest organisms, several threatened. Data on deadwood can be collected at relatively low cost in national forest inventories and the indicator is reported by countries according to agreed definitions.Accepted methodology.Geographical coverage: pan‑European.
•
••
Maindisadvantagesoftheindicator
The indicator is a general measure on habitat quality. It will not, at least not in international reporting, be possible to evaluate the indicator with respect to specific organisms, e.g. threatened species.A minimum level of required deadwood to create suitable habitats in multifunctional forests is not yet defined. This will probably have to be done when developing management plans at landscape or stand scales. Huge amounts of deadwood may also be a risk (insect calamities, fire).Methodology to measure deadwood differs between countries. Some countries include also tree stumps into the calculations. Numbers may also be influenced by the share of undisturbed forest (in which case figures for deadwood may reflect the share of undisturbed forest instead of the real amount of dead wood in production forests).
•
•
•
Analysisofoptions The 35 MCPFE quantitative indicators (http://www.mcpfe.org/documents/r_2007/ici) all relate to sustainable forestry management. From this set, those with most direct relevance to biodiversity were selected.
Suggestionsforimprovement
Applying the proposed European Forest Types (EEA, 2006). More research is required on the quality and quantity of dead wood and the related biodiversity components.
••
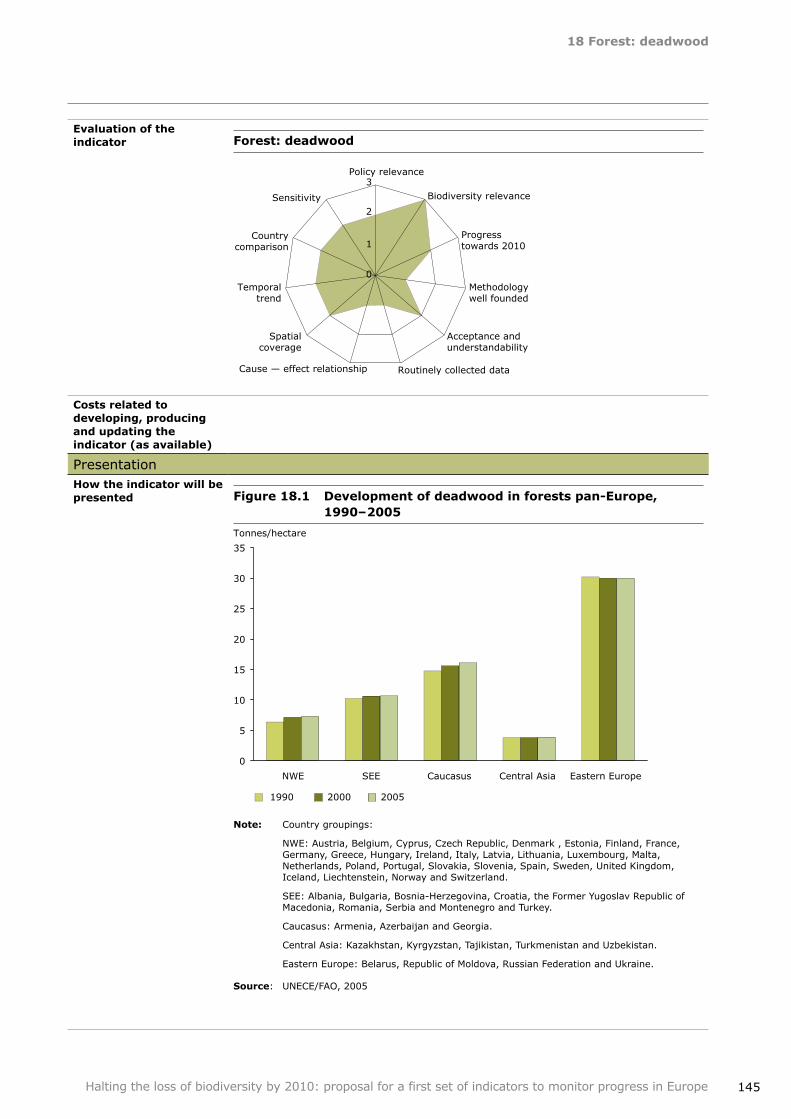
18Forest:deadwood
145Halting the loss of biodiversity by 2010: proposal for a first set of indicators to monitor progress in Europe
Evaluationoftheindicator Forest:deadwood
Costsrelatedtodeveloping,producingandupdatingtheindicator(asavailable)
PresentationHowtheindicatorwillbepresented Figure18.1 Developmentofdeadwoodinforestspan‑Europe,
1990–2005
0
5
10
15
20
25
30
35
NWE SEE Caucasus Central Asia Eastern Europe
Tonnes/hectare
1990 2000 2005
Note: Country groupings:
NWE: Austria, Belgium, Cyprus, Czech Republic, Denmark , Estonia, Finland, France, Germany, Greece, Hungary, Ireland, Italy, Latvia, Lithuania, Luxembourg, Malta, Netherlands, Poland, Portugal, Slovakia, Slovenia, Spain, Sweden, United Kingdom, Iceland, Liechtenstein, Norway and Switzerland.
SEE: Albania, Bulgaria, Bosnia‑Herzegovina, Croatia, the Former Yugoslav Republic of Macedonia, Romania, Serbia and Montenegro and Turkey.
Caucasus: Armenia, Azerbaijan and Georgia.
Central Asia: Kazakhstan, Kyrgyzstan, Tajikistan, Turkmenistan and Uzbekistan.
Eastern Europe: Belarus, Republic of Moldova, Russian Federation and Ukraine.
Source: UNECE/FAO, 2005
0
1
2
3 Policy relevance
Biodiversity relevance
Progress towards 2010
Methodology well founded
Acceptance and understandability
Routinely collected data Cause — effect relationship
Spatial coverage
Temporal trend
Country comparison
Sensitivity
18Forest:deadwood
146 Halting the loss of biodiversity by 2010: proposal for a first set of indicators to monitor progress in Europe
Howtheindicatorshouldbeinterpreted
Natural forests generally have much more deadwood than can be found in production forests. A certain amount of deadwood in multifunctional forest shows that the biodiversity aspect has been taken into consideration by forest management. Knowing the importance of deadwood for many organisms an increased amount in forest ecosystems should be considered beneficial to biodiversity and a sign of halting biodiversity loss.
No precise critical level is currently identified. Such levels must probably take into account forest types and regional differences. There will also have to be a balancing between biodiversity targets and negative effects. It is however, not generally understood above which amount of deadwood or under which circumstances negative effects (pest outbreaks, fire) can become significant.
MetadataSummarytechnicalinformationontheindicator
Title: Forest: deadwood.Status: adopted by the pan‑European Ministers responsible for forests (MCPFE) and an UNECE/FAO reporting obligation. To be developed for SDI list.Definition: Volume of standing and lying deadwood in forest and other wooded land, classified by forest type (Ministerial Conference on the Protection of Forests in Europe (MCPFE) definition). In national forest inventories, countries generally classify according to type (standing, snags, lying, species and state of decay.Geographical coverage: Albania, Andorra, Austria, Belarus, Belgium, Bosnia and Herzegovina, Bulgaria, Croatia, Cyprus, Czech Republic, Denmark, Estonia, Finland, France, Georgia, Germany, Greece, Holy See, Hungary, Iceland, Ireland, Italy, Latvia, Liechtenstein, Lithuania, Luxembourg, Malta, Moldova, Monaco, Montenegro, Netherlands, Norway, Poland, Portugal, Romania, Russian Federation, Serbia, Slovakia, Slovenia, Spain, Sweden, Switzerland, The former Yugoslav Republic of Macedonia, Turkey, Ukraine, United Kingdom.Temporal coverage: 2003; 2005; (2007, 2010 expected).Update frequency: about 5 years.Identified experts: MCPFE Advisory Group; GFRA Advisory Group (FAO); UNECE/ FAO Team of Specialists on Sustainable Forest Management; COST Action E43; ICP Forest Expert Panel on Biodiversity and Ground Vegetation.
••
•
•
•••
References EEA, 2006. European forest types — Categories and types for sustainable forest management reporting and policy. European Environment Agency, Copenhagen, Denmark. EEA Technical report No 9/2006. .
FBI 2003 (Forest biodiversity indicators in the Nordic countries), status based on national forest inventories. http://www.norden.org/pub/ebook/2003‑514.pdf
FRA 2005 (Global forest resources assessment update) (2005): Terms and definitions (Final version). FAO Forestry Department. Rome, 2004. http://www.fao.org/documents/show_cdr.asp?url_file=/docrep/007/ae156e/ae156e00.htm
IUFRO (2000): Terminology of Forest Management. Terms and Definitions in English. IUFRO World Series Vol. 9‑en. IUFRO Secretariat Vienna. (Or: SilvaTerm Database. Available at http://iufro.boku.ac.at/iufro/silvavoc/svdatabase.htm).
Kuusela, K. 1994. Forest resources in Europe 1950–1990. Cambridge University Press.
MCPFE (2000): TBFRA Supplementary Enquiry for Data on Protected and Protective Forests and Other Wooded Land. MCPFE and UNECE, Geneva.
MCPFE (2002): MCPFE Assessment Guidelines for Protected and Protective Forest and Other Wooded Land in Europe as adopted by the MCPFE Expert Level Meeting, 10– 11 June 2002, Vienna, Austria.
MCPFE (2003): State of Europe's Forests 2003. The MCPFE Report on Sustainable Forest Management in Europe. Jointly prepared by MCPFE Liaison Unit Vienna and UNECE/FAO. Vienna.
SEC(2005) 161 final: Communication from Mr. Almunia to the members of the Commission. Sustainable Development Indicators to monitor the implementation of the EU Sustainable Development Strategy.
UNECE/FAO (2000): Forest Resources of Europe, CIS, North America, Australia, Japan and New Zealand (TBFRA 2000). Main report. UNECE/FAO Contribution to the Global Forest Resources Assessment 2000. United Nations, New York and Geneva.
UNECE/FAO (2005): Global Forest Resources Assessment 2005, Data for Europe. United Nations, New York and Geneva.
147
19Agriculture:nitrogenbalance
Halting the loss of biodiversity by 2010: proposal for a first set of indicators to monitor progress in Europe
Focalarea Sustainable use
Europeanindicatorheadline
Area of forest, agricultural, fishery and aquaculture ecosystems under sustainable management
Keypolicyquestion How important is agriculture as a driver of biodiversity loss? Is the impact of agriculture being reduced?
Definition of the indicator
'Gross nitrogen balance' estimates the potential surplus of nitrogen on agricultural land. This is done by calculating the balance between nitrogen added to an agricultural system (nitrogen input can be taken as a proxy indicator for the general intensity of agricultural management) and nitrogen removed from the system per hectare of agricultural land. The indicator accounts for all inputs to and outputs from the farm, and therefore includes nitrogen input.
Indicatortype(DPSIR) Pressure
Context High nitrogen inputs and losses generally coincide with high phosphorous and pesticide inputs and losses. The nitrogen balance is related to nutrient leaching risks. High nitrogen inputs and nitrogen imbalances normally lead to high pressure on biodiversity within and outside the farmed environment.
Agriculture is intensifying in many places and causes an increasing pressure on biodiversity. Increasing nitrogen availability favours a few nitrophilous species and suppresses many other, rarer species. 'Nitrogen balance' includes nitrogen input (inter alia fertilising, nitrogen fixation, nitrogen deposition) and nitrogen output (inter alia denitrification and the emission of ammonia) and thus reflects a major part of the nitrogen cycle and the impact of farm management to the hydrosphere and atmosphere. nitrogen input (fertilising and nitrogen fixation) more directly affects the level of biodiversity in fields and grasslands.
Relationoftheindicatortothefocalarea
Sustainable management of agricultural ecosystems would manage the nitrogen‑balance to minimise the negative effects from excess nitrogen.
Data sources and methodologyDataavailability Eurostat (Farm Structure Survey in particular).
IRENA and OECD data sets.FAOSTAT.
For more details see the specification of EEA core set indicator 025 at http://themes.eea.europa.eu/IMS/IMS/ISpecs/ISpecification20041007132056/full_spec.
•••
Methodology Calculation of the indicator per country: see the OECD/Eurostat gross nutrient balance handbook. For more details see the specification of EEA core set indicator 025 at http://themes.eea.europa.eu/IMS/IMS/ISpecs/ISpecification20041007132056/full_spec.
Total Nitrogen input:
Total fertilisers.Inorganic fertilisers (simple mineral fertilisers, Complex mineral fertilisers, Mineral‑organic compounds).Organic fertilisers (urban compost, sewage sludge spread on agricultural land)Livestock manure production.Manure stocks (stock levels, imports and exports of livestock manure). Biological nitrogen fixation (nitrogen fixed in the soil).Atmospheric deposition of nitrogen compounds.Other inputs (seeds and planting material, ...).
Total nitrogen outputs from farm unit: total harvested crops and forage.
Subtracting the sum of the total nitrogen output from the total nitrogen input results in the gross nutrient balance for nitrogen.
••
••••••
19 Agriculture:nitrogenbalance
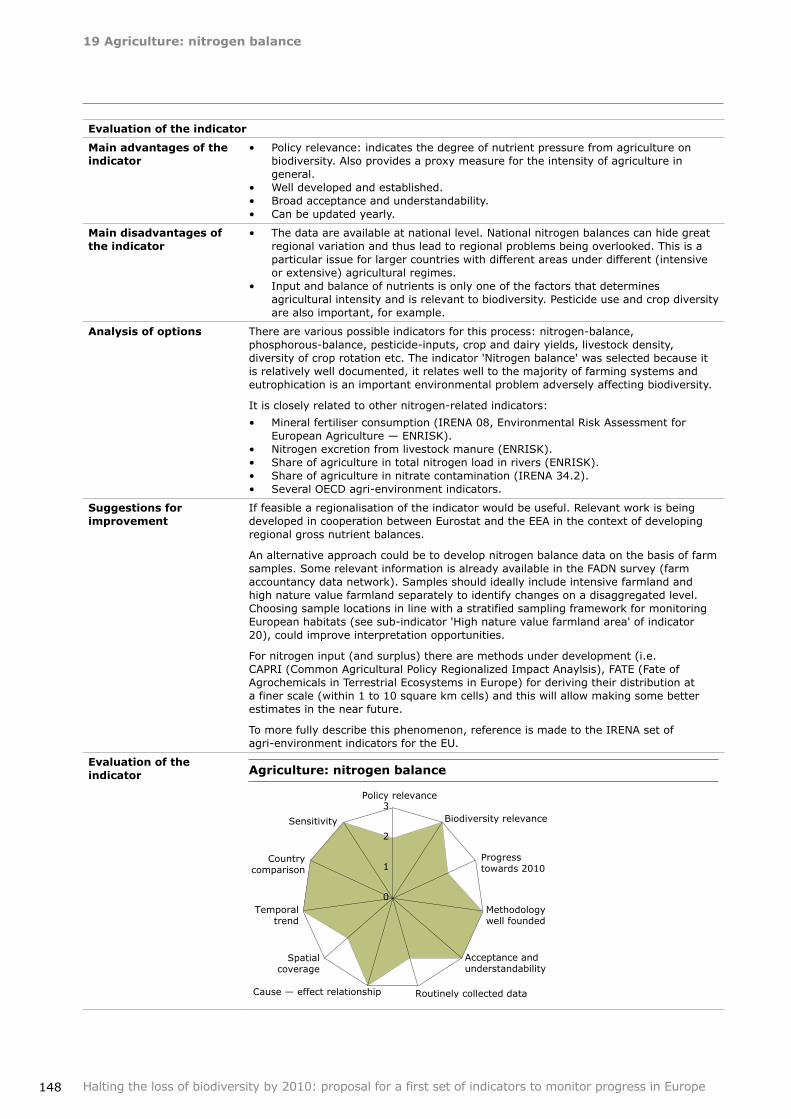
19Agriculture:nitrogenbalance
148 Halting the loss of biodiversity by 2010: proposal for a first set of indicators to monitor progress in Europe
Evaluationoftheindicator
Mainadvantagesoftheindicator
Policy relevance: indicates the degree of nutrient pressure from agriculture on biodiversity. Also provides a proxy measure for the intensity of agriculture in general. Well developed and established.Broad acceptance and understandability.Can be updated yearly.
•
•••
Maindisadvantagesoftheindicator
The data are available at national level. National nitrogen balances can hide great regional variation and thus lead to regional problems being overlooked. This is a particular issue for larger countries with different areas under different (intensive or extensive) agricultural regimes.Input and balance of nutrients is only one of the factors that determines agricultural intensity and is relevant to biodiversity. Pesticide use and crop diversity are also important, for example.
•
•
Analysisofoptions There are various possible indicators for this process: nitrogen‑balance, phosphorous‑balance, pesticide‑inputs, crop and dairy yields, livestock density, diversity of crop rotation etc. The indicator 'Nitrogen balance' was selected because it is relatively well documented, it relates well to the majority of farming systems and eutrophication is an important environmental problem adversely affecting biodiversity.
It is closely related to other nitrogen‑related indicators:
Mineral fertiliser consumption (IRENA 08, Environmental Risk Assessment for European Agriculture — ENRISK).Nitrogen excretion from livestock manure (ENRISK).Share of agriculture in total nitrogen load in rivers (ENRISK).Share of agriculture in nitrate contamination (IRENA 34.2).Several OECD agri‑environment indicators.
•
••••
Suggestionsforimprovement
If feasible a regionalisation of the indicator would be useful. Relevant work is being developed in cooperation between Eurostat and the EEA in the context of developing regional gross nutrient balances.
An alternative approach could be to develop nitrogen balance data on the basis of farm samples. Some relevant information is already available in the FADN survey (farm accountancy data network). Samples should ideally include intensive farmland and high nature value farmland separately to identify changes on a disaggregated level. Choosing sample locations in line with a stratified sampling framework for monitoring European habitats (see sub‑indicator 'High nature value farmland area' of indicator 20), could improve interpretation opportunities.
For nitrogen input (and surplus) there are methods under development (i.e. CAPRI (Common Agricultural Policy Regionalized Impact Anaylsis), FATE (Fate of Agrochemicals in Terrestrial Ecosystems in Europe) for deriving their distribution at a finer scale (within 1 to 10 square km cells) and this will allow making some better estimates in the near future.
To more fully describe this phenomenon, reference is made to the IRENA set of agri‑environment indicators for the EU.
Evaluationoftheindicator Agriculture:nitrogenbalance
0
1
2
3 Policy relevance
Biodiversity relevance
Progress towards 2010
Methodology well founded
Acceptance and understandability
Routinely collected data Cause — effect relationship
Spatial coverage
Temporal trend
Country comparison
Sensitivity
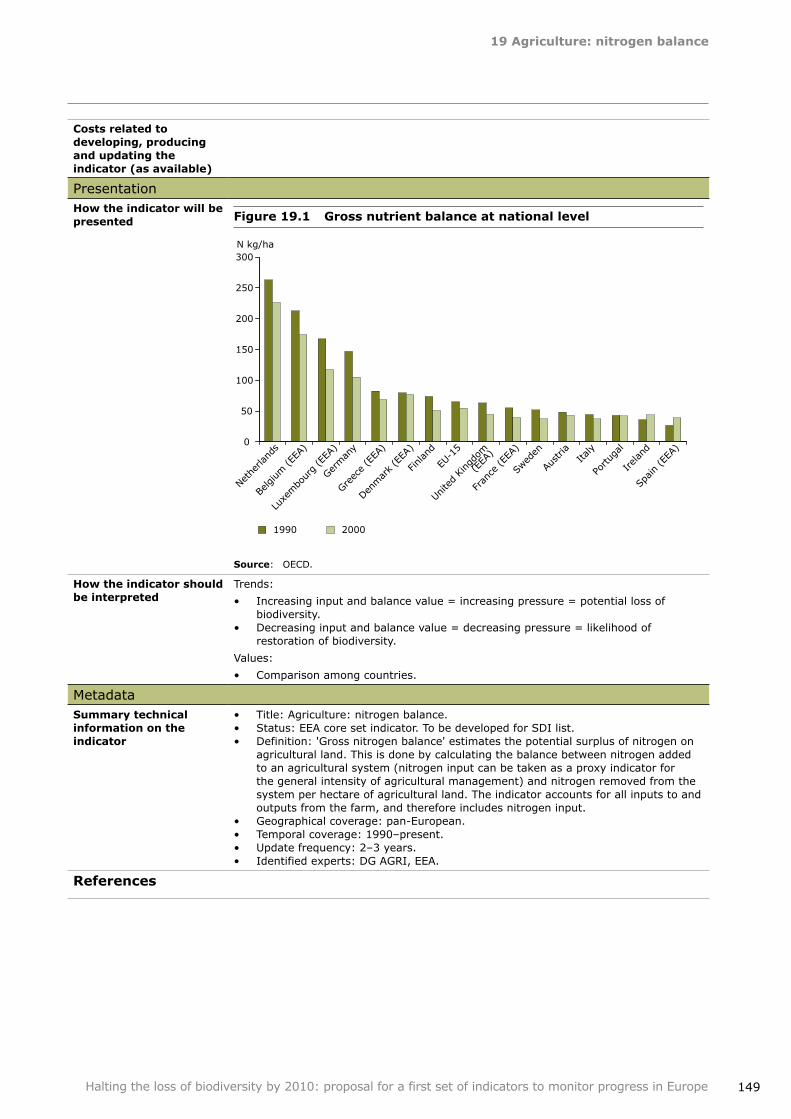
19Agriculture:nitrogenbalance
149Halting the loss of biodiversity by 2010: proposal for a first set of indicators to monitor progress in Europe
Costsrelatedtodeveloping,producingandupdatingtheindicator(asavailable)
PresentationHowtheindicatorwillbepresented Figure19.1 Grossnutrientbalanceatnationallevel
Source: OECD.
Howtheindicatorshouldbeinterpreted
Trends:
Increasing input and balance value = increasing pressure = potential loss of biodiversity.Decreasing input and balance value = decreasing pressure = likelihood of restoration of biodiversity.
Values:
Comparison among countries.
•
•
•
MetadataSummarytechnicalinformationontheindicator
Title: Agriculture: nitrogen balance.Status: EEA core set indicator. To be developed for SDI list.Definition: 'Gross nitrogen balance' estimates the potential surplus of nitrogen on agricultural land. This is done by calculating the balance between nitrogen added to an agricultural system (nitrogen input can be taken as a proxy indicator for the general intensity of agricultural management) and nitrogen removed from the system per hectare of agricultural land. The indicator accounts for all inputs to and outputs from the farm, and therefore includes nitrogen input.Geographical coverage: pan‑European.Temporal coverage: 1990–present.Update frequency: 2–3 years.Identified experts: DG AGRI, EEA.
•••
••••
References
0
50
100
150
200
250
300
Nethe
rland
s
Belgium (E
EA)
Luxe
mbo
urg (E
EA)
German
y
Greec
e (E
EA)
Denmar
k (E
EA)
Finlan
d
EU-1
5
Unite
d King
dom
(EEA
)
Fran
ce (E
EA)
Swed
en
Austria
Italy
Portu
gal
Irelan
d
Spain (E
EA)
N kg/ha
1990 2000
150
20Agriculture:areaundermanagementpracticespotentiallysupportingbiodiversity
Halting the loss of biodiversity by 2010: proposal for a first set of indicators to monitor progress in Europe
Focalarea Sustainable use
Europeanindicatorheadline
Area of forest, agricultural, fishery and aquaculture ecosystems under sustainable management
Keypolicyquestion How can agriculture be managed to promote the conservation of biodiversity?
Definition of the indicator
This indicator is based on three sub‑indicators and shows trends in area (as proportion of the total utilised area) of three (not mutually exclusive) categories of agricultural land:
a. High nature value farmland area. b. Area under organic farming. c. Area under biodiversity supportive agri‑environment schemes.
a. 'High nature value farmland area' (ha) indicates the area where farming systems are sustaining a high level of biodiversity. They are often characterised by extensive farming practices, associated with a high species and habitat diversity or the presence of species of European conservation concern.
b. 'Area under organic farming' (ha) indicates trends in the organic farming area and the share of the organic farming area in the total utilised agricultural area. Farming is only considered to be organic at EU level if it complies with Council Regulation (EEC) No 2092/91.
c. 'Area under biodiversity supportive agri‑environment schemes' (ha) indicates where farming systems are generally focusing on sustainability. For non‑EU countries this information is not available. In theory, 'Budget for biodiversity supportive measures' could be used as a proxy indicator but this no longer indicates an 'area' as suggested by the Headline Indicator.
The three sub indicators are adopted from the IRENA set of indicators (IRENA 26, 7 and 1 respectively). See www.eea.europa.eu/projects/irena/products.
Indicatortype(DPSIR) a. High nature value farmland area: state.
b. Area under organic farming: response.
c. Area under biodiversity supportive agri‑environment schemes: response.
Context a.Highnaturevaluefarmlandarea
High nature value farmland areas mostly coincide with traditional or extensive agricultural systems. They have one or more of following characteristics:
dominated by semi‑natural vegetation;dominated by a mosaic of different low intensity agricultural land uses and natural and structural elements,hosting rare species or supporting a high proportion of their European or global populations.
Loss of high nature value farmland is a result of intensification, as well as of abandonment and urbanisation.
b.Areaunderorganicfarming
By caring for the whole system organic farming generally favours biodiversity (Hole et al. 2005), though more productive faming systems may also support opportunities for biodiversity.
Recent literature reviews provide more information on environmental impacts of organic agriculture compared with conventional management systems. The results are not always unambiguous: the environmental benefits of organic farming are most clearly documented for biodiversity and for water and soil conservation, but there is no clear evidence of reduced greenhouse gas emissions. Organic agriculture is likely to have a more positive environmental impact in areas with highly intensive agriculture
••
•
20 Agriculture:areaundermanagementpracticespotentiallysupportingbiodiversity
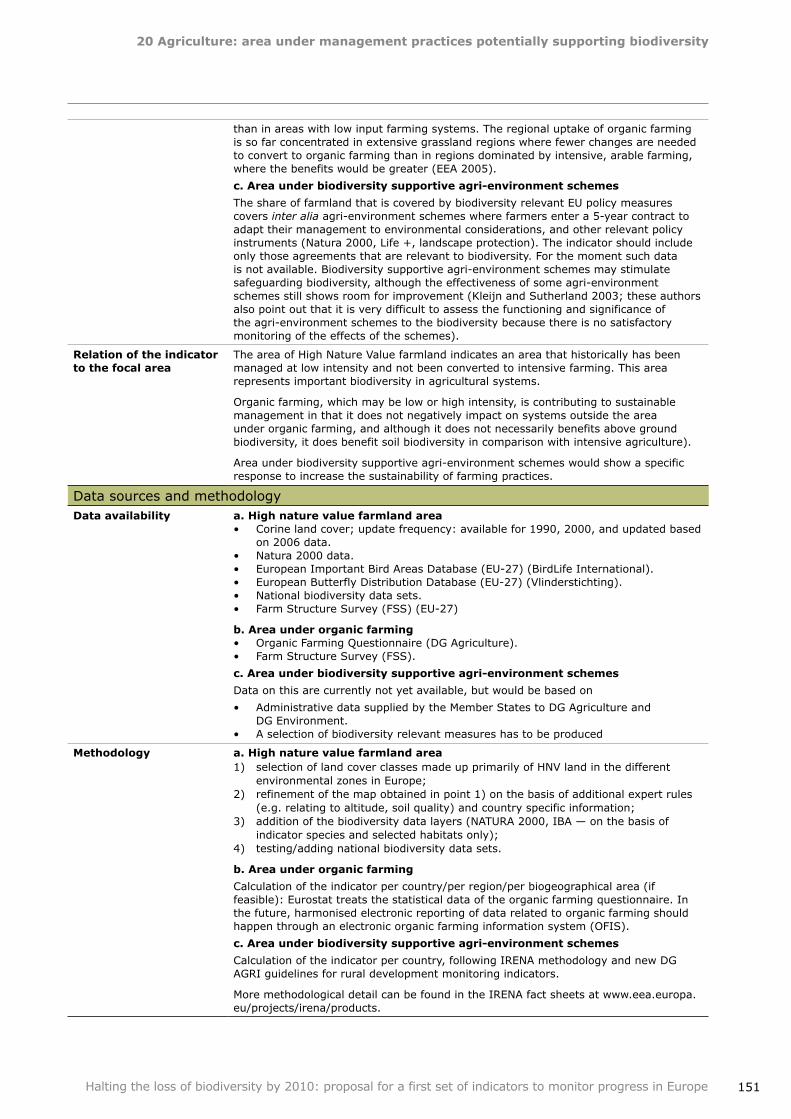
20Agriculture:areaundermanagementpracticespotentiallysupportingbiodiversity
151Halting the loss of biodiversity by 2010: proposal for a first set of indicators to monitor progress in Europe
than in areas with low input farming systems. The regional uptake of organic farming is so far concentrated in extensive grassland regions where fewer changes are needed to convert to organic farming than in regions dominated by intensive, arable farming, where the benefits would be greater (EEA 2005).
c.Areaunderbiodiversitysupportiveagri‑environmentschemes
The share of farmland that is covered by biodiversity relevant EU policy measures covers inter alia agri‑environment schemes where farmers enter a 5‑year contract to adapt their management to environmental considerations, and other relevant policy instruments (Natura 2000, Life +, landscape protection). The indicator should include only those agreements that are relevant to biodiversity. For the moment such data is not available. Biodiversity supportive agri‑environment schemes may stimulate safeguarding biodiversity, although the effectiveness of some agri‑environment schemes still shows room for improvement (Kleijn and Sutherland 2003; these authors also point out that it is very difficult to assess the functioning and significance of the agri‑environment schemes to the biodiversity because there is no satisfactory monitoring of the effects of the schemes).
Relationoftheindicatortothefocalarea
The area of High Nature Value farmland indicates an area that historically has been managed at low intensity and not been converted to intensive farming. This area represents important biodiversity in agricultural systems.
Organic farming, which may be low or high intensity, is contributing to sustainable management in that it does not negatively impact on systems outside the area under organic farming, and although it does not necessarily benefits above ground biodiversity, it does benefit soil biodiversity in comparison with intensive agriculture).
Area under biodiversity supportive agri‑environment schemes would show a specific response to increase the sustainability of farming practices.
Data sources and methodologyDataavailability a.Highnaturevaluefarmlandarea
Corine land cover; update frequency: available for 1990, 2000, and updated based on 2006 data.Natura 2000 data.European Important Bird Areas Database (EU‑27) (BirdLife International).European Butterfly Distribution Database (EU‑27) (Vlinderstichting).National biodiversity data sets.Farm Structure Survey (FSS) (EU‑27)
b.AreaunderorganicfarmingOrganic Farming Questionnaire (DG Agriculture).Farm Structure Survey (FSS).
c.Areaunderbiodiversitysupportiveagri‑environmentschemes
Data on this are currently not yet available, but would be based on
Administrative data supplied by the Member States to DG Agriculture and DG Environment.A selection of biodiversity relevant measures has to be produced
•
•••••
••
•
•
Methodology a.Highnaturevaluefarmlandarea1) selection of land cover classes made up primarily of HNV land in the different
environmental zones in Europe;2) refinement of the map obtained in point 1) on the basis of additional expert rules
(e.g. relating to altitude, soil quality) and country specific information;3) addition of the biodiversity data layers (NATURA 2000, IBA — on the basis of
indicator species and selected habitats only);4) testing/adding national biodiversity data sets.
b.Areaunderorganicfarming
Calculation of the indicator per country/per region/per biogeographical area (if feasible): Eurostat treats the statistical data of the organic farming questionnaire. In the future, harmonised electronic reporting of data related to organic farming should happen through an electronic organic farming information system (OFIS).
c.Areaunderbiodiversitysupportiveagri‑environmentschemes
Calculation of the indicator per country, following IRENA methodology and new DG AGRI guidelines for rural development monitoring indicators.
More methodological detail can be found in the IRENA fact sheets at www.eea.europa.eu/projects/irena/products.
20Agriculture:areaundermanagementpracticespotentiallysupportingbiodiversity
152 Halting the loss of biodiversity by 2010: proposal for a first set of indicators to monitor progress in Europe
Evaluation of the indicatorMainadvantagesoftheindicator
The combined indicator has a number of advantages:
Policy relevance: direct links to EU policies (organic agriculture and agri‑environment schemes).Established methodology: included in the IRENA set.Allows for easy comparison between countries, biogeographical areas, and (indirectly) agricultural systems by presenting the indicator as a percentage of the total agricultural area.
In addition, the components have the following advantages:
a.Highnaturevaluefarmlandarea
Indicates the agricultural area with a potential high biodiversity and gives a clear and simple message on the biodiversity in the agricultural area.
b.AreaunderorganicfarmingYearly available.
c.Areaunderbiodiversitysupportiveagri‑environmentschemesIndicates the agricultural area where special efforts are being directed towards biodiversity and gives an indication of the political awareness and commitment.Once defined it will be available yearly.
•
••
•
•
Maindisadvantagesoftheindicator
a.HighnaturevaluefarmlandareaEven if Corine will be updated every 5/6 years instead of the 10 year first cycle, the regularity is not considered to be sufficient for monitoring area changes. The current data sets at European level only allow providing area estimates at NUTS2 level.
b.Areaunderorganicfarming
Proxy‑indicator: there is a reasonable correlation between organic farming and biodiversity, but there are exceptions as organic farms can also be intensively managed (even without chemical inputs). Therefore one might have to consider selecting a sub‑set of organic farms only, e.g. mixed farms only.
Area under organic farming does not give the total area of agriculture managed with biodiversity in mind as biodiversity concerns can also be integrated in non‑organic farming.
c.Areaunderbiodiversitysupportiveagri‑environmentschemes
Some agri‑environment support is directed towards environmental protection, and only agri‑environmental support that focuses on biodiversity should be selected. Several policy instruments are partly favourable to biodiversity and partly not; additional complexity is added by national implementation of the measures
•
•
Analysisofoptions The proposed indicator is a combination of three existing IRENA indicators. These were selected because they are the best available agricultural indicators at the European level.
Suggestionsforimprovement
a.HighnaturevaluefarmlandareaThe most promising approach for the future development of this indicator lies in a systematic addition of national (biodiversity) data.For a more frequent update of the 'High nature value farmland area' indicator, a stratified network of representative sample areas could be set up, to monitor changes in the surface of high nature value farmland every 2–3 years. This would involve some costs since these updates could not rely on automated procedures and existing data. Such an approach could utilize modern, more sophisticated satellite observation techniques, as well as standard field survey techniques. Recently a 'Sampling framework and strategy for monitoring of European habitats' has been developed by the BIOHAB and BIOPRESS research communities (www.biohab.alterra.nl; http://www.creaf.uab.es/biopress), estimating the total cost of different approaches (Jongman et al., 2006). The methods mentioned earlier are not fully satisfactory and in many countries work to estimate the HNV area using national data, information and methods is underway.
c.Areaunderbiodiversitysupportiveagri‑environmentschemes
Biodiversity relevant measures have to be defined in a transparent manner (possibly considered at a certain percentage if only partly relevant).
•
•
•
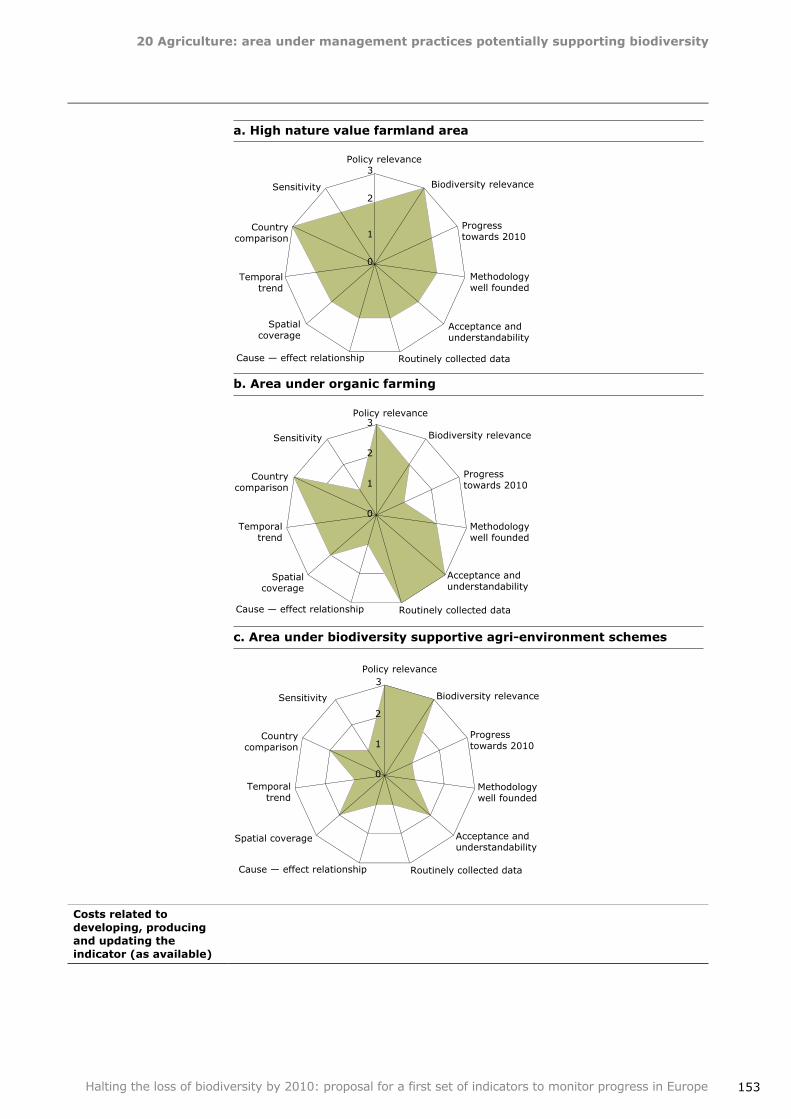
20Agriculture:areaundermanagementpracticespotentiallysupportingbiodiversity
153Halting the loss of biodiversity by 2010: proposal for a first set of indicators to monitor progress in Europe
a.Highnaturevaluefarmlandarea
b.Areaunderorganicfarming
c.Areaunderbiodiversitysupportiveagri‑environmentschemes
Costsrelatedtodeveloping,producingandupdatingtheindicator(asavailable)
0
1
2
3 Policy relevance
Biodiversity relevance
Progress towards 2010
Methodology well founded
Acceptance and understandability
Routinely collected data Cause — effect relationship
Spatial coverage
Temporal trend
Country comparison
Sensitivity
0
1
2
3 Policy relevance
Biodiversity relevance
Progress towards 2010
Methodology well founded
Acceptance and understandability
Routinely collected data Cause — effect relationship
Spatial coverage
Temporal trend
Country comparison
Sensitivity
0
1
2
3 Policy relevance
Biodiversity relevance
Progress towards 2010
Methodology well founded
Acceptance and understandability
Routinely collected data Cause — effect relationship
Spatial coverage
Temporal trend
Country comparison
Sensitivity
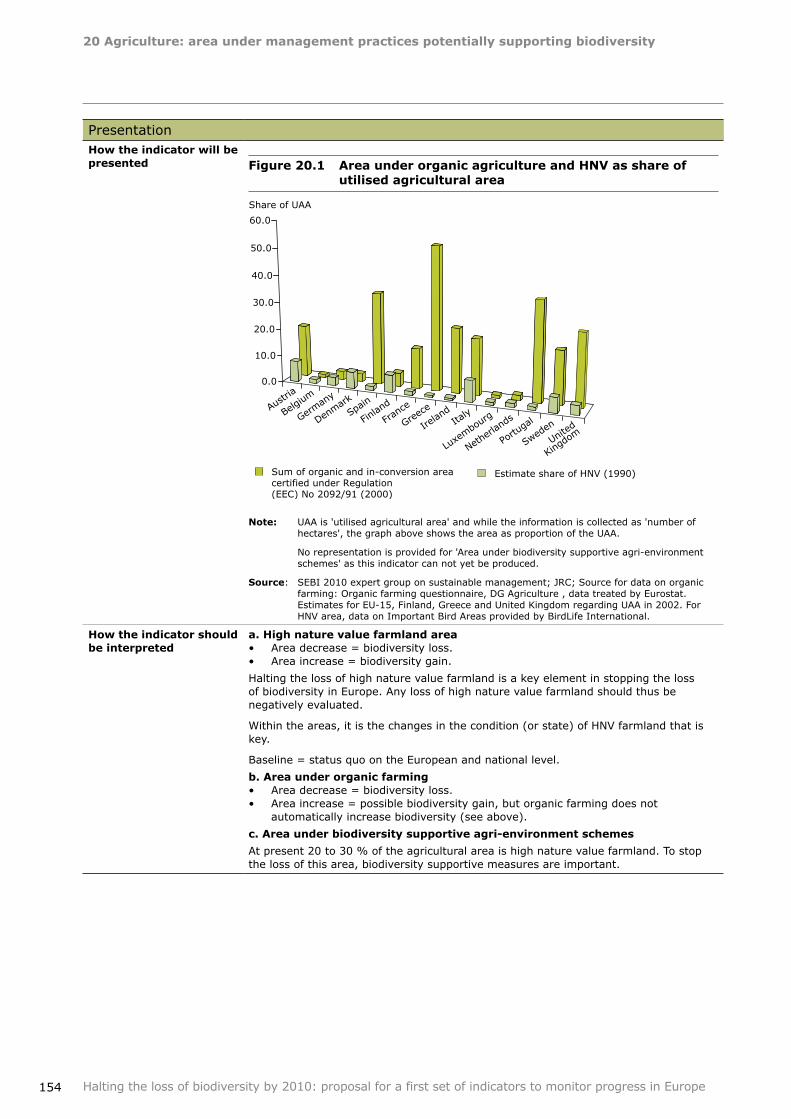
20Agriculture:areaundermanagementpracticespotentiallysupportingbiodiversity
154 Halting the loss of biodiversity by 2010: proposal for a first set of indicators to monitor progress in Europe
PresentationHowtheindicatorwillbepresented Figure20.1 AreaunderorganicagricultureandHNVasshareof
utilisedagriculturalarea
Note: UAA is 'utilised agricultural area' and while the information is collected as 'number of hectares', the graph above shows the area as proportion of the UAA.
No representation is provided for 'Area under biodiversity supportive agri‑environment schemes' as this indicator can not yet be produced.
Source: SEBI 2010 expert group on sustainable management; JRC; Source for data on organic farming: Organic farming questionnaire, DG Agriculture , data treated by Eurostat. Estimates for EU‑15, Finland, Greece and United Kingdom regarding UAA in 2002. For HNV area, data on Important Bird Areas provided by BirdLife International.
Howtheindicatorshouldbeinterpreted
a.HighnaturevaluefarmlandareaArea decrease = biodiversity loss.Area increase = biodiversity gain.
Halting the loss of high nature value farmland is a key element in stopping the loss of biodiversity in Europe. Any loss of high nature value farmland should thus be negatively evaluated.
Within the areas, it is the changes in the condition (or state) of HNV farmland that is key.
Baseline = status quo on the European and national level.
b.AreaunderorganicfarmingArea decrease = biodiversity loss.Area increase = possible biodiversity gain, but organic farming does not automatically increase biodiversity (see above).
c.Areaunderbiodiversitysupportiveagri‑environmentschemes
At present 20 to 30 % of the agricultural area is high nature value farmland. To stop the loss of this area, biodiversity supportive measures are important.
••
••
Austri
a
Belgium
German
y
Denmark
Spain
Finlan
d
Franc
e
Greece
Irelan
dIta
ly
Luxe
mbour
g
Netherl
ands
Portu
gal
Sweden
United
Kingdo
m
0.0
10.0
20.0
30.0
40.0
50.0
60.0
Sum of organic and in-conversion areacertified under Regulation(EEC) No 2092/91 (2000)
Estimate share of HNV (1990)
Share of UAA
20Agriculture:areaundermanagementpracticespotentiallysupportingbiodiversity
155Halting the loss of biodiversity by 2010: proposal for a first set of indicators to monitor progress in Europe
MetadataSummarytechnicalinformationontheindicator
Title: Agriculture: area under management practices potentially supporting biodiversity Status: area under organic farming is a EEA core set indicator. All three sub‑indicators are IRENA indicators. The SDI list contains 'Area under agri‑environmental commitments; Area under organic farming'.Definition: this indicator is based on three sub‑indicators and shows trends in area (as proportion of the total utilised area) of three (not mutually exclusive) categories of agricultural land:
a. High nature value farmland areab. Area under organic farmingc. Area under biodiversity supportive agri‑environment schemesGeographical coverage: a. High nature value farmland area: pan‑Europeanb. Area under organic farming: EU Member Statesc. Area under biodiversity supportive agri‑environment schemes: EU Member
StatesTemporal coverage: 1985–present for organic farming. HNV farmland: 2000.Update frequency: organic farming 1998–present, HNV and agri‑environment schemes tbd.Identified experts: EEA, DG AGRI, ESTAT.
•
•
•
•
••
•
References EEA (European Environment Agency), 2005. The European environment — State and outlook 2005. Copenhagen.
Bengtsson, J.A. and Weibull, A.‑C. 2005. The effects of organic agriculture on biodiversity and abundance: a meta‑analysis, Journal of Applied Ecology 42 (2), 261– 269.
Jongman, R. H. G. ; Bunce, R. G. H.; Metzger, M. J.; Mücher, C. A.; Howard, D. C. and Mateus, V. L. . 2006. Objectives and Applications of a Statistical Environmental Stratification of Europe. Landscape Ecology Volume 21, Number 3/April, 2006.
Kleijn, D. and Sutherland, W.J. . 2003. How effective are agri‑environment schemes in conserving and promoting biodiversity?. J. Appl. Ecol. 40, pp. 947–969.
156
21Fisheries:Europeancommercialfishstocks
Halting the loss of biodiversity by 2010: proposal for a first set of indicators to monitor progress in Europe
Focalarea Sustainable use
Europeanindicatorheadline
Area of forest, agricultural, fishery and aquaculture ecosystems under sustainable management
Keypolicyquestion What is the status of European commercial fish stocks, and what can be done to prevent stocks from collapsing?
Definition of the indicator
Annual change of proportion of commercial fish stocks within safe biological limits (SBL) in European Seas and per fisheries management unit.
Indicatortype(DPSIR) Pressure
Context One of the main goals of the EU Common Fisheries Policy (CFP) is to take conservation measures to prevent fish stocks from being overexploited.
By comparing trends over time in recruitment (R), spawning stock biomass (SSB), landings and fishing mortality (F), a fairly reliable picture of stock development can be derived. In general when mortality exceeds recruitment and growth, a stock can be characterised as being outside safe biological limits.
Relationoftheindicatortothefocalarea
The 'proportion of commercial fish stocks within and outside safe biological limits' is an indication of the extent to which fish stocks have not been sustainably managed, but overexploited.
Whether all stocks should be within safe biological limits is a societal/political choice. For the individual stocks, and for biodiversity, a sustainably managed stock needs to be within safe biological limits.
Data sources and methodologyDataavailability The status of many commercial stocks in the northe‑east Atlantic and Baltic area
is assessed by ICES (International Council for the Exploration of the Sea) and data are publicly available from the ICES database (http://www.ices.dk/datacentre/StdGraphDB.asp).
The status of fish stocks in the Mediterranean is assessed by the GFCM (General Fisheries Commission for the Mediterranean) and data are available from the GFCM website (http://www.fao.org/fi/body/rfb/GFCM/gfcm_home.htm).
Methodology With the introduction of the precautionary approach, a stock is considered to be outside 'Safe Biological Limits' (SBL) when the Spawning Stock Biomass (SSB) (the mature part of a stock) is below a biomass precautionary approach reference point (Bpa), or when the Fishing mortality (F) (an expression of the proportion of a stock that is removed by fishing activities in a year) exceeds a fishing mortality precautionary approach reference point (Fpa), or when both conditions exist. This is the approach followed for stocks in the north‑east Atlantic and Baltic Sea.
In the Mediterranean, stock assessment is at a relative early stage of development judged by the criteria of North Atlantic fisheries, and the development of reference points is still underway. Stock assessment of the Mediterranean resources is based mainly on analysis of landing trends, biomass surveys, and the analysis of commercial catch per unit effort (CPUE) data, given the absence of complete or independent information on fishing intensity or fishing mortality, and stocks are assessed in terms of being over fished or not.
More details can be found in the specification sheet for EEA Core Set indicator 032 at http://themes.eea.europa.eu/IMS/IMS/ISpecs/ISpecification20041007132227/full_spec.
21 Fisheries:Europeancommercialfishstocks
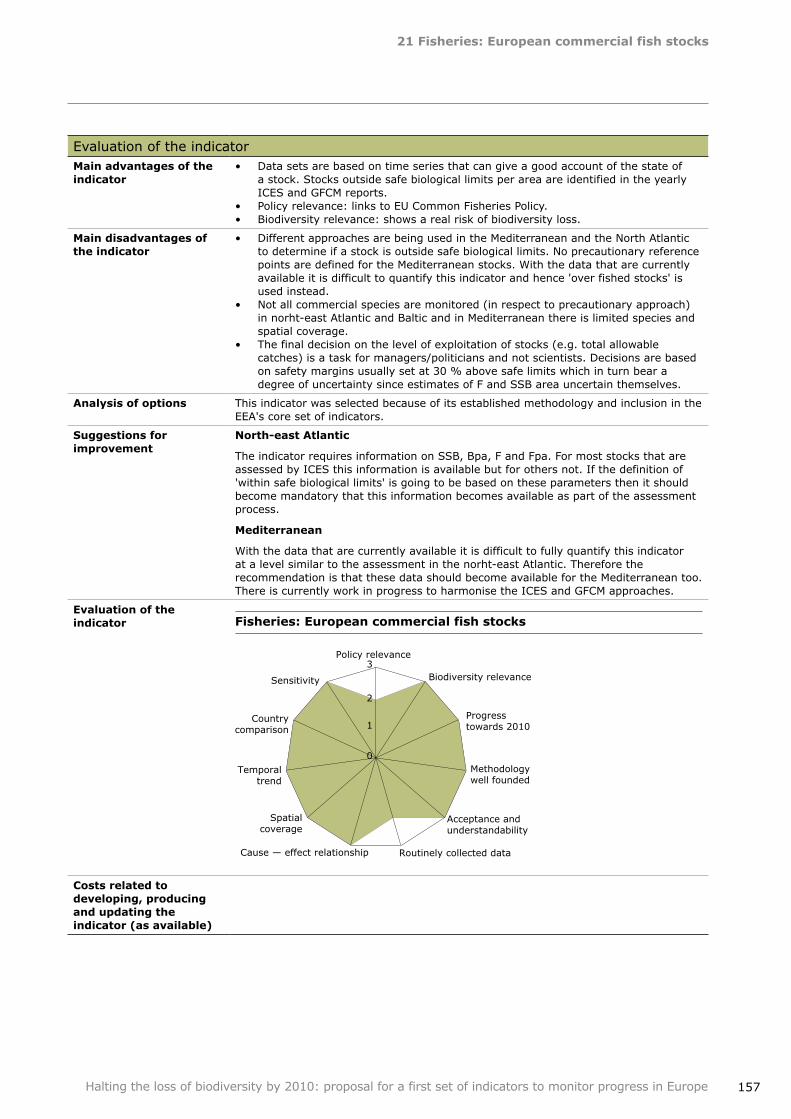
21Fisheries:Europeancommercialfishstocks
157Halting the loss of biodiversity by 2010: proposal for a first set of indicators to monitor progress in Europe
Evaluation of the indicatorMainadvantagesoftheindicator
Data sets are based on time series that can give a good account of the state of a stock. Stocks outside safe biological limits per area are identified in the yearly ICES and GFCM reports. Policy relevance: links to EU Common Fisheries Policy.Biodiversity relevance: shows a real risk of biodiversity loss.
•
••
Maindisadvantagesoftheindicator
Different approaches are being used in the Mediterranean and the North Atlantic to determine if a stock is outside safe biological limits. No precautionary reference points are defined for the Mediterranean stocks. With the data that are currently available it is difficult to quantify this indicator and hence 'over fished stocks' is used instead.Not all commercial species are monitored (in respect to precautionary approach) in norht‑east Atlantic and Baltic and in Mediterranean there is limited species and spatial coverage. The final decision on the level of exploitation of stocks (e.g. total allowable catches) is a task for managers/politicians and not scientists. Decisions are based on safety margins usually set at 30 % above safe limits which in turn bear a degree of uncertainty since estimates of F and SSB area uncertain themselves.
•
•
•
Analysisofoptions This indicator was selected because of its established methodology and inclusion in the EEA's core set of indicators.
Suggestionsforimprovement
North‑eastAtlantic
The indicator requires information on SSB, Bpa, F and Fpa. For most stocks that are assessed by ICES this information is available but for others not. If the definition of 'within safe biological limits' is going to be based on these parameters then it should become mandatory that this information becomes available as part of the assessment process.
Mediterranean
With the data that are currently available it is difficult to fully quantify this indicator at a level similar to the assessment in the norht‑east Atlantic. Therefore the recommendation is that these data should become available for the Mediterranean too. There is currently work in progress to harmonise the ICES and GFCM approaches.
Evaluationoftheindicator Fisheries:Europeancommercialfishstocks
Costsrelatedtodeveloping,producingandupdatingtheindicator(asavailable)
0
1
2
3 Policy relevance
Biodiversity relevance
Progress towards 2010
Methodology well founded
Acceptance and understandability
Routinely collected data Cause — effect relationship
Spatial coverage
Temporal trend
Country comparison
Sensitivity
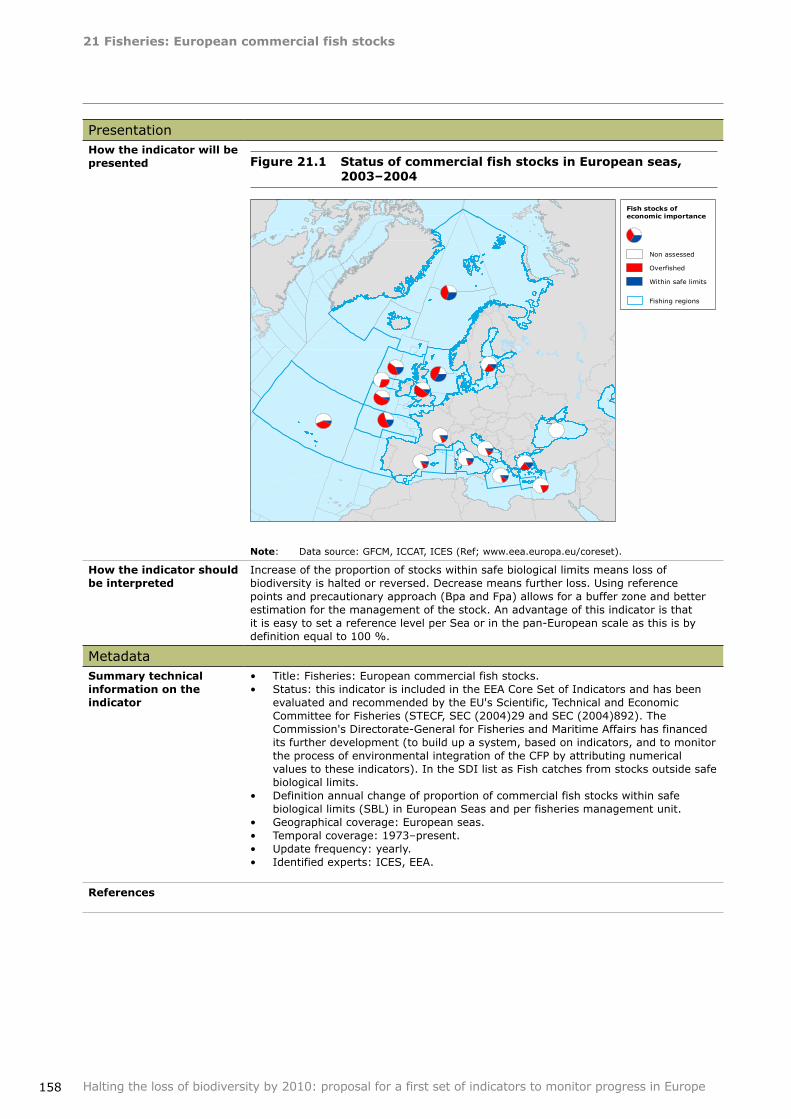
21Fisheries:Europeancommercialfishstocks
158 Halting the loss of biodiversity by 2010: proposal for a first set of indicators to monitor progress in Europe
PresentationHowtheindicatorwillbepresented Figure21.1 StatusofcommercialfishstocksinEuropeanseas,
2003–2004
Note: Data source: GFCM, ICCAT, ICES (Ref; www.eea.europa.eu/coreset).
Howtheindicatorshouldbeinterpreted
Increase of the proportion of stocks within safe biological limits means loss of biodiversity is halted or reversed. Decrease means further loss. Using reference points and precautionary approach (Bpa and Fpa) allows for a buffer zone and better estimation for the management of the stock. An advantage of this indicator is that it is easy to set a reference level per Sea or in the pan‑European scale as this is by definition equal to 100 %.
MetadataSummarytechnicalinformationontheindicator
Title: Fisheries: European commercial fish stocks.Status: this indicator is included in the EEA Core Set of Indicators and has been evaluated and recommended by the EU's Scientific, Technical and Economic Committee for Fisheries (STECF, SEC (2004)29 and SEC (2004)892). The Commission's Directorate‑General for Fisheries and Maritime Affairs has financed its further development (to build up a system, based on indicators, and to monitor the process of environmental integration of the CFP by attributing numerical values to these indicators). In the SDI list as Fish catches from stocks outside safe biological limits.Definition annual change of proportion of commercial fish stocks within safe biological limits (SBL) in European Seas and per fisheries management unit.Geographical coverage: European seas.Temporal coverage: 1973–present.Update frequency: yearly.Identified experts: ICES, EEA.
••
•
••••
References
Fi sh st oc ks of ec on om ic im po rt ance
Fi sh in g re gi on s
Wi th in sa fe li mi ts
Non as se sse d
Ov er fi sh ed
159
22Aquaculture:effluentwaterqualityfromfinfishfarms
Halting the loss of biodiversity by 2010: proposal for a first set of indicators to monitor progress in Europe
Focalarea Sustainable use
Europeanindicatorheadline
Area of forest, agricultural, fishery and aquaculture ecosystems under sustainable management
Keypolicyquestion How much nutrients are released from aquaculture? How can the impacts of aquaculture on biodiversity be limited?
Definition of the indicator
Annual trend in release of nutrients into the marine environment as a result of aquaculture practices.
Indicatortype(DPSIR) Pressure
Context The importance of aquaculture as a source of fish protein in the EU is increasing. In 2004 aquaculture contributed almost 19 % to the total fisheries production of EU–25 an increase of nearly 2 % over the situation in 2000. However, this was not due to an increase in aquaculture production, which has remained relatively stable since 2000, but due primarily to a decrease of nearly 10 % in the total fisheries production. One of the goals of the EU Common Fisheries Policy (CFP) is to take measures to mitigate the impact of aquaculture on the environment.
In general, effluent water quality is determined by the concentration of nutrients in the discharge water and hence by the amount of nutrients produced that will be discharged, and the flow rate of the effluent. In the case of aquaculture the production of nutrients that will be discharged in the marine environment is determined.
Relationoftheindicatortothefocalarea
Aquaculture typically takes place in water of high quality. The principal measurable environmental pressures of aquaculture production are increased local organic matter, nitrogen and phosphorous which in turn may lead to locally increased Biological Oxygen Demand, eutrophication, and possibly algal blooms. In the absence of major improvements in industry practices, increased production is likely to be associated with increases in all these pressures and thus unsustainability (NB: some local systems may however have a higher carrying capacity than others).
Any localised degradation will lead to production problems on farms. Pressure from nutrients from intensive cultivation in marine and brackish water is becoming significant in the context of total nutrient loadings to the coastal environment. Although the environmental pressure from aquaculture will continue to grow as European aquaculture production expands, the rate of increase may be mitigated substantially by adoption of more sustainable management practices and production techniques.
Data sources and methodologyDataavailability The production figures for European aquaculture are available through the FAO FishStat
data base which is updated every two years. Based on these production figures and by applying the relevant conversion factors, estimates of 'produced' nutrients can be derived.
22 Aquaculture:effluentwaterqualityfromfinfishfarms
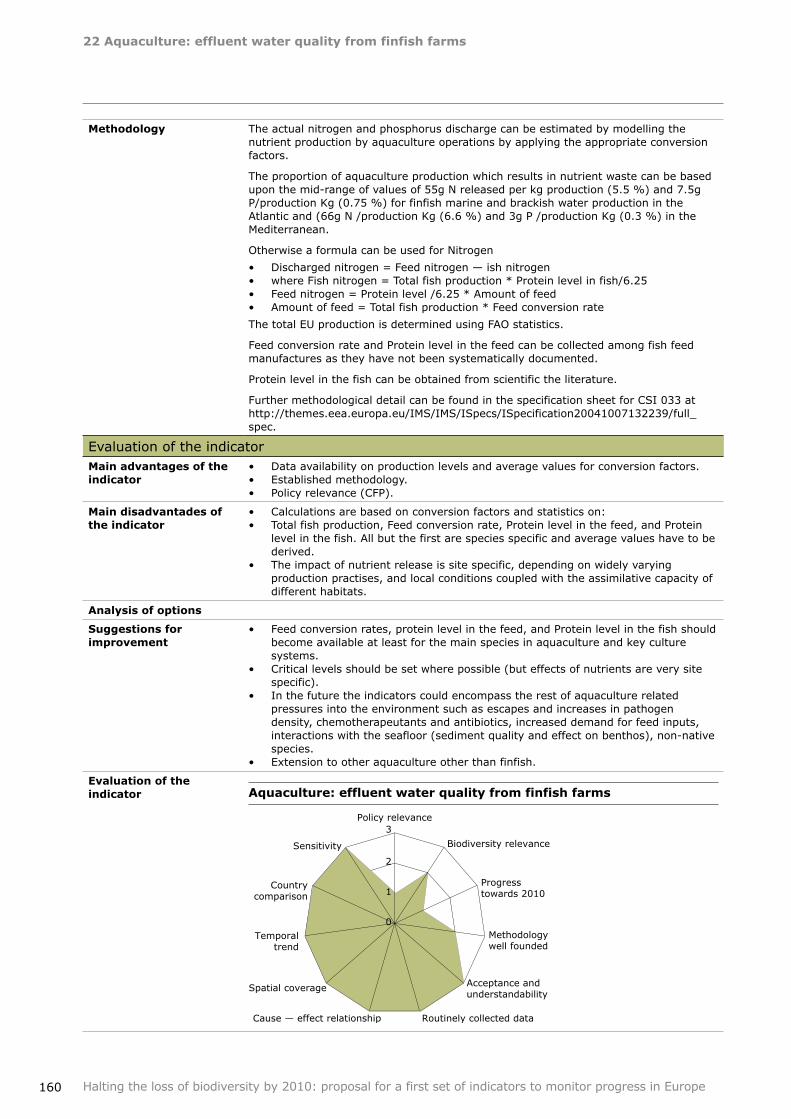
22Aquaculture:effluentwaterqualityfromfinfishfarms
160 Halting the loss of biodiversity by 2010: proposal for a first set of indicators to monitor progress in Europe
Methodology The actual nitrogen and phosphorus discharge can be estimated by modelling the nutrient production by aquaculture operations by applying the appropriate conversion factors.
The proportion of aquaculture production which results in nutrient waste can be based upon the mid‑range of values of 55g N released per kg production (5.5 %) and 7.5g P/production Kg (0.75 %) for finfish marine and brackish water production in the Atlantic and (66g N /production Kg (6.6 %) and 3g P /production Kg (0.3 %) in the Mediterranean.
Otherwise a formula can be used for Nitrogen
Discharged nitrogen = Feed nitrogen — ish nitrogenwhere Fish nitrogen = Total fish production * Protein level in fish/6.25Feed nitrogen = Protein level /6.25 * Amount of feedAmount of feed = Total fish production * Feed conversion rate
The total EU production is determined using FAO statistics.
Feed conversion rate and Protein level in the feed can be collected among fish feed manufactures as they have not been systematically documented.
Protein level in the fish can be obtained from scientific the literature.
Further methodological detail can be found in the specification sheet for CSI 033 at http://themes.eea.europa.eu/IMS/IMS/ISpecs/ISpecification20041007132239/full_spec.
••••
Evaluation of the indicatorMainadvantagesoftheindicator
Data availability on production levels and average values for conversion factors.Established methodology.Policy relevance (CFP).
•••
Maindisadvantadesoftheindicator
Calculations are based on conversion factors and statistics on:Total fish production, Feed conversion rate, Protein level in the feed, and Protein level in the fish. All but the first are species specific and average values have to be derived.The impact of nutrient release is site specific, depending on widely varying production practises, and local conditions coupled with the assimilative capacity of different habitats.
••
•
Analysisofoptions
Suggestionsforimprovement
Feed conversion rates, protein level in the feed, and Protein level in the fish should become available at least for the main species in aquaculture and key culture systems.Critical levels should be set where possible (but effects of nutrients are very site specific).In the future the indicators could encompass the rest of aquaculture related pressures into the environment such as escapes and increases in pathogen density, chemotherapeutants and antibiotics, increased demand for feed inputs, interactions with the seafloor (sediment quality and effect on benthos), non‑native species. Extension to other aquaculture other than finfish.
•
•
•
•
Evaluationoftheindicator Aquaculture:effluentwaterqualityfromfinfishfarms
0
1
2
3 Policy relevance
Biodiversity relevance
Progress towards 2010
Methodology well founded
Acceptance and understandability
Routinely collected data Cause — effect relationship
Spatial coverage
Temporal trend
Country comparison
Sensitivity
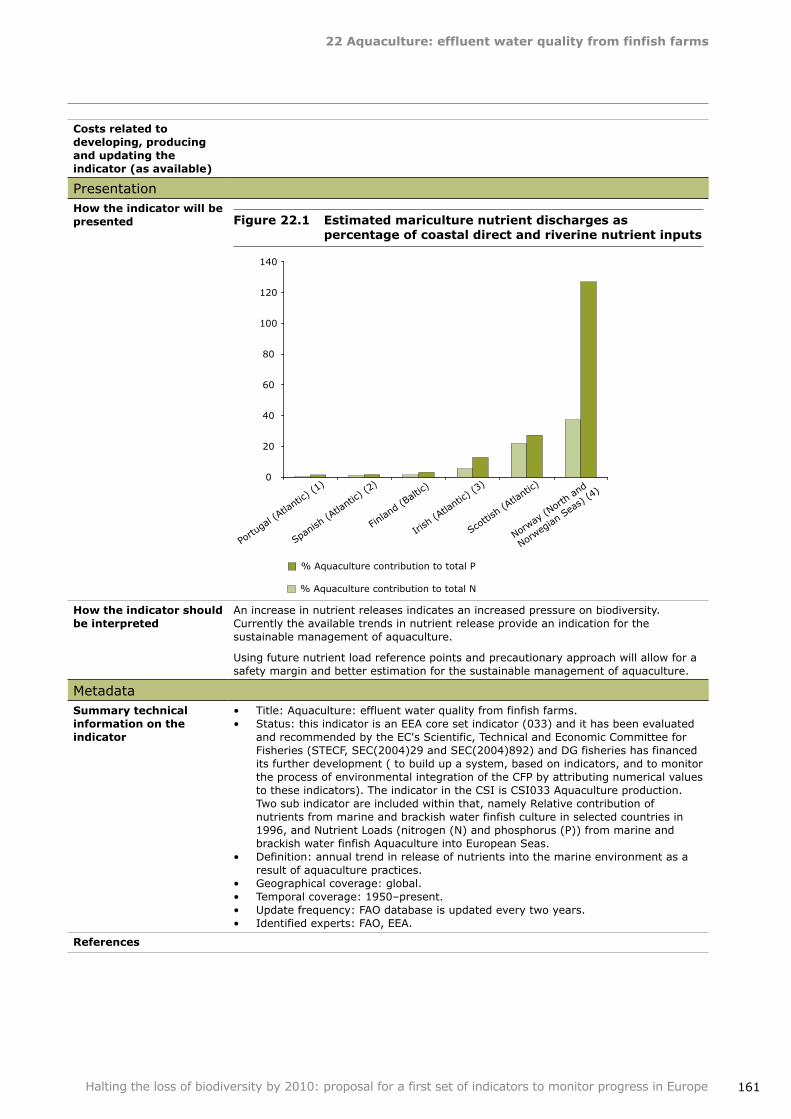
22Aquaculture:effluentwaterqualityfromfinfishfarms
161Halting the loss of biodiversity by 2010: proposal for a first set of indicators to monitor progress in Europe
Costsrelatedtodeveloping,producingandupdatingtheindicator(asavailable)
PresentationHowtheindicatorwillbepresented Figure22.1 Estimatedmariculturenutrientdischargesas
percentageofcoastaldirectandriverinenutrientinputs
Howtheindicatorshouldbeinterpreted
An increase in nutrient releases indicates an increased pressure on biodiversity. Currently the available trends in nutrient release provide an indication for the sustainable management of aquaculture.
Using future nutrient load reference points and precautionary approach will allow for a safety margin and better estimation for the sustainable management of aquaculture.
MetadataSummarytechnicalinformationontheindicator
Title: Aquaculture: effluent water quality from finfish farms.Status: this indicator is an EEA core set indicator (033) and it has been evaluated and recommended by the EC's Scientific, Technical and Economic Committee for Fisheries (STECF, SEC(2004)29 and SEC(2004)892) and DG fisheries has financed its further development ( to build up a system, based on indicators, and to monitor the process of environmental integration of the CFP by attributing numerical values to these indicators). The indicator in the CSI is CSI033 Aquaculture production. Two sub indicator are included within that, namely Relative contribution of nutrients from marine and brackish water finfish culture in selected countries in 1996, and Nutrient Loads (nitrogen (N) and phosphorus (P)) from marine and brackish water finfish Aquaculture into European Seas.Definition: annual trend in release of nutrients into the marine environment as a result of aquaculture practices.Geographical coverage: global.Temporal coverage: 1950–present.Update frequency: FAO database is updated every two years.Identified experts: FAO, EEA.
••
•
••••
References
0
20
40
60
80
100
120
140
Portu
gal (
Atlanti
c) (1
)
Spanis
h (Atla
ntic)
(2)
Finlan
d (Balt
ic)
Irish
(Atla
ntic)
(3)
Scotti
sh (A
tlanti
c)
Norway
(Nort
h and
Norweg
ian Sea
s) (4
)
% Aquaculture contribution to total N
% Aquaculture contribution to total P
162
23EcologicalfootprintofEuropeancountries
Halting the loss of biodiversity by 2010: proposal for a first set of indicators to monitor progress in Europe
Focalarea Sustainable use
Europeanindicatorheadline
Ecological footprint and biocapacity of European countries
Keypolicyquestion What impact does the overall resource demand of European societies have on biodiversity and ecosystems outside Europe?
Definition of the indicator
The ecological footprint for Europe is a measure of how much biologically productive land and water area Europe requires to produce all the biological resources it consumes and to absorb the waste it generates, using prevailing technology and management. This area could be located anywhere in the world. This can be compared with the biocapacity of the planet or the one available within a given region. Both biocapacity and the ecological footprint are measured in global hectares.
Indicatortype(DPSIR) Pressure
Context When considering the underlying causes of biodiversity loss, the Millennium Ecosystem Assessment notes that: 'in particular, growing consumption of ecosystem services (as well as growing use of fossil fuels), which results from growing populations and growing per capita consumption, leads to increased pressure on ecosystems and biodiversity'.
Therefore, if progress towards the 2010 Target is to be assessed effectively, human resource demand and its relationship to the biosphere's productive capacity must be measured. The ecological footprint provides an indication of human consumption in relation to planet Earth's capacity to renew the ecological resources and services being consumed.
The indicator provides a quantitative assessment of global and local overshoot, the extent to which humanity's Footprint, or demand for ecosystem resources, exceeds biocapacity, the planet's ability to regenerate these resources. This overshoot means ecosystem stocks are being liquidated, and untreated wastes are accumulating in the biosphere. While it is not known precisely how long various ecosystems can tolerate this growing ecological debt, this growing pressure will eventually contribute to ecosystem degradation or failure.
The regional or national ecological footprint is the area of productive biosphere required to provide all of the biological resources which a region's or nation's population consumes and to absorb the wastes it generates, using prevailing technologies and resource management.
National ecological footprint accounting provides a number of key indicators such as the Footprint of consumption, the Footprint of production, or the biocapacity of a nation. Hence it can provide assessments of aspects such as (1) Europe's demands on land and sea area within its own borders, (2) Europe's demands for land and sea area outside its borders, and (3) Europe's demand on specific ecosystem types. Although the aggregate consumption of European households of material resources is more than double the available biocapacity within Europe, Europe's domestic extraction of biological resources is still below Europe's total biocapacity and has stayed at about the same level in recent years.
Relationoftheindicatortothefocalarea
The 'ecological footprint of European countries' (i.e., the consumption footprint) directly measures Europe's resource use compared to what is available globally. In other words, it shows to what extent the level of consumption is replicable on a global scale. It can also measure local extraction rates. This means the accounts can provide information about global and local sustainability.
23 EcologicalfootprintofEuropeancountries
23EcologicalfootprintofEuropeancountries
163Halting the loss of biodiversity by 2010: proposal for a first set of indicators to monitor progress in Europe
Data sources and methodologyDataavailability The two broadest and most important databases for ecological footprint calculations
are both maintained by United Nations organisations. FAOSTAT from FAO provides information on production, trade, and consumption of crop, livestock, fish, and timber products as well as data on land use and land cover. COMTRADE, from the United Nations Statistical Division, tracks data on the imports and exports of over 600 categories of additional processed products. Both of these databases are global in scope and provide data from 1961, the first year for which the National Footprint Accounts calculate results, through the present.
Other important data sources include the International Energy Agency (IEA), recent Forest Resource Assessments (FRA) (FAO), and the work of the Intergovernmental Panel on Climate Change (IPCC).
Raw data from FAOSTAT and COMTRADE databases are downloaded once a year to calculate national ecological footprints for the most recent data year available and to accommodated historical data revisions by the United Nations.
These data, in full time series, are available from the Global Footprint Network (http://www.footprintnetwork.org). Recent data have also been published by the European Environment Agency (http://www.eea.europa.eu/highlights/Ann1132753060) and WWF International (http://www.planet.org/livingplanet).
Methodology The ecological footprint uses a common standardised measurement unit, global hectares, to make results comparable globally and across scales. A global hectare is a hectare of biologically productive area with the world average productivity for a given year. Hectares of productive area are converted into global hectares by weighting each area in proportion to its potential productivity of useful biomass (that is potential annual production of useful biological resources).
The ecological footprint calculated for each country includes the biological resources and wastes embodied within goods and services that are consumed by people living in that country. Resources consumed for the production of goods and services exported to another country are added to the country where the goods and services are consumed, and not to the country where they are produced.
The methodology of ecological footprint accounts builds on six assumptions:
1. The annual amounts of biological resources consumed and wastes generated by countries are tracked by national and international organisations.
2. The quantity of biological resources appropriated for human use is directly related to the amount of bioproductive land area necessary for their regeneration and for the assimilation of wastes.
3. By weighting each area in proportion to its usable biomass productivity (that is, its potential annual production of usable biomass), the different areas can be expressed in terms of a standardised average productive hectare (a global hectare).
4. The overall demand in global hectares can be aggregated by adding all mutually exclusive resource‑providing and waste‑assimilating areas required to support the demand.
5. Aggregated human demand (ecological footprint) and nature's supply (biocapacity) can be directly compared to each other.
6. Area demand can exceed area supply.
More detailed description of the methodology can be found in 'National Footprint and Biocapacity Accounts 2005: The underlying calculation method' http://www.footprintnetwork.org/gfn_sub.php?content=datamethods.
The method continues to be further developed, under the scientific guidance of the national accounts committee of Global Footprint Network. http://www.footprintnetwork.org/gfn_sub.php?content=standards_committees#nac.
23EcologicalfootprintofEuropeancountries
164 Halting the loss of biodiversity by 2010: proposal for a first set of indicators to monitor progress in Europe
Evaluation of the indicatorMainadvantagesoftheindicator
Established methodology: the indicator is already developed and produced by Global Footprint Network and has matured significantly over its 15 years of existence, both with regards to data sources and methodology. It is of high policy relevance because it indicates the overall resource demand of European societies compared to resource availability in Europe and in the rest of the world.Geographical and temporal coverage: the indicator has a worldwide coverage and data are available on a long time scale (1961–2003 and annually updated). The core data are on the national level and allow for aggregations at different physical scales. The indicator can be disaggregated to provide information on specific resources or ecosystems.The ecological footprint is a powerful tool for communicating with and reaching a wide range of audiences, to promote an understanding of how people's activities have an impact on the environment, and to support people in making choices to reduce this impact.
•
•
•
•
Mainadvantagesoftheindicator
Several important aspects of sustainable use/management are not being measured by the ecological footprint:
Non‑ecological aspects of sustainability. Having a Footprint smaller than the biosphere is a necessary minimum condition for a sustainable society, but is not sufficient. For instance, although social well‑being also needs to be considered, the Footprint does not do this. Depletion of non‑renewable resources. The Footprint does not track the amount of non‑renewable resource stocks, such as oil, natural gas, coal or metal deposits. The Footprint associated with these materials is based on the regenerative capacity used or compromised by their extraction and, in the case of fossil fuels, the area required to assimilate the wastes they generate.Inherently unsustainable activities. Activities that are inherently unsustainable, such as the release of heavy metals, radioactive materials and persistent synthetic compounds (e.g. chlordane, PCBs, CFCs, PVCs, dioxins, etc.) do not enter directly into Footprint calculations. Where these substances cause a loss of biocapacity, however, their influence can be seen.Ecological degradation. The Footprint does not directly measure ecological degradation, such as increased soil salinity from irrigation, which could affect future bioproductivity. However, if degradation leads to reductions in biological productivity, then this loss is captured when measuring biocapacity in the future. Also, when only looking at the aggregate number, 'underexploitation' in one area (e.g. forests) can hide overexploitation in another area (e.g. fisheries).Resilience of ecosystems. Footprint accounts do not identify where and in what way the capacity of ecosystems are vulnerable or resilient. The Footprint is merely an outcome measure documenting how much of the biosphere is being used compared with how productive it is.
•
•
•
•
•
Analysisofoptions Humanity's ecological footprint was chosen as one of the CBD indicators.
The ecological footprint of European countries may show both aggregated figures of regional Footprints as well as breakdown by ecosystem types, or by specific materials. It can also show the distribution of biocapacity.
Suggestionsforimprovement
Improvements in the methodology for calculating the ecological footprint, in data collection and management, and in application and communication of the indicator at regional and national scales will increase the value of the metric as an indicator for monitoring progress towards the 2010 target.
A full description of twenty‑five research topics for ecological footprint accounts can be found in 'A Research Agenda for Improving National Ecological Footprint Accounts' (Kitzes et al.). Presented to the International Ecological Footprint Conference — Stepping up the Pace: New Developments in Ecological Footprint Methodology, Policy and Practice, 8–10 May 2007, Cardiff, and in preparation for publication.
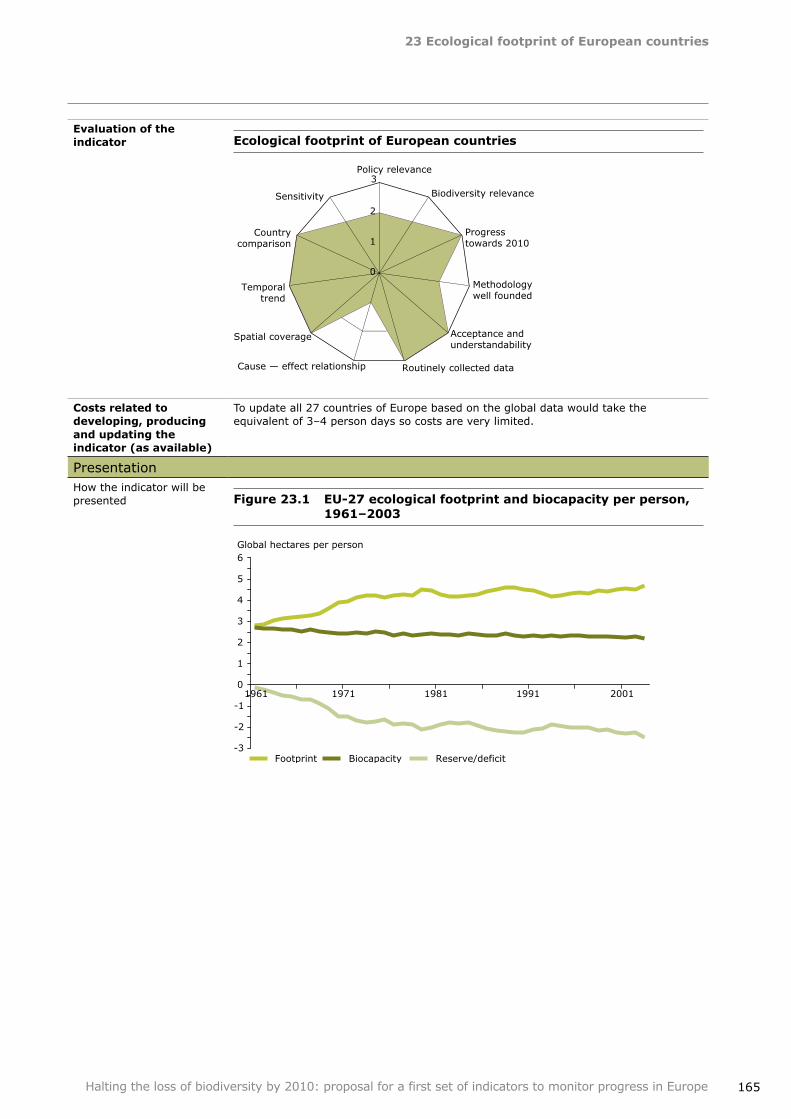
23EcologicalfootprintofEuropeancountries
165Halting the loss of biodiversity by 2010: proposal for a first set of indicators to monitor progress in Europe
Evaluationoftheindicator EcologicalfootprintofEuropeancountries
Costsrelatedtodeveloping,producingandupdatingtheindicator(asavailable)
To update all 27 countries of Europe based on the global data would take the equivalent of 3–4 person days so costs are very limited.
PresentationHow the indicator will be presented Figure23.1 EU‑27ecologicalfootprintandbiocapacityperperson,
1961–2003
0
1
2
3 Policy relevance
Biodiversity relevance
Progress towards 2010
Methodology well founded
Acceptance and understandability
Routinely collected data Cause — effect relationship
Spatial coverage
Temporal trend
Country comparison
Sensitivity
Global hectares per person
-3
-2
-1
0
1
2
3
4
5
6
1971 1981 1991 2001
Footprint Biocapacity Reserve/deficit
1961
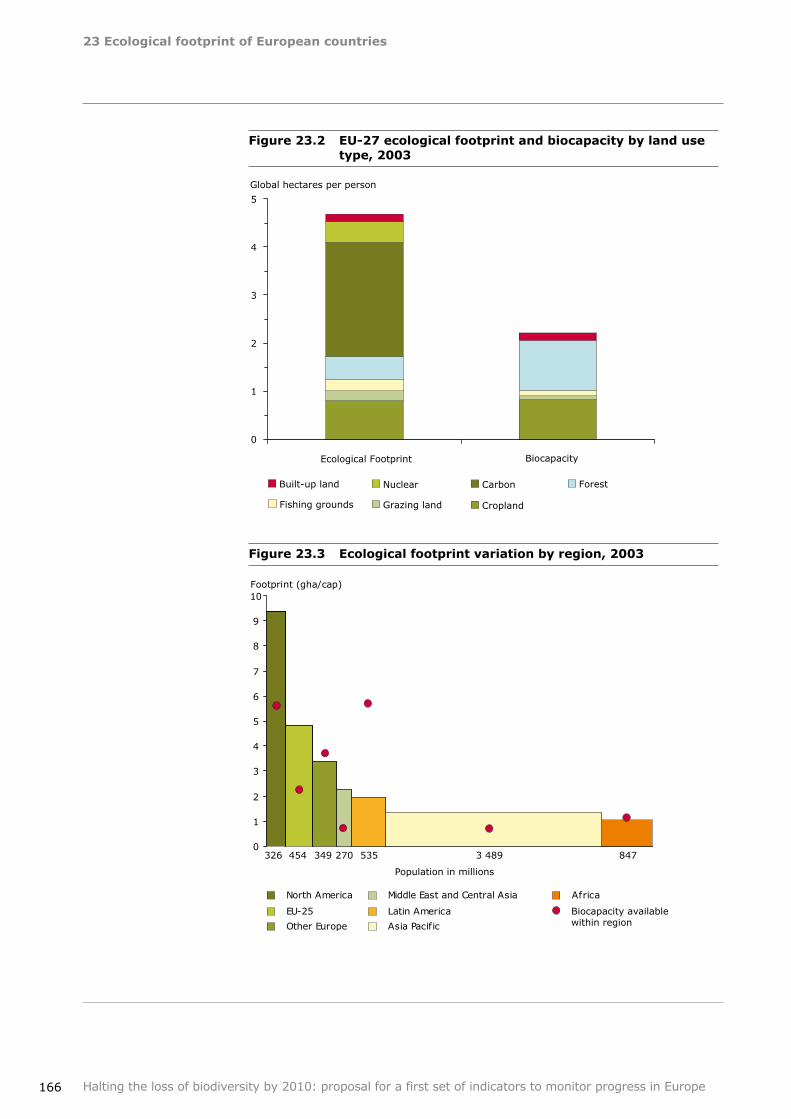
23EcologicalfootprintofEuropeancountries
166 Halting the loss of biodiversity by 2010: proposal for a first set of indicators to monitor progress in Europe
Figure23.2 EU‑27ecologicalfootprintandbiocapacitybylandusetype,2003
Figure23.3 Ecologicalfootprintvariationbyregion,2003
Global hectares per person
0
1
2
3
4
5
Ecological Footprint Biocapacity
Built-up land Nuclear Carbon Forest
Fishing grounds Grazing land Cropland
0
1
2
3
4
5
6
7
8
9
10Footprint (gha/cap)
Africa
Asia Pacific
Latin America
Middle East and Central Asia
Other Europe
EU-25
North America
326 454 349 270 535 3 489 847
Biocapacity available within region
Population in millions
23EcologicalfootprintofEuropeancountries
167Halting the loss of biodiversity by 2010: proposal for a first set of indicators to monitor progress in Europe
Howtheindicatorshouldbeinterpreted
If Figures 23.1 and 23.2 show an ecological deficit, with demand exceeding supply, then biological resource use and waste emission is greater than the biological capacity available within Europe, showing that Europe cannot sustainably meet its consumption demands from within its own borders. Even in countries where the available biocapacity for the population exceeds the footprint of that population, attention must be given to the different components of the overall country footprint. While demand on some land types may be met by resources provided within the borders of a given nation, many footprint components remain largely the result of imported resources.
If the per person ecological footprint of Europe is greater than globally available biocapacity per person (see Figure 23.3, then European consumption patterns are not sustainable at a global scale. When this is the case, biodiversity is likely to be lost as a result: the higher humanity's demand for 'global hectares' the higher the pressure on biological resources and the less area is available for biodiversity.
MetadataSummarytechnicalinformationontheindicator
Title: Ecological footprint of European countries.Status: developed by EEA and Global Footprint Network.Definition: the ecological footprint for Europe is a measure of how much biologically productive land and water area Europe requires to produce all the biological resources it consumes and to absorb the waste it generates, using prevailing technology and management. This area could be located anywhere in the world. This can be compared with the biocapacity of the planet or the one available within a given region. Both biocapacity and the ecological footprint are measured in global hectares.Geographical coverage: global.Temporal coverage: 1961–present.Update frequency: at least every second year.Identified experts: Global Footprint Network: Mathis Wackernagel; Steven Goldfinger, Justin Kitzes. EEA: Gorm Dige.
•••
••••
References
168
24Patentapplicationsbasedongeneticresources
Halting the loss of biodiversity by 2010: proposal for a first set of indicators to monitor progress in Europe
Focalarea Status of access and benefits sharing
Europeanindicatorheadline
Percentage of European patent applications for inventions based on genetic resources
Keypolicyquestion How important is biodiversity as a resource for inventions, and are benefits of the use of this resource being shared?
Definition of the indicator
The indicator shows the share of European patent applications that are based on genetic resources.
The following types of patent applications would be considered 'European patent applications':
Patent applications presented to the national intellectual property offices of the pan‑European countries;Patent applications presented to the European Patent Office (EPO) under the EPC (European Patent Convention); andPatent applications presented to the European Patent Office or the World Intellectual Property Organization (WIPO) under the PCT (Patent Cooperation Treaty), when pan‑European countries are mentioned among the designated Contracting States of the PCT in which protection is sought.
The CBD (art. 2) defines 'genetic resources' as genetic material of actual or potential value. 'Genetic material,' in turn, is defined as any material of plant, animal, microbial or other origin containing functional units of heredity. Nevertheless, there is still no conclusive answer to what resources and uses are covered by these definitions. The methodology proposed for this indicator attempts to address this uncertainty.
In this regard, it is also worth noting that while access and benefit‑sharing provisions refer solely to genetic resources, the CBD also contains references to the importance of equitable sharing of the benefits arising from the utilization of knowledge, innovations and practices of indigenous and local communities.
•
•
•
Indicatortype(DPSIR) Response
Context Information on the number of patents being sought or granted for products and processes developed on the basis of genetic resources would provide critical insight into the role and relevance of genetic resources in diverse economic sectors and, potentially, the degree to which such role and relevance have been recognized and equitably rewarded. Since the number of patents granted in the pan‑European region is significant — nearly 35 % of patents in force at the end of 2004 were granted by the contracting States of the European Patent Convention (EPC) — the information could, moreover, potentially inform not only regional but also global policies.(21)
The fair and equitable sharing of benefits arising from the use of genetic resources is one of the main objectives of the CBD. The implementation of the CBD goals and provisions on benefit‑sharing, however, has proved difficult. Intellectual property rights, especially patents, act as incentives for trade and investment that thus promote the creation of benefits from the use of genetic resources. Nevertheless, the existence of patents for inventions based on genetic resources has also raised a number of ethical concerns and concerns on the impacts on science and innovation.
(21) Trilateral Statistical Report, 2005. In 2005, the European Patent Convention entered into force in Latvia, which so became the 31st EPC Contracting state. By the end of the year, the members of the underlying European Patent Organization were: Austria, Belgium, Bulgaria, Cyprus, Czech Republic, Denmark, Estonia, Finland, France, Germany, Greece, Hungary, Iceland, Ireland, Italy, Latvia, Liechtenstein, Lithuania, Luxembourg, Monaco, Netherlands, Poland, Portugal, Romania, Slovakia, Slovenia, Spain, Sweden, Switzerland, Turkey, and the United Kingdom. Other states have agreements with the European Patent Office to allow applicants to request an extension of European patents to their territory. These states are: Albania, Bosnia‑Herzegovina, Croatia, the Former Yugoslav Republic of Macedonia, Serbia and Montenegro. Other states that have recently expressed their intention to join the organisation are Norway, Malta, and Croatia.
24 Patentapplicationsbasedongeneticresources
24Patentapplicationsbasedongeneticresources
169Halting the loss of biodiversity by 2010: proposal for a first set of indicators to monitor progress in Europe
Relationoftheindicatortothefocalarea
Percentage of patent applications directly relates to access and benefit sharing, as it concerns the documentation of the use of genetic diversity for commercial or other use though a patent. Documenting such use is essential to enable an assessment of whether benefits from the use are equitably shared.
Data sources and methodologyDataavailability Many databases with patent information exist.
Particularly interesting for the indicator are two initiatives hosted by the EPO. Esp@ cenet contains more than 50 million patent documents from over 70 national patent offices, four regional patent organizations, and WIPO. These data are divided in various databases that can be considered separately, with searches covering all jurisdictions, only EPO, or only PCT applications.
In addition, a new EPO initiative, the EPO Worldwide Patent Statistical Database (PATSTAT) will provide information on patent publications across the national, regional, and international sources used by the EPO.
Esp@cenet is ready and publicly accessible (http://www.espacenet.com/index.en.htm), while PATSTAT is in the final phases of development (it contains data but a user interface and search tools are being developed).
The databases cover all pan‑European countries except Andorra — see http://patentinfo.european‑patent‑office.org/_resources/data/pdf/global_patent_data_coverage.pdf. PATSTAT contains information on patent applications presented to the national intellectual property offices for 43 of the 53 pan‑European countries. However, since it also has information on patent applications filed under the European Patent Convention, there would also be some information on Cyprus, Macedonia, and perhaps soon Malta. Then, if the patent applications filed under the PCT system are added, there would be at least some information on all pan‑European countries except Andorra.
Temporal coverage varies between countries — see http://ep.espacenet.com/help?locale=en_EPandmethod=handleHelpTopicandtopic=detailedcoverage.
Methodology 'Classification codes' are awarded to patent publications to facilitate the retrieval of information on inventions in particular technological fields. As they systematize and allow retrieval of information on inventions covered by patent publications, classification codes can also be used for a number of additional purposes, including locating and sorting through inventions based on genetic resources.
There are several classification systems that operate at the national, regional, and international level. Of these systems, the International Patent Classification (IPC) and the European Classification system (ECLA) are particularly relevant for the indicator. The IPC is the main classification system at the international level, currently being used by over 90 countries and five international patent organizations. It is frequently revised, with the latest version of the IPC — IPC 8 — containing approximately 70 000 classifiers. To ensure the proposed indicator can be compared with other patent‑based information and be considered in the CBD and other international negotiations, it would make sense to take the IPC as its basis. The challenge is then to find, within the IPC, the classifications codes relevant for inventions based on genetic resources.
The steps for calculating the indicator would then be the following:
1. Determining the total number of patent applications in the pan‑European region. The first step is to determine the total number of European patents applications including those presented nationally, regionally and internationally.
2. Identifying the patent applications for inventions based on genetic resources. The patent applications under each and all the relevant IPC classifiers then need to be determined. Both the total number of biodiversity‑based patent applications and the specific number for certain sectors and technologies would be established.
3. Calculating the percentage that the patent applications for inventions based on genetic resources constitute in considering the total number of patent applications.
24Patentapplicationsbasedongeneticresources
170 Halting the loss of biodiversity by 2010: proposal for a first set of indicators to monitor progress in Europe
Methodology(contd.) The key decision is therefore which IPC classification codes to use.
One option is to aim for a broad coverage indicator. An extensive selection of codes has been proposed to ensure all possible patent applications using genetic resources are being captured. See Annex 2 for a list of the potentially relevant codes. As can be seen from the list, there may of course be codes that capture applications that are not based on genetic resources. Further work is therefore required in order to refine the list, or to allow for more specific filtering within the codes proposed.
An alternative proposed here as a first proxy for the indicator is to use a narrow but well established set of classification codes, the ones used by OECD for patent applications for biotechnology, many of which are based on genetic resources. See Annex 1 for the list of codes proposed. The indicator would be a proxy for broader trends in the use of the components of biodiversity and related traditional knowledge in inventions. It also has the benefit of having been already used and refined by the OECD.
OECD has selected these codes through the following steps:
1. Analysis of the IPC classification, starting at the section level, followed by sub‑sections, classes, sub‑classes, groups and sub‑groups.
2. Keyword search, identifying the IPC codes wherein these keywords are used most frequently.
3. Analysis of patents owned by biotechnology firms (OECD, 2005).
It should be noted that the OECD definition is currently being revised to include comments and suggestions received from experts and relevant stakeholders. The WIPO International Bureau, for instance, has put forth a number of additional classifications codes that it considers should be taken into account.
Of course, none of these lists match the exact scope of the proposed indicator as currently construed — 'inventions based on genetic resources.' The OECD definition for biotechnology patents is narrower, while the work of WIPO and Oldham (2006 a. and b.) on biodiversity more general is broader. In the latter, additional work would thus be necessary to determine the specific significance of patent information resulting from the calculation of the indicator to the benefit‑sharing provisions in the CBD. On the contrary, narrower approaches such as the one developed by the OECD for biotechnology could be considered to follow a stricter definition of the use of genetic resources and thus be used in the implementation of the proposed indicator.
Nevertheless, given that the definition of 'genetic resources' remains imprecise at international level, a more comprehensive methodology that could later be narrowed down remains the most useful approach in the long term to a patent‑based indicator for benefit‑sharing.
Evaluation of the indicatorMainadvantagesoftheindicator
Data availability (freely available) and geographic coverage are good. The indicator may encourage further work to refine the classification codes.
••
Mainadvantagesoftheindicator
While methodology is straightforward, and data exist, using the PATSTAT database will require more time and work.
•
Analysisofoptions Ideally, the broader set of classification codes could be used to ensure that all applications related to biodiversity are captured. But since an indicator based on the broad set without further work may result in an overestimation, it is proposed to use an indicator based on applications for biotechnology patents as a proxy.
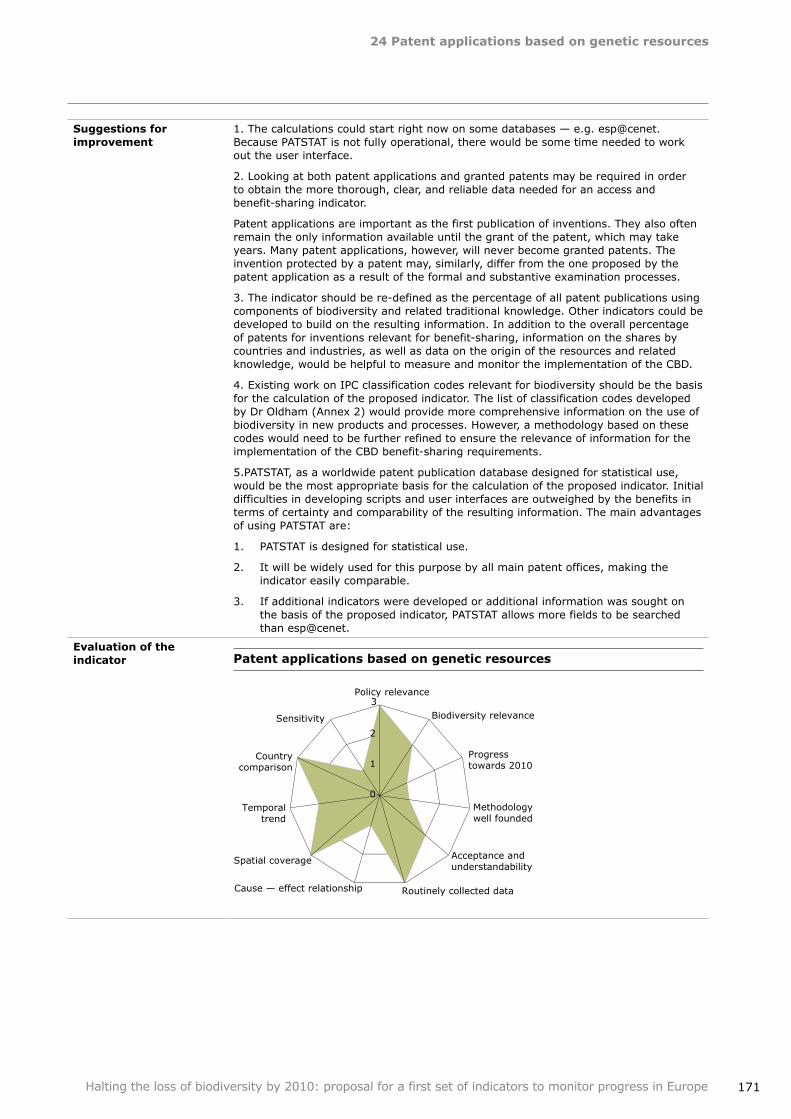
24Patentapplicationsbasedongeneticresources
171Halting the loss of biodiversity by 2010: proposal for a first set of indicators to monitor progress in Europe
Suggestionsforimprovement
1. The calculations could start right now on some databases — e.g. esp@cenet. Because PATSTAT is not fully operational, there would be some time needed to work out the user interface.
2. Looking at both patent applications and granted patents may be required in order to obtain the more thorough, clear, and reliable data needed for an access and benefit‑sharing indicator.
Patent applications are important as the first publication of inventions. They also often remain the only information available until the grant of the patent, which may take years. Many patent applications, however, will never become granted patents. The invention protected by a patent may, similarly, differ from the one proposed by the patent application as a result of the formal and substantive examination processes.
3. The indicator should be re‑defined as the percentage of all patent publications using components of biodiversity and related traditional knowledge. Other indicators could be developed to build on the resulting information. In addition to the overall percentage of patents for inventions relevant for benefit‑sharing, information on the shares by countries and industries, as well as data on the origin of the resources and related knowledge, would be helpful to measure and monitor the implementation of the CBD.
4. Existing work on IPC classification codes relevant for biodiversity should be the basis for the calculation of the proposed indicator. The list of classification codes developed by Dr Oldham (Annex 2) would provide more comprehensive information on the use of biodiversity in new products and processes. However, a methodology based on these codes would need to be further refined to ensure the relevance of information for the implementation of the CBD benefit‑sharing requirements.
5.PATSTAT, as a worldwide patent publication database designed for statistical use, would be the most appropriate basis for the calculation of the proposed indicator. Initial difficulties in developing scripts and user interfaces are outweighed by the benefits in terms of certainty and comparability of the resulting information. The main advantages of using PATSTAT are:
1. PATSTAT is designed for statistical use.
2. It will be widely used for this purpose by all main patent offices, making the indicator easily comparable.
3. If additional indicators were developed or additional information was sought on the basis of the proposed indicator, PATSTAT allows more fields to be searched than esp@cenet.
Evaluationoftheindicator Patentapplicationsbasedongeneticresources
0
1
2
3 Policy relevance
Biodiversity relevance
Progress towards 2010
Methodology well founded
Acceptance and understandability
Routinely collected data Cause — effect relationship
Spatial coverage
Temporal trend
Country comparison
Sensitivity
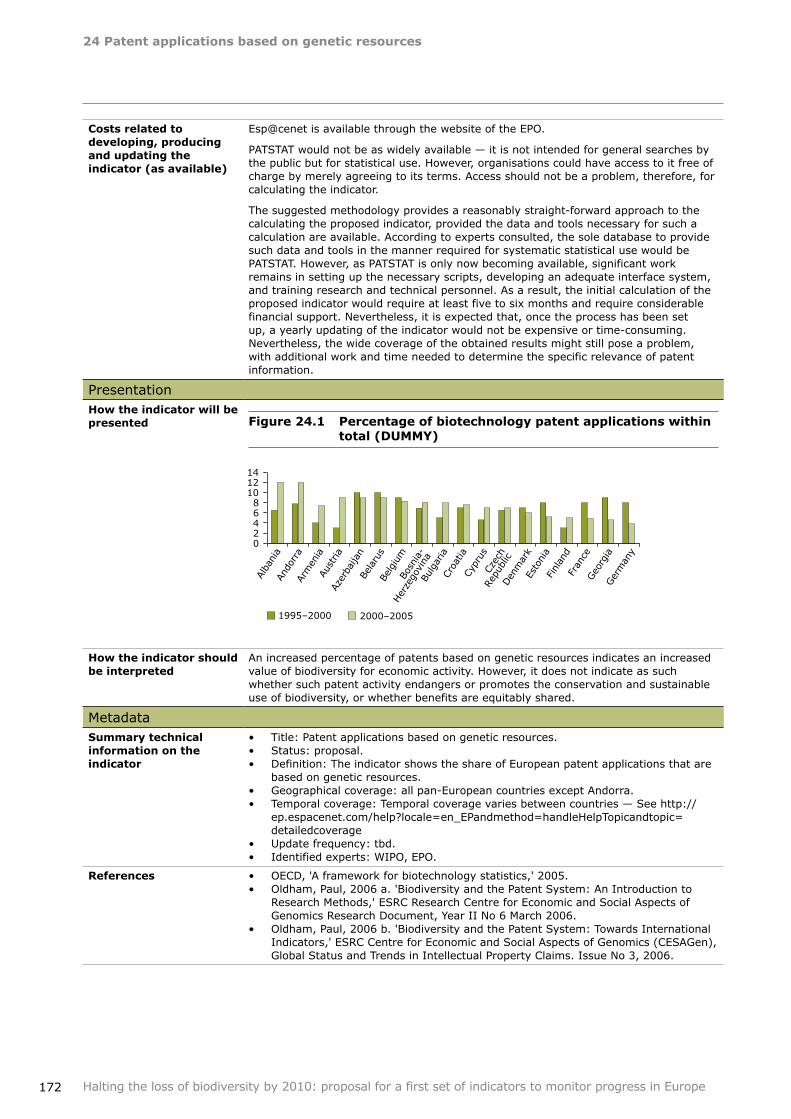
24Patentapplicationsbasedongeneticresources
172 Halting the loss of biodiversity by 2010: proposal for a first set of indicators to monitor progress in Europe
Costsrelatedtodeveloping,producingandupdatingtheindicator(asavailable)
Esp@cenet is available through the website of the EPO.
PATSTAT would not be as widely available — it is not intended for general searches by the public but for statistical use. However, organisations could have access to it free of charge by merely agreeing to its terms. Access should not be a problem, therefore, for calculating the indicator.
The suggested methodology provides a reasonably straight‑forward approach to the calculating the proposed indicator, provided the data and tools necessary for such a calculation are available. According to experts consulted, the sole database to provide such data and tools in the manner required for systematic statistical use would be PATSTAT. However, as PATSTAT is only now becoming available, significant work remains in setting up the necessary scripts, developing an adequate interface system, and training research and technical personnel. As a result, the initial calculation of the proposed indicator would require at least five to six months and require considerable financial support. Nevertheless, it is expected that, once the process has been set up, a yearly updating of the indicator would not be expensive or time‑consuming. Nevertheless, the wide coverage of the obtained results might still pose a problem, with additional work and time needed to determine the specific relevance of patent information.
PresentationHowtheindicatorwillbepresented Figure24.1 Percentageofbiotechnologypatentapplicationswithin
total(DUMMY)
Howtheindicatorshouldbeinterpreted
An increased percentage of patents based on genetic resources indicates an increased value of biodiversity for economic activity. However, it does not indicate as such whether such patent activity endangers or promotes the conservation and sustainable use of biodiversity, or whether benefits are equitably shared.
MetadataSummarytechnicalinformationontheindicator
Title: Patent applications based on genetic resources.Status: proposal.Definition: The indicator shows the share of European patent applications that are based on genetic resources.Geographical coverage: all pan‑European countries except Andorra.Temporal coverage: Temporal coverage varies between countries — See http://ep.espacenet.com/help?locale=en_EPandmethod=handleHelpTopicandtopic= detailedcoverageUpdate frequency: tbd.Identified experts: WIPO, EPO.
•••
••
••
References OECD, 'A framework for biotechnology statistics,' 2005.Oldham, Paul, 2006 a. 'Biodiversity and the Patent System: An Introduction to Research Methods,' ESRC Research Centre for Economic and Social Aspects of Genomics Research Document, Year II No 6 March 2006.Oldham, Paul, 2006 b. 'Biodiversity and the Patent System: Towards International Indicators,' ESRC Centre for Economic and Social Aspects of Genomics (CESAGen), Global Status and Trends in Intellectual Property Claims. Issue No 3, 2006.
••
•
0 2 4 6 8
10 12 14
1995–2000
Alba
nia
Ando
rra
Arm
enia
Aust
riaAz
erba
ijan
Bela
rus
Belg
ium
Bosn
ia-
Her
zego
vina
Bulg
aria
Croa
tiaCy
prus
Czec
hRe
publ
icDen
mar
kEs
toni
aFinl
and
Fran
ceGeo
rgia
Ger
man
y2000–2005
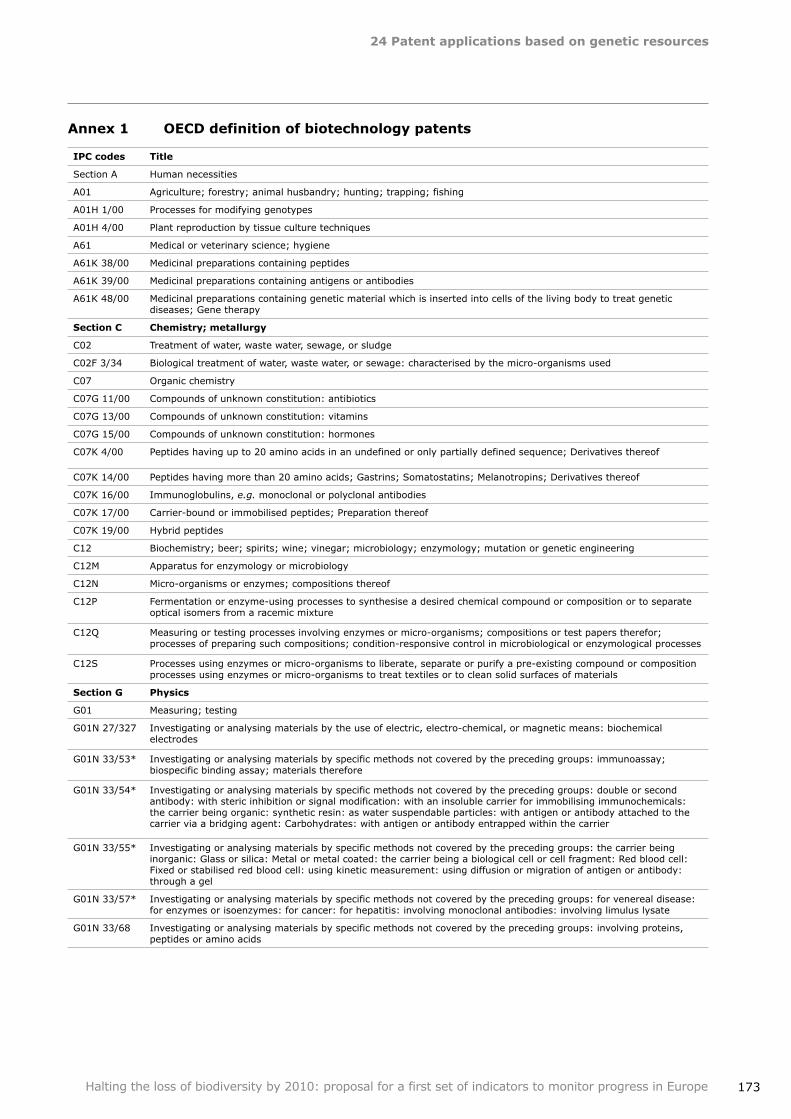
24Patentapplicationsbasedongeneticresources
173Halting the loss of biodiversity by 2010: proposal for a first set of indicators to monitor progress in Europe
Annex1 OECDdefinitionofbiotechnologypatents
IPCcodes Title
Section A Human necessities
A01 Agriculture; forestry; animal husbandry; hunting; trapping; fishing
A01H 1/00 Processes for modifying genotypes
A01H 4/00 Plant reproduction by tissue culture techniques
A61 Medical or veterinary science; hygiene
A61K 38/00 Medicinal preparations containing peptides
A61K 39/00 Medicinal preparations containing antigens or antibodies
A61K 48/00 Medicinal preparations containing genetic material which is inserted into cells of the living body to treat genetic diseases; Gene therapy
SectionC Chemistry;metallurgy
C02 Treatment of water, waste water, sewage, or sludge
C02F 3/34 Biological treatment of water, waste water, or sewage: characterised by the micro‑organisms used
C07 Organic chemistry
C07G 11/00 Compounds of unknown constitution: antibiotics
C07G 13/00 Compounds of unknown constitution: vitamins
C07G 15/00 Compounds of unknown constitution: hormones
C07K 4/00 Peptides having up to 20 amino acids in an undefined or only partially defined sequence; Derivatives thereof
C07K 14/00 Peptides having more than 20 amino acids; Gastrins; Somatostatins; Melanotropins; Derivatives thereof
C07K 16/00 Immunoglobulins, e.g. monoclonal or polyclonal antibodies
C07K 17/00 Carrier‑bound or immobilised peptides; Preparation thereof
C07K 19/00 Hybrid peptides
C12 Biochemistry; beer; spirits; wine; vinegar; microbiology; enzymology; mutation or genetic engineering
C12M Apparatus for enzymology or microbiology
C12N Micro‑organisms or enzymes; compositions thereof
C12P Fermentation or enzyme‑using processes to synthesise a desired chemical compound or composition or to separate optical isomers from a racemic mixture
C12Q Measuring or testing processes involving enzymes or micro‑organisms; compositions or test papers therefor; processes of preparing such compositions; condition‑responsive control in microbiological or enzymological processes
C12S Processes using enzymes or micro‑organisms to liberate, separate or purify a pre‑existing compound or composition processes using enzymes or micro‑organisms to treat textiles or to clean solid surfaces of materials
SectionG Physics
G01 Measuring; testing
G01N 27/327 Investigating or analysing materials by the use of electric, electro‑chemical, or magnetic means: biochemical electrodes
G01N 33/53* Investigating or analysing materials by specific methods not covered by the preceding groups: immunoassay; biospecific binding assay; materials therefore
G01N 33/54* Investigating or analysing materials by specific methods not covered by the preceding groups: double or second antibody: with steric inhibition or signal modification: with an insoluble carrier for immobilising immunochemicals: the carrier being organic: synthetic resin: as water suspendable particles: with antigen or antibody attached to the carrier via a bridging agent: Carbohydrates: with antigen or antibody entrapped within the carrier
G01N 33/55* Investigating or analysing materials by specific methods not covered by the preceding groups: the carrier being inorganic: Glass or silica: Metal or metal coated: the carrier being a biological cell or cell fragment: Red blood cell: Fixed or stabilised red blood cell: using kinetic measurement: using diffusion or migration of antigen or antibody: through a gel
G01N 33/57* Investigating or analysing materials by specific methods not covered by the preceding groups: for venereal disease: for enzymes or isoenzymes: for cancer: for hepatitis: involving monoclonal antibodies: involving limulus lysate
G01N 33/68 Investigating or analysing materials by specific methods not covered by the preceding groups: involving proteins, peptides or amino acids
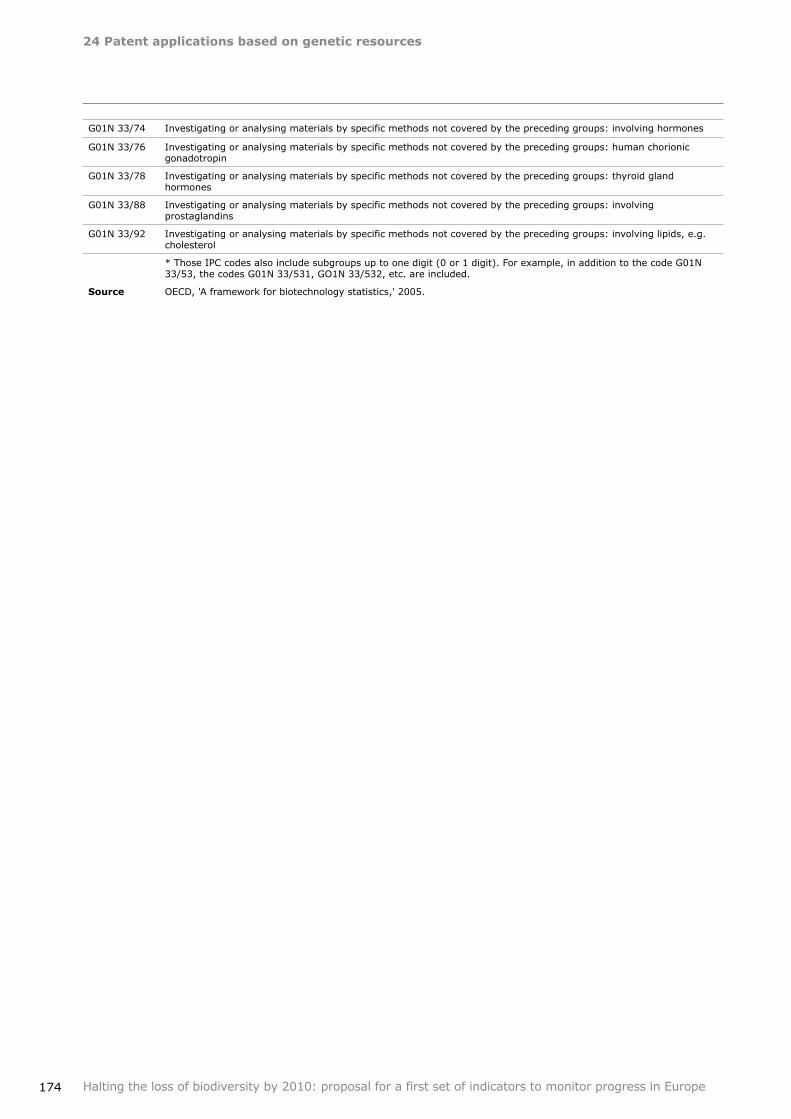
24Patentapplicationsbasedongeneticresources
174 Halting the loss of biodiversity by 2010: proposal for a first set of indicators to monitor progress in Europe
G01N 33/74 Investigating or analysing materials by specific methods not covered by the preceding groups: involving hormones
G01N 33/76 Investigating or analysing materials by specific methods not covered by the preceding groups: human chorionic gonadotropin
G01N 33/78 Investigating or analysing materials by specific methods not covered by the preceding groups: thyroid gland hormones
G01N 33/88 Investigating or analysing materials by specific methods not covered by the preceding groups: involving prostaglandins
G01N 33/92 Investigating or analysing materials by specific methods not covered by the preceding groups: involving lipids, e.g. cholesterol
* Those IPC codes also include subgroups up to one digit (0 or 1 digit). For example, in addition to the code G01N 33/53, the codes G01N 33/531, GO1N 33/532, etc. are included.
Source OECD, 'A framework for biotechnology statistics,' 2005.
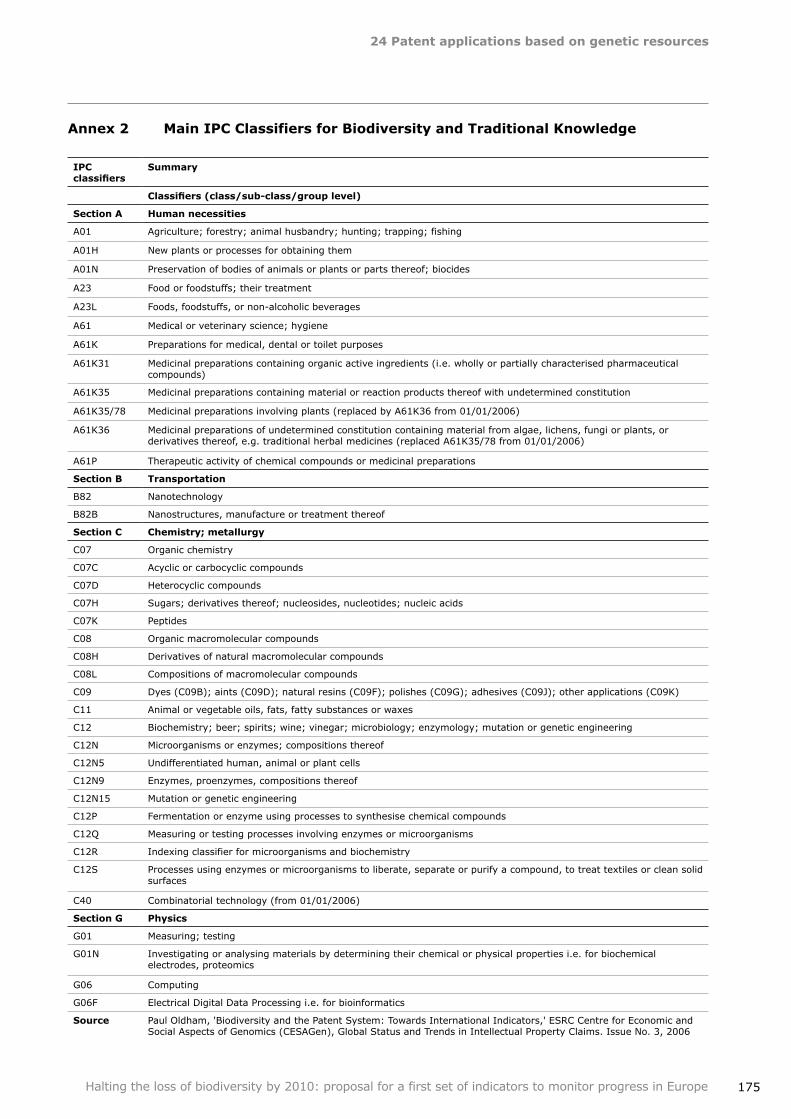
24Patentapplicationsbasedongeneticresources
175Halting the loss of biodiversity by 2010: proposal for a first set of indicators to monitor progress in Europe
Annex2 MainIPCClassifiersforBiodiversityandTraditionalKnowledge
IPCclassifiers
Summary
Classifiers (class/sub‑class/group level)
SectionA Humannecessities
A01 Agriculture; forestry; animal husbandry; hunting; trapping; fishing
A01H New plants or processes for obtaining them
A01N Preservation of bodies of animals or plants or parts thereof; biocides
A23 Food or foodstuffs; their treatment
A23L Foods, foodstuffs, or non‑alcoholic beverages
A61 Medical or veterinary science; hygiene
A61K Preparations for medical, dental or toilet purposes
A61K31 Medicinal preparations containing organic active ingredients (i.e. wholly or partially characterised pharmaceutical compounds)
A61K35 Medicinal preparations containing material or reaction products thereof with undetermined constitution
A61K35/78 Medicinal preparations involving plants (replaced by A61K36 from 01/01/2006)
A61K36 Medicinal preparations of undetermined constitution containing material from algae, lichens, fungi or plants, or derivatives thereof, e.g. traditional herbal medicines (replaced A61K35/78 from 01/01/2006)
A61P Therapeutic activity of chemical compounds or medicinal preparations
SectionB Transportation
B82 Nanotechnology
B82B Nanostructures, manufacture or treatment thereof
SectionC Chemistry;metallurgy
C07 Organic chemistry
C07C Acyclic or carbocyclic compounds
C07D Heterocyclic compounds
C07H Sugars; derivatives thereof; nucleosides, nucleotides; nucleic acids
C07K Peptides
C08 Organic macromolecular compounds
C08H Derivatives of natural macromolecular compounds
C08L Compositions of macromolecular compounds
C09 Dyes (C09B); aints (C09D); natural resins (C09F); polishes (C09G); adhesives (C09J); other applications (C09K)
C11 Animal or vegetable oils, fats, fatty substances or waxes
C12 Biochemistry; beer; spirits; wine; vinegar; microbiology; enzymology; mutation or genetic engineering
C12N Microorganisms or enzymes; compositions thereof
C12N5 Undifferentiated human, animal or plant cells
C12N9 Enzymes, proenzymes, compositions thereof
C12N15 Mutation or genetic engineering
C12P Fermentation or enzyme using processes to synthesise chemical compounds
C12Q Measuring or testing processes involving enzymes or microorganisms
C12R Indexing classifier for microorganisms and biochemistry
C12S Processes using enzymes or microorganisms to liberate, separate or purify a compound, to treat textiles or clean solid surfaces
C40 Combinatorial technology (from 01/01/2006)
SectionG Physics
G01 Measuring; testing
G01N Investigating or analysing materials by determining their chemical or physical properties i.e. for biochemical electrodes, proteomics
G06 Computing
G06F Electrical Digital Data Processing i.e. for bioinformatics
Source Paul Oldham, 'Biodiversity and the Patent System: Towards International Indicators,' ESRC Centre for Economic and Social Aspects of Genomics (CESAGen), Global Status and Trends in Intellectual Property Claims. Issue No. 3, 2006
176
25Financingbiodiversitymanagement
Halting the loss of biodiversity by 2010: proposal for a first set of indicators to monitor progress in Europe
Focalarea Status of resource transfers and use
Europeanindicatorheadline
Funding to biodiversity
Keypolicyquestion Are sufficient resources being allocated to the management and conservation of biodiversity?
Definition of the indicator
The indicator is a compilation of the value for the specific types of expenditure for biodiversity from the EU budget. Once this value has been obtained, it can then be expressed as a ratio in terms of the overall EU budget, in addition to its expression in absolute terms, which would be calculated in reference to an initial value for the euro to be determined as the baseline expenditure for biodiversity.
Income foregone as a result of any of the above circumstances is also a value that has to be included in the calculation as far as this is compensated from the EU budget.
The EU processes at present do not provide readily/publicly available data which breaks down their expenditure — so it is, for instance, not possible to find out what proportion of the agri‑environment budget has been spent on biodiversity. However, this data can be made available in future, at which point a baseline year can be chosen and accommodation made for the expansion of the EU and associated changes in budget streams.
Indicatortype(DPSIR) Response
Context The purpose of the indicator for financing biodiversity management is to obtain a value that embraces both what has been done in favour of biodiversity as well as what that has not been done, the latter in order to avoid damage to biodiversity. Considering what has not been done refers, inter alia, to the legislation that specifically prohibits action, and that subsequently may entail income foregone for a party thus constrained. To simplify, these two categories of action are addressed separately.
Actionstomaintainandenhancebiodiversity
The expenditure that is normally considered as beneficial for biodiversity should:
add to the territory that is reserved for nature conservation; manage the territory that has been set aside for nature conservation; promote conservation measures to maintain and restore nature generally,
including research; protect the diurnal or seasonal migration pathways for species; regulate land use, when the corresponding impacts are positive for the state of
biodiversity.
Actionstoprotectandrestorebiodiversity
The expenditure that is associated with avoiding (continued) harm to biodiversity should:
compensate for past or future disruption to the state of natural habitats; reintroduce species in a habitat where their numbers have declined below a
satisfactory level for maintaining a viable population or community; forbid certain uses of biodiversity (notably species capture — in all manners
— or harvesting); monitor species population levels and area of natural habitat; regulate land use, when the corresponding impacts would have been negative
for the state of biodiversity; these include cross‑compliance measures applied to agricultural (and forestry) practices.
1.2.3.
4.5.
1.2.
3.
4.5.
25 Financingbiodiversitymanagement
25Financingbiodiversitymanagement
177Halting the loss of biodiversity by 2010: proposal for a first set of indicators to monitor progress in Europe
Income foregone as a result of any of the above circumstances is also a value that has to be included in the calculation, as far as this is compensated from the EU budget.
Within the EU budget, the appropriate budget lines are:
Title 05 — agriculture
05 04 01 07 — agri‑environment (former system)
05 04 01 08 — agri‑environment (new system)
Title 07 — environment
07 03 03 01 — LIFE III (nature protection)
07 03 03 02 — Natura 2000 preparatory action
Relationoftheindicatortothefocalarea
Biodiversity funding at the EU level is an indication of the relative and absolute degree of resource transfer from the public sector for the benefit of maintaining or enhancing the state of biodiversity, or to avoid damage and disruption to ecological conditions.
Data sources and methodologyDataavailability EU Budget — Expenditures: Commitments in the Annual Appropriations.
Methodology Analysis of Titles, Chapters, Articles and Items.
To be tested with real data.
It remains to be decided how baseline expenditure is being determined, what year is chosen, and how the indicator takes into account the expansion of the EU and the budget, if for the baseline year a year is chosen before 2004/2007.
Evaluation of the indicatorMainadvantagesoftheindicator
Policy relevance: The level and development through time of financial means for Biodiversity management from the EU budget is immediately perceptible, and is the direct outcome of policy decisions. Biodiversity relevance: specifically indicates spending on biodiversity.
•
•
Maindisadvantagesoftheindicator
The indicator presents only EU budget financed activities. National contributions (which are for example in the Netherlands up to 85 % of the total expenditure) are not included. The picture is thus far from complete.The construction of the indicator from elements in the EU budget runs up against the lack of direct relationship between a budget line and the particular aspect of the indicator being investigated. Each of the EU budget lines retained, for instance, may cover several of the aspects of the indicator; conversely, some aspects may be covered in a budget line that is not easily identified for its relevance for biodiversity financing.
•
•
Analysisofoptions No other indicator was available at this stage.
Suggestionsforimprovement
Include national expenditure as well as private donations. Work is ongoing on a coding system that will determine EU Member State spending levels on biodiversity. In addition, more detailed information will be provided on other funding instruments such as the agro‑environment schemes, broader rural development, also including Natura 2000 payments, Structural Funds, RTD, and LIFE+.
The improvement of the indicator depends on more accurate accounting system within the EU that would allow tracking the disbursement of funds according to the legal instrument authorising the activity.
According to the EU Headline Indicator, resource transfers also need to be included (funding to biodiversity in economic and development cooperation).
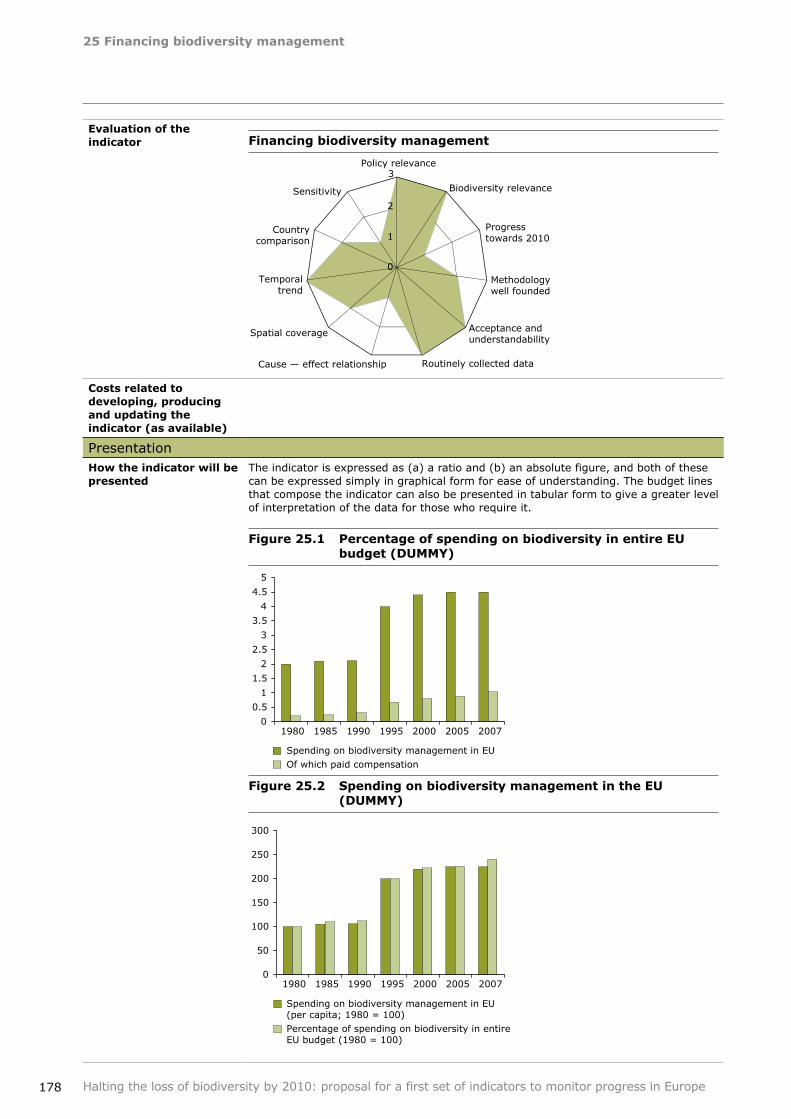
25Financingbiodiversitymanagement
178 Halting the loss of biodiversity by 2010: proposal for a first set of indicators to monitor progress in Europe
0
0.5
1
1.5
2
2.5
3
3.5
4
4.5
5
1980 1985 1990 1995 2000 2005 2007
1980 1985 1990 1995 2000 2005 2007
Spending on biodiversity management in EUOf which paid compensation
0
50
100
150
200
250
300
Spending on biodiversity management in EU(per capita; 1980 = 100)Percentage of spending on biodiversity in entire EU budget (1980 = 100)
Evaluationoftheindicator Financingbiodiversitymanagement
Costsrelatedtodeveloping,producingandupdatingtheindicator(asavailable)
PresentationHowtheindicatorwillbepresented
The indicator is expressed as (a) a ratio and (b) an absolute figure, and both of these can be expressed simply in graphical form for ease of understanding. The budget lines that compose the indicator can also be presented in tabular form to give a greater level of interpretation of the data for those who require it.
Figure25.1 PercentageofspendingonbiodiversityinentireEUbudget(DUMMY)
Figure25.2 SpendingonbiodiversitymanagementintheEU(DUMMY)
0
1
2
3 Policy relevance
Biodiversity relevance
Progress towards 2010
Methodology well founded
Acceptance and understandability
Routinely collected data Cause — effect relationship
Spatial coverage
Temporal trend
Country comparison
Sensitivity
25Financingbiodiversitymanagement
179Halting the loss of biodiversity by 2010: proposal for a first set of indicators to monitor progress in Europe
Howtheindicatorshouldbeinterpreted
An increase in funding is positive for biodiversity and hence the 2010 target; a decrease is negative.
The absolute impact on biodiversity depending on EU‑level financing is probably impossible to determine, because it is quite possible that substitution of national or other territorial funding could occur in the absence of EU‑level support, and collectively there are undoubtedly already other budgets for biodiversity financing at national and regional territorial levels which cover the entire EU.
MetadataSummarytechnicalinformationontheindicator
Title: Financing biodiversity managementStatus: proposalDefinition: the indicator is a compilation of the value for the specific types of expenditure for biodiversity from the EU budget. Once this value has been obtained, it can then be expressed as a ratio in terms of the overall EU budget, in addition to its expression in absolute terms, which would be calculated in reference to an initial value for the euro to be determined as the baseline expenditure for biodiversity. Income foregone as a result of any of the above circumstances is also a value that has to be included in the calculation as far as this is compensated from the EU budget.Geographical coverage: EU Member States.Temporal coverage: tbd.Update frequency: yearly.Identified experts: DG Environment, DG Budget.
•••
••••
References
180
26Publicawareness
Halting the loss of biodiversity by 2010: proposal for a first set of indicators to monitor progress in Europe
Focalarea Public Opinion
Europeanindicatorheadline
Public awareness and participation
Keypolicyquestion How important is biodiversity to Europeans? How can public awareness be increased to ensure the conservation of biodiversity?
Definition of the indicator
This indicator is based on a quantitative questionnaire‑based survey (Eurobarometer survey on biodiversity) to provide results that can be presented as, for instance (fictional example): '35 % of the European voting population visit a nature reserve at least once a year'. It can include qualitative information, often involving focus groups, for instance (fictional example): 'Discussion in the United Kingdom focus groups has shown that people are highly concerned about the impact of climate change on wildlife'.
Indicatortype(DPSIR) Response
Context Public opinion is a vital factor in influencing politicians and decision makers. It provides a barometer for public support and interest and is a motivation for individuals at all levels to lead and to take more action. The purpose of this indicator for public opinion is therefore to gauge attitudes of the general public in relation to issues such as: value for money and effectiveness in delivering biodiversity gains through public funding; knowledge of and value (financial and otherwise) assigned to wildlife; awareness of and opportunities to see wildlife and visit wildlife sites; etc.
Relationoftheindicatortothefocalarea
Public opinion is an indication of: 1) attitude towards biodiversity per se; and 2) the attitude of the action taken by politicians and public bodies toward the protection and management (financial and fiscal, public statements, etc.) for biodiversity.
Data sources and methodologyDataavailability The Eurobarometer survey referred to above will provide a baseline measure (results
expected early in 2008).
The Biodiversity Eurobarometer should be repeated (ideally more than once) before 2010 to allow for an interpretation of trends.
Methodology The standard Eurobarometer was established in 1973. Each survey consists of approximately 1 000 face‑to‑face interviews per member state (with variations in a small number of countries). They are conducted between two and five times a year, with reports published twice yearly. Against this background 'Special Eurobarometer' reports (of which biodiversity is one) are based on in‑depth thematic studies carried out for various services of the European Commission and other EU institutions and integrated in Standard Eurobarometer's polling waves.
Evaluation of the indicatorMainadvantagesoftheindicator
It is policy relevant, and it is currently tested in all EU Member States. It is cost‑effective and complementary to other indicators.
••
Maindisadvantagesoftheindicator
It is entirely dependant on the questions asked in the survey. Additionally, the answers are directly linked to factors that will vary between countries, for instance:
Economic prosperity (the ability of travel, etc.);Cultural and socio economic factors (e.g. nature reserve is a playground to visit for some, and some countries, and a place to live and work for others).
Differing levels of interpretation/response by the public based on socio‑economic/cultural factors.Only one data point is certain before 2010.
•
••
•
•
26 Publicawareness
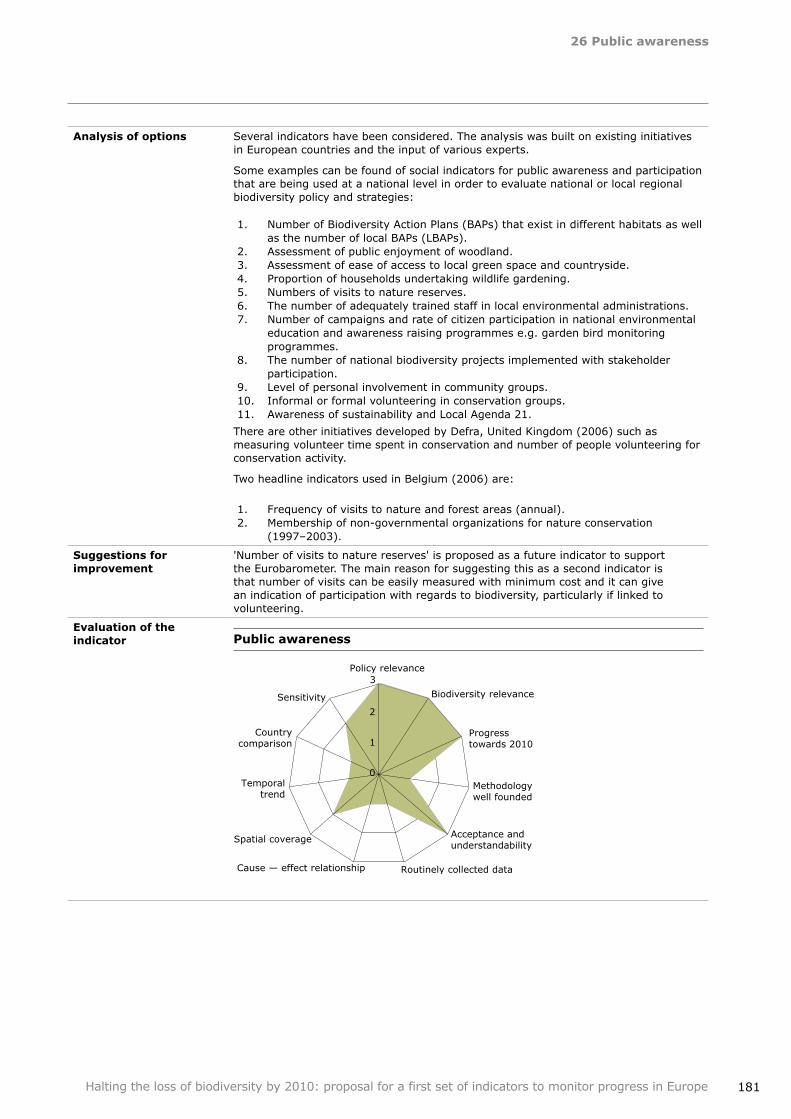
26Publicawareness
181Halting the loss of biodiversity by 2010: proposal for a first set of indicators to monitor progress in Europe
Analysisofoptions Several indicators have been considered. The analysis was built on existing initiatives in European countries and the input of various experts.
Some examples can be found of social indicators for public awareness and participation that are being used at a national level in order to evaluate national or local regional biodiversity policy and strategies:
Number of Biodiversity Action Plans (BAPs) that exist in different habitats as well as the number of local BAPs (LBAPs).
Assessment of public enjoyment of woodland. Assessment of ease of access to local green space and countryside. Proportion of households undertaking wildlife gardening. Numbers of visits to nature reserves. The number of adequately trained staff in local environmental administrations. Number of campaigns and rate of citizen participation in national environmental
education and awareness raising programmes e.g. garden bird monitoring programmes.
The number of national biodiversity projects implemented with stakeholder participation.
Level of personal involvement in community groups. Informal or formal volunteering in conservation groups. Awareness of sustainability and Local Agenda 21.
There are other initiatives developed by Defra, United Kingdom (2006) such as measuring volunteer time spent in conservation and number of people volunteering for conservation activity.
Two headline indicators used in Belgium (2006) are:
Frequency of visits to nature and forest areas (annual). Membership of non‑governmental organizations for nature conservation
(1997–2003).
1.
2.3.4.5.6.7.
8.
9.10.11.
1.2.
Suggestionsforimprovement
'Number of visits to nature reserves' is proposed as a future indicator to support the Eurobarometer. The main reason for suggesting this as a second indicator is that number of visits can be easily measured with minimum cost and it can give an indication of participation with regards to biodiversity, particularly if linked to volunteering.
Evaluationoftheindicator Publicawareness
0
1
2
3 Policy relevance
Biodiversity relevance
Progress towards 2010
Methodology well founded
Acceptance and understandability
Routinely collected data Cause — effect relationship
Spatial coverage
Temporal trend
Country comparison
Sensitivity
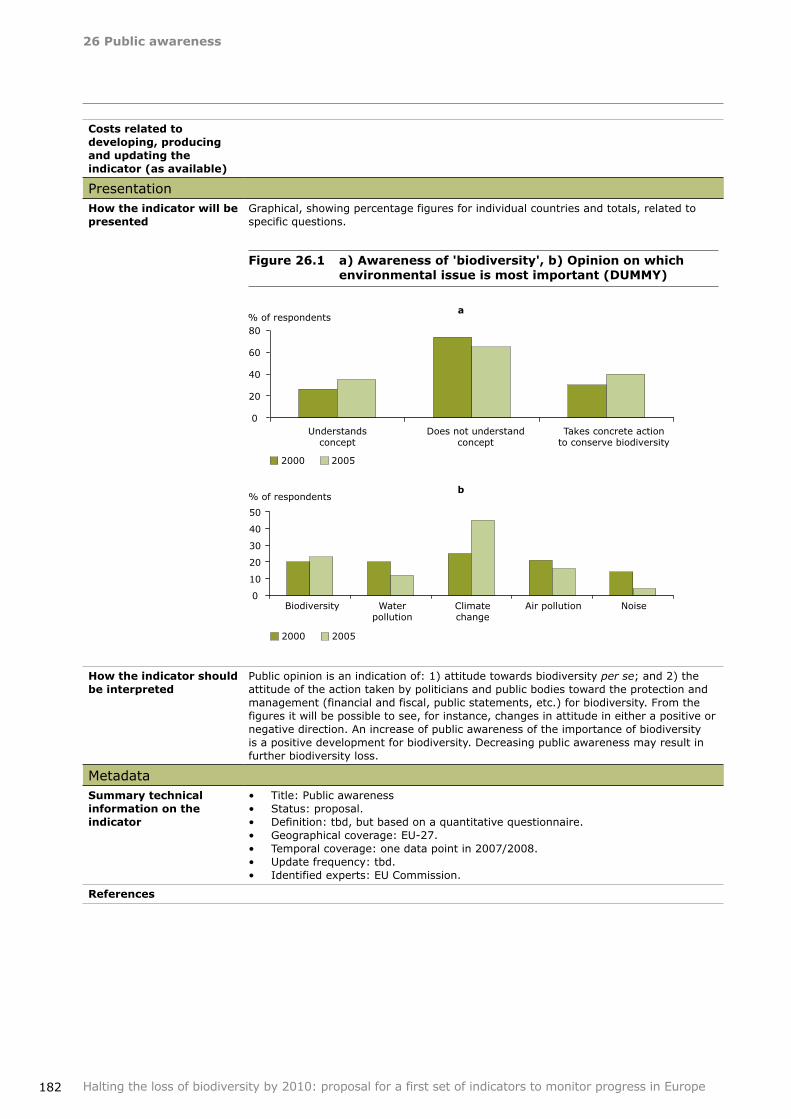
26Publicawareness
182 Halting the loss of biodiversity by 2010: proposal for a first set of indicators to monitor progress in Europe
Costsrelatedtodeveloping,producingandupdatingtheindicator(asavailable)
PresentationHowtheindicatorwillbepresented
Graphical, showing percentage figures for individual countries and totals, related to specific questions.
Figure26.1 a)Awarenessof'biodiversity',b)Opiniononwhichenvironmentalissueismostimportant(DUMMY)
Howtheindicatorshouldbeinterpreted
Public opinion is an indication of: 1) attitude towards biodiversity per se; and 2) the attitude of the action taken by politicians and public bodies toward the protection and management (financial and fiscal, public statements, etc.) for biodiversity. From the figures it will be possible to see, for instance, changes in attitude in either a positive or negative direction. An increase of public awareness of the importance of biodiversity is a positive development for biodiversity. Decreasing public awareness may result in further biodiversity loss.
MetadataSummarytechnicalinformationontheindicator
Title: Public awarenessStatus: proposal.Definition: tbd, but based on a quantitative questionnaire.Geographical coverage: EU‑27.Temporal coverage: one data point in 2007/2008.Update frequency: tbd.Identified experts: EU Commission.
•••••••
References
% of respondents
0
10
20
30
40
50
Biodiversity Waterpollution
Climatechange
Air pollution Noise
2000 2005
% of respondents
0
20
40
60
80
2000 2005
Understandsconcept
Does not understandconcept
Takes concrete actionto conserve biodiversity
a
b

European Environment Agency
Haltingthelossofbiodiversityby2010:proposal for a first set of indicators to monitor progress in Europe
2007 — 182 pp. — 21 x 29.7 cm
ISBN 978‑92‑9167‑931‑7
European Environment AgencyKongens Nytorv 61050 Copenhagen KDenmark
Tel.: +45 33 36 71 00Fax: +45 33 36 71 99
Web: eea.europa.euEnquiries: eea.europa.eu/enquiries
TH
‑AK‑0
7‑0
12‑E
N‑N