Embed Size (px)
Citation preview
HALF YEARLY REPORT31 December 2018
(Un-Audited)
HALF YEARLY REPORT 31 DECEMBER 201802
03HALF YEARLY REPORT 31 DECEMBER 2018
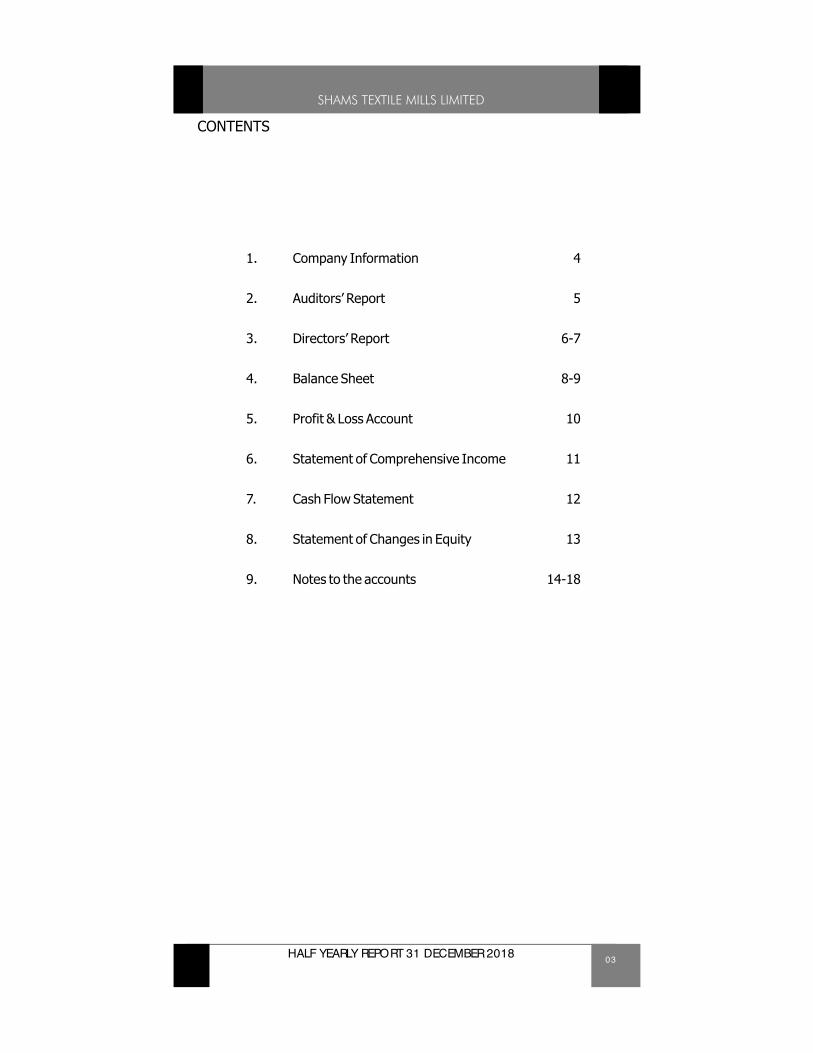
1. Company Information 4
2. Auditors’ Report 5
3. Directors’ Report 6-7
4. Balance Sheet 8-9
5. Profit & Loss Account 10
6. Statement of Comprehensive Income 11
7. Cash Flow Statement 12
8. Statement of Changes in Equity 13
9. Notes to the accounts 14-18
CONTENTS
04 HALF YEARLY REPORT 31 DECEMBER 2018
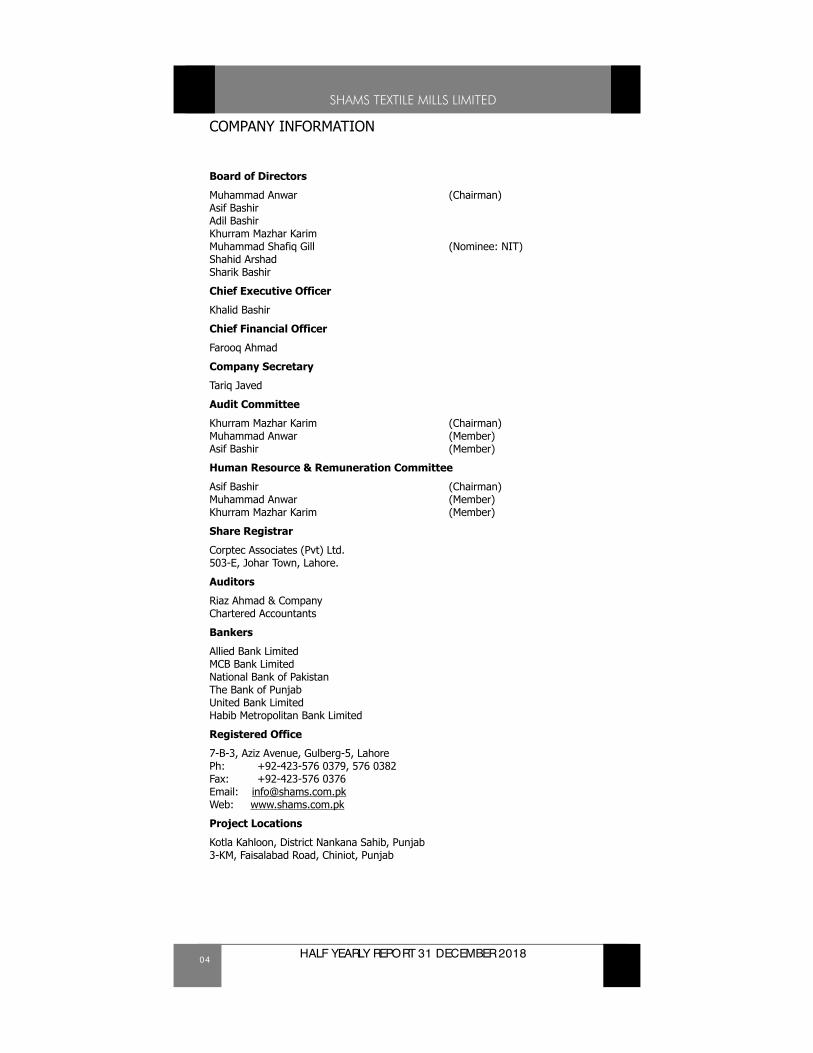
Board of Directors
Muhammad Anwar (Chairman)Asif BashirAdil Bashir Khurram Mazhar KarimMuhammad Shafiq Gill (Nominee: NIT)Shahid ArshadSharik Bashir
Chief Executive Officer
Khalid Bashir
Chief Financial Officer
Farooq Ahmad
Company Secretary
Tariq Javed
Audit Committee
Khurram Mazhar Karim (Chairman)Muhammad Anwar (Member)Asif Bashir (Member)
Human Resource & Remuneration Committee
Asif Bashir (Chairman)Muhammad Anwar (Member)Khurram Mazhar Karim (Member)
Share Registrar
Corptec Associates (Pvt) Ltd.503-E, Johar Town, Lahore.
Auditors
Riaz Ahmad & Company Chartered Accountants
Bankers
Allied Bank LimitedMCB Bank LimitedNational Bank of PakistanThe Bank of PunjabUnited Bank LimitedHabib Metropolitan Bank Limited
Registered Office
7-B-3, Aziz Avenue, Gulberg-5, LahorePh: +92-423-576 0379, 576 0382Fax: +92-423-576 0376Email: [email protected] Web: www.shams.com.pk
Project Locations
Kotla Kahloon, District Nankana Sahib, Punjab3-KM, Faisalabad Road, Chiniot, Punjab
COMPANY INFORMATION
05HALF YEARLY REPORT 31 DECEMBER 2018
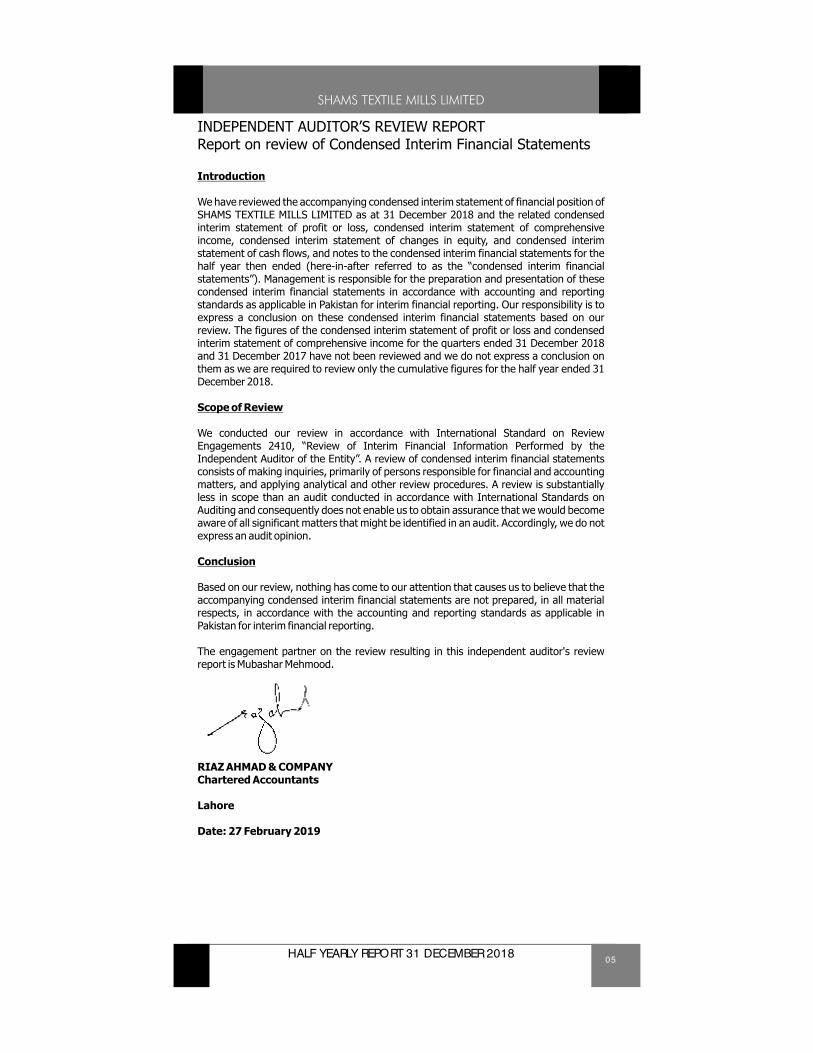
Introduction
We have reviewed the accompanying condensed interim statement of financial position of SHAMS TEXTILE MILLS LIMITED as at 31 December 2018 and the related condensed interim statement of profit or loss, condensed interim statement of comprehensive income, condensed interim statement of changes in equity, and condensed interim statement of cash flows, and notes to the condensed interim financial statements for the half year then ended (here-in-after referred to as the “condensed interim financial statements”). Management is responsible for the preparation and presentation of these condensed interim financial statements in accordance with accounting and reporting standards as applicable in Pakistan for interim financial reporting. Our responsibility is to express a conclusion on these condensed interim financial statements based on our review. The figures of the condensed interim statement of profit or loss and condensed interim statement of comprehensive income for the quarters ended 31 December 2018 and 31 December 2017 have not been reviewed and we do not express a conclusion on them as we are required to review only the cumulative figures for the half year ended 31 December 2018.
Scope of Review
We conducted our review in accordance with International Standard on Review Engagements 2410, “Review of Interim Financial Information Performed by the Independent Auditor of the Entity”. A review of condensed interim financial statements consists of making inquiries, primarily of persons responsible for financial and accounting matters, and applying analytical and other review procedures. A review is substantially less in scope than an audit conducted in accordance with International Standards on Auditing and consequently does not enable us to obtain assurance that we would become aware of all significant matters that might be identified in an audit. Accordingly, we do not express an audit opinion.
Conclusion
Based on our review, nothing has come to our attention that causes us to believe that the accompanying condensed interim financial statements are not prepared, in all material respects, in accordance with the accounting and reporting standards as applicable in Pakistan for interim financial reporting.
The engagement partner on the review resulting in this independent auditor's review report is Mubashar Mehmood.
RIAZ AHMAD & COMPANYChartered Accountants
Lahore
Date: 27 February 2019
INDEPENDENT AUDITOR’S REVIEW REPORTReport on review of Condensed Interim Financial Statements
06 HALF YEARLY REPORT 31 DECEMBER 2018
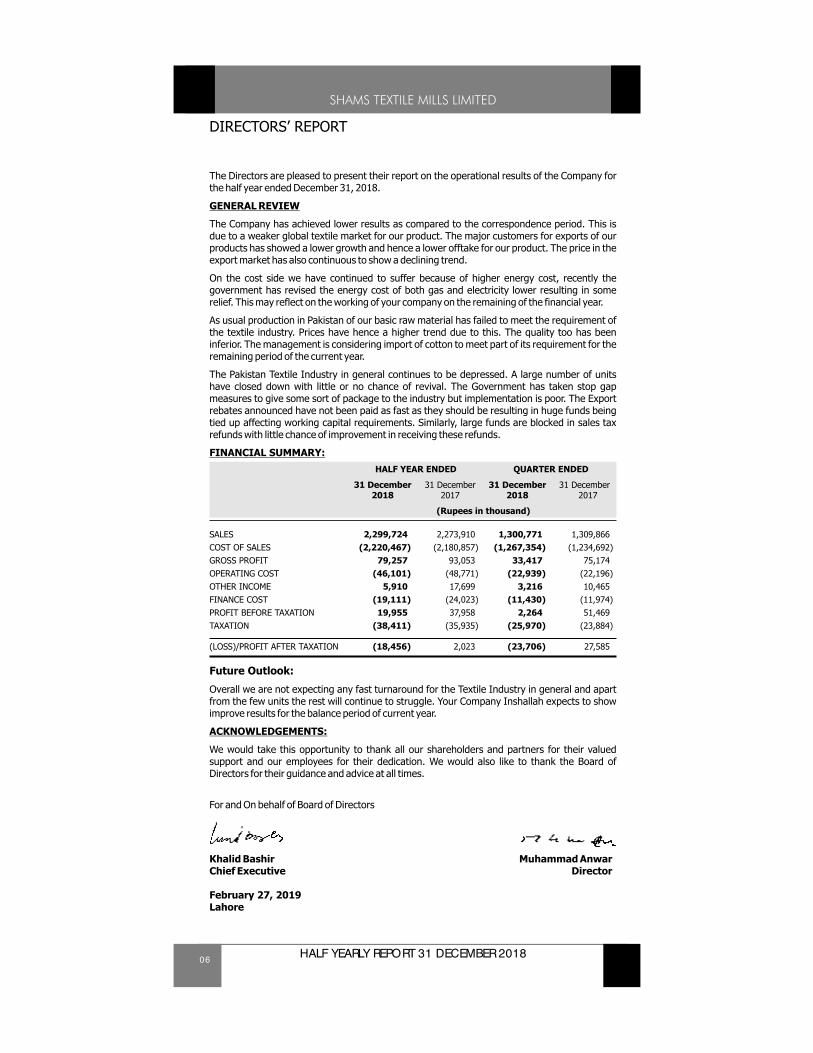
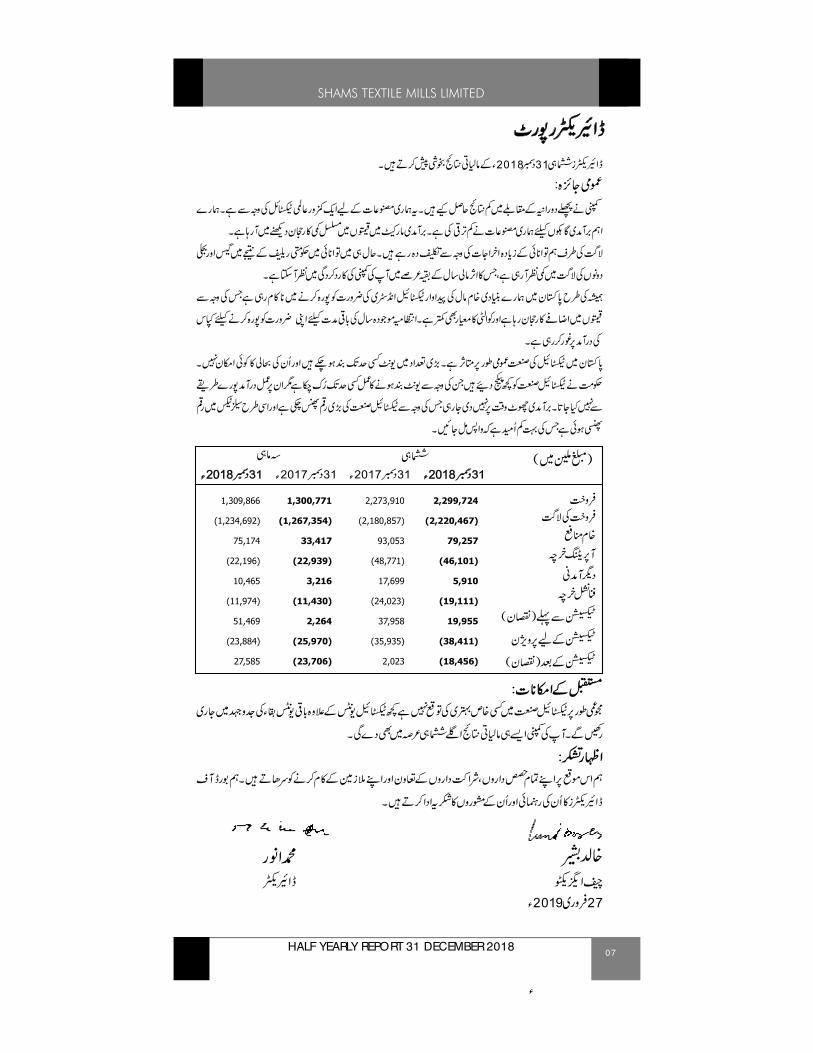
The Directors are pleased to present their report on the operational results of the Company for the half year ended December 31, 2018.
GENERAL REVIEW
The Company has achieved lower results as compared to the correspondence period. This is due to a weaker global textile market for our product. The major customers for exports of our products has showed a lower growth and hence a lower offtake for our product. The price in the export market has also continuous to show a declining trend.
On the cost side we have continued to suffer because of higher energy cost, recently the government has revised the energy cost of both gas and electricity lower resulting in some relief. This may reflect on the working of your company on the remaining of the financial year.
As usual production in Pakistan of our basic raw material has failed to meet the requirement of the textile industry. Prices have hence a higher trend due to this. The quality too has been inferior. The management is considering import of cotton to meet part of its requirement for the remaining period of the current year.
The Pakistan Textile Industry in general continues to be depressed. A large number of units have closed down with little or no chance of revival. The Government has taken stop gap measures to give some sort of package to the industry but implementation is poor. The Export rebates announced have not been paid as fast as they should be resulting in huge funds being tied up affecting working capital requirements. Similarly, large funds are blocked in sales tax refunds with little chance of improvement in receiving these refunds.
FINANCIAL SUMMARY:
HALF YEAR ENDED QUARTER ENDED
31 December 31 December 31 December 31 December2018 2017 2018 2017
(Rupees in thousand)
SALES 2,299,724 2,273,910 1,300,771 1,309,866COST OF SALES (2,220,467) (2,180,857) (1,267,354) (1,234,692)GROSS PROFIT 79,257 93,053 33,417 75,174OPERATING COST (46,101) (48,771) (22,939) (22,196)OTHER INCOME 5,910 17,699 3,216 10,465FINANCE COST (19,111) (24,023) (11,430) (11,974)PROFIT BEFORE TAXATION 19,955 37,958 2,264 51,469TAXATION (38,411) (35,935) (25,970) (23,884)
(LOSS)/PROFIT AFTER TAXATION (18,456) 2,023 (23,706) 27,585
Future Outlook:
Overall we are not expecting any fast turnaround for the Textile Industry in general and apart from the few units the rest will continue to struggle. Your Company Inshallah expects to show improve results for the balance period of current year.
ACKNOWLEDGEMENTS:
We would take this opportunity to thank all our shareholders and partners for their valued support and our employees for their dedication. We would also like to thank the Board of Directors for their guidance and advice at all times.
For and On behalf of Board of Directors
Khalid Bashir Muhammad AnwarChief Executive Director
February 27, 2019Lahore
DIRECTORS’ REPORT
07HALF YEARLY REPORT 31 DECEMBER 2018
20182018
2,299,724
(2,220,467)
79,257
(46,101)
5,910
(19,111)
19,955
(38,411)
(18,456)
2,273,910
(2,180,857)
93,053
(48,771)
17,699
(24,023)
37,958
(35,935)
2,023
1,300,771
(1,267,354)
33,417
(22,939)
3,216
(11,430)
2,264
(25,970)
(23,706)
1,309,866
(1,234,692)
75,174
(22,196)
10,465
(11,974)
51,469
(23,884)
27,585
08 HALF YEARLY REPORT 31 DECEMBER 2018
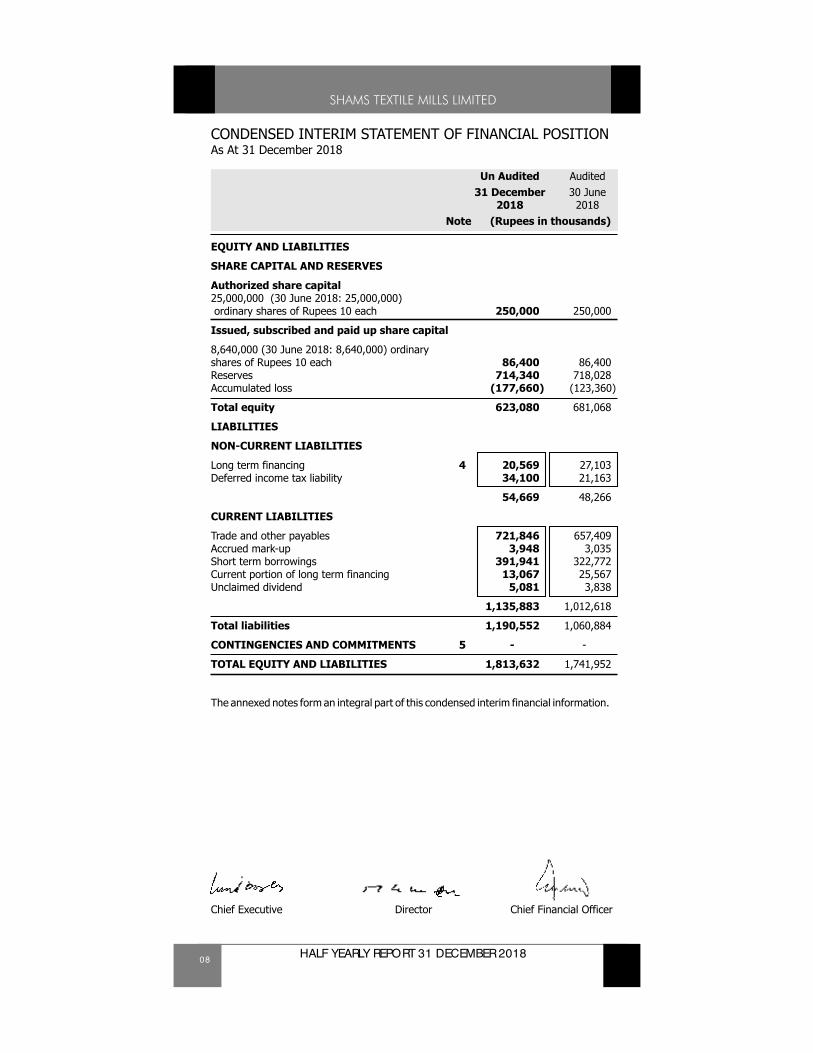
CONDENSED INTERIM STATEMENT OF FINANCIAL POSITIONAs At 31 December 2018
Un Audited Audited31 December 30 June
2018 2018Note (Rupees in thousands)
EQUITY AND LIABILITIES
SHARE CAPITAL AND RESERVES
Authorized share capital25,000,000 (30 June 2018: 25,000,000) ordinary shares of Rupees 10 each 250,000 250,000
Issued, subscribed and paid up share capital
8,640,000 (30 June 2018: 8,640,000) ordinaryshares of Rupees 10 each 86,400 86,400Reserves 714,340 718,028Accumulated loss (177,660) (123,360)
Total equity 623,080 681,068
LIABILITIES
NON-CURRENT LIABILITIES
Long term financing 4 20,569 27,103Deferred income tax liability 34,100 21,163
54,669 48,266
CURRENT LIABILITIES
Trade and other payables 721,846 657,409Accrued mark-up 3,948 3,035Short term borrowings 391,941 322,772Current portion of long term financing 13,067 25,567Unclaimed dividend 5,081 3,838
1,135,883 1,012,618
Total liabilities 1,190,552 1,060,884
CONTINGENCIES AND COMMITMENTS 5 - -
TOTAL EQUITY AND LIABILITIES 1,813,632 1,741,952
The annexed notes form an integral part of this condensed interim financial information.
Chief Executive Director Chief Financial Officer
09HALF YEARLY REPORT 31 DECEMBER 2018
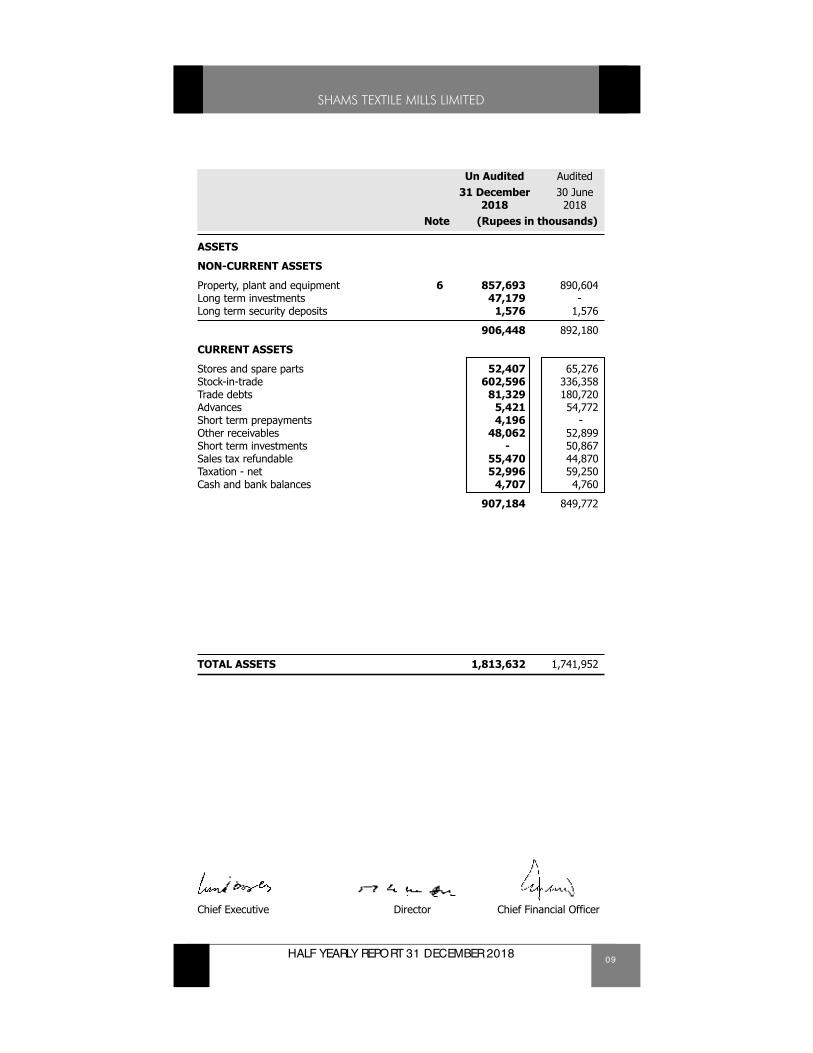
Un Audited Audited31 December 30 June
2018 2018Note (Rupees in thousands)
ASSETS
NON-CURRENT ASSETS
Property, plant and equipment 6 857,693 890,604Long term investments 47,179 -Long term security deposits 1,576 1,576
906,448 892,180
CURRENT ASSETS
Stores and spare parts 52,407 65,276Stock-in-trade 602,596 336,358Trade debts 81,329 180,720Advances 5,421 54,772Short term prepayments 4,196 -Other receivables 48,062 52,899Short term investments - 50,867Sales tax refundable 55,470 44,870Taxation - net 52,996 59,250Cash and bank balances 4,707 4,760
907,184 849,772
TOTAL ASSETS 1,813,632 1,741,952
Chief Executive Director Chief Financial Officer
10 HALF YEARLY REPORT 31 DECEMBER 2018
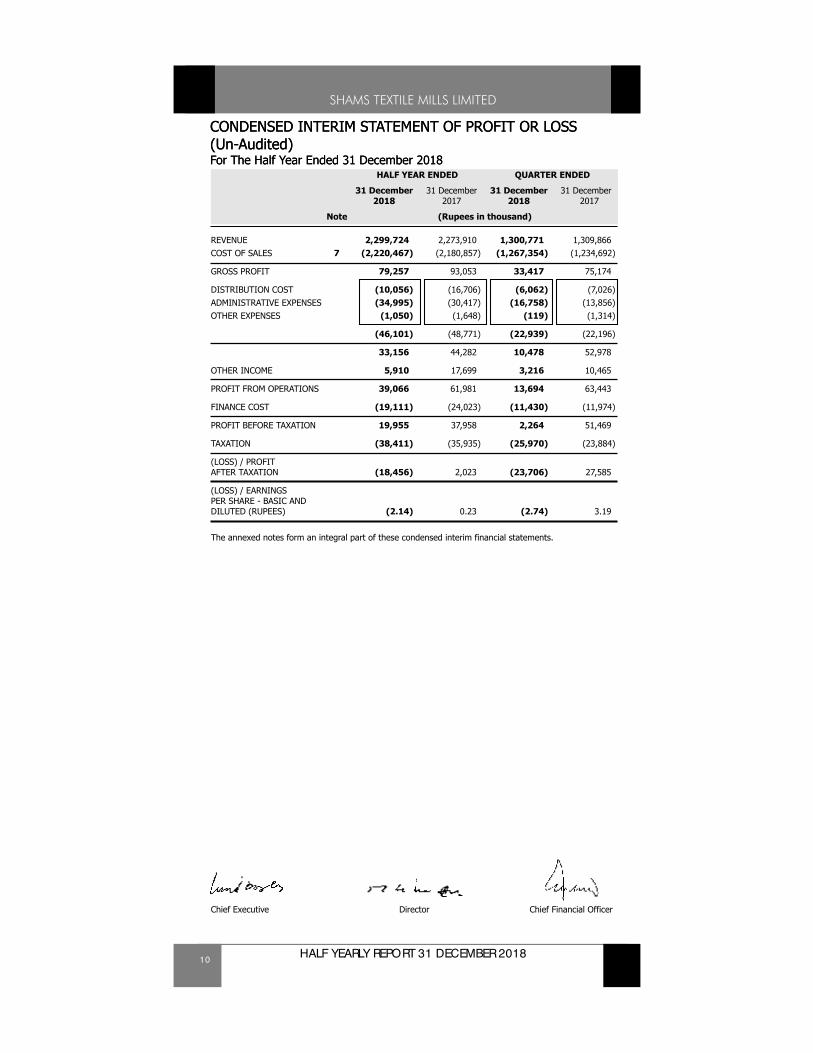
CONDENSED INTERIM STATEMENT OF PROFIT OR LOSS (Un-Audited)For The Half Year Ended 31 December 2018
CONDENSED INTERIM STATEMENT OF PROFIT OR LOSS (Un-Audited)For The Half Year Ended 31 December 2018
HALF YEAR ENDED QUARTER ENDED
31 December 31 December 31 December 31 December2018 2017 2018 2017
Note (Rupees in thousand)
REVENUE 2,299,724 2,273,910 1,300,771 1,309,866COST OF SALES 7 (2,220,467) (2,180,857) (1,267,354) (1,234,692)
GROSS PROFIT 79,257 93,053 33,417 75,174
DISTRIBUTION COST (10,056) (16,706) (6,062) (7,026)ADMINISTRATIVE EXPENSES (34,995) (30,417) (16,758) (13,856)OTHER EXPENSES (1,050) (1,648) (119) (1,314)
(46,101) (48,771) (22,939) (22,196)
33,156 44,282 10,478 52,978
OTHER INCOME 5,910 17,699 3,216 10,465
PROFIT FROM OPERATIONS 39,066 61,981 13,694 63,443
FINANCE COST (19,111) (24,023) (11,430) (11,974)
PROFIT BEFORE TAXATION 19,955 37,958 2,264 51,469
TAXATION (38,411) (35,935) (25,970) (23,884)
(LOSS) / PROFIT AFTER TAXATION (18,456) 2,023 (23,706) 27,585
(LOSS) / EARNINGS PER SHARE - BASIC AND DILUTED (RUPEES) (2.14) 0.23 (2.74) 3.19
The annexed notes form an integral part of these condensed interim financial statements.
Chief Executive Director Chief Financial Officer
11HALF YEARLY REPORT 31 DECEMBER 2018
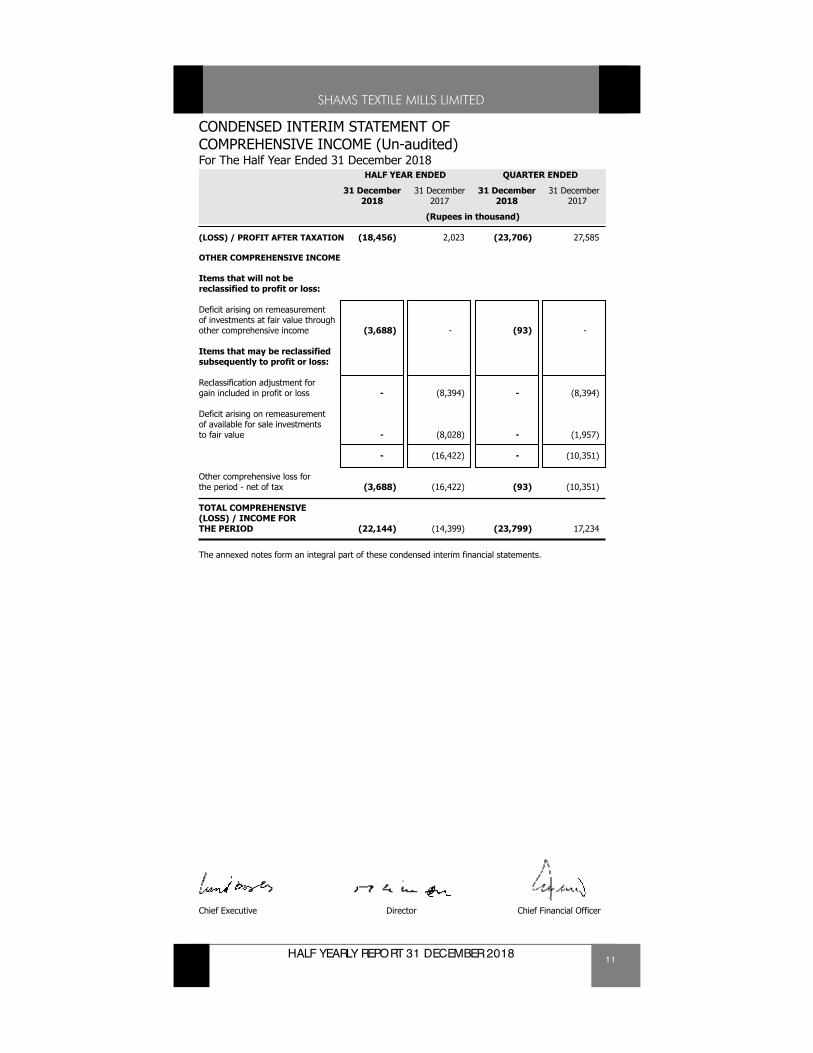
CONDENSED INTERIM STATEMENT OF COMPREHENSIVE INCOME (Un-audited)For The Half Year Ended 31 December 2018
HALF YEAR ENDED QUARTER ENDED
31 December 31 December 31 December 31 December2018 2017 2018 2017
(Rupees in thousand)
(LOSS) / PROFIT AFTER TAXATION (18,456) 2,023 (23,706) 27,585
OTHER COMPREHENSIVE INCOME
Items that will not be reclassified to profit or loss:
Deficit arising on remeasurement of investments at fair value through other comprehensive income (3,688) - (93) -
Items that may be reclassified subsequently to profit or loss:
Reclassification adjustment for gain included in profit or loss - (8,394) - (8,394)
Deficit arising on remeasurement of available for sale investments to fair value - (8,028) - (1,957)
- (16,422) - (10,351)
Other comprehensive loss for the period - net of tax (3,688) (16,422) (93) (10,351)
TOTAL COMPREHENSIVE (LOSS) / INCOME FOR THE PERIOD (22,144) (14,399) (23,799) 17,234
The annexed notes form an integral part of these condensed interim financial statements.
Chief Executive Director Chief Financial Officer
12 HALF YEARLY REPORT 31 DECEMBER 2018
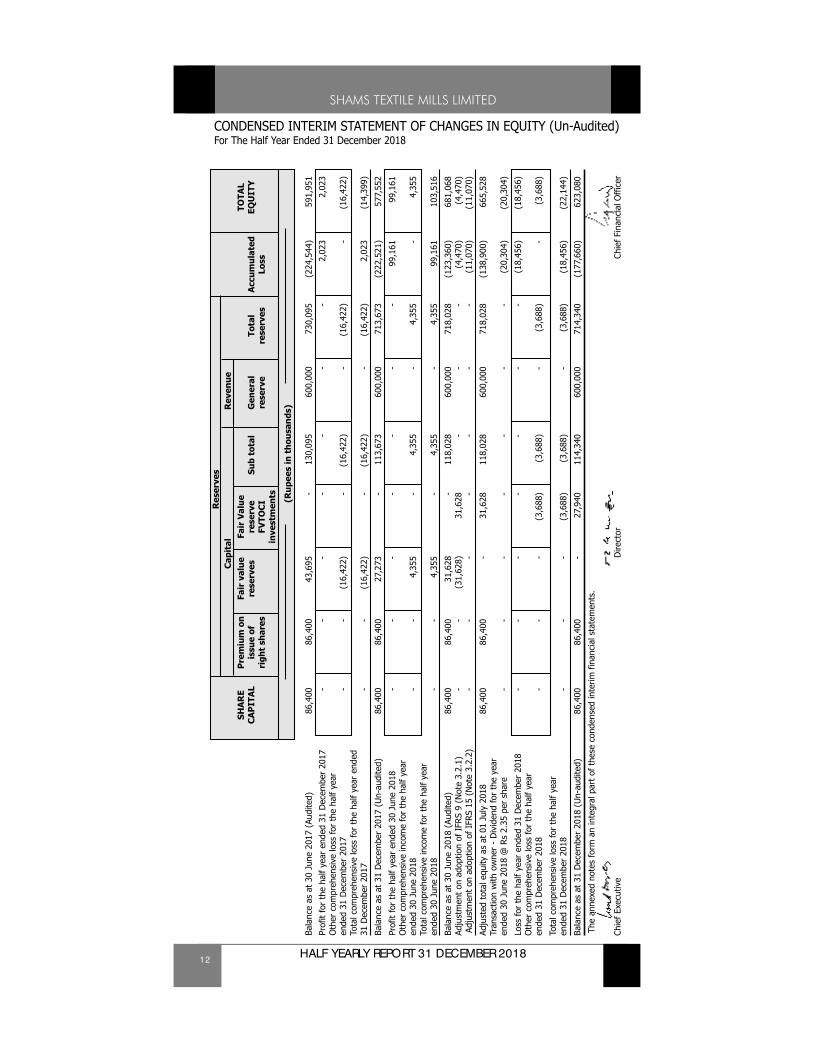
CONDENSED INTERIM STATEMENT OF CHANGES IN EQUITY (Un-Audited)For The Half Year Ended 31 December 2018
Res
erve
sC
apit
alR
even
ueSH
AR
EP
rem
ium
on
Fair
val
ueFa
ir V
alue
TOTA
LC
AP
ITA
Lis
sue
ofre
serv
esre
serv
e Su
b to
tal
Gen
eral
Tota
lA
ccum
ulat
edEQ
UIT
Yri
ght
shar
esFV
TOC
Ire
serv
ere
serv
esLo
ssin
vest
men
ts (Rup
ees
in t
hous
ands
)
Bala
nce
as a
t 30
Jun
e 20
17 (
Audi
ted)
86,4
0086
,400
43,6
95-
130,
095
600,
000
730,
095
(224
,544
)59
1,95
1
Prof
it fo
r th
e ha
lf ye
ar e
nded
31
Dec
embe
r 20
17-
--
--
--
2,02
32,
023
Oth
er c
ompr
ehen
sive
loss
for
the
half
year
en
ded
31 D
ecem
ber
2017
--
(16,
422)
-(1
6,42
2)-
(16,
422)
-(1
6,42
2)To
tal c
ompr
ehen
sive
loss
for
the
half
year
end
ed
31 D
ecem
ber
2017
--
(16,
422)
-(1
6,42
2)-
(16,
422)
2,02
3(1
4,39
9)
Bala
nce
as a
t 31
Dec
embe
r 20
17 (
Un-
audi
ted)
86,4
0086
,400
27,2
73-
113,
673
600,
000
713,
673
(222
,521
)57
7,55
2
Prof
it fo
r th
e ha
lf ye
ar e
nded
30
June
201
8-
--
--
--
99,1
6199
,161
Oth
er c
ompr
ehen
sive
inco
me
for
the
half
year
en
ded
30 J
une
2018
--
4,35
5-
4,35
5-
4,35
5-
4,35
5To
tal c
ompr
ehen
sive
inco
me
for
the
half
year
en
ded
30 J
une
2018
--
4,35
5-
4,35
5-
4,35
599
,161
103,
516
Bala
nce
as a
t 30
Jun
e 20
18 (
Audi
ted)
86,4
0086
,400
31,6
28-
118,
028
600,
000
718,
028
(123
,360
)68
1,06
8Ad
just
men
t on
ado
ptio
n of
IFR
S 9
(Not
e 3.
2.1)
--
(31,
628)
31,6
28-
--
(4,4
70)
(4,4
70)
Adj
ustm
ent
on a
dopt
ion
of I
FRS
15 (
Not
e 3.
2.2)
--
--
--
-(1
1,07
0)(1
1,07
0)
Adju
sted
tot
al e
quity
as
at 0
1 Ju
ly 2
018
86,4
0086
,400
-31
,628
118,
028
600,
000
718,
028
(138
,900
)66
5,52
8Tr
ansa
ctio
n w
ith o
wne
r -
Div
iden
d fo
r th
e ye
ar
ende
d 30
Jun
e 20
18 @
Rs
2.35
per
sha
re-
--
--
--
(20,
304)
(20,
304)
Loss
for
the
half
year
end
ed 3
1 D
ecem
ber
2018
--
--
--
-(1
8,45
6)(1
8,45
6)O
ther
com
preh
ensi
ve lo
ss fo
r th
e ha
lf ye
ar
ende
d 31
Dec
embe
r 20
18-
--
(3,6
88)
(3,6
88)
-(3
,688
)-
(3,6
88)
Tota
l com
preh
ensi
ve lo
ss fo
r th
e ha
lf ye
ar
ende
d 31
Dec
embe
r 20
18-
--
(3,6
88)
(3,6
88)
-(3
,688
)(1
8,45
6)(2
2,14
4)
Bala
nce
as a
t 31
Dec
embe
r 20
18 (
Un-
audi
ted)
86,4
0086
,400
-27
,940
114,
340
600,
000
714,
340
(177
,660
)62
3,08
0
The
ann
exed
not
es fo
rm a
n in
tegr
al p
art
of t
hese
con
dens
ed in
terim
fin
anci
al s
tate
men
ts.
Chie
f Ex
ecut
ive
Dire
ctor
Chie
f Fi
nanc
ial O
ffic
er
13HALF YEARLY REPORT 31 DECEMBER 2018
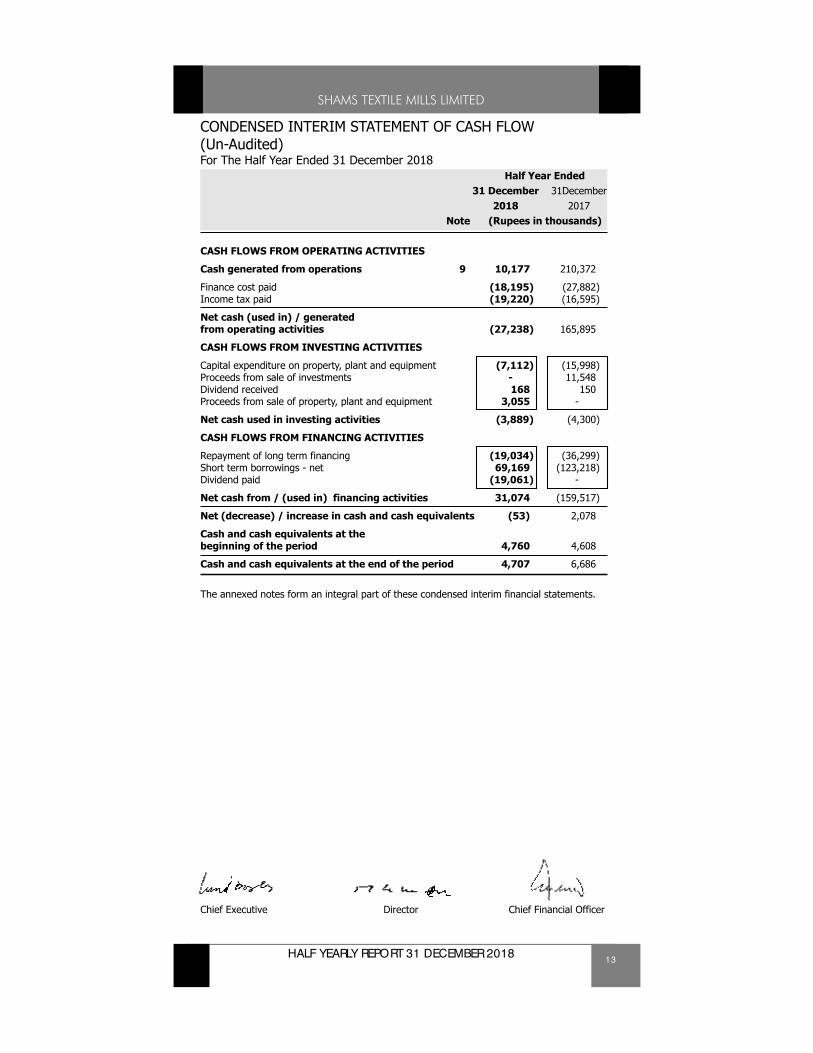
CONDENSED INTERIM STATEMENT OF CASH FLOW (Un-Audited)For The Half Year Ended 31 December 2018
Half Year Ended31 December 31December
2018 2017Note (Rupees in thousands)
CASH FLOWS FROM OPERATING ACTIVITIES
Cash generated from operations 9 10,177 210,372
Finance cost paid (18,195) (27,882)Income tax paid (19,220) (16,595)
Net cash (used in) / generated from operating activities (27,238) 165,895
CASH FLOWS FROM INVESTING ACTIVITIES
Capital expenditure on property, plant and equipment (7,112) (15,998)Proceeds from sale of investments - 11,548Dividend received 168 150Proceeds from sale of property, plant and equipment 3,055 -
Net cash used in investing activities (3,889) (4,300)
CASH FLOWS FROM FINANCING ACTIVITIES
Repayment of long term financing (19,034) (36,299)Short term borrowings - net 69,169 (123,218)Dividend paid (19,061) -
Net cash from / (used in) financing activities 31,074 (159,517)
Net (decrease) / increase in cash and cash equivalents (53) 2,078
Cash and cash equivalents at the beginning of the period 4,760 4,608
Cash and cash equivalents at the end of the period 4,707 6,686
The annexed notes form an integral part of these condensed interim financial statements.
Chief Executive Director Chief Financial Officer
14 HALF YEARLY REPORT 31 DECEMBER 2018
SELECTED NOTES TO THE CONDENSED INTERIMFINANCIAL INFORMATION (Un-Audited)For The Half Year Ended 31 December 2018
1. THE COMPANY AND ITS OPERATIONS
Shams Textile Mills Limited ("the Company") is a public limited Company incorporated in Pakistan under the Companies Act, 1913 (Now the Companies Act, 2017) and is listed on Pakistan Stock Exchange Limited. Its registered office is situated at 7-B-III, Aziz Avenue, Gulberg V, Lahore. The Company is engaged in the business of manufacturing, sale and trading of yarn and trading of cloth.
2. BASIS OF PREPARATION
2.1 These condensed interim financial statements have been prepared in accordance with the accounting and reporting standards as applicable in Pakistan for interim financial reporting. The accounting and reporting standards as applicable in Pakistan for interim financial reporting comprise of:
• International Accounting Standard (IAS) 34, Interim Financial Reporting, issued by the International Accounting Standards Board (IASB) as notified under the Companies Act, 2017; and
• Provisions of and directives issued under the Companies Act, 2017.
Where the provisions of and directives issued under the Companies Act, 2017 differ with the requirements of IAS 34, the provisions of and directives issued under the Companies Act, 2017 have been followed.
2.2 These condensed interim financial statements do not include all the information and disclosures required in annual financial statements and should be read in conjunction with the annual audited financial statements of the Company for the year ended 30 June 2018. These condensed interim financial statements are un-audited, however, have been subjected to limited scope review by the auditors and are being submitted to the shareholders as required by the Listed Companies (Code of Corporate Governance) Regulations, 2017 and Section 237 of the Companies Act, 2017.
3. ACCOUNTING POLICIES
The accounting policies and methods of computations adopted for the preparation of these condensed interim financial statements are the same as applied in the preparation of the preceding audited annual published financial statements of the Company for the year ended 30 June 2018 except for the changes in accounting policies as stated in note 3.2 to these condensed interim financial statements.
3.1 CRITICAL ACCOUNTING ESTIMATES AND JUDGEMENTS
The preparation of these condensed interim financial statements in conformity with the approved accounting standards requires the use of certain critical accounting estimates. It also requires the management to exercise its judgment in the process of applying the Company's accounting policies. Estimates and judgments are continually evaluated and are based on historical experience and other factors, including expectations of future events that are believed to be reasonable under the circumstances.
During preparation of these condensed interim financial statements, the significant judgments made by the management in applying the Company’s accounting policies and the key sources of estimation and uncertainty were the same as those that applied in the preceding audited annual published financial statements of the Company for the year ended 30 June 2018.
3.2 CHANGES IN ACCOUNTING POLICIES DUE TO APPLICABILITY OF CERTAIN INTERNATIONAL FINANCIAL REPORTING STANDARDS (IFRS)
The following changes in accounting policies have taken place effective from 01 July 2018:
3.2.1 IFRS 9 “Financial Instruments”
The Company has adopted IFRS 9 “Financial Instruments” from 01 July 2018. The standard introduced new classification and measurement models for financial assets. A financial asset shall be measured at amortised cost if it is held within a business model whose objective is to hold assets in order to collect contractual cash flows which arise on specified dates and that are solely principal and interest. A debt investment shall be measured at fair value through other comprehensive income if it is held within a business model whose objective is to both hold assets in order to collect contractual cash flows which arise on specified dates that are solely principal and interest as well as selling the asset on the basis of its fair value. All other financial assets are classified and measured at fair value through profit or loss unless the Company makes an irrevocable election on initial
15HALF YEARLY REPORT 31 DECEMBER 2018
SELECTED NOTES TO THE CONDENSED INTERIMFINANCIAL INFORMATION (Un-Audited)For The Half Year Ended 31 December 2018
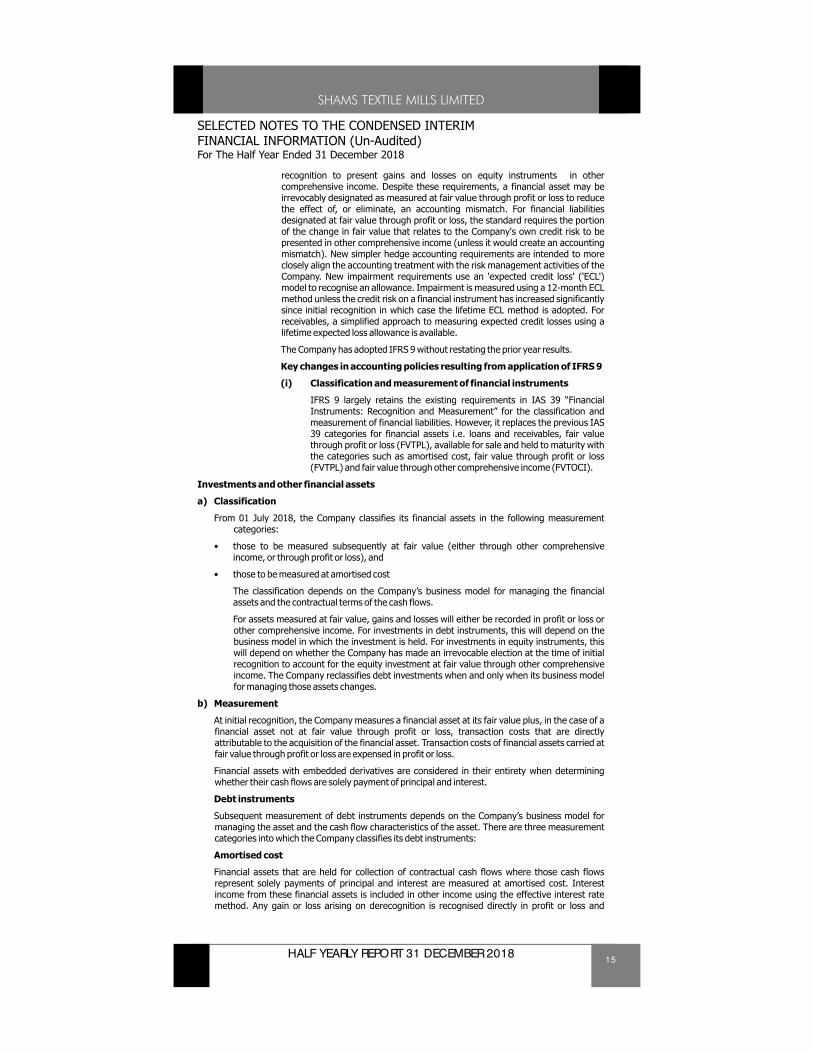
recognition to present gains and losses on equity instruments in other comprehensive income. Despite these requirements, a financial asset may be irrevocably designated as measured at fair value through profit or loss to reduce the effect of, or eliminate, an accounting mismatch. For financial liabilities designated at fair value through profit or loss, the standard requires the portion of the change in fair value that relates to the Company's own credit risk to be presented in other comprehensive income (unless it would create an accounting mismatch). New simpler hedge accounting requirements are intended to more closely align the accounting treatment with the risk management activities of the Company. New impairment requirements use an 'expected credit loss' ('ECL') model to recognise an allowance. Impairment is measured using a 12-month ECL method unless the credit risk on a financial instrument has increased significantly since initial recognition in which case the lifetime ECL method is adopted. For receivables, a simplified approach to measuring expected credit losses using a lifetime expected loss allowance is available.
The Company has adopted IFRS 9 without restating the prior year results.
Key changes in accounting policies resulting from application of IFRS 9
(i) Classification and measurement of financial instruments
IFRS 9 largely retains the existing requirements in IAS 39 “Financial Instruments: Recognition and Measurement” for the classification and measurement of financial liabilities. However, it replaces the previous IAS 39 categories for financial assets i.e. loans and receivables, fair value through profit or loss (FVTPL), available for sale and held to maturity with the categories such as amortised cost, fair value through profit or loss (FVTPL) and fair value through other comprehensive income (FVTOCI).
Investments and other financial assets
a) Classification
From 01 July 2018, the Company classifies its financial assets in the following measurement categories:
• those to be measured subsequently at fair value (either through other comprehensive income, or through profit or loss), and
• those to be measured at amortised cost
The classification depends on the Company’s business model for managing the financial assets and the contractual terms of the cash flows.
For assets measured at fair value, gains and losses will either be recorded in profit or loss or other comprehensive income. For investments in debt instruments, this will depend on the business model in which the investment is held. For investments in equity instruments, this will depend on whether the Company has made an irrevocable election at the time of initial recognition to account for the equity investment at fair value through other comprehensive income. The Company reclassifies debt investments when and only when its business model for managing those assets changes.
b) Measurement
At initial recognition, the Company measures a financial asset at its fair value plus, in the case of a financial asset not at fair value through profit or loss, transaction costs that are directly attributable to the acquisition of the financial asset. Transaction costs of financial assets carried at fair value through profit or loss are expensed in profit or loss.
Financial assets with embedded derivatives are considered in their entirety when determining whether their cash flows are solely payment of principal and interest.
Debt instruments
Subsequent measurement of debt instruments depends on the Company’s business model for managing the asset and the cash flow characteristics of the asset. There are three measurement categories into which the Company classifies its debt instruments:
Amortised cost
Financial assets that are held for collection of contractual cash flows where those cash flows represent solely payments of principal and interest are measured at amortised cost. Interest income from these financial assets is included in other income using the effective interest rate method. Any gain or loss arising on derecognition is recognised directly in profit or loss and
16 HALF YEARLY REPORT 31 DECEMBER 2018
SELECTED NOTES TO THE CONDENSED INTERIMFINANCIAL STATEMENTS (Un-Audited)For The Half Year Ended 31 December 2018
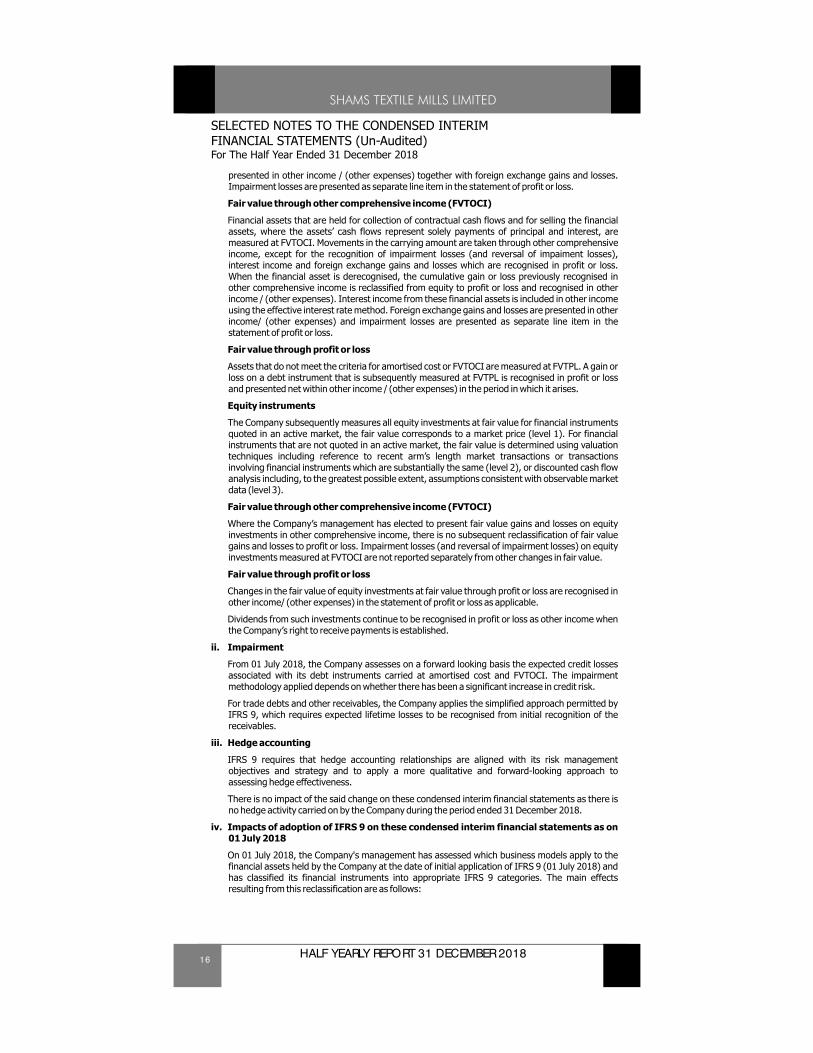
presented in other income / (other expenses) together with foreign exchange gains and losses. Impairment losses are presented as separate line item in the statement of profit or loss.
Fair value through other comprehensive income (FVTOCI)
Financial assets that are held for collection of contractual cash flows and for selling the financial assets, where the assets’ cash flows represent solely payments of principal and interest, are measured at FVTOCI. Movements in the carrying amount are taken through other comprehensive income, except for the recognition of impairment losses (and reversal of impaiment losses), interest income and foreign exchange gains and losses which are recognised in profit or loss. When the financial asset is derecognised, the cumulative gain or loss previously recognised in other comprehensive income is reclassified from equity to profit or loss and recognised in other income / (other expenses). Interest income from these financial assets is included in other income using the effective interest rate method. Foreign exchange gains and losses are presented in other income/ (other expenses) and impairment losses are presented as separate line item in the statement of profit or loss.
Fair value through profit or loss
Assets that do not meet the criteria for amortised cost or FVTOCI are measured at FVTPL. A gain or loss on a debt instrument that is subsequently measured at FVTPL is recognised in profit or loss and presented net within other income / (other expenses) in the period in which it arises.
Equity instruments
The Company subsequently measures all equity investments at fair value for financial instruments quoted in an active market, the fair value corresponds to a market price (level 1). For financial instruments that are not quoted in an active market, the fair value is determined using valuation techniques including reference to recent arm’s length market transactions or transactions involving financial instruments which are substantially the same (level 2), or discounted cash flow analysis including, to the greatest possible extent, assumptions consistent with observable market data (level 3).
Fair value through other comprehensive income (FVTOCI)
Where the Company’s management has elected to present fair value gains and losses on equity investments in other comprehensive income, there is no subsequent reclassification of fair value gains and losses to profit or loss. Impairment losses (and reversal of impairment losses) on equity investments measured at FVTOCI are not reported separately from other changes in fair value.
Fair value through profit or loss
Changes in the fair value of equity investments at fair value through profit or loss are recognised in other income/ (other expenses) in the statement of profit or loss as applicable.
Dividends from such investments continue to be recognised in profit or loss as other income when the Company’s right to receive payments is established.
ii. Impairment
From 01 July 2018, the Company assesses on a forward looking basis the expected credit losses associated with its debt instruments carried at amortised cost and FVTOCI. The impairment methodology applied depends on whether there has been a significant increase in credit risk.
For trade debts and other receivables, the Company applies the simplified approach permitted by IFRS 9, which requires expected lifetime losses to be recognised from initial recognition of the receivables.
iii. Hedge accounting
IFRS 9 requires that hedge accounting relationships are aligned with its risk management objectives and strategy and to apply a more qualitative and forward-looking approach to assessing hedge effectiveness.
There is no impact of the said change on these condensed interim financial statements as there is no hedge activity carried on by the Company during the period ended 31 December 2018.
iv. Impacts of adoption of IFRS 9 on these condensed interim financial statements as on 01 July 2018
On 01 July 2018, the Company's management has assessed which business models apply to the financial assets held by the Company at the date of initial application of IFRS 9 (01 July 2018) and has classified its financial instruments into appropriate IFRS 9 categories. The main effects resulting from this reclassification are as follows:
17HALF YEARLY REPORT 31 DECEMBER 2018
SELECTED NOTES TO THE CONDENSED INTERIMFINANCIAL STATEMENTS (Un-Audited)For The Half Year Ended 31 December 2018
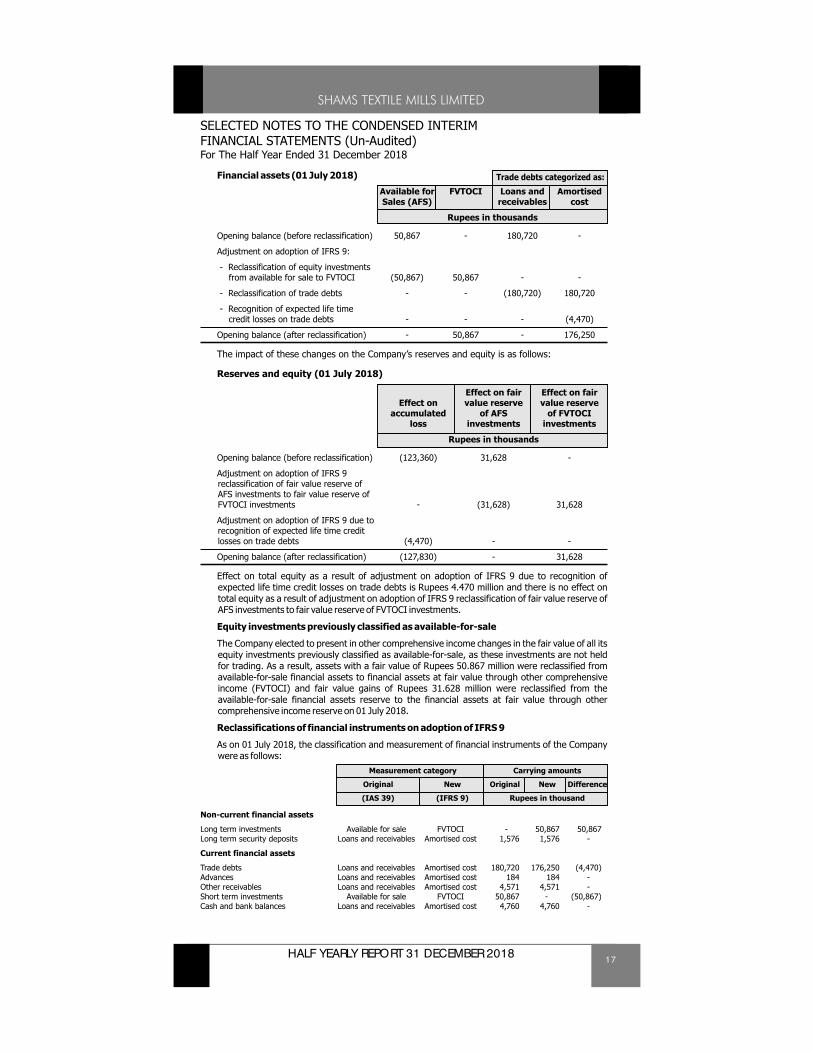
Financial assets (01 July 2018)
Available for FVTOCI Loans and AmortisedSales (AFS) receivables cost
Rupees in thousands
Opening balance (before reclassification) 50,867 - 180,720 -
Adjustment on adoption of IFRS 9:
- Reclassification of equity investments from available for sale to FVTOCI (50,867) 50,867 - -
- Reclassification of trade debts - - (180,720) 180,720
- Recognition of expected life time credit losses on trade debts - - - (4,470)
Opening balance (after reclassification) - 50,867 - 176,250
The impact of these changes on the Company’s reserves and equity is as follows:
Reserves and equity (01 July 2018)
Effect on fair Effect on fairEffect on value reserve value reserve
accumulated of AFS of FVTOCIloss investments investments
Rupees in thousands
Opening balance (before reclassification) (123,360) 31,628 -
Adjustment on adoption of IFRS 9 reclassification of fair value reserve of AFS investments to fair value reserve of FVTOCI investments - (31,628) 31,628
Adjustment on adoption of IFRS 9 due to recognition of expected life time credit losses on trade debts (4,470) - -
Opening balance (after reclassification) (127,830) - 31,628
Effect on total equity as a result of adjustment on adoption of IFRS 9 due to recognition of expected life time credit losses on trade debts is Rupees 4.470 million and there is no effect on total equity as a result of adjustment on adoption of IFRS 9 reclassification of fair value reserve of AFS investments to fair value reserve of FVTOCI investments.
Equity investments previously classified as available-for-sale
The Company elected to present in other comprehensive income changes in the fair value of all its equity investments previously classified as available-for-sale, as these investments are not held for trading. As a result, assets with a fair value of Rupees 50.867 million were reclassified from available-for-sale financial assets to financial assets at fair value through other comprehensive income (FVTOCI) and fair value gains of Rupees 31.628 million were reclassified from the available-for-sale financial assets reserve to the financial assets at fair value through other comprehensive income reserve on 01 July 2018.
Reclassifications of financial instruments on adoption of IFRS 9
As on 01 July 2018, the classification and measurement of financial instruments of the Company were as follows:
Measurement category Carrying amounts
Original New Original New Difference
(IAS 39) (IFRS 9) Rupees in thousand
Non-current financial assets
Long term investments Available for sale FVTOCI - 50,867 50,867Long term security deposits Loans and receivables Amortised cost 1,576 1,576 -
Current financial assets
Trade debts Loans and receivables Amortised cost 180,720 176,250 (4,470)Advances Loans and receivables Amortised cost 184 184 -Other receivables Loans and receivables Amortised cost 4,571 4,571 -Short term investments Available for sale FVTOCI 50,867 - (50,867)Cash and bank balances Loans and receivables Amortised cost 4,760 4,760 -
Trade debts categorized as:
18 HALF YEARLY REPORT 31 DECEMBER 2018
SELECTED NOTES TO THE CONDENSED INTERIMFINANCIAL STATEMENTS (Un-Audited)For The Half Year Ended 31 December 2018
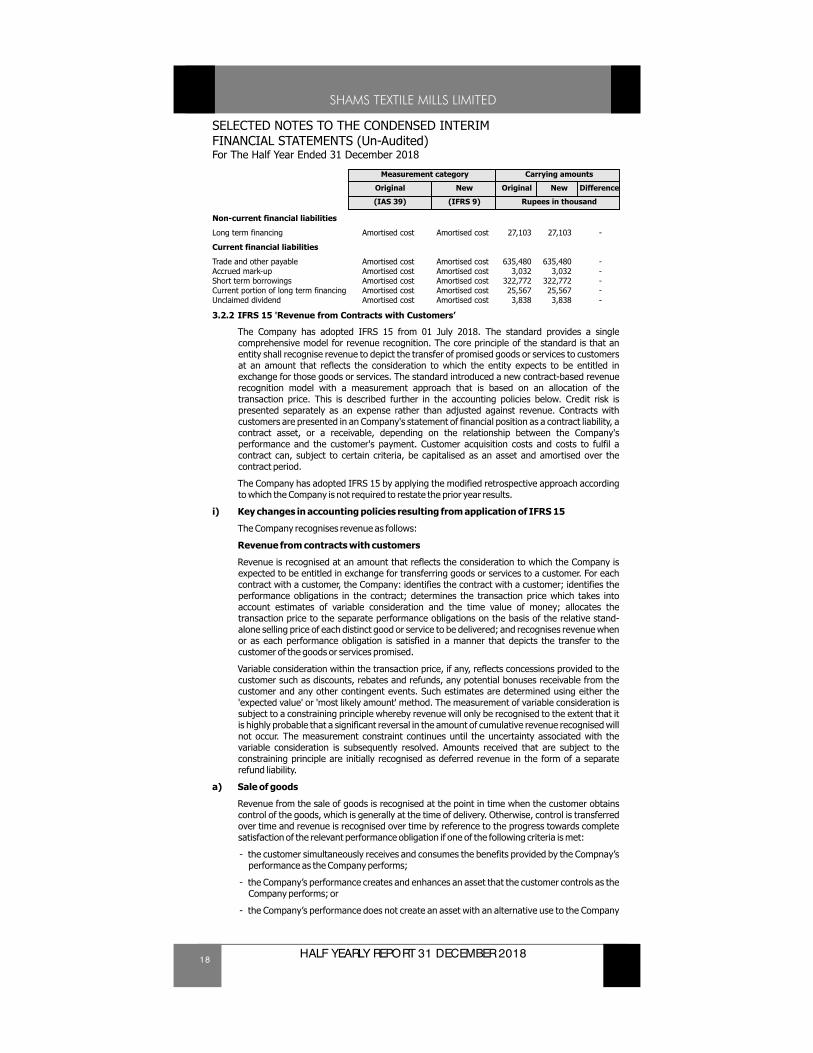
Measurement category Carrying amounts
Original New Original New Difference
(IAS 39) (IFRS 9) Rupees in thousand
Non-current financial liabilities
Long term financing Amortised cost Amortised cost 27,103 27,103 -
Current financial liabilities
Trade and other payable Amortised cost Amortised cost 635,480 635,480 -Accrued mark-up Amortised cost Amortised cost 3,032 3,032 -Short term borrowings Amortised cost Amortised cost 322,772 322,772 -Current portion of long term financing Amortised cost Amortised cost 25,567 25,567 -Unclaimed dividend Amortised cost Amortised cost 3,838 3,838 -
3.2.2 IFRS 15 'Revenue from Contracts with Customers’
The Company has adopted IFRS 15 from 01 July 2018. The standard provides a single comprehensive model for revenue recognition. The core principle of the standard is that an entity shall recognise revenue to depict the transfer of promised goods or services to customers at an amount that reflects the consideration to which the entity expects to be entitled in exchange for those goods or services. The standard introduced a new contract-based revenue recognition model with a measurement approach that is based on an allocation of the transaction price. This is described further in the accounting policies below. Credit risk is presented separately as an expense rather than adjusted against revenue. Contracts with customers are presented in an Company's statement of financial position as a contract liability, a contract asset, or a receivable, depending on the relationship between the Company's performance and the customer's payment. Customer acquisition costs and costs to fulfil a contract can, subject to certain criteria, be capitalised as an asset and amortised over the contract period.
The Company has adopted IFRS 15 by applying the modified retrospective approach according to which the Company is not required to restate the prior year results.
i) Key changes in accounting policies resulting from application of IFRS 15
The Company recognises revenue as follows:
Revenue from contracts with customers
Revenue is recognised at an amount that reflects the consideration to which the Company is expected to be entitled in exchange for transferring goods or services to a customer. For each contract with a customer, the Company: identifies the contract with a customer; identifies the performance obligations in the contract; determines the transaction price which takes into account estimates of variable consideration and the time value of money; allocates the transaction price to the separate performance obligations on the basis of the relative stand-alone selling price of each distinct good or service to be delivered; and recognises revenue when or as each performance obligation is satisfied in a manner that depicts the transfer to the customer of the goods or services promised.
Variable consideration within the transaction price, if any, reflects concessions provided to the customer such as discounts, rebates and refunds, any potential bonuses receivable from the customer and any other contingent events. Such estimates are determined using either the 'expected value' or 'most likely amount' method. The measurement of variable consideration is subject to a constraining principle whereby revenue will only be recognised to the extent that it is highly probable that a significant reversal in the amount of cumulative revenue recognised will not occur. The measurement constraint continues until the uncertainty associated with the variable consideration is subsequently resolved. Amounts received that are subject to the constraining principle are initially recognised as deferred revenue in the form of a separate refund liability.
a) Sale of goods
Revenue from the sale of goods is recognised at the point in time when the customer obtains control of the goods, which is generally at the time of delivery. Otherwise, control is transferred over time and revenue is recognised over time by reference to the progress towards complete satisfaction of the relevant performance obligation if one of the following criteria is met:
- the customer simultaneously receives and consumes the benefits provided by the Compnay’s performance as the Company performs;
- the Company’s performance creates and enhances an asset that the customer controls as the Company performs; or
- the Company’s performance does not create an asset with an alternative use to the Company
19HALF YEARLY REPORT 31 DECEMBER 2018
SELECTED NOTES TO THE CONDENSED INTERIMFINANCIAL STATEMENTS (Un-Audited)For The Half Year Ended 31 December 2018
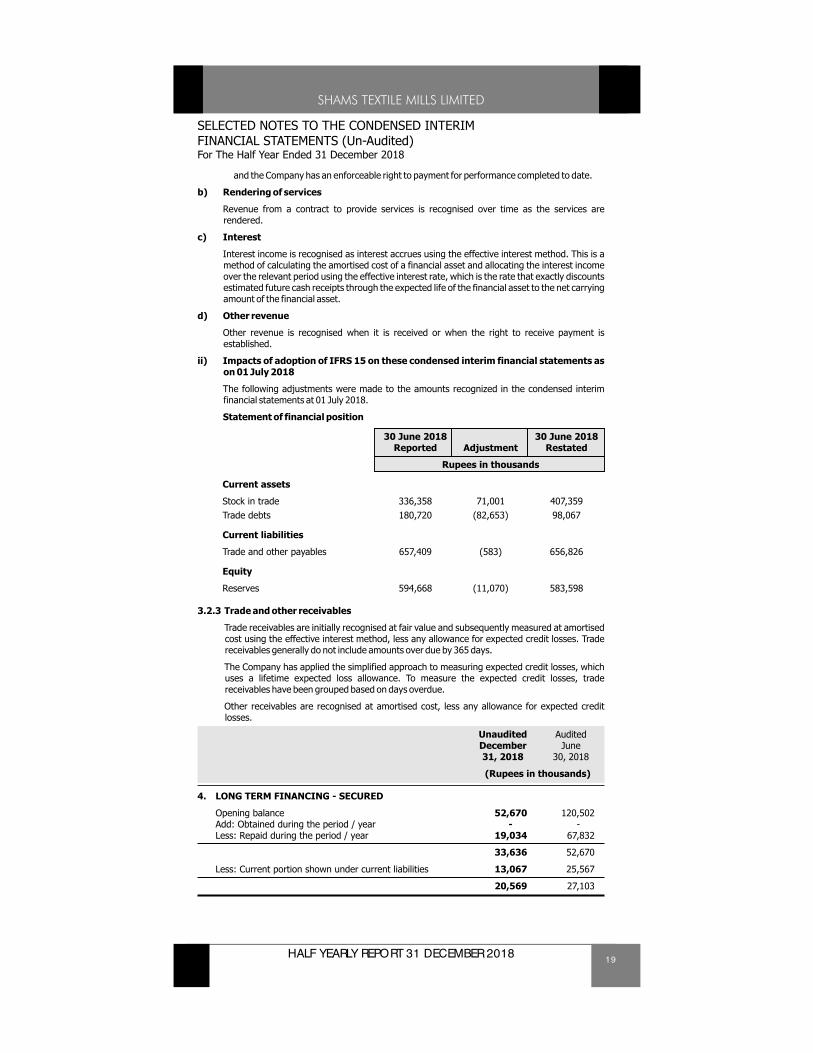
and the Company has an enforceable right to payment for performance completed to date.
b) Rendering of services
Revenue from a contract to provide services is recognised over time as the services are rendered.
c) Interest
Interest income is recognised as interest accrues using the effective interest method. This is a method of calculating the amortised cost of a financial asset and allocating the interest income over the relevant period using the effective interest rate, which is the rate that exactly discounts estimated future cash receipts through the expected life of the financial asset to the net carrying amount of the financial asset.
d) Other revenue
Other revenue is recognised when it is received or when the right to receive payment is established.
ii) Impacts of adoption of IFRS 15 on these condensed interim financial statements as on 01 July 2018
The following adjustments were made to the amounts recognized in the condensed interim financial statements at 01 July 2018.
Statement of financial position
30 June 2018 30 June 2018Reported Adjustment Restated
Rupees in thousands
Current assets
Stock in trade 336,358 71,001 407,359Trade debts 180,720 (82,653) 98,067
Current liabilities
Trade and other payables 657,409 (583) 656,826
Equity
Reserves 594,668 (11,070) 583,598
3.2.3 Trade and other receivables
Trade receivables are initially recognised at fair value and subsequently measured at amortised cost using the effective interest method, less any allowance for expected credit losses. Trade receivables generally do not include amounts over due by 365 days.
The Company has applied the simplified approach to measuring expected credit losses, which uses a lifetime expected loss allowance. To measure the expected credit losses, trade receivables have been grouped based on days overdue.
Other receivables are recognised at amortised cost, less any allowance for expected credit losses.
Unaudited AuditedDecember June31, 2018 30, 2018
(Rupees in thousands)
4. LONG TERM FINANCING - SECURED
Opening balance 52,670 120,502Add: Obtained during the period / year - -Less: Repaid during the period / year 19,034 67,832
33,636 52,670
Less: Current portion shown under current liabilities 13,067 25,567
20,569 27,103
20 HALF YEARLY REPORT 31 DECEMBER 2018
SELECTED NOTES TO THE CONDENSED INTERIMFINANCIAL STATEMENTS (Un-Audited)For The Half Year Ended 31 December 2018
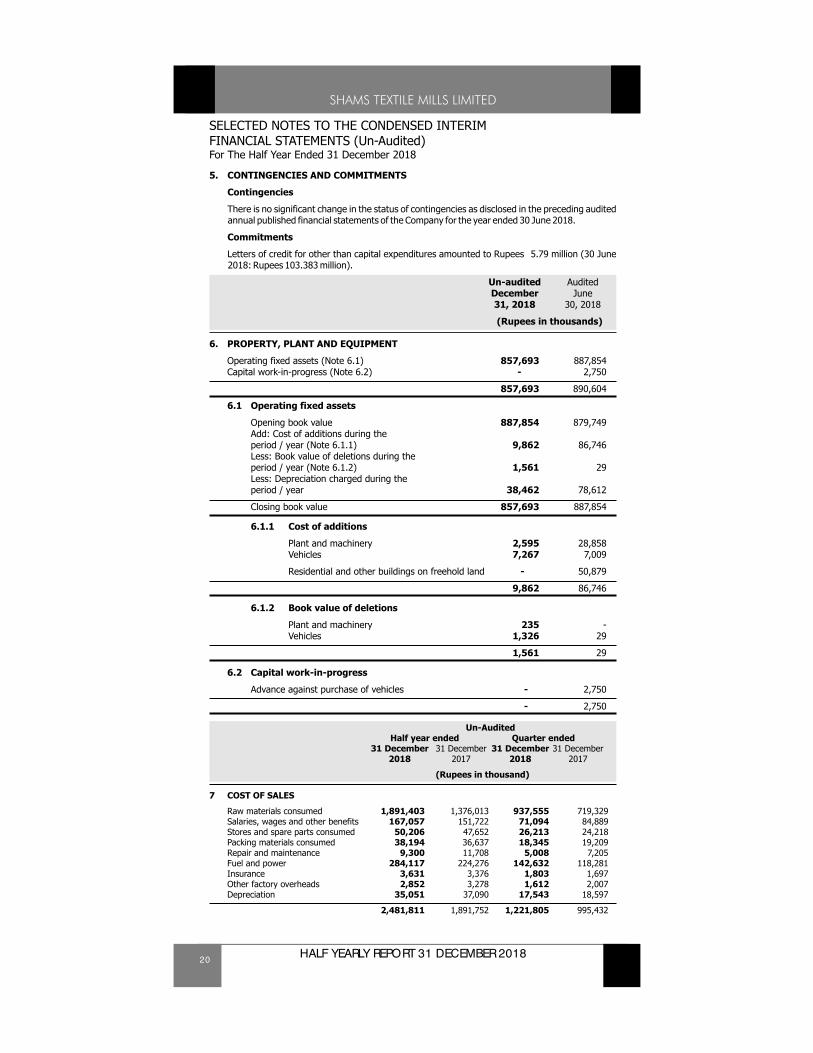
5. CONTINGENCIES AND COMMITMENTS
Contingencies
There is no significant change in the status of contingencies as disclosed in the preceding audited annual published financial statements of the Company for the year ended 30 June 2018.
Commitments
Letters of credit for other than capital expenditures amounted to Rupees 5.79 million (30 June 2018: Rupees 103.383 million).
Un-audited AuditedDecember June31, 2018 30, 2018
(Rupees in thousands)
6. PROPERTY, PLANT AND EQUIPMENT
Operating fixed assets (Note 6.1) 857,693 887,854Capital work-in-progress (Note 6.2) - 2,750
857,693 890,604
6.1 Operating fixed assets
Opening book value 887,854 879,749Add: Cost of additions during the period / year (Note 6.1.1) 9,862 86,746Less: Book value of deletions during the period / year (Note 6.1.2) 1,561 29Less: Depreciation charged during the period / year 38,462 78,612
Closing book value 857,693 887,854
6.1.1 Cost of additions
Plant and machinery 2,595 28,858Vehicles 7,267 7,009
Residential and other buildings on freehold land - 50,879
9,862 86,746
6.1.2 Book value of deletions
Plant and machinery 235 -Vehicles 1,326 29
1,561 29
6.2 Capital work-in-progress
Advance against purchase of vehicles - 2,750
- 2,750
Un-AuditedHalf year ended Quarter ended
31 December 31 December 31 December 31 December2018 2017 2018 2017
(Rupees in thousand)
7 COST OF SALES
Raw materials consumed 1,891,403 1,376,013 937,555 719,329Salaries, wages and other benefits 167,057 151,722 71,094 84,889Stores and spare parts consumed 50,206 47,652 26,213 24,218Packing materials consumed 38,194 36,637 18,345 19,209Repair and maintenance 9,300 11,708 5,008 7,205Fuel and power 284,117 224,276 142,632 118,281Insurance 3,631 3,376 1,803 1,697Other factory overheads 2,852 3,278 1,612 2,007Depreciation 35,051 37,090 17,543 18,597
2,481,811 1,891,752 1,221,805 995,432
21HALF YEARLY REPORT 31 DECEMBER 2018
SELECTED NOTES TO THE CONDENSED INTERIMFINANCIAL STATEMENTS (Un-Audited)For The Half Year Ended 31 December 2018
Un-AuditedHalf year ended Quarter ended
31 December 31 December 31 December 31 December2018 2017 2018 2017
(Rupees in thousand)
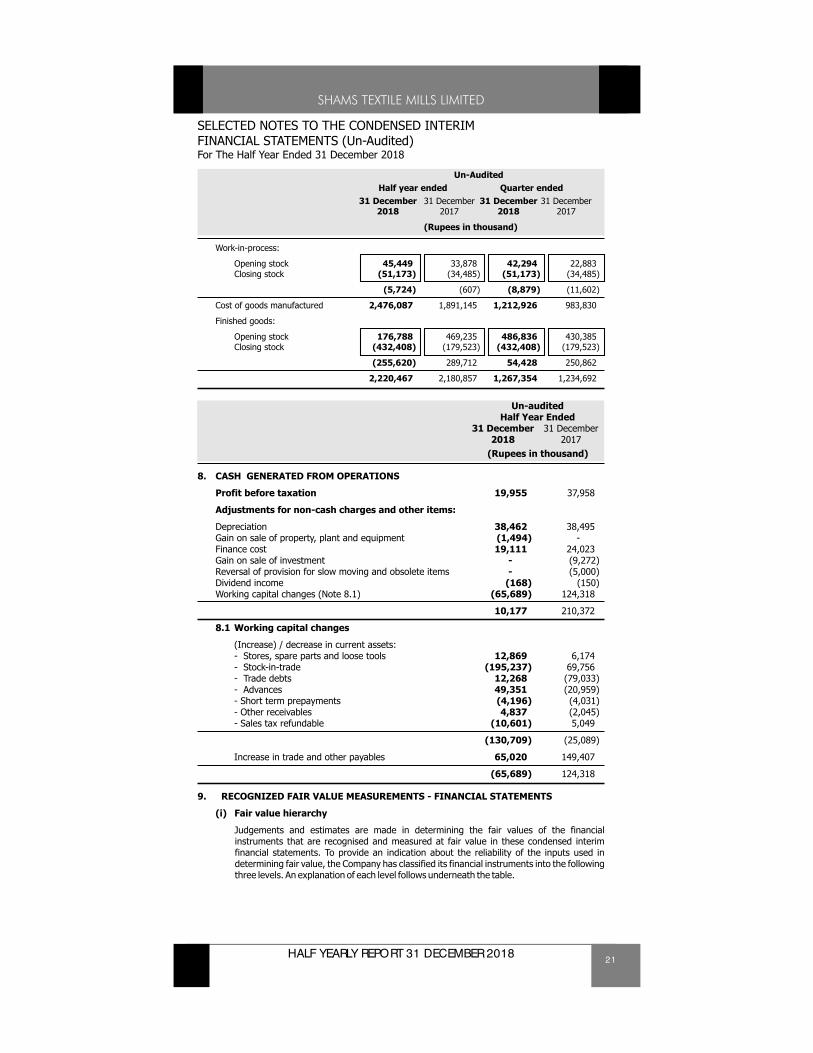
Work-in-process:
Opening stock 45,449 33,878 42,294 22,883Closing stock (51,173) (34,485) (51,173) (34,485)
(5,724) (607) (8,879) (11,602)
Cost of goods manufactured 2,476,087 1,891,145 1,212,926 983,830
Finished goods:
Opening stock 176,788 469,235 486,836 430,385Closing stock (432,408) (179,523) (432,408) (179,523)
(255,620) 289,712 54,428 250,862
2,220,467 2,180,857 1,267,354 1,234,692
Un-auditedHalf Year Ended
31 December 31 December2018 2017
(Rupees in thousand)
8. CASH GENERATED FROM OPERATIONS
Profit before taxation 19,955 37,958
Adjustments for non-cash charges and other items:
Depreciation 38,462 38,495Gain on sale of property, plant and equipment (1,494) -Finance cost 19,111 24,023Gain on sale of investment - (9,272)Reversal of provision for slow moving and obsolete items - (5,000)Dividend income (168) (150)Working capital changes (Note 8.1) (65,689) 124,318
10,177 210,372
8.1 Working capital changes
(Increase) / decrease in current assets:- Stores, spare parts and loose tools 12,869 6,174- Stock-in-trade (195,237) 69,756- Trade debts 12,268 (79,033)- Advances 49,351 (20,959)- Short term prepayments (4,196) (4,031)- Other receivables 4,837 (2,045)- Sales tax refundable (10,601) 5,049
(130,709) (25,089)
Increase in trade and other payables 65,020 149,407
(65,689) 124,318
9. RECOGNIZED FAIR VALUE MEASUREMENTS - FINANCIAL STATEMENTS
(i) Fair value hierarchy
Judgements and estimates are made in determining the fair values of the financial instruments that are recognised and measured at fair value in these condensed interim financial statements. To provide an indication about the reliability of the inputs used in determining fair value, the Company has classified its financial instruments into the following three levels. An explanation of each level follows underneath the table.
22 HALF YEARLY REPORT 31 DECEMBER 2018
SELECTED NOTES TO THE CONDENSED INTERIMFINANCIAL STATEMENTS (Un-Audited)For The Half Year Ended 31 December 2018
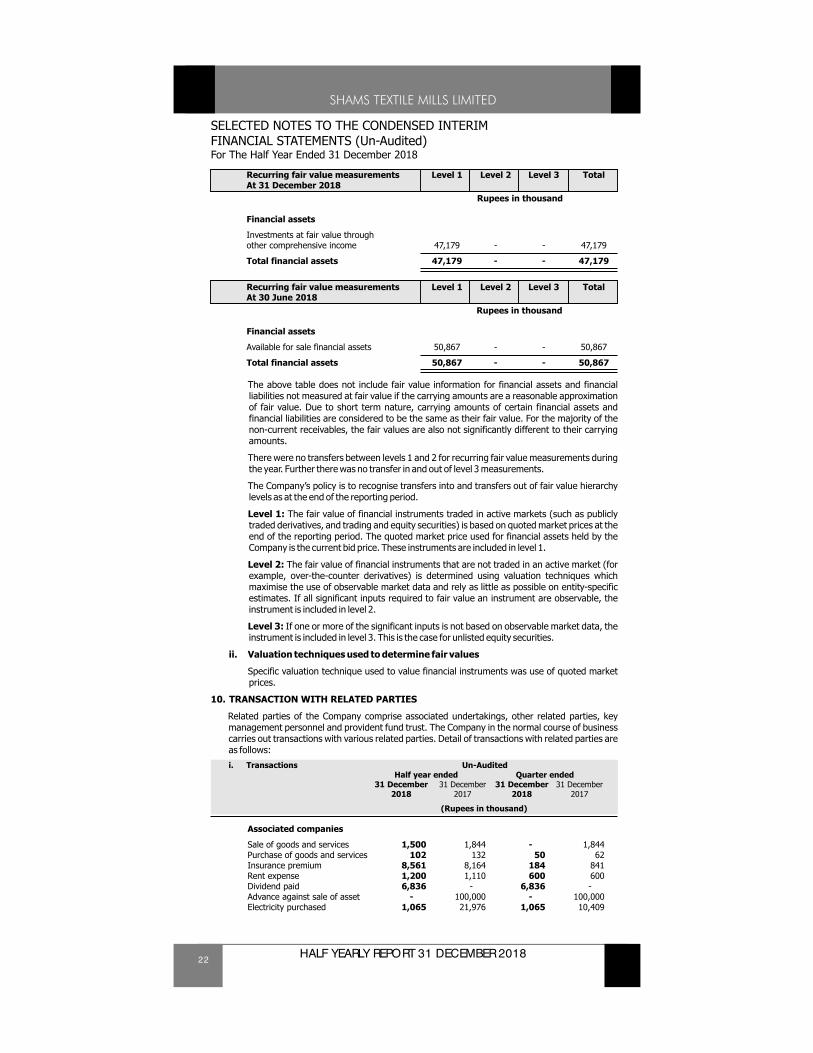
Recurring fair value measurements Level 1 Level 2 Level 3 TotalAt 31 December 2018
Rupees in thousand
Financial assets
Investments at fair value through other comprehensive income 47,179 - - 47,179
Total financial assets 47,179 - - 47,179
Recurring fair value measurements Level 1 Level 2 Level 3 TotalAt 30 June 2018
Rupees in thousand
Financial assets
Available for sale financial assets 50,867 - - 50,867
Total financial assets 50,867 - - 50,867
The above table does not include fair value information for financial assets and financial liabilities not measured at fair value if the carrying amounts are a reasonable approximation of fair value. Due to short term nature, carrying amounts of certain financial assets and financial liabilities are considered to be the same as their fair value. For the majority of the non-current receivables, the fair values are also not significantly different to their carrying amounts.
There were no transfers between levels 1 and 2 for recurring fair value measurements during the year. Further there was no transfer in and out of level 3 measurements.
The Company’s policy is to recognise transfers into and transfers out of fair value hierarchy levels as at the end of the reporting period.
Level 1: The fair value of financial instruments traded in active markets (such as publicly traded derivatives, and trading and equity securities) is based on quoted market prices at the end of the reporting period. The quoted market price used for financial assets held by the Company is the current bid price. These instruments are included in level 1.
Level 2: The fair value of financial instruments that are not traded in an active market (for example, over-the-counter derivatives) is determined using valuation techniques which maximise the use of observable market data and rely as little as possible on entity-specific estimates. If all significant inputs required to fair value an instrument are observable, the instrument is included in level 2.
Level 3: If one or more of the significant inputs is not based on observable market data, the instrument is included in level 3. This is the case for unlisted equity securities.
ii. Valuation techniques used to determine fair values
Specific valuation technique used to value financial instruments was use of quoted market prices.
10. TRANSACTION WITH RELATED PARTIES
Related parties of the Company comprise associated undertakings, other related parties, key management personnel and provident fund trust. The Company in the normal course of business carries out transactions with various related parties. Detail of transactions with related parties are as follows:
i. Transactions Un-AuditedHalf year ended Quarter ended
31 December 31 December 31 December 31 December2018 2017 2018 2017
(Rupees in thousand)
Associated companies
Sale of goods and services 1,500 1,844 - 1,844Purchase of goods and services 102 132 50 62Insurance premium 8,561 8,164 184 841Rent expense 1,200 1,110 600 600Dividend paid 6,836 - 6,836 -Advance against sale of asset - 100,000 - 100,000Electricity purchased 1,065 21,976 1,065 10,409
23HALF YEARLY REPORT 31 DECEMBER 2018
SELECTED NOTES TO THE CONDENSED INTERIMFINANCIAL STATEMENTS (Un-Audited)For The Half Year Ended 31 December 2018
Un-AuditedHalf year ended Quarter ended
31 December 31 December 31 December 31 December2018 2017 2018 2017
(Rupees in thousand)
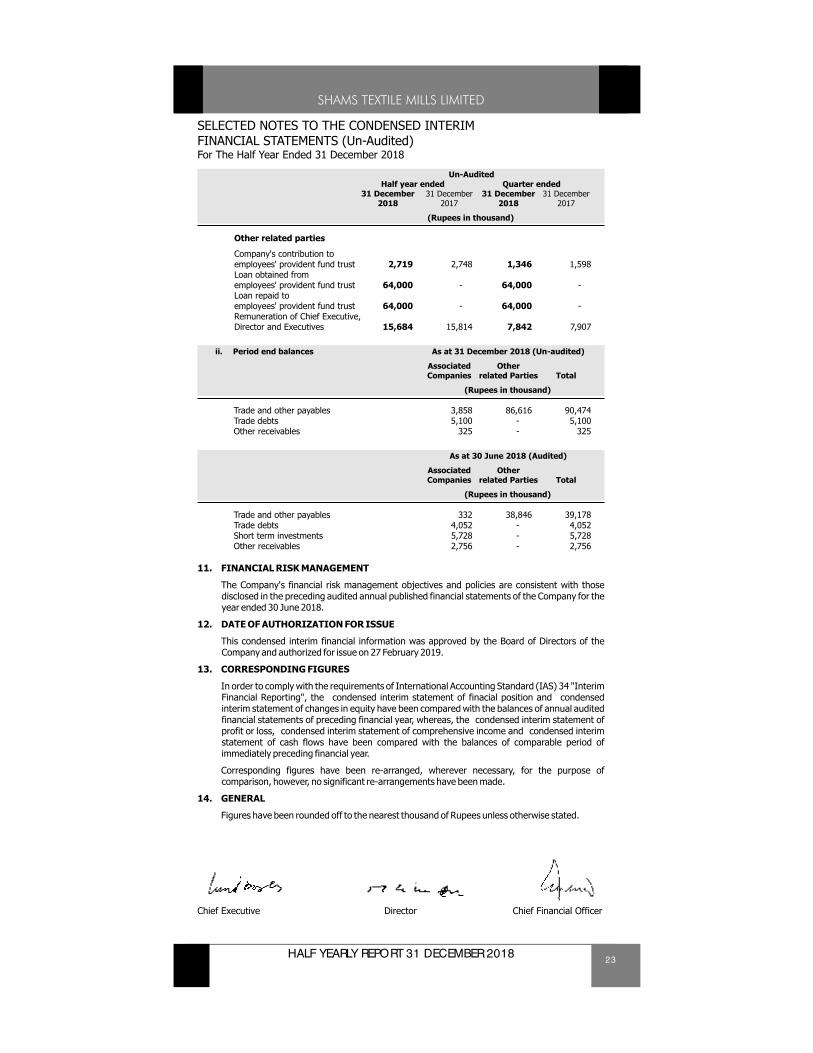
Other related parties
Company's contribution to employees' provident fund trust 2,719 2,748 1,346 1,598Loan obtained from employees' provident fund trust 64,000 - 64,000 -Loan repaid to employees' provident fund trust 64,000 - 64,000 -Remuneration of Chief Executive, Director and Executives 15,684 15,814 7,842 7,907
ii. Period end balances As at 31 December 2018 (Un-audited)
Associated OtherCompanies related Parties Total
(Rupees in thousand)
Trade and other payables 3,858 86,616 90,474Trade debts 5,100 - 5,100Other receivables 325 - 325
As at 30 June 2018 (Audited)
Associated OtherCompanies related Parties Total
(Rupees in thousand)
Trade and other payables 332 38,846 39,178Trade debts 4,052 - 4,052Short term investments 5,728 - 5,728Other receivables 2,756 - 2,756
11. FINANCIAL RISK MANAGEMENT
The Company's financial risk management objectives and policies are consistent with those disclosed in the preceding audited annual published financial statements of the Company for the year ended 30 June 2018.
12. DATE OF AUTHORIZATION FOR ISSUE
This condensed interim financial information was approved by the Board of Directors of the Company and authorized for issue on 27 February 2019.
13. CORRESPONDING FIGURES
In order to comply with the requirements of International Accounting Standard (IAS) 34 "Interim Financial Reporting", the condensed interim statement of finacial position and condensed interim statement of changes in equity have been compared with the balances of annual audited financial statements of preceding financial year, whereas, the condensed interim statement of profit or loss, condensed interim statement of comprehensive income and condensed interim statement of cash flows have been compared with the balances of comparable period of immediately preceding financial year.
Corresponding figures have been re-arranged, wherever necessary, for the purpose of comparison, however, no significant re-arrangements have been made.
14. GENERAL
Figures have been rounded off to the nearest thousand of Rupees unless otherwise stated.
Chief Executive Director Chief Financial Officer

BOOK POST
Shams Textile Mills Limited7-B-3, Aziz Avenue, Gulberg 5Lahore PakistanT: 92 (42) 3576 0381F: 92 (42) 3576 0376E: [email protected]
www.shams.com.pk Gra
ce P
rint
ing
Pre
ss
033
4-40
6702
4