Embed Size (px)
Citation preview
Half Yearly Reportand Financial Statements
For the 6 months ended28 February 2017Unaudited
Fidelity Institutional Liquidity Fund plc
(A UCITS umbrella fund authorised and regulated by the Central Bank of Ireland)
MOODY’S Aaa-mf RATED
S&P AAAm RATED
General Information 2
Investment Manager’s Overview 3
Schedule of Investments 4
Combined Statement of Financial Position 20
Combined Statement of Comprehensive Income 21
Combined Statement of Changes in Net Assets attributable to
redeemable participating shares 22
Combined Statement of Cash Flows 23
Statement of Financial Position 24
Statement of Comprehensive Income 28
Statement of Changes in Net Assets attributable to redeemable
participating shares 30
Statement of Cash Flows 34
Notes to the Financial Statements 36
Statement of Changes in Investments 44
Directory 48
Contents
FidelityInstitutional Liquidity Fund plc
1

General Information
Fidelity Institutional Liquidity Fund plc (the ‘Company’), is an open ended investment company with variable capital and is authorised and regulated by the Central Bank of Ireland (the ‘Central Bank’) under the European Communities (Undertakings for Collective Investment in Transferable Securities) Regulations 2011 (as amended) and the Central Bank’s (Supervision and Enforcement) Act 2013 (section 48(1)) UCITS Regulations 2015, (collectively the ‘UCITS Regulations’). The Company is organised in the form of an umbrella fund with cross liability between sub-funds. The Company is recognised in the UK under Sections 264-265 of the Financial Services and Markets Act 2000, as amended. The Company will not be covered by the provisions of the Financial Services Compensation Scheme operated in the UK. Unless otherwise defined or inconsistent with the context herein, capitalised terms used in this document are as used and have the same meanings as are ascribed to them in the Memorandum and Articles of Association and Prospectus of the Company.
This half- yearly report does not constitute an offer of shares. Shares are offered on the basis of the information contained in the current Key Investor Information Documents, the Prospectus and the documents referred to within it. Copies of the current Key Investor Information Documents, the Prospectus, the annual and half yearly reports are available free of charge, from the registered office of the Company.
This material is issued by FIL Fund Management (Ireland) Limited, a firm authorised in Ireland as a management company by the Central Bank of Ireland pursuant to the UCITS Regulations.
FidelityInstitutional Liquidity Fund plc
2
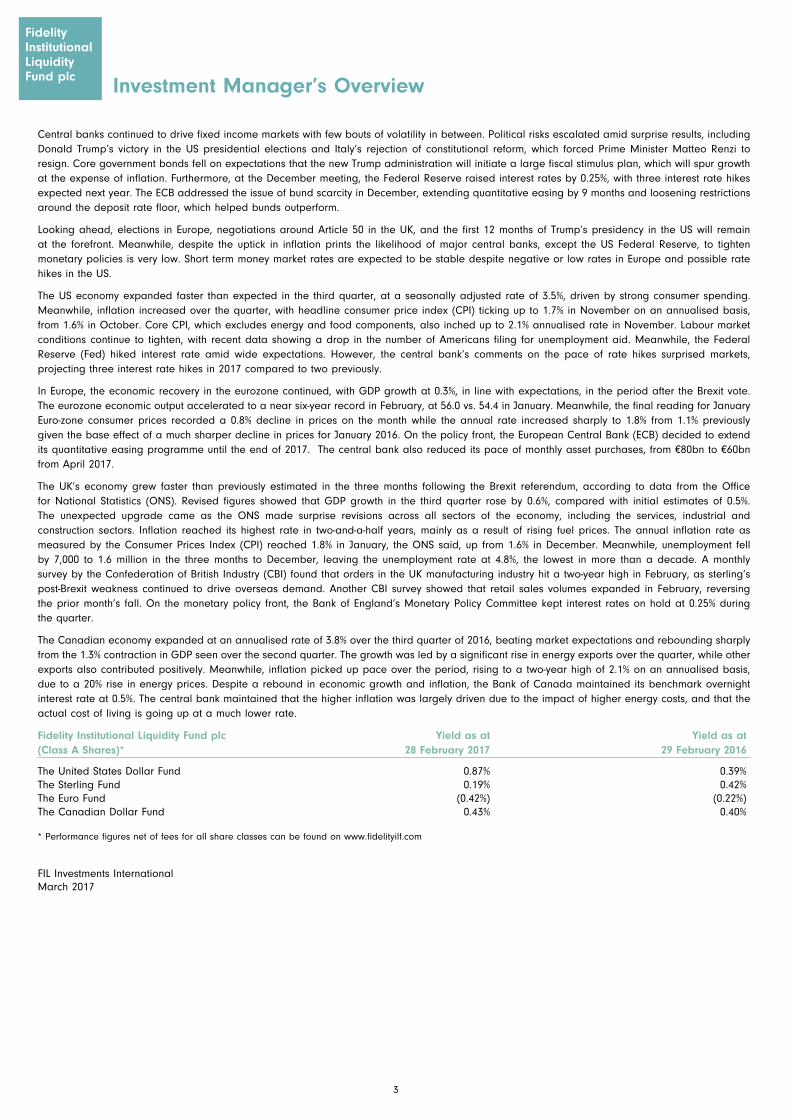
Investment Manager’s Overview
Central banks continued to drive fixed income markets with few bouts of volatility in between. Political risks escalated amid surprise results, including Donald Trump’s victory in the US presidential elections and Italy’s rejection of constitutional reform, which forced Prime Minister Matteo Renzi to resign. Core government bonds fell on expectations that the new Trump administration will initiate a large fiscal stimulus plan, which will spur growth at the expense of inflation. Furthermore, at the December meeting, the Federal Reserve raised interest rates by 0.25%, with three interest rate hikes expected next year. The ECB addressed the issue of bund scarcity in December, extending quantitative easing by 9 months and loosening restrictions around the deposit rate floor, which helped bunds outperform.
Looking ahead, elections in Europe, negotiations around Article 50 in the UK, and the first 12 months of Trump’s presidency in the US will remain at the forefront. Meanwhile, despite the uptick in inflation prints the likelihood of major central banks, except the US Federal Reserve, to tighten monetary policies is very low. Short term money market rates are expected to be stable despite negative or low rates in Europe and possible rate hikes in the US.
The US economy expanded faster than expected in the third quarter, at a seasonally adjusted rate of 3.5%, driven by strong consumer spending. Meanwhile, inflation increased over the quarter, with headline consumer price index (CPI) ticking up to 1.7% in November on an annualised basis, from 1.6% in October. Core CPI, which excludes energy and food components, also inched up to 2.1% annualised rate in November. Labour market conditions continue to tighten, with recent data showing a drop in the number of Americans filing for unemployment aid. Meanwhile, the Federal Reserve (Fed) hiked interest rate amid wide expectations. However, the central bank’s comments on the pace of rate hikes surprised markets, projecting three interest rate hikes in 2017 compared to two previously.
In Europe, the economic recovery in the eurozone continued, with GDP growth at 0.3%, in line with expectations, in the period after the Brexit vote. The eurozone economic output accelerated to a near six-year record in February, at 56.0 vs. 54.4 in January. Meanwhile, the final reading for January Euro-zone consumer prices recorded a 0.8% decline in prices on the month while the annual rate increased sharply to 1.8% from 1.1% previously given the base effect of a much sharper decline in prices for January 2016. On the policy front, the European Central Bank (ECB) decided to extend its quantitative easing programme until the end of 2017. The central bank also reduced its pace of monthly asset purchases, from €80bn to €60bn from April 2017.
The UK’s economy grew faster than previously estimated in the three months following the Brexit referendum, according to data from the Office for National Statistics (ONS). Revised figures showed that GDP growth in the third quarter rose by 0.6%, compared with initial estimates of 0.5%. The unexpected upgrade came as the ONS made surprise revisions across all sectors of the economy, including the services, industrial and construction sectors. Inflation reached its highest rate in two-and-a-half years, mainly as a result of rising fuel prices. The annual inflation rate as measured by the Consumer Prices Index (CPI) reached 1.8% in January, the ONS said, up from 1.6% in December. Meanwhile, unemployment fell by 7,000 to 1.6 million in the three months to December, leaving the unemployment rate at 4.8%, the lowest in more than a decade. A monthly survey by the Confederation of British Industry (CBI) found that orders in the UK manufacturing industry hit a two-year high in February, as sterling’s post-Brexit weakness continued to drive overseas demand. Another CBI survey showed that retail sales volumes expanded in February, reversing the prior month’s fall. On the monetary policy front, the Bank of England’s Monetary Policy Committee kept interest rates on hold at 0.25% during the quarter.
The Canadian economy expanded at an annualised rate of 3.8% over the third quarter of 2016, beating market expectations and rebounding sharply from the 1.3% contraction in GDP seen over the second quarter. The growth was led by a significant rise in energy exports over the quarter, while other exports also contributed positively. Meanwhile, inflation picked up pace over the period, rising to a two-year high of 2.1% on an annualised basis, due to a 20% rise in energy prices. Despite a rebound in economic growth and inflation, the Bank of Canada maintained its benchmark overnight interest rate at 0.5%. The central bank maintained that the higher inflation was largely driven due to the impact of higher energy costs, and that the actual cost of living is going up at a much lower rate.
Fidelity Institutional Liquidity Fund plc Yield as at Yield as at (Class A Shares)* 28 February 2017 29 February 2016
The United States Dollar Fund 0.87% 0.39%The Sterling Fund 0.19% 0.42%The Euro Fund (0.42%) (0.22%)The Canadian Dollar Fund 0.43% 0.40%
* Performance figures net of fees for all share classes can be found on www.fidelityilf.com
FIL Investments InternationalMarch 2017
3
FidelityInstitutional Liquidity Fund plc
4
FidelityInstitutional Liquidity Fund plc
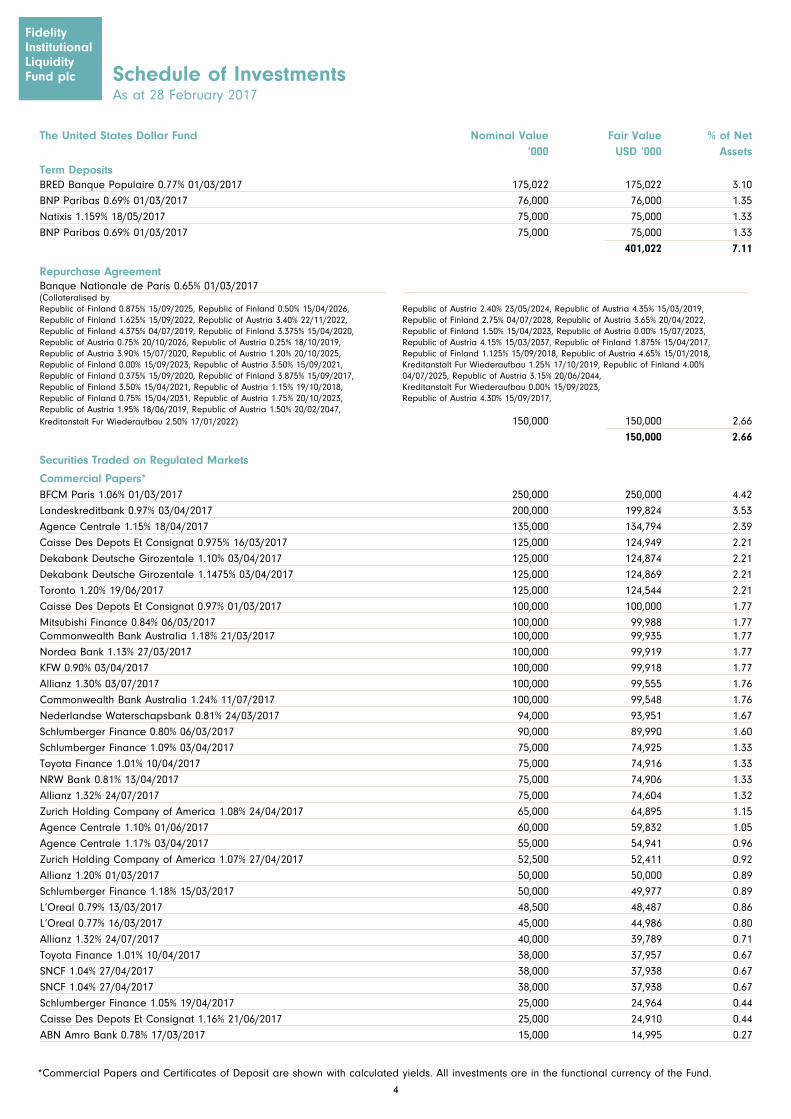
*Commercial Papers and Certificates of Deposit are shown with calculated yields. All investments are in the functional currency of the Fund.
Schedule of InvestmentsAs at 28 February 2017
4
BRED Banque Populaire 0.77% 01/03/2017 175,022 175,022 3.10
BNP Paribas 0.69% 01/03/2017 76,000 76,000 1.35
Natixis 1.159% 18/05/2017 75,000 75,000 1.33
BNP Paribas 0.69% 01/03/2017 75,000 75,000 1.33
401,022 7.11
Repurchase Agreement
Kreditanstalt Fur Wiederaufbau 2.50% 17/01/2022) 150,000 150,000 2.66
150,000 2.66
Securities Traded on Regulated Markets
Commercial Papers* BFCM Paris 1.06% 01/03/2017 250,000 250,000 4.42
Landeskreditbank 0.97% 03/04/2017 200,000 199,824 3.53
Agence Centrale 1.15% 18/04/2017 135,000 134,794 2.39
Caisse Des Depots Et Consignat 0.975% 16/03/2017 125,000 124,949 2.21
Dekabank Deutsche Girozentale 1.10% 03/04/2017 125,000 124,874 2.21
Dekabank Deutsche Girozentale 1.1475% 03/04/2017 125,000 124,869 2.21
Toronto 1.20% 19/06/2017 125,000 124,544 2.21
Caisse Des Depots Et Consignat 0.97% 01/03/2017 100,000 100,000 1.77
Mitsubishi Finance 0.84% 06/03/2017 100,000 99,988 1.77Commonwealth Bank Australia 1.18% 21/03/2017 100,000 99,935 1.77
Nordea Bank 1.13% 27/03/2017 100,000 99,919 1.77
KFW 0.90% 03/04/2017 100,000 99,918 1.77
Allianz 1.30% 03/07/2017 100,000 99,555 1.76
Commonwealth Bank Australia 1.24% 11/07/2017 100,000 99,548 1.76
Nederlandse Waterschapsbank 0.81% 24/03/2017 94,000 93,951 1.67
Schlumberger Finance 0.80% 06/03/2017 90,000 89,990 1.60
Schlumberger Finance 1.09% 03/04/2017 75,000 74,925 1.33
Toyota Finance 1.01% 10/04/2017 75,000 74,916 1.33
NRW Bank 0.81% 13/04/2017 75,000 74,906 1.33
Allianz 1.32% 24/07/2017 75,000 74,604 1.32
Zurich Holding Company of America 1.08% 24/04/2017 65,000 64,895 1.15
Agence Centrale 1.10% 01/06/2017 60,000 59,832 1.05
Agence Centrale 1.17% 03/04/2017 55,000 54,941 0.96
Zurich Holding Company of America 1.07% 27/04/2017 52,500 52,411 0.92
Allianz 1.20% 01/03/2017 50,000 50,000 0.89
Schlumberger Finance 1.18% 15/03/2017 50,000 49,977 0.89
L’Oreal 0.79% 13/03/2017 48,500 48,487 0.86
L’Oreal 0.77% 16/03/2017 45,000 44,986 0.80
Allianz 1.32% 24/07/2017 40,000 39,789 0.71
Toyota Finance 1.01% 10/04/2017 38,000 37,957 0.67
SNCF 1.04% 27/04/2017 38,000 37,938 0.67
SNCF 1.04% 27/04/2017 38,000 37,938 0.67
Schlumberger Finance 1.05% 19/04/2017 25,000 24,964 0.44
Caisse Des Depots Et Consignat 1.16% 21/06/2017 25,000 24,910 0.44
ABN Amro Bank 0.78% 17/03/2017 15,000 14,995 0.27
The United States Dollar Fund Nominal Value Fair Value % of Net ‘000 USD ‘000 Assets
Term Deposits
FidelityInstitutional Liquidity Fund plc
Banque Nationale de Paris 0.65% 01/03/2017 (Collateralised by Republic of Finland 0.875% 15/09/2025, Republic of Finland 0.50% 15/04/2026, Republic of Finland 1.625% 15/09/2022, Republic of Austria 3.40% 22/11/2022, Republic of Finland 4.375% 04/07/2019, Republic of Finland 3.375% 15/04/2020, Republic of Austria 0.75% 20/10/2026, Republic of Austria 0.25% 18/10/2019, Republic of Austria 3.90% 15/07/2020, Republic of Austria 1.20% 20/10/2025, Republic of Finland 0.00% 15/09/2023, Republic of Austria 3.50% 15/09/2021, Republic of Finland 0.375% 15/09/2020, Republic of Finland 3.875% 15/09/2017, Republic of Finland 3.50% 15/04/2021, Republic of Austria 1.15% 19/10/2018, Republic of Finland 0.75% 15/04/2031, Republic of Austria 1.75% 20/10/2023, Republic of Austria 1.95% 18/06/2019, Republic of Austria 1.50% 20/02/2047,
Republic of Austria 2.40% 23/05/2024, Republic of Austria 4.35% 15/03/2019, Republic of Finland 2.75% 04/07/2028, Republic of Austria 3.65% 20/04/2022, Republic of Finland 1.50% 15/04/2023, Republic of Austria 0.00% 15/07/2023, Republic of Austria 4.15% 15/03/2037, Republic of Finland 1.875% 15/04/2017, Republic of Finland 1.125% 15/09/2018, Republic of Austria 4.65% 15/01/2018, Kreditanstalt Fur Wiederaufbau 1.25% 17/10/2019, Republic of Finland 4.00% 04/07/2025, Republic of Austria 3.15% 20/06/2044, Kreditanstalt Fur Wiederaufbau 0.00% 15/09/2023, Republic of Austria 4.30% 15/09/2017,
5
Schedule of InvestmentsAs at 28 February 2017
FidelityInstitutional Liquidity Fund plc
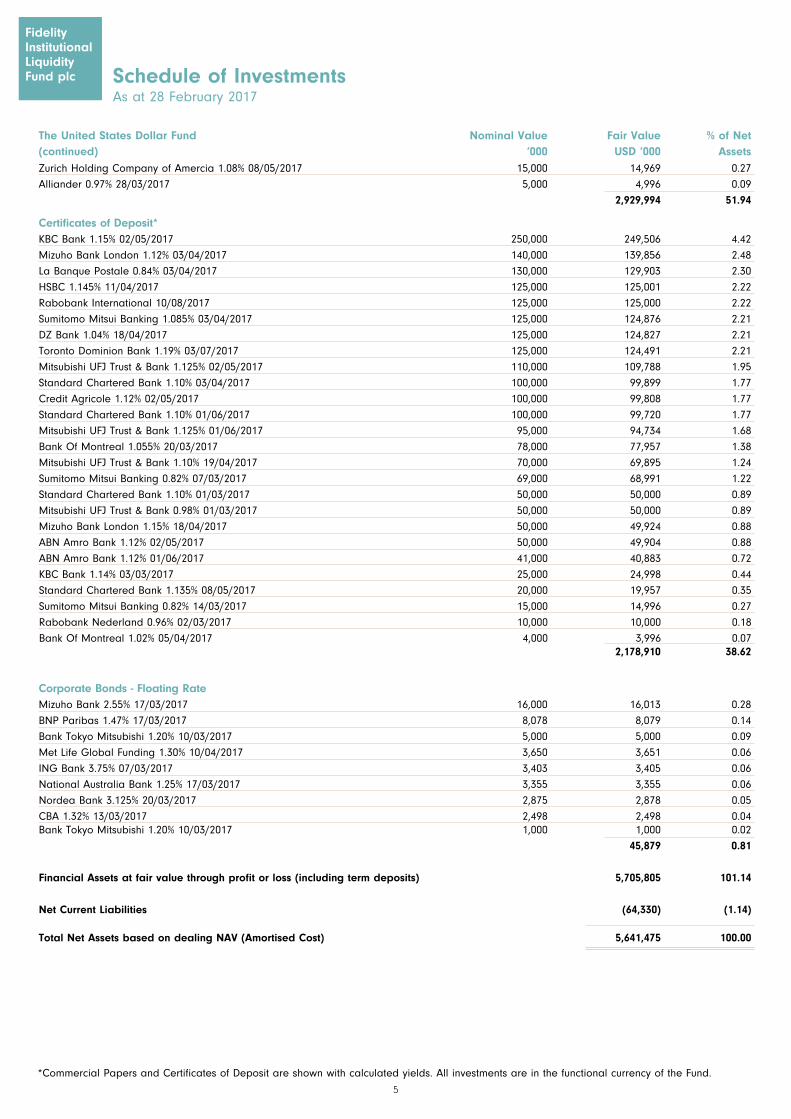
*Commercial Papers and Certificates of Deposit are shown with calculated yields. All investments are in the functional currency of the Fund.
Zurich Holding Company of Amercia 1.08% 08/05/2017 15,000 14,969 0.27
Alliander 0.97% 28/03/2017 5,000 4,996 0.09
2,929,994 51.94
Certificates of Deposit* KBC Bank 1.15% 02/05/2017 250,000 249,506 4.42
Mizuho Bank London 1.12% 03/04/2017 140,000 139,856 2.48
La Banque Postale 0.84% 03/04/2017 130,000 129,903 2.30
HSBC 1.145% 11/04/2017 125,000 125,001 2.22
Rabobank International 10/08/2017 125,000 125,000 2.22
Sumitomo Mitsui Banking 1.085% 03/04/2017 125,000 124,876 2.21
DZ Bank 1.04% 18/04/2017 125,000 124,827 2.21
Toronto Dominion Bank 1.19% 03/07/2017 125,000 124,491 2.21
Mitsubishi UFJ Trust & Bank 1.125% 02/05/2017 110,000 109,788 1.95
Standard Chartered Bank 1.10% 03/04/2017 100,000 99,899 1.77
Credit Agricole 1.12% 02/05/2017 100,000 99,808 1.77
Standard Chartered Bank 1.10% 01/06/2017 100,000 99,720 1.77
Mitsubishi UFJ Trust & Bank 1.125% 01/06/2017 95,000 94,734 1.68
Bank Of Montreal 1.055% 20/03/2017 78,000 77,957 1.38
Mitsubishi UFJ Trust & Bank 1.10% 19/04/2017 70,000 69,895 1.24
Sumitomo Mitsui Banking 0.82% 07/03/2017 69,000 68,991 1.22
Standard Chartered Bank 1.10% 01/03/2017 50,000 50,000 0.89
Mitsubishi UFJ Trust & Bank 0.98% 01/03/2017 50,000 50,000 0.89
Mizuho Bank London 1.15% 18/04/2017 50,000 49,924 0.88
ABN Amro Bank 1.12% 02/05/2017 50,000 49,904 0.88
ABN Amro Bank 1.12% 01/06/2017 41,000 40,883 0.72
KBC Bank 1.14% 03/03/2017 25,000 24,998 0.44
Standard Chartered Bank 1.135% 08/05/2017 20,000 19,957 0.35
Sumitomo Mitsui Banking 0.82% 14/03/2017 15,000 14,996 0.27
Rabobank Nederland 0.96% 02/03/2017 10,000 10,000 0.18
Bank Of Montreal 1.02% 05/04/2017 4,000 3,996 0.07 2,178,910 38.62
Corporate Bonds - Floating RateMizuho Bank 2.55% 17/03/2017 16,000 16,013 0.28
BNP Paribas 1.47% 17/03/2017 8,078 8,079 0.14
Bank Tokyo Mitsubishi 1.20% 10/03/2017 5,000 5,000 0.09
Met Life Global Funding 1.30% 10/04/2017 3,650 3,651 0.06
ING Bank 3.75% 07/03/2017 3,403 3,405 0.06
National Australia Bank 1.25% 17/03/2017 3,355 3,355 0.06
Nordea Bank 3.125% 20/03/2017 2,875 2,878 0.05
CBA 1.32% 13/03/2017 2,498 2,498 0.04Bank Tokyo Mitsubishi 1.20% 10/03/2017 1,000 1,000 0.02
45,879 0.81
Financial Assets at fair value through profit or loss (including term deposits) 5,705,805 101.14
Net Current Liabilities (64,330) (1.14)
Total Net Assets based on dealing NAV (Amortised Cost) 5,641,475 100.00
The United States Dollar Fund Nominal Value Fair Value % of Net (continued) ‘000 USD ‘000 Assets
FidelityInstitutional Liquidity Fund plc

6
FidelityInstitutional Liquidity Fund plc
*Commercial Papers and Certificates of Deposit are shown with calculated yields. All investments are in the functional currency of the Fund.
Schedule of InvestmentsAs at 28 February 2017
The United States Dollar Fund (continued)
FidelityInstitutional Liquidity Fund plc
Analysis of Total Assets % of Total Assets Transferable securities and money market instruments admitted to official stock exchange listing or traded on a regulated market 91.37
Other Assets 8.63
Total 100.00%
The Counterparty for the open Repurchase Agreement is J.P. Morgan Chase Bank.
7
FidelityInstitutional Liquidity Fund plc
*Commercial Papers and Certificates of Deposit are shown with calculated yields. All investments are in the functional currency of the Fund.
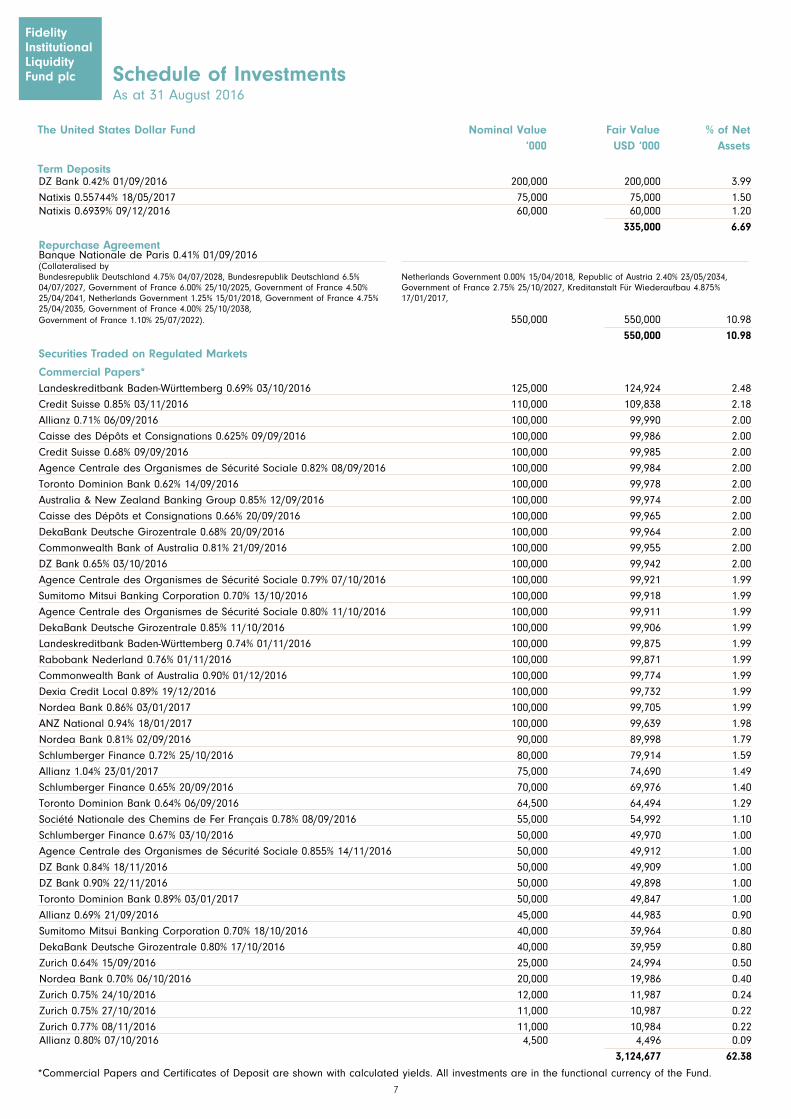
Schedule of InvestmentsAs at 31 August 2016
The United States Dollar Fund Nominal Value Fair Value % of Net ‘000 USD ‘000 Assets
Term Deposits DZ Bank 0.42% 01/09/2016 200,000 200,000 3.99
Natixis 0.55744% 18/05/2017 75,000 75,000 1.50Natixis 0.6939% 09/12/2016 60,000 60,000 1.20
335,000 6.69
Repurchase Agreement
Government of France 1.10% 25/07/2022). 550,000 550,000 10.98
550,000 10.98
Securities Traded on Regulated Markets
Commercial Papers* Landeskreditbank Baden-Württemberg 0.69% 03/10/2016 125,000 124,924 2.48
Credit Suisse 0.85% 03/11/2016 110,000 109,838 2.18
Allianz 0.71% 06/09/2016 100,000 99,990 2.00
Caisse des Dépôts et Consignations 0.625% 09/09/2016 100,000 99,986 2.00
Credit Suisse 0.68% 09/09/2016 100,000 99,985 2.00
Agence Centrale des Organismes de Sécurité Sociale 0.82% 08/09/2016 100,000 99,984 2.00
Toronto Dominion Bank 0.62% 14/09/2016 100,000 99,978 2.00
Australia & New Zealand Banking Group 0.85% 12/09/2016 100,000 99,974 2.00
Caisse des Dépôts et Consignations 0.66% 20/09/2016 100,000 99,965 2.00
DekaBank Deutsche Girozentrale 0.68% 20/09/2016 100,000 99,964 2.00
Commonwealth Bank of Australia 0.81% 21/09/2016 100,000 99,955 2.00
DZ Bank 0.65% 03/10/2016 100,000 99,942 2.00
Agence Centrale des Organismes de Sécurité Sociale 0.79% 07/10/2016 100,000 99,921 1.99
Sumitomo Mitsui Banking Corporation 0.70% 13/10/2016 100,000 99,918 1.99
Agence Centrale des Organismes de Sécurité Sociale 0.80% 11/10/2016 100,000 99,911 1.99
DekaBank Deutsche Girozentrale 0.85% 11/10/2016 100,000 99,906 1.99
Landeskreditbank Baden-Württemberg 0.74% 01/11/2016 100,000 99,875 1.99
Rabobank Nederland 0.76% 01/11/2016 100,000 99,871 1.99
Commonwealth Bank of Australia 0.90% 01/12/2016 100,000 99,774 1.99
Dexia Credit Local 0.89% 19/12/2016 100,000 99,732 1.99
Nordea Bank 0.86% 03/01/2017 100,000 99,705 1.99
ANZ National 0.94% 18/01/2017 100,000 99,639 1.98
Nordea Bank 0.81% 02/09/2016 90,000 89,998 1.79
Schlumberger Finance 0.72% 25/10/2016 80,000 79,914 1.59
Allianz 1.04% 23/01/2017 75,000 74,690 1.49
Schlumberger Finance 0.65% 20/09/2016 70,000 69,976 1.40
Toronto Dominion Bank 0.64% 06/09/2016 64,500 64,494 1.29
Société Nationale des Chemins de Fer Français 0.78% 08/09/2016 55,000 54,992 1.10
Schlumberger Finance 0.67% 03/10/2016 50,000 49,970 1.00
Agence Centrale des Organismes de Sécurité Sociale 0.855% 14/11/2016 50,000 49,912 1.00
DZ Bank 0.84% 18/11/2016 50,000 49,909 1.00
DZ Bank 0.90% 22/11/2016 50,000 49,898 1.00
Toronto Dominion Bank 0.89% 03/01/2017 50,000 49,847 1.00
Allianz 0.69% 21/09/2016 45,000 44,983 0.90
Sumitomo Mitsui Banking Corporation 0.70% 18/10/2016 40,000 39,964 0.80
DekaBank Deutsche Girozentrale 0.80% 17/10/2016 40,000 39,959 0.80
Zurich 0.64% 15/09/2016 25,000 24,994 0.50
Nordea Bank 0.70% 06/10/2016 20,000 19,986 0.40
Zurich 0.75% 24/10/2016 12,000 11,987 0.24
Zurich 0.75% 27/10/2016 11,000 10,987 0.22
Zurich 0.77% 08/11/2016 11,000 10,984 0.22Allianz 0.80% 07/10/2016 4,500 4,496 0.09
3,124,677 62.38
Banque Nationale de Paris 0.41% 01/09/2016 (Collateralised by Bundesrepublik Deutschland 4.75% 04/07/2028, Bundesrepublik Deutschland 6.5% 04/07/2027, Government of France 6.00% 25/10/2025, Government of France 4.50% 25/04/2041, Netherlands Government 1.25% 15/01/2018, Government of France 4.75% 25/04/2035, Government of France 4.00% 25/10/2038,
Netherlands Government 0.00% 15/04/2018, Republic of Austria 2.40% 23/05/2034, Government of France 2.75% 25/10/2027, Kreditanstalt Für Wiederaufbau 4.875% 17/01/2017,
8
FidelityInstitutional Liquidity Fund plc
*Commercial Papers and Certificates of Deposit are shown with calculated yields. All investments are in the functional currency of the Fund.
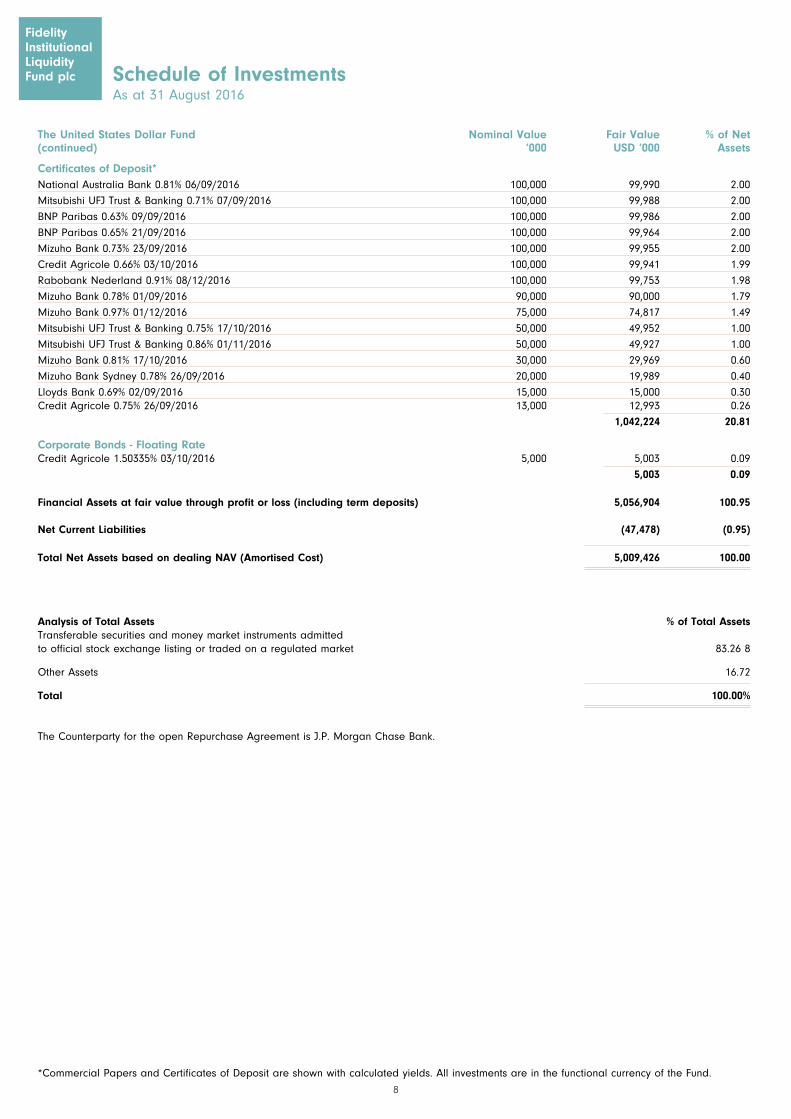
The United States Dollar Fund Nominal Value Fair Value % of Net (continued) ‘000 USD ‘000 Assets
Schedule of InvestmentsAs at 31 August 2016
Certificates of Deposit* National Australia Bank 0.81% 06/09/2016 100,000 99,990 2.00
Mitsubishi UFJ Trust & Banking 0.71% 07/09/2016 100,000 99,988 2.00
BNP Paribas 0.63% 09/09/2016 100,000 99,986 2.00
BNP Paribas 0.65% 21/09/2016 100,000 99,964 2.00
Mizuho Bank 0.73% 23/09/2016 100,000 99,955 2.00
Credit Agricole 0.66% 03/10/2016 100,000 99,941 1.99
Rabobank Nederland 0.91% 08/12/2016 100,000 99,753 1.98
Mizuho Bank 0.78% 01/09/2016 90,000 90,000 1.79
Mizuho Bank 0.97% 01/12/2016 75,000 74,817 1.49
Mitsubishi UFJ Trust & Banking 0.75% 17/10/2016 50,000 49,952 1.00
Mitsubishi UFJ Trust & Banking 0.86% 01/11/2016 50,000 49,927 1.00
Mizuho Bank 0.81% 17/10/2016 30,000 29,969 0.60
Mizuho Bank Sydney 0.78% 26/09/2016 20,000 19,989 0.40
Lloyds Bank 0.69% 02/09/2016 15,000 15,000 0.30Credit Agricole 0.75% 26/09/2016 13,000 12,993 0.26
1,042,224 20.81
Corporate Bonds - Floating RateCredit Agricole 1.50335% 03/10/2016 5,000 5,003 0.09
5,003 0.09
Financial Assets at fair value through profit or loss (including term deposits) 5,056,904 100.95
Net Current Liabilities (47,478) (0.95)
Total Net Assets based on dealing NAV (Amortised Cost) 5,009,426 100.00
Analysis of Total Assets % of Total Assets Transferable securities and money market instruments admitted to official stock exchange listing or traded on a regulated market 83.26 8
Other Assets 16.72
Total 100.00%
The Counterparty for the open Repurchase Agreement is J.P. Morgan Chase Bank.
9
Schedule of InvestmentsAs at 28 February 2017
FidelityInstitutional Liquidity Fund plc
*Commercial Papers and Certificates of Deposit are shown with calculated yields. All investments are in the functional currency of the Fund.
FidelityInstitutional Liquidity Fund plc
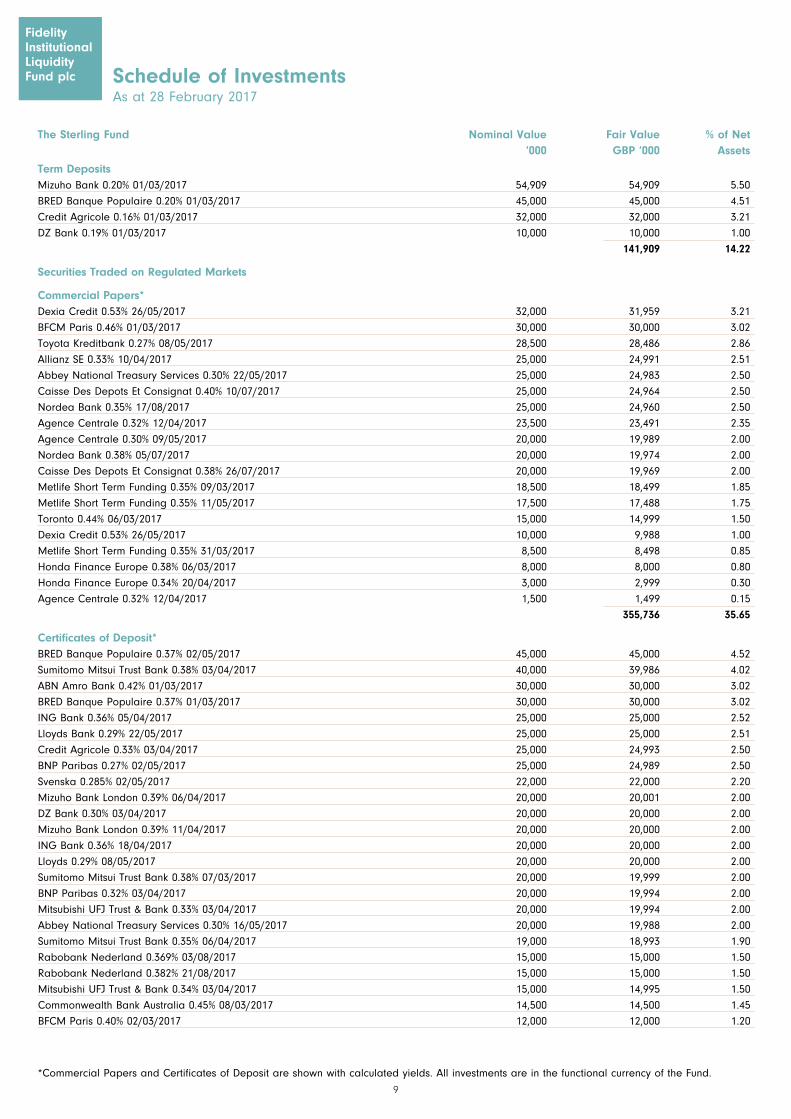
The Sterling Fund Nominal Value Fair Value % of Net ‘000 GBP ‘000 Assets
Term Deposits Mizuho Bank 0.20% 01/03/2017 54,909 54,909 5.50
BRED Banque Populaire 0.20% 01/03/2017 45,000 45,000 4.51
Credit Agricole 0.16% 01/03/2017 32,000 32,000 3.21
DZ Bank 0.19% 01/03/2017 10,000 10,000 1.00
141,909 14.22
Securities Traded on Regulated Markets
Commercial Papers* Dexia Credit 0.53% 26/05/2017 32,000 31,959 3.21
BFCM Paris 0.46% 01/03/2017 30,000 30,000 3.02
Toyota Kreditbank 0.27% 08/05/2017 28,500 28,486 2.86
Allianz SE 0.33% 10/04/2017 25,000 24,991 2.51
Abbey National Treasury Services 0.30% 22/05/2017 25,000 24,983 2.50
Caisse Des Depots Et Consignat 0.40% 10/07/2017 25,000 24,964 2.50
Nordea Bank 0.35% 17/08/2017 25,000 24,960 2.50
Agence Centrale 0.32% 12/04/2017 23,500 23,491 2.35
Agence Centrale 0.30% 09/05/2017 20,000 19,989 2.00
Nordea Bank 0.38% 05/07/2017 20,000 19,974 2.00
Caisse Des Depots Et Consignat 0.38% 26/07/2017 20,000 19,969 2.00
Metlife Short Term Funding 0.35% 09/03/2017 18,500 18,499 1.85
Metlife Short Term Funding 0.35% 11/05/2017 17,500 17,488 1.75
Toronto 0.44% 06/03/2017 15,000 14,999 1.50
Dexia Credit 0.53% 26/05/2017 10,000 9,988 1.00
Metlife Short Term Funding 0.35% 31/03/2017 8,500 8,498 0.85
Honda Finance Europe 0.38% 06/03/2017 8,000 8,000 0.80
Honda Finance Europe 0.34% 20/04/2017 3,000 2,999 0.30
Agence Centrale 0.32% 12/04/2017 1,500 1,499 0.15
355,736 35.65
Certificates of Deposit* BRED Banque Populaire 0.37% 02/05/2017 45,000 45,000 4.52
Sumitomo Mitsui Trust Bank 0.38% 03/04/2017 40,000 39,986 4.02
ABN Amro Bank 0.42% 01/03/2017 30,000 30,000 3.02
BRED Banque Populaire 0.37% 01/03/2017 30,000 30,000 3.02
ING Bank 0.36% 05/04/2017 25,000 25,000 2.52
Lloyds Bank 0.29% 22/05/2017 25,000 25,000 2.51
Credit Agricole 0.33% 03/04/2017 25,000 24,993 2.50
BNP Paribas 0.27% 02/05/2017 25,000 24,989 2.50
Svenska 0.285% 02/05/2017 22,000 22,000 2.20
Mizuho Bank London 0.39% 06/04/2017 20,000 20,001 2.00
DZ Bank 0.30% 03/04/2017 20,000 20,000 2.00
Mizuho Bank London 0.39% 11/04/2017 20,000 20,000 2.00
ING Bank 0.36% 18/04/2017 20,000 20,000 2.00
Lloyds 0.29% 08/05/2017 20,000 20,000 2.00
Sumitomo Mitsui Trust Bank 0.38% 07/03/2017 20,000 19,999 2.00
BNP Paribas 0.32% 03/04/2017 20,000 19,994 2.00
Mitsubishi UFJ Trust & Bank 0.33% 03/04/2017 20,000 19,994 2.00
Abbey National Treasury Services 0.30% 16/05/2017 20,000 19,988 2.00
Sumitomo Mitsui Trust Bank 0.35% 06/04/2017 19,000 18,993 1.90
Rabobank Nederland 0.369% 03/08/2017 15,000 15,000 1.50
Rabobank Nederland 0.382% 21/08/2017 15,000 15,000 1.50
Mitsubishi UFJ Trust & Bank 0.34% 03/04/2017 15,000 14,995 1.50
Commonwealth Bank Australia 0.45% 08/03/2017 14,500 14,500 1.45
BFCM Paris 0.40% 02/03/2017 12,000 12,000 1.20
10
Schedule of InvestmentsAs at 28 February 2017
FidelityInstitutional Liquidity Fund plc
*Commercial Papers and Certificates of Deposit are shown with calculated yields. All investments are in the functional currency of the Fund.
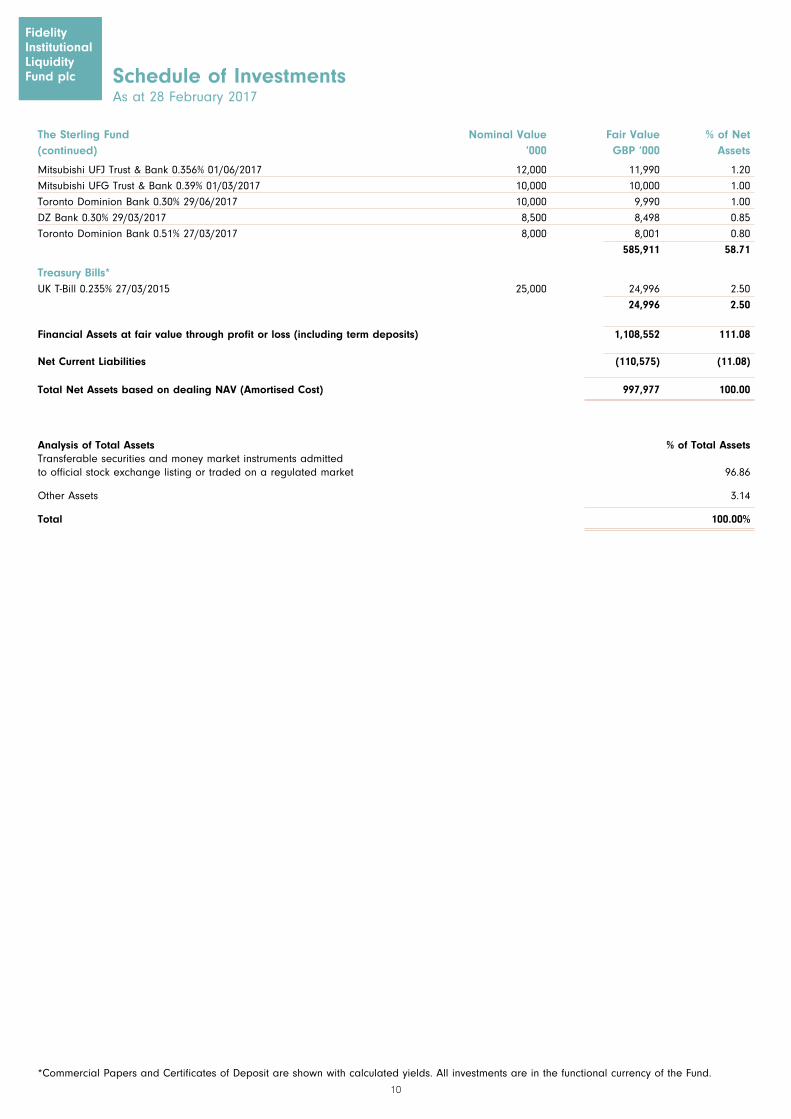
The Sterling Fund Nominal Value Fair Value % of Net (continued) ‘000 GBP ‘000 Assets
Mitsubishi UFJ Trust & Bank 0.356% 01/06/2017 12,000 11,990 1.20
Mitsubishi UFG Trust & Bank 0.39% 01/03/2017 10,000 10,000 1.00
Toronto Dominion Bank 0.30% 29/06/2017 10,000 9,990 1.00
DZ Bank 0.30% 29/03/2017 8,500 8,498 0.85
Toronto Dominion Bank 0.51% 27/03/2017 8,000 8,001 0.80
585,911 58.71
Treasury Bills* UK T-Bill 0.235% 27/03/2015 25,000 24,996 2.50
24,996 2.50
Financial Assets at fair value through profit or loss (including term deposits) 1,108,552 111.08
Net Current Liabilities (110,575) (11.08)
Total Net Assets based on dealing NAV (Amortised Cost) 997,977 100.00
Analysis of Total Assets % of Total Assets Transferable securities and money market instruments admitted to official stock exchange listing or traded on a regulated market 96.86
Other Assets 3.14
Total 100.00%
FidelityInstitutional Liquidity Fund plc
11
FidelityInstitutional Liquidity Fund plc
*Commercial Papers and Certificates of Deposit are shown with calculated yields. All investments are in the functional currency of the Fund.
The Sterling Fund Nominal Value Fair Value % of Net ‘000 GBP ‘000 Assets
Term Deposits
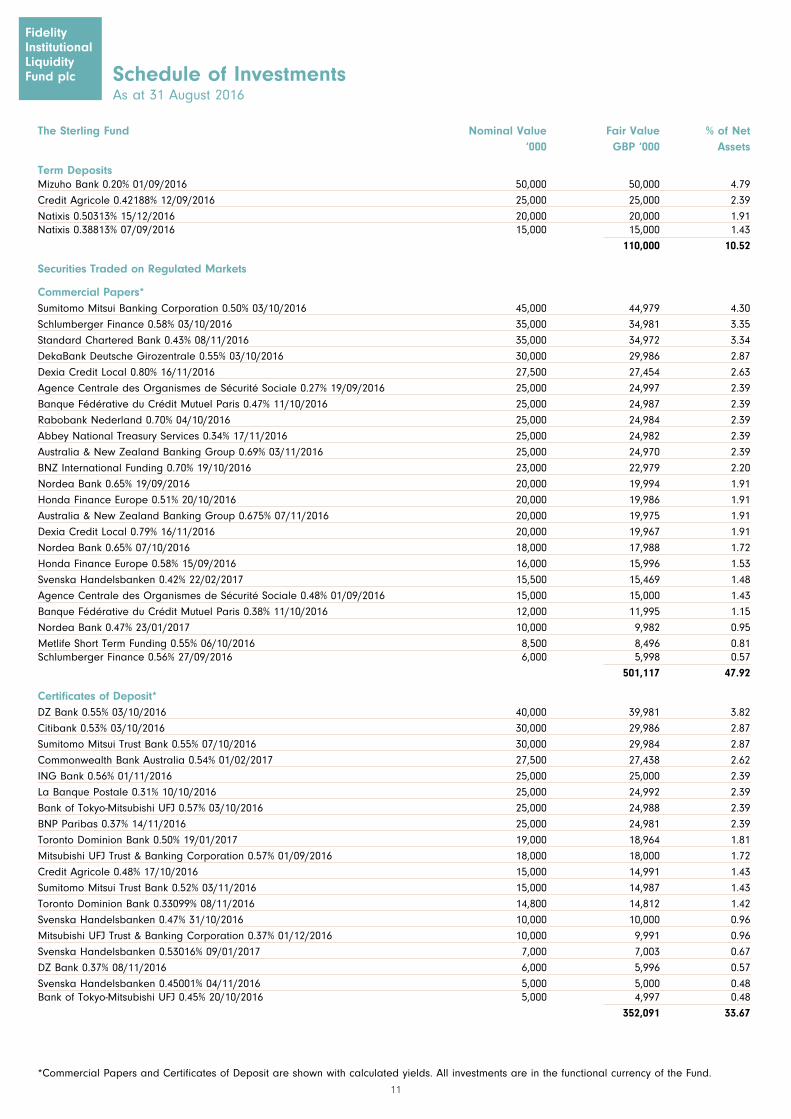
Schedule of InvestmentsAs at 31 August 2016
Mizuho Bank 0.20% 01/09/2016 50,000 50,000 4.79
Credit Agricole 0.42188% 12/09/2016 25,000 25,000 2.39
Natixis 0.50313% 15/12/2016 20,000 20,000 1.91Natixis 0.38813% 07/09/2016 15,000 15,000 1.43
110,000 10.52
Securities Traded on Regulated Markets
Commercial Papers* Sumitomo Mitsui Banking Corporation 0.50% 03/10/2016 45,000 44,979 4.30
Schlumberger Finance 0.58% 03/10/2016 35,000 34,981 3.35
Standard Chartered Bank 0.43% 08/11/2016 35,000 34,972 3.34
DekaBank Deutsche Girozentrale 0.55% 03/10/2016 30,000 29,986 2.87
Dexia Credit Local 0.80% 16/11/2016 27,500 27,454 2.63
Agence Centrale des Organismes de Sécurité Sociale 0.27% 19/09/2016 25,000 24,997 2.39
Banque Fédérative du Crédit Mutuel Paris 0.47% 11/10/2016 25,000 24,987 2.39
Rabobank Nederland 0.70% 04/10/2016 25,000 24,984 2.39
Abbey National Treasury Services 0.34% 17/11/2016 25,000 24,982 2.39
Australia & New Zealand Banking Group 0.69% 03/11/2016 25,000 24,970 2.39
BNZ International Funding 0.70% 19/10/2016 23,000 22,979 2.20
Nordea Bank 0.65% 19/09/2016 20,000 19,994 1.91
Honda Finance Europe 0.51% 20/10/2016 20,000 19,986 1.91
Australia & New Zealand Banking Group 0.675% 07/11/2016 20,000 19,975 1.91
Dexia Credit Local 0.79% 16/11/2016 20,000 19,967 1.91
Nordea Bank 0.65% 07/10/2016 18,000 17,988 1.72
Honda Finance Europe 0.58% 15/09/2016 16,000 15,996 1.53
Svenska Handelsbanken 0.42% 22/02/2017 15,500 15,469 1.48
Agence Centrale des Organismes de Sécurité Sociale 0.48% 01/09/2016 15,000 15,000 1.43
Banque Fédérative du Crédit Mutuel Paris 0.38% 11/10/2016 12,000 11,995 1.15
Nordea Bank 0.47% 23/01/2017 10,000 9,982 0.95
Metlife Short Term Funding 0.55% 06/10/2016 8,500 8,496 0.81Schlumberger Finance 0.56% 27/09/2016 6,000 5,998 0.57
501,117 47.92
Certificates of Deposit* DZ Bank 0.55% 03/10/2016 40,000 39,981 3.82
Citibank 0.53% 03/10/2016 30,000 29,986 2.87
Sumitomo Mitsui Trust Bank 0.55% 07/10/2016 30,000 29,984 2.87
Commonwealth Bank Australia 0.54% 01/02/2017 27,500 27,438 2.62
ING Bank 0.56% 01/11/2016 25,000 25,000 2.39
La Banque Postale 0.31% 10/10/2016 25,000 24,992 2.39
Bank of Tokyo-Mitsubishi UFJ 0.57% 03/10/2016 25,000 24,988 2.39
BNP Paribas 0.37% 14/11/2016 25,000 24,981 2.39
Toronto Dominion Bank 0.50% 19/01/2017 19,000 18,964 1.81
Mitsubishi UFJ Trust & Banking Corporation 0.57% 01/09/2016 18,000 18,000 1.72
Credit Agricole 0.48% 17/10/2016 15,000 14,991 1.43
Sumitomo Mitsui Trust Bank 0.52% 03/11/2016 15,000 14,987 1.43
Toronto Dominion Bank 0.33099% 08/11/2016 14,800 14,812 1.42
Svenska Handelsbanken 0.47% 31/10/2016 10,000 10,000 0.96
Mitsubishi UFJ Trust & Banking Corporation 0.37% 01/12/2016 10,000 9,991 0.96
Svenska Handelsbanken 0.53016% 09/01/2017 7,000 7,003 0.67
DZ Bank 0.37% 08/11/2016 6,000 5,996 0.57
Svenska Handelsbanken 0.45001% 04/11/2016 5,000 5,000 0.48Bank of Tokyo-Mitsubishi UFJ 0.45% 20/10/2016 5,000 4,997 0.48
352,091 33.67
12
FidelityInstitutional Liquidity Fund plc
*Commercial Papers and Certificates of Deposit are shown with calculated yields. All investments are in the functional currency of the Fund.
The Sterling Fund Nominal Value Fair Value % of Net (continued) ‘000 GBP ‘000 Assets
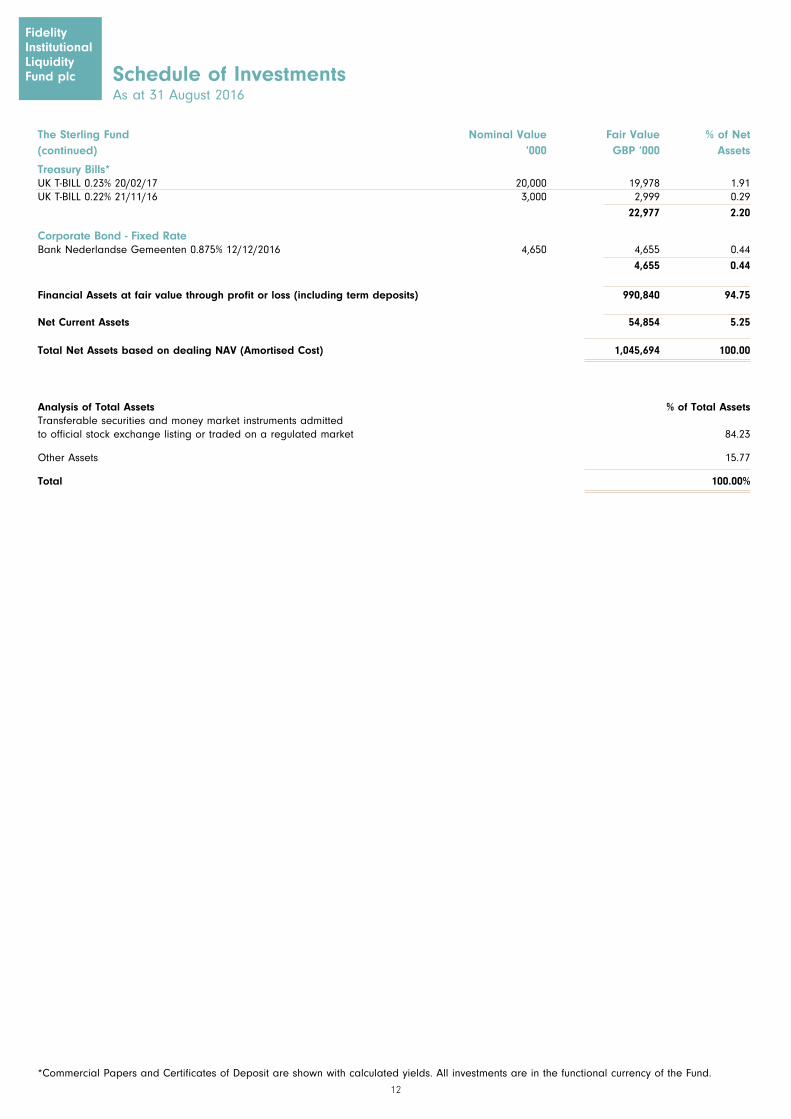
Schedule of InvestmentsAs at 31 August 2016
Treasury Bills* UK T-BILL 0.23% 20/02/17 20,000 19,978 1.91UK T-BILL 0.22% 21/11/16 3,000 2,999 0.29
22,977 2.20
Corporate Bond - Fixed Rate Bank Nederlandse Gemeenten 0.875% 12/12/2016 4,650 4,655 0.44
4,655 0.44
Financial Assets at fair value through profit or loss (including term deposits) 990,840 94.75
Net Current Assets 54,854 5.25
Total Net Assets based on dealing NAV (Amortised Cost) 1,045,694 100.00
Analysis of Total Assets % of Total Assets Transferable securities and money market instruments admitted to official stock exchange listing or traded on a regulated market 84.23
Other Assets 15.77
Total 100.00%
13
FidelityInstitutional Liquidity Fund plc
*Commercial Papers and Certificates of Deposit are shown with calculated yields. All investments are in the functional currency of the Fund.
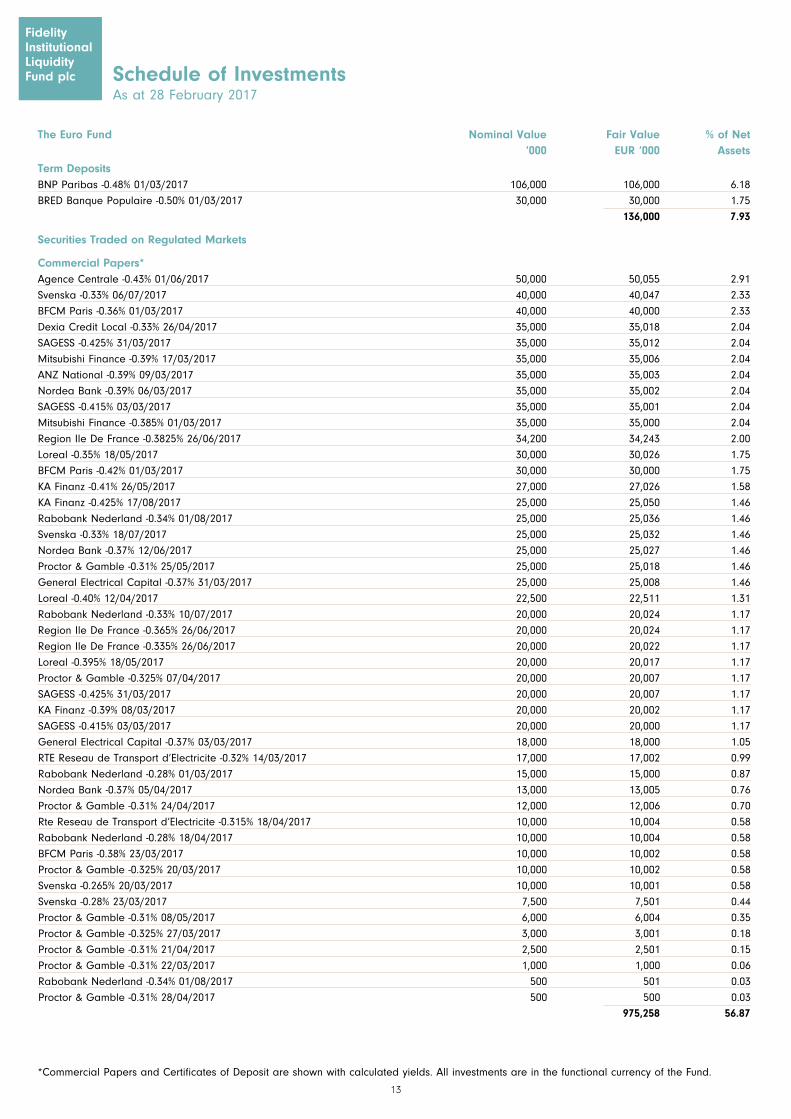
The Euro Fund Nominal Value Fair Value % of Net ‘000 EUR ‘000 Assets
Schedule of InvestmentsAs at 28 February 2017
Term Deposits BNP Paribas -0.48% 01/03/2017 106,000 106,000 6.18
BRED Banque Populaire -0.50% 01/03/2017 30,000 30,000 1.75
136,000 7.93
Securities Traded on Regulated Markets
Commercial Papers* Agence Centrale -0.43% 01/06/2017 50,000 50,055 2.91
Svenska -0.33% 06/07/2017 40,000 40,047 2.33
BFCM Paris -0.36% 01/03/2017 40,000 40,000 2.33
Dexia Credit Local -0.33% 26/04/2017 35,000 35,018 2.04
SAGESS -0.425% 31/03/2017 35,000 35,012 2.04
Mitsubishi Finance -0.39% 17/03/2017 35,000 35,006 2.04
ANZ National -0.39% 09/03/2017 35,000 35,003 2.04
Nordea Bank -0.39% 06/03/2017 35,000 35,002 2.04
SAGESS -0.415% 03/03/2017 35,000 35,001 2.04
Mitsubishi Finance -0.385% 01/03/2017 35,000 35,000 2.04
Region Ile De France -0.3825% 26/06/2017 34,200 34,243 2.00
Loreal -0.35% 18/05/2017 30,000 30,026 1.75
BFCM Paris -0.42% 01/03/2017 30,000 30,000 1.75
KA Finanz -0.41% 26/05/2017 27,000 27,026 1.58
KA Finanz -0.425% 17/08/2017 25,000 25,050 1.46
Rabobank Nederland -0.34% 01/08/2017 25,000 25,036 1.46
Svenska -0.33% 18/07/2017 25,000 25,032 1.46
Nordea Bank -0.37% 12/06/2017 25,000 25,027 1.46
Proctor & Gamble -0.31% 25/05/2017 25,000 25,018 1.46
General Electrical Capital -0.37% 31/03/2017 25,000 25,008 1.46
Loreal -0.40% 12/04/2017 22,500 22,511 1.31
Rabobank Nederland -0.33% 10/07/2017 20,000 20,024 1.17
Region Ile De France -0.365% 26/06/2017 20,000 20,024 1.17
Region Ile De France -0.335% 26/06/2017 20,000 20,022 1.17
Loreal -0.395% 18/05/2017 20,000 20,017 1.17
Proctor & Gamble -0.325% 07/04/2017 20,000 20,007 1.17
SAGESS -0.425% 31/03/2017 20,000 20,007 1.17
KA Finanz -0.39% 08/03/2017 20,000 20,002 1.17
SAGESS -0.415% 03/03/2017 20,000 20,000 1.17
General Electrical Capital -0.37% 03/03/2017 18,000 18,000 1.05
RTE Reseau de Transport d’Electricite -0.32% 14/03/2017 17,000 17,002 0.99
Rabobank Nederland -0.28% 01/03/2017 15,000 15,000 0.87
Nordea Bank -0.37% 05/04/2017 13,000 13,005 0.76
Proctor & Gamble -0.31% 24/04/2017 12,000 12,006 0.70
Rte Reseau de Transport d’Electricite -0.315% 18/04/2017 10,000 10,004 0.58
Rabobank Nederland -0.28% 18/04/2017 10,000 10,004 0.58
BFCM Paris -0.38% 23/03/2017 10,000 10,002 0.58
Proctor & Gamble -0.325% 20/03/2017 10,000 10,002 0.58
Svenska -0.265% 20/03/2017 10,000 10,001 0.58
Svenska -0.28% 23/03/2017 7,500 7,501 0.44
Proctor & Gamble -0.31% 08/05/2017 6,000 6,004 0.35
Proctor & Gamble -0.325% 27/03/2017 3,000 3,001 0.18
Proctor & Gamble -0.31% 21/04/2017 2,500 2,501 0.15
Proctor & Gamble -0.31% 22/03/2017 1,000 1,000 0.06
Rabobank Nederland -0.34% 01/08/2017 500 501 0.03
Proctor & Gamble -0.31% 28/04/2017 500 500 0.03
975,258 56.87
FidelityInstitutional Liquidity Fund plc
14
FidelityInstitutional Liquidity Fund plc
*Commercial Papers and Certificates of Deposit are shown with calculated yields. All investments are in the functional currency of the Fund.
The Euro Fund Nominal Value Fair Value % of Net (continued) ‘000 EUR ‘000 Assets
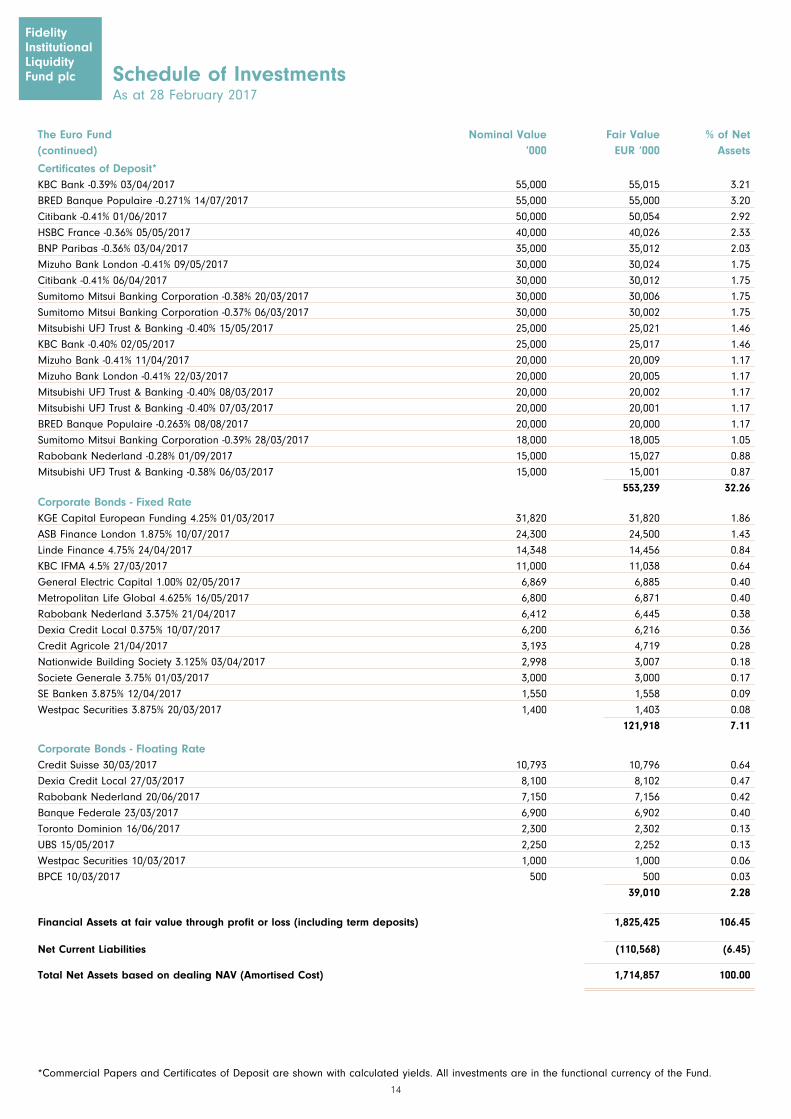
Schedule of InvestmentsAs at 28 February 2017
Certificates of Deposit* KBC Bank -0.39% 03/04/2017 55,000 55,015 3.21
BRED Banque Populaire -0.271% 14/07/2017 55,000 55,000 3.20
Citibank -0.41% 01/06/2017 50,000 50,054 2.92
HSBC France -0.36% 05/05/2017 40,000 40,026 2.33
BNP Paribas -0.36% 03/04/2017 35,000 35,012 2.03
Mizuho Bank London -0.41% 09/05/2017 30,000 30,024 1.75
Citibank -0.41% 06/04/2017 30,000 30,012 1.75
Sumitomo Mitsui Banking Corporation -0.38% 20/03/2017 30,000 30,006 1.75
Sumitomo Mitsui Banking Corporation -0.37% 06/03/2017 30,000 30,002 1.75
Mitsubishi UFJ Trust & Banking -0.40% 15/05/2017 25,000 25,021 1.46
KBC Bank -0.40% 02/05/2017 25,000 25,017 1.46
Mizuho Bank -0.41% 11/04/2017 20,000 20,009 1.17
Mizuho Bank London -0.41% 22/03/2017 20,000 20,005 1.17
Mitsubishi UFJ Trust & Banking -0.40% 08/03/2017 20,000 20,002 1.17
Mitsubishi UFJ Trust & Banking -0.40% 07/03/2017 20,000 20,001 1.17
BRED Banque Populaire -0.263% 08/08/2017 20,000 20,000 1.17
Sumitomo Mitsui Banking Corporation -0.39% 28/03/2017 18,000 18,005 1.05
Rabobank Nederland -0.28% 01/09/2017 15,000 15,027 0.88
Mitsubishi UFJ Trust & Banking -0.38% 06/03/2017 15,000 15,001 0.87
553,239 32.26Corporate Bonds - Fixed Rate KGE Capital European Funding 4.25% 01/03/2017 31,820 31,820 1.86
ASB Finance London 1.875% 10/07/2017 24,300 24,500 1.43
Linde Finance 4.75% 24/04/2017 14,348 14,456 0.84
KBC IFMA 4.5% 27/03/2017 11,000 11,038 0.64
General Electric Capital 1.00% 02/05/2017 6,869 6,885 0.40
Metropolitan Life Global 4.625% 16/05/2017 6,800 6,871 0.40
Rabobank Nederland 3.375% 21/04/2017 6,412 6,445 0.38
Dexia Credit Local 0.375% 10/07/2017 6,200 6,216 0.36
Credit Agricole 21/04/2017 3,193 4,719 0.28
Nationwide Building Society 3.125% 03/04/2017 2,998 3,007 0.18
Societe Generale 3.75% 01/03/2017 3,000 3,000 0.17
SE Banken 3.875% 12/04/2017 1,550 1,558 0.09
Westpac Securities 3.875% 20/03/2017 1,400 1,403 0.08
121,918 7.11
Corporate Bonds - Floating Rate Credit Suisse 30/03/2017 10,793 10,796 0.64
Dexia Credit Local 27/03/2017 8,100 8,102 0.47
Rabobank Nederland 20/06/2017 7,150 7,156 0.42
Banque Federale 23/03/2017 6,900 6,902 0.40
Toronto Dominion 16/06/2017 2,300 2,302 0.13
UBS 15/05/2017 2,250 2,252 0.13
Westpac Securities 10/03/2017 1,000 1,000 0.06
BPCE 10/03/2017 500 500 0.03
39,010 2.28
Financial Assets at fair value through profit or loss (including term deposits) 1,825,425 106.45
Net Current Liabilities (110,568) (6.45)
Total Net Assets based on dealing NAV (Amortised Cost) 1,714,857 100.00

15
The Euro Fund ‘000 USD ‘000 % of Net Nominal Value Market Value Asset
Schedule of InvestmentsAs at 28 February 2017
FidelityInstitutional Liquidity Fund plc
*Commercial Papers and Certificates of Deposit are shown with calculated yields. All investments are in the functional currency of the Fund.
The Euro Fund (continued)
Analysis of Total Assets % of Total Assets Transferable securities and money market instruments admitted to official stock exchange listing or traded on a regulated market 98.52
Other Assets 1.48
Total 100.00%
16
FidelityInstitutional Liquidity Fund plc
*Commercial Papers and Certificates of Deposit are shown with calculated yields. All investments are in the functional currency of the Fund.
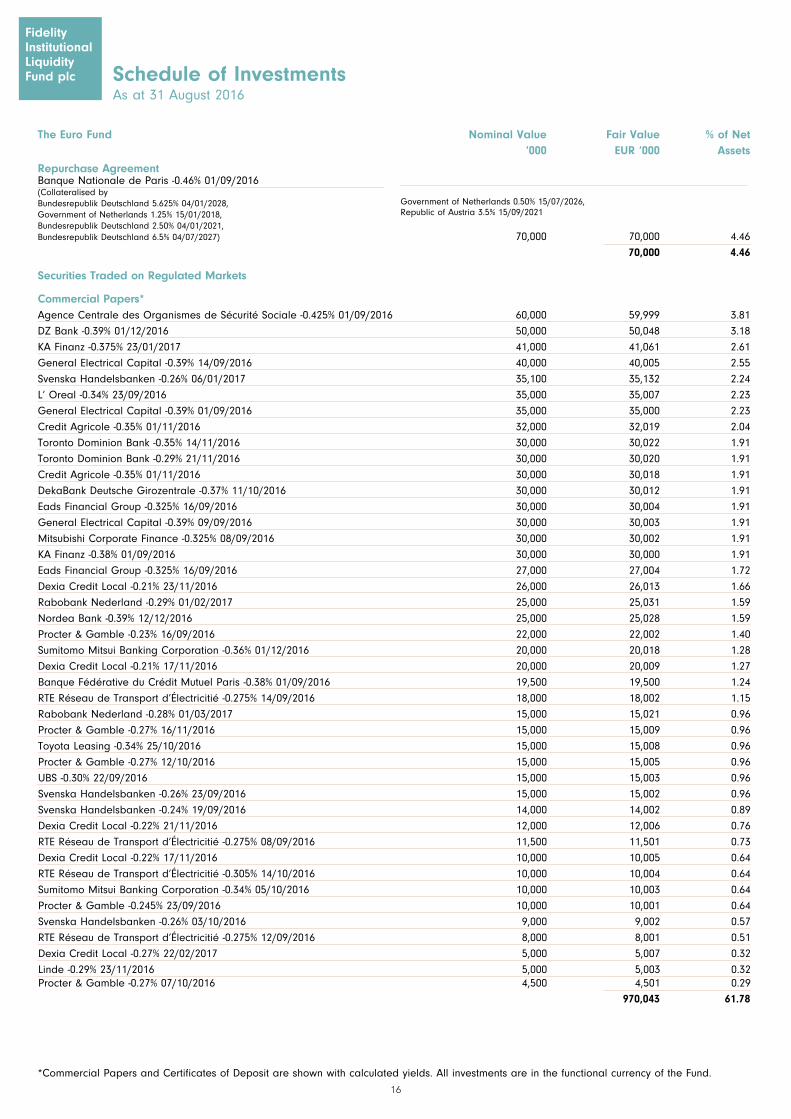
The Euro Fund Nominal Value Fair Value % of Net ‘000 EUR ‘000 Assets
Repurchase Agreement
Bundesrepublik Deutschland 6.5% 04/07/2027) 70,000 70,000 4.46
70,000 4.46
Securities Traded on Regulated Markets
Commercial Papers* Agence Centrale des Organismes de Sécurité Sociale -0.425% 01/09/2016 60,000 59,999 3.81
DZ Bank -0.39% 01/12/2016 50,000 50,048 3.18
KA Finanz -0.375% 23/01/2017 41,000 41,061 2.61
General Electrical Capital -0.39% 14/09/2016 40,000 40,005 2.55
Svenska Handelsbanken -0.26% 06/01/2017 35,100 35,132 2.24
L’ Oreal -0.34% 23/09/2016 35,000 35,007 2.23
General Electrical Capital -0.39% 01/09/2016 35,000 35,000 2.23
Credit Agricole -0.35% 01/11/2016 32,000 32,019 2.04
Toronto Dominion Bank -0.35% 14/11/2016 30,000 30,022 1.91
Toronto Dominion Bank -0.29% 21/11/2016 30,000 30,020 1.91
Credit Agricole -0.35% 01/11/2016 30,000 30,018 1.91
DekaBank Deutsche Girozentrale -0.37% 11/10/2016 30,000 30,012 1.91
Eads Financial Group -0.325% 16/09/2016 30,000 30,004 1.91
General Electrical Capital -0.39% 09/09/2016 30,000 30,003 1.91
Mitsubishi Corporate Finance -0.325% 08/09/2016 30,000 30,002 1.91
KA Finanz -0.38% 01/09/2016 30,000 30,000 1.91
Eads Financial Group -0.325% 16/09/2016 27,000 27,004 1.72
Dexia Credit Local -0.21% 23/11/2016 26,000 26,013 1.66
Rabobank Nederland -0.29% 01/02/2017 25,000 25,031 1.59
Nordea Bank -0.39% 12/12/2016 25,000 25,028 1.59
Procter & Gamble -0.23% 16/09/2016 22,000 22,002 1.40
Sumitomo Mitsui Banking Corporation -0.36% 01/12/2016 20,000 20,018 1.28
Dexia Credit Local -0.21% 17/11/2016 20,000 20,009 1.27
Banque Fédérative du Crédit Mutuel Paris -0.38% 01/09/2016 19,500 19,500 1.24
RTE Réseau de Transport d’Électricitié -0.275% 14/09/2016 18,000 18,002 1.15
Rabobank Nederland -0.28% 01/03/2017 15,000 15,021 0.96
Procter & Gamble -0.27% 16/11/2016 15,000 15,009 0.96
Toyota Leasing -0.34% 25/10/2016 15,000 15,008 0.96
Procter & Gamble -0.27% 12/10/2016 15,000 15,005 0.96
UBS -0.30% 22/09/2016 15,000 15,003 0.96
Svenska Handelsbanken -0.26% 23/09/2016 15,000 15,002 0.96
Svenska Handelsbanken -0.24% 19/09/2016 14,000 14,002 0.89
Dexia Credit Local -0.22% 21/11/2016 12,000 12,006 0.76
RTE Réseau de Transport d’Électricitié -0.275% 08/09/2016 11,500 11,501 0.73
Dexia Credit Local -0.22% 17/11/2016 10,000 10,005 0.64
RTE Réseau de Transport d’Électricitié -0.305% 14/10/2016 10,000 10,004 0.64
Sumitomo Mitsui Banking Corporation -0.34% 05/10/2016 10,000 10,003 0.64
Procter & Gamble -0.245% 23/09/2016 10,000 10,001 0.64
Svenska Handelsbanken -0.26% 03/10/2016 9,000 9,002 0.57
RTE Réseau de Transport d’Électricitié -0.275% 12/09/2016 8,000 8,001 0.51
Dexia Credit Local -0.27% 22/02/2017 5,000 5,007 0.32
Linde -0.29% 23/11/2016 5,000 5,003 0.32Procter & Gamble -0.27% 07/10/2016 4,500 4,501 0.29
970,043 61.78
Schedule of InvestmentsAs at 31 August 2016
Banque Nationale de Paris -0.46% 01/09/2016 (Collateralised by Bundesrepublik Deutschland 5.625% 04/01/2028, Government of Netherlands 1.25% 15/01/2018, Bundesrepublik Deutschland 2.50% 04/01/2021,
Government of Netherlands 0.50% 15/07/2026, Republic of Austria 3.5% 15/09/2021
17
FidelityInstitutional Liquidity Fund plc
*Commercial Papers and Certificates of Deposit are shown with calculated yields. All investments are in the functional currency of the Fund.
Schedule of InvestmentsAs at 31 August 2016
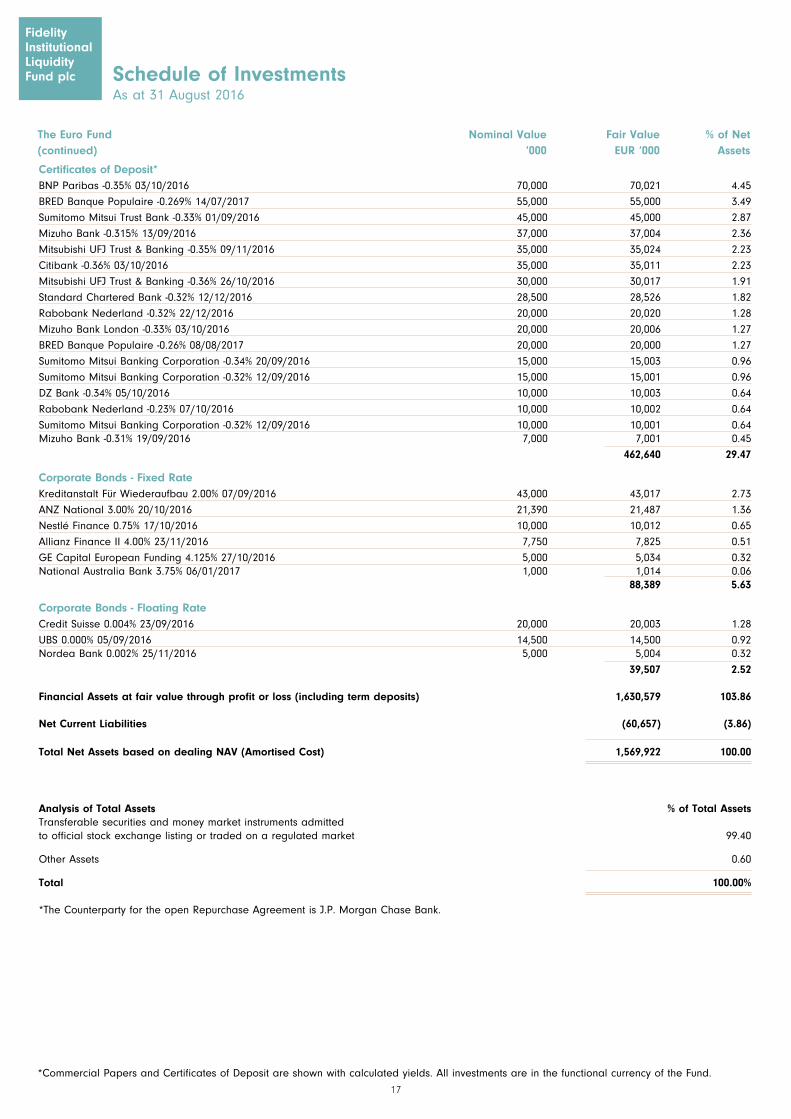
The Euro Fund Nominal Value Fair Value % of Net (continued) ‘000 EUR ‘000 Assets
Certificates of Deposit* BNP Paribas -0.35% 03/10/2016 70,000 70,021 4.45
BRED Banque Populaire -0.269% 14/07/2017 55,000 55,000 3.49
Sumitomo Mitsui Trust Bank -0.33% 01/09/2016 45,000 45,000 2.87
Mizuho Bank -0.315% 13/09/2016 37,000 37,004 2.36
Mitsubishi UFJ Trust & Banking -0.35% 09/11/2016 35,000 35,024 2.23
Citibank -0.36% 03/10/2016 35,000 35,011 2.23
Mitsubishi UFJ Trust & Banking -0.36% 26/10/2016 30,000 30,017 1.91
Standard Chartered Bank -0.32% 12/12/2016 28,500 28,526 1.82
Rabobank Nederland -0.32% 22/12/2016 20,000 20,020 1.28
Mizuho Bank London -0.33% 03/10/2016 20,000 20,006 1.27
BRED Banque Populaire -0.26% 08/08/2017 20,000 20,000 1.27
Sumitomo Mitsui Banking Corporation -0.34% 20/09/2016 15,000 15,003 0.96
Sumitomo Mitsui Banking Corporation -0.32% 12/09/2016 15,000 15,001 0.96
DZ Bank -0.34% 05/10/2016 10,000 10,003 0.64
Rabobank Nederland -0.23% 07/10/2016 10,000 10,002 0.64
Sumitomo Mitsui Banking Corporation -0.32% 12/09/2016 10,000 10,001 0.64Mizuho Bank -0.31% 19/09/2016 7,000 7,001 0.45
462,640 29.47
Corporate Bonds - Fixed Rate Kreditanstalt Für Wiederaufbau 2.00% 07/09/2016 43,000 43,017 2.73
ANZ National 3.00% 20/10/2016 21,390 21,487 1.36
Nestlé Finance 0.75% 17/10/2016 10,000 10,012 0.65
Allianz Finance II 4.00% 23/11/2016 7,750 7,825 0.51
GE Capital European Funding 4.125% 27/10/2016 5,000 5,034 0.32National Australia Bank 3.75% 06/01/2017 1,000 1,014 0.06 88,389 5.63
Corporate Bonds - Floating Rate Credit Suisse 0.004% 23/09/2016 20,000 20,003 1.28
UBS 0.000% 05/09/2016 14,500 14,500 0.92Nordea Bank 0.002% 25/11/2016 5,000 5,004 0.32
39,507 2.52
Financial Assets at fair value through profit or loss (including term deposits) 1,630,579 103.86
Net Current Liabilities (60,657) (3.86)
Total Net Assets based on dealing NAV (Amortised Cost) 1,569,922 100.00
Analysis of Total Assets % of Total Assets Transferable securities and money market instruments admitted to official stock exchange listing or traded on a regulated market 99.40
Other Assets 0.60
Total 100.00%
*The Counterparty for the open Repurchase Agreement is J.P. Morgan Chase Bank.
18
FidelityInstitutional Liquidity Fund plc
*Commercial Papers and Certificates of Deposit are shown with calculated yields. All investments are in the functional currency of the Fund.
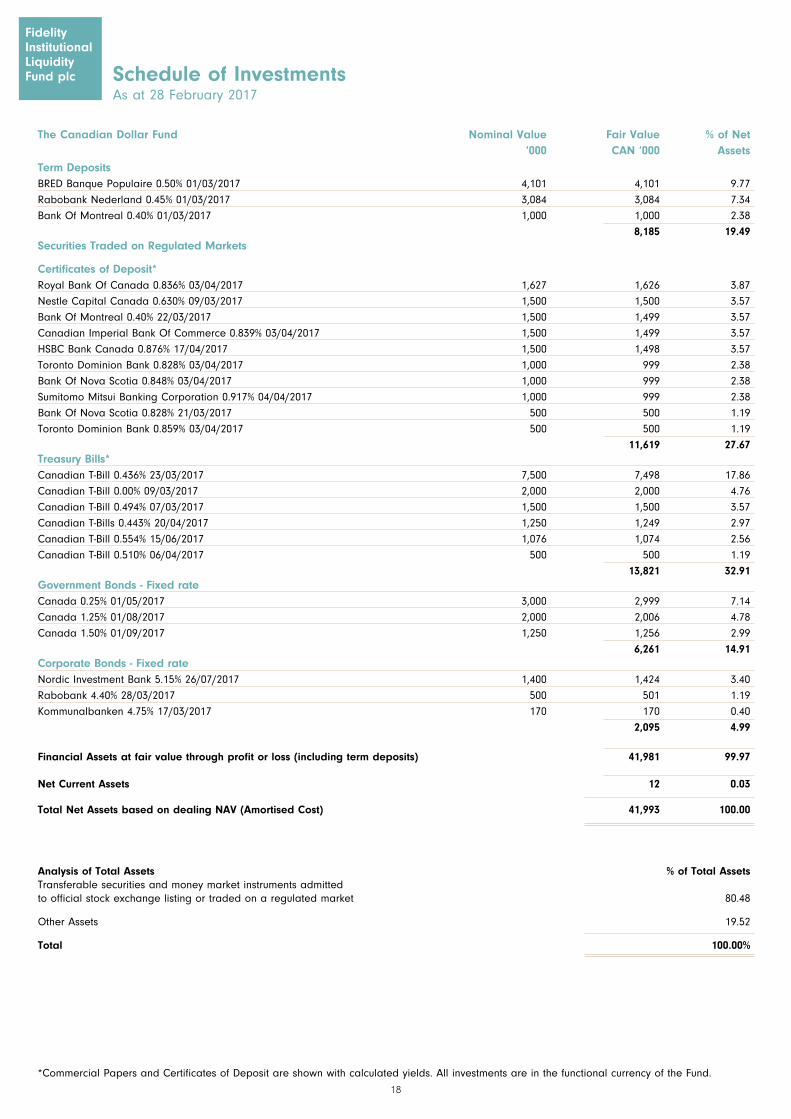
The Canadian Dollar Fund Nominal Value Fair Value % of Net ‘000 CAN ‘000 Assets
Schedule of InvestmentsAs at 28 February 2017
Term DepositsBRED Banque Populaire 0.50% 01/03/2017 4,101 4,101 9.77
Rabobank Nederland 0.45% 01/03/2017 3,084 3,084 7.34
Bank Of Montreal 0.40% 01/03/2017 1,000 1,000 2.38
8,185 19.49Securities Traded on Regulated Markets
Certificates of Deposit* Royal Bank Of Canada 0.836% 03/04/2017 1,627 1,626 3.87
Nestle Capital Canada 0.630% 09/03/2017 1,500 1,500 3.57
Bank Of Montreal 0.40% 22/03/2017 1,500 1,499 3.57
Canadian Imperial Bank Of Commerce 0.839% 03/04/2017 1,500 1,499 3.57
HSBC Bank Canada 0.876% 17/04/2017 1,500 1,498 3.57
Toronto Dominion Bank 0.828% 03/04/2017 1,000 999 2.38
Bank Of Nova Scotia 0.848% 03/04/2017 1,000 999 2.38
Sumitomo Mitsui Banking Corporation 0.917% 04/04/2017 1,000 999 2.38
Bank Of Nova Scotia 0.828% 21/03/2017 500 500 1.19
Toronto Dominion Bank 0.859% 03/04/2017 500 500 1.19
11,619 27.67Treasury Bills* Canadian T-Bill 0.436% 23/03/2017 7,500 7,498 17.86
Canadian T-Bill 0.00% 09/03/2017 2,000 2,000 4.76
Canadian T-Bill 0.494% 07/03/2017 1,500 1,500 3.57
Canadian T-Bills 0.443% 20/04/2017 1,250 1,249 2.97
Canadian T-Bill 0.554% 15/06/2017 1,076 1,074 2.56
Canadian T-Bill 0.510% 06/04/2017 500 500 1.19
13,821 32.91Government Bonds - Fixed rate Canada 0.25% 01/05/2017 3,000 2,999 7.14
Canada 1.25% 01/08/2017 2,000 2,006 4.78
Canada 1.50% 01/09/2017 1,250 1,256 2.99
6,261 14.91Corporate Bonds - Fixed rate Nordic Investment Bank 5.15% 26/07/2017 1,400 1,424 3.40
Rabobank 4.40% 28/03/2017 500 501 1.19
Kommunalbanken 4.75% 17/03/2017 170 170 0.40
2,095 4.99
Financial Assets at fair value through profit or loss (including term deposits) 41,981 99.97
Net Current Assets 12 0.03
Total Net Assets based on dealing NAV (Amortised Cost) 41,993 100.00
Analysis of Total Assets % of Total Assets Transferable securities and money market instruments admitted to official stock exchange listing or traded on a regulated market 80.48
Other Assets 19.52
Total 100.00%
19
FidelityInstitutional Liquidity Fund plc
*Commercial Papers and Certificates of Deposit are shown with calculated yields. All investments are in the functional currency of the Fund.
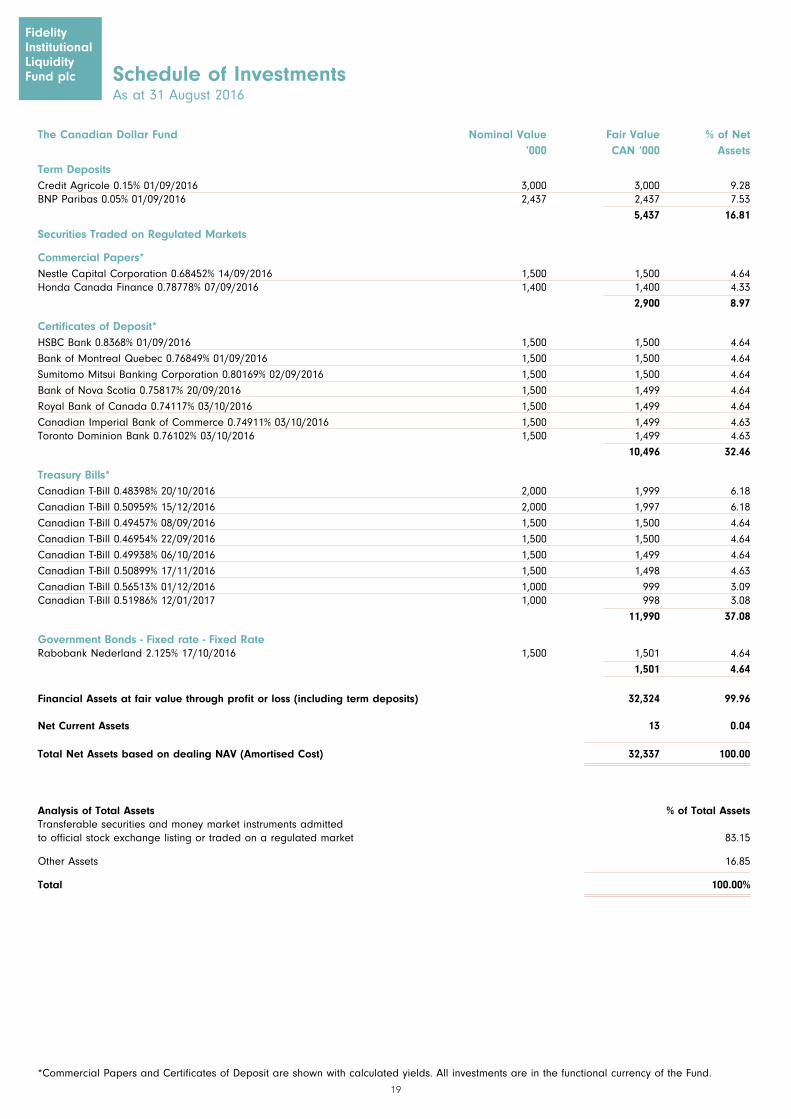
The Canadian Dollar Fund Nominal Value Fair Value % of Net ‘000 CAN ‘000 Assets
Schedule of InvestmentsAs at 31 August 2016
Term DepositsCredit Agricole 0.15% 01/09/2016 3,000 3,000 9.28BNP Paribas 0.05% 01/09/2016 2,437 2,437 7.53
5,437 16.81
Securities Traded on Regulated Markets
Commercial Papers* Nestle Capital Corporation 0.68452% 14/09/2016 1,500 1,500 4.64Honda Canada Finance 0.78778% 07/09/2016 1,400 1,400 4.33
2,900 8.97
Certificates of Deposit* HSBC Bank 0.8368% 01/09/2016 1,500 1,500 4.64
Bank of Montreal Quebec 0.76849% 01/09/2016 1,500 1,500 4.64
Sumitomo Mitsui Banking Corporation 0.80169% 02/09/2016 1,500 1,500 4.64
Bank of Nova Scotia 0.75817% 20/09/2016 1,500 1,499 4.64
Royal Bank of Canada 0.74117% 03/10/2016 1,500 1,499 4.64
Canadian Imperial Bank of Commerce 0.74911% 03/10/2016 1,500 1,499 4.63Toronto Dominion Bank 0.76102% 03/10/2016 1,500 1,499 4.63
10,496 32.46
Treasury Bills* Canadian T-Bill 0.48398% 20/10/2016 2,000 1,999 6.18
Canadian T-Bill 0.50959% 15/12/2016 2,000 1,997 6.18
Canadian T-Bill 0.49457% 08/09/2016 1,500 1,500 4.64
Canadian T-Bill 0.46954% 22/09/2016 1,500 1,500 4.64
Canadian T-Bill 0.49938% 06/10/2016 1,500 1,499 4.64
Canadian T-Bill 0.50899% 17/11/2016 1,500 1,498 4.63
Canadian T-Bill 0.56513% 01/12/2016 1,000 999 3.09Canadian T-Bill 0.51986% 12/01/2017 1,000 998 3.08
11,990 37.08
Government Bonds - Fixed rate - Fixed Rate Rabobank Nederland 2.125% 17/10/2016 1,500 1,501 4.64
1,501 4.64
Financial Assets at fair value through profit or loss (including term deposits) 32,324 99.96 Net Current Assets 13 0.04
Total Net Assets based on dealing NAV (Amortised Cost) 32,337 100.00
Analysis of Total Assets % of Total Assets Transferable securities and money market instruments admitted to official stock exchange listing or traded on a regulated market 83.15
Other Assets 16.85
Total 100.00%
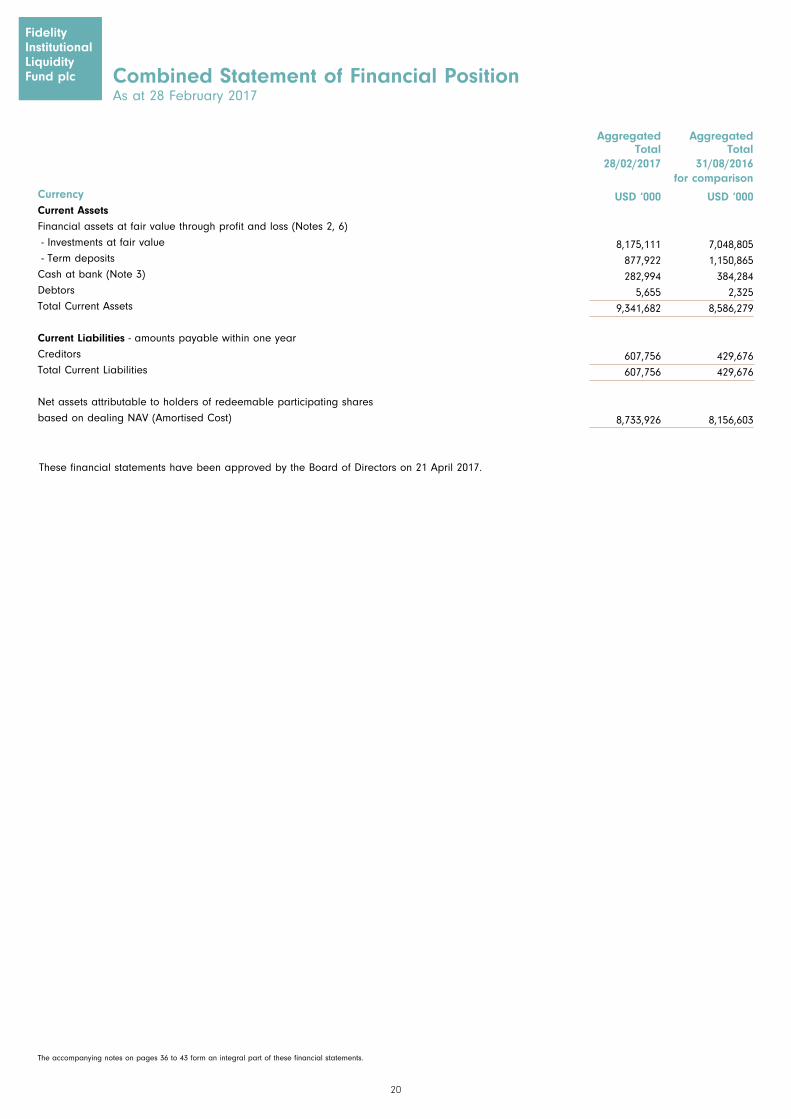
CurrencyCurrent AssetsFinancial assets at fair value through profit and loss (Notes 2, 6)
- Investments at fair value
- Term deposits
Cash at bank (Note 3)
Debtors
Total Current Assets
Current Liabilities - amounts payable within one year
Creditors
Total Current Liabilities
Net assets attributable to holders of redeemable participating shares
based on dealing NAV (Amortised Cost)
Aggregated Total
28/02/2017
USD ‘000
8,175,111
877,922
282,994
5,655
9,341,682
607,756
607,756
8,733,926
USD ‘000
7,048,805
1,150,865
384,284
2,325
8,586,279
429,676
429,676
8,156,603
The accompanying notes on pages 36 to 43 form an integral part of these financial statements.
20
Combined Statement of Financial PositionAs at 28 February 2017
FidelityInstitutional Liquidity Fund plc
FidelityInstitutional Liquidity Fund plc
These financial statements have been approved by the Board of Directors on 21 April 2017.
Aggregated Total
31/08/2016for comparison
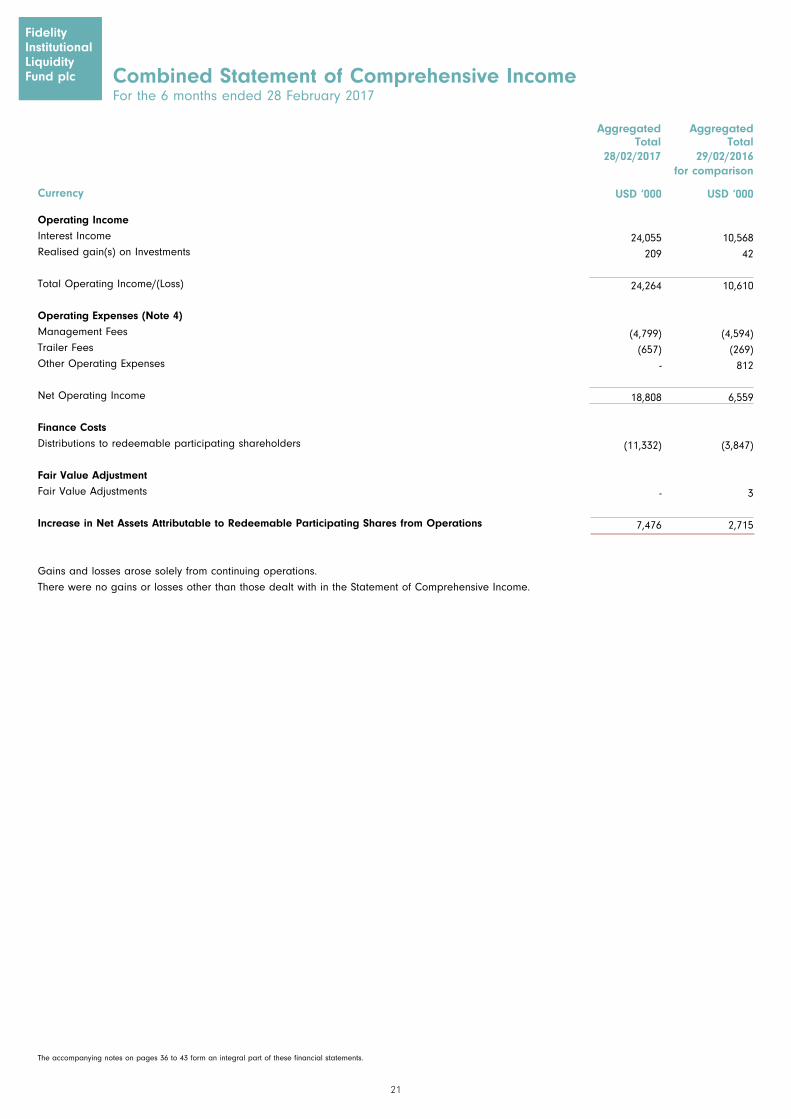
Currency
Operating IncomeInterest Income
Realised gain(s) on Investments
Total Operating Income/(Loss)
Operating Expenses (Note 4)Management Fees
Trailer Fees
Other Operating Expenses
Net Operating Income
Finance CostsDistributions to redeemable participating shareholders
Fair Value AdjustmentFair Value Adjustments
Increase in Net Assets Attributable to Redeemable Participating Shares from Operations
Gains and losses arose solely from continuing operations.
There were no gains or losses other than those dealt with in the Statement of Comprehensive Income.
Aggregated Total
28/02/2017
USD ‘000
24,055
209
24,264
(4,799)
(657)
-
18,808
(11,332)
-
7,476
Aggregated Total
29/02/2016for comparison
USD ‘000
10,568
42
10,610
(4,594)
(269)
812
6,559
(3,847)
3
2,715
The accompanying notes on pages 36 to 43 form an integral part of these financial statements.
21
Combined Statement of Comprehensive IncomeFor the 6 months ended 28 February 2017
FidelityInstitutional Liquidity Fund plc
FidelityInstitutional Liquidity Fund plc
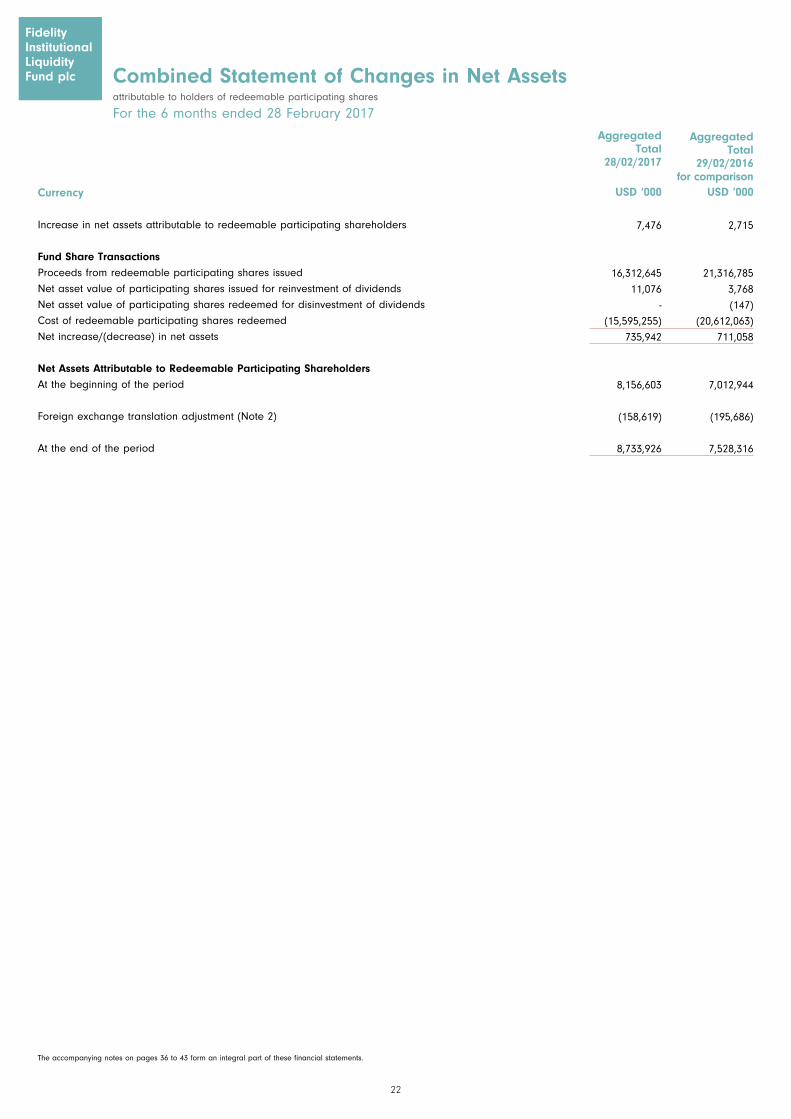
Currency
Increase in net assets attributable to redeemable participating shareholders
Fund Share TransactionsProceeds from redeemable participating shares issued
Net asset value of participating shares issued for reinvestment of dividends
Net asset value of participating shares redeemed for disinvestment of dividends
Cost of redeemable participating shares redeemed
Net increase/(decrease) in net assets
Net Assets Attributable to Redeemable Participating ShareholdersAt the beginning of the period
Foreign exchange translation adjustment (Note 2)
At the end of the period
USD ‘000
7,476
16,312,645
11,076
-
(15,595,255)
735,942
8,156,603
(158,619)
8,733,926
Aggregated Total
29/02/2016 for comparison
USD ‘000
2,715
21,316,785
3,768
(147)
(20,612,063)
711,058
7,012,944
(195,686)
7,528,316
The accompanying notes on pages 36 to 43 form an integral part of these financial statements.
22
Combined Statement of Changes in Net Assetsattributable to holders of redeemable participating shares
For the 6 months ended 28 February 2017
FidelityInstitutional Liquidity Fund plc
FidelityInstitutional Liquidity Fund plc
Aggregated Total
28/02/2017
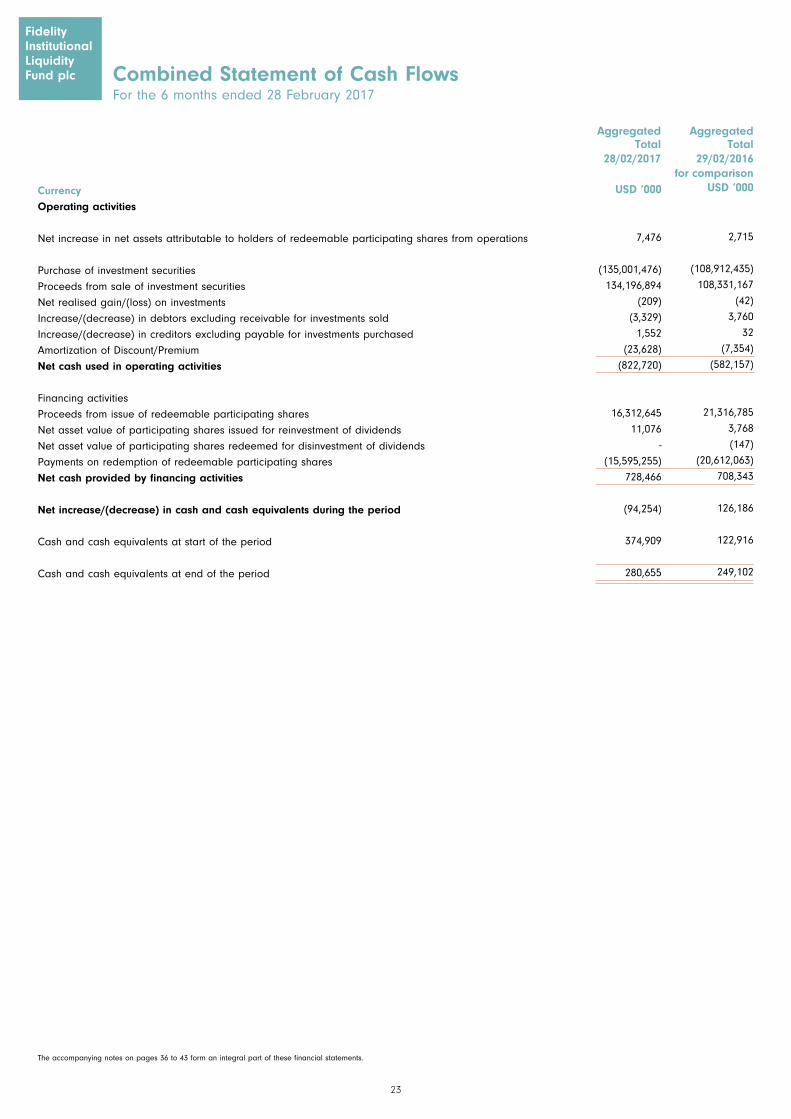
CurrencyOperating activities
Net increase in net assets attributable to holders of redeemable participating shares from operations
Purchase of investment securities
Proceeds from sale of investment securities
Net realised gain/(loss) on investments
Increase/(decrease) in debtors excluding receivable for investments sold
Increase/(decrease) in creditors excluding payable for investments purchased
Amortization of Discount/Premium
Net cash used in operating activities
Financing activities
Proceeds from issue of redeemable participating shares
Net asset value of participating shares issued for reinvestment of dividends
Net asset value of participating shares redeemed for disinvestment of dividends
Payments on redemption of redeemable participating shares
Net cash provided by financing activities
Net increase/(decrease) in cash and cash equivalents during the period
Cash and cash equivalents at start of the period
Cash and cash equivalents at end of the period
USD ‘000
7,476
(135,001,476)
134,196,894
(209)
(3,329)
1,552
(23,628)
(822,720)
16,312,645
11,076
-
(15,595,255)
728,466
(94,254)
374,909
280,655
USD ‘000
2,715
(108,912,435)
108,331,167
(42)
3,760
32
(7,354)
(582,157)
21,316,785
3,768
(147)
(20,612,063)
708,343
126,186
122,916
249,102
The accompanying notes on pages 36 to 43 form an integral part of these financial statements.
23
FidelityInstitutional Liquidity Fund plc Combined Statement of Cash Flows
For the 6 months ended 28 February 2017
Aggregated Total
28/02/2017
Aggregated Total
29/02/2016for comparison
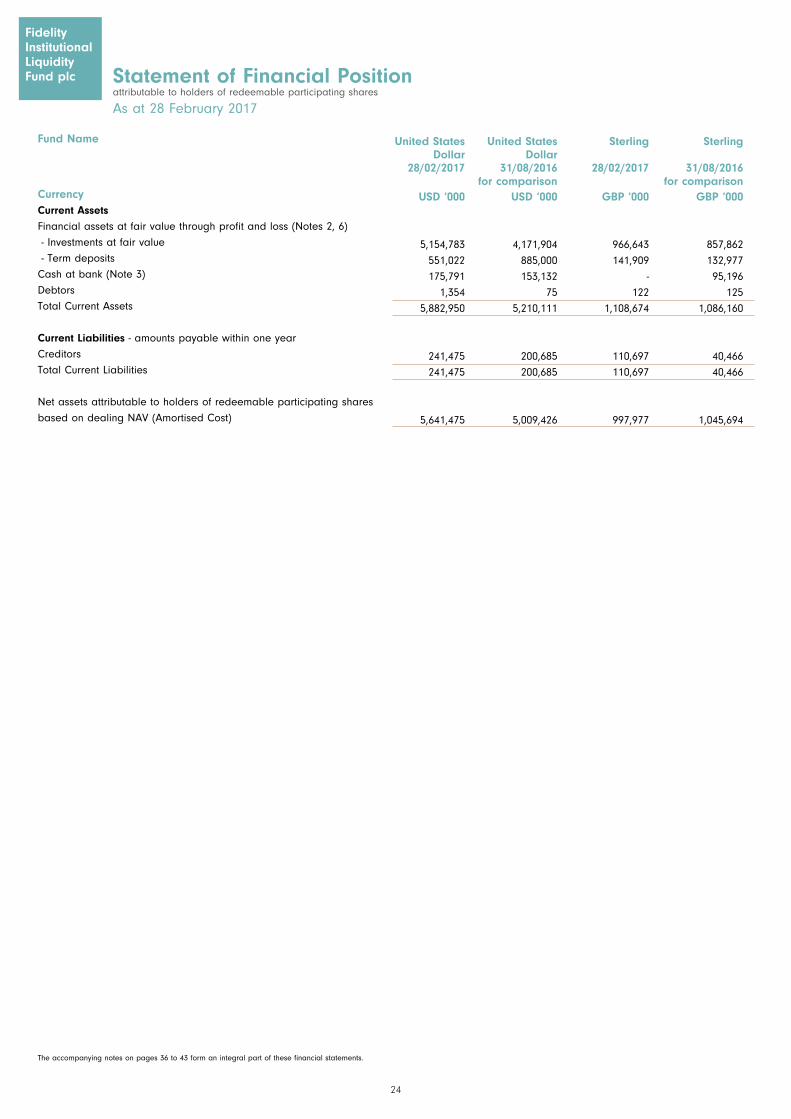
Fund Name Sterling
31/08/2016for comparison
GBP ‘000
857,862
132,977
95,196
125
1,086,160
40,466
40,466
1,045,694
United States Dollar
28/02/2017
USD ‘000
5,154,783
551,022
175,791
1,354
5,882,950
241,475
241,475
5,641,475
United States Dollar
31/08/2016for comparison
USD ‘000
4,171,904
885,000
153,132
75
5,210,111
200,685
200,685
5,009,426
Sterling
28/02/2017
GBP ‘000
966,643
141,909
-
122
1,108,674
110,697
110,697
997,977
The accompanying notes on pages 36 to 43 form an integral part of these financial statements.
24
Statement of Financial Positionattributable to holders of redeemable participating shares
As at 28 February 2017
FidelityInstitutional Liquidity Fund plc
CurrencyCurrent AssetsFinancial assets at fair value through profit and loss (Notes 2, 6)
- Investments at fair value
- Term deposits
Cash at bank (Note 3)
Debtors
Total Current Assets
Current Liabilities - amounts payable within one year
Creditors
Total Current Liabilities
Net assets attributable to holders of redeemable participating shares
based on dealing NAV (Amortised Cost)
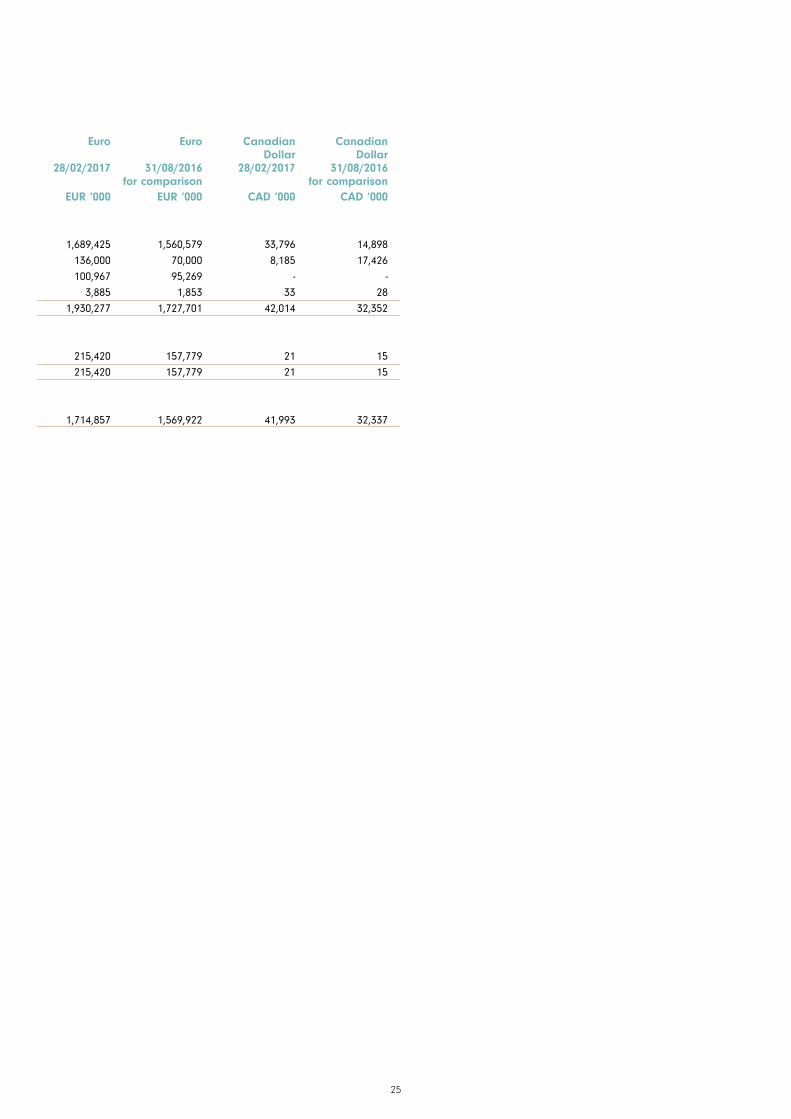
Euro
28/02/2017
EUR ‘000
1,689,425
136,000
100,967
3,885
1,930,277
215,420
215,420
1,714,857
Euro
31/08/2016for comparison
EUR ‘000
1,560,579
70,000
95,269
1,853
1,727,701
157,779
157,779
1,569,922
Canadian Dollar
28/02/2017
CAD ‘000
33,796
8,185
-
33
42,014
21
21
41,993
Canadian Dollar
31/08/2016for comparison
CAD ‘000
14,898
17,426
-
28
32,352
15
15
32,337
25
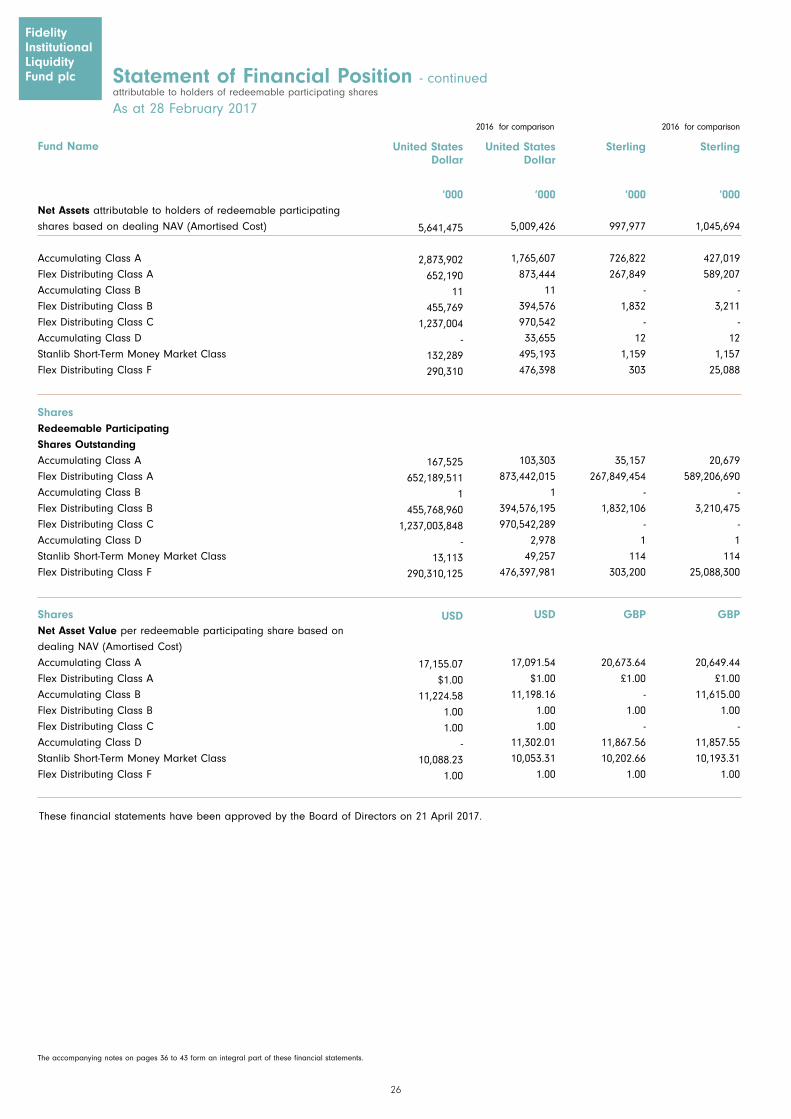
Statement of Financial Position - continuedattributable to holders of redeemable participating shares
As at 28 February 2017
FidelityInstitutional Liquidity Fund plc
Fund Name
Net Assets attributable to holders of redeemable participating
shares based on dealing NAV (Amortised Cost)
Accumulating Class A
Flex Distributing Class A
Accumulating Class B
Flex Distributing Class B
Flex Distributing Class C
Accumulating Class D
Stanlib Short-Term Money Market Class
Flex Distributing Class F
SharesRedeemable ParticipatingShares OutstandingAccumulating Class A
Flex Distributing Class A
Accumulating Class B
Flex Distributing Class B
Flex Distributing Class C
Accumulating Class D
Stanlib Short-Term Money Market Class
Flex Distributing Class F
SharesNet Asset Value per redeemable participating share based on
dealing NAV (Amortised Cost)
Accumulating Class A
Flex Distributing Class A
Accumulating Class B
Flex Distributing Class B
Flex Distributing Class C
Accumulating Class D
Stanlib Short-Term Money Market Class
Flex Distributing Class F
Sterling
‘000
1,045,694
427,019
589,207
-
3,211
-
12
1,157
25,088
20,679
589,206,690
-
3,210,475
-
1
114
25,088,300
GBP
20,649.44
£1.00
11,615.00
1.00
-
11,857.55
10,193.31
1.00
United States Dollar
‘000
5,641,475
2,873,902
652,190
11
455,769
1,237,004
-
132,289
290,310
167,525
652,189,511
1
455,768,960
1,237,003,848
-
13,113
290,310,125
USD
17,155.07
$1.00
11,224.58
1.00
1.00
-
10,088.23
1.00
United States Dollar
‘000
5,009,426
1,765,607
873,444
11
394,576
970,542
33,655
495,193
476,398
103,303
873,442,015
1
394,576,195
970,542,289
2,978
49,257
476,397,981
USD
17,091.54
$1.00
11,198.16
1.00
1.00
11,302.01
10,053.31
1.00
Sterling
‘000
997,977
726,822
267,849
-
1,832
-
12
1,159
303
35,157
267,849,454
-
1,832,106
-
1
114
303,200
GBP
20,673.64
£1.00
-
1.00
-
11,867.56
10,202.66
1.00
2016 for comparison
The accompanying notes on pages 36 to 43 form an integral part of these financial statements.
26
2016 for comparison
These financial statements have been approved by the Board of Directors on 21 April 2017.
27
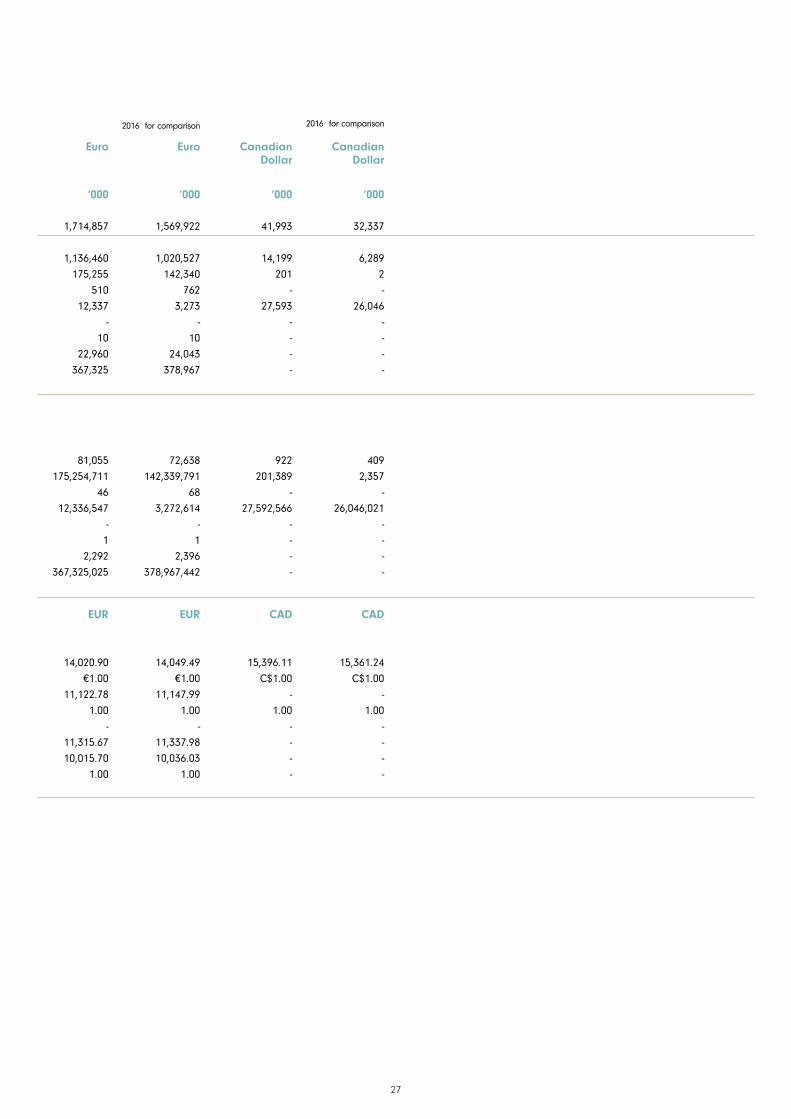
Euro
‘000
1,714,857
1,136,460
175,255
510
12,337
-
10
22,960
367,325
81,055
175,254,711
46
12,336,547
-
1
2,292
367,325,025
EUR
14,020.90
€1.00
11,122.78
1.00
-
11,315.67
10,015.70
1.00
Euro
‘000
1,569,922
1,020,527
142,340
762
3,273
-
10
24,043
378,967
72,638
142,339,791
68
3,272,614
-
1
2,396
378,967,442
EUR
14,049.49
€1.00
11,147.99
1.00
-
11,337.98
10,036.03
1.00
Canadian Dollar
‘000
41,993
14,199
201
-
27,593
-
-
-
-
922
201,389
-
27,592,566
-
-
-
-
CAD
15,396.11
C$1.00
-
1.00
-
-
-
-
Canadian Dollar
‘000
32,337
6,289
2
-
26,046
-
-
-
-
409
2,357
-
26,046,021
-
-
-
-
CAD
15,361.24
C$1.00
-
1.00
-
-
-
-
2016 for comparison 2016 for comparison
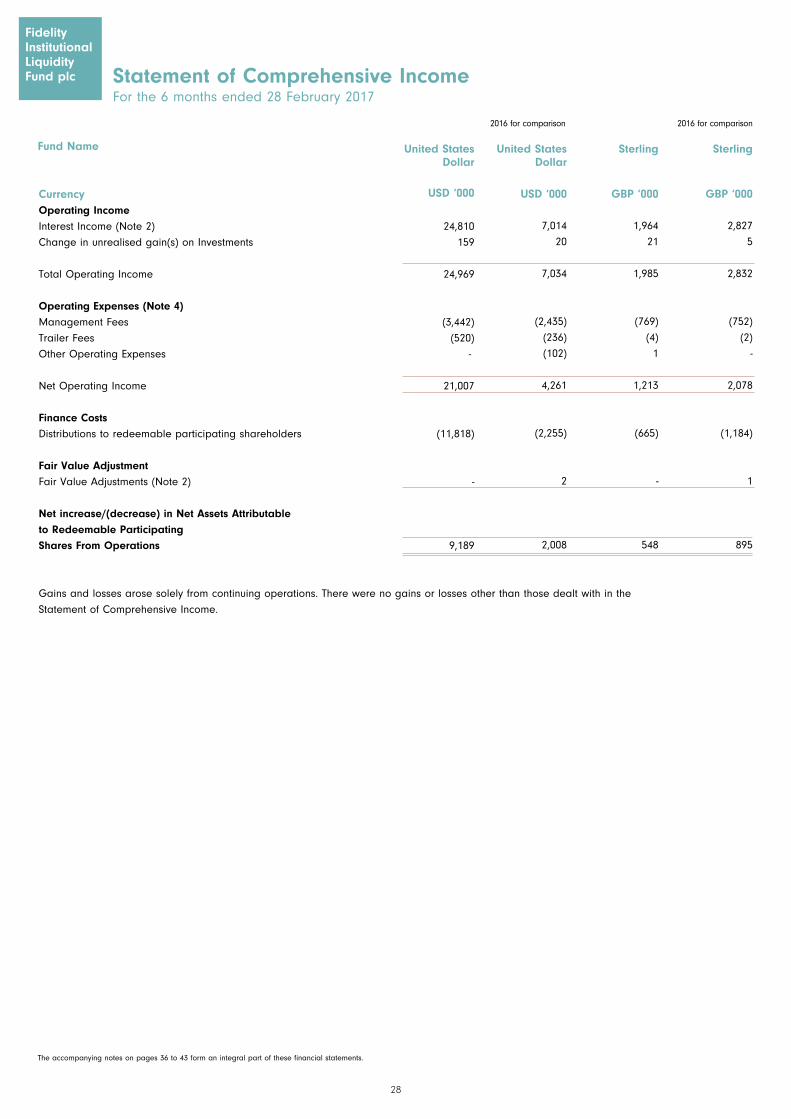
CurrencyOperating IncomeInterest Income (Note 2)
Change in unrealised gain(s) on Investments
Total Operating Income
Operating Expenses (Note 4)Management Fees
Trailer Fees
Other Operating Expenses
Net Operating Income
Finance CostsDistributions to redeemable participating shareholders
Fair Value AdjustmentFair Value Adjustments (Note 2)
Net increase/(decrease) in Net Assets Attributable to Redeemable Participating Shares From Operations
Gains and losses arose solely from continuing operations. There were no gains or losses other than those dealt with in the
Statement of Comprehensive Income.
Fund Name United States Dollar
USD ‘000
24,810
159
24,969
(3,442)
(520)
-
21,007
(11,818)
-
9,189
United States Dollar
USD ‘000
7,014
20
7,034
(2,435)
(236)
(102)
4,261
(2,255)
2
2,008
Sterling
GBP ‘000
1,964
21
1,985
(769)
(4)
1
1,213
(665)
-
548
Sterling
GBP ‘000
2,827
5
2,832
(752)
(2)
-
2,078
(1,184)
1
895
2016 for comparison 2016 for comparison
The accompanying notes on pages 36 to 43 form an integral part of these financial statements.
28
Statement of Comprehensive IncomeFor the 6 months ended 28 February 2017
FidelityInstitutional Liquidity Fund plc
29
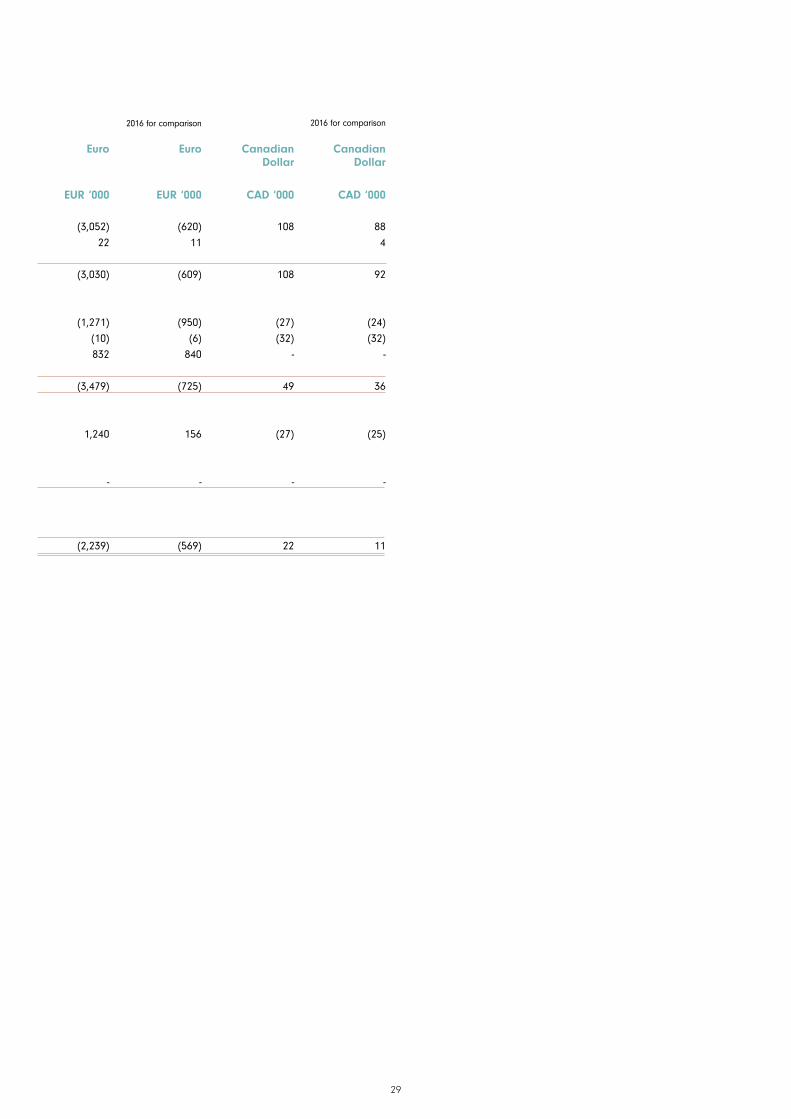
Euro
EUR ‘000
(3,052)
22
(3,030)
(1,271)
(10)
832
(3,479)
1,240
-
(2,239)
Euro
EUR ‘000
(620)
11
(609)
(950)
(6)
840
(725)
156
-
(569)
Canadian Dollar
CAD ‘000
108
108
(27)
(32)
-
49
(27)
-
22
Canadian Dollar
CAD ‘000
88
4
92
(24)
(32)
-
36
(25)
-
11
2016 for comparison 2016 for comparison
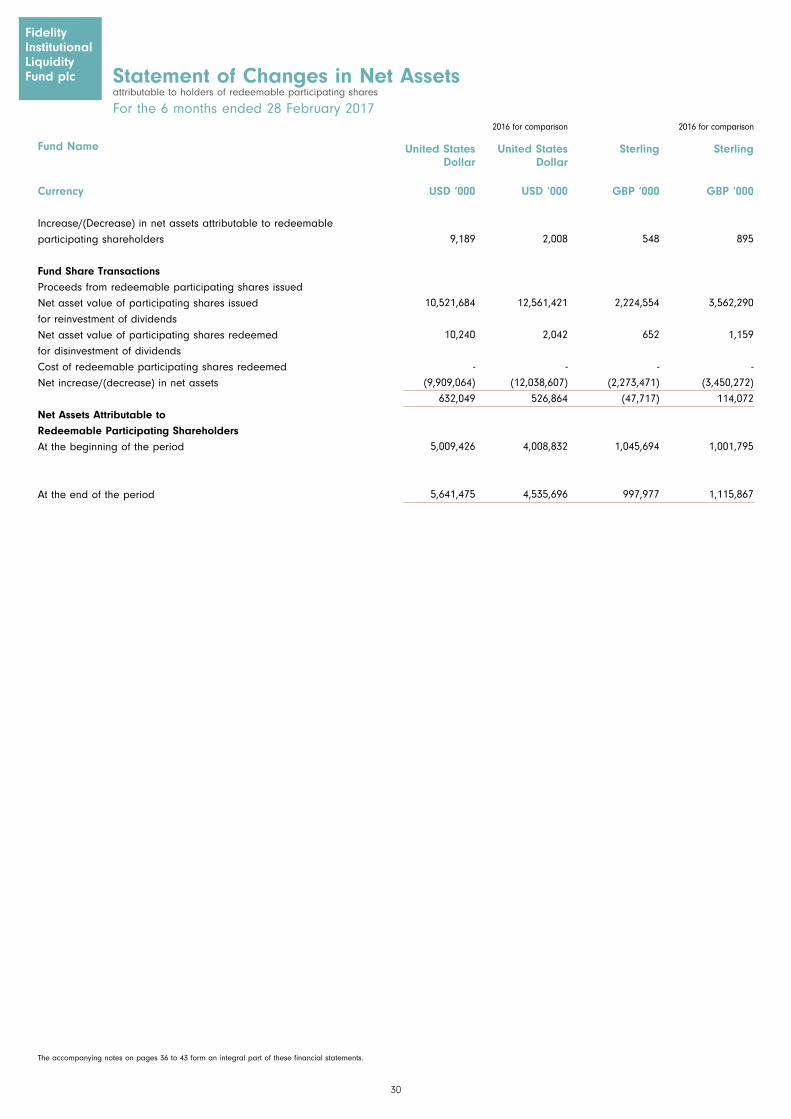
Fund Name
Currency
Increase/(Decrease) in net assets attributable to redeemable
participating shareholders
Fund Share TransactionsProceeds from redeemable participating shares issued
Net asset value of participating shares issued
for reinvestment of dividends
Net asset value of participating shares redeemed
for disinvestment of dividends
Cost of redeemable participating shares redeemed
Net increase/(decrease) in net assets
Net Assets Attributable toRedeemable Participating ShareholdersAt the beginning of the period
At the end of the period
United States Dollar
USD ‘000
9,189
10,521,684
10,240
-
(9,909,064)
632,049
5,009,426
5,641,475
United States Dollar
USD ‘000
2,008
12,561,421
2,042
-
(12,038,607)
526,864
4,008,832
4,535,696
Sterling
GBP ‘000
548
2,224,554
652
-
(2,273,471)
(47,717)
1,045,694
997,977
Sterling
GBP ‘000
895
3,562,290
1,159
-
(3,450,272)
114,072
1,001,795
1,115,867
The accompanying notes on pages 36 to 43 form an integral part of these financial statements.
30
Statement of Changes in Net Assetsattributable to holders of redeemable participating shares
For the 6 months ended 28 February 2017
FidelityInstitutional Liquidity Fund plc
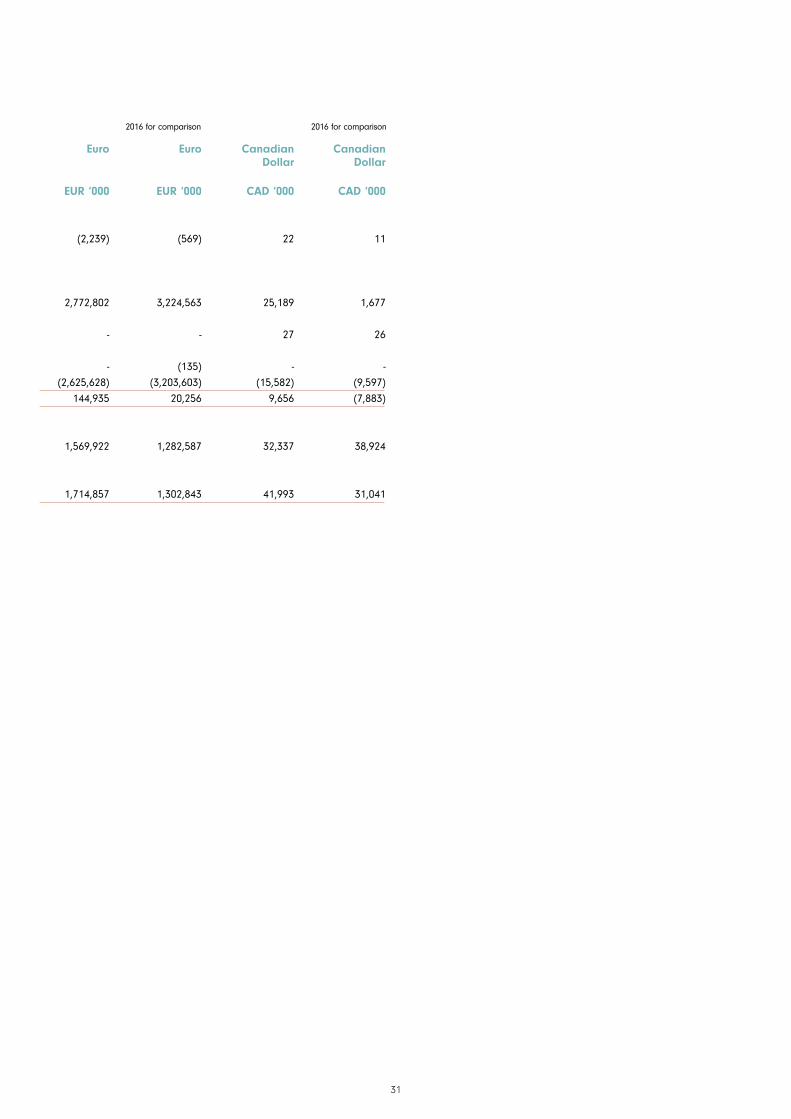
2016 for comparison 2016 for comparison
31
Euro
EUR ‘000
(2,239)
2,772,802
-
-
(2,625,628)
144,935
1,569,922
1,714,857
Euro
EUR ‘000
(569)
3,224,563
-
(135)
(3,203,603)
20,256
1,282,587
1,302,843
Canadian Dollar
CAD ‘000
22
25,189
27
-
(15,582)
9,656
32,337
41,993
Canadian Dollar
CAD ‘000
11
1,677
26
-
(9,597)
(7,883)
38,924
31,041
2016 for comparison 2016 for comparison
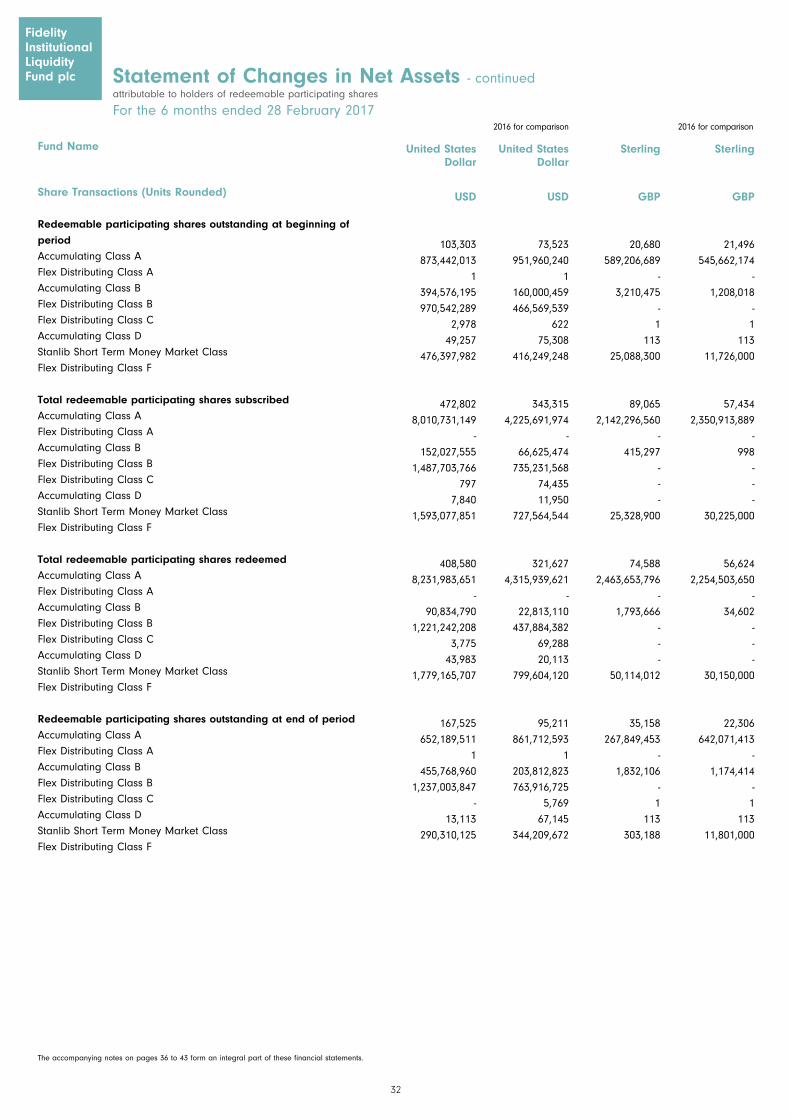
Statement of Changes in Net Assets - continuedattributable to holders of redeemable participating shares
For the 6 months ended 28 February 2017
FidelityInstitutional Liquidity Fund plc
Fund Name
Share Transactions (Units Rounded)
Redeemable participating shares outstanding at beginning of periodAccumulating Class A
Flex Distributing Class A
Accumulating Class B
Flex Distributing Class B
Flex Distributing Class C
Accumulating Class D
Stanlib Short Term Money Market Class
Flex Distributing Class F
Total redeemable participating shares subscribedAccumulating Class A
Flex Distributing Class A
Accumulating Class B
Flex Distributing Class B
Flex Distributing Class C
Accumulating Class D
Stanlib Short Term Money Market Class
Flex Distributing Class F
Total redeemable participating shares redeemedAccumulating Class A
Flex Distributing Class A
Accumulating Class B
Flex Distributing Class B
Flex Distributing Class C
Accumulating Class D
Stanlib Short Term Money Market Class
Flex Distributing Class F
Redeemable participating shares outstanding at end of periodAccumulating Class A
Flex Distributing Class A
Accumulating Class B
Flex Distributing Class B
Flex Distributing Class C
Accumulating Class D
Stanlib Short Term Money Market Class
Flex Distributing Class F
United States Dollar
USD
103,303
873,442,013
1
394,576,195
970,542,289
2,978
49,257
476,397,982
472,802
8,010,731,149
-
152,027,555
1,487,703,766
797
7,840
1,593,077,851
408,580
8,231,983,651
-
90,834,790
1,221,242,208
3,775
43,983
1,779,165,707
167,525
652,189,511
1
455,768,960
1,237,003,847
-
13,113
290,310,125
United States Dollar
USD
73,523
951,960,240
1
160,000,459
466,569,539
622
75,308
416,249,248
343,315
4,225,691,974
-
66,625,474
735,231,568
74,435
11,950
727,564,544
321,627
4,315,939,621
-
22,813,110
437,884,382
69,288
20,113
799,604,120
95,211
861,712,593
1
203,812,823
763,916,725
5,769
67,145
344,209,672
Sterling
GBP
20,680
589,206,689
-
3,210,475
-
1
113
25,088,300
89,065
2,142,296,560
-
415,297
-
-
-
25,328,900
74,588
2,463,653,796
-
1,793,666
-
-
-
50,114,012
35,158
267,849,453
-
1,832,106
-
1
113
303,188
Sterling
GBP
21,496
545,662,174
-
1,208,018
-
1
113
11,726,000
57,434
2,350,913,889
-
998
-
-
-
30,225,000
56,624
2,254,503,650
-
34,602
-
-
-
30,150,000
22,306
642,071,413
-
1,174,414
-
1
113
11,801,000
The accompanying notes on pages 36 to 43 form an integral part of these financial statements.
32
2016 for comparison 2016 for comparison

33
Euro
EUR
72,638
142,339,791
68
3,272,614
-
1
2,396
378,967,443
222,673
662,796,681
43
9,615,667
-
-
199
605,109,716
214,257
629,881,762
66
551,732
-
-
303
616,752,133
81,055
175,254,710
46
12,336,550
-
1
2,292
367,325,026
Euro
EUR
79,397
110,897,029
129
3,097,945
-
1
2,543
23,535,491
174,992
413,165,374
70
682,513
-
-
333
342,927,950
185,031
363,886,314
105
375,958
-
-
367
229,584,093
69,357
160,176,089
95
3,404,500-
-
1
2,510
136,879,348
Canadian Dollar
CAD
409
2,357
-
26,046,021
-
-
-
-
1,316
199,031
-
5,083,654
-
-
-
-
803
-
-
3,537,109
-
-
-
-
922
201,388
-
27,592,566
-
-
-
-
Canadian Dollar
CAD
753
2,064,985
-
25,339,397
-
-
-
-
5
4,411
-
1,618,674
-
-
-
-
588
-
-
594,392
-
-
-
-
170
2,069,396
-
26,363,679
-
-
-
-
2016 for comparison 2016 for comparison
34
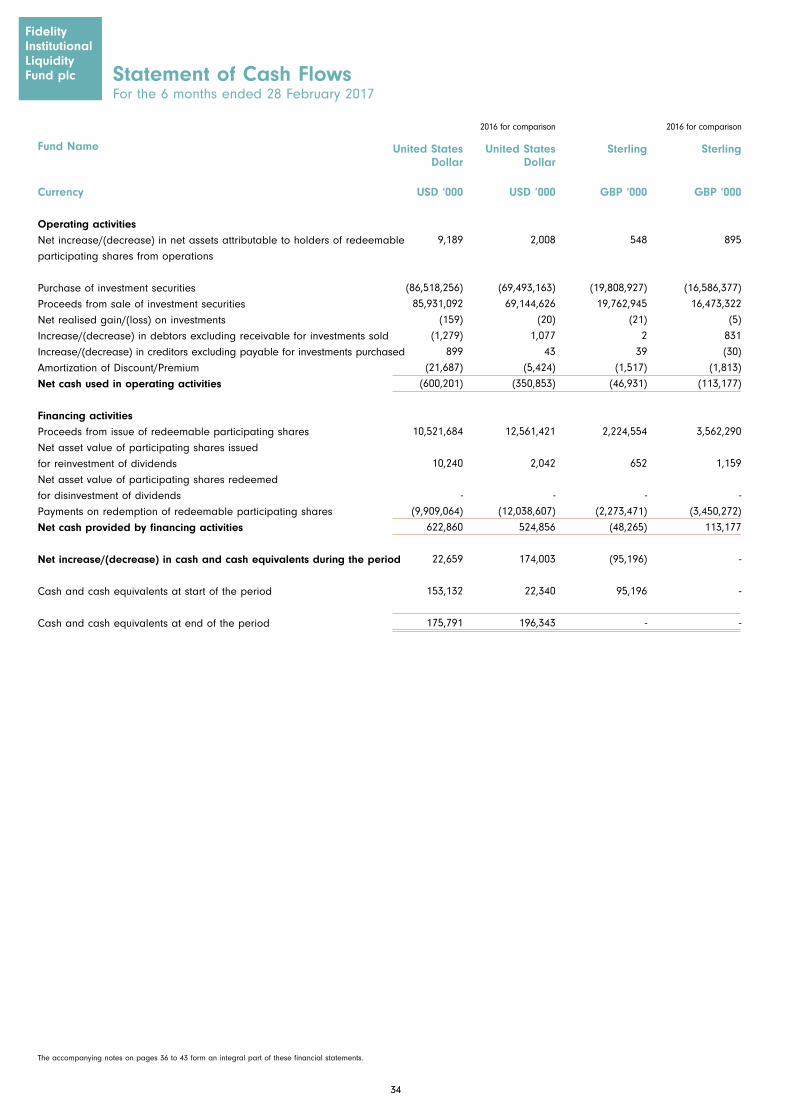
Statement of Cash FlowsFor the 6 months ended 28 February 2017
FidelityInstitutional Liquidity Fund plc
Fund Name
Currency
Operating activitiesNet increase/(decrease) in net assets attributable to holders of redeemable
participating shares from operations
Purchase of investment securities
Proceeds from sale of investment securities
Net realised gain/(loss) on investments
Increase/(decrease) in debtors excluding receivable for investments sold
Increase/(decrease) in creditors excluding payable for investments purchased
Amortization of Discount/Premium
Net cash used in operating activities
Financing activitiesProceeds from issue of redeemable participating shares
Net asset value of participating shares issued
for reinvestment of dividends
Net asset value of participating shares redeemed
for disinvestment of dividends
Payments on redemption of redeemable participating shares
Net cash provided by financing activities
Net increase/(decrease) in cash and cash equivalents during the period
Cash and cash equivalents at start of the period
Cash and cash equivalents at end of the period
United States Dollar
USD ‘000
9,189
(86,518,256)
85,931,092
(159)
(1,279)
899
(21,687)
(600,201)
10,521,684
10,240
-
(9,909,064)
622,860
22,659
153,132
175,791
United States Dollar
USD ‘000
2,008
(69,493,163)
69,144,626
(20)
1,077
43
(5,424)
(350,853)
12,561,421
2,042
-
(12,038,607)
524,856
174,003
22,340
196,343
Sterling
GBP ‘000
548
(19,808,927)
19,762,945
(21)
2
39
(1,517)
(46,931)
2,224,554
652
-
(2,273,471)
(48,265)
(95,196)
95,196
-
Sterling
GBP ‘000
895
(16,586,377)
16,473,322
(5)
831
(30)
(1,813)
(113,177)
3,562,290
1,159
-
(3,450,272)
113,177
-
-
-
The accompanying notes on pages 36 to 43 form an integral part of these financial statements.
34
FidelityInstitutional Liquidity Fund plc
2016 for comparison 2016 for comparison
35
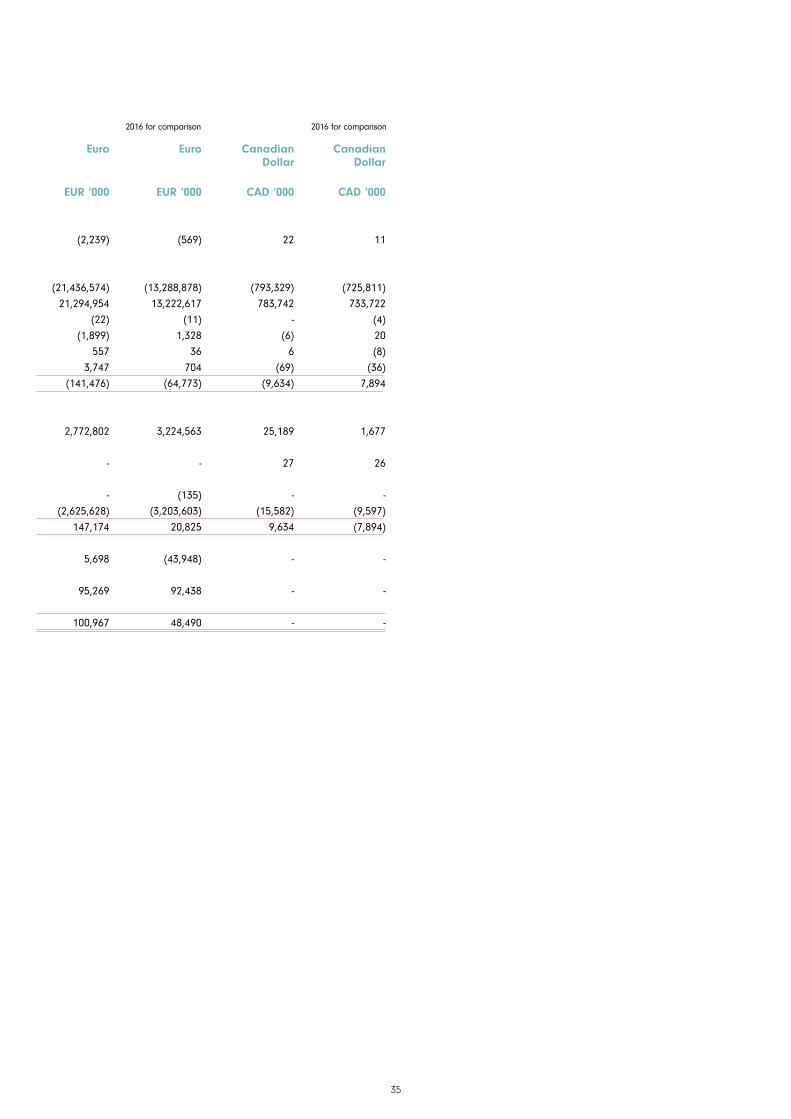
Euro
EUR ‘000
(2,239)
(21,436,574)
21,294,954
(22)
(1,899)
557
3,747
(141,476)
2,772,802
-
-
(2,625,628)
147,174
5,698
95,269
100,967
Euro
EUR ‘000
(569)
(13,288,878)
13,222,617
(11)
1,328
36
704
(64,773)
3,224,563
-
(135)
(3,203,603)
20,825
(43,948)
92,438
48,490
Canadian Dollar
CAD ‘000
22
(793,329)
783,742
-
(6)
6
(69)
(9,634)
25,189
27
-
(15,582)
9,634
-
-
-
Canadian Dollar
CAD ‘000
11
(725,811)
733,722
(4)
20
(8)
(36)
7,894
1,677
26
-
(9,597)
(7,894)
-
-
-
2016 for comparison 2016 for comparison
FidelityInstitutional Liquidity Fund plc
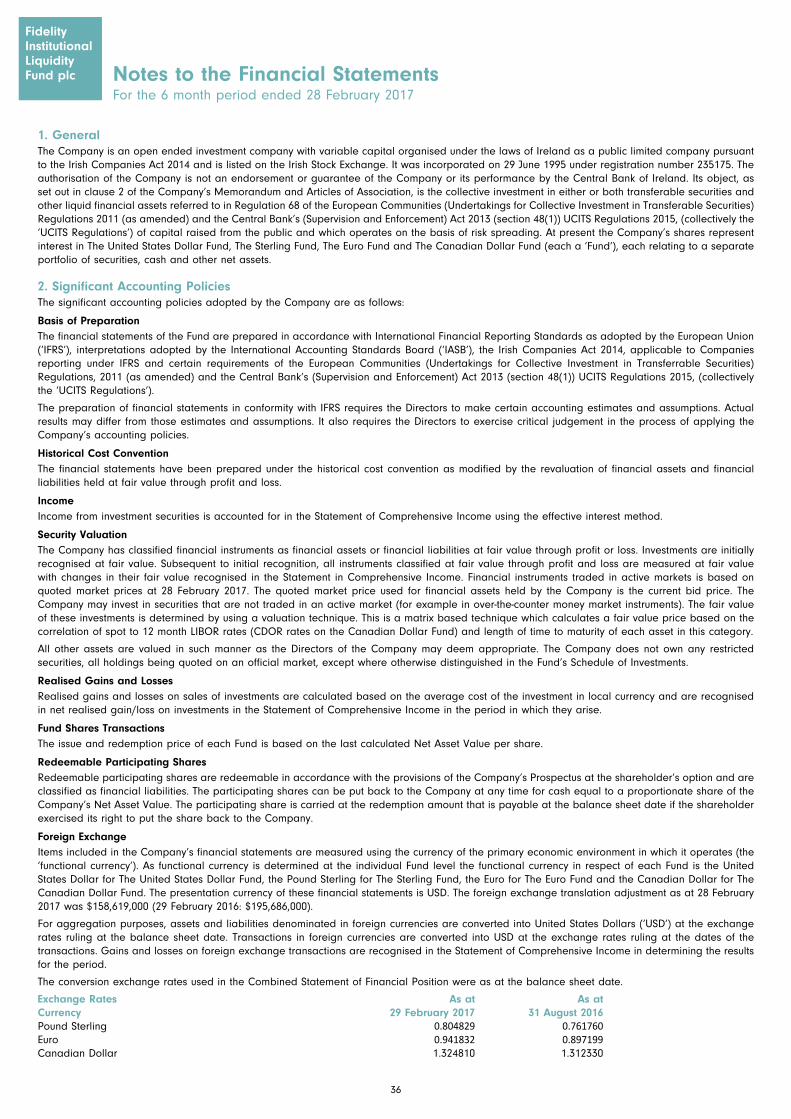
FidelityInstitutional Liquidity Fund plc Notes to the Financial Statements
For the 6 month period ended 28 February 2017
1. GeneralThe Company is an open ended investment company with variable capital organised under the laws of Ireland as a public limited company pursuant to the Irish Companies Act 2014 and is listed on the Irish Stock Exchange. It was incorporated on 29 June 1995 under registration number 235175. The authorisation of the Company is not an endorsement or guarantee of the Company or its performance by the Central Bank of Ireland. Its object, as set out in clause 2 of the Company’s Memorandum and Articles of Association, is the collective investment in either or both transferable securities and other liquid financial assets referred to in Regulation 68 of the European Communities (Undertakings for Collective Investment in Transferable Securities) Regulations 2011 (as amended) and the Central Bank’s (Supervision and Enforcement) Act 2013 (section 48(1)) UCITS Regulations 2015, (collectively the ‘UCITS Regulations’) of capital raised from the public and which operates on the basis of risk spreading. At present the Company’s shares represent interest in The United States Dollar Fund, The Sterling Fund, The Euro Fund and The Canadian Dollar Fund (each a ‘Fund’), each relating to a separate portfolio of securities, cash and other net assets.
2. Significant Accounting PoliciesThe significant accounting policies adopted by the Company are as follows:
Basis of PreparationThe financial statements of the Fund are prepared in accordance with International Financial Reporting Standards as adopted by the European Union (‘IFRS’), interpretations adopted by the International Accounting Standards Board (‘IASB’), the Irish Companies Act 2014, applicable to Companies reporting under IFRS and certain requirements of the European Communities (Undertakings for Collective Investment in Transferrable Securities) Regulations, 2011 (as amended) and the Central Bank’s (Supervision and Enforcement) Act 2013 (section 48(1)) UCITS Regulations 2015, (collectively the ‘UCITS Regulations’).
The preparation of financial statements in conformity with IFRS requires the Directors to make certain accounting estimates and assumptions. Actual results may differ from those estimates and assumptions. It also requires the Directors to exercise critical judgement in the process of applying the Company’s accounting policies.
Historical Cost ConventionThe financial statements have been prepared under the historical cost convention as modified by the revaluation of financial assets and financial liabilities held at fair value through profit and loss.
IncomeIncome from investment securities is accounted for in the Statement of Comprehensive Income using the effective interest method.
Security ValuationThe Company has classified financial instruments as financial assets or financial liabilities at fair value through profit or loss. Investments are initially recognised at fair value. Subsequent to initial recognition, all instruments classified at fair value through profit and loss are measured at fair value with changes in their fair value recognised in the Statement in Comprehensive Income. Financial instruments traded in active markets is based on quoted market prices at 28 February 2017. The quoted market price used for financial assets held by the Company is the current bid price. The Company may invest in securities that are not traded in an active market (for example in over-the-counter money market instruments). The fair value of these investments is determined by using a valuation technique. This is a matrix based technique which calculates a fair value price based on the correlation of spot to 12 month LIBOR rates (CDOR rates on the Canadian Dollar Fund) and length of time to maturity of each asset in this category.
All other assets are valued in such manner as the Directors of the Company may deem appropriate. The Company does not own any restricted securities, all holdings being quoted on an official market, except where otherwise distinguished in the Fund’s Schedule of Investments.
Realised Gains and LossesRealised gains and losses on sales of investments are calculated based on the average cost of the investment in local currency and are recognised in net realised gain/loss on investments in the Statement of Comprehensive Income in the period in which they arise.
Fund Shares TransactionsThe issue and redemption price of each Fund is based on the last calculated Net Asset Value per share.
Redeemable Participating SharesRedeemable participating shares are redeemable in accordance with the provisions of the Company’s Prospectus at the shareholder’s option and are classified as financial liabilities. The participating shares can be put back to the Company at any time for cash equal to a proportionate share of the Company’s Net Asset Value. The participating share is carried at the redemption amount that is payable at the balance sheet date if the shareholder exercised its right to put the share back to the Company.
Foreign ExchangeItems included in the Company’s financial statements are measured using the currency of the primary economic environment in which it operates (the ‘functional currency’). As functional currency is determined at the individual Fund level the functional currency in respect of each Fund is the United States Dollar for The United States Dollar Fund, the Pound Sterling for The Sterling Fund, the Euro for The Euro Fund and the Canadian Dollar for The Canadian Dollar Fund. The presentation currency of these financial statements is USD. The foreign exchange translation adjustment as at 28 February 2017 was $158,619,000 (29 February 2016: $195,686,000).
For aggregation purposes, assets and liabilities denominated in foreign currencies are converted into United States Dollars (‘USD’) at the exchange rates ruling at the balance sheet date. Transactions in foreign currencies are converted into USD at the exchange rates ruling at the dates of the transactions. Gains and losses on foreign exchange transactions are recognised in the Statement of Comprehensive Income in determining the results for the period.
The conversion exchange rates used in the Combined Statement of Financial Position were as at the balance sheet date.
Exchange Rates As at As at Currency 29 February 2017 31 August 2016Pound Sterling 0.804829 0.761760Euro 0.941832 0.897199Canadian Dollar 1.324810 1.312330
36
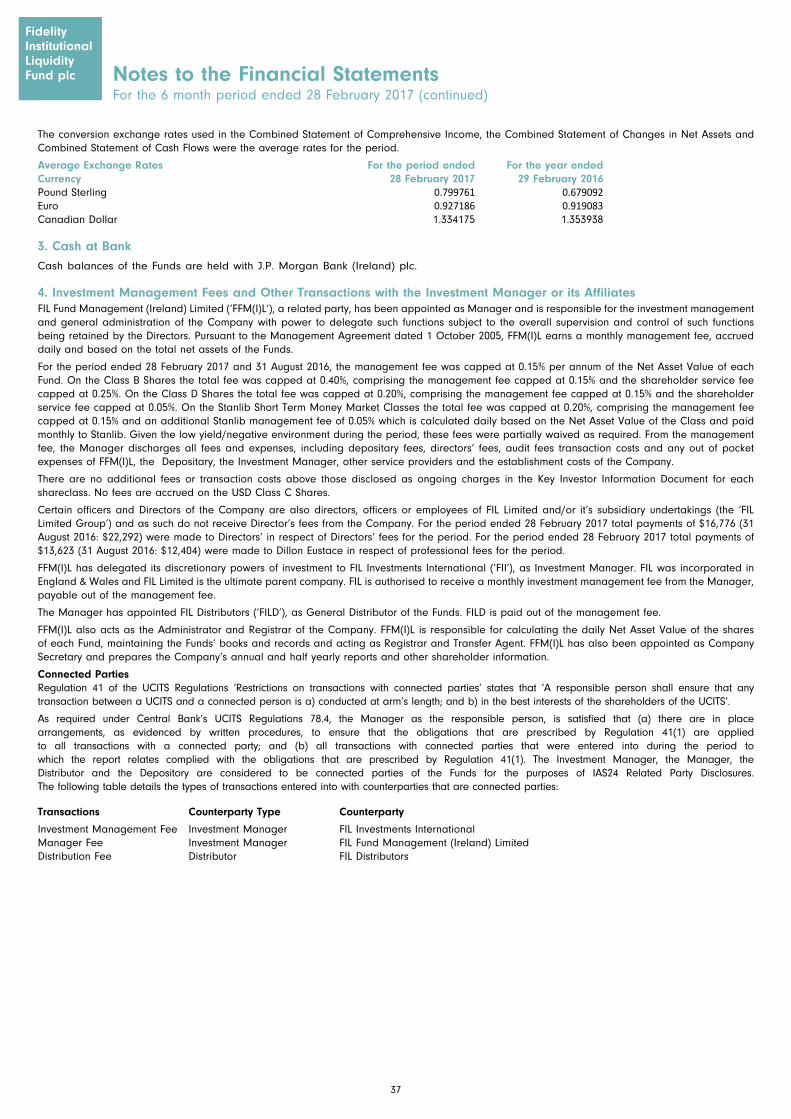
The conversion exchange rates used in the Combined Statement of Comprehensive Income, the Combined Statement of Changes in Net Assets and Combined Statement of Cash Flows were the average rates for the period.
Average Exchange Rates For the period ended For the year ended Currency 28 February 2017 29 February 2016Pound Sterling 0.799761 0.679092Euro 0.927186 0.919083Canadian Dollar 1.334175 1.353938
3. Cash at Bank
Cash balances of the Funds are held with J.P. Morgan Bank (Ireland) plc.
4. Investment Management Fees and Other Transactions with the Investment Manager or its AffiliatesFIL Fund Management (Ireland) Limited (‘FFM(I)L’), a related party, has been appointed as Manager and is responsible for the investment management and general administration of the Company with power to delegate such functions subject to the overall supervision and control of such functions being retained by the Directors. Pursuant to the Management Agreement dated 1 October 2005, FFM(I)L earns a monthly management fee, accrued daily and based on the total net assets of the Funds.
For the period ended 28 February 2017 and 31 August 2016, the management fee was capped at 0.15% per annum of the Net Asset Value of each Fund. On the Class B Shares the total fee was capped at 0.40%, comprising the management fee capped at 0.15% and the shareholder service fee capped at 0.25%. On the Class D Shares the total fee was capped at 0.20%, comprising the management fee capped at 0.15% and the shareholder service fee capped at 0.05%. On the Stanlib Short Term Money Market Classes the total fee was capped at 0.20%, comprising the management fee capped at 0.15% and an additional Stanlib management fee of 0.05% which is calculated daily based on the Net Asset Value of the Class and paid monthly to Stanlib. Given the low yield/negative environment during the period, these fees were partially waived as required. From the management fee, the Manager discharges all fees and expenses, including depositary fees, directors’ fees, audit fees transaction costs and any out of pocket expenses of FFM(I)L, the Depositary, the Investment Manager, other service providers and the establishment costs of the Company.
There are no additional fees or transaction costs above those disclosed as ongoing charges in the Key Investor Information Document for each shareclass. No fees are accrued on the USD Class C Shares.
Certain officers and Directors of the Company are also directors, officers or employees of FIL Limited and/or it’s subsidiary undertakings (the ‘FIL Limited Group’) and as such do not receive Director’s fees from the Company. For the period ended 28 February 2017 total payments of $16,776 (31 August 2016: $22,292) were made to Directors’ in respect of Directors’ fees for the period. For the period ended 28 February 2017 total payments of $13,623 (31 August 2016: $12,404) were made to Dillon Eustace in respect of professional fees for the period.
FFM(I)L has delegated its discretionary powers of investment to FIL Investments International (‘FII’), as Investment Manager. FIL was incorporated in England & Wales and FIL Limited is the ultimate parent company. FIL is authorised to receive a monthly investment management fee from the Manager, payable out of the management fee.
The Manager has appointed FIL Distributors (‘FILD’), as General Distributor of the Funds. FILD is paid out of the management fee.
FFM(I)L also acts as the Administrator and Registrar of the Company. FFM(I)L is responsible for calculating the daily Net Asset Value of the shares of each Fund, maintaining the Funds’ books and records and acting as Registrar and Transfer Agent. FFM(I)L has also been appointed as Company Secretary and prepares the Company’s annual and half yearly reports and other shareholder information.
Connected Parties Regulation 41 of the UCITS Regulations ‘Restrictions on transactions with connected parties’ states that ‘A responsible person shall ensure that any transaction between a UCITS and a connected person is a) conducted at arm’s length; and b) in the best interests of the shareholders of the UCITS’.
As required under Central Bank’s UCITS Regulations 78.4, the Manager as the responsible person, is satisfied that (a) there are in place arrangements, as evidenced by written procedures, to ensure that the obligations that are prescribed by Regulation 41(1) are applied to all transactions with a connected party; and (b) all transactions with connected parties that were entered into during the period to which the report relates complied with the obligations that are prescribed by Regulation 41(1). The Investment Manager, the Manager, the Distributor and the Depository are considered to be connected parties of the Funds for the purposes of IAS24 Related Party Disclosures. The following table details the types of transactions entered into with counterparties that are connected parties:
Transactions Counterparty Type Counterparty
Investment Management Fee Investment Manager FIL Investments InternationalManager Fee Investment Manager FIL Fund Management (Ireland) LimitedDistribution Fee Distributor FIL Distributors
FidelityInstitutional Liquidity Fund plc
FidelityInstitutional Liquidity Fund plc Notes to the Financial Statements
For the 6 month period ended 28 February 2017 (continued)
37
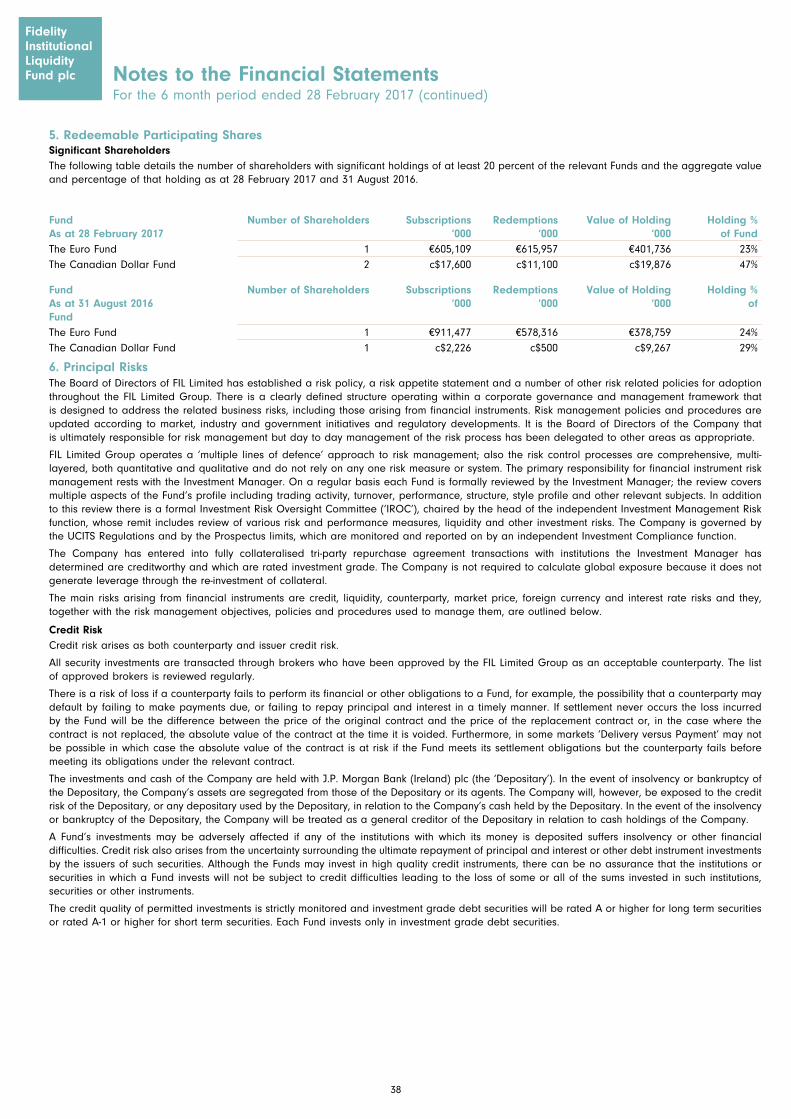
FidelityInstitutional Liquidity Fund plc Notes to the Financial Statements
For the 6 month period ended 28 February 2017 (continued)
FidelityInstitutional Liquidity Fund plc
5. Redeemable Participating Shares Significant ShareholdersThe following table details the number of shareholders with significant holdings of at least 20 percent of the relevant Funds and the aggregate value and percentage of that holding as at 28 February 2017 and 31 August 2016.
Fund Number of Shareholders Subscriptions Redemptions Value of Holding Holding % As at 28 February 2017 ‘000 ‘000 ‘000 of FundThe Euro Fund 1 €605,109 €615,957 €401,736 23%The Canadian Dollar Fund 2 c$17,600 c$11,100 c$19,876 47%
Fund Number of Shareholders Subscriptions Redemptions Value of Holding Holding % As at 31 August 2016 ‘000 ‘000 ‘000 of Fund The Euro Fund 1 €911,477 €578,316 €378,759 24%The Canadian Dollar Fund 1 c$2,226 c$500 c$9,267 29%
6. Principal RisksThe Board of Directors of FIL Limited has established a risk policy, a risk appetite statement and a number of other risk related policies for adoption throughout the FIL Limited Group. There is a clearly defined structure operating within a corporate governance and management framework that is designed to address the related business risks, including those arising from financial instruments. Risk management policies and procedures are updated according to market, industry and government initiatives and regulatory developments. It is the Board of Directors of the Company that is ultimately responsible for risk management but day to day management of the risk process has been delegated to other areas as appropriate.
FIL Limited Group operates a ‘multiple lines of defence’ approach to risk management; also the risk control processes are comprehensive, multi- layered, both quantitative and qualitative and do not rely on any one risk measure or system. The primary responsibility for financial instrument risk management rests with the Investment Manager. On a regular basis each Fund is formally reviewed by the Investment Manager; the review covers multiple aspects of the Fund’s profile including trading activity, turnover, performance, structure, style profile and other relevant subjects. In addition to this review there is a formal Investment Risk Oversight Committee (‘IROC’), chaired by the head of the independent Investment Management Risk function, whose remit includes review of various risk and performance measures, liquidity and other investment risks. The Company is governed by the UCITS Regulations and by the Prospectus limits, which are monitored and reported on by an independent Investment Compliance function.
The Company has entered into fully collateralised tri-party repurchase agreement transactions with institutions the Investment Manager has determined are creditworthy and which are rated investment grade. The Company is not required to calculate global exposure because it does not generate leverage through the re-investment of collateral.
The main risks arising from financial instruments are credit, liquidity, counterparty, market price, foreign currency and interest rate risks and they, together with the risk management objectives, policies and procedures used to manage them, are outlined below.
Credit RiskCredit risk arises as both counterparty and issuer credit risk.
All security investments are transacted through brokers who have been approved by the FIL Limited Group as an acceptable counterparty. The list of approved brokers is reviewed regularly.
There is a risk of loss if a counterparty fails to perform its financial or other obligations to a Fund, for example, the possibility that a counterparty may default by failing to make payments due, or failing to repay principal and interest in a timely manner. If settlement never occurs the loss incurred by the Fund will be the difference between the price of the original contract and the price of the replacement contract or, in the case where the contract is not replaced, the absolute value of the contract at the time it is voided. Furthermore, in some markets ‘Delivery versus Payment’ may not be possible in which case the absolute value of the contract is at risk if the Fund meets its settlement obligations but the counterparty fails before meeting its obligations under the relevant contract.
The investments and cash of the Company are held with J.P. Morgan Bank (Ireland) plc (the ‘Depositary’). In the event of insolvency or bankruptcy of the Depositary, the Company’s assets are segregated from those of the Depositary or its agents. The Company will, however, be exposed to the credit risk of the Depositary, or any depositary used by the Depositary, in relation to the Company’s cash held by the Depositary. In the event of the insolvency or bankruptcy of the Depositary, the Company will be treated as a general creditor of the Depositary in relation to cash holdings of the Company.
A Fund’s investments may be adversely affected if any of the institutions with which its money is deposited suffers insolvency or other financial difficulties. Credit risk also arises from the uncertainty surrounding the ultimate repayment of principal and interest or other debt instrument investments by the issuers of such securities. Although the Funds may invest in high quality credit instruments, there can be no assurance that the institutions or securities in which a Fund invests will not be subject to credit difficulties leading to the loss of some or all of the sums invested in such institutions, securities or other instruments.
The credit quality of permitted investments is strictly monitored and investment grade debt securities will be rated A or higher for long term securities or rated A-1 or higher for short term securities. Each Fund invests only in investment grade debt securities.
38
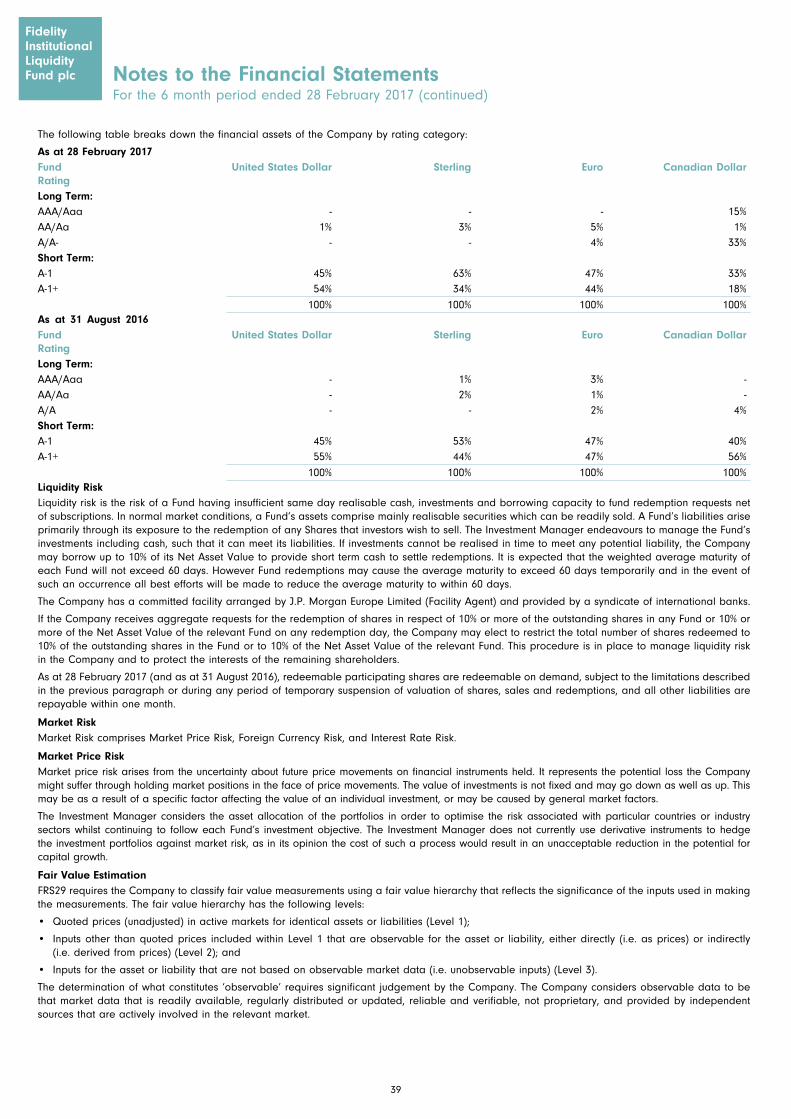
FidelityInstitutional Liquidity Fund plc Notes to the Financial Statements
For the 6 month period ended 28 February 2017 (continued)
FidelityInstitutional Liquidity Fund plc
The following table breaks down the financial assets of the Company by rating category:
As at 28 February 2017Fund United States Dollar Sterling Euro Canadian DollarRating Long Term:AAA/Aaa - - - 15%AA/Aa 1% 3% 5% 1%A/A- - - 4% 33%Short Term: A-1 45% 63% 47% 33%A-1+ 54% 34% 44% 18%
100% 100% 100% 100%As at 31 August 2016Fund United States Dollar Sterling Euro Canadian DollarRating Long Term:AAA/Aaa - 1% 3% -AA/Aa - 2% 1% -A/A - - 2% 4%Short Term: A-1 45% 53% 47% 40%A-1+ 55% 44% 47% 56%
100% 100% 100% 100%Liquidity RiskLiquidity risk is the risk of a Fund having insufficient same day realisable cash, investments and borrowing capacity to fund redemption requests net of subscriptions. In normal market conditions, a Fund’s assets comprise mainly realisable securities which can be readily sold. A Fund’s liabilities arise primarily through its exposure to the redemption of any Shares that investors wish to sell. The Investment Manager endeavours to manage the Fund’s investments including cash, such that it can meet its liabilities. If investments cannot be realised in time to meet any potential liability, the Company may borrow up to 10% of its Net Asset Value to provide short term cash to settle redemptions. It is expected that the weighted average maturity of each Fund will not exceed 60 days. However Fund redemptions may cause the average maturity to exceed 60 days temporarily and in the event of such an occurrence all best efforts will be made to reduce the average maturity to within 60 days.
The Company has a committed facility arranged by J.P. Morgan Europe Limited (Facility Agent) and provided by a syndicate of international banks.
If the Company receives aggregate requests for the redemption of shares in respect of 10% or more of the outstanding shares in any Fund or 10% or more of the Net Asset Value of the relevant Fund on any redemption day, the Company may elect to restrict the total number of shares redeemed to 10% of the outstanding shares in the Fund or to 10% of the Net Asset Value of the relevant Fund. This procedure is in place to manage liquidity risk in the Company and to protect the interests of the remaining shareholders.
As at 28 February 2017 (and as at 31 August 2016), redeemable participating shares are redeemable on demand, subject to the limitations described in the previous paragraph or during any period of temporary suspension of valuation of shares, sales and redemptions, and all other liabilities are repayable within one month.
Market RiskMarket Risk comprises Market Price Risk, Foreign Currency Risk, and Interest Rate Risk.
Market Price RiskMarket price risk arises from the uncertainty about future price movements on financial instruments held. It represents the potential loss the Company might suffer through holding market positions in the face of price movements. The value of investments is not fixed and may go down as well as up. This may be as a result of a specific factor affecting the value of an individual investment, or may be caused by general market factors.
The Investment Manager considers the asset allocation of the portfolios in order to optimise the risk associated with particular countries or industry sectors whilst continuing to follow each Fund’s investment objective. The Investment Manager does not currently use derivative instruments to hedge the investment portfolios against market risk, as in its opinion the cost of such a process would result in an unacceptable reduction in the potential for capital growth.
Fair Value EstimationFRS29 requires the Company to classify fair value measurements using a fair value hierarchy that reflects the significance of the inputs used in making the measurements. The fair value hierarchy has the following levels:
• Quoted prices (unadjusted) in active markets for identical assets or liabilities (Level 1);
• Inputs other than quoted prices included within Level 1 that are observable for the asset or liability, either directly (i.e. as prices) or indirectly (i.e. derived from prices) (Level 2); and
• Inputs for the asset or liability that are not based on observable market data (i.e. unobservable inputs) (Level 3).
The determination of what constitutes ‘observable’ requires significant judgement by the Company. The Company considers observable data to be that market data that is readily available, regularly distributed or updated, reliable and verifiable, not proprietary, and provided by independent sources that are actively involved in the relevant market.
39
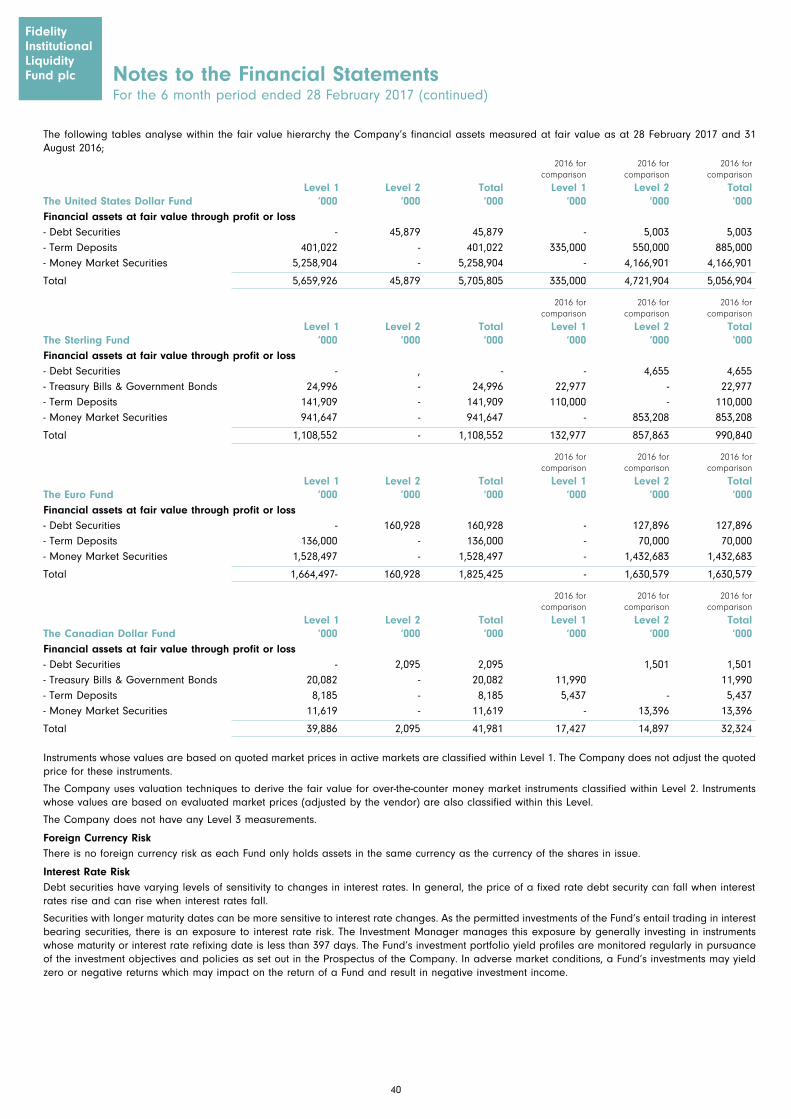
FidelityInstitutional Liquidity Fund plc Notes to the Financial Statements
For the 6 month period ended 28 February 2017 (continued)
FidelityInstitutional Liquidity Fund plc
The following tables analyse within the fair value hierarchy the Company’s financial assets measured at fair value as at 28 February 2017 and 31 August 2016; 2016 for 2016 for 2016 for comparison comparison comparison
Level 1 Level 2 Total Level 1 Level 2 TotalThe United States Dollar Fund ‘000 ‘000 ‘000 ‘000 ‘000 ‘000Financial assets at fair value through profit or loss - Debt Securities - 45,879 45,879 - 5,003 5,003- Term Deposits 401,022 - 401,022 335,000 550,000 885,000- Money Market Securities 5,258,904 - 5,258,904 - 4,166,901 4,166,901
Total 5,659,926 45,879 5,705,805 335,000 4,721,904 5,056,904
2016 for 2016 for 2016 for comparison comparison comparison
Level 1 Level 2 Total Level 1 Level 2 TotalThe Sterling Fund ‘000 ‘000 ‘000 ‘000 ‘000 ‘000Financial assets at fair value through profit or loss - Debt Securities - , - - 4,655 4,655- Treasury Bills & Government Bonds 24,996 - 24,996 22,977 - 22,977- Term Deposits 141,909 - 141,909 110,000 - 110,000- Money Market Securities 941,647 - 941,647 - 853,208 853,208
Total 1,108,552 - 1,108,552 132,977 857,863 990,840
2016 for 2016 for 2016 for comparison comparison comparison
Level 1 Level 2 Total Level 1 Level 2 TotalThe Euro Fund ‘000 ‘000 ‘000 ‘000 ‘000 ‘000Financial assets at fair value through profit or loss - Debt Securities - 160,928 160,928 - 127,896 127,896- Term Deposits 136,000 - 136,000 - 70,000 70,000- Money Market Securities 1,528,497 - 1,528,497 - 1,432,683 1,432,683
Total 1,664,497- 160,928 1,825,425 - 1,630,579 1,630,579
2016 for 2016 for 2016 for comparison comparison comparison
Level 1 Level 2 Total Level 1 Level 2 TotalThe Canadian Dollar Fund ‘000 ‘000 ‘000 ‘000 ‘000 ‘000Financial assets at fair value through profit or loss - Debt Securities - 2,095 2,095 1,501 1,501- Treasury Bills & Government Bonds 20,082 - 20,082 11,990 11,990 - Term Deposits 8,185 - 8,185 5,437 - 5,437- Money Market Securities 11,619 - 11,619 - 13,396 13,396
Total 39,886 2,095 41,981 17,427 14,897 32,324
Instruments whose values are based on quoted market prices in active markets are classified within Level 1. The Company does not adjust the quoted price for these instruments.
The Company uses valuation techniques to derive the fair value for over-the-counter money market instruments classified within Level 2. Instruments whose values are based on evaluated market prices (adjusted by the vendor) are also classified within this Level.
The Company does not have any Level 3 measurements.
Foreign Currency RiskThere is no foreign currency risk as each Fund only holds assets in the same currency as the currency of the shares in issue.
Interest Rate RiskDebt securities have varying levels of sensitivity to changes in interest rates. In general, the price of a fixed rate debt security can fall when interest rates rise and can rise when interest rates fall.
Securities with longer maturity dates can be more sensitive to interest rate changes. As the permitted investments of the Fund’s entail trading in interest bearing securities, there is an exposure to interest rate risk. The Investment Manager manages this exposure by generally investing in instruments whose maturity or interest rate refixing date is less than 397 days. The Fund’s investment portfolio yield profiles are monitored regularly in pursuance of the investment objectives and policies as set out in the Prospectus of the Company. In adverse market conditions, a Fund’s investments may yield zero or negative returns which may impact on the return of a Fund and result in negative investment income.
40
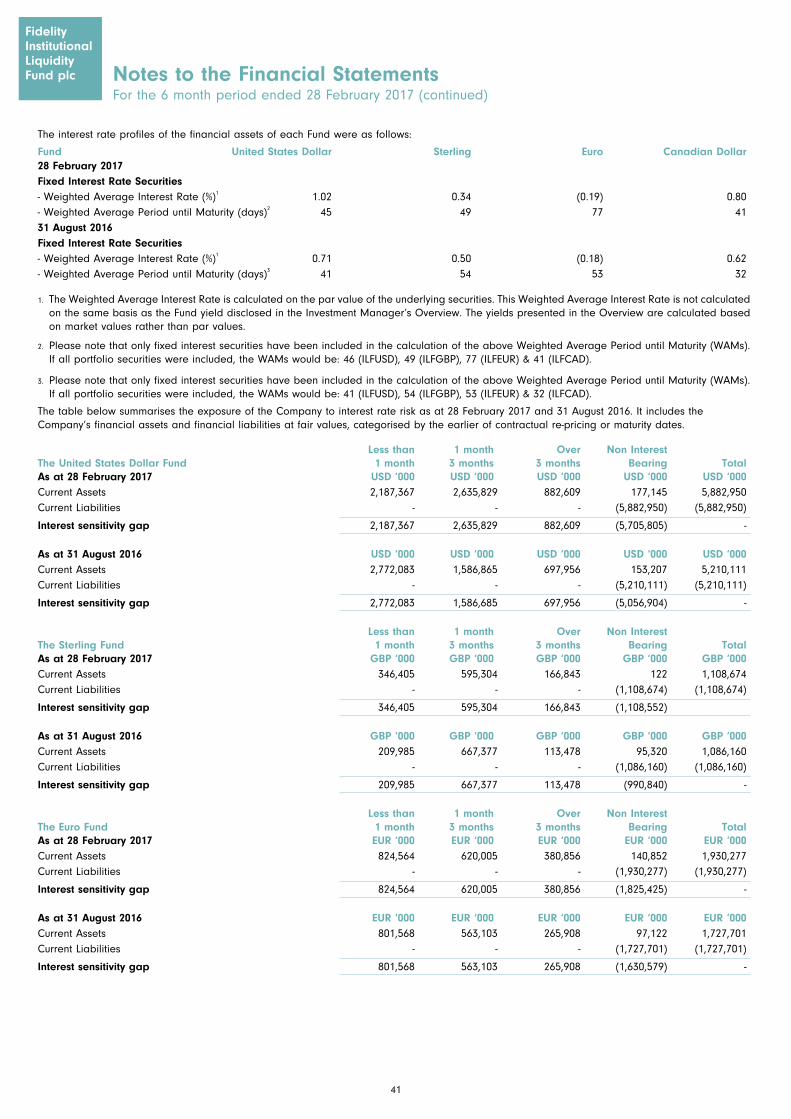
FidelityInstitutional Liquidity Fund plc Notes to the Financial Statements
For the 6 month period ended 28 February 2017 (continued)
FidelityInstitutional Liquidity Fund plc
The interest rate profiles of the financial assets of each Fund were as follows:
Fund United States Dollar Sterling Euro Canadian Dollar28 February 2017Fixed Interest Rate Securities - Weighted Average Interest Rate (%)1 1.02 0.34 (0.19) 0.80- Weighted Average Period until Maturity (days)2 45 49 77 4131 August 2016Fixed Interest Rate Securities - Weighted Average Interest Rate (%)1 0.71 0.50 (0.18) 0.62- Weighted Average Period until Maturity (days)3 41 54 53 32
1. The Weighted Average Interest Rate is calculated on the par value of the underlying securities. This Weighted Average Interest Rate is not calculated on the same basis as the Fund yield disclosed in the Investment Manager’s Overview. The yields presented in the Overview are calculated based on market values rather than par values.
2. Please note that only fixed interest securities have been included in the calculation of the above Weighted Average Period until Maturity (WAMs). If all portfolio securities were included, the WAMs would be: 46 (ILFUSD), 49 (ILFGBP), 77 (ILFEUR) & 41 (ILFCAD).
3. Please note that only fixed interest securities have been included in the calculation of the above Weighted Average Period until Maturity (WAMs). If all portfolio securities were included, the WAMs would be: 41 (ILFUSD), 54 (ILFGBP), 53 (ILFEUR) & 32 (ILFCAD).
The table below summarises the exposure of the Company to interest rate risk as at 28 February 2017 and 31 August 2016. It includes the Company’s financial assets and financial liabilities at fair values, categorised by the earlier of contractual re-pricing or maturity dates.
Less than 1 month Over Non Interest The United States Dollar Fund 1 month 3 months 3 months Bearing Total As at 28 February 2017 USD ‘000 USD ‘000 USD ‘000 USD ‘000 USD ‘000Current Assets 2,187,367 2,635,829 882,609 177,145 5,882,950Current Liabilities - - - (5,882,950) (5,882,950)
Interest sensitivity gap 2,187,367 2,635,829 882,609 (5,705,805) -
As at 31 August 2016 USD ‘000 USD ‘000 USD ‘000 USD ‘000 USD ‘000Current Assets 2,772,083 1,586,865 697,956 153,207 5,210,111Current Liabilities - - - (5,210,111) (5,210,111)
Interest sensitivity gap 2,772,083 1,586,685 697,956 (5,056,904) -
Less than 1 month Over Non Interest The Sterling Fund 1 month 3 months 3 months Bearing Total As at 28 February 2017 GBP ‘000 GBP ‘000 GBP ‘000 GBP ‘000 GBP ‘000Current Assets 346,405 595,304 166,843 122 1,108,674Current Liabilities - - - (1,108,674) (1,108,674)
Interest sensitivity gap 346,405 595,304 166,843 (1,108,552)
As at 31 August 2016 GBP ‘000 GBP ‘000 GBP ‘000 GBP ‘000 GBP ‘000Current Assets 209,985 667,377 113,478 95,320 1,086,160Current Liabilities - - - (1,086,160) (1,086,160)
Interest sensitivity gap 209,985 667,377 113,478 (990,840) -
Less than 1 month Over Non Interest The Euro Fund 1 month 3 months 3 months Bearing Total As at 28 February 2017 EUR ‘000 EUR ‘000 EUR ‘000 EUR ‘000 EUR ‘000Current Assets 824,564 620,005 380,856 140,852 1,930,277Current Liabilities - - - (1,930,277) (1,930,277)
Interest sensitivity gap 824,564 620,005 380,856 (1,825,425) -
As at 31 August 2016 EUR ‘000 EUR ‘000 EUR ‘000 EUR ‘000 EUR ‘000Current Assets 801,568 563,103 265,908 97,122 1,727,701Current Liabilities - - - (1,727,701) (1,727,701)
Interest sensitivity gap 801,568 563,103 265,908 (1,630,579) -
41
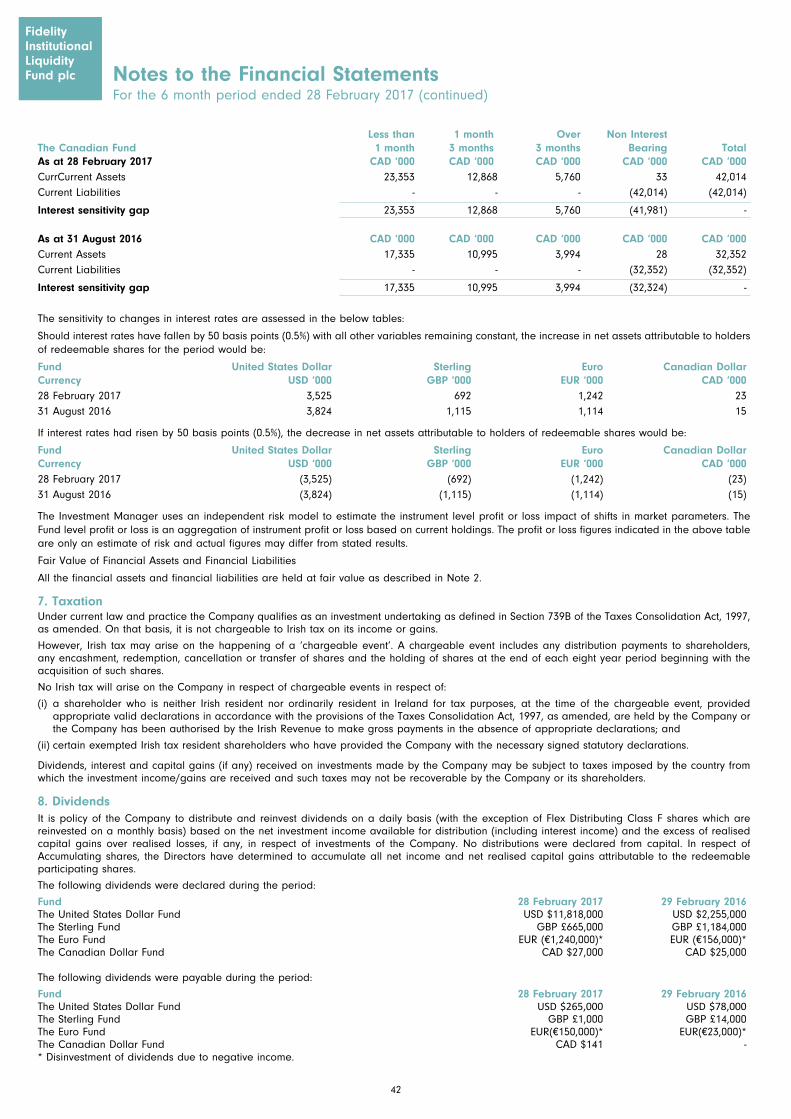
FidelityInstitutional Liquidity Fund plc Notes to the Financial Statements
For the 6 month period ended 28 February 2017 (continued)
FidelityInstitutional Liquidity Fund plc
Less than 1 month Over Non Interest The Canadian Fund 1 month 3 months 3 months Bearing Total As at 28 February 2017 CAD ‘000 CAD ‘000 CAD ‘000 CAD ‘000 CAD ‘000CurrCurrent Assets 23,353 12,868 5,760 33 42,014Current Liabilities - - - (42,014) (42,014)
Interest sensitivity gap 23,353 12,868 5,760 (41,981) -
As at 31 August 2016 CAD ‘000 CAD ‘000 CAD ‘000 CAD ‘000 CAD ‘000Current Assets 17,335 10,995 3,994 28 32,352Current Liabilities - - - (32,352) (32,352)
Interest sensitivity gap 17,335 10,995 3,994 (32,324) -
The sensitivity to changes in interest rates are assessed in the below tables:
Should interest rates have fallen by 50 basis points (0.5%) with all other variables remaining constant, the increase in net assets attributable to holders of redeemable shares for the period would be:
Fund United States Dollar Sterling Euro Canadian Dollar Currency USD ‘000 GBP ‘000 EUR ‘000 CAD ‘00028 February 2017 3,525 692 1,242 2331 August 2016 3,824 1,115 1,114 15
If interest rates had risen by 50 basis points (0.5%), the decrease in net assets attributable to holders of redeemable shares would be:
Fund United States Dollar Sterling Euro Canadian Dollar Currency USD ‘000 GBP ‘000 EUR ‘000 CAD ‘00028 February 2017 (3,525) (692) (1,242) (23)31 August 2016 (3,824) (1,115) (1,114) (15)
The Investment Manager uses an independent risk model to estimate the instrument level profit or loss impact of shifts in market parameters. The Fund level profit or loss is an aggregation of instrument profit or loss based on current holdings. The profit or loss figures indicated in the above table are only an estimate of risk and actual figures may differ from stated results.
Fair Value of Financial Assets and Financial Liabilities
All the financial assets and financial liabilities are held at fair value as described in Note 2.
7. TaxationUnder current law and practice the Company qualifies as an investment undertaking as defined in Section 739B of the Taxes Consolidation Act, 1997, as amended. On that basis, it is not chargeable to Irish tax on its income or gains.
However, Irish tax may arise on the happening of a ‘chargeable event’. A chargeable event includes any distribution payments to shareholders, any encashment, redemption, cancellation or transfer of shares and the holding of shares at the end of each eight year period beginning with the acquisition of such shares.
No Irish tax will arise on the Company in respect of chargeable events in respect of:
(i) a shareholder who is neither Irish resident nor ordinarily resident in Ireland for tax purposes, at the time of the chargeable event, provided appropriate valid declarations in accordance with the provisions of the Taxes Consolidation Act, 1997, as amended, are held by the Company or the Company has been authorised by the Irish Revenue to make gross payments in the absence of appropriate declarations; and
(ii) certain exempted Irish tax resident shareholders who have provided the Company with the necessary signed statutory declarations.
Dividends, interest and capital gains (if any) received on investments made by the Company may be subject to taxes imposed by the country from which the investment income/gains are received and such taxes may not be recoverable by the Company or its shareholders.
8. DividendsIt is policy of the Company to distribute and reinvest dividends on a daily basis (with the exception of Flex Distributing Class F shares which are reinvested on a monthly basis) based on the net investment income available for distribution (including interest income) and the excess of realised capital gains over realised losses, if any, in respect of investments of the Company. No distributions were declared from capital. In respect of Accumulating shares, the Directors have determined to accumulate all net income and net realised capital gains attributable to the redeemable participating shares.
The following dividends were declared during the period:
Fund 28 February 2017 29 February 2016The United States Dollar Fund USD $11,818,000 USD $2,255,000The Sterling Fund GBP £665,000 GBP £1,184,000The Euro Fund EUR (€1,240,000)* EUR (€156,000)*The Canadian Dollar Fund CAD $27,000 CAD $25,000
The following dividends were payable during the period:
Fund 28 February 2017 29 February 2016The United States Dollar Fund USD $265,000 USD $78,000The Sterling Fund GBP £1,000 GBP £14,000The Euro Fund EUR(€150,000)* EUR(€23,000)*The Canadian Dollar Fund CAD $141 -* Disinvestment of dividends due to negative income.
42
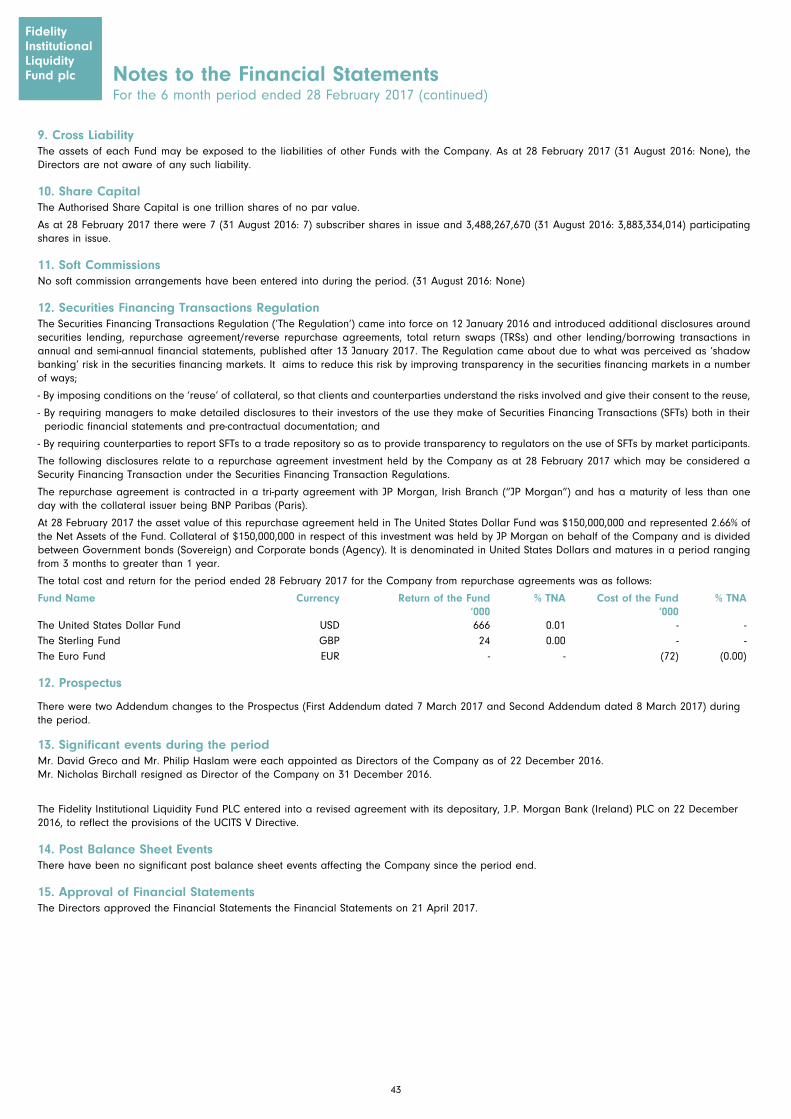
9. Cross LiabilityThe assets of each Fund may be exposed to the liabilities of other Funds with the Company. As at 28 February 2017 (31 August 2016: None), the Directors are not aware of any such liability.
10. Share CapitalThe Authorised Share Capital is one trillion shares of no par value.
As at 28 February 2017 there were 7 (31 August 2016: 7) subscriber shares in issue and 3,488,267,670 (31 August 2016: 3,883,334,014) participating shares in issue.
11. Soft CommissionsNo soft commission arrangements have been entered into during the period. (31 August 2016: None)
12. Securities Financing Transactions RegulationThe Securities Financing Transactions Regulation (’The Regulation’) came into force on 12 January 2016 and introduced additional disclosures around securities lending, repurchase agreement/reverse repurchase agreements, total return swaps (TRSs) and other lending/borrowing transactions in annual and semi-annual financial statements, published after 13 January 2017. The Regulation came about due to what was perceived as ‘shadow banking’ risk in the securities financing markets. It aims to reduce this risk by improving transparency in the securities financing markets in a number of ways;
- By imposing conditions on the ‘reuse’ of collateral, so that clients and counterparties understand the risks involved and give their consent to the reuse,
- By requiring managers to make detailed disclosures to their investors of the use they make of Securities Financing Transactions (SFTs) both in theirperiodic financial statements and pre-contractual documentation; and
- By requiring counterparties to report SFTs to a trade repository so as to provide transparency to regulators on the use of SFTs by market participants.
The following disclosures relate to a repurchase agreement investment held by the Company as at 28 February 2017 which may be considered a Security Financing Transaction under the Securities Financing Transaction Regulations.
The repurchase agreement is contracted in a tri-party agreement with JP Morgan, Irish Branch (“JP Morgan”) and has a maturity of less than one day with the collateral issuer being BNP Paribas (Paris).
At 28 February 2017 the asset value of this repurchase agreement held in The United States Dollar Fund was $150,000,000 and represented 2.66% of the Net Assets of the Fund. Collateral of $150,000,000 in respect of this investment was held by JP Morgan on behalf of the Company and is divided between Government bonds (Sovereign) and Corporate bonds (Agency). It is denominated in United States Dollars and matures in a period ranging from 3 months to greater than 1 year.
The total cost and return for the period ended 28 February 2017 for the Company from repurchase agreements was as follows:
Fund Name Currency Return of the Fund % TNA Cost of the Fund % TNA‘000 ‘000
The United States Dollar Fund USD 666 0.01 - -The Sterling Fund GBP 24 0.00 - -The Euro Fund EUR - - (72) (0.00)
12. Prospectus
There were two Addendum changes to the Prospectus (First Addendum dated 7 March 2017 and Second Addendum dated 8 March 2017) during the period.
13. Significant events during the periodMr. David Greco and Mr. Philip Haslam were each appointed as Directors of the Company as of 22 December 2016. Mr. Nicholas Birchall resigned as Director of the Company on 31 December 2016.
The Fidelity Institutional Liquidity Fund PLC entered into a revised agreement with its depositary, J.P. Morgan Bank (Ireland) PLC on 22 December 2016, to reflect the provisions of the UCITS V Directive.
14. Post Balance Sheet EventsThere have been no significant post balance sheet events affecting the Company since the period end.
15. Approval of Financial StatementsThe Directors approved the Financial Statements the Financial Statements on 21 April 2017.
FidelityInstitutional Liquidity Fund plc
FidelityInstitutional Liquidity Fund plc Notes to the Financial Statements
For the 6 month period ended 28 February 2017 (continued)
43
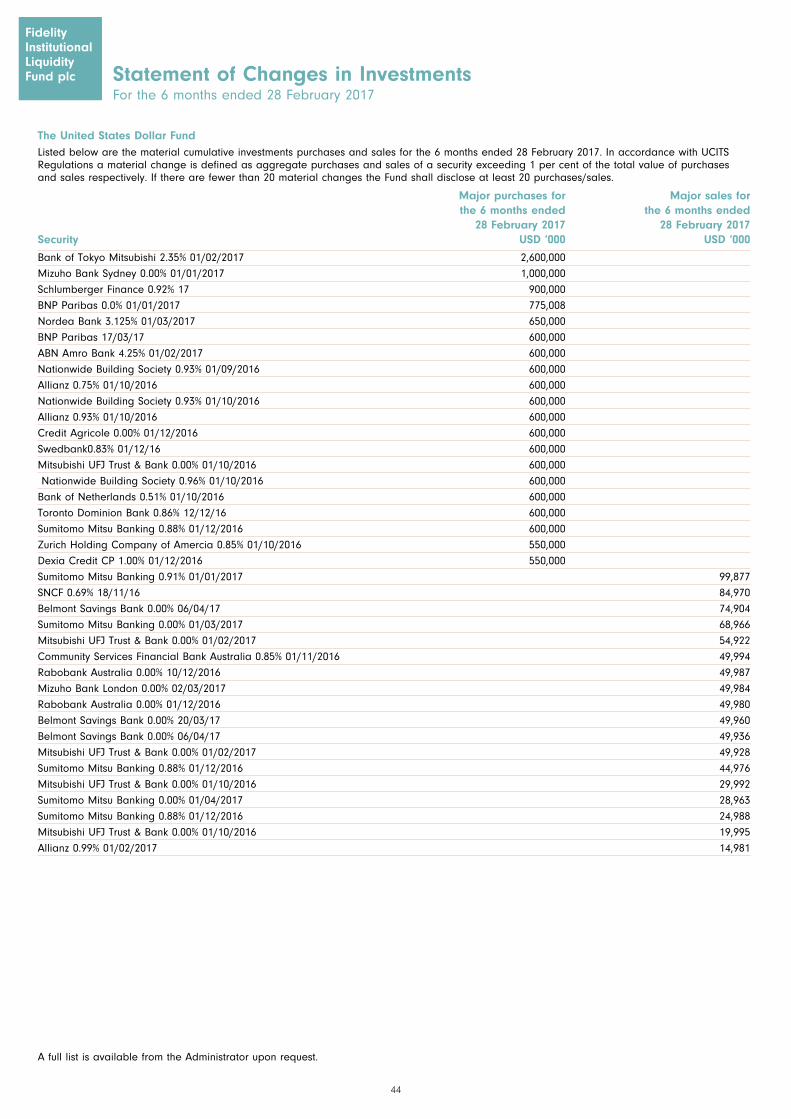
44
The United States Dollar Fund
Major purchases for Major sales for the year ended the year ended 31 August 2016 31 August 2016 Security USD ‘000 USD ‘000
FidelityInstitutional Liquidity Fund plc Statement of Changes in Investments
For the 6 months ended 28 February 2017
The United States Dollar Fund Listed below are the material cumulative investments purchases and sales for the 6 months ended 28 February 2017. In accordance with UCITS Regulations a material change is defined as aggregate purchases and sales of a security exceeding 1 per cent of the total value of purchases and sales respectively. If there are fewer than 20 material changes the Fund shall disclose at least 20 purchases/sales.
Major purchases for Major sales for the 6 months ended the 6 months ended 28 February 2017 28 February 2017 Security USD ‘000 USD ‘000
FidelityInstitutional Liquidity Fund plc
Bank of Tokyo Mitsubishi 2.35% 01/02/2017 2,600,000
Mizuho Bank Sydney 0.00% 01/01/2017 1,000,000
Schlumberger Finance 0.92% 17 900,000
BNP Paribas 0.0% 01/01/2017 775,008
Nordea Bank 3.125% 01/03/2017 650,000
BNP Paribas 17/03/17 600,000
ABN Amro Bank 4.25% 01/02/2017 600,000
Nationwide Building Society 0.93% 01/09/2016 600,000
Allianz 0.75% 01/10/2016 600,000
Nationwide Building Society 0.93% 01/10/2016 600,000
Allianz 0.93% 01/10/2016 600,000
Credit Agricole 0.00% 01/12/2016 600,000
Swedbank0.83% 01/12/16 600,000
Mitsubishi UFJ Trust & Bank 0.00% 01/10/2016 600,000
Nationwide Building Society 0.96% 01/10/2016 600,000
Bank of Netherlands 0.51% 01/10/2016 600,000
Toronto Dominion Bank 0.86% 12/12/16 600,000
Sumitomo Mitsu Banking 0.88% 01/12/2016 600,000
Zurich Holding Company of Amercia 0.85% 01/10/2016 550,000
Dexia Credit CP 1.00% 01/12/2016 550,000
Sumitomo Mitsu Banking 0.91% 01/01/2017 99,877
SNCF 0.69% 18/11/16 84,970
Belmont Savings Bank 0.00% 06/04/17 74,904
Sumitomo Mitsu Banking 0.00% 01/03/2017 68,966
Mitsubishi UFJ Trust & Bank 0.00% 01/02/2017 54,922
Community Services Financial Bank Australia 0.85% 01/11/2016 49,994
Rabobank Australia 0.00% 10/12/2016 49,987
Mizuho Bank London 0.00% 02/03/2017 49,984
Rabobank Australia 0.00% 01/12/2016 49,980
Belmont Savings Bank 0.00% 20/03/17 49,960
Belmont Savings Bank 0.00% 06/04/17 49,936
Mitsubishi UFJ Trust & Bank 0.00% 01/02/2017 49,928
Sumitomo Mitsu Banking 0.88% 01/12/2016 44,976
Mitsubishi UFJ Trust & Bank 0.00% 01/10/2016 29,992
Sumitomo Mitsu Banking 0.00% 01/04/2017 28,963
Sumitomo Mitsu Banking 0.88% 01/12/2016 24,988
Mitsubishi UFJ Trust & Bank 0.00% 01/10/2016 19,995
Allianz 0.99% 01/02/2017 14,981
A full list is available from the Administrator upon request.
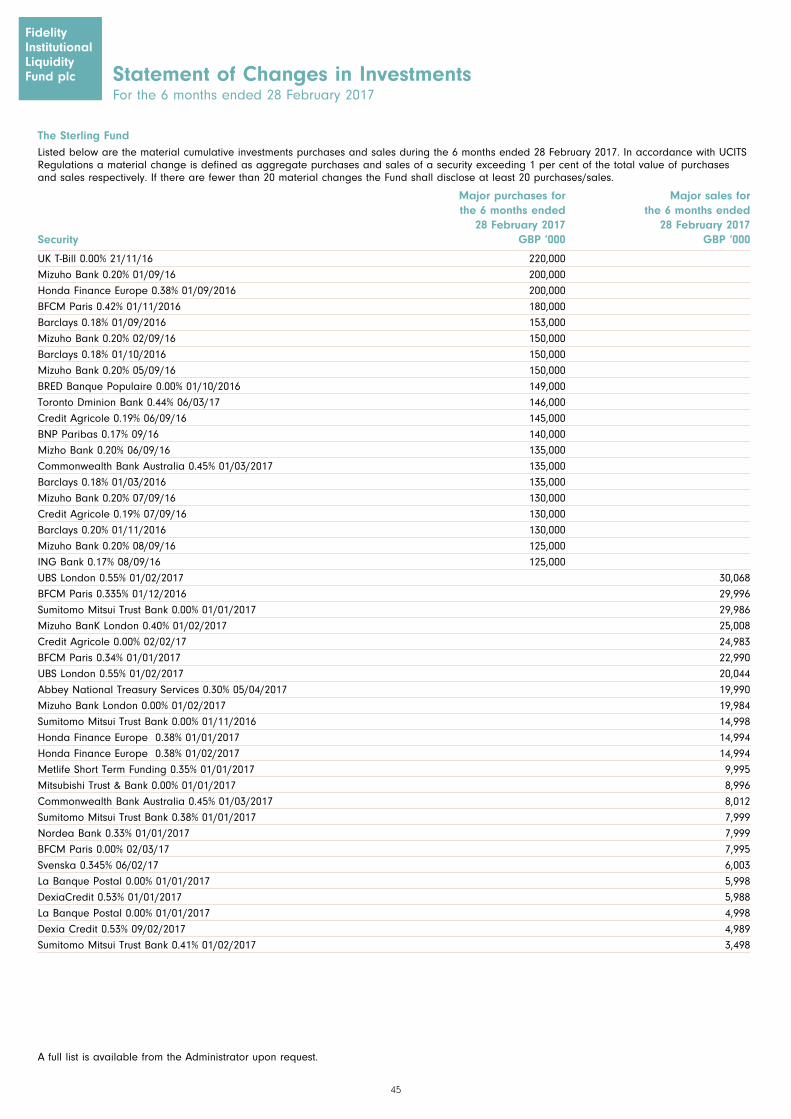
45
The Sterling Fund
Major purchases for Major sales for the year ended the year ended 31 August 2016 31 August 2016 Security GBP ‘000 GBP ‘000
FidelityInstitutional Liquidity Fund plc Statement of Changes in Investments
For the 6 months ended 28 February 2017
FidelityInstitutional Liquidity Fund plc
UK T-Bill 0.00% 21/11/16 220,000
Mizuho Bank 0.20% 01/09/16 200,000
Honda Finance Europe 0.38% 01/09/2016 200,000
BFCM Paris 0.42% 01/11/2016 180,000
Barclays 0.18% 01/09/2016 153,000
Mizuho Bank 0.20% 02/09/16 150,000
Barclays 0.18% 01/10/2016 150,000
Mizuho Bank 0.20% 05/09/16 150,000
BRED Banque Populaire 0.00% 01/10/2016 149,000
Toronto Dminion Bank 0.44% 06/03/17 146,000
Credit Agricole 0.19% 06/09/16 145,000
BNP Paribas 0.17% 09/16 140,000
Mizho Bank 0.20% 06/09/16 135,000
Commonwealth Bank Australia 0.45% 01/03/2017 135,000
Barclays 0.18% 01/03/2016 135,000
Mizuho Bank 0.20% 07/09/16 130,000
Credit Agricole 0.19% 07/09/16 130,000
Barclays 0.20% 01/11/2016 130,000
Mizuho Bank 0.20% 08/09/16 125,000
ING Bank 0.17% 08/09/16 125,000
UBS London 0.55% 01/02/2017 30,068
BFCM Paris 0.335% 01/12/2016 29,996
Sumitomo Mitsui Trust Bank 0.00% 01/01/2017 29,986
Mizuho BanK London 0.40% 01/02/2017 25,008
Credit Agricole 0.00% 02/02/17 24,983
BFCM Paris 0.34% 01/01/2017 22,990
UBS London 0.55% 01/02/2017 20,044
Abbey National Treasury Services 0.30% 05/04/2017 19,990
Mizuho Bank London 0.00% 01/02/2017 19,984
Sumitomo Mitsui Trust Bank 0.00% 01/11/2016 14,998
Honda Finance Europe 0.38% 01/01/2017 14,994
Honda Finance Europe 0.38% 01/02/2017 14,994
Metlife Short Term Funding 0.35% 01/01/2017 9,995
Mitsubishi Trust & Bank 0.00% 01/01/2017 8,996
Commonwealth Bank Australia 0.45% 01/03/2017 8,012
Sumitomo Mitsui Trust Bank 0.38% 01/01/2017 7,999
Nordea Bank 0.33% 01/01/2017 7,999
BFCM Paris 0.00% 02/03/17 7,995
Svenska 0.345% 06/02/17 6,003
La Banque Postal 0.00% 01/01/2017 5,998
DexiaCredit 0.53% 01/01/2017 5,988
La Banque Postal 0.00% 01/01/2017 4,998
Dexia Credit 0.53% 09/02/2017 4,989
Sumitomo Mitsui Trust Bank 0.41% 01/02/2017 3,498
A full list is available from the Administrator upon request.
The Sterling Fund Listed below are the material cumulative investments purchases and sales during the 6 months ended 28 February 2017. In accordance with UCITS Regulations a material change is defined as aggregate purchases and sales of a security exceeding 1 per cent of the total value of purchases and sales respectively. If there are fewer than 20 material changes the Fund shall disclose at least 20 purchases/sales.
Major purchases for Major sales for the 6 months ended the 6 months ended 28 February 2017 28 February 2017 Security GBP ‘000 GBP ‘000
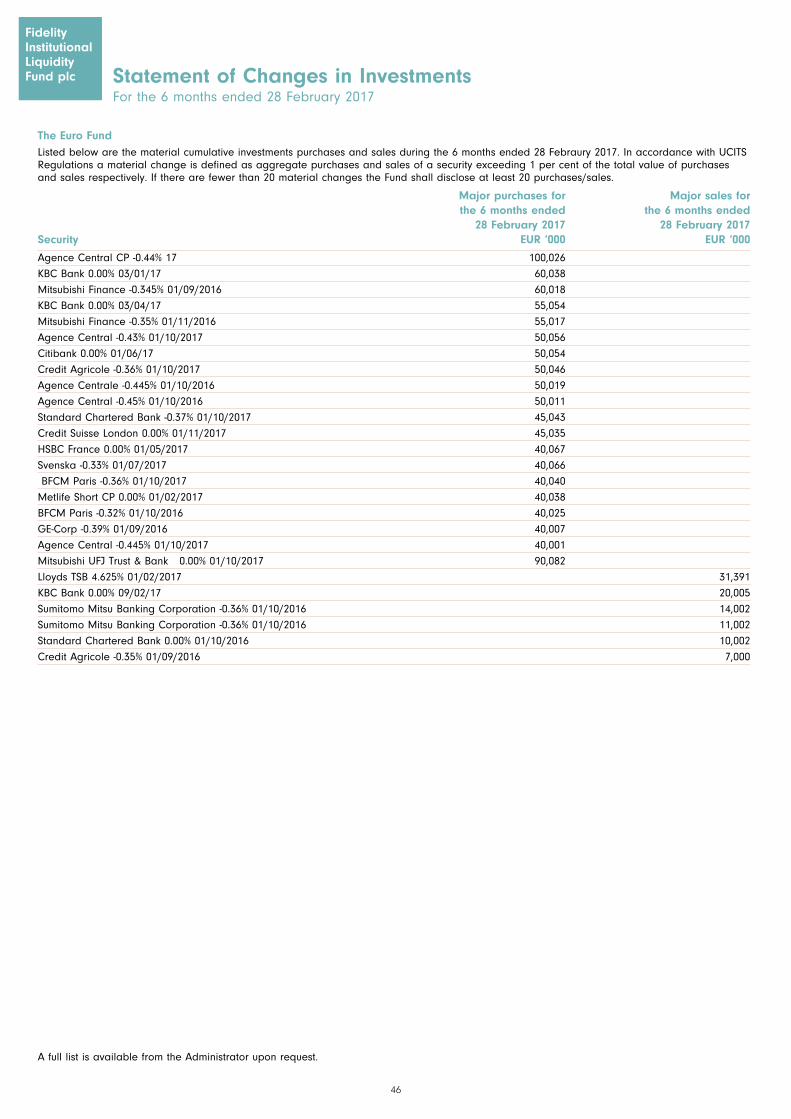
46
The Euro Fund
Major purchases for Major sales for the year ended the year ended 31 August 2016 31 August 2016 Security EUR ‘000 EUR ‘000
Statement of Changes in InvestmentsFor the 6 months ended 28 February 2017
FidelityInstitutional Liquidity Fund plc
FidelityInstitutional Liquidity Fund plc
Agence Central CP -0.44% 17 100,026
KBC Bank 0.00% 03/01/17 60,038
Mitsubishi Finance -0.345% 01/09/2016 60,018
KBC Bank 0.00% 03/04/17 55,054
Mitsubishi Finance -0.35% 01/11/2016 55,017
Agence Central -0.43% 01/10/2017 50,056
Citibank 0.00% 01/06/17 50,054
Credit Agricole -0.36% 01/10/2017 50,046
Agence Centrale -0.445% 01/10/2016 50,019
Agence Central -0.45% 01/10/2016 50,011
Standard Chartered Bank -0.37% 01/10/2017 45,043
Credit Suisse London 0.00% 01/11/2017 45,035
HSBC France 0.00% 01/05/2017 40,067
Svenska -0.33% 01/07/2017 40,066
BFCM Paris -0.36% 01/10/2017 40,040
Metlife Short CP 0.00% 01/02/2017 40,038
BFCM Paris -0.32% 01/10/2016 40,025
GE-Corp -0.39% 01/09/2016 40,007
Agence Central -0.445% 01/10/2017 40,001
Mitsubishi UFJ Trust & Bank 0.00% 01/10/2017 90,082
Lloyds TSB 4.625% 01/02/2017 31,391
KBC Bank 0.00% 09/02/17 20,005
Sumitomo Mitsu Banking Corporation -0.36% 01/10/2016 14,002
Sumitomo Mitsu Banking Corporation -0.36% 01/10/2016 11,002
Standard Chartered Bank 0.00% 01/10/2016 10,002
Credit Agricole -0.35% 01/09/2016 7,000
A full list is available from the Administrator upon request.
The Euro Fund Listed below are the material cumulative investments purchases and sales during the 6 months ended 28 Febraury 2017. In accordance with UCITS Regulations a material change is defined as aggregate purchases and sales of a security exceeding 1 per cent of the total value of purchases and sales respectively. If there are fewer than 20 material changes the Fund shall disclose at least 20 purchases/sales.
Major purchases for Major sales for the 6 months ended the 6 months ended 28 February 2017 28 February 2017 Security EUR ‘000 EUR ‘000
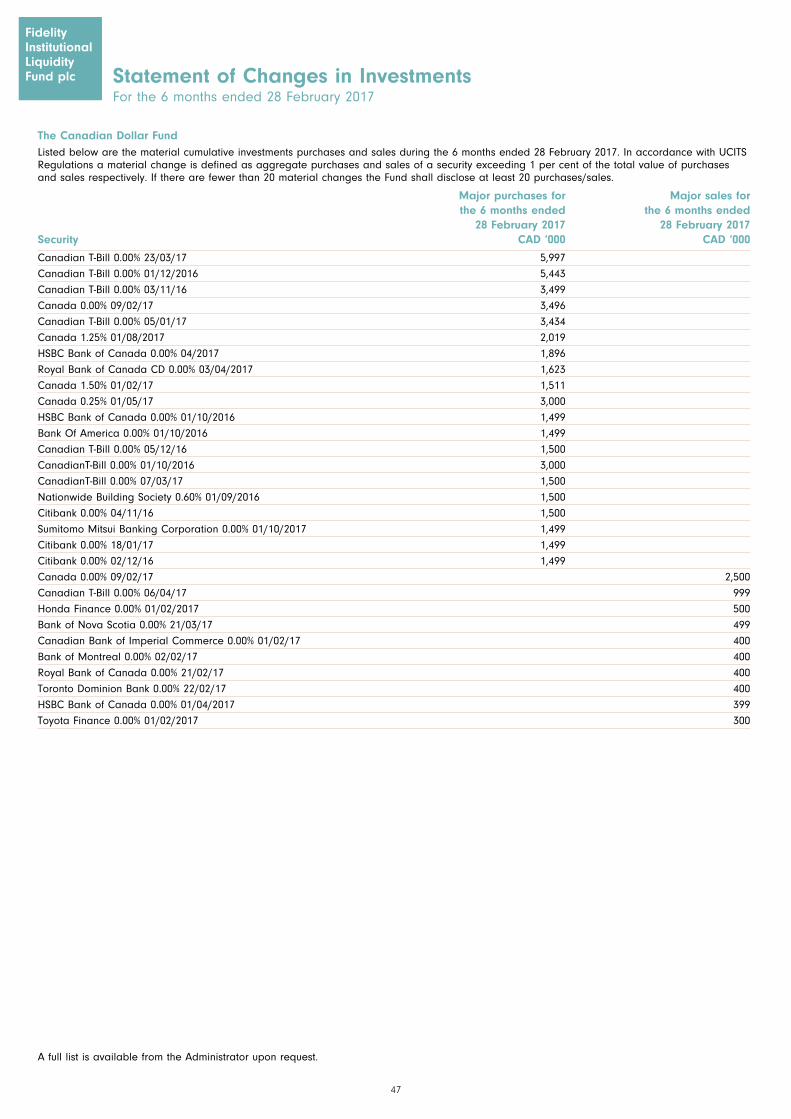
47
The Canadian Dollar Fund
Major purchases for Major sales for the year ended the year ended 31 August 2016 31 August 2016 Security CAD ‘000 CAD ‘000
Statement of Changes in InvestmentsFor the 6 months ended 28 February 2017
FidelityInstitutional Liquidity Fund plc
FidelityInstitutional Liquidity Fund plc
Canadian T-Bill 0.00% 23/03/17 5,997
Canadian T-Bill 0.00% 01/12/2016 5,443
Canadian T-Bill 0.00% 03/11/16 3,499
Canada 0.00% 09/02/17 3,496
Canadian T-Bill 0.00% 05/01/17 3,434
Canada 1.25% 01/08/2017 2,019
HSBC Bank of Canada 0.00% 04/2017 1,896
Royal Bank of Canada CD 0.00% 03/04/2017 1,623
Canada 1.50% 01/02/17 1,511
Canada 0.25% 01/05/17 3,000
HSBC Bank of Canada 0.00% 01/10/2016 1,499
Bank Of America 0.00% 01/10/2016 1,499
Canadian T-Bill 0.00% 05/12/16 1,500
CanadianT-Bill 0.00% 01/10/2016 3,000
CanadianT-Bill 0.00% 07/03/17 1,500
Nationwide Building Society 0.60% 01/09/2016 1,500
Citibank 0.00% 04/11/16 1,500
Sumitomo Mitsui Banking Corporation 0.00% 01/10/2017 1,499
Citibank 0.00% 18/01/17 1,499
Citibank 0.00% 02/12/16 1,499
Canada 0.00% 09/02/17 2,500
Canadian T-Bill 0.00% 06/04/17 999
Honda Finance 0.00% 01/02/2017 500
Bank of Nova Scotia 0.00% 21/03/17 499
Canadian Bank of Imperial Commerce 0.00% 01/02/17 400
Bank of Montreal 0.00% 02/02/17 400
Royal Bank of Canada 0.00% 21/02/17 400
Toronto Dominion Bank 0.00% 22/02/17 400
HSBC Bank of Canada 0.00% 01/04/2017 399
Toyota Finance 0.00% 01/02/2017 300
A full list is available from the Administrator upon request.
The Canadian Dollar Fund Listed below are the material cumulative investments purchases and sales during the 6 months ended 28 February 2017. In accordance with UCITS Regulations a material change is defined as aggregate purchases and sales of a security exceeding 1 per cent of the total value of purchases and sales respectively. If there are fewer than 20 material changes the Fund shall disclose at least 20 purchases/sales.
Major purchases for Major sales for the 6 months ended the 6 months ended 28 February 2017 28 February 2017 Security CAD ‘000 CAD ‘000
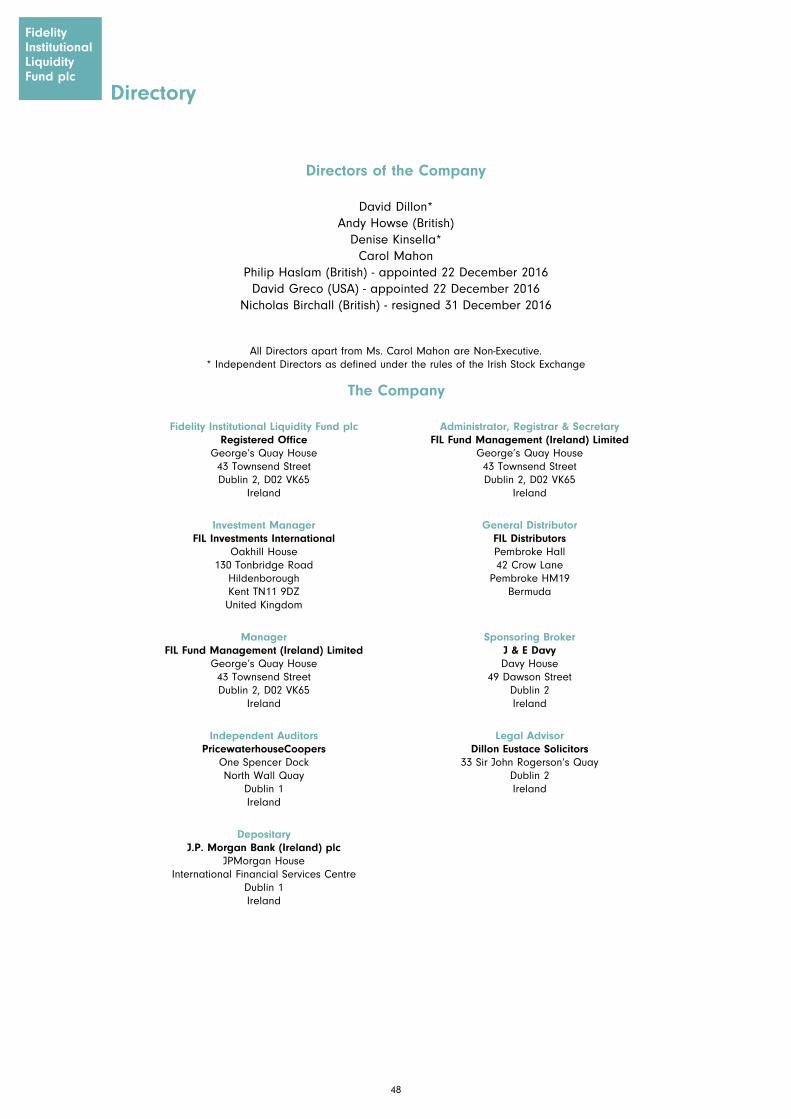
Fidelity Institutional Liquidity Fund plcRegistered Office
George’s Quay House43 Townsend StreetDublin 2, D02 VK65
Ireland
Investment ManagerFIL Investments International
Oakhill House130 Tonbridge Road
HildenboroughKent TN11 9DZUnited Kingdom
ManagerFIL Fund Management (Ireland) Limited
George’s Quay House43 Townsend StreetDublin 2, D02 VK65
Ireland
Independent AuditorsPricewaterhouseCoopers
One Spencer DockNorth Wall Quay
Dublin 1Ireland
DepositaryJ.P. Morgan Bank (Ireland) plc
JPMorgan HouseInternational Financial Services Centre
Dublin 1 Ireland
Administrator, Registrar & SecretaryFIL Fund Management (Ireland) Limited
George’s Quay House43 Townsend StreetDublin 2, D02 VK65
Ireland
General DistributorFIL Distributors Pembroke Hall42 Crow Lane
Pembroke HM19Bermuda
Sponsoring BrokerJ & E DavyDavy House
49 Dawson StreetDublin 2Ireland
Legal AdvisorDillon Eustace Solicitors
33 Sir John Rogerson’s QuayDublin 2Ireland
48
Directory
FidelityInstitutional Liquidity Fund plc
Directors of the Company
Philip Haslam (British) - appointed 22 December 2016
Nicholas Birchall (British) - resigned 31 December 2016David Greco (USA) - appointed 22 December 2016
Denise Kinsella*
David Dillon* Andy Howse (British)
Carol Mahon
All Directors apart from Ms. Carol Mahon are Non-Executive.* Independent Directors as defined under the rules of the Irish Stock Exchange
The Company

Fidelity, Fidelity International, the Fidelity International logo and symbol are trademarks of FIL Limited