Embed Size (px)
Citation preview
1
HALF-YEARLY FINANCIAL REPORT Electrocomponents plc, the leading high service distributor to engineers worldwide, today announces its results for the six months ended 30 September 2010. Strategic initiatives delivering a more than doubling of profits. SUMMARY RESULTS
H1 2010/11 H1 2009/10 Change Revenue £563.3m £447.2m 24.4%(1) Profit before tax £50.5m £24.8m 103.6% Earnings per share 8.0p 3.9p 105.1% Free cash flow £33.6m £42.7m (21.3)% Interim dividend per share 5.0p 5.0p -
(1) Underlying revenue growth, adjusting for currency and trading days Financial Highlights Strong underlying sales growth of 24%, with all regions in double digit growth. Gross margin stable through the first half. Significant cost leverage with operating costs reducing by 5% points of sales to 37%. More than doubling of profit before tax to £50.5m. Return on sales increasing by 3.4% points to 9.5%. Free cash flow of £33.6m representing nearly 100% cash conversion. Strong balance sheet with interest cover of 21.9x and net debt to EBITDA of 1.2x.
Strategic Highlights International business now contributing 70% of Group sales with 30% sales growth in first half. Strong electronics performance with 87% growth in semiconductors (ICs) and 18k new products. Successful launch of DesignSpark, our leading online design tool, with 150k visitors in first 3 months. eCommerce sales growth of 42% led by North America at more than 100%. eCommerce revenue share up from 41% last year to 47%, exiting at 48%. Successful large customer acquisition programme with 19 account wins in the UK and Europe. European mass marketing campaigns driving double digit increase in average order frequency.
CURRENT TRADING AND OUTLOOK Group sales remained strong throughout the half year, growing by 24% in the first quarter and 25% in the second quarter. In October, Group revenue has grown by 21%, the UK by 12% and International by 26%. Within International, Continental Europe has grown by 21%, North America by 38% and Asia Pacific by 21%. We are continuing to invest in our International markets, electronics and eCommerce initiatives in order to drive future sales growth. Whilst recognising the global economic uncertainties and more demanding comparatives in the second half, we believe that the outcome for the year as a whole will be ahead of our previous expectations. IAN MASON, GROUP CHIEF EXECUTIVE, COMMENTED: “These are excellent results reflecting the success of our strategic initiatives which combined with our operating leverage delivered an increase in profits of over 100%. All regions reported significant sales growth, with our Allied business in North America achieving revenue growth of 41%. Our International business now represents 70% of our sales and we will continue with our strategy to exploit the attractive structural growth opportunities in these markets. Electronics was our strongest performing category, reflecting the benefits of our previous and ongoing investment and focus in this area. With 42% sales growth in the period, eCommerce sales now represent around 48% of Group sales and our target of 70% eCommerce revenue share remains on track.”
2
Enquiries:
Ian Mason, Group Chief Executive Electrocomponents plc 020 7567 8000* Simon Boddie, Group Finance Director Electrocomponents plc 020 7567 8000* John Sunnucks/David Allchurch Tulchan Communications Group 020 7353 4200
* Available to 11.00am on 12 November 2010, thereafter 01865 204000. There will be a live audio webcast of the half year results presentation at 9.00am accessible through the Investor Centre page on the Company’s website: www.electrocomponents.com Definitions of terms: Underlying revenue growth: in order to reflect underlying business performance, comparisons of revenue between periods have, unless otherwise stated, been adjusted for exchange rates (where applicable) and the number of trading days. Changes in profit, cash flow, debt and share related measures such as earnings per share are, unless otherwise stated, at reported exchange rates. Headline profit: the term headline profit applies to profit measures which exclude one off items. These excluded items were £nil in the current and comparative half years. For year ended 31 March 2010, the net income excluded from headline profits was £1.6m. Details of these items are given in note 2. Key performance measures such as return on sales and EBITDA use headline profit figures. Sign conventions: % changes in revenue and costs are disclosed as positive if improving profit and negative if reducing profit. Notes to editors: Electrocomponents plc is the leading high service distributor to engineers worldwide. The company which was founded in 1937 is listed on the London Stock Exchange, employs around 5,600 people and has operations in 27 countries, serving another 43 countries through distributors. The Group satisfies the small quantity needs of its customers who are typically electronics or maintenance engineers in business. Electrocomponents sells around half a million products to 1.5m customers over the internet, through catalogues and trade counters. Products include electronics, electrical, mechanical, automation and health and safety components. The offer to engineers is valuable to many of our 2,500 suppliers, who would otherwise find the small order and immediate dispatch requirements of such customers difficult and costly to satisfy. A large number of high quality goods are stocked, which are dispatched the same day that the order is received. The average customer order value is around £100 although the range of order values is wide. The Group’s large number of customers is from a wide range of industry sectors with diverse product demands.
3
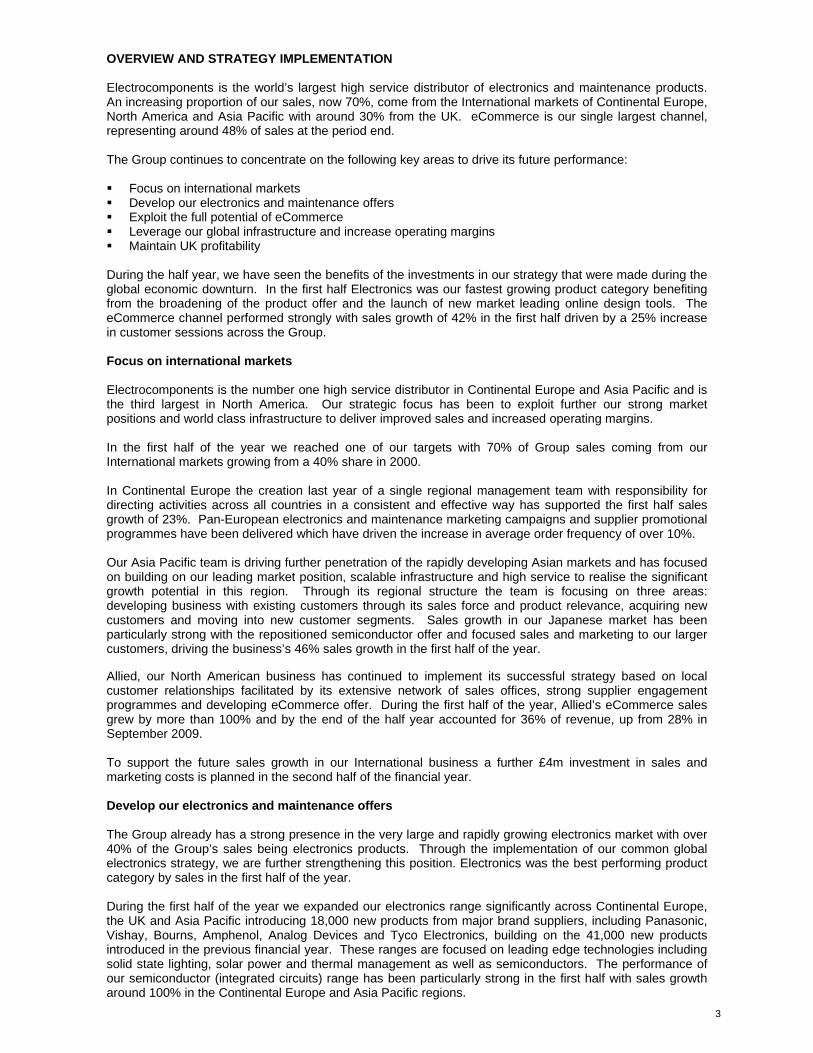
OVERVIEW AND STRATEGY IMPLEMENTATION Electrocomponents is the world’s largest high service distributor of electronics and maintenance products. An increasing proportion of our sales, now 70%, come from the International markets of Continental Europe, North America and Asia Pacific with around 30% from the UK. eCommerce is our single largest channel, representing around 48% of sales at the period end. The Group continues to concentrate on the following key areas to drive its future performance: Focus on international markets Develop our electronics and maintenance offers Exploit the full potential of eCommerce Leverage our global infrastructure and increase operating margins Maintain UK profitability
During the half year, we have seen the benefits of the investments in our strategy that were made during the global economic downturn. In the first half Electronics was our fastest growing product category benefiting from the broadening of the product offer and the launch of new market leading online design tools. The eCommerce channel performed strongly with sales growth of 42% in the first half driven by a 25% increase in customer sessions across the Group. Focus on international markets Electrocomponents is the number one high service distributor in Continental Europe and Asia Pacific and is the third largest in North America. Our strategic focus has been to exploit further our strong market positions and world class infrastructure to deliver improved sales and increased operating margins. In the first half of the year we reached one of our targets with 70% of Group sales coming from our International markets growing from a 40% share in 2000. In Continental Europe the creation last year of a single regional management team with responsibility for directing activities across all countries in a consistent and effective way has supported the first half sales growth of 23%. Pan-European electronics and maintenance marketing campaigns and supplier promotional programmes have been delivered which have driven the increase in average order frequency of over 10%. Our Asia Pacific team is driving further penetration of the rapidly developing Asian markets and has focused on building on our leading market position, scalable infrastructure and high service to realise the significant growth potential in this region. Through its regional structure the team is focusing on three areas: developing business with existing customers through its sales force and product relevance, acquiring new customers and moving into new customer segments. Sales growth in our Japanese market has been particularly strong with the repositioned semiconductor offer and focused sales and marketing to our larger customers, driving the business’s 46% sales growth in the first half of the year. Allied, our North American business has continued to implement its successful strategy based on local customer relationships facilitated by its extensive network of sales offices, strong supplier engagement programmes and developing eCommerce offer. During the first half of the year, Allied’s eCommerce sales grew by more than 100% and by the end of the half year accounted for 36% of revenue, up from 28% in September 2009. To support the future sales growth in our International business a further £4m investment in sales and marketing costs is planned in the second half of the financial year. Develop our electronics and maintenance offers The Group already has a strong presence in the very large and rapidly growing electronics market with over 40% of the Group’s sales being electronics products. Through the implementation of our common global electronics strategy, we are further strengthening this position. Electronics was the best performing product category by sales in the first half of the year. During the first half of the year we expanded our electronics range significantly across Continental Europe, the UK and Asia Pacific introducing 18,000 new products from major brand suppliers, including Panasonic, Vishay, Bourns, Amphenol, Analog Devices and Tyco Electronics, building on the 41,000 new products introduced in the previous financial year. These ranges are focused on leading edge technologies including solid state lighting, solar power and thermal management as well as semiconductors. The performance of our semiconductor (integrated circuits) range has been particularly strong in the first half with sales growth around 100% in the Continental Europe and Asia Pacific regions.
4
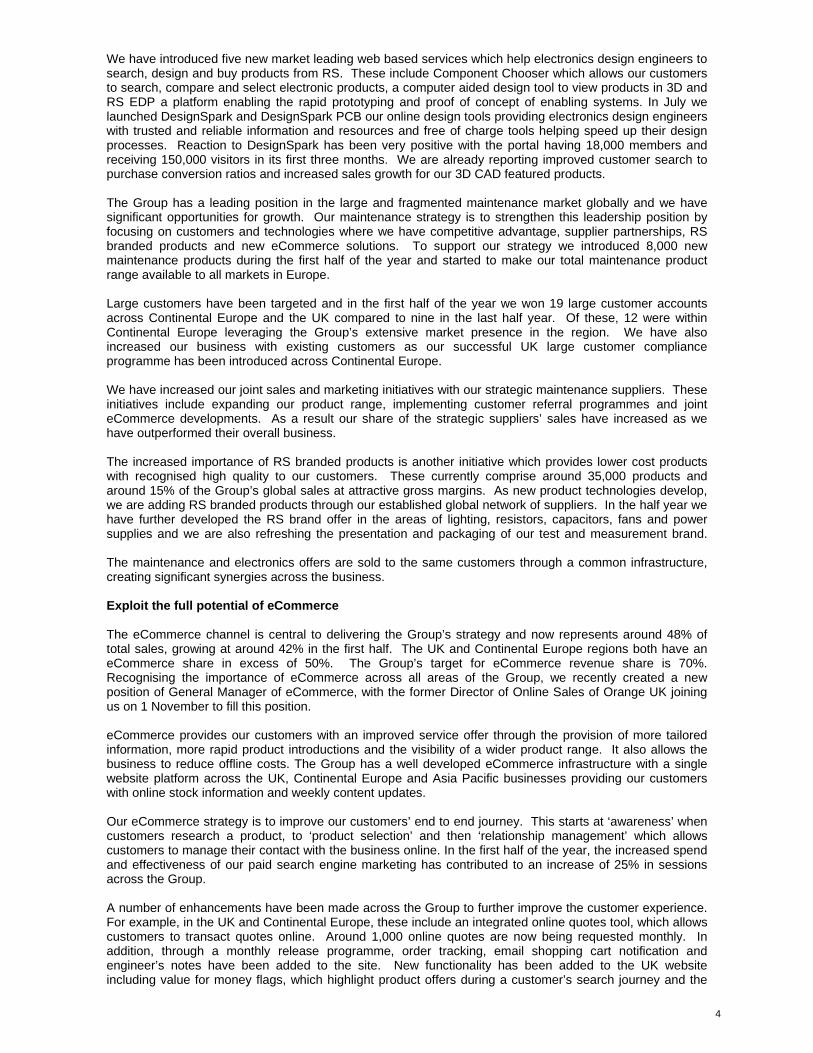
We have introduced five new market leading web based services which help electronics design engineers to search, design and buy products from RS. These include Component Chooser which allows our customers to search, compare and select electronic products, a computer aided design tool to view products in 3D and RS EDP a platform enabling the rapid prototyping and proof of concept of enabling systems. In July we launched DesignSpark and DesignSpark PCB our online design tools providing electronics design engineers with trusted and reliable information and resources and free of charge tools helping speed up their design processes. Reaction to DesignSpark has been very positive with the portal having 18,000 members and receiving 150,000 visitors in its first three months. We are already reporting improved customer search to purchase conversion ratios and increased sales growth for our 3D CAD featured products. The Group has a leading position in the large and fragmented maintenance market globally and we have significant opportunities for growth. Our maintenance strategy is to strengthen this leadership position by focusing on customers and technologies where we have competitive advantage, supplier partnerships, RS branded products and new eCommerce solutions. To support our strategy we introduced 8,000 new maintenance products during the first half of the year and started to make our total maintenance product range available to all markets in Europe. Large customers have been targeted and in the first half of the year we won 19 large customer accounts across Continental Europe and the UK compared to nine in the last half year. Of these, 12 were within Continental Europe leveraging the Group’s extensive market presence in the region. We have also increased our business with existing customers as our successful UK large customer compliance programme has been introduced across Continental Europe. We have increased our joint sales and marketing initiatives with our strategic maintenance suppliers. These initiatives include expanding our product range, implementing customer referral programmes and joint eCommerce developments. As a result our share of the strategic suppliers’ sales have increased as we have outperformed their overall business. The increased importance of RS branded products is another initiative which provides lower cost products with recognised high quality to our customers. These currently comprise around 35,000 products and around 15% of the Group’s global sales at attractive gross margins. As new product technologies develop, we are adding RS branded products through our established global network of suppliers. In the half year we have further developed the RS brand offer in the areas of lighting, resistors, capacitors, fans and power supplies and we are also refreshing the presentation and packaging of our test and measurement brand. The maintenance and electronics offers are sold to the same customers through a common infrastructure, creating significant synergies across the business. Exploit the full potential of eCommerce The eCommerce channel is central to delivering the Group’s strategy and now represents around 48% of total sales, growing at around 42% in the first half. The UK and Continental Europe regions both have an eCommerce share in excess of 50%. The Group’s target for eCommerce revenue share is 70%. Recognising the importance of eCommerce across all areas of the Group, we recently created a new position of General Manager of eCommerce, with the former Director of Online Sales of Orange UK joining us on 1 November to fill this position. eCommerce provides our customers with an improved service offer through the provision of more tailored information, more rapid product introductions and the visibility of a wider product range. It also allows the business to reduce offline costs. The Group has a well developed eCommerce infrastructure with a single website platform across the UK, Continental Europe and Asia Pacific businesses providing our customers with online stock information and weekly content updates. Our eCommerce strategy is to improve our customers’ end to end journey. This starts at ‘awareness’ when customers research a product, to ‘product selection’ and then ‘relationship management’ which allows customers to manage their contact with the business online. In the first half of the year, the increased spend and effectiveness of our paid search engine marketing has contributed to an increase of 25% in sessions across the Group. A number of enhancements have been made across the Group to further improve the customer experience. For example, in the UK and Continental Europe, these include an integrated online quotes tool, which allows customers to transact quotes online. Around 1,000 online quotes are now being requested monthly. In addition, through a monthly release programme, order tracking, email shopping cart notification and engineer’s notes have been added to the site. New functionality has been added to the UK website including value for money flags, which highlight product offers during a customer’s search journey and the
5
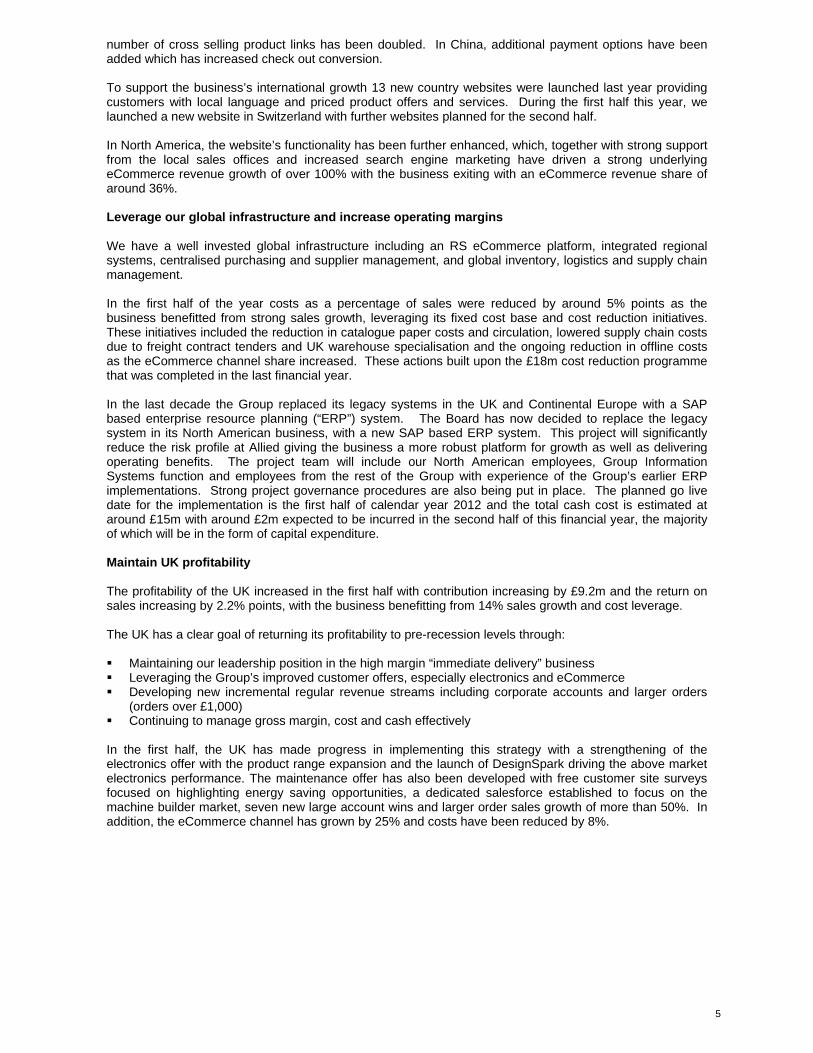
number of cross selling product links has been doubled. In China, additional payment options have been added which has increased check out conversion. To support the business’s international growth 13 new country websites were launched last year providing customers with local language and priced product offers and services. During the first half this year, we launched a new website in Switzerland with further websites planned for the second half. In North America, the website’s functionality has been further enhanced, which, together with strong support from the local sales offices and increased search engine marketing have driven a strong underlying eCommerce revenue growth of over 100% with the business exiting with an eCommerce revenue share of around 36%. Leverage our global infrastructure and increase operating margins We have a well invested global infrastructure including an RS eCommerce platform, integrated regional systems, centralised purchasing and supplier management, and global inventory, logistics and supply chain management. In the first half of the year costs as a percentage of sales were reduced by around 5% points as the business benefitted from strong sales growth, leveraging its fixed cost base and cost reduction initiatives. These initiatives included the reduction in catalogue paper costs and circulation, lowered supply chain costs due to freight contract tenders and UK warehouse specialisation and the ongoing reduction in offline costs as the eCommerce channel share increased. These actions built upon the £18m cost reduction programme that was completed in the last financial year. In the last decade the Group replaced its legacy systems in the UK and Continental Europe with a SAP based enterprise resource planning (“ERP”) system. The Board has now decided to replace the legacy system in its North American business, with a new SAP based ERP system. This project will significantly reduce the risk profile at Allied giving the business a more robust platform for growth as well as delivering operating benefits. The project team will include our North American employees, Group Information Systems function and employees from the rest of the Group with experience of the Group’s earlier ERP implementations. Strong project governance procedures are also being put in place. The planned go live date for the implementation is the first half of calendar year 2012 and the total cash cost is estimated at around £15m with around £2m expected to be incurred in the second half of this financial year, the majority of which will be in the form of capital expenditure. Maintain UK profitability The profitability of the UK increased in the first half with contribution increasing by £9.2m and the return on sales increasing by 2.2% points, with the business benefitting from 14% sales growth and cost leverage. The UK has a clear goal of returning its profitability to pre-recession levels through: Maintaining our leadership position in the high margin “immediate delivery” business Leveraging the Group’s improved customer offers, especially electronics and eCommerce Developing new incremental regular revenue streams including corporate accounts and larger orders
(orders over £1,000) Continuing to manage gross margin, cost and cash effectively
In the first half, the UK has made progress in implementing this strategy with a strengthening of the electronics offer with the product range expansion and the launch of DesignSpark driving the above market electronics performance. The maintenance offer has also been developed with free customer site surveys focused on highlighting energy saving opportunities, a dedicated salesforce established to focus on the machine builder market, seven new large account wins and larger order sales growth of more than 50%. In addition, the eCommerce channel has grown by 25% and costs have been reduced by 8%.
6
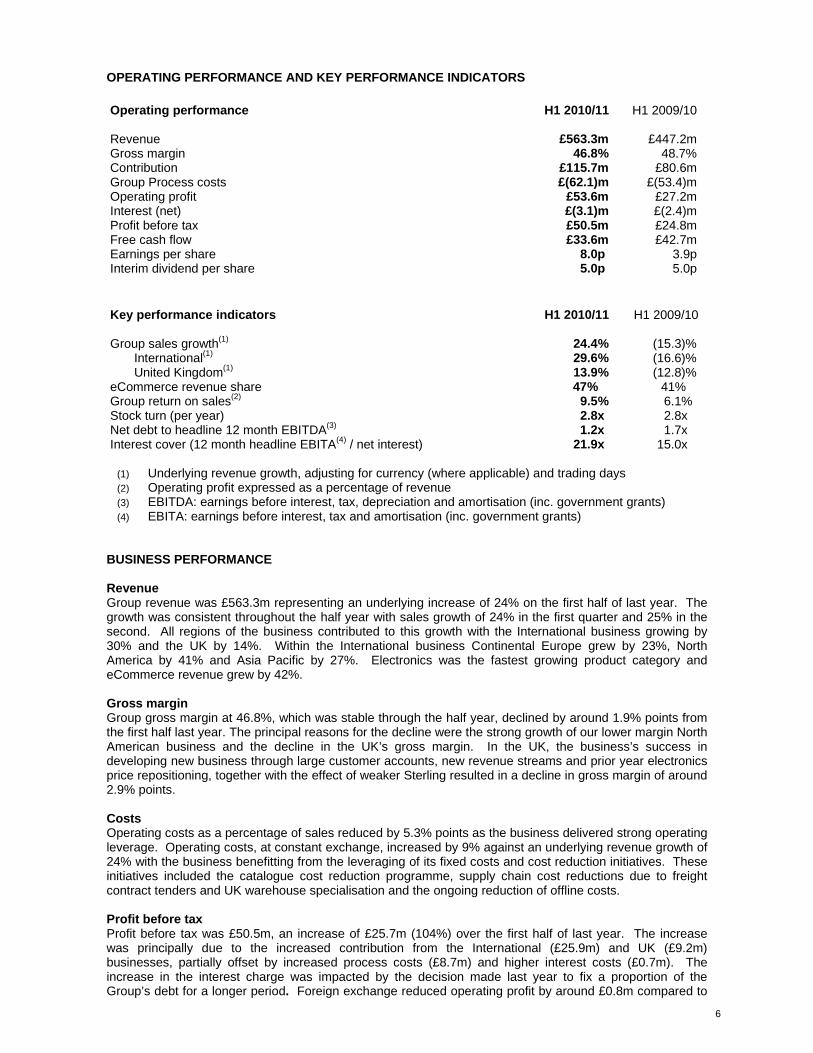
OPERATING PERFORMANCE AND KEY PERFORMANCE INDICATORS Operating performance H1 2010/11 H1 2009/10 Revenue £563.3m £447.2mGross margin 46.8% 48.7%Contribution £115.7m £80.6mGroup Process costs £(62.1)m £(53.4)mOperating profit £53.6m £27.2mInterest (net) £(3.1)m £(2.4)mProfit before tax £50.5m £24.8mFree cash flow £33.6m £42.7mEarnings per share 8.0p 3.9pInterim dividend per share 5.0p 5.0p Key performance indicators H1 2010/11 H1 2009/10 Group sales growth(1) 24.4% (15.3)% International(1) 29.6% (16.6)% United Kingdom(1) 13.9% (12.8)% eCommerce revenue share 47% 41% Group return on sales(2) 9.5% 6.1% Stock turn (per year) 2.8x 2.8x Net debt to headline 12 month EBITDA(3) 1.2x 1.7x Interest cover (12 month headline EBITA(4) / net interest) 21.9x 15.0x
(1) Underlying revenue growth, adjusting for currency (where applicable) and trading days (2) Operating profit expressed as a percentage of revenue (3) EBITDA: earnings before interest, tax, depreciation and amortisation (inc. government grants) (4) EBITA: earnings before interest, tax and amortisation (inc. government grants)
BUSINESS PERFORMANCE Revenue Group revenue was £563.3m representing an underlying increase of 24% on the first half of last year. The growth was consistent throughout the half year with sales growth of 24% in the first quarter and 25% in the second. All regions of the business contributed to this growth with the International business growing by 30% and the UK by 14%. Within the International business Continental Europe grew by 23%, North America by 41% and Asia Pacific by 27%. Electronics was the fastest growing product category and eCommerce revenue grew by 42%. Gross margin Group gross margin at 46.8%, which was stable through the half year, declined by around 1.9% points from the first half last year. The principal reasons for the decline were the strong growth of our lower margin North American business and the decline in the UK’s gross margin. In the UK, the business’s success in developing new business through large customer accounts, new revenue streams and prior year electronics price repositioning, together with the effect of weaker Sterling resulted in a decline in gross margin of around 2.9% points. Costs Operating costs as a percentage of sales reduced by 5.3% points as the business delivered strong operating leverage. Operating costs, at constant exchange, increased by 9% against an underlying revenue growth of 24% with the business benefitting from the leveraging of its fixed costs and cost reduction initiatives. These initiatives included the catalogue cost reduction programme, supply chain cost reductions due to freight contract tenders and UK warehouse specialisation and the ongoing reduction of offline costs. Profit before tax Profit before tax was £50.5m, an increase of £25.7m (104%) over the first half of last year. The increase was principally due to the increased contribution from the International (£25.9m) and UK (£9.2m) businesses, partially offset by increased process costs (£8.7m) and higher interest costs (£0.7m). The increase in the interest charge was impacted by the decision made last year to fix a proportion of the Group’s debt for a longer period. Foreign exchange reduced operating profit by around £0.8m compared to
7
the last half year due to the strengthening of Sterling against the Euro, partially offset by weakening against the US Dollar. Earnings per share Earnings per share of 8.0p were 105% higher than the first half of last year with the effective tax rate remaining at 31%. Cash flow The Group continued to deliver a strong cash flow of £33.6m with a cash conversion ratio of nearly 100%. Within working capital stock turn has been maintained at 2.8 times and debtor days were flat. Financial position The Group’s strong financial metrics improved further during the first half of the year. EBITA interest cover was 22 times and net debt to EBITDA was 1.2 times (both measures based upon proforma twelve months ended 30 September 2010 financials), with significant headroom to the Group’s banking covenants. The headroom between net debt of £163m and committed bank facilities at 30 September 2010 was £143m. Of the £306m committed facilities available, £298m have a maturity date of September 2012 or later. Under IAS 19, the combined deficit of the Group’s defined benefit pension schemes was £5.9m at 30 September 2010 having reduced from £16.2m at 31 March 2010 mainly due to increasing asset values. Dividend The Board has decided to maintain the interim dividend of 5p per share which will be paid in January next year. INTERNATIONAL
H1 2010/11Restated (2)
H1 2009/10 Change
Reported
Change (Constant
Exchange)
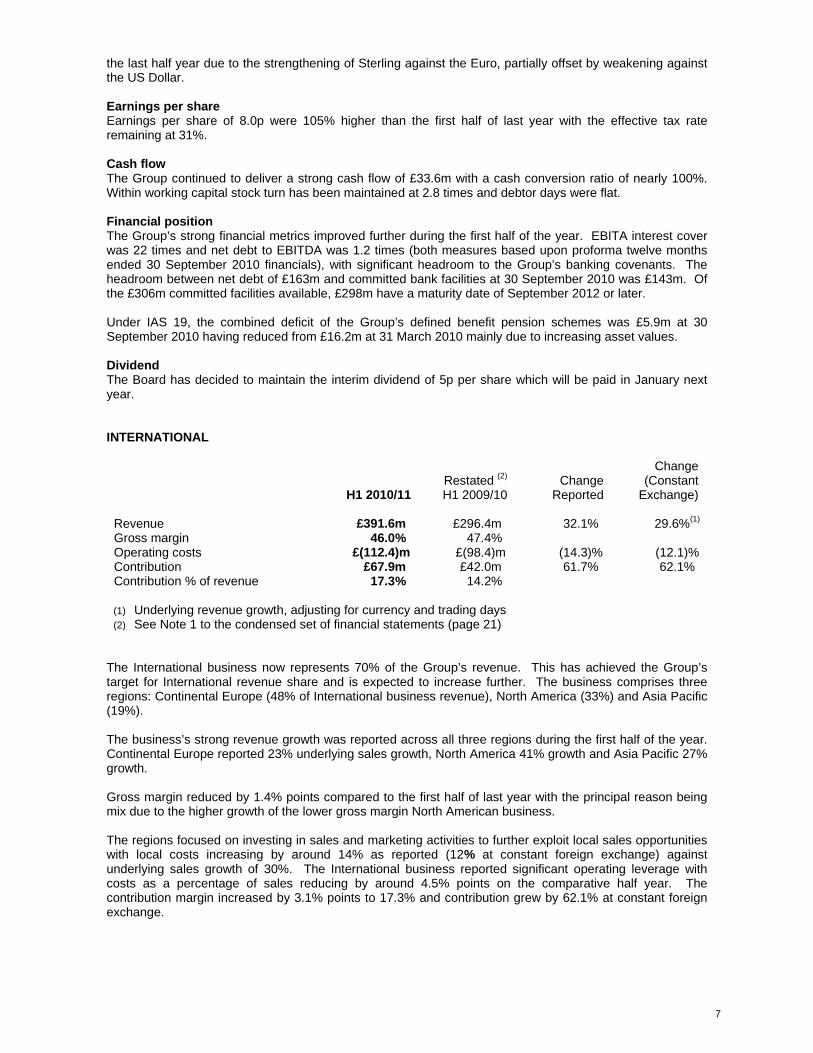
Revenue £391.6m £296.4m 32.1% 29.6%(1)
Gross margin 46.0% 47.4% Operating costs £(112.4)m £(98.4)m (14.3)% (12.1)% Contribution £67.9m £42.0m 61.7% 62.1% Contribution % of revenue 17.3% 14.2% (1) Underlying revenue growth, adjusting for currency and trading days (2) See Note 1 to the condensed set of financial statements (page 21)
The International business now represents 70% of the Group’s revenue. This has achieved the Group’s target for International revenue share and is expected to increase further. The business comprises three regions: Continental Europe (48% of International business revenue), North America (33%) and Asia Pacific (19%). The business’s strong revenue growth was reported across all three regions during the first half of the year. Continental Europe reported 23% underlying sales growth, North America 41% growth and Asia Pacific 27% growth. Gross margin reduced by 1.4% points compared to the first half of last year with the principal reason being mix due to the higher growth of the lower gross margin North American business. The regions focused on investing in sales and marketing activities to further exploit local sales opportunities with local costs increasing by around 14% as reported (12% at constant foreign exchange) against underlying sales growth of 30%. The International business reported significant operating leverage with costs as a percentage of sales reducing by around 4.5% points on the comparative half year. The contribution margin increased by 3.1% points to 17.3% and contribution grew by 62.1% at constant foreign exchange.
8
Continental Europe
H1 2010/11Restated (2)
H1 2009/10 Change
Reported
Change(Constant
Exchange)
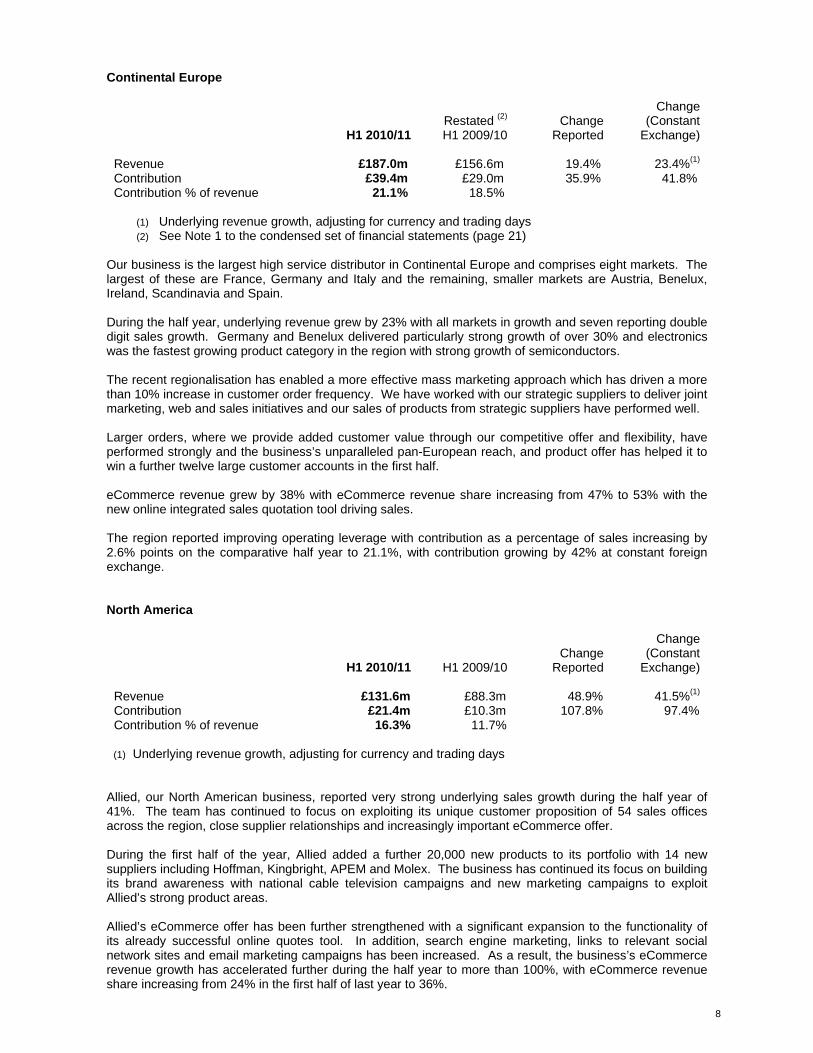
Revenue £187.0m £156.6m 19.4% 23.4%(1)
Contribution £39.4m £29.0m 35.9% 41.8% Contribution % of revenue 21.1% 18.5%
(1) Underlying revenue growth, adjusting for currency and trading days (2) See Note 1 to the condensed set of financial statements (page 21)
Our business is the largest high service distributor in Continental Europe and comprises eight markets. The largest of these are France, Germany and Italy and the remaining, smaller markets are Austria, Benelux, Ireland, Scandinavia and Spain. During the half year, underlying revenue grew by 23% with all markets in growth and seven reporting double digit sales growth. Germany and Benelux delivered particularly strong growth of over 30% and electronics was the fastest growing product category in the region with strong growth of semiconductors. The recent regionalisation has enabled a more effective mass marketing approach which has driven a more than 10% increase in customer order frequency. We have worked with our strategic suppliers to deliver joint marketing, web and sales initiatives and our sales of products from strategic suppliers have performed well. Larger orders, where we provide added customer value through our competitive offer and flexibility, have performed strongly and the business’s unparalleled pan-European reach, and product offer has helped it to win a further twelve large customer accounts in the first half. eCommerce revenue grew by 38% with eCommerce revenue share increasing from 47% to 53% with the new online integrated sales quotation tool driving sales. The region reported improving operating leverage with contribution as a percentage of sales increasing by 2.6% points on the comparative half year to 21.1%, with contribution growing by 42% at constant foreign exchange. North America
H1 2010/11 H1 2009/10 Change
Reported
Change(Constant
Exchange)
Revenue £131.6m £88.3m 48.9% 41.5%(1)
Contribution £21.4m £10.3m 107.8% 97.4% Contribution % of revenue 16.3% 11.7% (1) Underlying revenue growth, adjusting for currency and trading days
Allied, our North American business, reported very strong underlying sales growth during the half year of 41%. The team has continued to focus on exploiting its unique customer proposition of 54 sales offices across the region, close supplier relationships and increasingly important eCommerce offer. During the first half of the year, Allied added a further 20,000 new products to its portfolio with 14 new suppliers including Hoffman, Kingbright, APEM and Molex. The business has continued its focus on building its brand awareness with national cable television campaigns and new marketing campaigns to exploit Allied’s strong product areas. Allied’s eCommerce offer has been further strengthened with a significant expansion to the functionality of its already successful online quotes tool. In addition, search engine marketing, links to relevant social network sites and email marketing campaigns has been increased. As a result, the business’s eCommerce revenue growth has accelerated further during the half year to more than 100%, with eCommerce revenue share increasing from 24% in the first half of last year to 36%.
9
The business reported improved operating leverage with contribution as a percentage of sales improving by around 4.6% points to 16.3% with contribution growing by 97% at constant foreign exchange. Asia Pacific
H1 2010/11Restated (2)
H1 2009/10 Change
Reported
Change(Constant
Exchange)
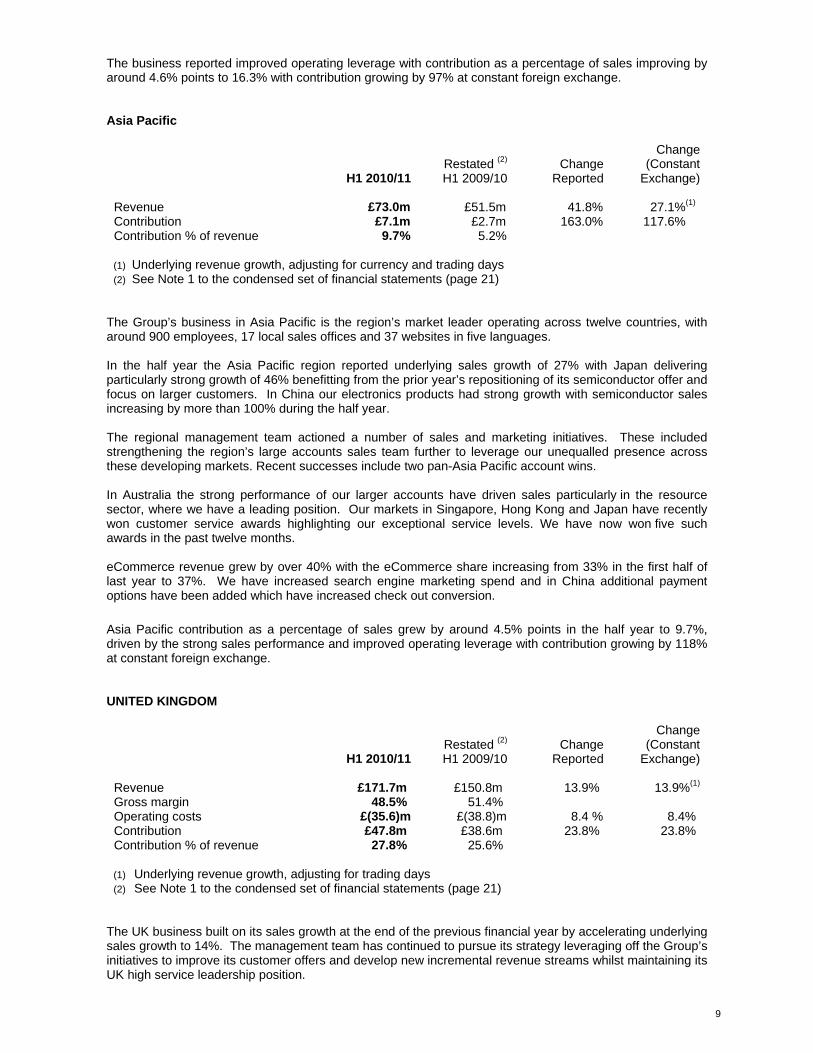
Revenue £73.0m £51.5m 41.8% 27.1%(1) Contribution £7.1m £2.7m 163.0% 117.6% Contribution % of revenue 9.7% 5.2% (1) Underlying revenue growth, adjusting for currency and trading days (2) See Note 1 to the condensed set of financial statements (page 21)
The Group’s business in Asia Pacific is the region’s market leader operating across twelve countries, with around 900 employees, 17 local sales offices and 37 websites in five languages. In the half year the Asia Pacific region reported underlying sales growth of 27% with Japan delivering particularly strong growth of 46% benefitting from the prior year’s repositioning of its semiconductor offer and focus on larger customers. In China our electronics products had strong growth with semiconductor sales increasing by more than 100% during the half year. The regional management team actioned a number of sales and marketing initiatives. These included strengthening the region’s large accounts sales team further to leverage our unequalled presence across these developing markets. Recent successes include two pan-Asia Pacific account wins. In Australia the strong performance of our larger accounts have driven sales particularly in the resource sector, where we have a leading position. Our markets in Singapore, Hong Kong and Japan have recently won customer service awards highlighting our exceptional service levels. We have now won five such awards in the past twelve months. eCommerce revenue grew by over 40% with the eCommerce share increasing from 33% in the first half of last year to 37%. We have increased search engine marketing spend and in China additional payment options have been added which have increased check out conversion. Asia Pacific contribution as a percentage of sales grew by around 4.5% points in the half year to 9.7%, driven by the strong sales performance and improved operating leverage with contribution growing by 118% at constant foreign exchange. UNITED KINGDOM
H1 2010/11Restated (2)
H1 2009/10 Change
Reported
Change(Constant
Exchange)
Revenue £171.7m £150.8m 13.9% 13.9%(1)
Gross margin 48.5% 51.4% Operating costs £(35.6)m £(38.8)m 8.4 % 8.4% Contribution £47.8m £38.6m 23.8% 23.8% Contribution % of revenue 27.8% 25.6% (1) Underlying revenue growth, adjusting for trading days (2) See Note 1 to the condensed set of financial statements (page 21)
The UK business built on its sales growth at the end of the previous financial year by accelerating underlying sales growth to 14%. The management team has continued to pursue its strategy leveraging off the Group’s initiatives to improve its customer offers and develop new incremental revenue streams whilst maintaining its UK high service leadership position.
10
The electronics offer has been strengthened with the range expansion and launch of DesignSpark which has driven the above market electronics performance. The maintenance offer has been further developed with the provision of free surveys to customers highlighting energy saving products supplied by RS. Dedicated sales teams have been created to focus on the machine builder market with a competitive offer and broad product range. The business has had significant success with both its large customer and large order offers. Seven large customer accounts were won during the half year and the flexible pricing offer, with orders valued at around £1,000 had sales growth of around 50%. eCommerce revenue grew during the half year by around 25% with eCommerce revenue share increasing from 48% in the first half of last year to 52% this year. The performance has been driven by purchasing manager and e-procurement wins with a particular emphasis on larger customers and increased search engine marketing spend. Other activities have included the recent creation of personal web pages for certain maintenance customers, detailing their product selections and agreed pricing. The business’s success in developing new business through large customer accounts, new revenue streams and prior year electronics price repositioning, together with the effect of weaker Sterling resulted in a decline in gross margin of around 2.9% points. In absolute terms the UK’s gross profit increased by around £6m. The business delivered operating leverage with costs reducing by 5% points of sales. The 8% year on year reduction in costs in the UK was driven by lower catalogue costs, freight carrier change, warehouse specialisation and lower stockholding costs. Contribution as a percentage of sales increased by 2.2% points to 27.8%, with contribution growing by around 24%. PROCESSES
H1 2010/11 H1 2009/10 Change
Reported
Change(Constant
Exchange)
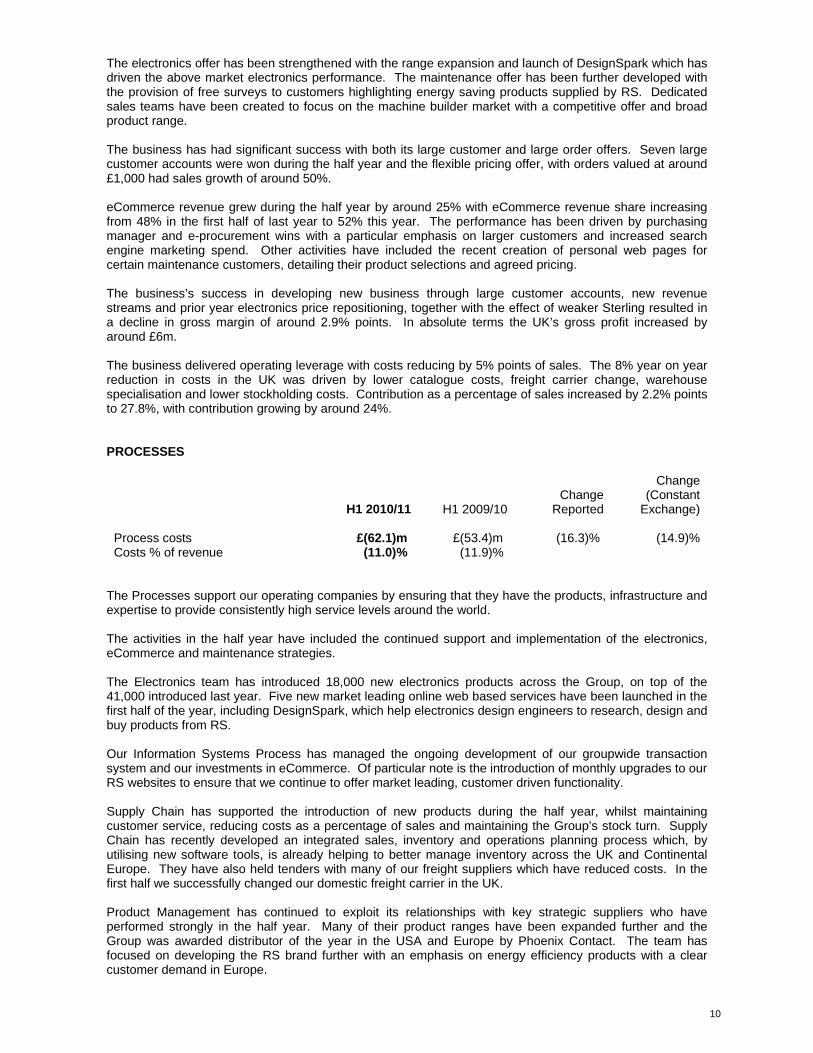
Process costs £(62.1)m £(53.4)m (16.3)% (14.9)%Costs % of revenue (11.0)% (11.9)%
The Processes support our operating companies by ensuring that they have the products, infrastructure and expertise to provide consistently high service levels around the world. The activities in the half year have included the continued support and implementation of the electronics, eCommerce and maintenance strategies. The Electronics team has introduced 18,000 new electronics products across the Group, on top of the 41,000 introduced last year. Five new market leading online web based services have been launched in the first half of the year, including DesignSpark, which help electronics design engineers to research, design and buy products from RS. Our Information Systems Process has managed the ongoing development of our groupwide transaction system and our investments in eCommerce. Of particular note is the introduction of monthly upgrades to our RS websites to ensure that we continue to offer market leading, customer driven functionality. Supply Chain has supported the introduction of new products during the half year, whilst maintaining customer service, reducing costs as a percentage of sales and maintaining the Group’s stock turn. Supply Chain has recently developed an integrated sales, inventory and operations planning process which, by utilising new software tools, is already helping to better manage inventory across the UK and Continental Europe. They have also held tenders with many of our freight suppliers which have reduced costs. In the first half we successfully changed our domestic freight carrier in the UK. Product Management has continued to exploit its relationships with key strategic suppliers who have performed strongly in the half year. Many of their product ranges have been expanded further and the Group was awarded distributor of the year in the USA and Europe by Phoenix Contact. The team has focused on developing the RS brand further with an emphasis on energy efficiency products with a clear customer demand in Europe.
11
Process costs as a percentage of sales reduced by 0.9% points as the business benefitted from the leveraging of its fixed cost base. During the half year the business continued to invest in the implementation of its electronics and eCommerce strategic activities. This investment together with increased variable costs associated with the strong International sales growth and accelerating new product introductions resulted in Process costs increasing by around 15% at constant exchange rates. RISKS AND UNCERTAINTIES The Group has well established risk management and internal control processes for the identification, assessment and management of risks likely to affect the achievement of the Group’s corporate and strategic objectives. The Board and Group Executive Committee receive regular reports covering risks and mitigating actions arising from external factors, key dependencies, project delivery and corporate responsibility areas. This section summarises the most significant risks to the achievement of our objectives: Global economic conditions Following declining sales and profit during the economic downturn during 2009 and 2010, the business has returned to growth. Despite recent strong performance, the short to medium term economic outlook continues to be uncertain. The business remains in a strong position, and is highly cash generative, with significant headroom to the Group’s banking covenants. The vast majority of the Group’s committed facilities available at 31 March 2010 have a maturity date of September 2012 or later. Pricing An ongoing challenge for our business is to maintain value for money by balancing a competitive pricing strategy with high service levels and customer communication. The risk is that our competitors close the service gap and become more competitive on price. To address this we continue to develop a dynamic pricing strategy that enables us to adapt product sale prices in response to and in anticipation of external factors, e.g. competitor marketing, competitor pricing actions and currency movements. In the electronics market we have increased the number of price matches with competitor products and the frequency of price matching exercises. In conjunction with our pricing strategy we continue to focus on customer service by monitoring and maintaining our customer service levels across all regions. Product data quality and content Our eCommerce strategy has seen an increased proportion of Group sales driven through the internet. Creating a more dynamic journey for our customers when they browse for and purchase goods online is very important. Historically, our data content was established to support catalogue creation, rather than to support a dynamic customer environment. There is a risk that unreliable and incomplete product data impedes the development and delivery of a high standard eCommerce customer offer. To address this risk we have invested in improvements to our content structure which are specifically tailored to delivering an improved web experience. Our focus has been on improving the customers’ ability to find, choose and buy products online, driving increased search-to-order conversion rates, improved natural search ranking and a streamlined process to reduce time to make content changes. Implementation of the Allied information systems As part of the Group’s overall information system strategy and to support the successful expansion of the Allied business, the decision has been made to replace the legacy system in North America with a SAP based ERP system. As with any project of this scale there are implementation risks to be mitigated. A project team has been assembled including our North American employees, Group Information Systems function and employees from the rest of the Group with experience of the Group’s earlier ERP implementations. Strong project governance procedures are also being put in place. The Allied management team will be overseeing the day to day implementation and have established a process of close review, monitoring of deliverables and costs with regular reporting to Group.
12
CURRENT TRADING AND OUTLOOK Group sales remained strong throughout the half year, growing by 24% in the first quarter and 25% in the second quarter. In October, Group revenue has grown by 21%, the UK by 12% and International by 26%. Within International, Continental Europe has grown by 21%, North America by 38% and Asia Pacific by 21%. We are continuing to invest in our International markets, electronics and eCommerce initiatives in order to drive future sales growth. Whilst recognising the global economic uncertainties and more demanding comparatives in the second half, we believe that the outcome for the year as a whole will be ahead of our previous expectations. Ian Mason, Group Chief Executive Simon Boddie, Group Finance Director 12 November 2010
13
RESPONSIBILITY STATEMENT OF THE DIRECTORS IN RESPECT OF THE HALF-YEARLY FINANCIAL REPORT We confirm that to the best of our knowledge: The condensed set of financial statements has been prepared in accordance with IAS 34 Interim
Financial Reporting as adopted by the EU; The interim management report includes a fair review of the information required by:
(a) DTR 4.2.7R of the Disclosure and Transparency Rules, being an indication of important events that have occurred during the first six months of the financial year and their impact on the condensed set of financial statements; and a description of the principal risks and uncertainties for the remaining six months of the year; and
(b) DTR 4.2.8R of the Disclosure and Transparency Rules, being related party transactions that have
taken place in the first six months of the current financial year and that have materially affected the financial position or performance of the entity during that period; and any changes in the related party transactions described in the last annual report that could do so.
Ian Mason, Group Chief Executive Simon Boddie, Group Finance Director 12 November 2010
14
Condensed Consolidated Income Statement
Note 6 months to
30.9.20106 months to
30.9.2009 Year to
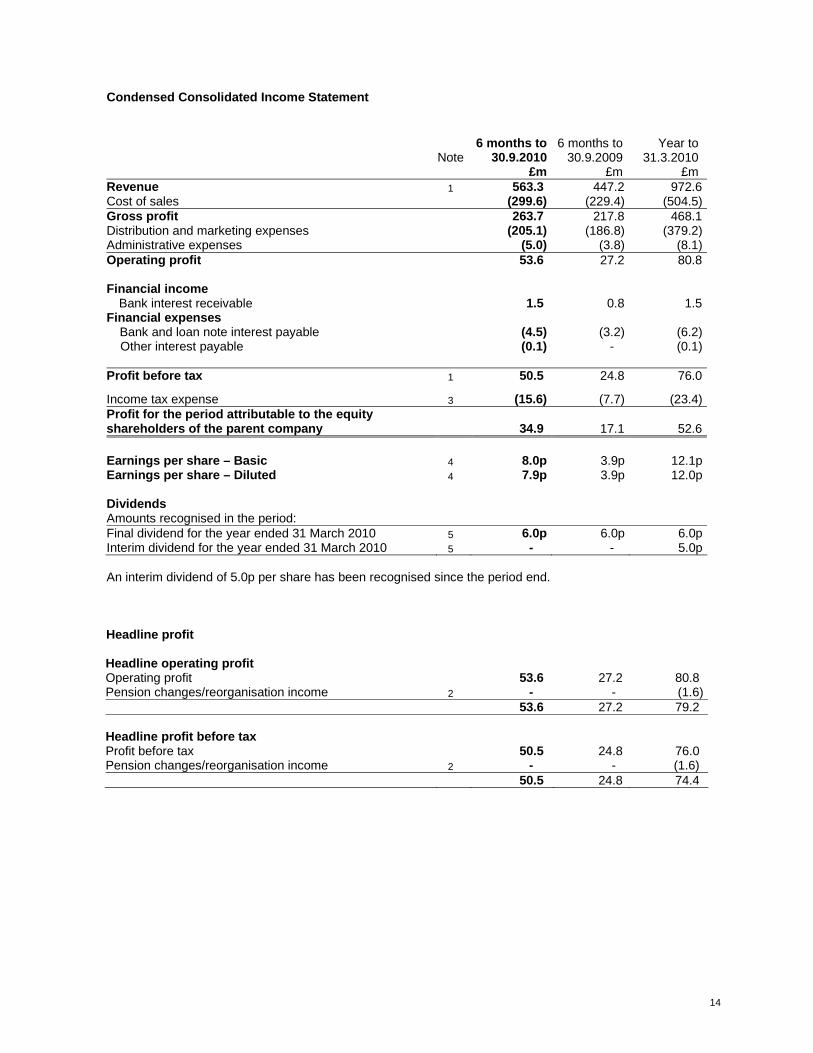
31.3.2010 £m £m £m Revenue 1 563.3 447.2 972.6Cost of sales (299.6) (229.4) (504.5)Gross profit 263.7 217.8 468.1Distribution and marketing expenses (205.1) (186.8) (379.2)Administrative expenses (5.0) (3.8) (8.1)Operating profit 53.6 27.2 80.8 Financial income Bank interest receivable 1.5 0.8 1.5Financial expenses Bank and loan note interest payable (4.5) (3.2) (6.2) Other interest payable (0.1) - (0.1) Profit before tax 1 50.5 24.8 76.0
Income tax expense 3 (15.6) (7.7) (23.4)Profit for the period attributable to the equity shareholders of the parent company 34.9 17.1 52.6 Earnings per share – Basic 4 8.0p 3.9p 12.1pEarnings per share – Diluted 4 7.9p 3.9p 12.0p Dividends Amounts recognised in the period: Final dividend for the year ended 31 March 2010 5 6.0p 6.0p 6.0pInterim dividend for the year ended 31 March 2010 5 - - 5.0p An interim dividend of 5.0p per share has been recognised since the period end. Headline profit Headline operating profit Operating profit 53.6 27.2 80.8 Pension changes/reorganisation income 2 - - (1.6) 53.6 27.2 79.2 Headline profit before tax Profit before tax 50.5 24.8 76.0 Pension changes/reorganisation income 2 - - (1.6) 50.5 24.8 74.4
15
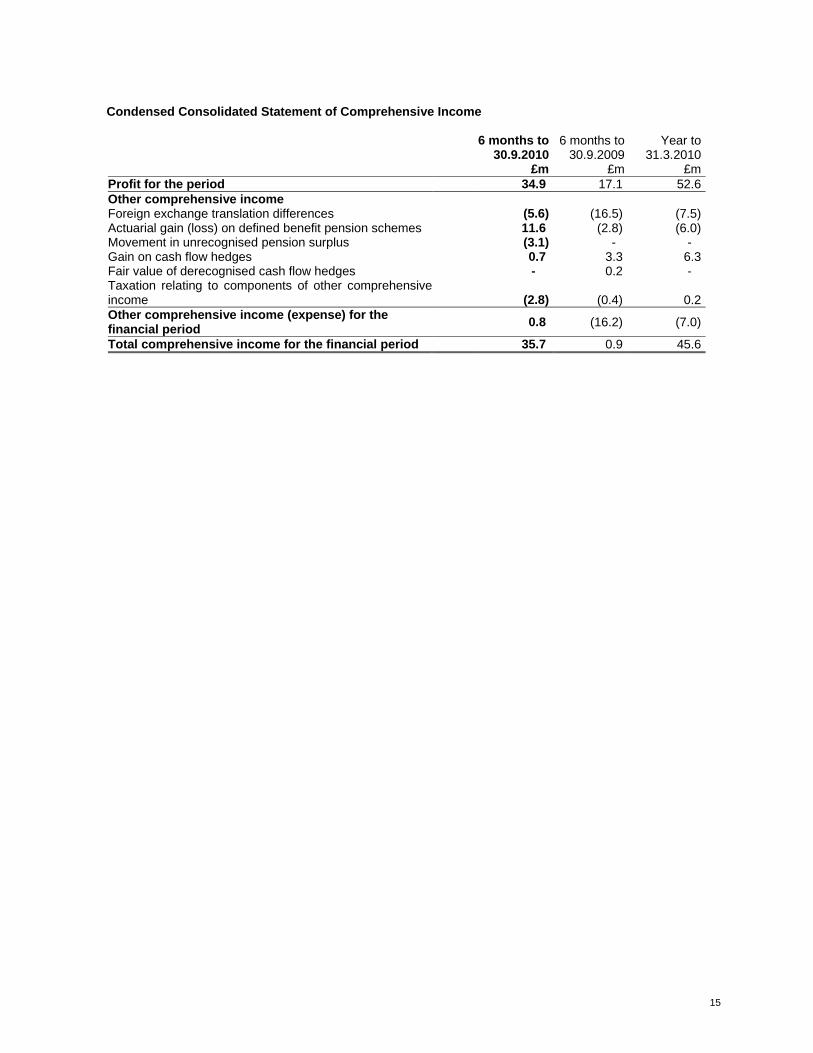
Condensed Consolidated Statement of Comprehensive Income
6 months to
30.9.20106 months to
30.9.2009 Year to
31.3.2010 £m £m £mProfit for the period 34.9 17.1 52.6Other comprehensive income Foreign exchange translation differences (5.6) (16.5) (7.5)Actuarial gain (loss) on defined benefit pension schemes 11.6 (2.8) (6.0)Movement in unrecognised pension surplus (3.1) - - Gain on cash flow hedges 0.7 3.3 6.3Fair value of derecognised cash flow hedges - 0.2 - Taxation relating to components of other comprehensive income (2.8) (0.4) 0.2Other comprehensive income (expense) for the financial period 0.8 (16.2) (7.0)
Total comprehensive income for the financial period 35.7 0.9 45.6
16
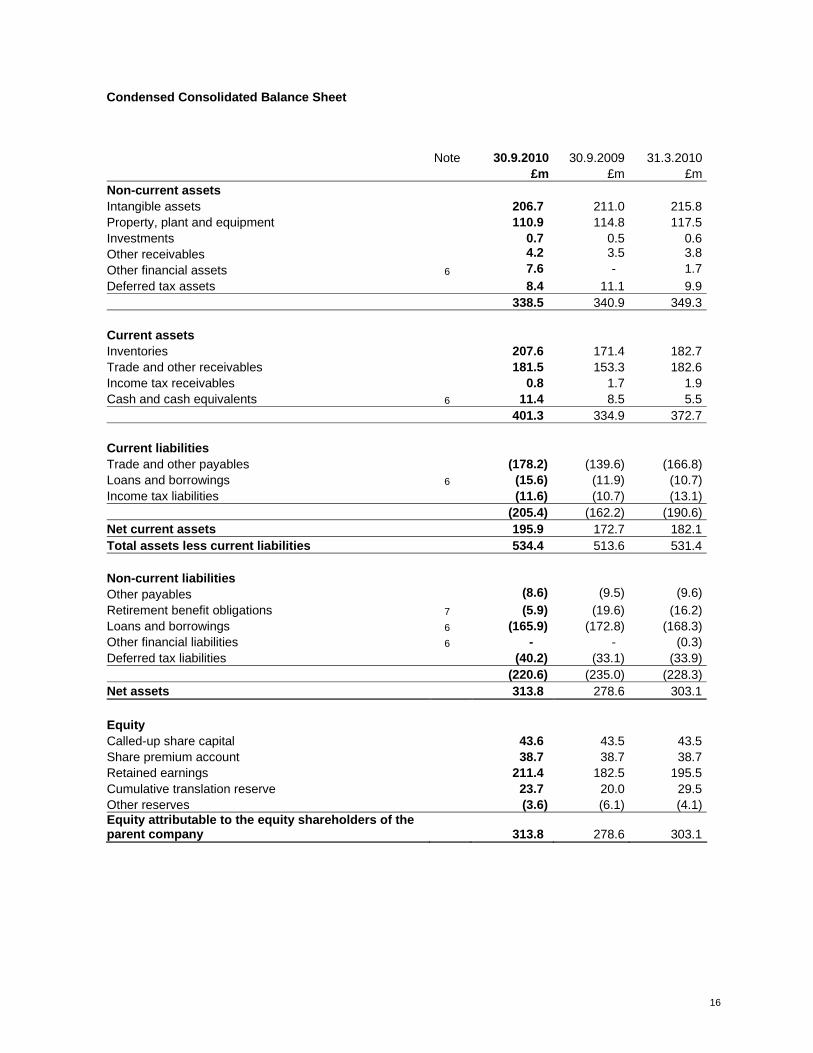
Condensed Consolidated Balance Sheet
Note 30.9.2010 30.9.2009 31.3.2010 £m £m £mNon-current assets Intangible assets 206.7 211.0 215.8Property, plant and equipment 110.9 114.8 117.5Investments 0.7 0.5 0.6Other receivables 4.2 3.5 3.8Other financial assets 6 7.6 - 1.7Deferred tax assets 8.4 11.1 9.9 338.5 340.9 349.3 Current assets Inventories 207.6 171.4 182.7Trade and other receivables 181.5 153.3 182.6Income tax receivables 0.8 1.7 1.9Cash and cash equivalents 6 11.4 8.5 5.5 401.3 334.9 372.7 Current liabilities Trade and other payables (178.2) (139.6) (166.8)Loans and borrowings 6 (15.6) (11.9) (10.7)Income tax liabilities (11.6) (10.7) (13.1) (205.4) (162.2) (190.6)Net current assets 195.9 172.7 182.1Total assets less current liabilities 534.4 513.6 531.4 Non-current liabilities Other payables (8.6) (9.5) (9.6)Retirement benefit obligations 7 (5.9) (19.6) (16.2)Loans and borrowings 6 (165.9) (172.8) (168.3)Other financial liabilities 6 - - (0.3)Deferred tax liabilities (40.2) (33.1) (33.9) (220.6) (235.0) (228.3)Net assets 313.8 278.6 303.1 Equity Called-up share capital 43.6 43.5 43.5Share premium account 38.7 38.7 38.7Retained earnings 211.4 182.5 195.5Cumulative translation reserve 23.7 20.0 29.5Other reserves (3.6) (6.1) (4.1)Equity attributable to the equity shareholders of the parent company 313.8 278.6 303.1
17
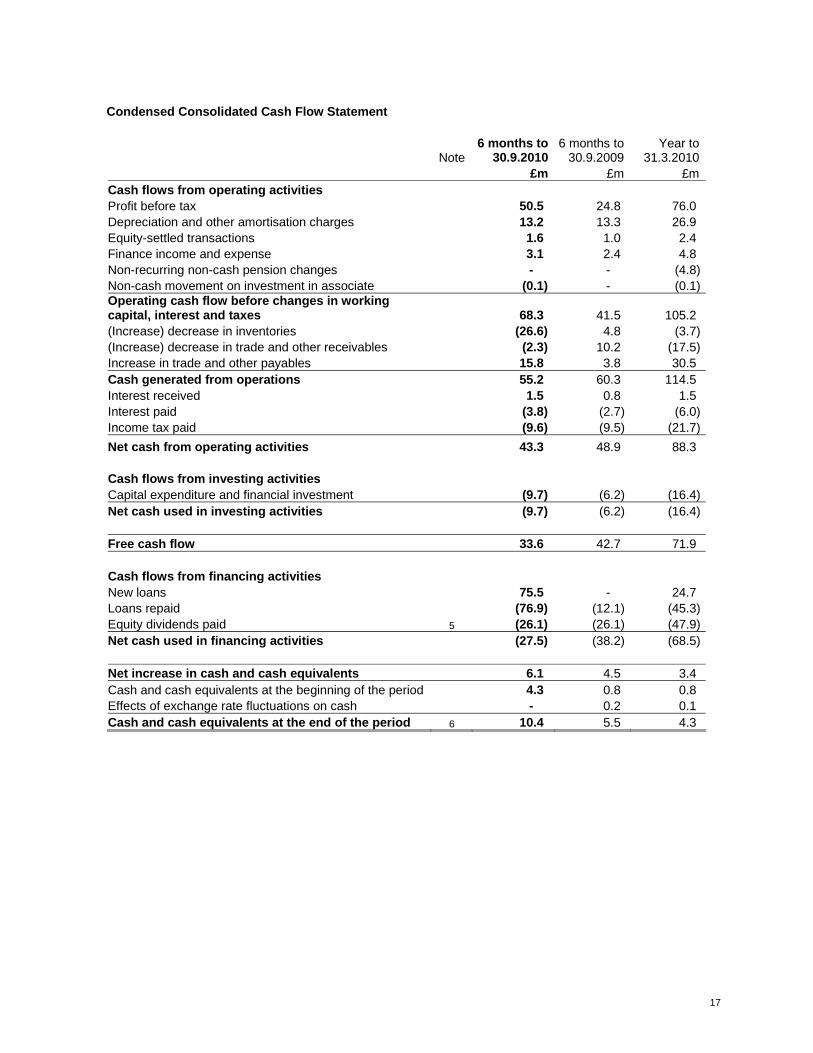
Condensed Consolidated Cash Flow Statement
Note 6 months to
30.9.20106 months to
30.9.2009 Year to
31.3.2010 £m £m £mCash flows from operating activities Profit before tax 50.5 24.8 76.0 Depreciation and other amortisation charges 13.2 13.3 26.9 Equity-settled transactions 1.6 1.0 2.4 Finance income and expense 3.1 2.4 4.8 Non-recurring non-cash pension changes - - (4.8)Non-cash movement on investment in associate (0.1) - (0.1)Operating cash flow before changes in working capital, interest and taxes 68.3 41.5 105.2 (Increase) decrease in inventories (26.6) 4.8 (3.7)(Increase) decrease in trade and other receivables (2.3) 10.2 (17.5)Increase in trade and other payables 15.8 3.8 30.5 Cash generated from operations 55.2 60.3 114.5 Interest received 1.5 0.8 1.5 Interest paid (3.8) (2.7) (6.0)Income tax paid (9.6) (9.5) (21.7)Net cash from operating activities 43.3 48.9 88.3
Cash flows from investing activities Capital expenditure and financial investment (9.7) (6.2) (16.4)Net cash used in investing activities (9.7) (6.2) (16.4) Free cash flow 33.6 42.7 71.9 Cash flows from financing activities New loans 75.5 - 24.7 Loans repaid (76.9) (12.1) (45.3)Equity dividends paid 5 (26.1) (26.1) (47.9)Net cash used in financing activities (27.5) (38.2) (68.5) Net increase in cash and cash equivalents 6.1 4.5 3.4 Cash and cash equivalents at the beginning of the period 4.3 0.8 0.8 Effects of exchange rate fluctuations on cash - 0.2 0.1 Cash and cash equivalents at the end of the period 6 10.4 5.5 4.3
18
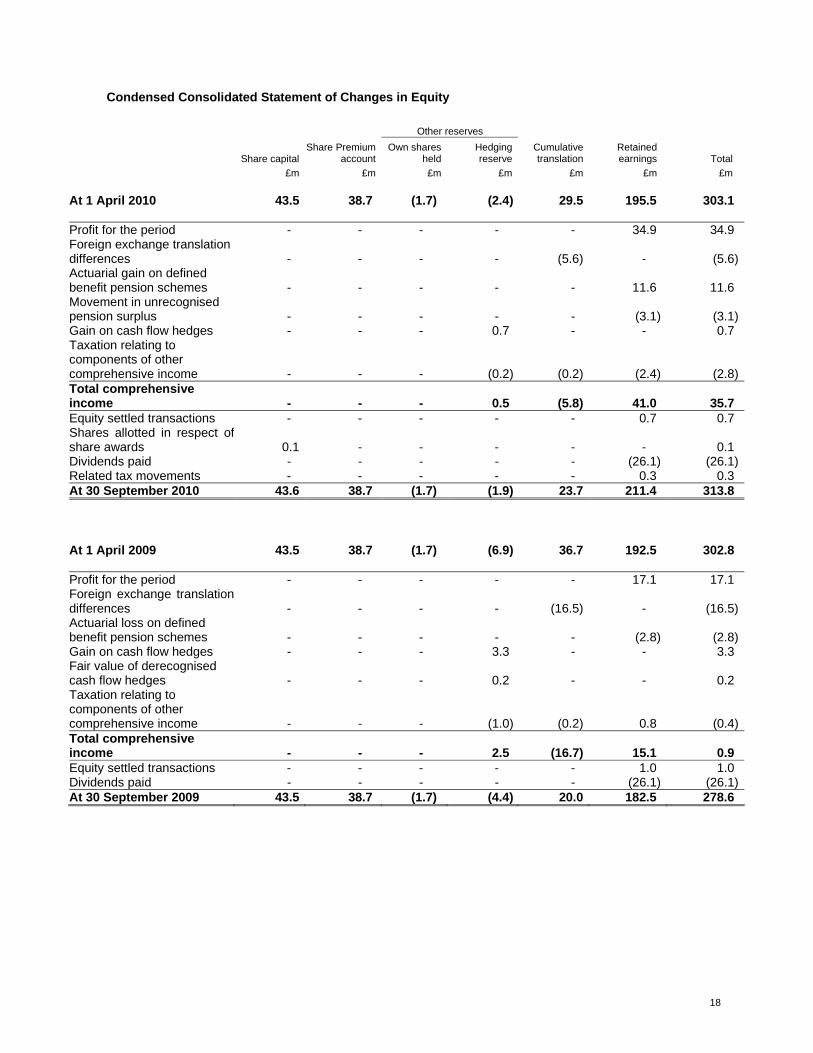
Condensed Consolidated Statement of Changes in Equity
Other reserves
Share capital Share Premium
account Own shares
held Hedging reserve
Cumulative translation
Retained earnings Total
£m £m £m £m £m £m £m At 1 April 2010 43.5 38.7 (1.7) (2.4) 29.5 195.5 303.1 Profit for the period - - - - - 34.9 34.9 Foreign exchange translation differences - - - - (5.6) - (5.6)Actuarial gain on defined benefit pension schemes - - - - - 11.6 11.6 Movement in unrecognised pension surplus - - - - - (3.1) (3.1)Gain on cash flow hedges - - - 0.7 - - 0.7 Taxation relating to components of other comprehensive income - - - (0.2) (0.2) (2.4) (2.8)Total comprehensive income - - - 0.5 (5.8) 41.0 35.7 Equity settled transactions - - - - - 0.7 0.7 Shares allotted in respect of share awards 0.1 - - - - - 0.1 Dividends paid - - - - - (26.1) (26.1)Related tax movements - - - - - 0.3 0.3 At 30 September 2010 43.6 38.7 (1.7) (1.9) 23.7 211.4 313.8 At 1 April 2009 43.5 38.7 (1.7) (6.9) 36.7 192.5 302.8 Profit for the period - - - - - 17.1 17.1 Foreign exchange translation differences - - - - (16.5) - (16.5)Actuarial loss on defined benefit pension schemes - - - - - (2.8) (2.8)Gain on cash flow hedges - - - 3.3 - - 3.3 Fair value of derecognised cash flow hedges - - - 0.2 - - 0.2 Taxation relating to components of other comprehensive income - - - (1.0) (0.2) 0.8 (0.4)Total comprehensive income - - - 2.5 (16.7) 15.1 0.9 Equity settled transactions - - - - - 1.0 1.0 Dividends paid - - - - - (26.1) (26.1)At 30 September 2009 43.5 38.7 (1.7) (4.4) 20.0 182.5 278.6
19
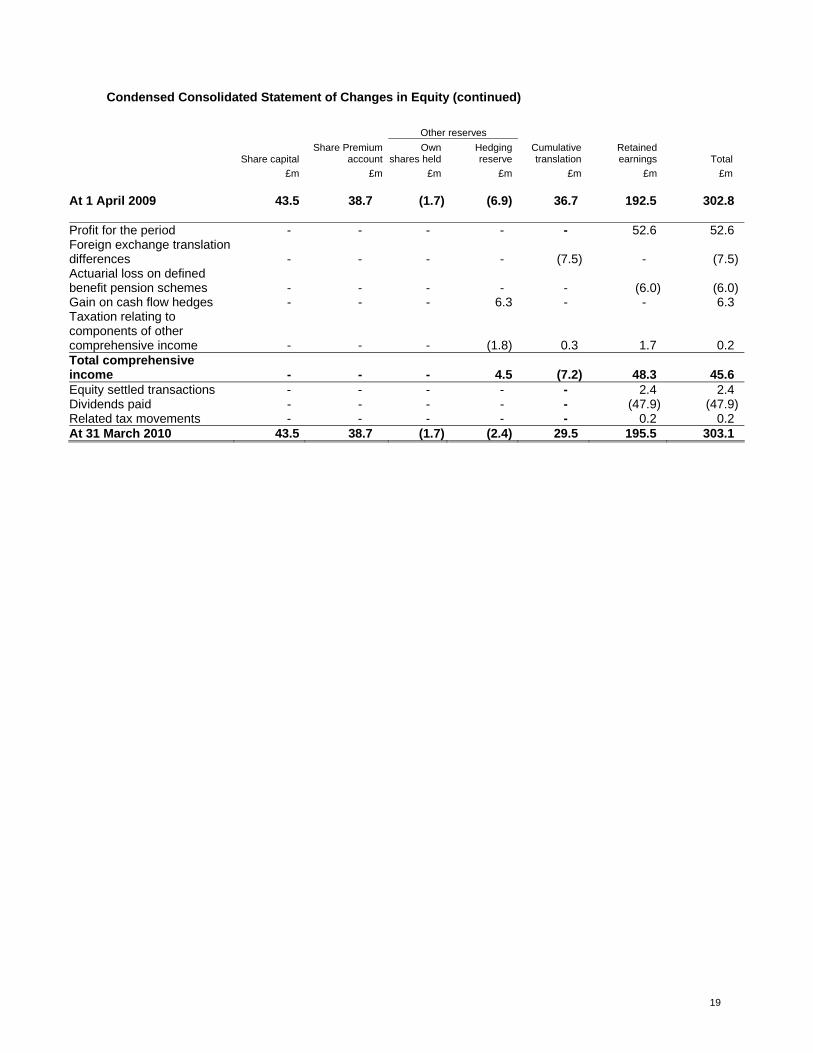
Condensed Consolidated Statement of Changes in Equity (continued)
Other reserves
Share capital Share Premium
account Own
shares held Hedging reserve
Cumulative translation
Retained earnings Total
£m £m £m £m £m £m £m At 1 April 2009 43.5 38.7 (1.7) (6.9) 36.7 192.5 302.8 Profit for the period - - - - - 52.6 52.6 Foreign exchange translation differences - - - - (7.5) - (7.5)Actuarial loss on defined benefit pension schemes - - - - - (6.0) (6.0)Gain on cash flow hedges - - - 6.3 - - 6.3 Taxation relating to components of other comprehensive income - - - (1.8) 0.3 1.7 0.2 Total comprehensive income - - - 4.5 (7.2) 48.3 45.6 Equity settled transactions - - - - - 2.4 2.4 Dividends paid - - - - - (47.9) (47.9)Related tax movements - - - - - 0.2 0.2 At 31 March 2010 43.5 38.7 (1.7) (2.4) 29.5 195.5 303.1
20
BASIS OF PREPARATION AND PRINCIPAL ACCOUNTING POLICIES Electrocomponents plc (the “Company”) is a company domiciled in the UK. The condensed set of financial statements as at, and for, the six months ended 30 September 2010 comprises the Company and its subsidiaries (together referred to as the “Group”) and the Group’s interest in a jointly controlled entity. The Group financial statements as at, and for, the year ended 31 March 2010 are available upon request from the Company’s registered office at International Management Centre, 8050 Oxford Business Park North, Oxford, OX4 2HW. The comparative figures for the financial year ended 31 March 2010 are not the Company’s statutory accounts for that financial year. Those accounts have been reported on by the Company's auditors and delivered to the Registrar of Companies. The report of the auditors was (i) unqualified, (ii) did not include a reference to any matters to which the auditors drew attention by way of emphasis without qualifying their report, and (iii) did not contain a statement under section 498(2) or (3) of the Companies Act 2006. Going concern After making enquiries, the Directors have a reasonable expectation that the Group has adequate resources to continue in operational existence for the foreseeable future. For this reason they continue to adopt the going concern basis in preparing the financial statements. The financial risk management objectives and policies of the Group and the exposure of the Group to price risk, credit risk, liquidity risk and cash flow risk are discussed in note 20 to the Group’s Annual Report and Accounts for the year ended 31 March 2010. Statement of compliance The condensed set of financial statements included in this half-yearly financial report has been prepared on the basis of the accounting policies set out in the 2010 Annual Report and Accounts, which were prepared in accordance with International Financial Reporting Standards as adopted by the EU (IFRS), and International Accounting Standard (IAS) 34 Interim Financial Reporting as adopted by the EU. The condensed set of financial statements do not include all of the information required for full annual financial statements, and should be read in conjunction with the Group financial statements as at, and for, the year ended 31 March 2010. This condensed set of financial statements was approved by the Board of Directors on 12 November 2010. Significant accounting policies The accounting policies applied by the Group in these condensed consolidated financial statements are the same as those that applied to the consolidated financial statements of the Group for the year ended 31 March 2010. Estimates and judgements The preparation of a condensed set of financial statements requires management to make judgements, estimates and assumptions that affect the application of accounting policies and the reported amounts of assets and liabilities, income and expense. Actual results may differ from these estimates. The significant judgements made by management in applying the Group’s accounting policies were the same as those that applied to the Group financial statements as at 31 March 2010. The key risks and uncertainties are explained on page 11 of this half-yearly financial report.
21
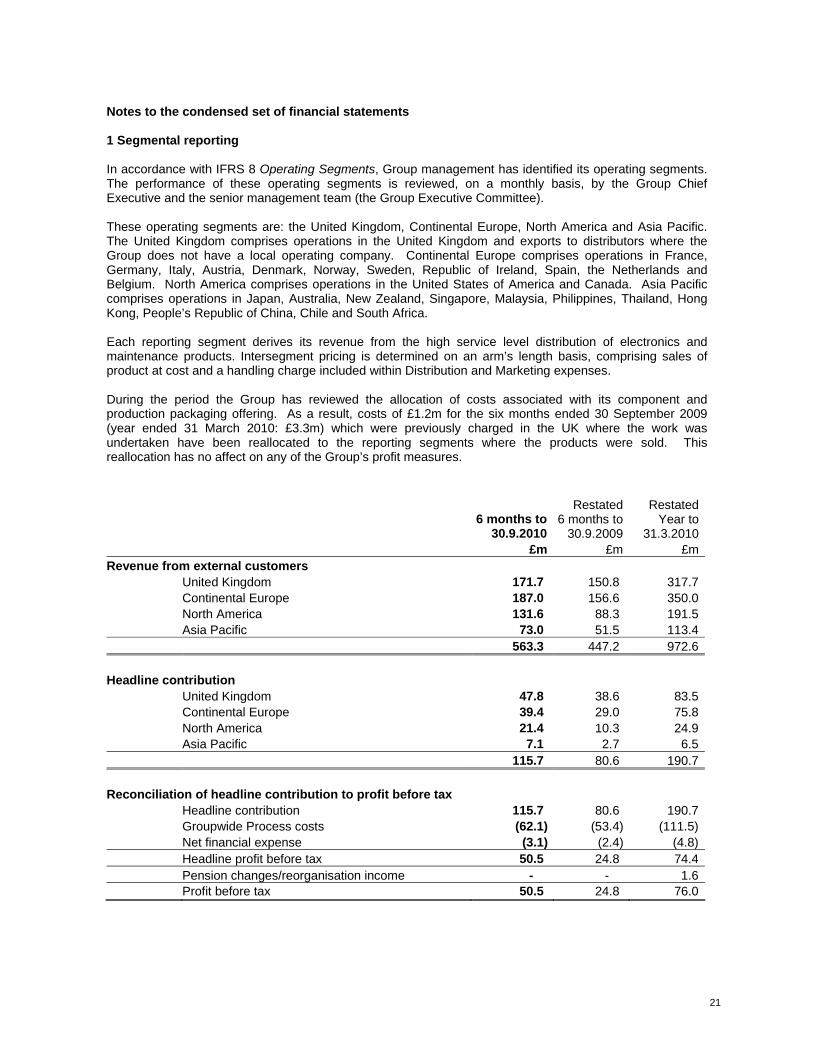
Notes to the condensed set of financial statements 1 Segmental reporting In accordance with IFRS 8 Operating Segments, Group management has identified its operating segments. The performance of these operating segments is reviewed, on a monthly basis, by the Group Chief Executive and the senior management team (the Group Executive Committee). These operating segments are: the United Kingdom, Continental Europe, North America and Asia Pacific. The United Kingdom comprises operations in the United Kingdom and exports to distributors where the Group does not have a local operating company. Continental Europe comprises operations in France, Germany, Italy, Austria, Denmark, Norway, Sweden, Republic of Ireland, Spain, the Netherlands and Belgium. North America comprises operations in the United States of America and Canada. Asia Pacific comprises operations in Japan, Australia, New Zealand, Singapore, Malaysia, Philippines, Thailand, Hong Kong, People’s Republic of China, Chile and South Africa. Each reporting segment derives its revenue from the high service level distribution of electronics and maintenance products. Intersegment pricing is determined on an arm’s length basis, comprising sales of product at cost and a handling charge included within Distribution and Marketing expenses. During the period the Group has reviewed the allocation of costs associated with its component and production packaging offering. As a result, costs of £1.2m for the six months ended 30 September 2009 (year ended 31 March 2010: £3.3m) which were previously charged in the UK where the work was undertaken have been reallocated to the reporting segments where the products were sold. This reallocation has no affect on any of the Group’s profit measures.
6 months to 30.9.2010
Restated 6 months to
30.9.2009
RestatedYear to
31.3.2010 £m £m £mRevenue from external customers United Kingdom 171.7 150.8 317.7 Continental Europe 187.0 156.6 350.0 North America 131.6 88.3 191.5 Asia Pacific 73.0 51.5 113.4 563.3 447.2 972.6 Headline contribution United Kingdom 47.8 38.6 83.5 Continental Europe 39.4 29.0 75.8 North America 21.4 10.3 24.9 Asia Pacific 7.1 2.7 6.5 115.7 80.6 190.7 Reconciliation of headline contribution to profit before tax Headline contribution 115.7 80.6 190.7 Groupwide Process costs (62.1) (53.4) (111.5) Net financial expense (3.1) (2.4) (4.8) Headline profit before tax 50.5 24.8 74.4 Pension changes/reorganisation income - - 1.6 Profit before tax 50.5 24.8 76.0
22
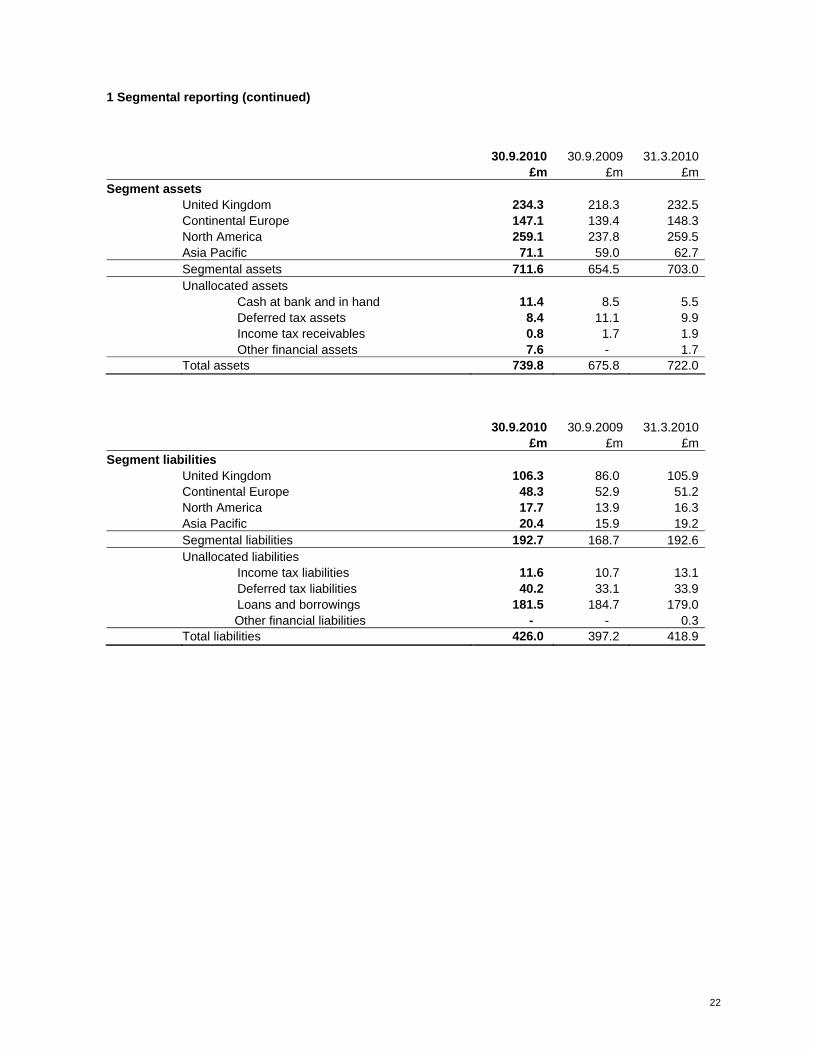
1 Segmental reporting (continued) 30.9.2010 30.9.2009 31.3.2010 £m £m £mSegment assets
United Kingdom 234.3 218.3 232.5 Continental Europe 147.1 139.4 148.3 North America 259.1 237.8 259.5
Asia Pacific 71.1 59.0 62.7 Segmental assets 711.6 654.5 703.0 Unallocated assets Cash at bank and in hand 11.4 8.5 5.5 Deferred tax assets 8.4 11.1 9.9 Income tax receivables 0.8 1.7 1.9 Other financial assets 7.6 - 1.7 Total assets 739.8 675.8 722.0 30.9.2010 30.9.2009 31.3.2010 £m £m £mSegment liabilities United Kingdom 106.3 86.0 105.9 Continental Europe 48.3 52.9 51.2 North America 17.7 13.9 16.3 Asia Pacific 20.4 15.9 19.2 Segmental liabilities 192.7 168.7 192.6 Unallocated liabilities Income tax liabilities 11.6 10.7 13.1 Deferred tax liabilities 40.2 33.1 33.9 Loans and borrowings 181.5 184.7 179.0 Other financial liabilities - - 0.3 Total liabilities 426.0 397.2 418.9
23
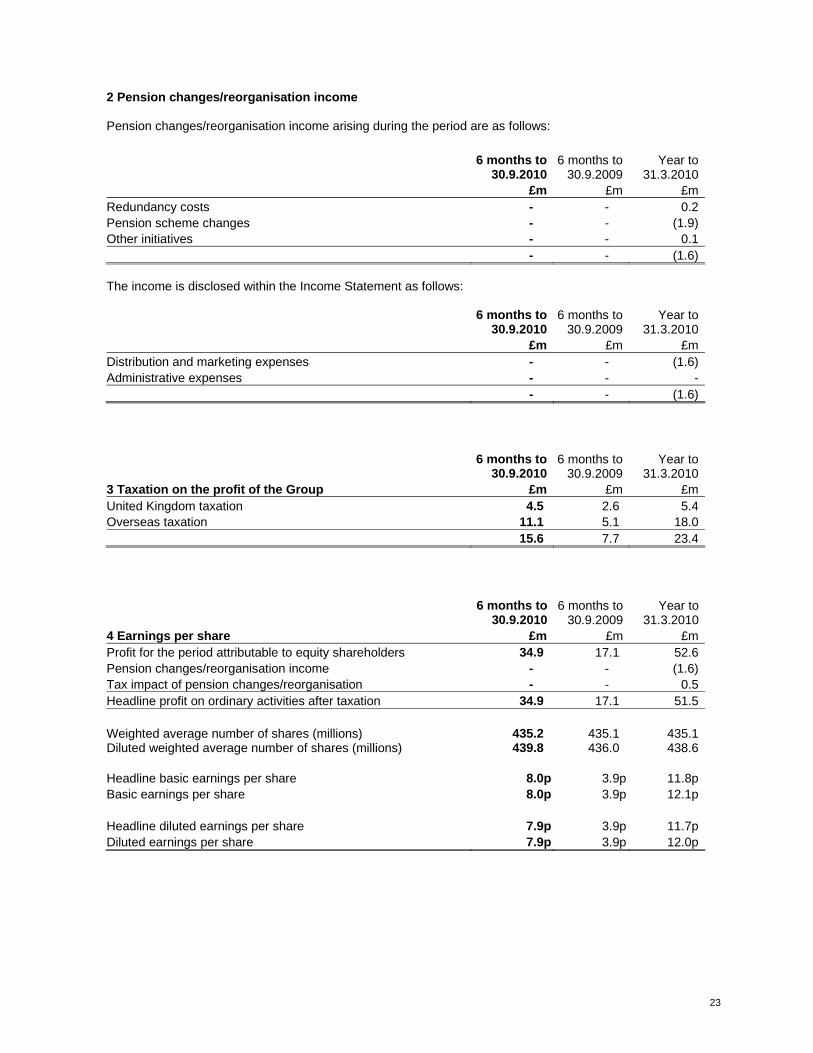
2 Pension changes/reorganisation income Pension changes/reorganisation income arising during the period are as follows:
6 months to 30.9.2010
6 months to 30.9.2009
Year to 31.3.2010
£m £m £mRedundancy costs - - 0.2Pension scheme changes - - (1.9)Other initiatives - - 0.1 - - (1.6) The income is disclosed within the Income Statement as follows:
6 months to
30.9.20106 months to
30.9.2009 Year to
31.3.2010 £m £m £mDistribution and marketing expenses - - (1.6)Administrative expenses - - - - - (1.6)
6 months to 30.9.2010
6 months to 30.9.2009
Year to 31.3.2010
3 Taxation on the profit of the Group £m £m £mUnited Kingdom taxation 4.5 2.6 5.4Overseas taxation 11.1 5.1 18.0 15.6 7.7 23.4
6 months to
30.9.20106 months to
30.9.2009 Year to
31.3.20104 Earnings per share £m £m £mProfit for the period attributable to equity shareholders 34.9 17.1 52.6Pension changes/reorganisation income - - (1.6)Tax impact of pension changes/reorganisation - - 0.5Headline profit on ordinary activities after taxation 34.9 17.1 51.5 Weighted average number of shares (millions) 435.2 435.1 435.1Diluted weighted average number of shares (millions) 439.8 436.0 438.6 Headline basic earnings per share 8.0p 3.9p 11.8pBasic earnings per share 8.0p 3.9p 12.1p Headline diluted earnings per share 7.9p 3.9p 11.7pDiluted earnings per share 7.9p 3.9p 12.0p
24
6 months to
30.9.20106 months to
30.9.2009 Year to
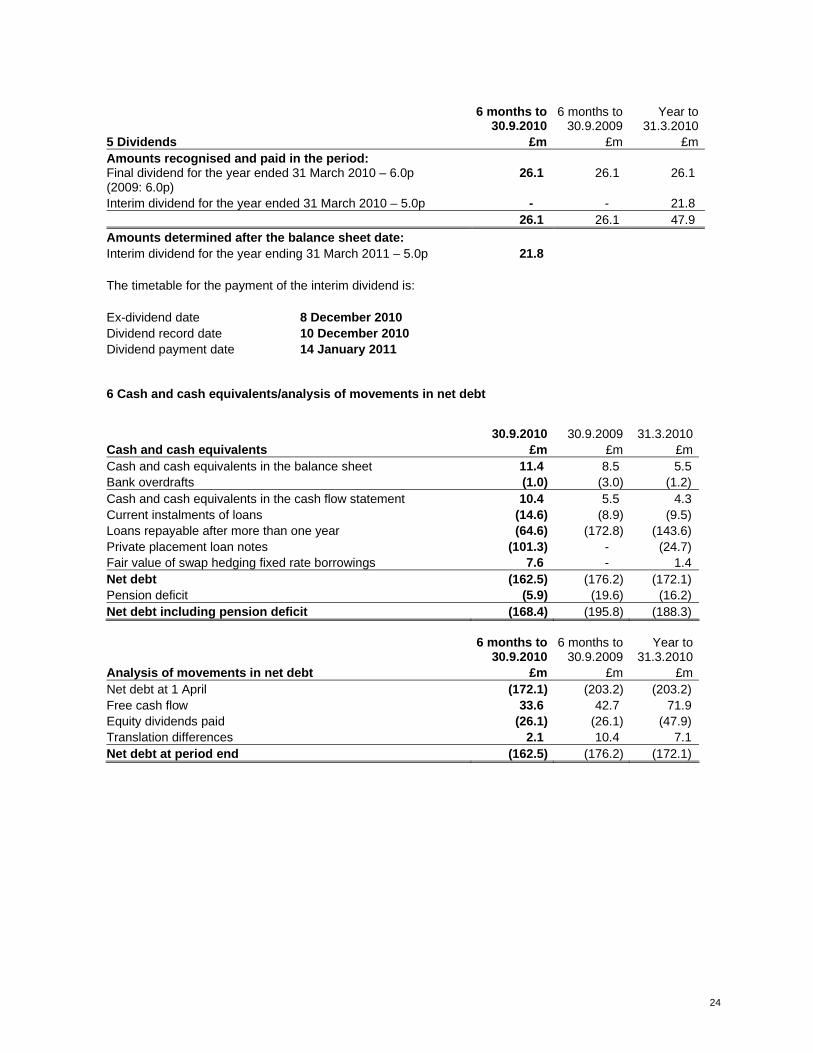
31.3.20105 Dividends £m £m £mAmounts recognised and paid in the period: Final dividend for the year ended 31 March 2010 – 6.0p (2009: 6.0p)
26.1 26.1 26.1
Interim dividend for the year ended 31 March 2010 – 5.0p - - 21.8 26.1 26.1 47.9 Amounts determined after the balance sheet date: Interim dividend for the year ending 31 March 2011 – 5.0p 21.8 The timetable for the payment of the interim dividend is: Ex-dividend date 8 December 2010 Dividend record date 10 December 2010 Dividend payment date 14 January 2011 6 Cash and cash equivalents/analysis of movements in net debt
30.9.2010 30.9.2009 31.3.2010Cash and cash equivalents £m £m £mCash and cash equivalents in the balance sheet 11.4 8.5 5.5 Bank overdrafts (1.0) (3.0) (1.2) Cash and cash equivalents in the cash flow statement 10.4 5.5 4.3 Current instalments of loans (14.6) (8.9) (9.5) Loans repayable after more than one year (64.6) (172.8) (143.6) Private placement loan notes (101.3) - (24.7) Fair value of swap hedging fixed rate borrowings 7.6 - 1.4 Net debt (162.5) (176.2) (172.1) Pension deficit (5.9) (19.6) (16.2) Net debt including pension deficit (168.4) (195.8) (188.3)
6 months to
30.9.20106 months to
30.9.2009 Year to
31.3.2010Analysis of movements in net debt £m £m £mNet debt at 1 April (172.1) (203.2) (203.2) Free cash flow 33.6 42.7 71.9 Equity dividends paid (26.1) (26.1) (47.9) Translation differences 2.1 10.4 7.1 Net debt at period end (162.5) (176.2) (172.1)
25
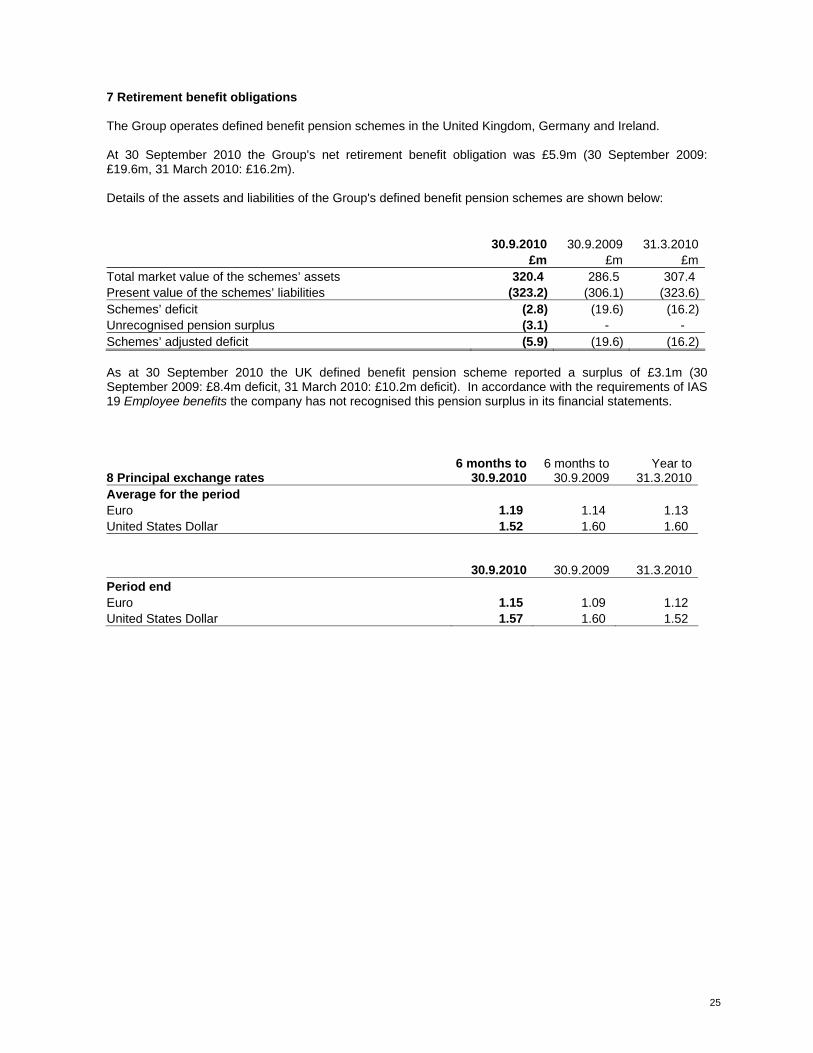
7 Retirement benefit obligations The Group operates defined benefit pension schemes in the United Kingdom, Germany and Ireland. At 30 September 2010 the Group's net retirement benefit obligation was £5.9m (30 September 2009: £19.6m, 31 March 2010: £16.2m). Details of the assets and liabilities of the Group's defined benefit pension schemes are shown below:
30.9.2010 30.9.2009 31.3.2010 £m £m £mTotal market value of the schemes’ assets 320.4 286.5 307.4 Present value of the schemes’ liabilities (323.2) (306.1) (323.6)Schemes’ deficit (2.8) (19.6) (16.2)Unrecognised pension surplus (3.1) - - Schemes’ adjusted deficit (5.9) (19.6) (16.2) As at 30 September 2010 the UK defined benefit pension scheme reported a surplus of £3.1m (30 September 2009: £8.4m deficit, 31 March 2010: £10.2m deficit). In accordance with the requirements of IAS 19 Employee benefits the company has not recognised this pension surplus in its financial statements.
8 Principal exchange rates 6 months to
30.9.20106 months to
30.9.2009 Year to
31.3.2010Average for the period Euro 1.19 1.14 1.13 United States Dollar 1.52 1.60 1.60
30.9.2010
30.9.2009 31.3.2010Period end Euro 1.15 1.09 1.12 United States Dollar 1.57 1.60 1.52
26
INDEPENDENT REVIEW REPORT TO ELECTROCOMPONENTS PLC Introduction We have been engaged by the company to review the condensed set of financial statements in the half-yearly financial report for the six months ended 30 September 2010 which comprises the condensed consolidated income statement, condensed consolidated statement of comprehensive income, condensed consolidated balance sheet, condensed consolidated cash flow statement and condensed consolidated statement of changes in equity and the related explanatory notes. We have read the other information contained in the half-yearly financial report and considered whether it contains any apparent misstatements or material inconsistencies with the information in the condensed set of financial statements. This report is made solely to the company in accordance with the terms of our engagement to assist the company in meeting the requirements of the Disclosure and Transparency Rules ("the DTR") of the UK's Financial Services Authority ("the UK FSA"). Our review has been undertaken so that we might state to the company those matters we are required to state to it in this report and for no other purpose. To the fullest extent permitted by law, we do not accept or assume responsibility to anyone other than the company for our review work, for this report, or for the conclusions we have reached. Directors' responsibilities The half-yearly financial report is the responsibility of, and has been approved by, the directors. The directors are responsible for preparing the half-yearly financial report in accordance with the DTR of the UK FSA. As disclosed in the Basis of Preparation and Principal Accounting Policies, the annual financial statements of the group are prepared in accordance with IFRSs as adopted by the EU. The condensed set of financial statements included in this half-yearly financial report has been prepared in accordance with IAS 34 Interim Financial Reporting as adopted by the EU. Our responsibility Our responsibility is to express to the company a conclusion on the condensed set of financial statements in the half-yearly financial report based on our review. Scope of review We conducted our review in accordance with International Standard on Review Engagements (UK and Ireland) 2410 Review of Interim Financial Information Performed by the Independent Auditor of the Entity issued by the Auditing Practices Board for use in the UK. A review of interim financial information consists of making enquiries, primarily of persons responsible for financial and accounting matters, and applying analytical and other review procedures. A review is substantially less in scope than an audit conducted in accordance with International Standards on Auditing (UK and Ireland) and consequently does not enable us to obtain assurance that we would become aware of all significant matters that might be identified in an audit. Accordingly, we do not express an audit opinion. Conclusion Based on our review, nothing has come to our attention that causes us to believe that the condensed set of financial statements in the half-yearly financial report for the six months ended 30 September 2010 is not prepared, in all material respects, in accordance with IAS 34 as adopted by the EU and the DTR of the UK FSA. Paul Sawdon for and on behalf of KPMG Audit Plc Chartered Accountants, London 12 November 2010
27
SAFE HARBOUR This half-yearly financial report contains certain statements, statistics and projections that are or may be forward-looking. The accuracy and completeness of all such statements, including, without limitation, statements regarding the future financial position, strategy, projected costs, plans and objectives for the management of future operations of Electrocomponents plc and its subsidiaries is not warranted or guaranteed. These statements typically contain words such as "intends", "expects", "anticipates", "estimates" and words of similar import. By their nature, forward-looking statements involve risk and uncertainty because they relate to events and depend on circumstances that will occur in the future. Although Electrocomponents plc believes that the expectations reflected in such statements are reasonable, no assurance can be given that such expectations will prove to be correct. There are a number of factors, which may be beyond the control of Electrocomponents plc, which could cause actual results and developments to differ materially from those expressed or implied by such forward-looking statements. Other than as required by applicable law or the applicable rules of any exchange on which our securities may be listed, Electrocomponents plc has no intention or obligation to update forward-looking statements contained herein.