Embed Size (px)
Citation preview
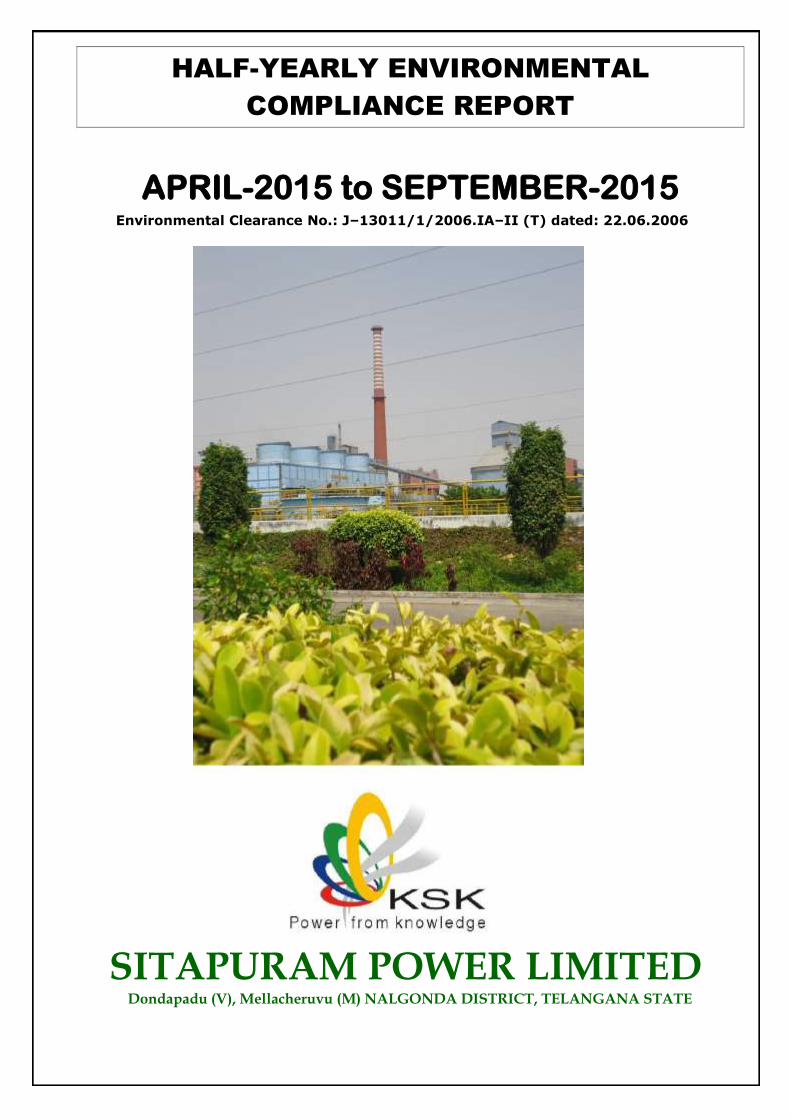
HALF-YEARLY ENVIRONMENTAL
COMPLIANCE REPORT
APRIL-2015 to SEPTEMBER-2015 Environmental Clearance No.: J–13011/1/2006.IA–II (T) dated: 22.06.2006
SITAPURAM POWER LIMITED
Dondapadu (V), Mellacheruvu (M) NALGONDA DISTRICT, TELANGANA STATE
6-MCR (Apr’15 to Sep’15) 1 | P a g e
TABLE OF CONTENT
S.No TITLE Page
1. Table of content 1
2. Point wise compliance for the conditions specified in
Environmental Clearance of MoEF 2-4
3. Ambient Air Quality & Sampling stations 5
4. Summary of Ambient Air Quality at 3 stations 6
5. Ambient Air Quality (Onsite): in plant 7-8
6. Ambient Air Quality (Offsite): Dondapadu (v) 9-10
7. Ambient Air Quality (Off site): Ramapuram (v) 11-12
8. Observation of Air monitoring 13
9. Trend of parameters during 6 month monitoring 14-18
10. Stack emission monitoring result and graphs 19-26
11. Table 1: Raw Water Quality 27
12. Table 2: Waste Water Quality (Guard Pond) 28
13. Table 3: Waste Water Quality (DM plant effluent) 29
14. Observation & Summary of the water Quality 30
15. Noise level Monitoring (Onsite & Offsite) 31
ANNEXURES
1. Annexure-I OPMS screenshot of APPCB website 32
2. Annexure-II Photos of Ash handling, DE system,First aid room, Toilets and RWH pit
33
3. Annexure-III Stack permission from AAI 34
4. Annexure-IV EC submission letter 35
5. Annexure-V EC notification in newspaper 36
6-MCR (Apr’15 to Sep’15) 2 | P a g e
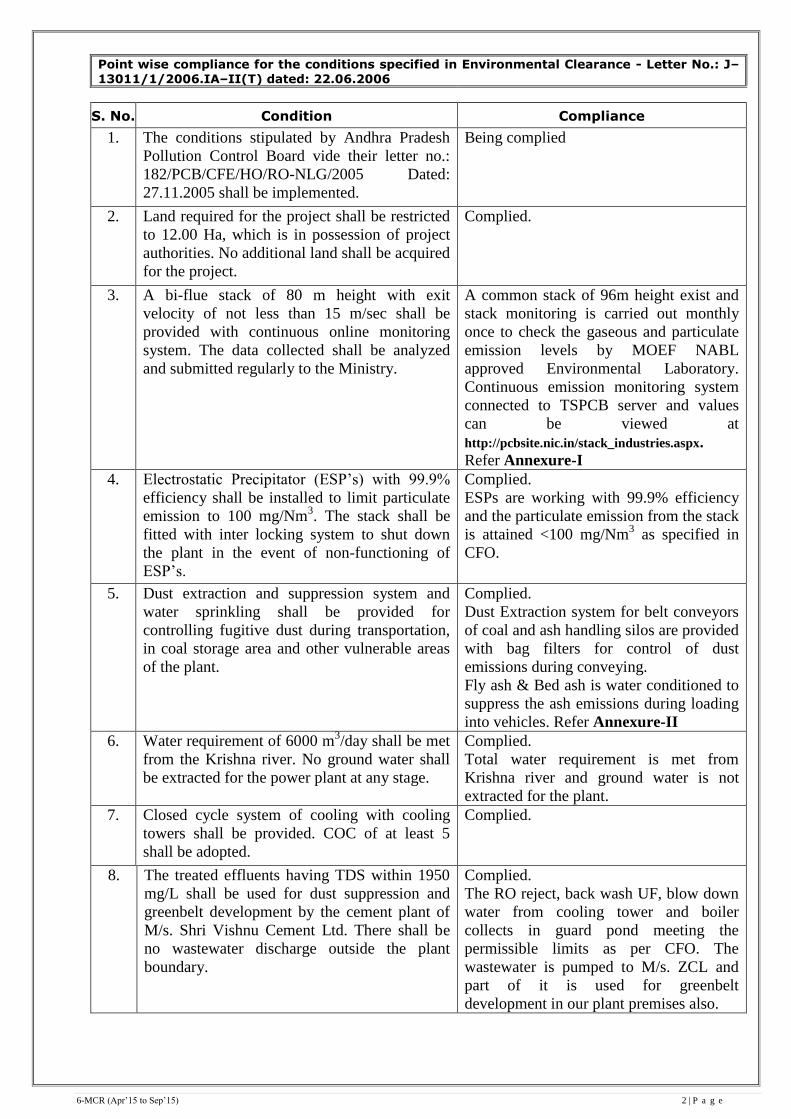
Point wise compliance for the conditions specified in Environmental Clearance - Letter No.: J–
13011/1/2006.IA–II(T) dated: 22.06.2006
S. No. Condition Compliance
1. The conditions stipulated by Andhra Pradesh
Pollution Control Board vide their letter no.:
182/PCB/CFE/HO/RO-NLG/2005 Dated:
27.11.2005 shall be implemented.
Being complied
2. Land required for the project shall be restricted
to 12.00 Ha, which is in possession of project
authorities. No additional land shall be acquired
for the project.
Complied.
3. A bi-flue stack of 80 m height with exit
velocity of not less than 15 m/sec shall be
provided with continuous online monitoring
system. The data collected shall be analyzed
and submitted regularly to the Ministry.
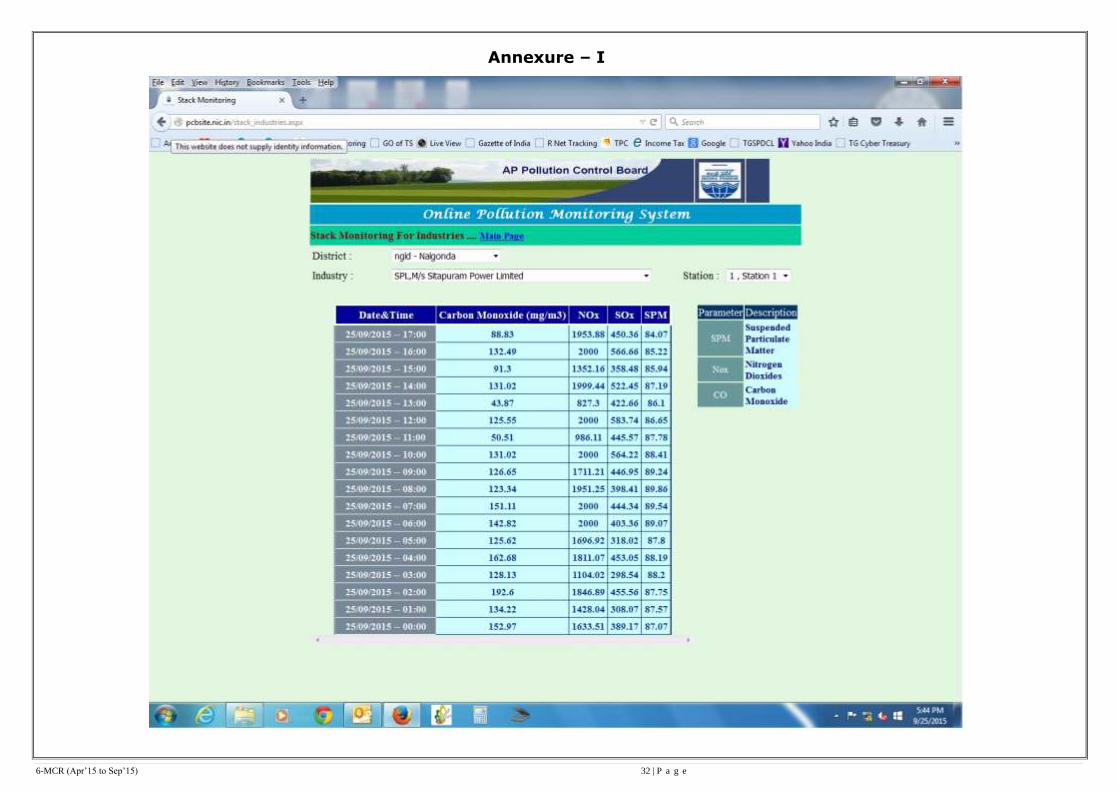
A common stack of 96m height exist and
stack monitoring is carried out monthly
once to check the gaseous and particulate
emission levels by MOEF NABL
approved Environmental Laboratory.
Continuous emission monitoring system
connected to TSPCB server and values
can be viewed at
http://pcbsite.nic.in/stack_industries.aspx. Refer Annexure-I
4. Electrostatic Precipitator (ESP’s) with 99.9%
efficiency shall be installed to limit particulate
emission to 100 mg/Nm3. The stack shall be
fitted with inter locking system to shut down
the plant in the event of non-functioning of
ESP’s.
Complied.
ESPs are working with 99.9% efficiency
and the particulate emission from the stack
is attained <100 mg/Nm3 as specified in
CFO.
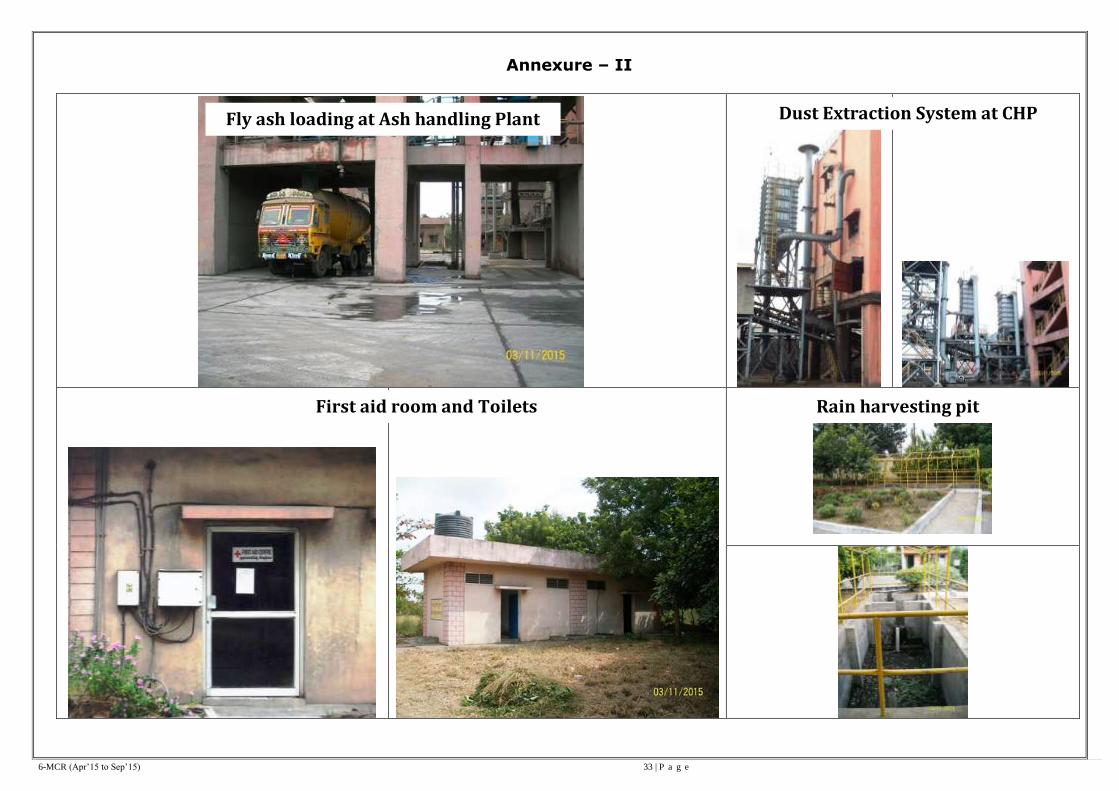
5. Dust extraction and suppression system and
water sprinkling shall be provided for
controlling fugitive dust during transportation,
in coal storage area and other vulnerable areas
of the plant.
Complied.
Dust Extraction system for belt conveyors
of coal and ash handling silos are provided
with bag filters for control of dust
emissions during conveying.
Fly ash & Bed ash is water conditioned to
suppress the ash emissions during loading
into vehicles. Refer Annexure-II
6. Water requirement of 6000 m3/day shall be met
from the Krishna river. No ground water shall
be extracted for the power plant at any stage.
Complied.
Total water requirement is met from
Krishna river and ground water is not
extracted for the plant.
7. Closed cycle system of cooling with cooling
towers shall be provided. COC of at least 5
shall be adopted.
Complied.
8. The treated effluents having TDS within 1950
mg/L shall be used for dust suppression and
greenbelt development by the cement plant of
M/s. Shri Vishnu Cement Ltd. There shall be
no wastewater discharge outside the plant
boundary.
Complied.
The RO reject, back wash UF, blow down
water from cooling tower and boiler
collects in guard pond meeting the
permissible limits as per CFO. The
wastewater is pumped to M/s. ZCL and
part of it is used for greenbelt
development in our plant premises also.
6-MCR (Apr’15 to Sep’15) 3 | P a g e
S. No. Condition Compliance
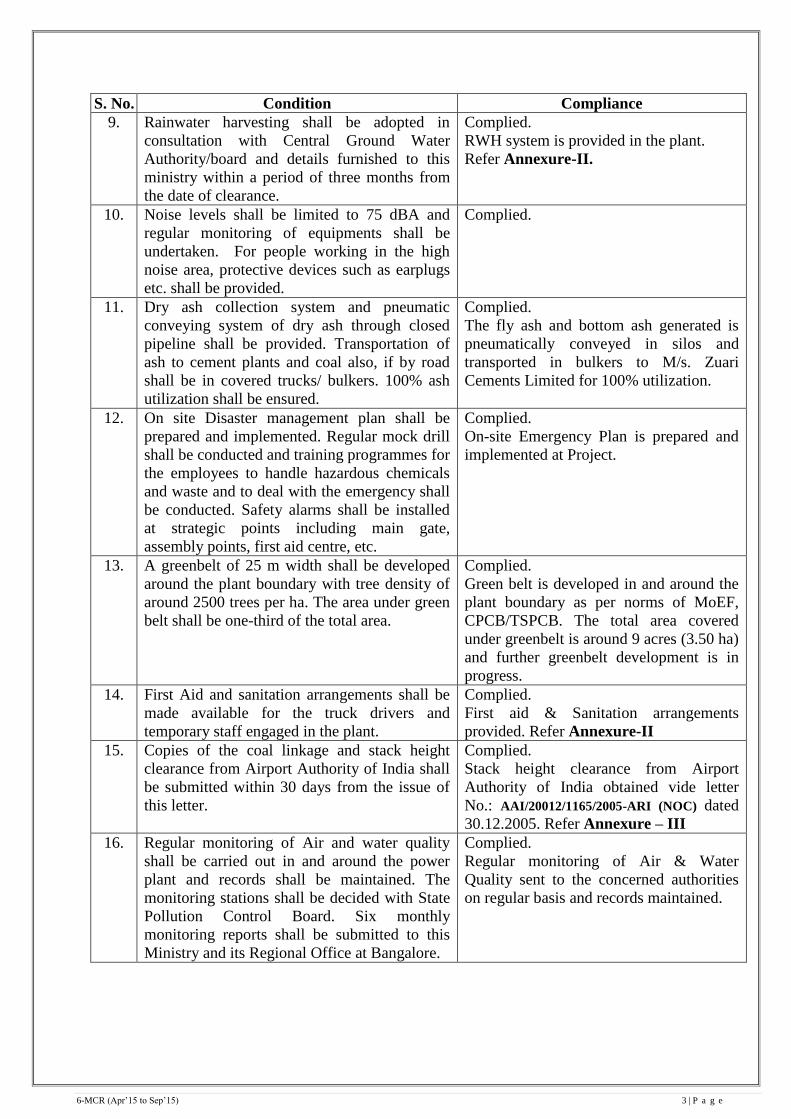
9. Rainwater harvesting shall be adopted in
consultation with Central Ground Water
Authority/board and details furnished to this
ministry within a period of three months from
the date of clearance.
Complied.
RWH system is provided in the plant.
Refer Annexure-II.
10. Noise levels shall be limited to 75 dBA and
regular monitoring of equipments shall be
undertaken. For people working in the high
noise area, protective devices such as earplugs
etc. shall be provided.
Complied.
11. Dry ash collection system and pneumatic
conveying system of dry ash through closed
pipeline shall be provided. Transportation of
ash to cement plants and coal also, if by road
shall be in covered trucks/ bulkers. 100% ash
utilization shall be ensured.
Complied.
The fly ash and bottom ash generated is
pneumatically conveyed in silos and
transported in bulkers to M/s. Zuari
Cements Limited for 100% utilization.
12. On site Disaster management plan shall be
prepared and implemented. Regular mock drill
shall be conducted and training programmes for
the employees to handle hazardous chemicals
and waste and to deal with the emergency shall
be conducted. Safety alarms shall be installed
at strategic points including main gate,
assembly points, first aid centre, etc.
Complied.
On-site Emergency Plan is prepared and
implemented at Project.
13. A greenbelt of 25 m width shall be developed
around the plant boundary with tree density of
around 2500 trees per ha. The area under green
belt shall be one-third of the total area.
Complied.
Green belt is developed in and around the
plant boundary as per norms of MoEF,
CPCB/TSPCB. The total area covered
under greenbelt is around 9 acres (3.50 ha)
and further greenbelt development is in
progress.
14. First Aid and sanitation arrangements shall be
made available for the truck drivers and
temporary staff engaged in the plant.
Complied.
First aid & Sanitation arrangements
provided. Refer Annexure-II
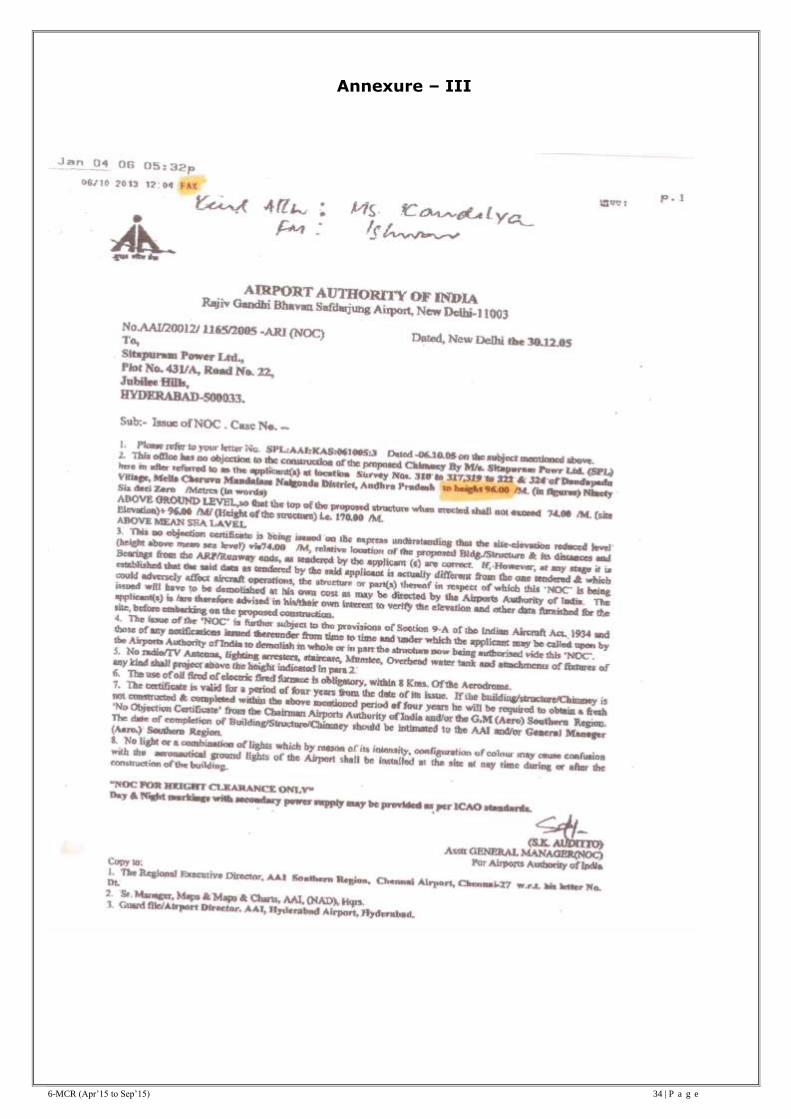
15. Copies of the coal linkage and stack height
clearance from Airport Authority of India shall
be submitted within 30 days from the issue of
this letter.
Complied.
Stack height clearance from Airport
Authority of India obtained vide letter
No.: AAI/20012/1165/2005-ARI (NOC) dated
30.12.2005. Refer Annexure – III
16. Regular monitoring of Air and water quality
shall be carried out in and around the power
plant and records shall be maintained. The
monitoring stations shall be decided with State
Pollution Control Board. Six monthly
monitoring reports shall be submitted to this
Ministry and its Regional Office at Bangalore.
Complied.
Regular monitoring of Air & Water
Quality sent to the concerned authorities
on regular basis and records maintained.
6-MCR (Apr’15 to Sep’15) 4 | P a g e
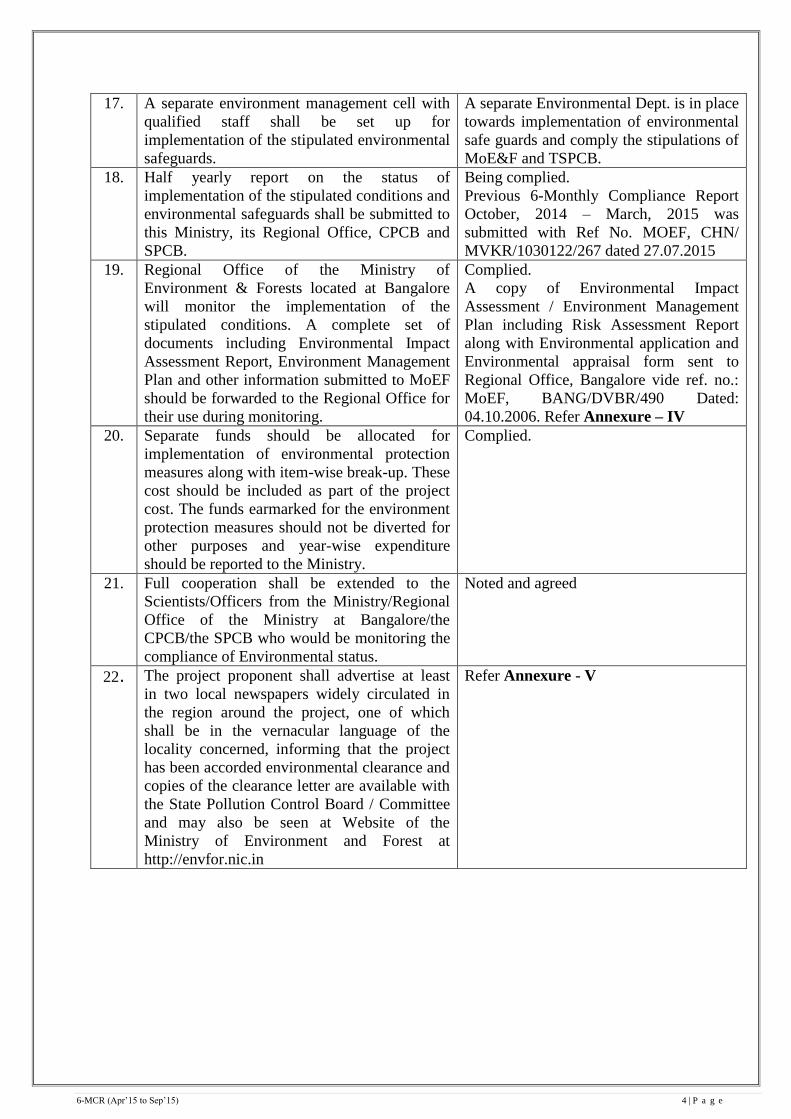
17. A separate environment management cell with
qualified staff shall be set up for
implementation of the stipulated environmental
safeguards.
A separate Environmental Dept. is in place
towards implementation of environmental
safe guards and comply the stipulations of
MoE&F and TSPCB.
18. Half yearly report on the status of
implementation of the stipulated conditions and
environmental safeguards shall be submitted to
this Ministry, its Regional Office, CPCB and
SPCB.
Being complied.
Previous 6-Monthly Compliance Report
October, 2014 – March, 2015 was
submitted with Ref No. MOEF, CHN/
MVKR/1030122/267 dated 27.07.2015
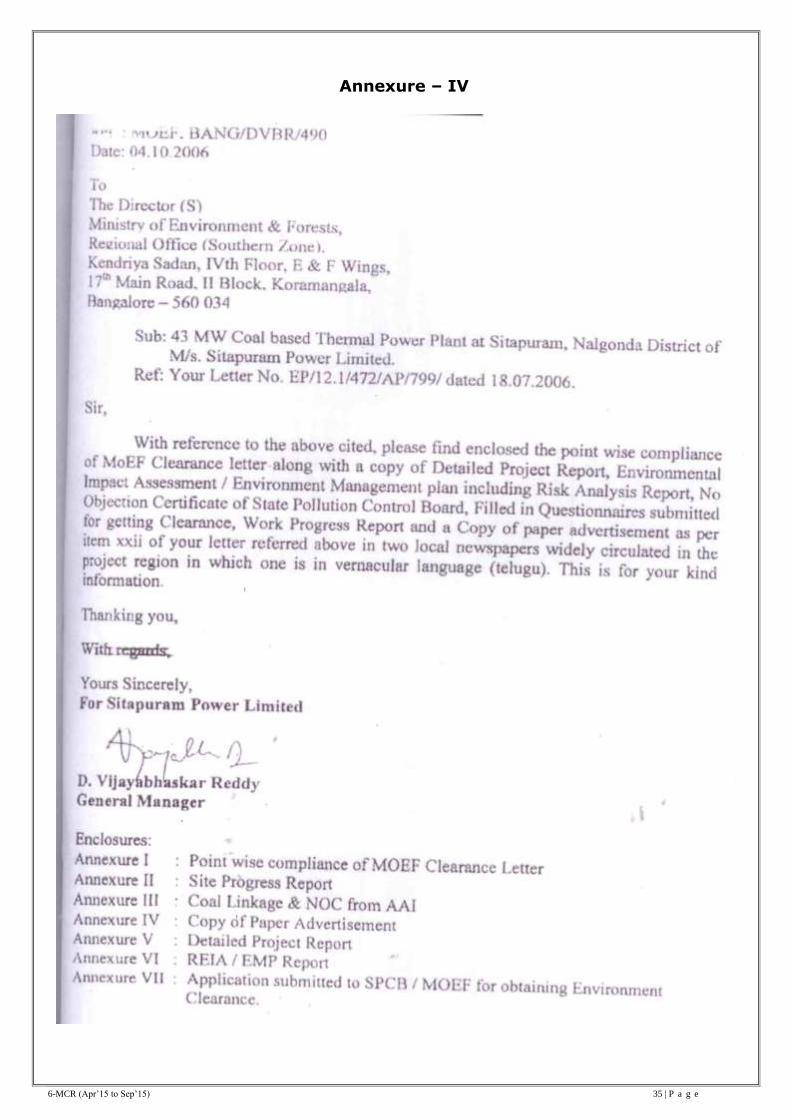
19. Regional Office of the Ministry of
Environment & Forests located at Bangalore
will monitor the implementation of the
stipulated conditions. A complete set of
documents including Environmental Impact
Assessment Report, Environment Management
Plan and other information submitted to MoEF
should be forwarded to the Regional Office for
their use during monitoring.
Complied.
A copy of Environmental Impact
Assessment / Environment Management
Plan including Risk Assessment Report
along with Environmental application and
Environmental appraisal form sent to
Regional Office, Bangalore vide ref. no.:
MoEF, BANG/DVBR/490 Dated:
04.10.2006. Refer Annexure – IV
20. Separate funds should be allocated for
implementation of environmental protection
measures along with item-wise break-up. These
cost should be included as part of the project
cost. The funds earmarked for the environment
protection measures should not be diverted for
other purposes and year-wise expenditure
should be reported to the Ministry.
Complied.
21. Full cooperation shall be extended to the
Scientists/Officers from the Ministry/Regional
Office of the Ministry at Bangalore/the
CPCB/the SPCB who would be monitoring the
compliance of Environmental status.
Noted and agreed
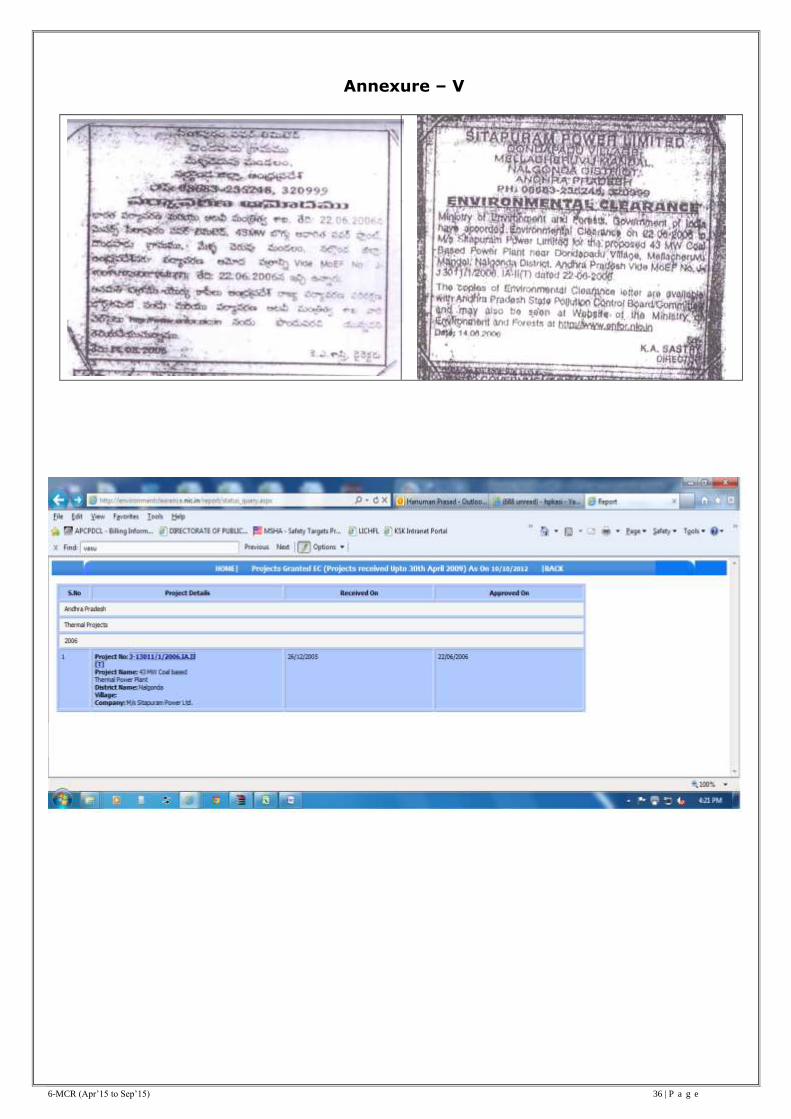
22. The project proponent shall advertise at least
in two local newspapers widely circulated in
the region around the project, one of which
shall be in the vernacular language of the
locality concerned, informing that the project
has been accorded environmental clearance and
copies of the clearance letter are available with
the State Pollution Control Board / Committee
and may also be seen at Website of the
Ministry of Environment and Forest at
http://envfor.nic.in
Refer Annexure - V
6-MCR (Apr’15 to Sep’15) 5 | P a g e
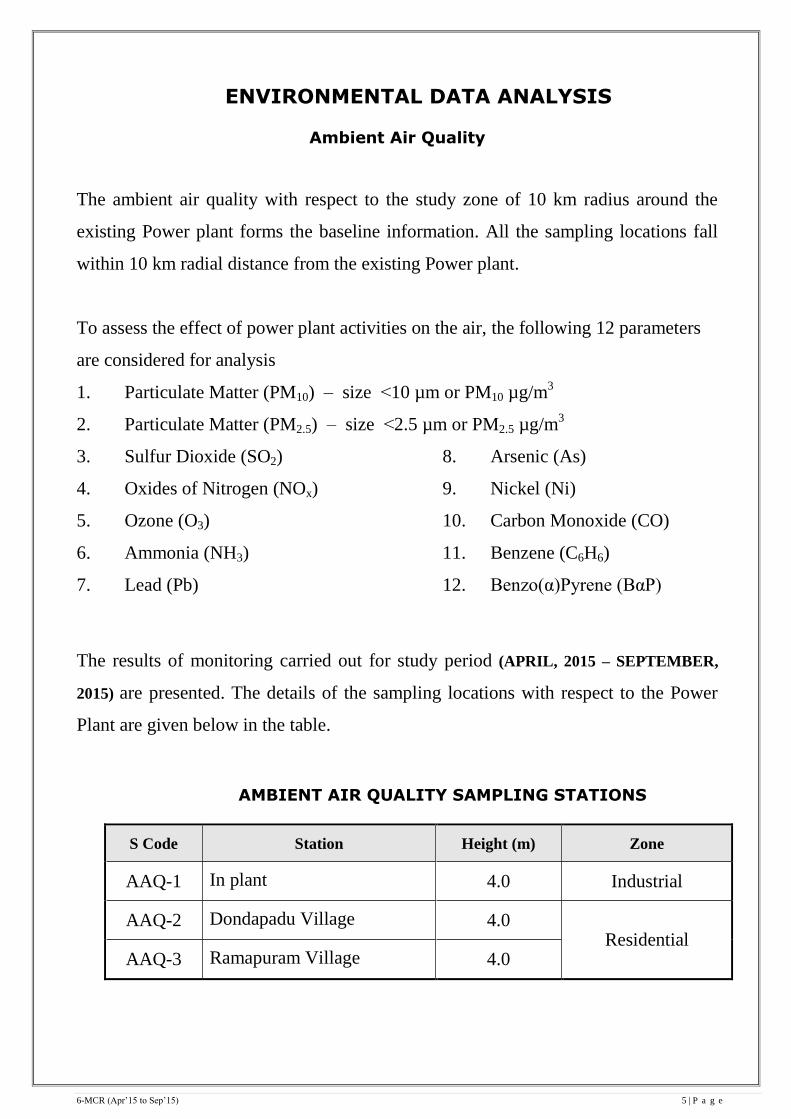
ENVIRONMENTAL DATA ANALYSIS
Ambient Air Quality
The ambient air quality with respect to the study zone of 10 km radius around the
existing Power plant forms the baseline information. All the sampling locations fall
within 10 km radial distance from the existing Power plant.
To assess the effect of power plant activities on the air, the following 12 parameters
are considered for analysis
1. Particulate Matter (PM10) – size ˂10 µm or PM10 µg/m3
2. Particulate Matter (PM2.5) – size ˂2.5 µm or PM2.5 µg/m3
3. Sulfur Dioxide (SO2)
4. Oxides of Nitrogen (NOx)
5. Ozone (O3)
6. Ammonia (NH3)
7. Lead (Pb)
8. Arsenic (As)
9. Nickel (Ni)
10. Carbon Monoxide (CO)
11. Benzene (C6H6)
12. Benzo(α)Pyrene (BαP)
The results of monitoring carried out for study period (APRIL, 2015 – SEPTEMBER,
2015) are presented. The details of the sampling locations with respect to the Power
Plant are given below in the table.
AMBIENT AIR QUALITY SAMPLING STATIONS
S Code Station Height (m) Zone
AAQ-1 In plant 4.0 Industrial
AAQ-2 Dondapadu Village 4.0 Residential
AAQ-3 Ramapuram Village 4.0
6-MCR (Apr’15 to Sep’15) 6 | P a g e
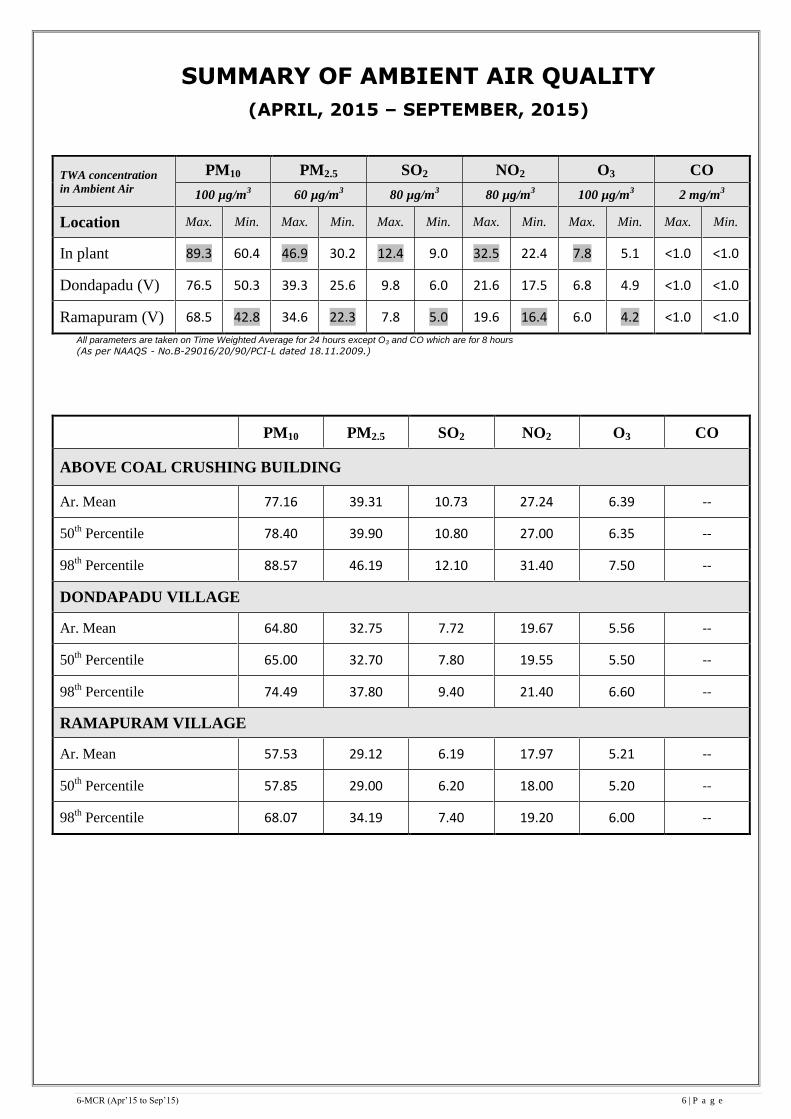
SUMMARY OF AMBIENT AIR QUALITY
(APRIL, 2015 – SEPTEMBER, 2015)
TWA concentration
in Ambient Air PM10 PM2.5 SO2 NO2 O3 CO
100 µg/m3 60 µg/m
3 80 µg/m
3 80 µg/m
3 100 µg/m
3 2 mg/m
3
Location Max. Min. Max. Min. Max. Min. Max. Min. Max. Min. Max. Min.
In plant 89.3 60.4 46.9 30.2 12.4 9.0 32.5 22.4 7.8 5.1 <1.0 <1.0
Dondapadu (V) 76.5 50.3 39.3 25.6 9.8 6.0 21.6 17.5 6.8 4.9 <1.0 <1.0
Ramapuram (V) 68.5 42.8 34.6 22.3 7.8 5.0 19.6 16.4 6.0 4.2 <1.0 <1.0
All parameters are taken on Time Weighted Average for 24 hours except O3 and CO which are for 8 hours
(As per NAAQS - No.B-29016/20/90/PCI-L dated 18.11.2009.)
PM10 PM2.5 SO2 NO2 O3 CO
ABOVE COAL CRUSHING BUILDING
Ar. Mean 77.16 39.31 10.73 27.24 6.39 --
50th Percentile 78.40 39.90 10.80 27.00 6.35 --
98th Percentile 88.57 46.19 12.10 31.40 7.50 --
DONDAPADU VILLAGE
Ar. Mean 64.80 32.75 7.72 19.67 5.56 --
50th Percentile 65.00 32.70 7.80 19.55 5.50 --
98th Percentile 74.49 37.80 9.40 21.40 6.60 --
RAMAPURAM VILLAGE
Ar. Mean 57.53 29.12 6.19 17.97 5.21 --
50th Percentile 57.85 29.00 6.20 18.00 5.20 --
98th Percentile 68.07 34.19 7.40 19.20 6.00 --
6-MCR (Apr’15 to Sep’15) 7 | P a g e
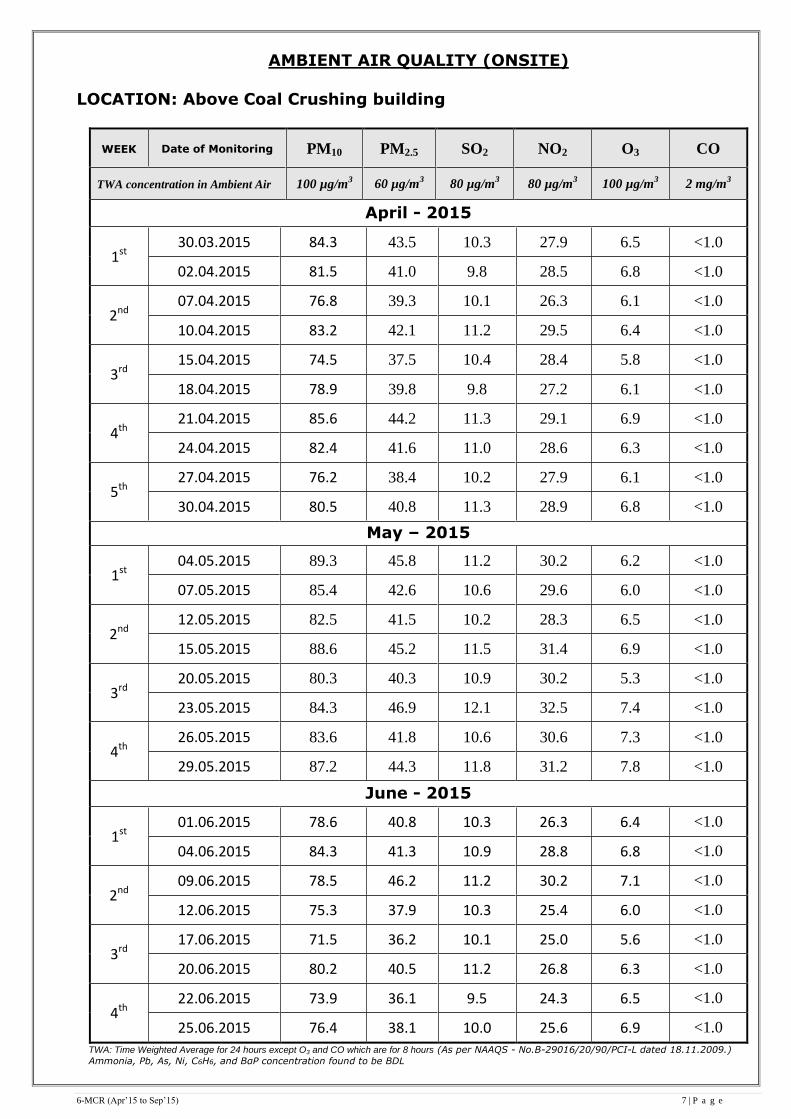
AMBIENT AIR QUALITY (ONSITE)
LOCATION: Above Coal Crushing building
WEEK Date of Monitoring PM10 PM2.5 SO2 NO2 O3 CO
TWA concentration in Ambient Air 100 µg/m3 60 µg/m
3 80 µg/m
3 80 µg/m
3 100 µg/m
3 2 mg/m
3
April - 2015
1st 30.03.2015 84.3 43.5 10.3 27.9 6.5 <1.0
02.04.2015 81.5 41.0 9.8 28.5 6.8 <1.0
2nd 07.04.2015 76.8 39.3 10.1 26.3 6.1 <1.0
10.04.2015 83.2 42.1 11.2 29.5 6.4 <1.0
3rd 15.04.2015 74.5 37.5 10.4 28.4 5.8 <1.0
18.04.2015 78.9 39.8 9.8 27.2 6.1 <1.0
4th 21.04.2015 85.6 44.2 11.3 29.1 6.9 <1.0
24.04.2015 82.4 41.6 11.0 28.6 6.3 <1.0
5th 27.04.2015 76.2 38.4 10.2 27.9 6.1 <1.0
30.04.2015 80.5 40.8 11.3 28.9 6.8 <1.0
May – 2015
1st 04.05.2015 89.3 45.8 11.2 30.2 6.2 <1.0
07.05.2015 85.4 42.6 10.6 29.6 6.0 <1.0
2nd 12.05.2015 82.5 41.5 10.2 28.3 6.5 <1.0
15.05.2015 88.6 45.2 11.5 31.4 6.9 <1.0
3rd 20.05.2015 80.3 40.3 10.9 30.2 5.3 <1.0
23.05.2015 84.3 46.9 12.1 32.5 7.4 <1.0
4th 26.05.2015 83.6 41.8 10.6 30.6 7.3 <1.0
29.05.2015 87.2 44.3 11.8 31.2 7.8 <1.0
June - 2015
1st 01.06.2015 78.6 40.8 10.3 26.3 6.4 <1.0
04.06.2015 84.3 41.3 10.9 28.8 6.8 <1.0
2nd 09.06.2015 78.5 46.2 11.2 30.2 7.1 <1.0
12.06.2015 75.3 37.9 10.3 25.4 6.0 <1.0
3rd 17.06.2015 71.5 36.2 10.1 25.0 5.6 <1.0
20.06.2015 80.2 40.5 11.2 26.8 6.3 <1.0
4th 22.06.2015 73.9 36.1 9.5 24.3 6.5 <1.0
25.06.2015 76.4 38.1 10.0 25.6 6.9 <1.0
TWA: Time Weighted Average for 24 hours except O3 and CO which are for 8 hours (As per NAAQS - No.B-29016/20/90/PCI-L dated 18.11.2009.)
Ammonia, Pb, As, Ni, C6H6, and BαP concentration found to be BDL
6-MCR (Apr’15 to Sep’15) 8 | P a g e
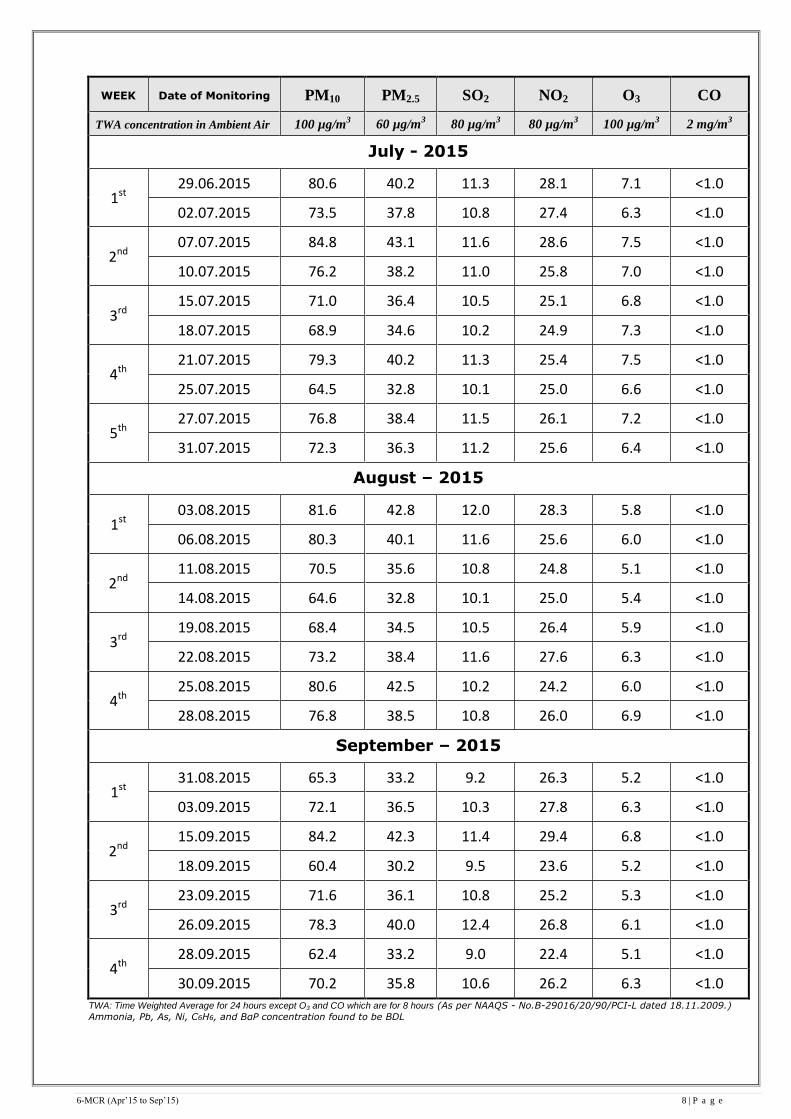
WEEK Date of Monitoring PM10 PM2.5 SO2 NO2 O3 CO
TWA concentration in Ambient Air 100 µg/m3 60 µg/m
3 80 µg/m
3 80 µg/m
3 100 µg/m
3 2 mg/m
3
July - 2015
1st 29.06.2015 80.6 40.2 11.3 28.1 7.1 <1.0
02.07.2015 73.5 37.8 10.8 27.4 6.3 <1.0
2nd 07.07.2015 84.8 43.1 11.6 28.6 7.5 <1.0
10.07.2015 76.2 38.2 11.0 25.8 7.0 <1.0
3rd 15.07.2015 71.0 36.4 10.5 25.1 6.8 <1.0
18.07.2015 68.9 34.6 10.2 24.9 7.3 <1.0
4th 21.07.2015 79.3 40.2 11.3 25.4 7.5 <1.0
25.07.2015 64.5 32.8 10.1 25.0 6.6 <1.0
5th 27.07.2015 76.8 38.4 11.5 26.1 7.2 <1.0
31.07.2015 72.3 36.3 11.2 25.6 6.4 <1.0
August – 2015
1st 03.08.2015 81.6 42.8 12.0 28.3 5.8 <1.0
06.08.2015 80.3 40.1 11.6 25.6 6.0 <1.0
2nd 11.08.2015 70.5 35.6 10.8 24.8 5.1 <1.0
14.08.2015 64.6 32.8 10.1 25.0 5.4 <1.0
3rd 19.08.2015 68.4 34.5 10.5 26.4 5.9 <1.0
22.08.2015 73.2 38.4 11.6 27.6 6.3 <1.0
4th 25.08.2015 80.6 42.5 10.2 24.2 6.0 <1.0
28.08.2015 76.8 38.5 10.8 26.0 6.9 <1.0
September – 2015
1st 31.08.2015 65.3 33.2 9.2 26.3 5.2 <1.0
03.09.2015 72.1 36.5 10.3 27.8 6.3 <1.0
2nd 15.09.2015 84.2 42.3 11.4 29.4 6.8 <1.0
18.09.2015 60.4 30.2 9.5 23.6 5.2 <1.0
3rd 23.09.2015 71.6 36.1 10.8 25.2 5.3 <1.0
26.09.2015 78.3 40.0 12.4 26.8 6.1 <1.0
4th 28.09.2015 62.4 33.2 9.0 22.4 5.1 <1.0
30.09.2015 70.2 35.8 10.6 26.2 6.3 <1.0
TWA: Time Weighted Average for 24 hours except O3 and CO which are for 8 hours (As per NAAQS - No.B-29016/20/90/PCI-L dated 18.11.2009.)
Ammonia, Pb, As, Ni, C6H6, and BαP concentration found to be BDL
6-MCR (Apr’15 to Sep’15) 9 | P a g e
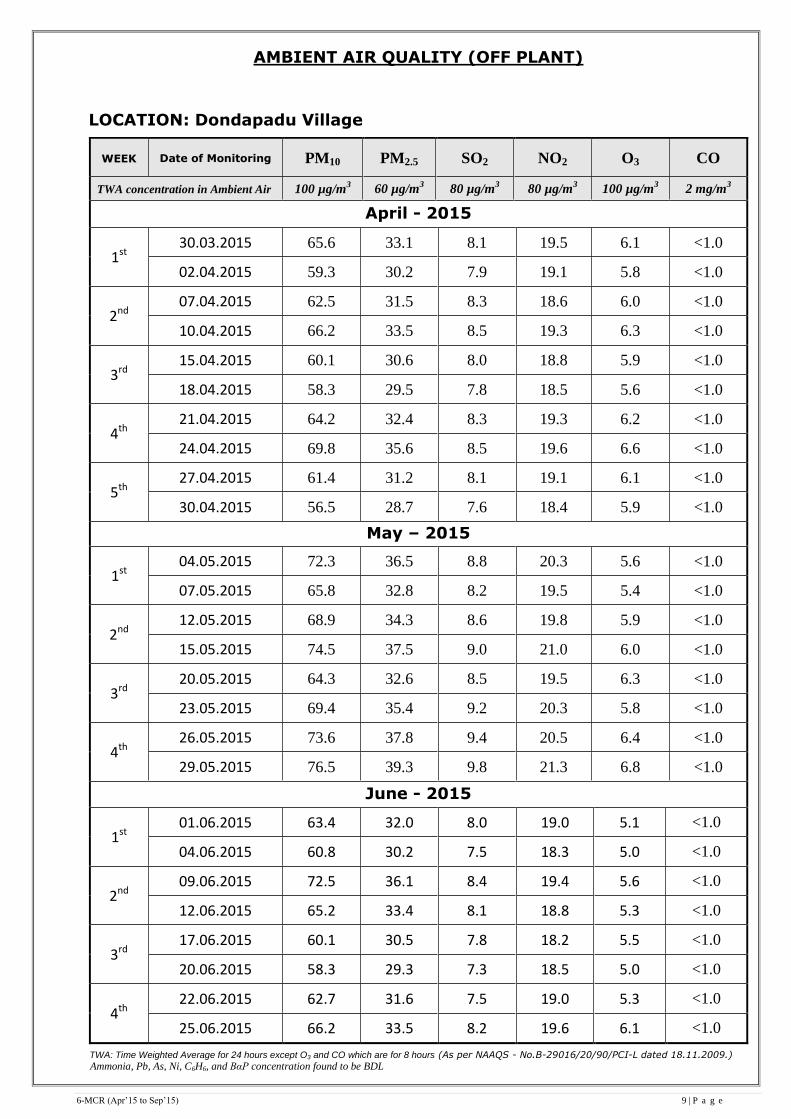
AMBIENT AIR QUALITY (OFF PLANT)
LOCATION: Dondapadu Village
WEEK Date of Monitoring PM10 PM2.5 SO2 NO2 O3 CO
TWA concentration in Ambient Air 100 µg/m3 60 µg/m
3 80 µg/m
3 80 µg/m
3 100 µg/m
3 2 mg/m
3
April - 2015
1st 30.03.2015 65.6 33.1 8.1 19.5 6.1 <1.0
02.04.2015 59.3 30.2 7.9 19.1 5.8 <1.0
2nd 07.04.2015 62.5 31.5 8.3 18.6 6.0 <1.0
10.04.2015 66.2 33.5 8.5 19.3 6.3 <1.0
3rd 15.04.2015 60.1 30.6 8.0 18.8 5.9 <1.0
18.04.2015 58.3 29.5 7.8 18.5 5.6 <1.0
4th 21.04.2015 64.2 32.4 8.3 19.3 6.2 <1.0
24.04.2015 69.8 35.6 8.5 19.6 6.6 <1.0
5th 27.04.2015 61.4 31.2 8.1 19.1 6.1 <1.0
30.04.2015 56.5 28.7 7.6 18.4 5.9 <1.0
May – 2015
1st 04.05.2015 72.3 36.5 8.8 20.3 5.6 <1.0
07.05.2015 65.8 32.8 8.2 19.5 5.4 <1.0
2nd 12.05.2015 68.9 34.3 8.6 19.8 5.9 <1.0
15.05.2015 74.5 37.5 9.0 21.0 6.0 <1.0
3rd 20.05.2015 64.3 32.6 8.5 19.5 6.3 <1.0
23.05.2015 69.4 35.4 9.2 20.3 5.8 <1.0
4th 26.05.2015 73.6 37.8 9.4 20.5 6.4 <1.0
29.05.2015 76.5 39.3 9.8 21.3 6.8 <1.0
June - 2015
1st 01.06.2015 63.4 32.0 8.0 19.0 5.1 <1.0
04.06.2015 60.8 30.2 7.5 18.3 5.0 <1.0
2nd 09.06.2015 72.5 36.1 8.4 19.4 5.6 <1.0
12.06.2015 65.2 33.4 8.1 18.8 5.3 <1.0
3rd 17.06.2015 60.1 30.5 7.8 18.2 5.5 <1.0
20.06.2015 58.3 29.3 7.3 18.5 5.0 <1.0
4th 22.06.2015 62.7 31.6 7.5 19.0 5.3 <1.0
25.06.2015 66.2 33.5 8.2 19.6 6.1 <1.0
TWA: Time Weighted Average for 24 hours except O3 and CO which are for 8 hours (As per NAAQS - No.B-29016/20/90/PCI-L dated 18.11.2009.)
Ammonia, Pb, As, Ni, C6H6, and BαP concentration found to be BDL

6-MCR (Apr’15 to Sep’15) 10 | P a g e
WEEK Date of Monitoring PM10 PM2.5 SO2 NO2 O3 CO
TWA concentration in Ambient Air 100 µg/m3 60 µg/m
3 80 µg/m
3 80 µg/m
3 100 µg/m
3 2 mg/m
3
July - 2015
1st 29.06.2015 59.2 29.5 7.6 19.6 5.0 <1.0
02.07.2015 62.5 31.6 7.9 19.9 5.2 <1.0
2nd 07.07.2015 68.6 34.2 8.1 20.2 5.1 <1.0
10.07.2015 74.2 37.8 8.3 21.4 5.8 <1.0
3rd 15.07.2015 70.3 35.4 7.5 20.5 5.6 <1.0
18.07.2015 65.6 32.5 7.0 19.8 5.3 <1.0
4th 21.07.2015 69.2 35.1 7.2 20.2 5.2 <1.0
25.07.2015 72.5 36.4 7.4 21.6 5.5 <1.0
5th 27.07.2015 63.4 32.5 6.8 19.5 5.1 <1.0
31.07.2015 67.2 34.6 7.3 21.2 5.9 <1.0
August – 2015
1st 03.08.2015 65.2 32.6 7.1 20.1 5.3 <1.0
06.08.2015 70.4 35.2 7.6 20.3 5.0 <1.0
2nd 11.08.2015 72.8 36.3 7.9 21.0 5.6 <1.0
14.08.2015 60.2 30.8 7.0 19.2 5.1 <1.0
3rd 19.08.2015 55.4 26.5 6.8 18.6 4.9 <1.0
22.08.2015 68.6 34.9 7.2 20.0 5.0 <1.0
4th 25.08.2015 71.4 36.2 7.8 21.3 5.5 <1.0
28.08.2015 64.8 32.8 6.5 20.8 5.2 <1.0
September – 2015
1st 31.08.2015 60.3 30.6 6.5 19.5 5.6 <1.0
03.09.2015 54.5 27.8 6.1 18.3 5.1 <1.0
2nd 15.09.2015 64.8 33.2 7.4 20.2 5.2 <1.0
18.09.2015 50.3 25.6 6.0 17.5 5.0 <1.0
3rd 23.09.2015 62.2 32.1 7.0 20.1 5.1 <1.0
26.09.2015 56.5 28.3 6.8 19.3 5.3 <1.0
4th 28.09.2015 68.3 34.5 7.2 20.6 5.8 <1.0
30.09.2015 52.8 26.8 6.2 19.0 5.0 <1.0
TWA: Time Weighted Average for 24 hours except O3 and CO which are for 8 hours (as per NAAQS - No.B-29016/20/90/PCI-L dated 18.11.2009.)
Ammonia, Pb, As, Ni, C6H6, BαP concentrations found to be BDL
6-MCR (Apr’15 to Sep’15) 11 | P a g e
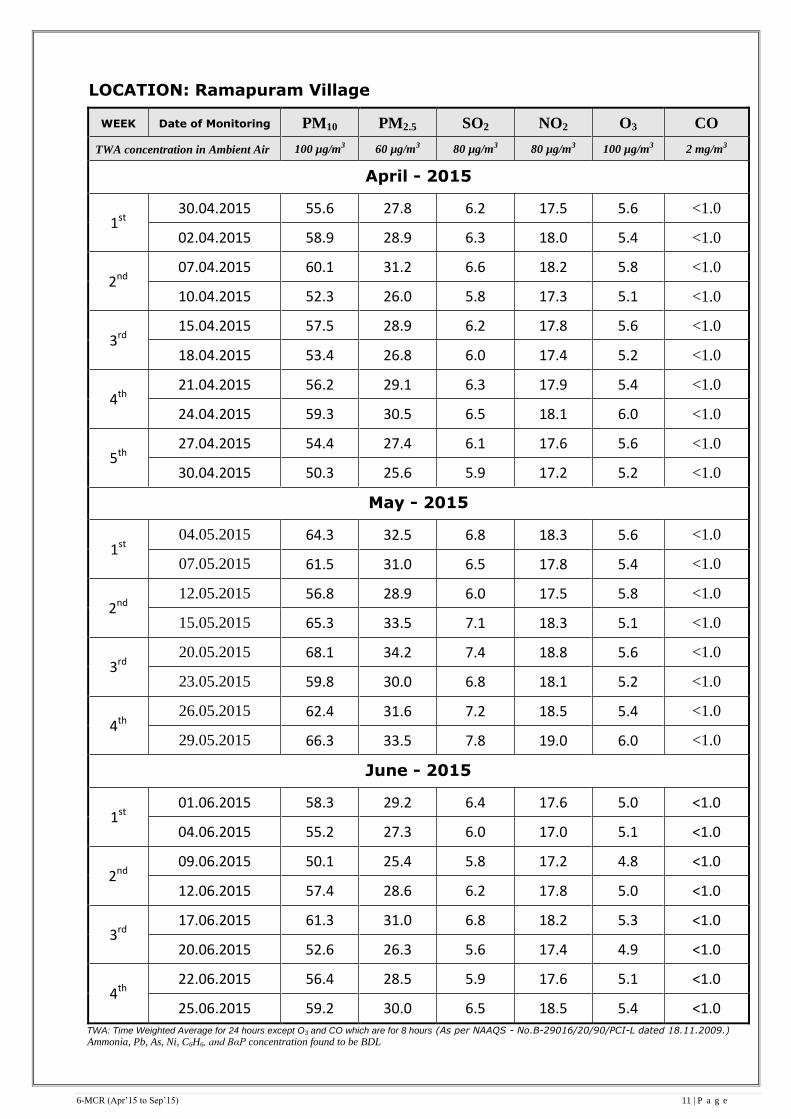
LOCATION: Ramapuram Village
WEEK Date of Monitoring PM10 PM2.5 SO2 NO2 O3 CO
TWA concentration in Ambient Air 100 µg/m3 60 µg/m3 80 µg/m3 80 µg/m3 100 µg/m3 2 mg/m3
April - 2015
1st 30.04.2015 55.6 27.8 6.2 17.5 5.6 <1.0
02.04.2015 58.9 28.9 6.3 18.0 5.4 <1.0
2nd 07.04.2015 60.1 31.2 6.6 18.2 5.8 <1.0
10.04.2015 52.3 26.0 5.8 17.3 5.1 <1.0
3rd 15.04.2015 57.5 28.9 6.2 17.8 5.6 <1.0
18.04.2015 53.4 26.8 6.0 17.4 5.2 <1.0
4th 21.04.2015 56.2 29.1 6.3 17.9 5.4 <1.0
24.04.2015 59.3 30.5 6.5 18.1 6.0 <1.0
5th 27.04.2015 54.4 27.4 6.1 17.6 5.6 <1.0
30.04.2015 50.3 25.6 5.9 17.2 5.2 <1.0
May - 2015
1st 04.05.2015 64.3 32.5 6.8 18.3 5.6 <1.0
07.05.2015 61.5 31.0 6.5 17.8 5.4 <1.0
2nd 12.05.2015 56.8 28.9 6.0 17.5 5.8 <1.0
15.05.2015 65.3 33.5 7.1 18.3 5.1 <1.0
3rd 20.05.2015 68.1 34.2 7.4 18.8 5.6 <1.0
23.05.2015 59.8 30.0 6.8 18.1 5.2 <1.0
4th 26.05.2015 62.4 31.6 7.2 18.5 5.4 <1.0
29.05.2015 66.3 33.5 7.8 19.0 6.0 <1.0
June - 2015
1st 01.06.2015 58.3 29.2 6.4 17.6 5.0 <1.0
04.06.2015 55.2 27.3 6.0 17.0 5.1 <1.0
2nd 09.06.2015 50.1 25.4 5.8 17.2 4.8 <1.0
12.06.2015 57.4 28.6 6.2 17.8 5.0 <1.0
3rd 17.06.2015 61.3 31.0 6.8 18.2 5.3 <1.0
20.06.2015 52.6 26.3 5.6 17.4 4.9 <1.0
4th 22.06.2015 56.4 28.5 5.9 17.6 5.1 <1.0
25.06.2015 59.2 30.0 6.5 18.5 5.4 <1.0
TWA: Time Weighted Average for 24 hours except O3 and CO which are for 8 hours (As per NAAQS - No.B-29016/20/90/PCI-L dated 18.11.2009.)
Ammonia, Pb, As, Ni, C6H6, and BαP concentration found to be BDL
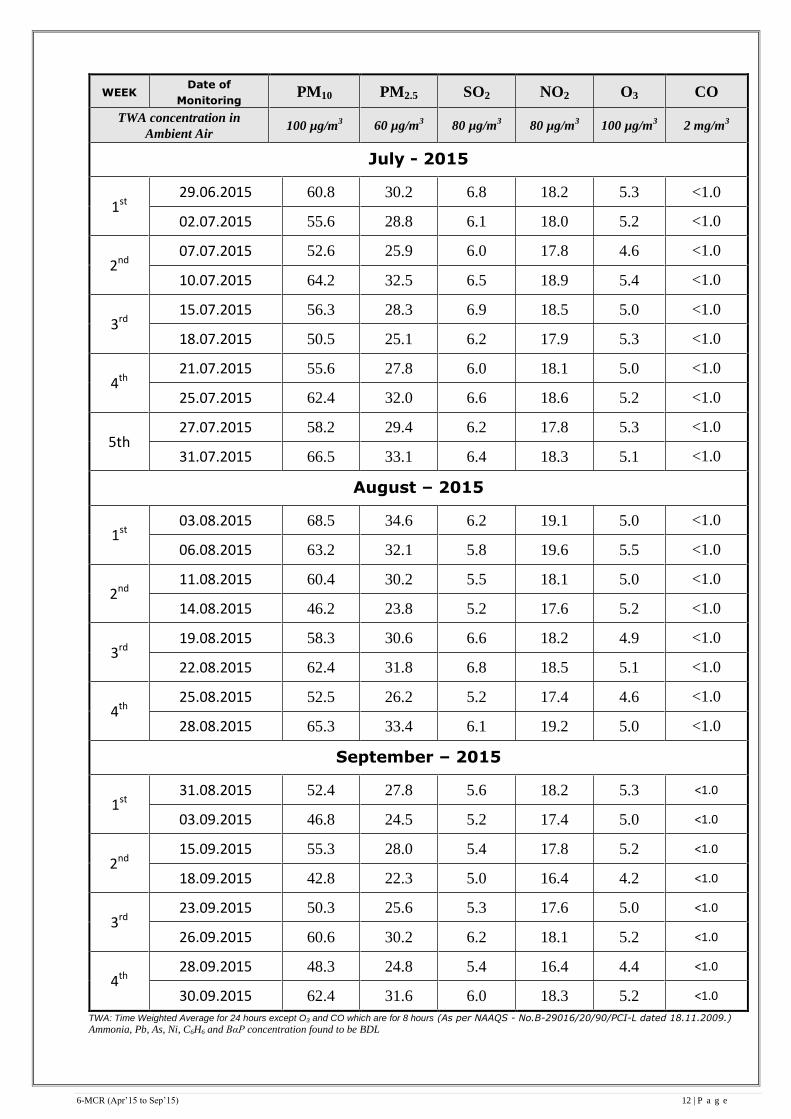
6-MCR (Apr’15 to Sep’15) 12 | P a g e
WEEK Date of
Monitoring PM10 PM2.5 SO2 NO2 O3 CO
TWA concentration in
Ambient Air 100 µg/m
3 60 µg/m3 80 µg/m
3 80 µg/m
3 100 µg/m
3 2 mg/m
3
July - 2015
1st 29.06.2015 60.8 30.2 6.8 18.2 5.3 <1.0
02.07.2015 55.6 28.8 6.1 18.0 5.2 <1.0
2nd 07.07.2015 52.6 25.9 6.0 17.8 4.6 <1.0
10.07.2015 64.2 32.5 6.5 18.9 5.4 <1.0
3rd 15.07.2015 56.3 28.3 6.9 18.5 5.0 <1.0
18.07.2015 50.5 25.1 6.2 17.9 5.3 <1.0
4th 21.07.2015 55.6 27.8 6.0 18.1 5.0 <1.0
25.07.2015 62.4 32.0 6.6 18.6 5.2 <1.0
5th
27.07.2015 58.2 29.4 6.2 17.8 5.3 <1.0
31.07.2015 66.5 33.1 6.4 18.3 5.1 <1.0
August – 2015
1st 03.08.2015 68.5 34.6 6.2 19.1 5.0 <1.0
06.08.2015 63.2 32.1 5.8 19.6 5.5 <1.0
2nd 11.08.2015 60.4 30.2 5.5 18.1 5.0 <1.0
14.08.2015 46.2 23.8 5.2 17.6 5.2 <1.0
3rd 19.08.2015 58.3 30.6 6.6 18.2 4.9 <1.0
22.08.2015 62.4 31.8 6.8 18.5 5.1 <1.0
4th 25.08.2015 52.5 26.2 5.2 17.4 4.6 <1.0
28.08.2015 65.3 33.4 6.1 19.2 5.0 <1.0
September – 2015
1st 31.08.2015 52.4 27.8 5.6 18.2 5.3 <1.0
03.09.2015 46.8 24.5 5.2 17.4 5.0 <1.0
2nd 15.09.2015 55.3 28.0 5.4 17.8 5.2 <1.0
18.09.2015 42.8 22.3 5.0 16.4 4.2 <1.0
3rd 23.09.2015 50.3 25.6 5.3 17.6 5.0 <1.0
26.09.2015 60.6 30.2 6.2 18.1 5.2 <1.0
4th 28.09.2015 48.3 24.8 5.4 16.4 4.4 <1.0
30.09.2015 62.4 31.6 6.0 18.3 5.2 <1.0
TWA: Time Weighted Average for 24 hours except O3 and CO which are for 8 hours (As per NAAQS - No.B-29016/20/90/PCI-L dated 18.11.2009.)
Ammonia, Pb, As, Ni, C6H6 and BαP concentration found to be BDL
6-MCR (Apr’15 to Sep’15) 13 | P a g e
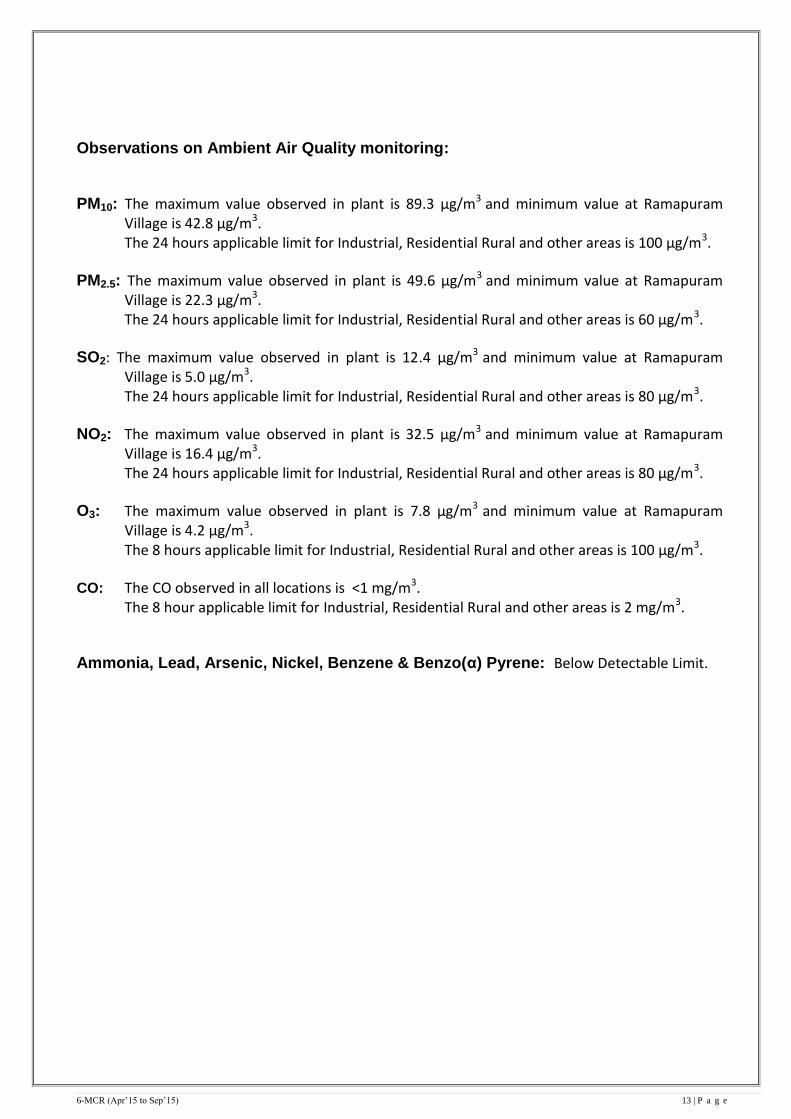
Observations on Ambient Air Quality monitoring:
PM10: The maximum value observed in plant is 89.3 μg/m3 and minimum value at Ramapuram Village is 42.8 μg/m3. The 24 hours applicable limit for Industrial, Residential Rural and other areas is 100 μg/m3.
PM2.5: The maximum value observed in plant is 49.6 μg/m3 and minimum value at Ramapuram Village is 22.3 μg/m3. The 24 hours applicable limit for Industrial, Residential Rural and other areas is 60 μg/m3.
SO2: The maximum value observed in plant is 12.4 μg/m3 and minimum value at Ramapuram Village is 5.0 μg/m3. The 24 hours applicable limit for Industrial, Residential Rural and other areas is 80 μg/m3.
NO2: The maximum value observed in plant is 32.5 μg/m3 and minimum value at Ramapuram Village is 16.4 μg/m3. The 24 hours applicable limit for Industrial, Residential Rural and other areas is 80 μg/m3.
O3: The maximum value observed in plant is 7.8 μg/m3 and minimum value at Ramapuram Village is 4.2 μg/m3. The 8 hours applicable limit for Industrial, Residential Rural and other areas is 100 μg/m3.
CO: The CO observed in all locations is <1 mg/m3. The 8 hour applicable limit for Industrial, Residential Rural and other areas is 2 mg/m3.
Ammonia, Lead, Arsenic, Nickel, Benzene & Benzo(α) Pyrene: Below Detectable Limit.
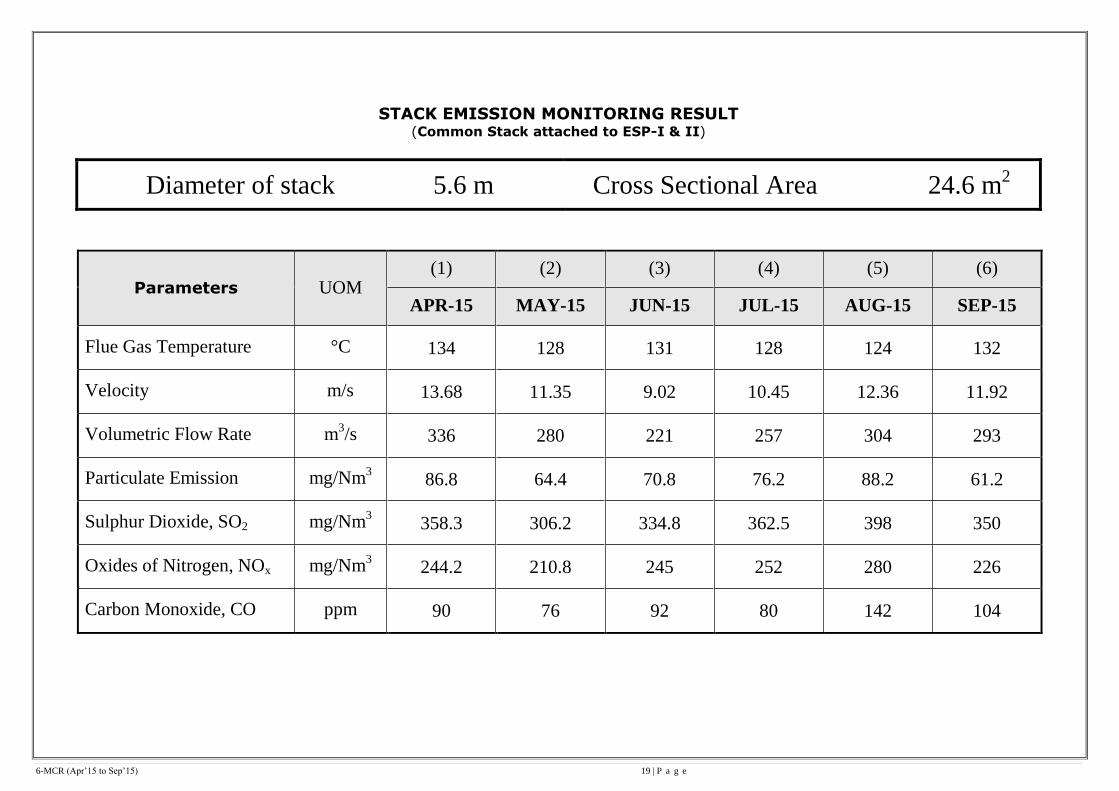
6-MCR (Apr’15 to Sep’15) 19 | P a g e
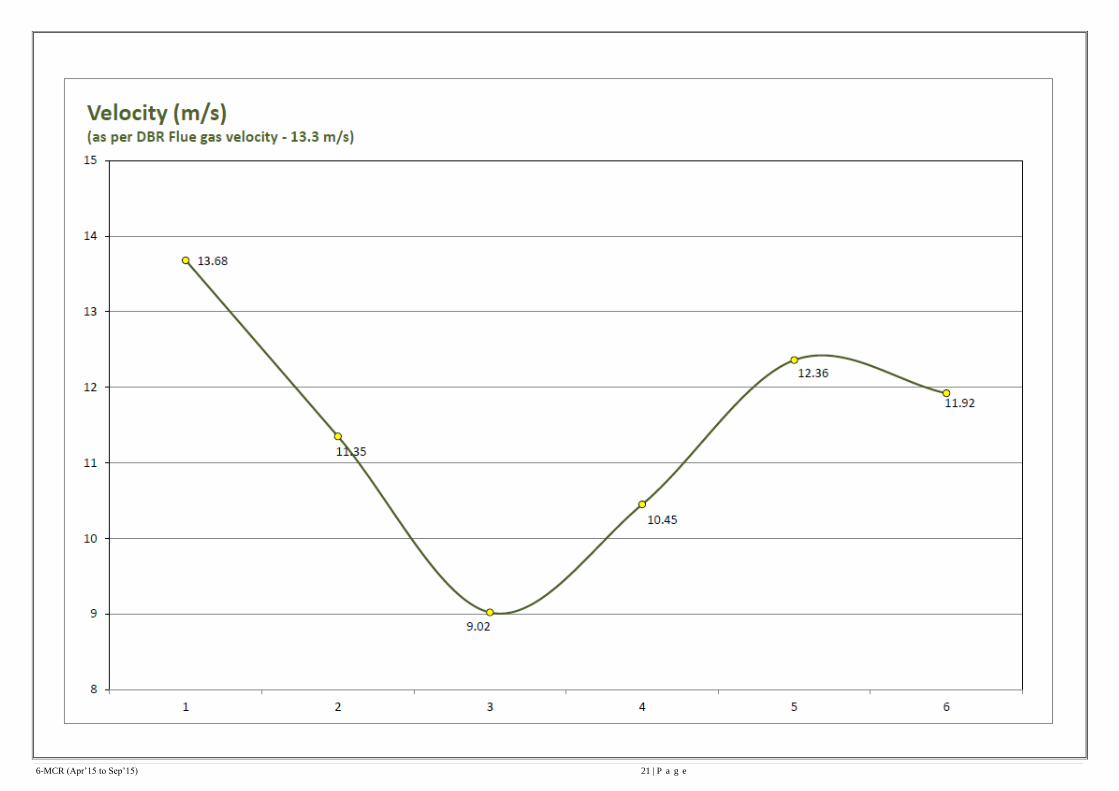
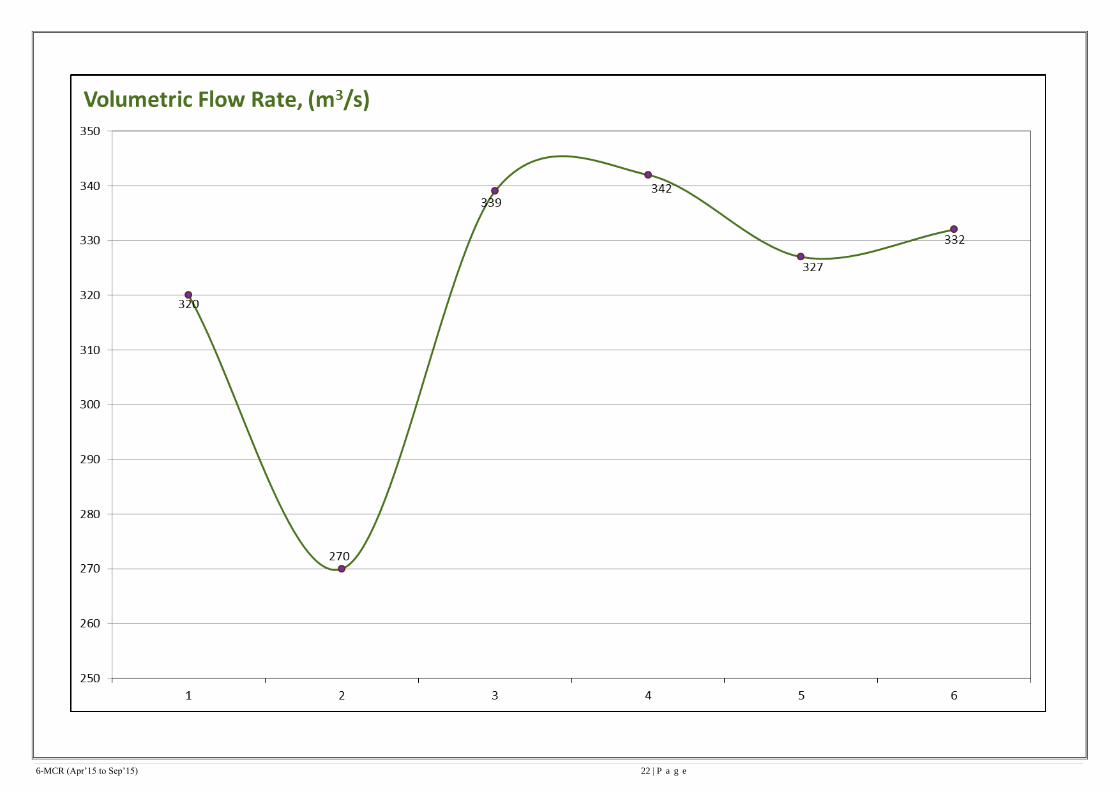
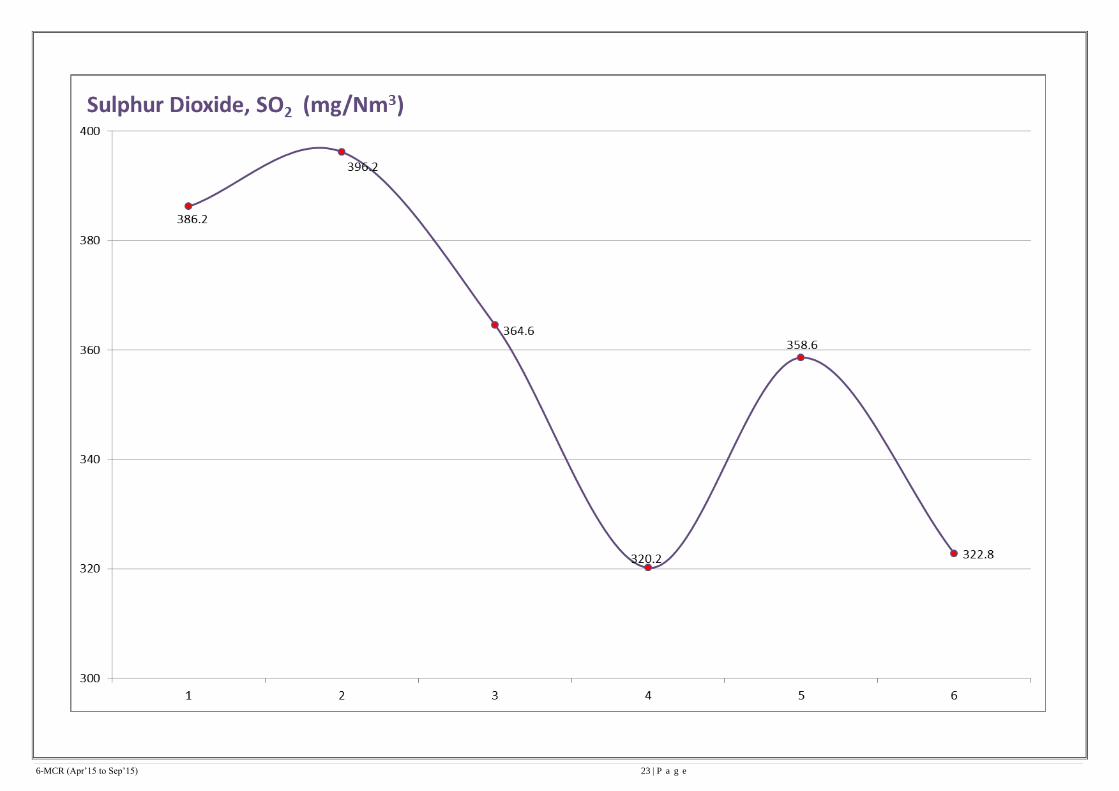
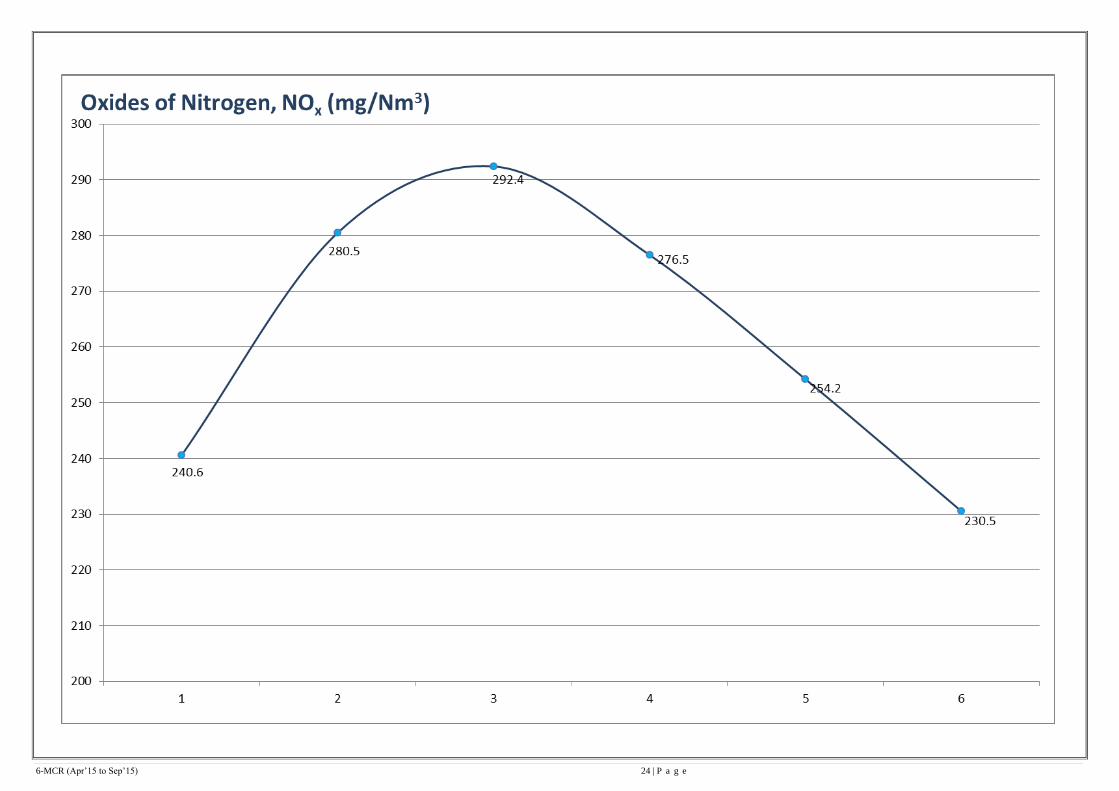
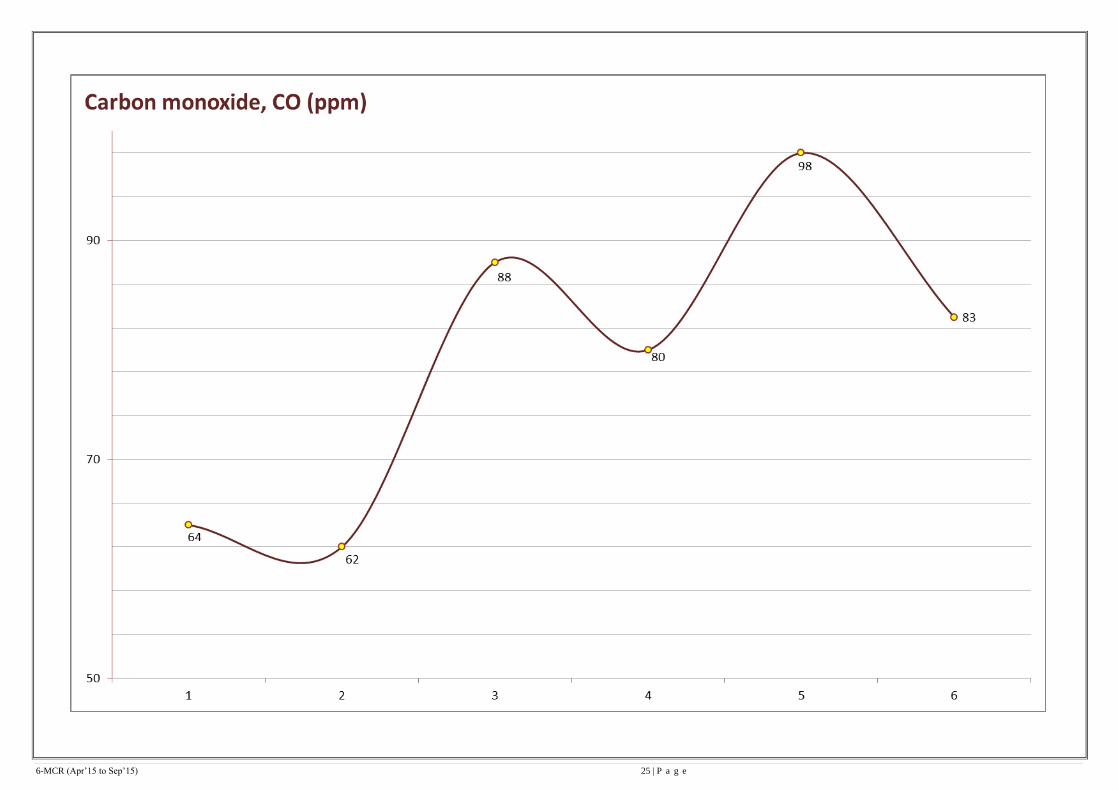
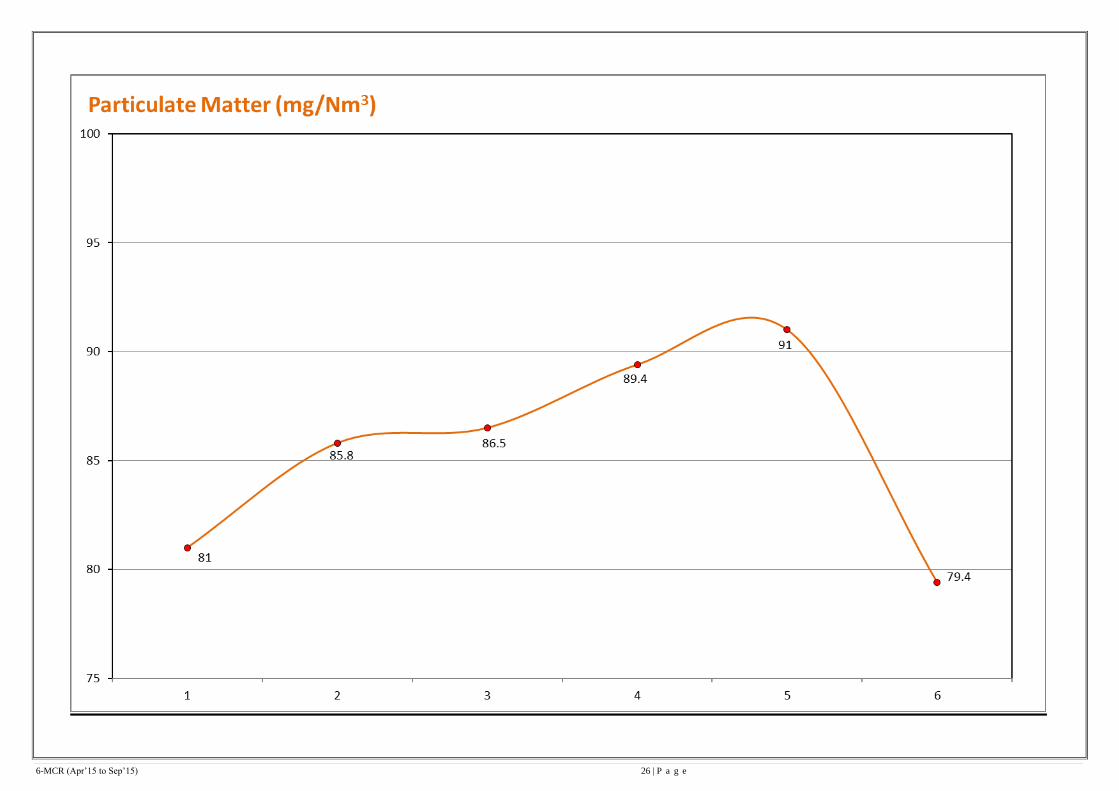
STACK EMISSION MONITORING RESULT (Common Stack attached to ESP-I & II)
Diameter of stack 5.6 m Cross Sectional Area 24.6 m2
Parameters UOM (1) (2) (3) (4) (5) (6)
APR-15 MAY-15 JUN-15 JUL-15 AUG-15 SEP-15
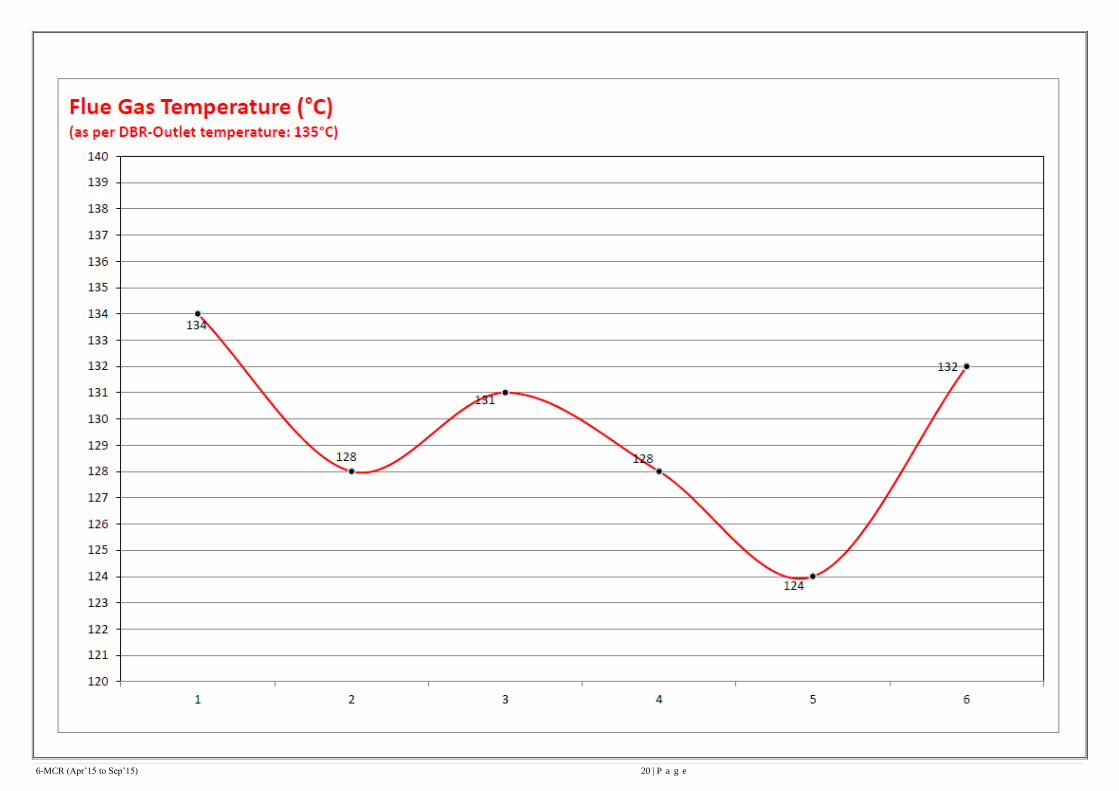
Flue Gas Temperature °C 134 128 131 128 124 132
Velocity m/s 13.68 11.35 9.02 10.45 12.36 11.92
Volumetric Flow Rate m3/s 336 280 221 257 304 293
Particulate Emission mg/Nm3 86.8 64.4 70.8 76.2 88.2 61.2
Sulphur Dioxide, SO2 mg/Nm3 358.3 306.2 334.8 362.5 398 350
Oxides of Nitrogen, NOx mg/Nm3 244.2 210.8 245 252 280 226
Carbon Monoxide, CO ppm 90 76 92 80 142 104
6-MCR (Apr’15 to Sep’15) 20 | P a g e
6-MCR (Apr’15 to Sep’15) 21 | P a g e
6-MCR (Apr’15 to Sep’15) 22 | P a g e
6-MCR (Apr’15 to Sep’15) 23 | P a g e
6-MCR (Apr’15 to Sep’15) 24 | P a g e
6-MCR (Apr’15 to Sep’15) 25 | P a g e
6-MCR (Apr’15 to Sep’15) 26 | P a g e
6-MCR (Apr’15 to Sep’15) 27 | P a g e
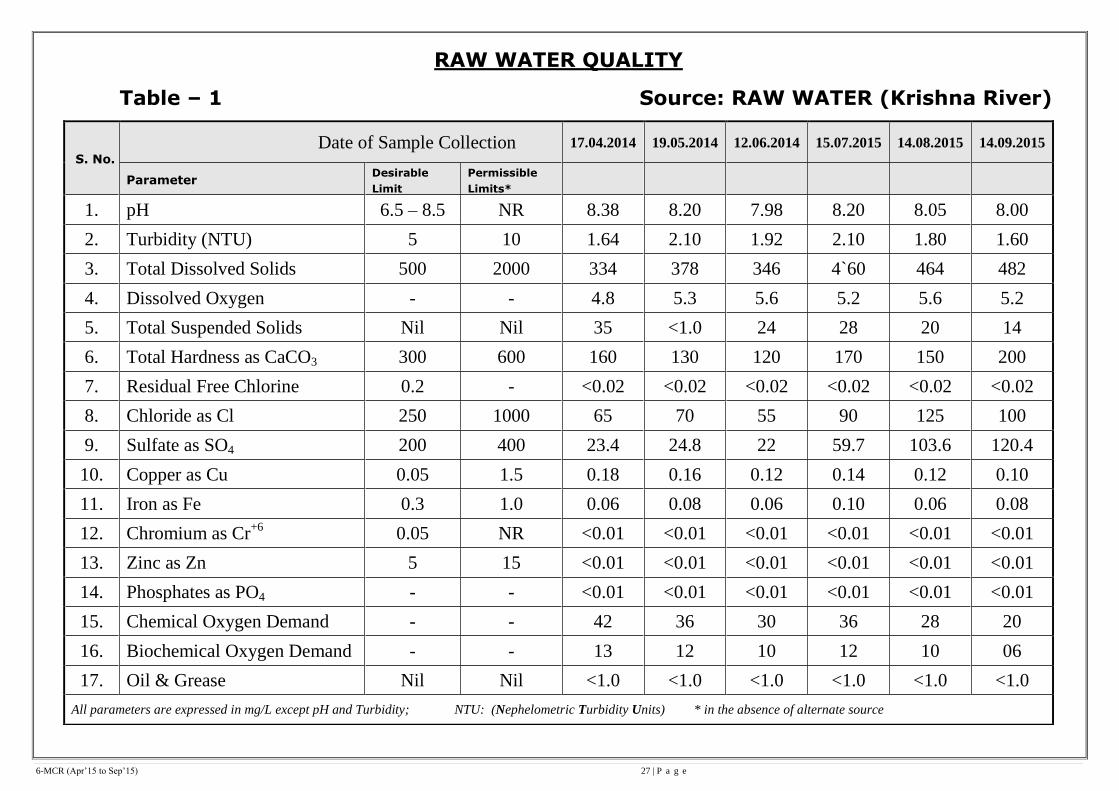
RAW WATER QUALITY
Table – 1 Source: RAW WATER (Krishna River)
S. No.
Date of Sample Collection 17.04.2014 19.05.2014 12.06.2014 15.07.2015 14.08.2015 14.09.2015
Parameter Desirable
Limit
Permissible
Limits*
1. pH 6.5 – 8.5 NR 8.38 8.20 7.98 8.20 8.05 8.00
2. Turbidity (NTU) 5 10 1.64 2.10 1.92 2.10 1.80 1.60
3. Total Dissolved Solids 500 2000 334 378 346 4`60 464 482
4. Dissolved Oxygen - - 4.8 5.3 5.6 5.2 5.6 5.2
5. Total Suspended Solids Nil Nil 35 <1.0 24 28 20 14
6. Total Hardness as CaCO3 300 600 160 130 120 170 150 200
7. Residual Free Chlorine 0.2 - <0.02 <0.02 <0.02 <0.02 <0.02 <0.02
8. Chloride as Cl 250 1000 65 70 55 90 125 100
9. Sulfate as SO4 200 400 23.4 24.8 22 59.7 103.6 120.4
10. Copper as Cu 0.05 1.5 0.18 0.16 0.12 0.14 0.12 0.10
11. Iron as Fe 0.3 1.0 0.06 0.08 0.06 0.10 0.06 0.08
12. Chromium as Cr+6
0.05 NR <0.01 <0.01 <0.01 <0.01 <0.01 <0.01
13. Zinc as Zn 5 15 <0.01 <0.01 <0.01 <0.01 <0.01 <0.01
14. Phosphates as PO4 - - <0.01 <0.01 <0.01 <0.01 <0.01 <0.01
15. Chemical Oxygen Demand - - 42 36 30 36 28 20
16. Biochemical Oxygen Demand - - 13 12 10 12 10 06
17. Oil & Grease Nil Nil <1.0 <1.0 <1.0 <1.0 <1.0 <1.0
All parameters are expressed in mg/L except pH and Turbidity; NTU: (Nephelometric Turbidity Units) * in the absence of alternate source
6-MCR (Apr’15 to Sep’15) 28 | P a g e
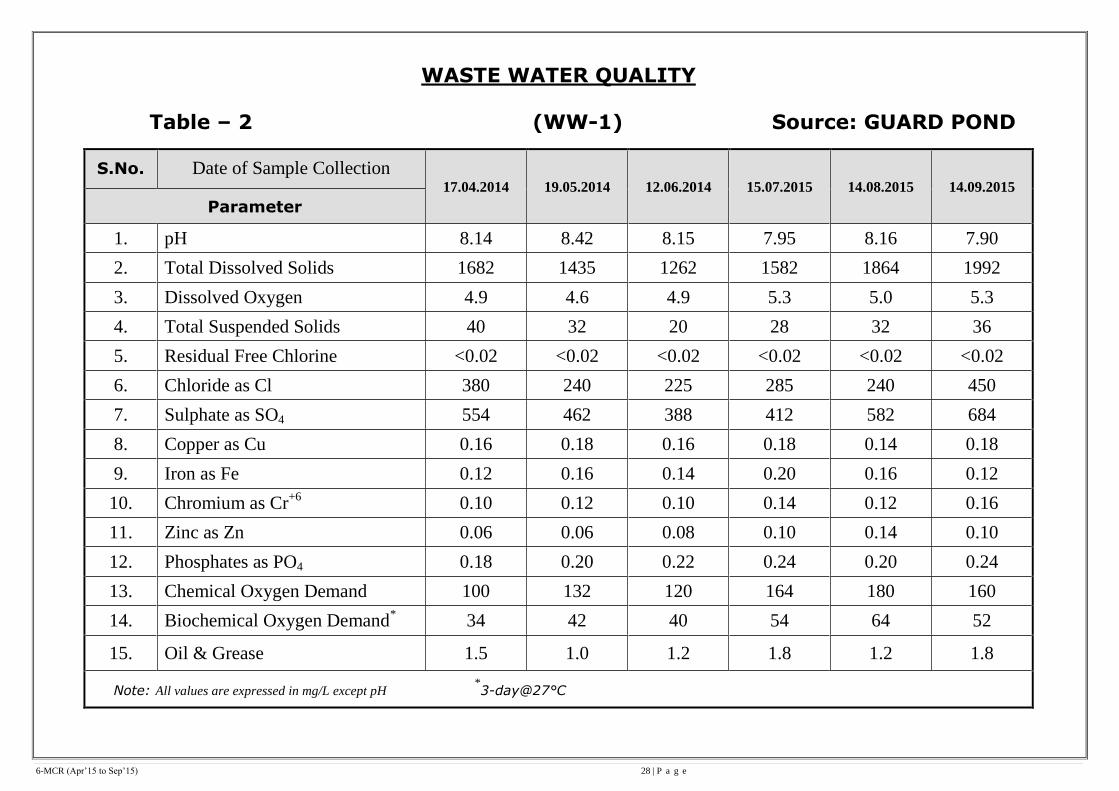
WASTE WATER QUALITY
Table – 2 (WW-1) Source: GUARD POND
S.No. Date of Sample Collection 17.04.2014 19.05.2014 12.06.2014 15.07.2015 14.08.2015 14.09.2015
Parameter
1. pH 8.14 8.42 8.15 7.95 8.16 7.90
2. Total Dissolved Solids 1682 1435 1262 1582 1864 1992
3. Dissolved Oxygen 4.9 4.6 4.9 5.3 5.0 5.3
4. Total Suspended Solids 40 32 20 28 32 36
5. Residual Free Chlorine <0.02 <0.02 <0.02 <0.02 <0.02 <0.02
6. Chloride as Cl 380 240 225 285 240 450
7. Sulphate as SO4 554 462 388 412 582 684
8. Copper as Cu 0.16 0.18 0.16 0.18 0.14 0.18
9. Iron as Fe 0.12 0.16 0.14 0.20 0.16 0.12
10. Chromium as Cr+6
0.10 0.12 0.10 0.14 0.12 0.16
11. Zinc as Zn 0.06 0.06 0.08 0.10 0.14 0.10
12. Phosphates as PO4 0.18 0.20 0.22 0.24 0.20 0.24
13. Chemical Oxygen Demand 100 132 120 164 180 160
14. Biochemical Oxygen Demand* 34 42 40 54 64 52
15. Oil & Grease 1.5 1.0 1.2 1.8 1.2 1.8
Note: All values are expressed in mg/L except pH *3-day@27°C
6-MCR (Apr’15 to Sep’15) 29 | P a g e
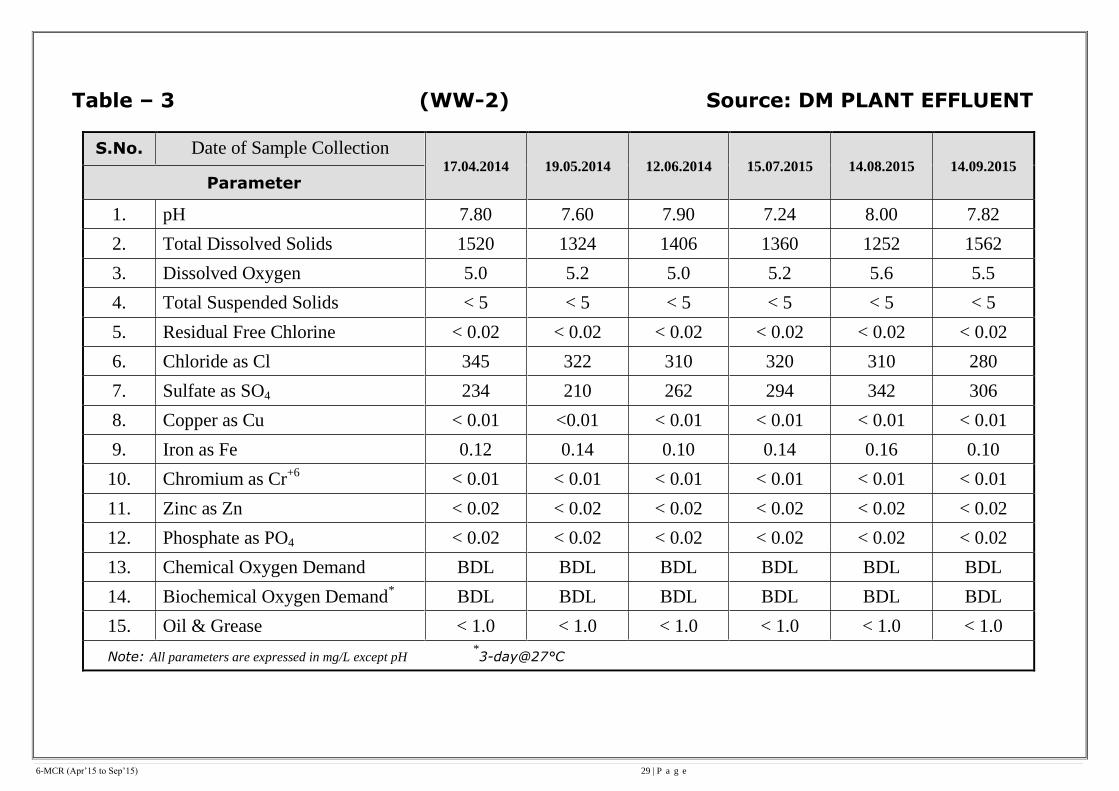
Table – 3 (WW-2) Source: DM PLANT EFFLUENT
S.No. Date of Sample Collection 17.04.2014 19.05.2014 12.06.2014 15.07.2015 14.08.2015 14.09.2015
Parameter
1. pH 7.80 7.60 7.90 7.24 8.00 7.82
2. Total Dissolved Solids 1520 1324 1406 1360 1252 1562
3. Dissolved Oxygen 5.0 5.2 5.0 5.2 5.6 5.5
4. Total Suspended Solids < 5 < 5 < 5 < 5 < 5 < 5
5. Residual Free Chlorine < 0.02 < 0.02 < 0.02 < 0.02 < 0.02 < 0.02
6. Chloride as Cl 345 322 310 320 310 280
7. Sulfate as SO4 234 210 262 294 342 306
8. Copper as Cu < 0.01 <0.01 < 0.01 < 0.01 < 0.01 < 0.01
9. Iron as Fe 0.12 0.14 0.10 0.14 0.16 0.10
10. Chromium as Cr+6
< 0.01 < 0.01 < 0.01 < 0.01 < 0.01 < 0.01
11. Zinc as Zn < 0.02 < 0.02 < 0.02 < 0.02 < 0.02 < 0.02
12. Phosphate as PO4 < 0.02 < 0.02 < 0.02 < 0.02 < 0.02 < 0.02
13. Chemical Oxygen Demand BDL BDL BDL BDL BDL BDL
14. Biochemical Oxygen Demand* BDL BDL BDL BDL BDL BDL
15. Oil & Grease < 1.0 < 1.0 < 1.0 < 1.0 < 1.0 < 1.0
Note: All parameters are expressed in mg/L except pH *3-day@27°C
6-MCR (Apr’15 to Sep’15) 30 | P a g e
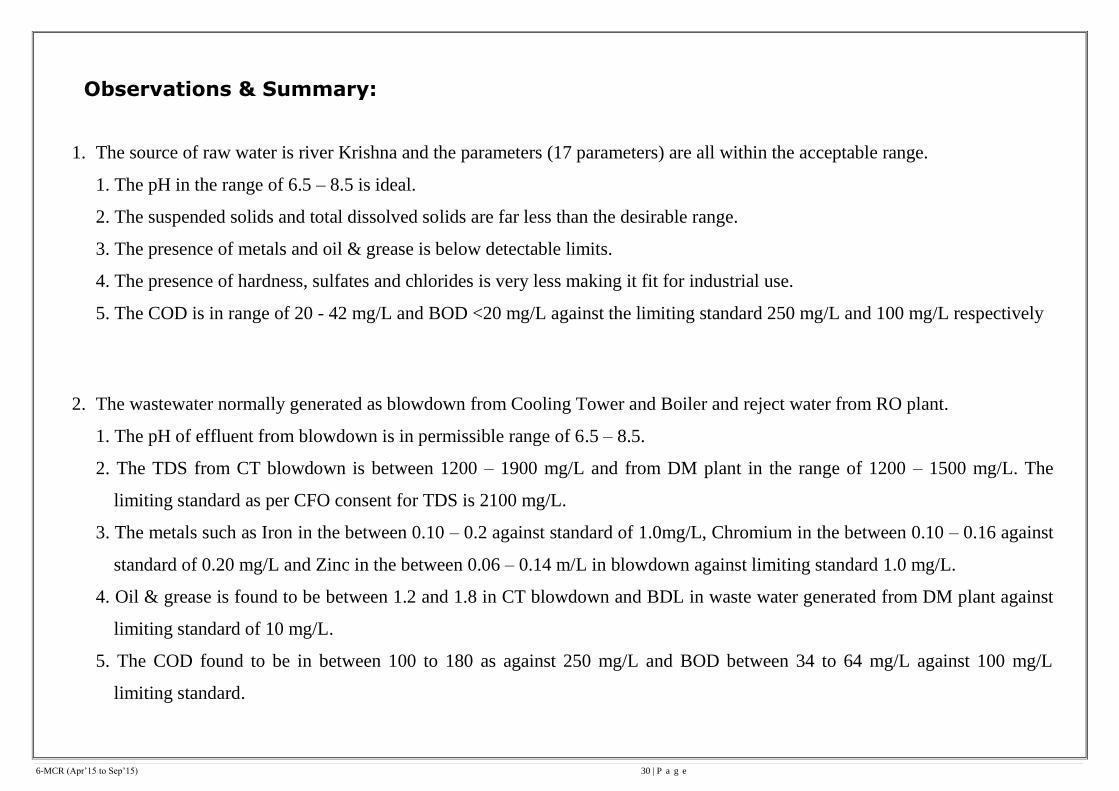
Observations & Summary:
1. The source of raw water is river Krishna and the parameters (17 parameters) are all within the acceptable range.
1. The pH in the range of 6.5 – 8.5 is ideal.
2. The suspended solids and total dissolved solids are far less than the desirable range.
3. The presence of metals and oil & grease is below detectable limits.
4. The presence of hardness, sulfates and chlorides is very less making it fit for industrial use.
5. The COD is in range of 20 - 42 mg/L and BOD <20 mg/L against the limiting standard 250 mg/L and 100 mg/L respectively
2. The wastewater normally generated as blowdown from Cooling Tower and Boiler and reject water from RO plant.
1. The pH of effluent from blowdown is in permissible range of 6.5 – 8.5.
2. The TDS from CT blowdown is between 1200 – 1900 mg/L and from DM plant in the range of 1200 – 1500 mg/L. The
limiting standard as per CFO consent for TDS is 2100 mg/L.
3. The metals such as Iron in the between 0.10 – 0.2 against standard of 1.0mg/L, Chromium in the between 0.10 – 0.16 against
standard of 0.20 mg/L and Zinc in the between 0.06 – 0.14 m/L in blowdown against limiting standard 1.0 mg/L.
4. Oil & grease is found to be between 1.2 and 1.8 in CT blowdown and BDL in waste water generated from DM plant against
limiting standard of 10 mg/L.
5. The COD found to be in between 100 to 180 as against 250 mg/L and BOD between 34 to 64 mg/L against 100 mg/L
limiting standard.
6-MCR (Apr’15 to Sep’15) 31 | P a g e
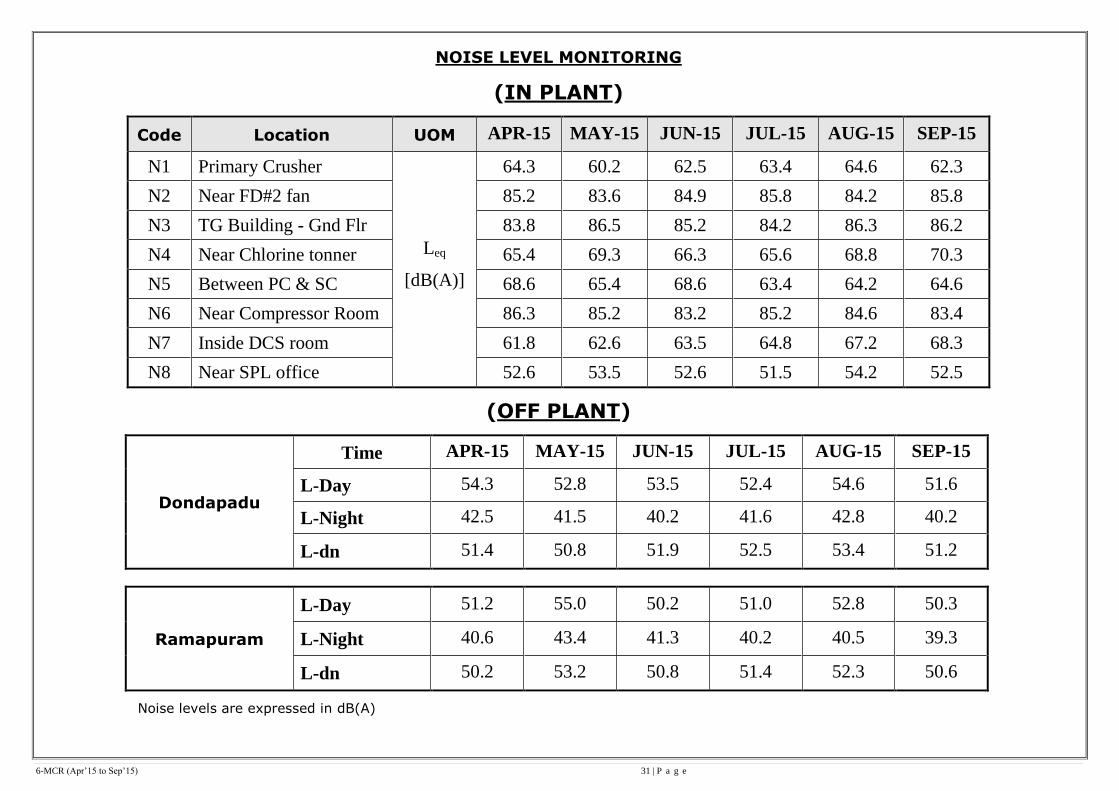
NOISE LEVEL MONITORING
(IN PLANT)
Code Location UOM APR-15 MAY-15 JUN-15 JUL-15 AUG-15 SEP-15
N1 Primary Crusher
Leq
[dB(A)]
64.3 60.2 62.5 63.4 64.6 62.3
N2 Near FD#2 fan 85.2 83.6 84.9 85.8 84.2 85.8
N3 TG Building - Gnd Flr 83.8 86.5 85.2 84.2 86.3 86.2
N4 Near Chlorine tonner 65.4 69.3 66.3 65.6 68.8 70.3
N5 Between PC & SC 68.6 65.4 68.6 63.4 64.2 64.6
N6 Near Compressor Room 86.3 85.2 83.2 85.2 84.6 83.4
N7 Inside DCS room 61.8 62.6 63.5 64.8 67.2 68.3
N8 Near SPL office 52.6 53.5 52.6 51.5 54.2 52.5
(OFF PLANT)
Dondapadu
Time APR-15 MAY-15 JUN-15 JUL-15 AUG-15 SEP-15
L-Day 54.3 52.8 53.5 52.4 54.6 51.6
L-Night 42.5 41.5 40.2 41.6 42.8 40.2
L-dn 51.4 50.8 51.9 52.5 53.4 51.2
Ramapuram
L-Day 51.2 55.0 50.2 51.0 52.8 50.3
L-Night 40.6 43.4 41.3 40.2 40.5 39.3
L-dn 50.2 53.2 50.8 51.4 52.3 50.6
Noise levels are expressed in dB(A)
6-MCR (Apr’15 to Sep’15) 32 | P a g e
Annexure – I
6-MCR (Apr’15 to Sep’15) 33 | P a g e
Annexure – II
First aid room and Toilets
Rain harvesting pit
Fly ash loading at Ash handling Plant
Dust Extraction System at CHP
6-MCR (Apr’15 to Sep’15) 34 | P a g e
Annexure – III
6-MCR (Apr’15 to Sep’15) 35 | P a g e
Annexure – IV
6-MCR (Apr’15 to Sep’15) 36 | P a g e
Annexure – V