Embed Size (px)
Citation preview
Half Year Review. For the six months ended 31 December 2012
Fletcher Building
For
per
sona
l use
onl
y
Highlights Page 1
Introduction Page 2
Strategy and outlook Page 4
Divisional overview Page 6
Building Products Page 7
Construction Page 8
Crane Page 9
Distribution Page 10
Infrastructure Products Page 11
Laminates & Panels Page 12
Financial review Page 14
Financial statements Page 16
Notes to the financial statements Page 25
Dividend information Page 28
Shareholder information Page 29
Cover image Jacob’s Ladder Footbridge, Auckland, New Zealand. Photography by Sean McCabe.
Contents.
For
per
sona
l use
onl
y
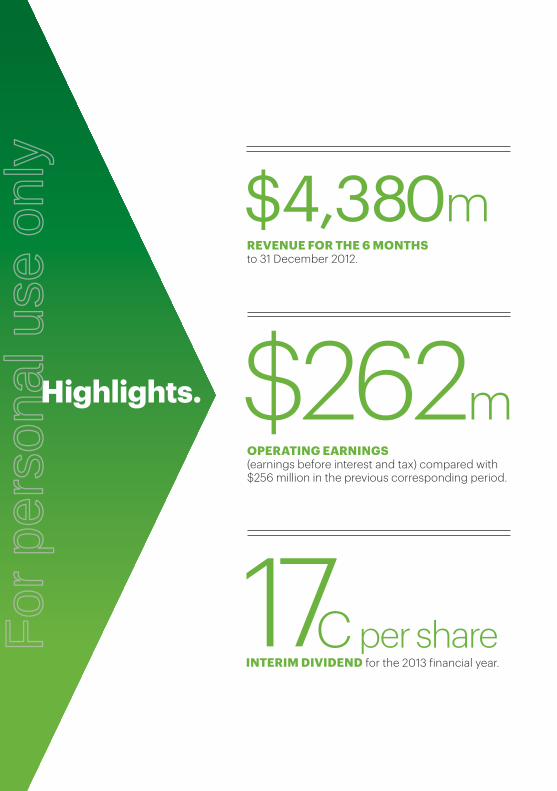
$262mOpeRatINg eaRNINgS(earnings before interest and tax) compared with $256 million in the previous corresponding period.
17C per shareINteRIm DIvIDeND for the 2013 financial year.
$4,380mReveNue FOR tHe 6 mONtHSto 31 December 2012.
Highlights.
For
per
sona
l use
onl
y
2 Fletcher Building Half Year Review
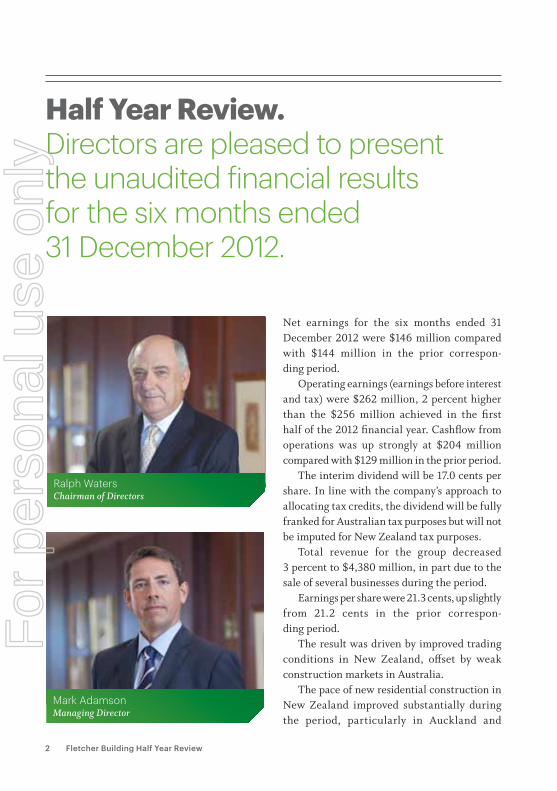
Net earnings for the six months ended 31 December 2012 were $146 million compared with $144 million in the prior correspon- ding period.
Operating earnings (earnings before interest and tax) were $262 million, 2 percent higher than the $256 million achieved in the first half of the 2012 financial year. Cashflow from operations was up strongly at $204 million compared with $129 million in the prior period.
The interim dividend will be 17.0 cents per share. In line with the company’s approach to allocating tax credits, the dividend will be fully franked for Australian tax purposes but will not be imputed for New Zealand tax purposes.
Total revenue for the group decreased 3 percent to $4,380 million, in part due to the sale of several businesses during the period.
Earnings per share were 21.3 cents, up slightly from 21.2 cents in the prior correspon- ding period.
The result was driven by improved trading conditions in New Zealand, offset by weak construction markets in Australia.
The pace of new residential construction in New Zealand improved substantially during the period, particularly in Auckland and
Half Year Review. Directors are pleased to present the unaudited financial results for the six months ended 31 December 2012.
Mark AdamsonManaging Director
Ralph WatersChairman of Directors
For
per
sona
l use
onl
y
3
Christchurch. In addition, there was strong momentum with rebuilding and new construc-tion activity in Canterbury. Consequently, earn-ings from the New Zealand operations were up by 31 percent compared with the same period in the prior year.
In Australia weak conditions continued in the residential and commercial construction sectors. Volume declines were experienced in most of the Australian businesses which negatively impacted earnings. Earnings from Australian operations declined by 12 percent on the prior corresponding period.
In other regions, results were mixed with revenues ahead in South East Asia, flat in North America, and down in China and Europe.
During the period, further restructuring was undertaken in a number of businesses incl-uding Laminex and Stramit in Australia. The consolidation of Formica’s operations in Spain was completed with the closure of the Bilbao plant, with additional costs incurred of $3 million beyond those provided for previously.
Good progress was made in establishing the business trans-formation programme which was outlined at the annual shareholders’ meeting in November. The goal of the programme is to further improve the group’s competitiveness. The programme includes initiatives around shared services, procurement, distribution, logis-tics, operational excellence and digital strategy. While some gains will accrue in the next finan-cial year, this is a multi-year transformation programme and the full benefits are expected to be realised in the medium to long term.
“Good progress was made in establishing the business transformation programme” mark adamson
For
per
sona
l use
onl
y

4 Fletcher Building Half Year Review
The company focuses on businesses that operate in fundamentally attractive industries, with leadership positions in the markets they target. This strategy seeks to deliver earnings reliability for the group through geographic and end-market diversification.
Fletcher Building seeks to create value through a business model that ensures that operating decisions are made as close to the customer as possible while also leveraging the overall size and scope of the portfolio to deliver greater efficiency and enhanced oper-ating capabilities.
Fletcher Building continues to see good opportunities across its markets for further organic growth through its existing businesses. Opportunities continue to be sought to invest in new businesses, or bolt on acquisitions, in markets with attractive growth prospects,
where Fletcher Building has the expertise and capabilities to achieve competitive advantage.
Business transformation programmeDuring the period a business transformation programme was initiated. This programme involves a systemic review of Fletcher Building’s existing business model and encompasses a fundamental redesign of how products and services are delivered. The programme includes work streams around shared services, procure-ment, distribution, logistics, operational excel-lence, and digital strategy. The transformation programme will span a number of years and the scale of the benefits will continue to evolve. In financial terms the full benefits are expected to be realised in the medium to long term.
A number of work streams have commenced within the business transformation programme,
Strategy and outlook. Fletcher Building’s strategy is to build and maintain attractive industry positions in both the light and heavy building and construction product sectors, as well as in distribution, primarily in New Zealand and Australia.
For
per
sona
l use
onl
y

5
while the scoping of other areas of focus has now commenced.
The shared services project aims to reduce the cost of core support functions through centralising transactional tasks and increas-ing productivity by leveraging the group’s scale. The project is targeting finance, human resources and information and communi-cation technologies (ICT).
The procurement project is focussed on achieving greater procurement co-ordination and cost savings from the $800 million per annum of indirect third party expenditure across the group. A specialist procurement function will lead a new approach from the corporate centre.
The group’s total property costs across New Zealand and Australia are in excess of $250 million per annum. A review of the property portfolio is being undertaken, and following this an assessment will be made of the distribution footprint and how this can be optimised to reduce site duplication and improve site utilisation.
OutlookIn New Zealand, the improvement in resi-dential consents in the first half should be reflected in stronger performance in the second half by all group businesses exposed to this sector. Infrastructure projects will continue to underpin the non-residential construction market. In addition, reconstruction activity in Canterbury is expected to be maintained at the high levels evident in the first half.
In Australia, the downturn in residential consents and continued weak approval levels in commercial construction are likely to mean that volumes remain weak. No improvement in the underlying trading conditions is foreseen in the second half, however, cost reduction
initiatives should help to partially mitigate the effect of lower volumes on earnings.
Despite a recent softening in volumes, North America is expected to improve in the second half. Operating performance in the Asian businesses will be dependent upon an expected improvement of activity levels in China. Conditions in Europe remain chal-lenging and the near term outlook remains poor, although cost reduction initiatives such as the recent closure of Bilbao should help to underpin earnings despite depressed condi-tions in that market.
For the full year operating earnings are expected to be within the range of $560 million to $610 million.
Ralph Waters Chairman of Directors
mark adamsonManaging Director
Christchurch Arts Centre Christchurch
For
per
sona
l use
onl
y
6 Fletcher Building Half Year Review
Building products.
Divisional Overview.
Construction.
Crane.
Distribution.
Infrastructure products.
Laminates & panels. F
or p
erso
nal u
se o
nly
7
Excluding the $4 million gain on the sale of the access flooring busi-ness in the prior period, the result
was 7 percent lower. The plasterboard business recorded a strong increase in operating earn-ings due to higher volumes, while margins and market share were stable.
The insulation business’ operating earn-ings were down 54 percent when the prior year gain on the sale of the access flooring busi-ness is excluded. Australian glasswool volumes were weaker and margins softened due to the increased competition in the market. Further restructuring was undertaken during the period to better align the organisation with current volumes. New Zealand glasswool volumes were flat as a result of increased competition.
Operating earnings for the roll-forming, metal roof tiles and coated steel businesses were down 16 percent to $24 million. This was primarily due to the weakness in the Austra-lian building market, with volumes in that market down by 8 percent. Cost reduction measures in the roll-forming business included
two site closures and further headcount reduc-tion. Earnings in the New Zealand coated steel business were flat on the prior period, with stronger domestic demand offset by reduced export volumes. Roof tile volumes were up 8 percent on the prior corresponding period with strong increases in Europe and Africa whilst US volumes declined.
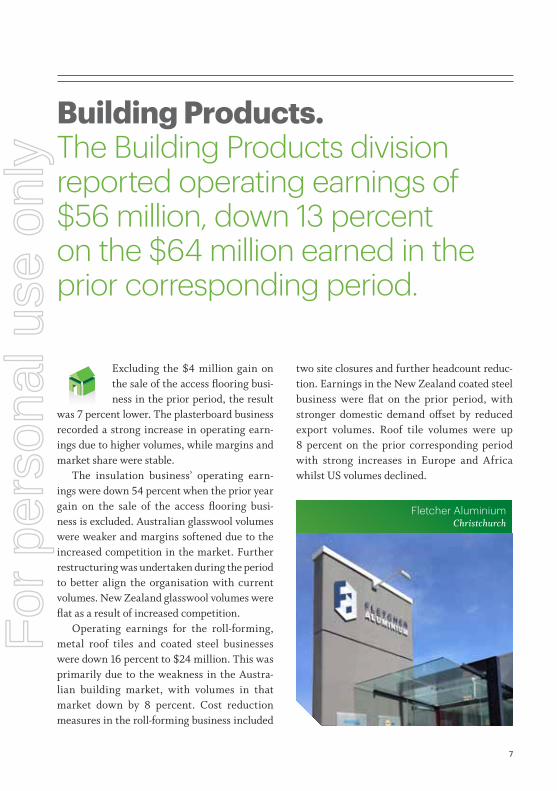
Building products. The Building Products division reported operating earnings of $56 million, down 13 percent on the $64 million earned in the prior corresponding period.
Fletcher Aluminium Christchurch
For
per
sona
l use
onl
y
8 Fletcher Building Half Year Review
The improvement in operating earnings was due to a significant uplift in residential house sales
and an increase in earthquake recovery work in Canterbury. While the overall market remained subdued there were posi-tive forward indicators arising from infra-structure construction in Christchurch, an improvement in the Auckland prime commercial property market, and other Government projects. The South Pacific
results were down on the prior period, although the workload in Papua New Guinea remains strong.
The construction backlog was $1,192 million at the end of December. This compares with a backlog of $1,204 million at the same time last year. The major contract won in the period was the Wiri Prison public private part-nership as part of the SecureFuture Consor-tium for just under $300 million.
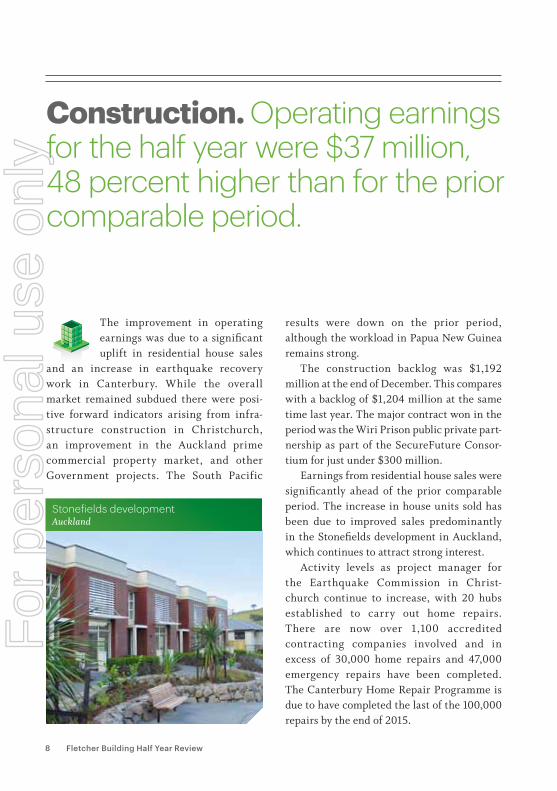
Earnings from residential house sales were significantly ahead of the prior comparable period. The increase in house units sold has been due to improved sales predominantly in the Stonefields development in Auckland, which continues to attract strong interest.
Activity levels as project manager for the Earthquake Commission in Christ-church continue to increase, with 20 hubs established to carry out home repairs. There are now over 1,100 accredited contracting companies involved and in excess of 30,000 home repairs and 47,000 emergency repairs have been completed. The Canterbury Home Repair Programme is due to have completed the last of the 100,000 repairs by the end of 2015.
Construction. Operating earnings for the half year were $37 million, 48 percent higher than for the prior comparable period.
Stonefields development Auckland
For
per
sona
l use
onl
y
9
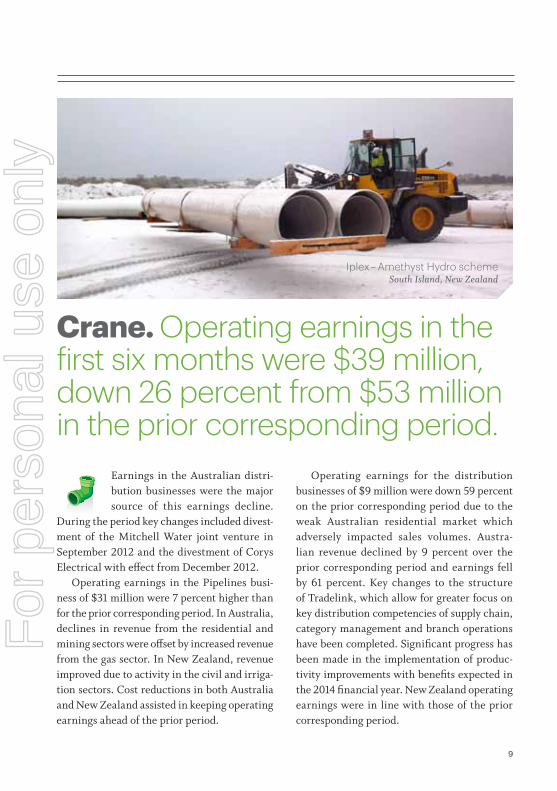
Earnings in the Australian distri-bution businesses were the major source of this earnings decline.
During the period key changes included divest-ment of the Mitchell Water joint venture in September 2012 and the divestment of Corys Electrical with effect from December 2012.
Operating earnings in the Pipelines busi-ness of $31 million were 7 percent higher than for the prior corresponding period. In Australia, declines in revenue from the residential and mining sectors were offset by increased revenue from the gas sector. In New Zealand, revenue improved due to activity in the civil and irriga-tion sectors. Cost reductions in both Australia and New Zealand assisted in keeping operating earnings ahead of the prior period.
Operating earnings for the distribution businesses of $9 million were down 59 percent on the prior corresponding period due to the weak Australian residential market which adversely impacted sales volumes. Austra-lian revenue declined by 9 percent over the prior corresponding period and earnings fell by 61 percent. Key changes to the structure of Tradelink, which allow for greater focus on key distribution competencies of supply chain, category management and branch operations have been completed. Significant progress has been made in the implementation of produc-tivity improvements with benefits expected in the 2014 financial year. New Zealand operating earnings were in line with those of the prior corresponding period.
Crane. Operating earnings in the first six months were $39 million, down 26 percent from $53 million in the prior corresponding period.
Iplex – Amethyst Hydro scheme South Island, New Zealand
For
per
sona
l use
onl
y
10 Fletcher Building Half Year Review
Trading conditions began to improve in the second quarter as activity lifted in Auckland and
Christchurch, while activity in regional centres remains subdued.
Intense competition in all categories con-tinued to place pressure on margins. In response, supply chain and procurement efficiency programmes resulted in a 7 percent reduction in the cost to sales ratio compared with the prior period. Additionally, a focus on inventory
management and optimising channels to market resulted in a significant reduction in the number of day’s stock on hand.
A continued focus on trade customers assisted growth in market share in key catego-ries. Capacity planning for the Christchurch rebuilding programme resulted in investment in automated manufacturing equipment and a new branch being built in Christchurch which will open later this year.
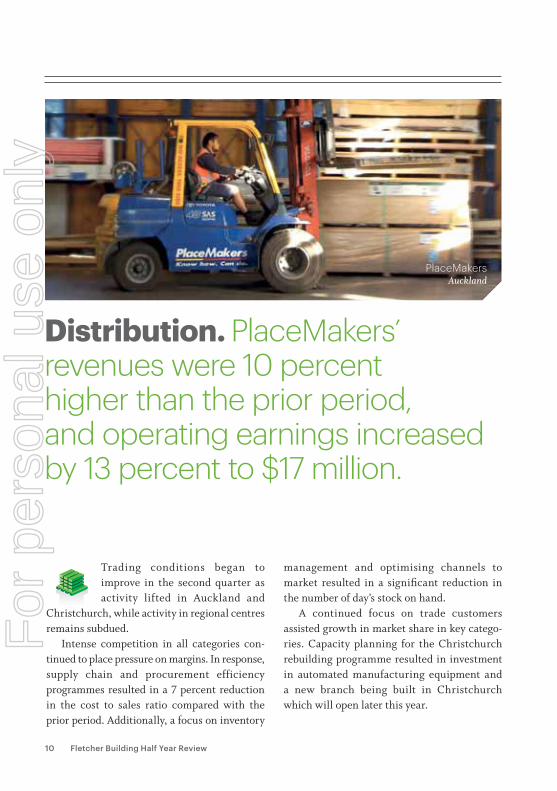
Distribution. PlaceMakers’ revenues were 10 percent higher than the prior period, and operating earnings increased by 13 percent to $17 million.
PlaceMakers Auckland
For
per
sona
l use
onl
y
11
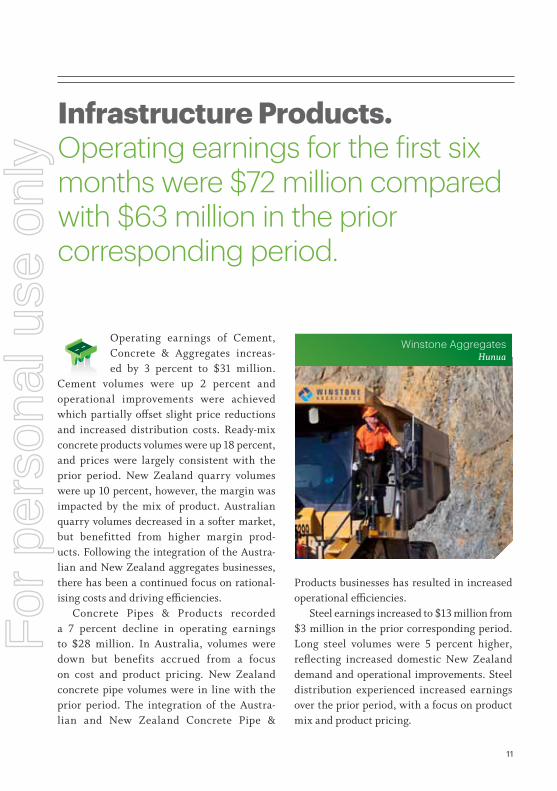
Operating earnings of Cement, Concrete & Aggregates increas-ed by 3 percent to $31 million.
Cement volumes were up 2 percent and operational improvements were achieved which partially offset slight price reductions and increased distribution costs. Ready-mix concrete products volumes were up 18 percent, and prices were largely consistent with the prior period. New Zealand quarry volumes were up 10 percent, however, the margin was impacted by the mix of product. Australian quarry volumes decreased in a softer market, but benefitted from higher margin prod-ucts. Following the integration of the Austra-lian and New Zealand aggregates businesses, there has been a continued focus on rational-ising costs and driving efficiencies.
Concrete Pipes & Products recorded a 7 percent decline in operating earnings to $28 million. In Australia, volumes were down but benefits accrued from a focus on cost and product pricing. New Zealand concrete pipe volumes were in line with the prior period. The integration of the Austra-lian and New Zealand Concrete Pipe &
Products businesses has resulted in increased operational efficiencies.
Steel earnings increased to $13 million from $3 million in the prior corresponding period. Long steel volumes were 5 percent higher, reflecting increased domestic New Zealand demand and operational improvements. Steel distribution experienced increased earnings over the prior period, with a focus on product mix and product pricing.
Infrastructure products. Operating earnings for the first six months were $72 million compared with $63 million in the prior corresponding period.
Winstone Aggregates Hunua
For
per
sona
l use
onl
y
12 Fletcher Building Half Year Review
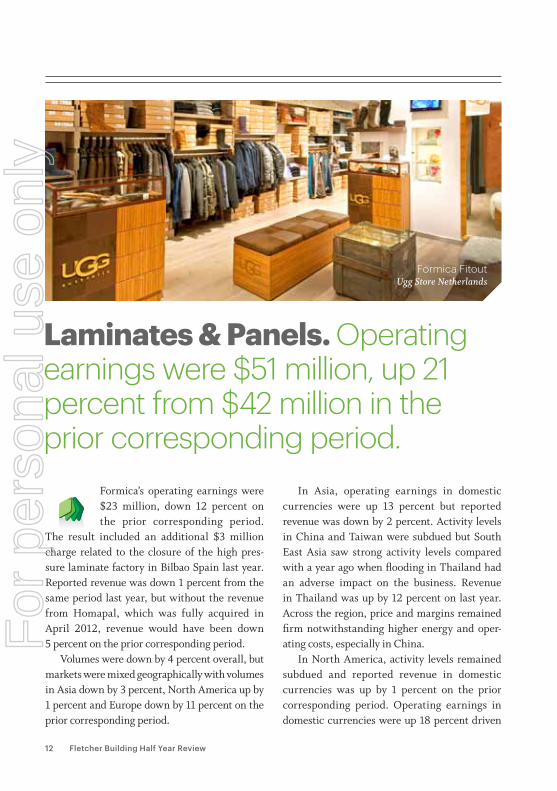
Formica’s operating earnings were $23 million, down 12 percent on the prior corresponding period.
The result included an additional $3 million charge related to the closure of the high pres-sure laminate factory in Bilbao Spain last year. Reported revenue was down 1 percent from the same period last year, but without the revenue from Homapal, which was fully acquired in April 2012, revenue would have been down 5 percent on the prior corresponding period.
Volumes were down by 4 percent overall, but markets were mixed geographically with volumes in Asia down by 3 percent, North America up by 1 percent and Europe down by 11 percent on the prior corresponding period.
In Asia, operating earnings in domestic currencies were up 13 percent but reported revenue was down by 2 percent. Activity levels in China and Taiwan were subdued but South East Asia saw strong activity levels compared with a year ago when flooding in Thailand had an adverse impact on the business. Revenue in Thailand was up by 12 percent on last year. Across the region, price and margins remained firm notwithstanding higher energy and oper-ating costs, especially in China.
In North America, activity levels remained subdued and reported revenue in domestic currencies was up by 1 percent on the prior corresponding period. Operating earnings in domestic currencies were up 18 percent driven
Laminates & panels. Operating earnings were $51 million, up 21 percent from $42 million in the prior corresponding period.
Formica Fitout Ugg Store Netherlands
For
per
sona
l use
onl
y
13
by improved margins and further operational and efficiency gains.
European reported revenue was down by 17 percent, with the UK down 7 percent, and Benelux, Spain and France down between 16 and 20 percent, while Russia had continued strong revenue growth. Operating earnings were down on the prior corresponding period due to the weak demand, however, prices and margins generally remained firm and continued savings in opera-tional costs helped to mitigate reduced revenues.
Laminex’s operating earnings were $28 million for the six months to December, a decrease of 24 percent on earnings excluding significant items in the prior corresponding period, an increase of 75 percent on a reported earnings basis.
Revenue was 9 percent below the prior period. Australian revenue in domestic currency was 10 percent lower, driven by the continued slowdown in new residential activity, and continued weakening in the renovation and commer-cial sectors. New Zealand revenue was also down by 10 percent, with 9 percent due primarily to the exit of some unprofitable product lines at the end of last year and the sale of the counter-top business in November 2012. The underlying market activity levels in New Zealand improved slightly. Competitive pressures in Australia and New Zealand remained strong with margins flat over the period.
Cost reduction and product rationalisa-tion measures were undertaken to help miti-gate earnings pressure from volume reductions, delivering significant savings in headcount and other controllable costs. Cost pressure on business inputs continued, in particular energy costs, with cost initiatives introduced to mitigate.
“South East Asia saw strong activity levels compared with a year ago”
For
per
sona
l use
onl
y
14 Fletcher Building Half Year Review
Balance sheetThe group’s gearing1 at 31 December 2012 was 35.4 percent compared with 36.4 percent at 30 June 2012. The gearing figure remains below the target range of 40 to 50 percent, and the group will continue to position gearing below the bottom of this range given the uncertainty in global financial markets.
FundingThe group had total available funding of $2,741 million as at 31 December 2012, which is down from $2,928 million as at 30 June 2012 following the group’s cancellation of $175 million of funding lines. Of this, $681 million was undrawn and there was an addi-tional $163 million of cash on hand. The group has drawn debt facilities maturing within the next 12 months of $58 million, and a further $75 million of capital notes subject to interest rate and term reset. These maturities are more than covered by the undrawn facilities and cash on hand.
Debt maturityThe average maturity of the debt is 5 years and the currency split is 47 percent Australian dollar; 38 percent New Zealand dollar; 10 per- cent US dollar; 4 percent Euro; and 1 percent Pounds Sterling.
Interest ratesApproximately 70 percent of all borrowings have fixed interest rates with an average dura-tion of 3 years and a rate of 7.6 percent. Inclusive of floating rate borrowings the average interest rate on the debt is approximately 6.7 percent. All interest rates are inclusive of margins but not fees.
Interest coverage2 for the period was 3.5 times compared with 3.8 times for the prior corresponding period.
CashflowCashflow from operations was $204 million compared with $129 million in the prior period. The improvement was due to tight working capital management.
Capital expenditure for the period was $94 million compared with $154 million in the prior corresponding period. Of this total, $52 million was for stay-in-business capital proj-ects, $31 million was for new growth initiatives, and $11 million was for the acquisition of new businesses, including the acquisition of Formica India. During the period, cash of $69 million was realised from the divestment of several businesses including Austral Wright, Mico Metals and Corys Electrical.
Financial review.
1 Interest bearing net debt (including capital notes) to interest bearing net debt (including capital notes) and equity.2 EBIT before significant items to total interest paid including capital notes interest.
For
per
sona
l use
onl
y
15
DividendThe 2013 interim dividend is 17 cents per share. In line with the dividend imputation and franking policy announced in February 2011, the interim dividend will be fully franked for Australian tax purposes, but will not be imputed for New Zealand tax purposes.
A dividend summary is attached illustrating the effect of the Australian franking tax credits on the dividend.
Dividend Reinvestment PlanThe Dividend Reinvestment Plan will be operative for this dividend payment. Shareholders can elect to participate in the plan by visiting the Computershare Investor Centre at investorcentre.com/nz and completing an electronic Participation Notice.
Alternatively, documentation for participa-tion is available from the share registry or the
company’s website at fletcherbuilding.com/investor. Applications to participate must be received by the registry before the record date of 28 March 2013.
There will be no discount to the price applied to ordinary shares issued under the Dividend Reinvestment Plan. The price used to deter-mine entitlements under the Plan is the average of the individual daily volume weighted average sale prices of price-setting trades of the compa-ny’s shares sold on the NZX on each of the five business days from, and including, the NZX ex-dividend date of 26 March 2013. The new shares will rank equally with existing shares and will be issued on the dividend payment date of 16 April 2013.
The shares will be quoted on an ex-dividend basis from 22 March 2013 on the ASX and 26 March 2013 on the NZX.
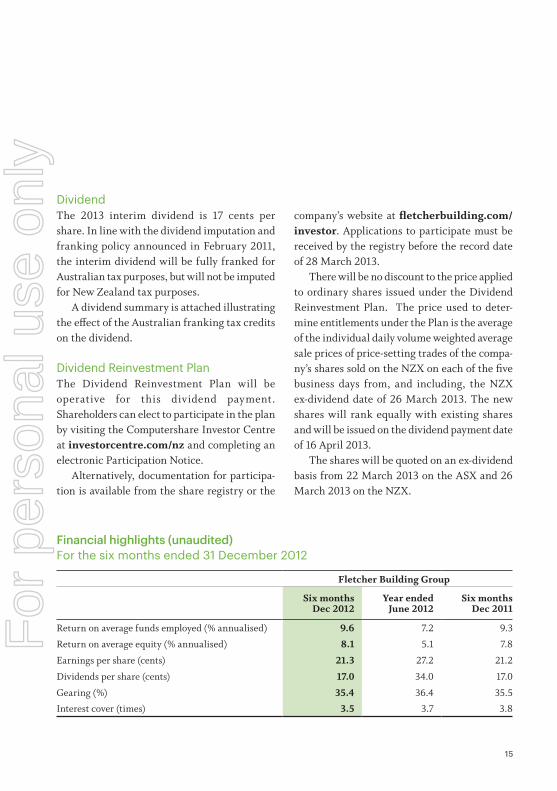
Financial highlights (unaudited) For the six months ended 31 December 2012
Fletcher Building Group
Six monthsDec 2012
Year endedJune 2012
Six monthsDec 2011
Return on average funds employed (% annualised) 9.6 7.2 9.3
Return on average equity (% annualised) 8.1 5.1 7.8
Earnings per share (cents) 21.3 27.2 21.2
Dividends per share (cents) 17.0 34.0 17.0
Gearing (%) 35.4 36.4 35.5
Interest cover (times) 3.5 3.7 3.8
For
per
sona
l use
onl
y
16 Fletcher Building Half Year Review
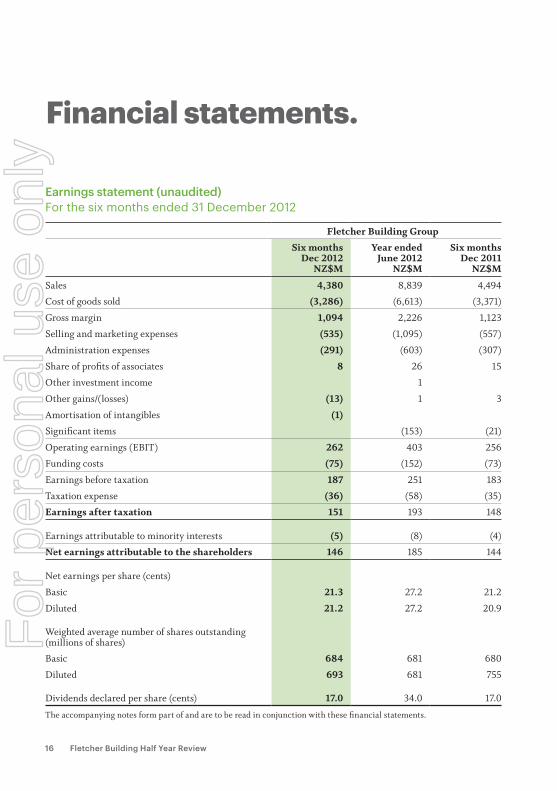
Earnings statement (unaudited)For the six months ended 31 December 2012
Fletcher Building Group
Six monthsDec 2012
NZ$M
Year endedJune 2012
NZ$M
Six monthsDec 2011
NZ$M
Sales 4,380 8,839 4,494
Cost of goods sold (3,286) (6,613) (3,371)
Gross margin 1,094 2,226 1,123
Selling and marketing expenses (535) (1,095) (557)
Administration expenses (291) (603) (307)
Share of profits of associates 8 26 15
Other investment income 1
Other gains/(losses) (13) 1 3
Amortisation of intangibles (1)
Significant items (153) (21)
Operating earnings (EBIT) 262 403 256
Funding costs (75) (152) (73)
Earnings before taxation 187 251 183
Taxation expense (36) (58) (35)
Earnings after taxation 151 193 148
Earnings attributable to minority interests (5) (8) (4)
Net earnings attributable to the shareholders 146 185 144
Net earnings per share (cents)
Basic 21.3 27.2 21.2
Diluted 21.2 27.2 20.9
Weighted average number of shares outstanding (millions of shares)
Basic 684 681 680
Diluted 693 681 755
Dividends declared per share (cents) 17.0 34.0 17.0
The accompanying notes form part of and are to be read in conjunction with these financial statements.
Financial statements.
For
per
sona
l use
onl
y
17
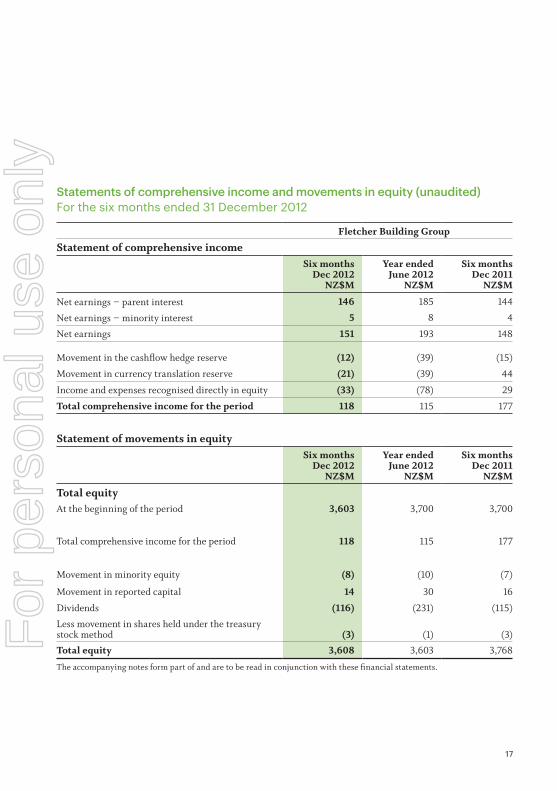
Statements of comprehensive income and movements in equity (unaudited)For the six months ended 31 December 2012
Fletcher Building Group
Statement of comprehensive income Six months
Dec 2012NZ$M
Year endedJune 2012
NZ$M
Six monthsDec 2011
NZ$M
Net earnings – parent interest 146 185 144
Net earnings – minority interest 5 8 4
Net earnings 151 193 148
Movement in the cashflow hedge reserve (12) (39) (15)
Movement in currency translation reserve (21) (39) 44
Income and expenses recognised directly in equity (33) (78) 29
Total comprehensive income for the period 118 115 177
Statement of movements in equitySix months
Dec 2012NZ$M
Year endedJune 2012
NZ$M
Six monthsDec 2011
NZ$M
Total equityAt the beginning of the period 3,603 3,700 3,700
Total comprehensive income for the period 118 115 177
Movement in minority equity (8) (10) (7)
Movement in reported capital 14 30 16
Dividends (116) (231) (115)
Less movement in shares held under the treasury stock method
(3)
(1)
(3)
Total equity 3,608 3,603 3,768
The accompanying notes form part of and are to be read in conjunction with these financial statements.
For
per
sona
l use
onl
y
18 Fletcher Building Half Year Review
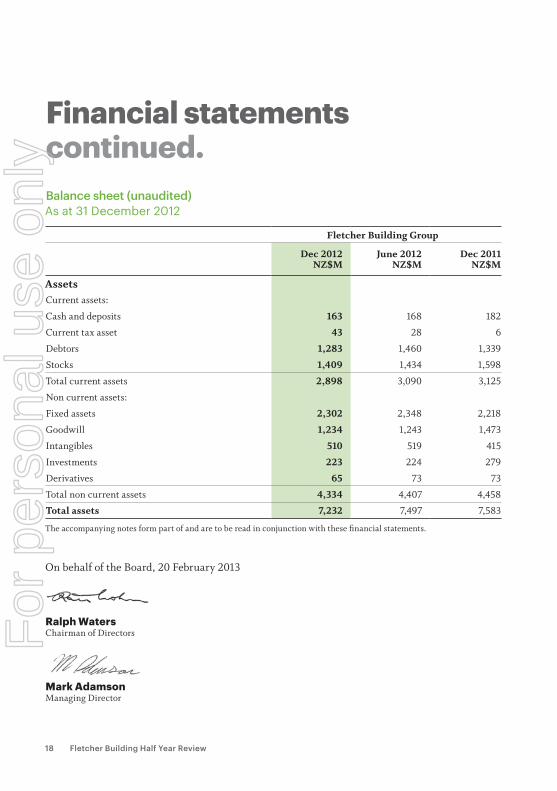
Balance sheet (unaudited)As at 31 December 2012
Fletcher Building Group
Dec 2012NZ$M
June 2012NZ$M
Dec 2011NZ$M
AssetsCurrent assets:
Cash and deposits 163 168 182
Current tax asset 43 28 6
Debtors 1,283 1,460 1,339
Stocks 1,409 1,434 1,598
Total current assets 2,898 3,090 3,125
Non current assets:
Fixed assets 2,302 2,348 2,218
Goodwill 1,234 1,243 1,473
Intangibles 510 519 415
Investments 223 224 279
Derivatives 65 73 73
Total non current assets 4,334 4,407 4,458
Total assets 7,232 7,497 7,583
Ralph Waters Chairman of Directors
mark adamson Managing Director
Financial statementscontinued.
The accompanying notes form part of and are to be read in conjunction with these financial statements.
On behalf of the Board, 20 February 2013
For
per
sona
l use
onl
y
19
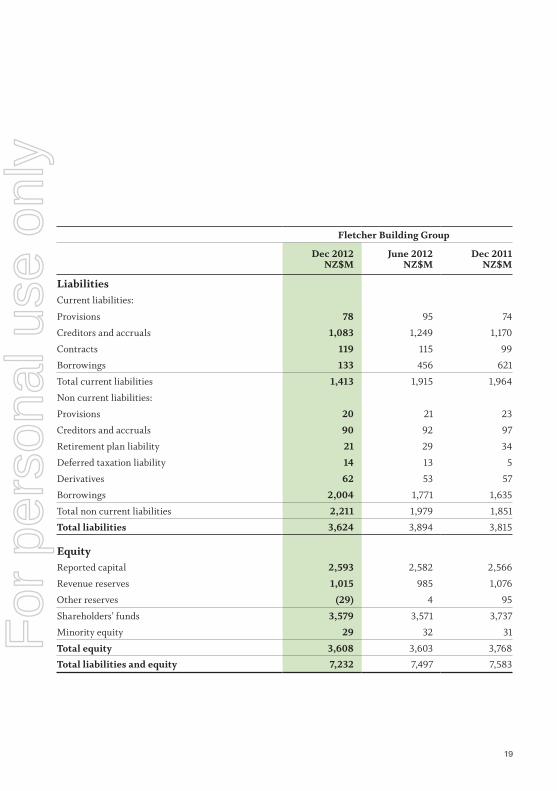
Fletcher Building Group
Dec 2012NZ$M
June 2012NZ$M
Dec 2011NZ$M
LiabilitiesCurrent liabilities:
Provisions 78 95 74
Creditors and accruals 1,083 1,249 1,170
Contracts 119 115 99
Borrowings 133 456 621
Total current liabilities 1,413 1,915 1,964
Non current liabilities:
Provisions 20 21 23
Creditors and accruals 90 92 97
Retirement plan liability 21 29 34
Deferred taxation liability 14 13 5
Derivatives 62 53 57
Borrowings 2,004 1,771 1,635
Total non current liabilities 2,211 1,979 1,851
Total liabilities 3,624 3,894 3,815
EquityReported capital 2,593 2,582 2,566
Revenue reserves 1,015 985 1,076
Other reserves (29) 4 95
Shareholders’ funds 3,579 3,571 3,737
Minority equity 29 32 31
Total equity 3,608 3,603 3,768
Total liabilities and equity 7,232 7,497 7,583
For
per
sona
l use
onl
y
20 Fletcher Building Half Year Review
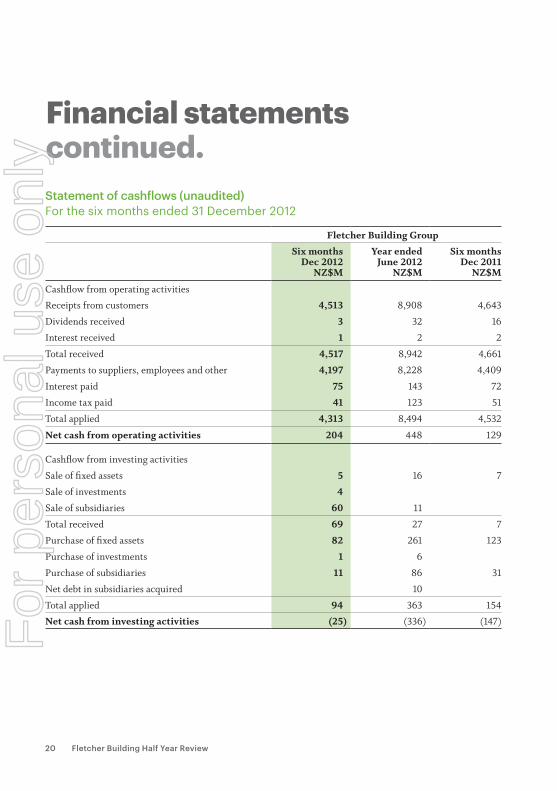
Statement of cashflows (unaudited) For the six months ended 31 December 2012
Fletcher Building Group
Six monthsDec 2012
NZ$M
Year endedJune 2012
NZ$M
Six monthsDec 2011
NZ$M
Cashflow from operating activities
Receipts from customers 4,513 8,908 4,643
Dividends received 3 32 16
Interest received 1 2 2
Total received 4,517 8,942 4,661
Payments to suppliers, employees and other 4,197 8,228 4,409
Interest paid 75 143 72
Income tax paid 41 123 51
Total applied 4,313 8,494 4,532
Net cash from operating activities 204 448 129
Cashflow from investing activities
Sale of fixed assets 5 16 7
Sale of investments 4
Sale of subsidiaries 60 11
Total received 69 27 7
Purchase of fixed assets 82 261 123
Purchase of investments 1 6
Purchase of subsidiaries 11 86 31
Net debt in subsidiaries acquired 10
Total applied 94 363 154
Net cash from investing activities (25) (336) (147)
Financial statementscontinued.
For
per
sona
l use
onl
y
21
Fletcher Building Group
Six monthsDec 2012
NZ$M
Year endedJune 2012
NZ$M
Six monthsDec 2011
NZ$M
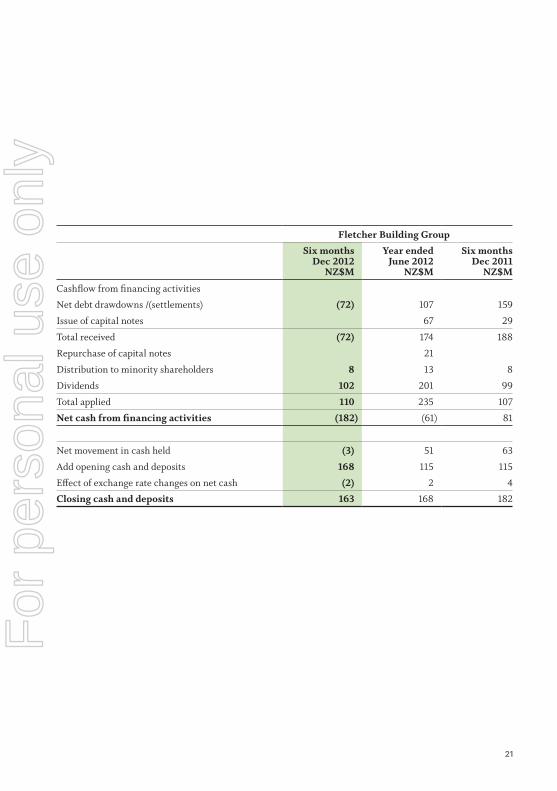
Cashflow from financing activities
Net debt drawdowns /(settlements) (72) 107 159
Issue of capital notes 67 29
Total received (72) 174 188
Repurchase of capital notes 21
Distribution to minority shareholders 8 13 8
Dividends 102 201 99
Total applied 110 235 107
Net cash from financing activities (182) (61) 81
Net movement in cash held (3) 51 63
Add opening cash and deposits 168 115 115
Effect of exchange rate changes on net cash (2) 2 4
Closing cash and deposits 163 168 182
For
per
sona
l use
onl
y
22 Fletcher Building Half Year Review
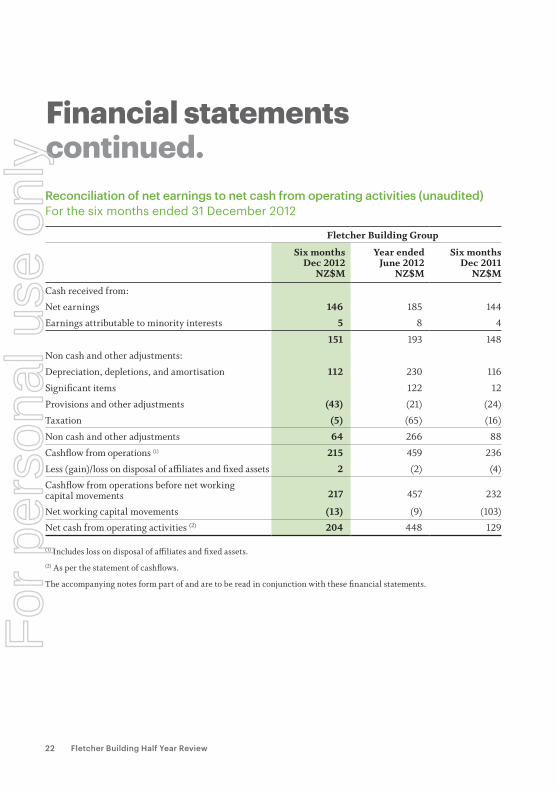
Reconciliation of net earnings to net cash from operating activities (unaudited)For the six months ended 31 December 2012
Fletcher Building Group
Six monthsDec 2012
NZ$M
Year endedJune 2012
NZ$M
Six monthsDec 2011
NZ$M
Cash received from:
Net earnings 146 185 144
Earnings attributable to minority interests 5 8 4
151 193 148
Non cash and other adjustments:
Depreciation, depletions, and amortisation 112 230 116
Significant items 122 12
Provisions and other adjustments (43) (21) (24)
Taxation (5) (65) (16)
Non cash and other adjustments 64 266 88
Cashflow from operations (1) 215 459 236
Less (gain)/loss on disposal of affiliates and fixed assets 2 (2) (4)
Cashflow from operations before net working capital movements 217 457 232
Net working capital movements (13) (9) (103)
Net cash from operating activities (2) 204 448 129
(1) Includes loss on disposal of affiliates and fixed assets.(2) As per the statement of cashflows.
The accompanying notes form part of and are to be read in conjunction with these financial statements.
Financial statementscontinued.
For
per
sona
l use
onl
y
23
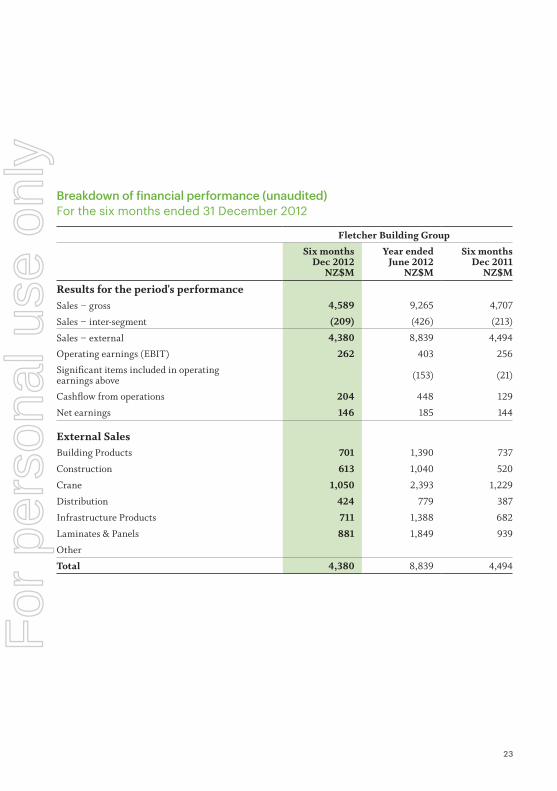
Breakdown of financial performance (unaudited)For the six months ended 31 December 2012
Fletcher Building Group
Six monthsDec 2012
NZ$M
Year endedJune 2012
NZ$M
Six monthsDec 2011
NZ$M
Results for the period's performanceSales – gross 4,589 9,265 4,707
Sales – inter-segment (209) (426) (213)
Sales – external 4,380 8,839 4,494
Operating earnings (EBIT) 262 403 256
Significant items included in operatingearnings above (153) (21)
Cashflow from operations 204 448 129
Net earnings 146 185 144
External SalesBuilding Products 701 1,390 737
Construction 613 1,040 520
Crane 1,050 2,393 1,229
Distribution 424 779 387
Infrastructure Products 711 1,388 682
Laminates & Panels 881 1,849 939
Other
Total 4,380 8,839 4,494
For
per
sona
l use
onl
y
24 Fletcher Building Half Year Review
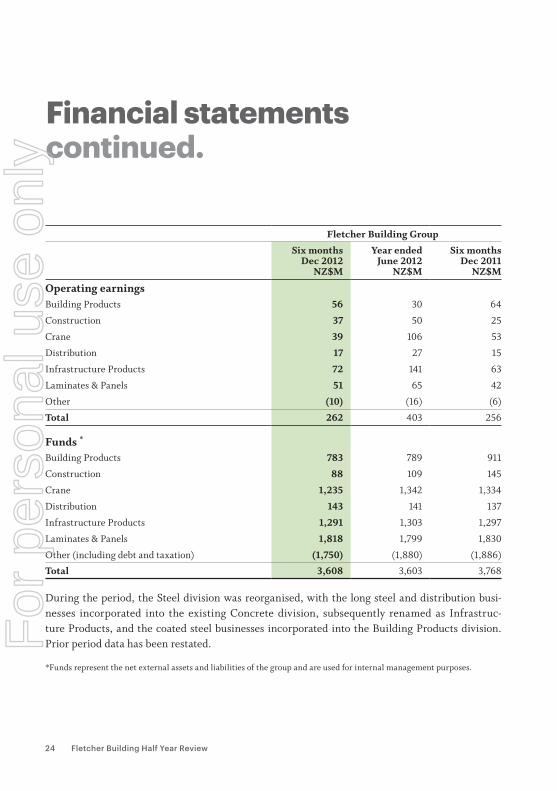
Fletcher Building Group
Six monthsDec 2012
NZ$M
Year endedJune 2012
NZ$M
Six monthsDec 2011
NZ$M
Operating earningsBuilding Products 56 30 64
Construction 37 50 25
Crane 39 106 53
Distribution 17 27 15
Infrastructure Products 72 141 63
Laminates & Panels 51 65 42
Other (10) (16) (6)
Total 262 403 256
Funds *
Building Products 783 789 911
Construction 88 109 145
Crane 1,235 1,342 1,334
Distribution 143 141 137
Infrastructure Products 1,291 1,303 1,297
Laminates & Panels 1,818 1,799 1,830
Other (including debt and taxation) (1,750) (1,880) (1,886)
Total 3,608 3,603 3,768
Financial statementscontinued.
During the period, the Steel division was reorganised, with the long steel and distribution busi-nesses incorporated into the existing Concrete division, subsequently renamed as Infrastruc-ture Products, and the coated steel businesses incorporated into the Building Products division. Prior period data has been restated.
*Funds represent the net external assets and liabilities of the group and are used for internal management purposes.
For
per
sona
l use
onl
y
25
Notes to the financial statements.
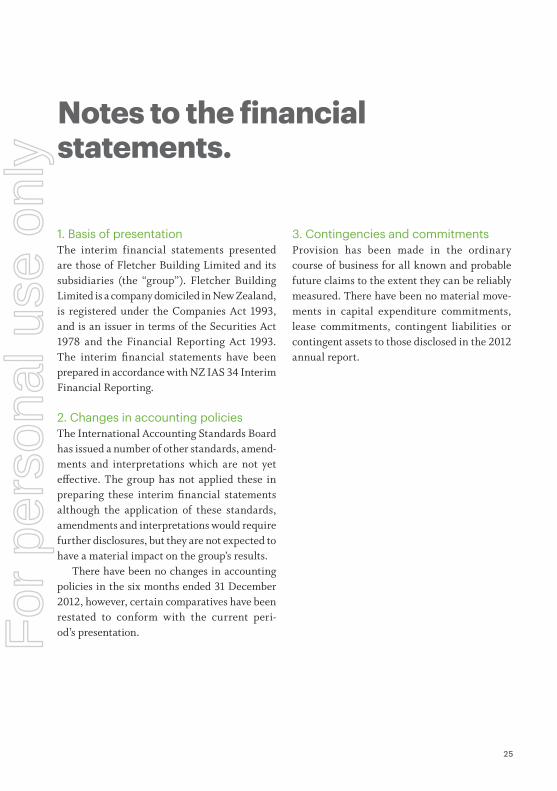
1. Basis of presentationThe interim financial statements presented are those of Fletcher Building Limited and its subsidiaries (the “group”). Fletcher Building Limited is a company domiciled in New Zealand, is registered under the Companies Act 1993, and is an issuer in terms of the Securities Act 1978 and the Financial Reporting Act 1993. The interim financial statements have been prepared in accordance with NZ IAS 34 Interim Financial Reporting.
2. Changes in accounting policies The International Accounting Standards Board has issued a number of other standards, amend-ments and interpretations which are not yet effective. The group has not applied these in preparing these interim financial statements although the application of these standards, amendments and interpretations would require further disclosures, but they are not expected to have a material impact on the group’s results.
There have been no changes in accounting policies in the six months ended 31 December 2012, however, certain comparatives have been restated to conform with the current peri-od’s presentation.
3. Contingencies and commitmentsProvision has been made in the ordinary course of business for all known and probable future claims to the extent they can be reliably measured. There have been no material move-ments in capital expenditure commitments, lease commitments, contingent liabilities or contingent assets to those disclosed in the 2012 annual report.
For
per
sona
l use
onl
y
26 Fletcher Building Half Year Review
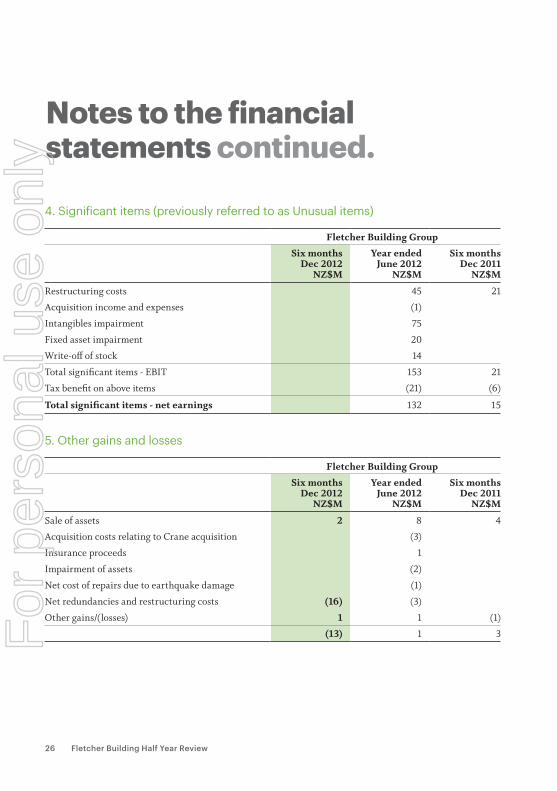
4. Significant items (previously referred to as Unusual items)
Fletcher Building Group
Six monthsDec 2012
NZ$M
Year endedJune 2012
NZ$M
Six monthsDec 2011
NZ$M
Restructuring costs 45 21
Acquisition income and expenses (1)
Intangibles impairment 75
Fixed asset impairment 20
Write-off of stock 14
Total significant items - EBIT 153 21
Tax benefit on above items (21) (6)
Total significant items - net earnings 132 15
5. Other gains and losses
Fletcher Building Group
Six monthsDec 2012
NZ$M
Year endedJune 2012
NZ$M
Six monthsDec 2011
NZ$M
Sale of assets 2 8 4
Acquisition costs relating to Crane acquisition (3)
Insurance proceeds 1
Impairment of assets (2)
Net cost of repairs due to earthquake damage (1)
Net redundancies and restructuring costs (16) (3)
Other gains/(losses) 1 1 (1)
(13) 1 3
Notes to the financial statements continued.
For
per
sona
l use
onl
y
27
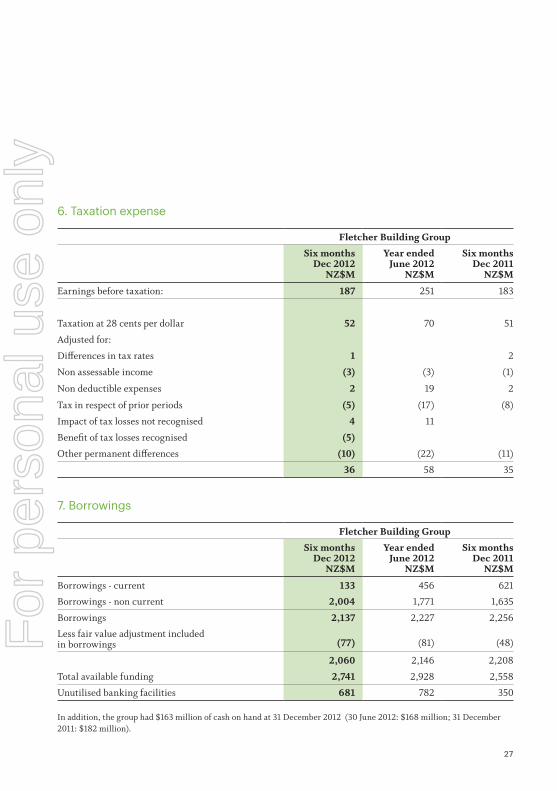
6. Taxation expense
Fletcher Building Group
Six monthsDec 2012
NZ$M
Year endedJune 2012
NZ$M
Six monthsDec 2011
NZ$M
Earnings before taxation: 187 251 183
Taxation at 28 cents per dollar 52 70 51
Adjusted for:
Differences in tax rates 1 2
Non assessable income (3) (3) (1)
Non deductible expenses 2 19 2
Tax in respect of prior periods (5) (17) (8)
Impact of tax losses not recognised 4 11
Benefit of tax losses recognised (5)
Other permanent differences (10) (22) (11)
36 58 35
7. Borrowings
Fletcher Building Group
Six monthsDec 2012
NZ$M
Year endedJune 2012
NZ$M
Six monthsDec 2011
NZ$M
Borrowings - current 133 456 621
Borrowings - non current 2,004 1,771 1,635
Borrowings 2,137 2,227 2,256
Less fair value adjustment included in borrowings (77) (81) (48)
2,060 2,146 2,208
Total available funding 2,741 2,928 2,558
Unutilised banking facilities 681 782 350
In addition, the group had $163 million of cash on hand at 31 December 2012 (30 June 2012: $168 million; 31 December 2011: $182 million).
Notes to the financial statements continued.
For
per
sona
l use
onl
y
28 Fletcher Building Half Year Review
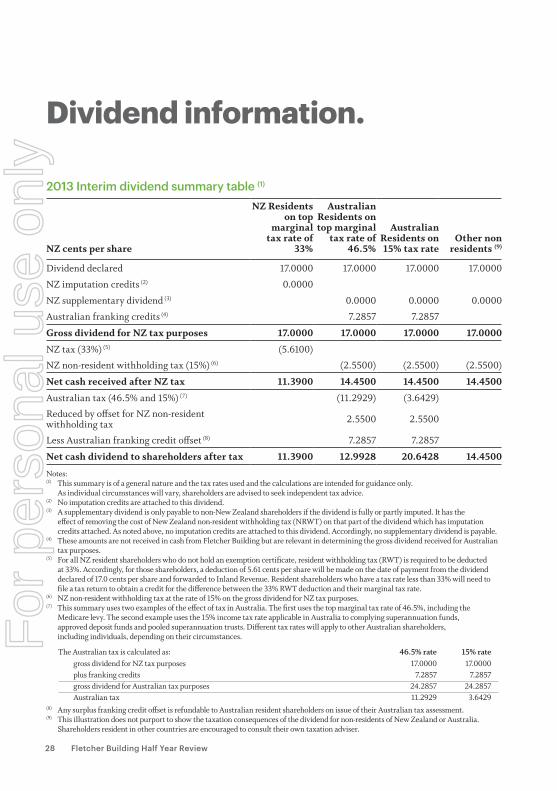
2013 Interim dividend summary table (1)
NZ cents per share
NZ Residents on top
marginal tax rate of
33%
Australian Residents on top marginal
tax rate of 46.5%
Australian Residents on 15% tax rate
Other non residents (9)
Dividend declared 17.0000 17.0000 17.0000 17.0000
NZ imputation credits (2) 0.0000
NZ supplementary dividend (3) 0.0000 0.0000 0.0000
Australian franking credits (4) 7.2857 7.2857
Gross dividend for NZ tax purposes 17.0000 17.0000 17.0000 17.0000
NZ tax (33%) (5) (5.6100)
NZ non-resident withholding tax (15%) (6) (2.5500) (2.5500) (2.5500)
Net cash received after NZ tax 11.3900 14.4500 14.4500 14.4500
Australian tax (46.5% and 15%) (7) (11.2929) (3.6429)
Reduced by offset for NZ non-resident withholding tax 2.5500 2.5500
Less Australian franking credit offset (8) 7.2857 7.2857
Net cash dividend to shareholders after tax 11.3900 12.9928 20.6428 14.4500
Notes:(1) This summary is of a general nature and the tax rates used and the calculations are intended for guidance only. As individual circumstances will vary, shareholders are advised to seek independent tax advice.(2) No imputation credits are attached to this dividend.(3) A supplementary dividend is only payable to non-New Zealand shareholders if the dividend is fully or partly imputed. It has the effect of removing the cost of New Zealand non-resident withholding tax (NRWT) on that part of the dividend which has imputation credits attached. As noted above, no imputation credits are attached to this dividend. Accordingly, no supplementary dividend is payable. (4) These amounts are not received in cash from Fletcher Building but are relevant in determining the gross dividend received for Australian tax purposes. (5) For all NZ resident shareholders who do not hold an exemption certificate, resident withholding tax (RWT) is required to be deducted at 33%. Accordingly, for those shareholders, a deduction of 5.61 cents per share will be made on the date of payment from the dividend declared of 17.0 cents per share and forwarded to Inland Revenue. Resident shareholders who have a tax rate less than 33% will need to file a tax return to obtain a credit for the difference between the 33% RWT deduction and their marginal tax rate.(6) NZ non-resident withholding tax at the rate of 15% on the gross dividend for NZ tax purposes.(7) This summary uses two examples of the effect of tax in Australia. The first uses the top marginal tax rate of 46.5%, including the
Medicare levy. The second example uses the 15% income tax rate applicable in Australia to complying superannuation funds, approved deposit funds and pooled superannuation trusts. Different tax rates will apply to other Australian shareholders, including individuals, depending on their circumstances.
The Australian tax is calculated as: 46.5% rate 15% rategross dividend for NZ tax purposes 17.0000 17.0000plus franking credits 7.2857 7.2857gross dividend for Australian tax purposes 24.2857 24.2857Australian tax 11.2929 3.6429
(8) Any surplus franking credit offset is refundable to Australian resident shareholders on issue of their Australian tax assessment.(9) This illustration does not purport to show the taxation consequences of the dividend for non-residents of New Zealand or Australia.
Shareholders resident in other countries are encouraged to consult their own taxation adviser.
Dividend information.
For
per
sona
l use
onl
y
29
Shareholder information.
Registered officesNew ZealandFletcher Building LimitedPrivate Bag 92 114Auckland 1142
Fletcher House810 Great South RoadPenrose, Auckland 1061New ZealandT. +64 9 525 9000
AustraliaFletcher Building (Australia) Pty LimitedLocked Bag 7013, Chatswood DC 2067NSW 2067
Level 11, Tower B, Zenith Centre821 Pacific HighwayChatswood, NSW 2067, AustraliaT. +61 2 8986 0900ARBN 096 046 936
Other investor enquiriesFletcher Building LimitedPrivate Bag 92 114Auckland 1142, New ZealandT. +64 9 525 9000F. +64 9 525 9032E. [email protected]
Shareholder enquiriesChanges of address, payment instructions and investment portfolios can be viewed and updated online at computershare.co.nz/investorcentre. Investor number and FIN are required to access this service.
Enquiries can also be addressed to the share registrar:
New ZealandComputershare Investor Services Limited Private Bag 92 119 Auckland 1142
Level 2, 159 Hurstmere RdTakapuna, Auckland 0622New ZealandT. +64 9 488 8777F. +64 9 488 8787E. [email protected]
AustraliaComputershare Investor Services Pty LimitedGPO Box 3329Melbourne, VIC 8060T. 1800 501 366 (within Australia)T. +61 3 9415 4083 (outside Australia)F. +61 3 9473 2009
Other informationfletcherbuilding.comF
or p
erso
nal u
se o
nly