Embed Size (px)
Citation preview

www.mitchellservices.com.au1
HALF-YEAR RESULTS PRESENTATIONDecember 2015
For
per
sona
l use
onl
y

www.mitchellservices.com.au2
DISCLAIMER
This investor presentation has been prepared by Mitchell Services Limited (“the Company”). Information in this presentation is of a general nature only and should be read in conjunction with the
Company’s other periodic and continuous disclosure announcements to the ASX, which are available at: www.asx.com.au.
This presentation contains statements, opinions, projections, forecasts and other material (“forward-looking statements”) with respect to the financial condition, business operations and competitive
landscape of the Company and certain plans for its future management. The words anticipate, believe, expect, project, forecast, estimate, likely, intend, should, could, may, target, plan and other similar
expressions are intended to identify forward-looking statements. Such forward-looking statements are not guarantees of future performance and include known and unknown risks, uncertainties,
assumptions and other important factors which are beyond the Company’s control and may cause actual results to differ from those expressed or implied in such statements. There can be no assurance
that actual outcomes will not differ materially from these statements. Any forward-looking statements contained in this document are qualified by this cautionary statement. The past performance of the
Company is not a guarantee of future performance. None of the Company, or its officers, employees, agents or any other person named in this presentation makes any representation, assurance or
guarantee as to the accuracy or likelihood of fulfilment of any forward-looking statements or any of the outcomes upon which they are based.
The information contained in this presentation does not take into account the investment objectives, financial situation or particular needs of any recipient and is not financial product advice. Before
making an investment decision, investors should consider their own needs and situation and, if necessary, seek independent professional advice.
To the maximum extent permitted by law, the Company and its directors and advisers of both give no warranty, representation or guarantee as to the accuracy, completeness or reliability of the
information contained in this presentation. Further, none of the Company, it officers, agents or employees of accepts, to the extent permitted by law, any liability for any loss, claim, damages, costs or
expenses arising from the use of this presentation or its contents or otherwise arising out of, or in connection with it. Any recipient of this presentation should independently satisfy themselves as to the
accuracy of all information contained herein.
For
per
sona
l use
onl
y

www.mitchellservices.com.au3
SAFETY UPDATE
• Even though rig utilisation has increased the
frequency and severity of safety incidents has
continued to decrease.
• Mitchell Services has had no lost time
injuries since November 2014.
• Numerous initiatives implemented to further
strengthen safety culture and performance.
For
per
sona
l use
onl
y

www.mitchellservices.com.au4
1H16 BUSINESS OVERVIEW
Average rig utilisation
12 vs 20HY2015 vs HY2016
Tier 1 client revenue
178%Total revenue
88%
Nitro acquisition and
integration completed
on time and on budget
↑↑
0
5
10
15
20
25
Jan Feb Mar Apr May Jun Jul Aug Sep Oct Nov Dec
OPERATING RIG COUNT2014 2015
For
per
sona
l use
onl
y

www.mitchellservices.com.au5
BUSINESS OPTIMISATION STRATEGY
Phase 1: Business ReadyCOMPLETE
• Implement initiatives to improve
safety culture and performance
• Reached goal of $24m operating
revenue in FY 2015
• $20.2m capital raise for the
acquisition of Tom Browne Drilling
Services assets from receivers
• Integration of Tom Browne Drilling
Services including auction of
surplus equipment
• Increase “Tier 1” client base and
increase rig utilisation
• Take advantage of strong position
in key markets
• Capitalise on long term revenue
streams from high quality Tier 1
clients
• Focus on reducing costs in the
business
• Deliver efficient, safe and quality
services to our clients
• Integration of Nitro assets
• Upgrade asset fleet and sell non-
core assets to reduce commercial
debt levels and optimise asset mix
• ISO certification and
implementation of electronic
safety, training and human
resources management system
• Review and implementation of
Industrial Relations strategy to
increase flexibility across the
business
• Moved operational base,
corporate office and rented
Townsville premises to major
global defence contractor
• Auction of surplus equipment
• Increased rig utilisation from 3 to
12 rigs
Phase 3: RefinementCONTINUING
Phase 2: Ramp UpCOMPLETE
For
per
sona
l use
onl
y
www.mitchellservices.com.au6
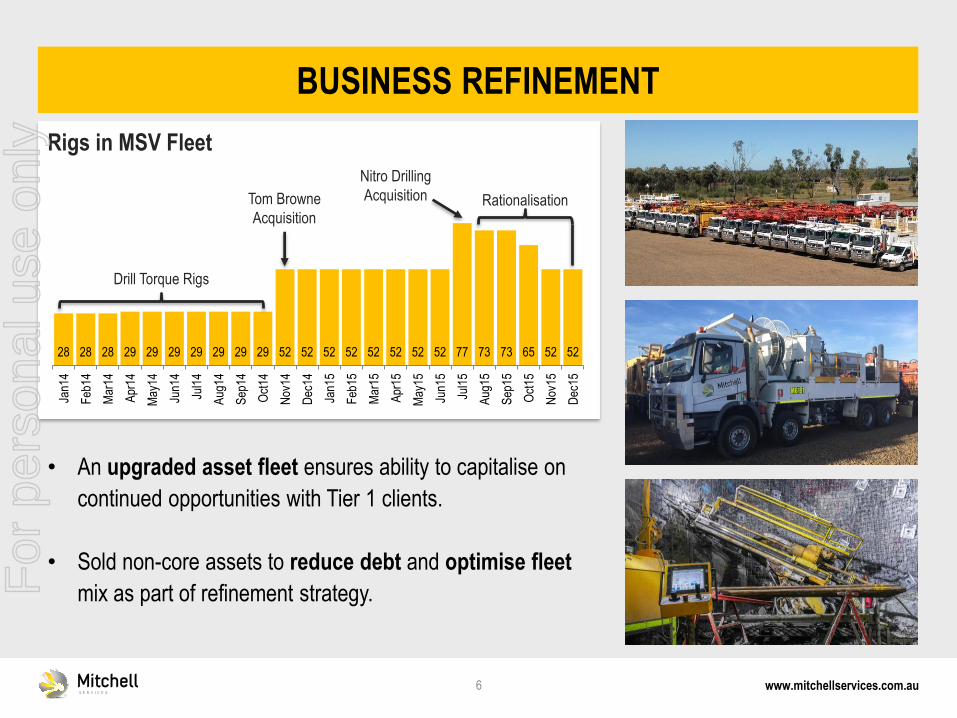
BUSINESS REFINEMENT
Rationalisation
Nitro Drilling
AcquisitionTom Browne
Acquisition
28 28 28 29 29 29 29 29 29 29 52 52 52 52 52 52 52 52 77 73 73 65 52 52
Jan1
4
Feb
14
Mar
14
Apr
14
May
14
Jun1
4
Jul1
4
Aug
14
Sep
14
Oct
14
Nov
14
Dec
14
Jan1
5
Feb
15
Mar
15
Apr
15
May
15
Jun1
5
Jul1
5
Aug
15
Sep
15
Oct
15
Nov
15
Dec
15
Drill Torque Rigs
Rigs in MSV Fleet
• An upgraded asset fleet ensures ability to capitalise on
continued opportunities with Tier 1 clients.
• Sold non-core assets to reduce debt and optimise fleet
mix as part of refinement strategy.For
per
sona
l use
onl
y

www.mitchellservices.com.au7
BUSINESS REFINEMENT
-
1
2
3
4
5
6
Mill
ions
($)
Commercial Debt Facilities
-
1
2
3
4
5
6
7
Mill
ions
($)
Asset Sales
• Strategic sales of non-core
assets completed for $6.32
million.
• Reduction in commercial debt
facilities.
• Optimisation of fleet mix to
capitalise on long term
revenue streams from high
quality Tier 1 clients.
44%
38%
18%
Use of Asset Sale Funds
Debt Repayments
Capital Expenditure
Evolution Ramp Up
For
per
sona
l use
onl
y

www.mitchellservices.com.au8
RESULTS OVERVIEW
1H16 1H15 Change
$000's $000's %
Revenue 18,472 9,808 88%
EBITDA 131 (1,113) 112%
EBIT (2,467) (2,607) 5%
NPBT (3,116) (2,917) (7%)
Statutory Profit & Loss
1H16 1H15 Change
$000's $000's %
Revenue 18,472 9,808 88%
EBITDA 2,009 (216) 1028%
EBIT (589) (1,711) 66%
NPBT (1,238) (2,020) 39%
Adjusted Profit & Loss
Please note “Adjusted” figures represent non-IFRS information that has not been subject
to an audit or review at 31 December 2015
1H1H
1H2H
2H
-
10,000
20,000
30,000
FY14 FY15 FY16
Revenue ($000's)
1H1H
1H
2H
2H
(5,000)
(4,000)
(3,000)
(2,000)
(1,000)
-
1,000
FY14 FY15 FY16
Statutory EBITDA ($000's)
1H 1H
1H
2H2H
(3,000)
(2,000)
(1,000)
-
1,000
2,000
3,000
FY14 FY15 FY16
Adjusted EBITDA ($000's)
For
per
sona
l use
onl
y

www.mitchellservices.com.au9
REVENUE BY CLIENT TYPE
VALUE OF TIER 1
• Large / multinational mining
and energy companies
• Very high safety and
business system
requirements
• Generally brownfield work
for existing mining operators
• Longer term contracts
*large / multinational mining & energy companies
$3.47m $4.06m $2.83m
$0.65m
$5.57m
$15.45m
HY2014 HY2015 HY2016
Tier 1 operating income*
Other operating income
$4.13m
$9.63m
$18.29m
For
per
sona
l use
onl
y

www.mitchellservices.com.au10
44.4%18.5%21.2%2.6%
13.2%
Gold Copper Coal Lead/Zinc/Silver Other
OPERATING REVENUE BY COMMODITY
Strategic focus on diversifying commodity mix
44.4%
18.5%
21.2%
2.6%13.2%
HY2014 $4.13m
9.5%
24.8%
40.5%
21.1%
4.1%
HY2015 $9.63m
23.5%
5.6%
54.6%
12.9%3.3%
HY2016 $18.29m
For
per
sona
l use
onl
y

www.mitchellservices.com.au11
Surface Underground Other
OPERATING REVENUE BY DRILLING TYPE
87.9%
10.5%1.6%
HY2014 $4.13m
89.2%
5.9%4.9%
HY2015 $9.63m
85.9%
12.8%1.3%
HY2016 $18.29m
Underground has grown by 314% from HY2015 to HY2016
For
per
sona
l use
onl
y

www.mitchellservices.com.au12
ADJUSTED EBITDA
131
2,009
Please note ADJUSTED EBITDA represents non-IFRS information that has not been subject to an audit or review at 31 December 2015 and is used internally by management to assess the
underlying performance of the business.
REPORTED
EBITDA ($000’s)
RESTRUCTURE
COSTS
NITRO ACQUISITION
& INTEGRATION
COSTS
EVOLUTION
RAMP UP
COSTS
ADJUSTED
EBITDA ($000’s)
For
per
sona
l use
onl
y

www.mitchellservices.com.au13
BALANCE SHEET
31 Dec 15 30 Jun 15 Change
$000’s $000’s %
Cash and cash equivalents 3,295 516 539%
Trade and other receivables 5,514 7,149 (23%)
Other current assets 2,277 18,438 (88%)
Total current assets 11,086 26,103 (58%)
Property, plant and equipment 26,534 18,287 45%
Other non-current assets 2,994 2,996 (0%)
Total non-current assets 29,528 21,283 39%
Total assets 40,614 47,386 (14%)
Bank overdraft 600 1,130 (47%)
Commercial facilities 1,326 2,293 (42%)
Other current liabilities 7,215 24,955 (71%)
Total current liabilities 9,142 28,378 (68%)
Commercial facilities 1,968 3,656 (46%)
Shareholder loans 8,500 0 100%
Other non-current liabilities 110 98 12%
Total non-current liabilities 10,578 3,754 182%
Total liabilities 19,719 32,132 (39%)
Net assets 20,895 15,254 37%
• Overall improved
liquidity.
• Current ratio improved
from 0.92 to 1.21.
• Commercial debt
reductions of $2.6m.
For
per
sona
l use
onl
y
www.mitchellservices.com.au14
SECOND HALF OUTLOOK
• Continue to pursue strong pipeline of Tier 1
contracts.
• Focus on Tier 1 and brownfield / production
drilling.
• Continue to increase rig utilisation.
• Purchase 4 additional rigs to service Tier 1
contracts post 31 December 2015 funded
through a combination of cash and equipment
finance.
• Continue to monitor and reduce costs across
the business.For
per
sona
l use
onl
y

www.mitchellservices.com.au15
MARKET OUTLOOK
• Competitive Profile of this market segment has
continued to improve.
• New entrants are faced with barriers to entry such
as high capital cost and inability to secure financing.
• Pipeline of identified opportunities continues to
grow.
• Greenfield exploration sector remains subdued.
• Interest in gold is increasing.
• Ability to leverage to the upside when general
market conditions improve.For
per
sona
l use
onl
y