Embed Size (px)
Citation preview
– 1 –– 1 –
Half Year Results 2017
Supplementary Slides
– 2 –– 2 –
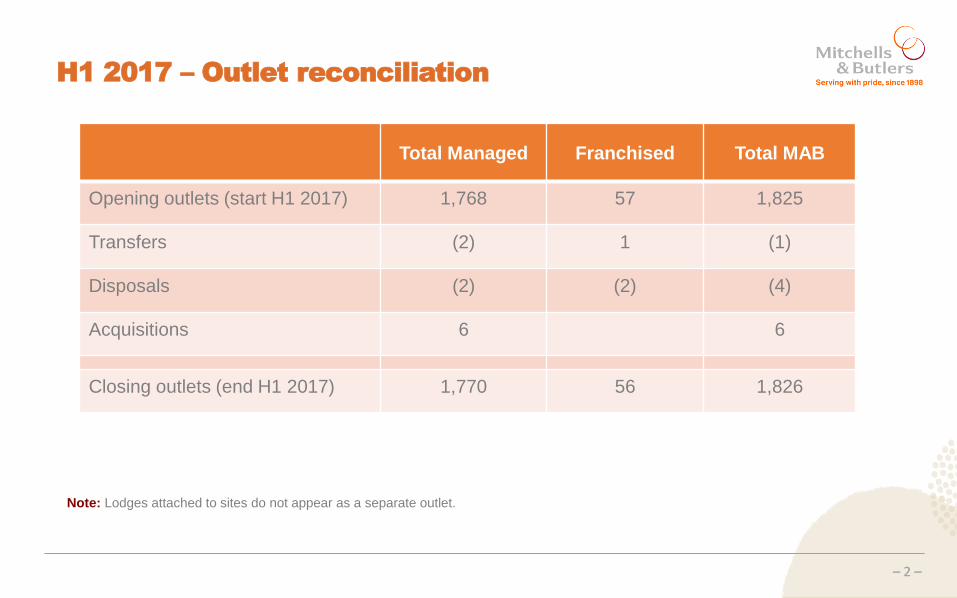
Total Managed Franchised Total MAB
Opening outlets (start H1 2017) 1,768 57 1,825
Transfers (2) 1 (1)
Disposals (2) (2) (4)
Acquisitions 6 6
Closing outlets (end H1 2017) 1,770 56 1,826
Supplementary Slides H1 2016
H1 2017 – Outlet reconciliation
Note: Lodges attached to sites do not appear as a separate outlet.
– 3 –– 3 –
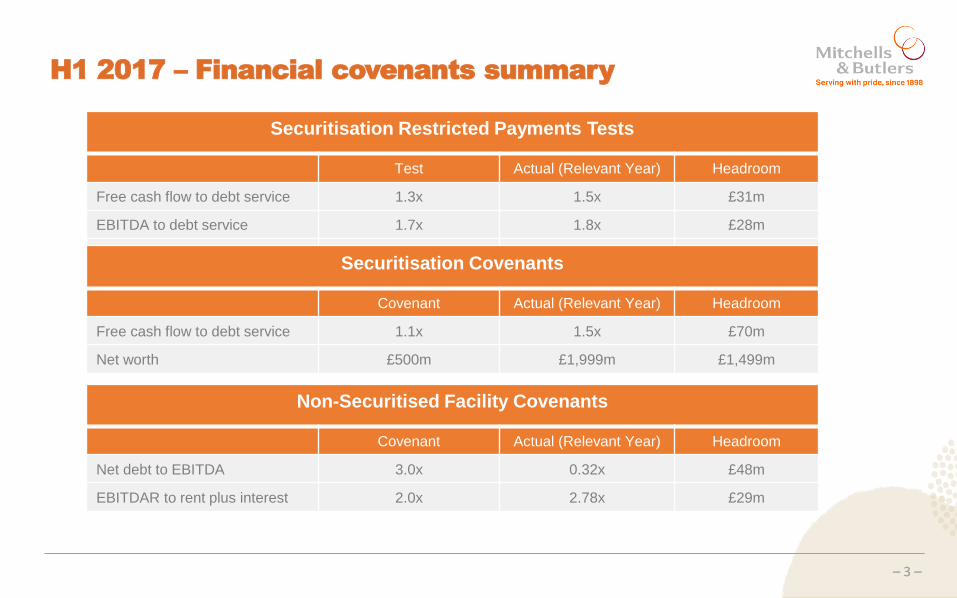
H1 2017 – Financial covenants summary
Supplementary Slides H1 2016
Securitisation Restricted Payments Tests
Test Actual (Relevant Year) Headroom
Free cash flow to debt service 1.3x 1.5x £31m
EBITDA to debt service 1.7x 1.8x £28m
Securitisation Covenants
Covenant Actual (Relevant Year) Headroom
Free cash flow to debt service 1.1x 1.5x £70m
Net worth £500m £1,999m £1,499m
Non-Securitised Facility Covenants
Covenant Actual (Relevant Year) Headroom
Net debt to EBITDA 3.0x 0.32x £48m
EBITDAR to rent plus interest 2.0x 2.78x £29m
– 4 –– 4 –
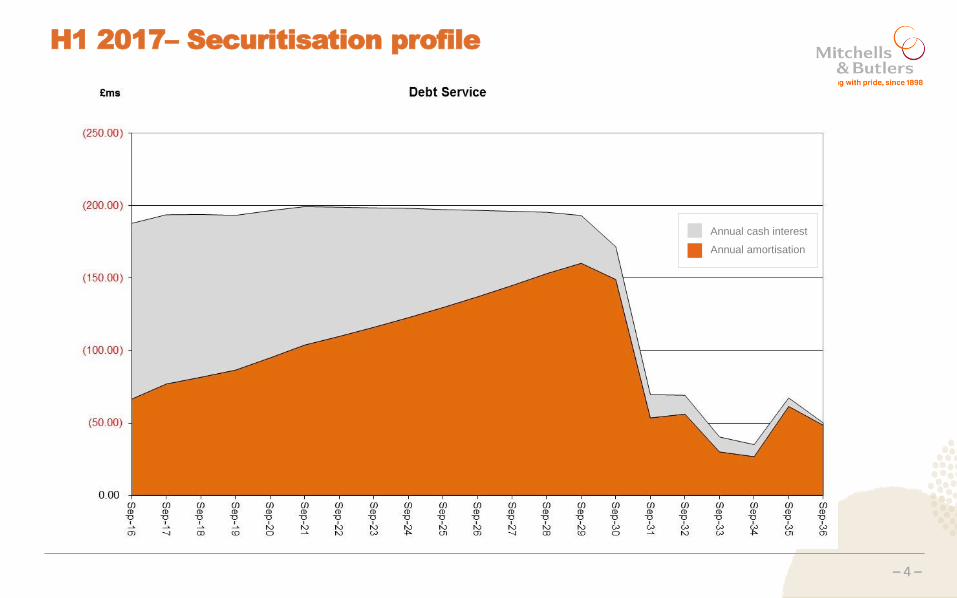
Annual amortisation
Annual cash interest
H1 2017– Securitisation profile