Embed Size (px)
Citation preview

berthiezbumotecdörriesdroop+reinheckertscharmannsipstarragttlwmw
Half-year results 2013
26 July 2013
Legal note
The economic projections and predictions contained in this information relate to future facts. Such projections and predictions are subject to risks uncertainties and changes which cannot be foreseen and which are beyond the control of the issuer. Starrag Group is therefore not in a position to make any representations as to the accuracy of economic projections and predictions or their impact on the financial situation of Starrag Group or the market in the securities of Starrag Group.
2
Half-year 2013 presentation
Markets
Financial Review
Strategic Update
Outlook
3
Order intake and sales increased – EBIT margin of 5 %
Order intake up 7 % compared to prior year’s period
Sales increase by 9 %
EBIT 9.1 million CHF or 4.6 percent of sales
Net income 5.7 million CHF or 2.9 percent of sales
Higher order intake and sales expected for full fiscal 2013
4
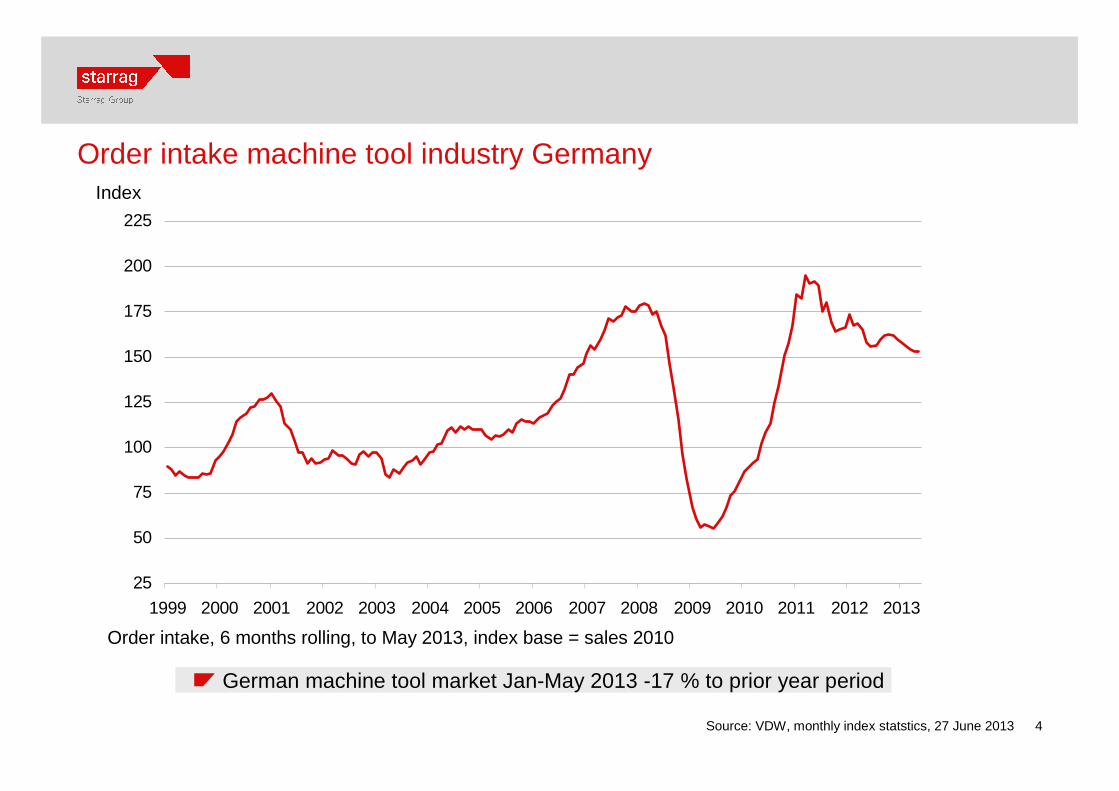
Order intake machine tool industry Germany
Source: VDW, monthly index statstics, 27 June 2013
Order intake, 6 months rolling, to May 2013, index base = sales 2010
Index
25
50
75
100
125
150
175
200
225
1999 2000 2001 2002 2003 2004 2005 2006 2007 2008 2009 2010 2011 2012 2013
German machine tool market Jan-May 2013 -17 % to prior year period
5
0
20
40
60
80
100
120
Q1 10 Q2 10 Q3 10 Q4 10 Q1 11 Q2 11 Q3 11 Q4 11 Q1 12 Q2 12 Q3 12 Q4 12 Q1 13 Q2 13
Quarterly 4 Quarter Moving Average
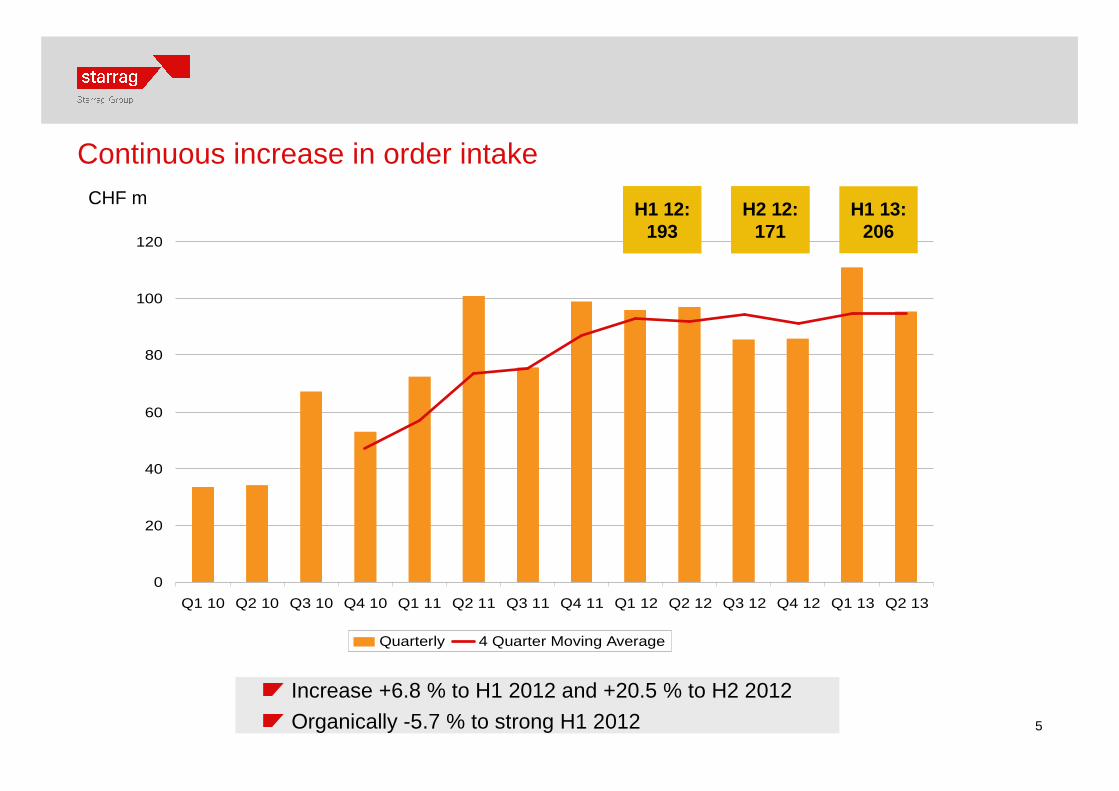
Continuous increase in order intakeCHF m
H1 12:193
H2 12:171
H1 13:206
H1 12:193
H2 12:171
Increase +6.8 % to H1 2012 and +20.5 % to H2 2012
Organically -5.7 % to strong H1 2012
6
71 86 98
30
59
53
95
137
86
3119
59
20
14
64 46
108109
77
340
50
100
150
200
250
300
350
400
2009 2010 2011 2012 H1 2013
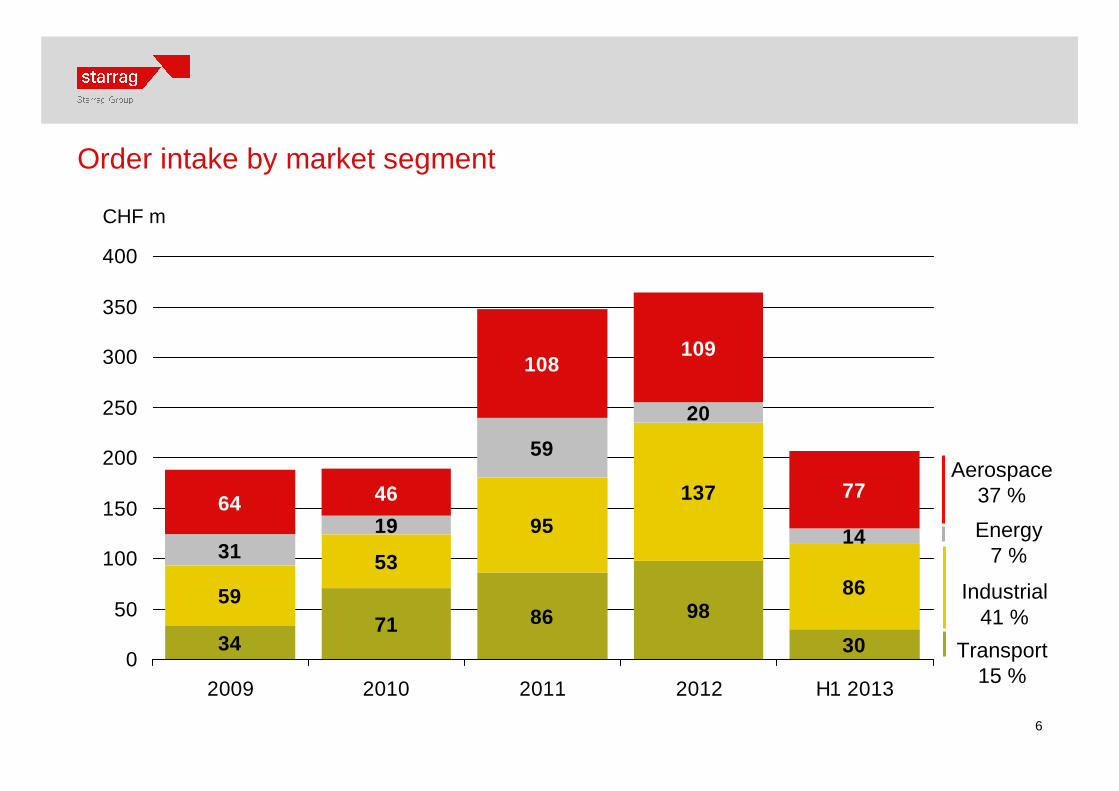
Order intake by market segment
CHF m
Aerospace37 %
Transport15 %
Energy7 %
Industrial41 %
7
112
211 210
146
50 89
102 104
4626 7
35 50
14
93
0
50
100
150
200
250
300
350
400
2009 2010 2011 2012 H1 2013
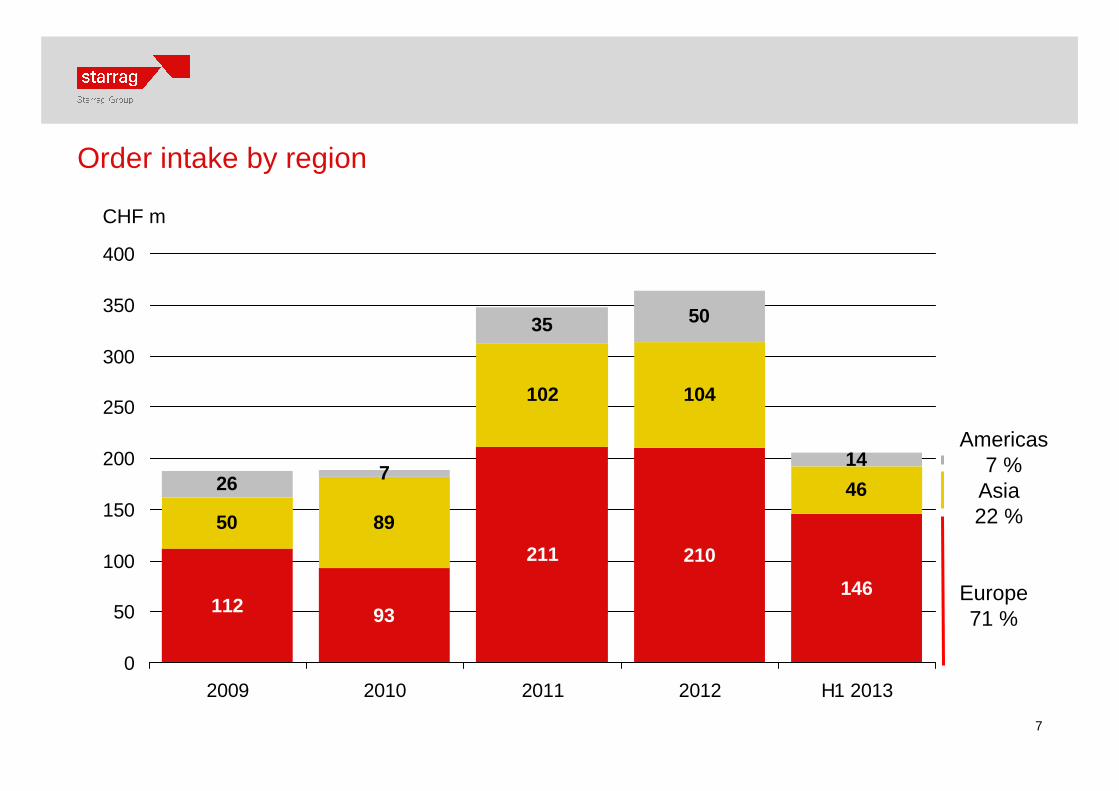
Order intake by region
CHF m
Americas7 %
Europe71 %
Asia22 %

8
Continuous investment into future success
CHF 4.8 m capex in H1 2013
improvements in factoriesIT platforms including integration
3 new products developed for presentation at major machine tool fair EMO in September
Increase of Bumotec manufacturing capacities in planning status
9
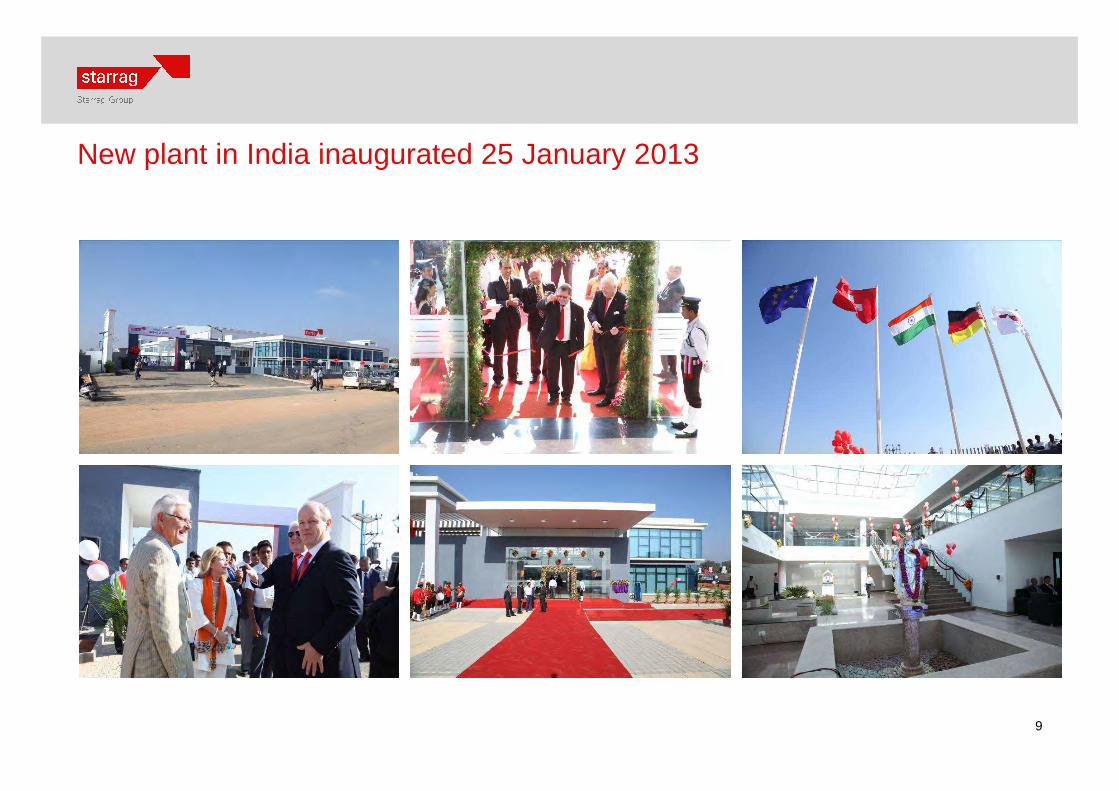
New plant in India inaugurated 25 January 2013

10
Newly developed product introduced at IMTEX in Bangalore
10
11
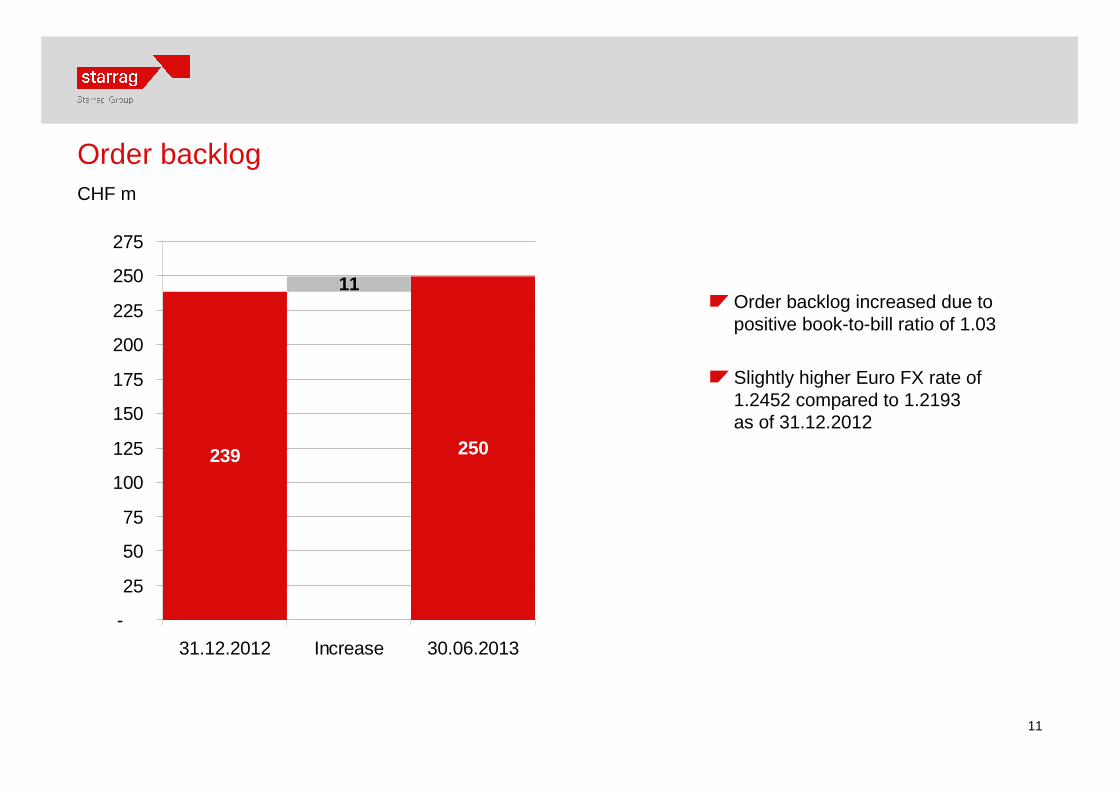
Order backlog
Order backlog increased due to positive book-to-bill ratio of 1.03
Slightly higher Euro FX rate of 1.2452 compared to 1.2193 as of 31.12.2012
CHF m
239 250
11
-
25
50
75
100
125
150
175
200
225
250
275
31.12.2012 Increase 30.06.2013

12
Sales revenue
Sales up by 8.8 %
Bumotec acquisition effect
Slightly higher Euro FX rate of 1.2415 compared to 1.2177 in prior year period
Organic decrease of 4.3 % due to lower orders in H2 2012
CHF m
183199
16
-
25
50
75
100
125
150
175
200
225
H1 2012 Increase H1 2013
13
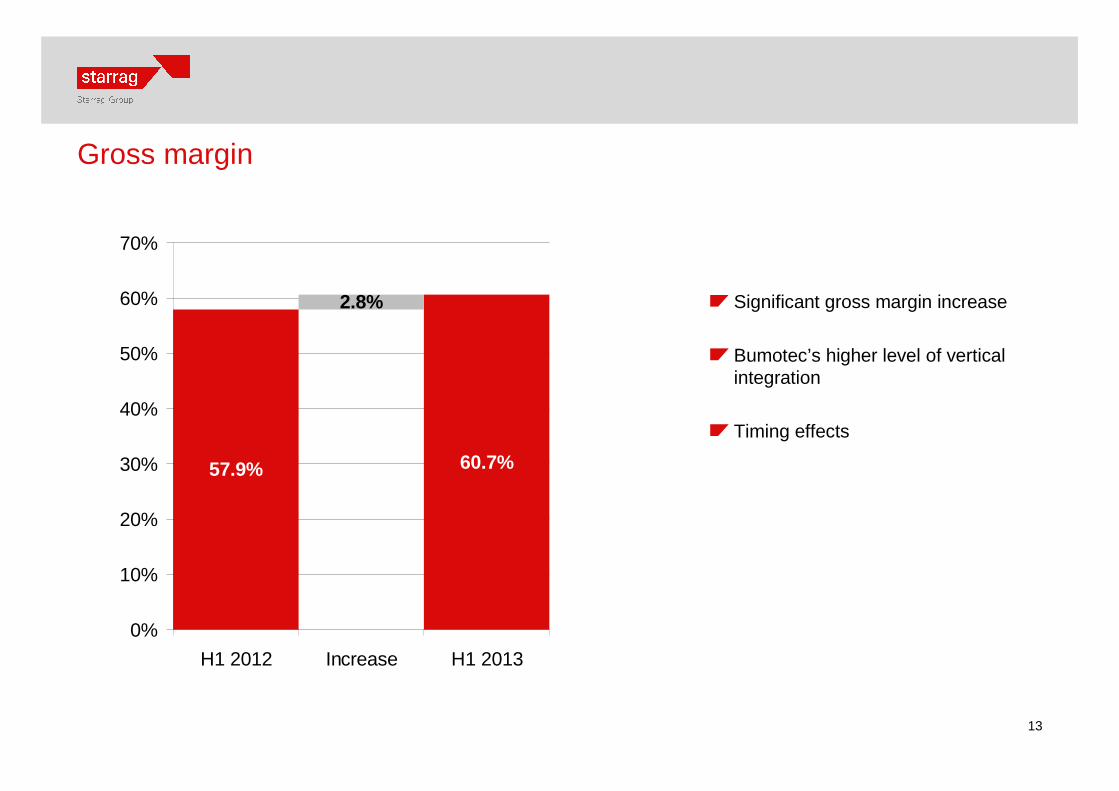
Gross margin
Significant gross margin increase
Bumotec’s higher level of vertical integration
Timing effects
57.9% 60.7%
2.8%
0%
10%
20%
30%
40%
50%
60%
70%
H1 2012 Increase H1 2013
14
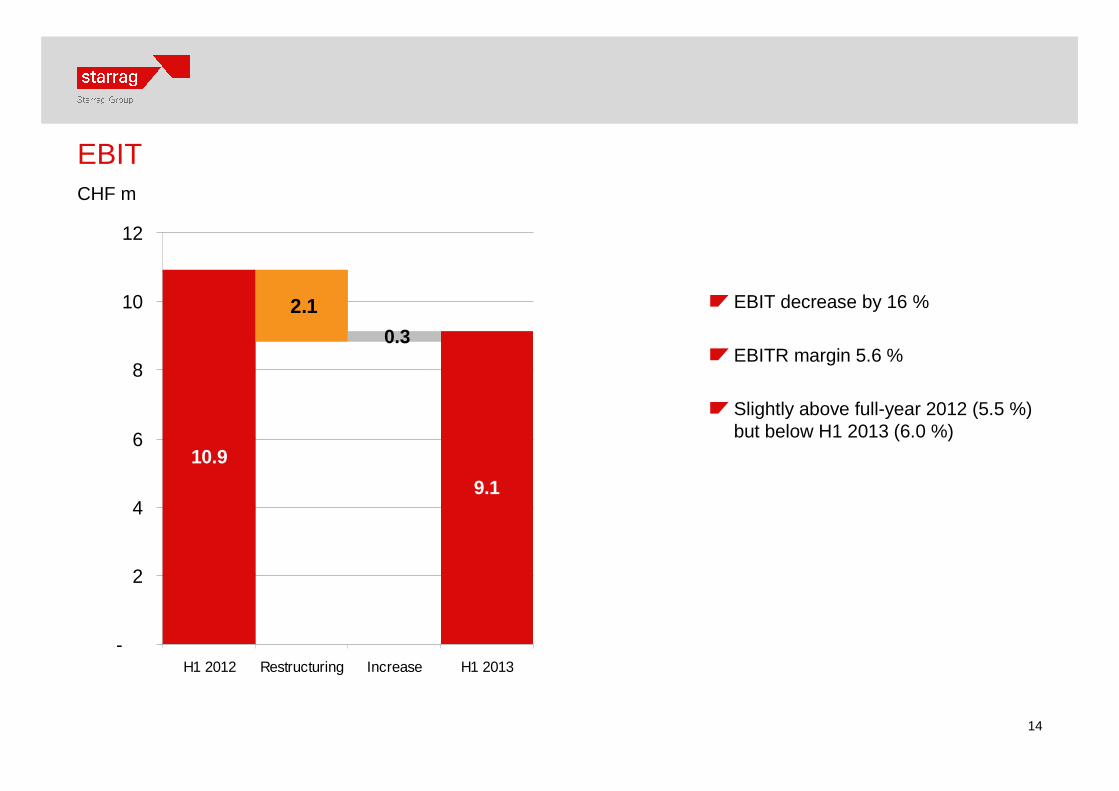
EBIT
EBIT decrease by 16 %
EBITR margin 5.6 %
Slightly above full-year 2012 (5.5 %)but below H1 2013 (6.0 %)
CHF m
10.9
9.1
2.1
0.3
-
2
4
6
8
10
12
H1 2012 Restructuring Increase H1 2013
15
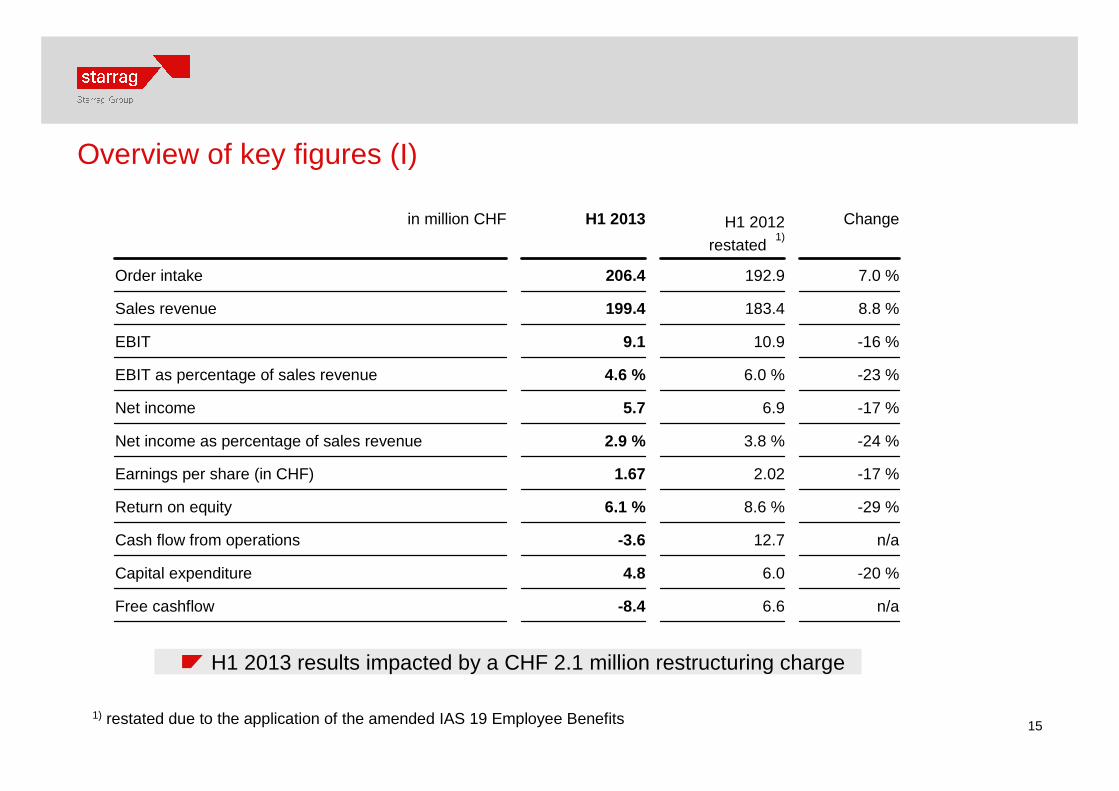
Overview of key figures (I)
1) restated due to the application of the amended IAS 19 Employee Benefits
n/a6.6-8.4Free cashflow
-20 %6.04.8Capital expenditure
n/a12.7-3.6Cash flow from operations
-29 %8.6 %6.1 %Return on equity
-17 %2.021.67Earnings per share (in CHF)
-24 %3.8 %2.9 %Net income as percentage of sales revenue
-17 %6.95.7Net income
-23 %6.0 %4.6 %EBIT as percentage of sales revenue
-16 %10.99.1EBIT
8.8 %183.4199.4Sales revenue
7.0 %192.9206.4Order intake
ChangeH1 2012 restated
1)
H1 2013in million CHF
H1 2013 results impacted by a CHF 2.1 million restructuring charge

16
Overview of key figures (II)
1) restated due to the application of the amended IAS 19 Employee Benefits
1.0 %1'6441'659Employees at year end
3.8 %53 %55 %Equity ratio
2.0 %183.6187.2Shareholder's equity
-59 %24.910.3Net cash
-1.2 %347.2343.1Total assets
4.7 %238.6249.7Order backlog
Change31.12.2012 restated
1)
30.06.2013in million CHF
Continued high levels of equity financing
Decrease in net cash due to advance purchasing for expected orders and lower liabilities
17
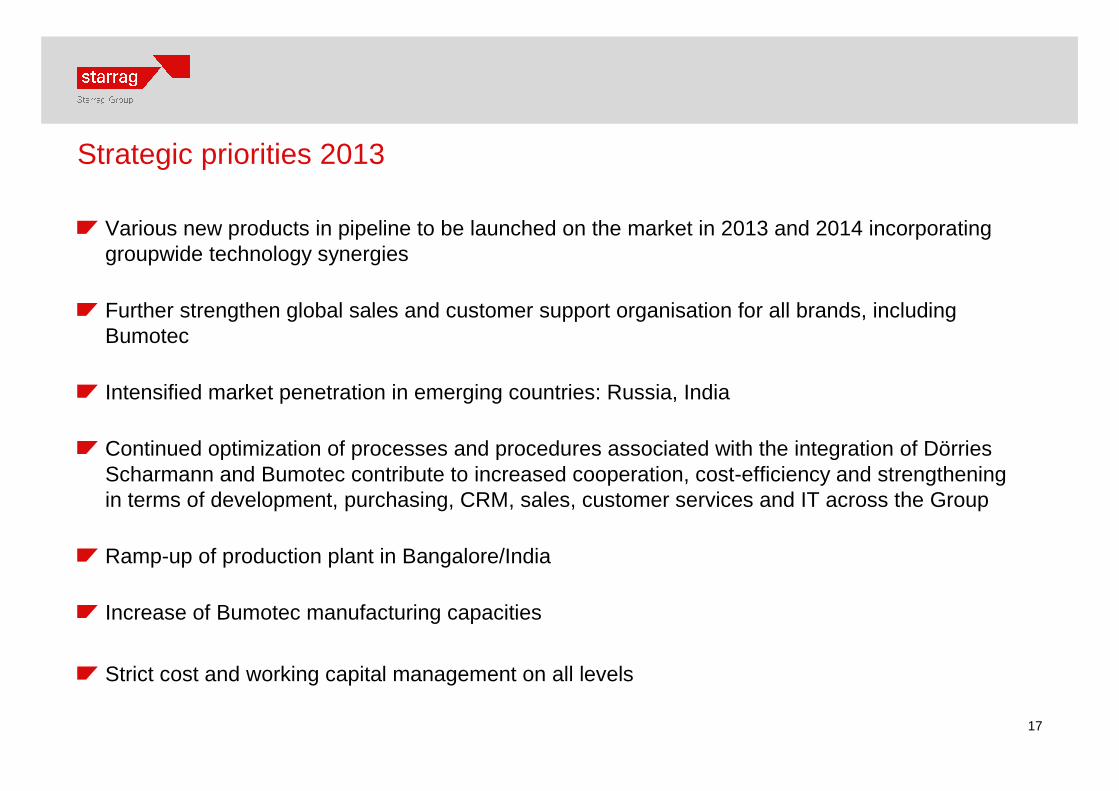
Strategic priorities 2013
Various new products in pipeline to be launched on the market in 2013 and 2014 incorporating groupwide technology synergies
Further strengthen global sales and customer support organisation for all brands, including Bumotec
Intensified market penetration in emerging countries: Russia, India
Continued optimization of processes and procedures associated with the integration of Dörries Scharmann and Bumotec contribute to increased cooperation, cost-efficiency and strengthening in terms of development, purchasing, CRM, sales, customer services and IT across the Group
Ramp-up of production plant in Bangalore/India
Increase of Bumotec manufacturing capacities
Strict cost and working capital management on all levels

18
Outlook full fiscal 2013
Ongoing low visibility due to uncertain market developments on all target markets
Recent strong recovery of aerospace market
No recovery expected in wind energy segment
Declining growth rates of Chinese economy as a challenge
Increased competition pressure in India due to weakened JPY and currently lower demand
Stimulus expected from Hanover EMO in September – three new machines to be presented
19
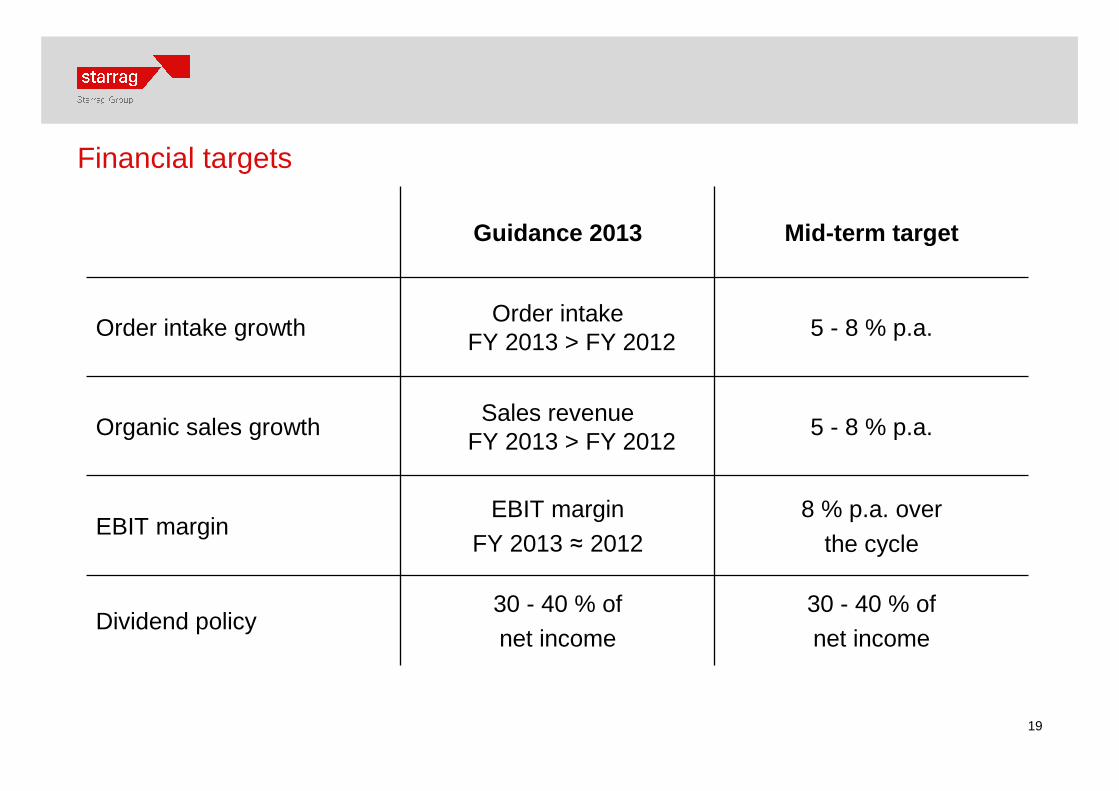
Financial targets
Guidance 2013 Mid-term target
Order intake growthOrder intake
FY 2013 > FY 20125 - 8 % p.a.
Organic sales growthSales revenue
FY 2013 > FY 20125 - 8 % p.a.
EBIT marginEBIT margin
FY 2013 ≈ 20128 % p.a. over
the cycle
Dividend policy30 - 40 % of
net income
30 - 40 % of
net income
20
Corporate calendar / Contact
05.11.2013 Q3 2013 results
27.01.2014 Initial information on 2013 results07.03.2014 Presentation of 2013 results for analysts and the media in Zurich
12.04.2014 Annual general meeting in Rorschacherberg
09.05.2014 Q1 2014 results
26.07.2014 Half-year report 2014
Dr. Frank Brinken, CEO, Phone +41 71 858 81 11, Fax +41 71 858 82 09
Gerold Brütsch, CFO, Phone +41 71 858 81 11, Fax +41 71 858 82 30
Further Information:http://[email protected]

berthiezbumotecdörriesdroop+reinheckertscharmannsipstarragttlwmw
We are pleased to answer your questions.

22
Back-up slides
23
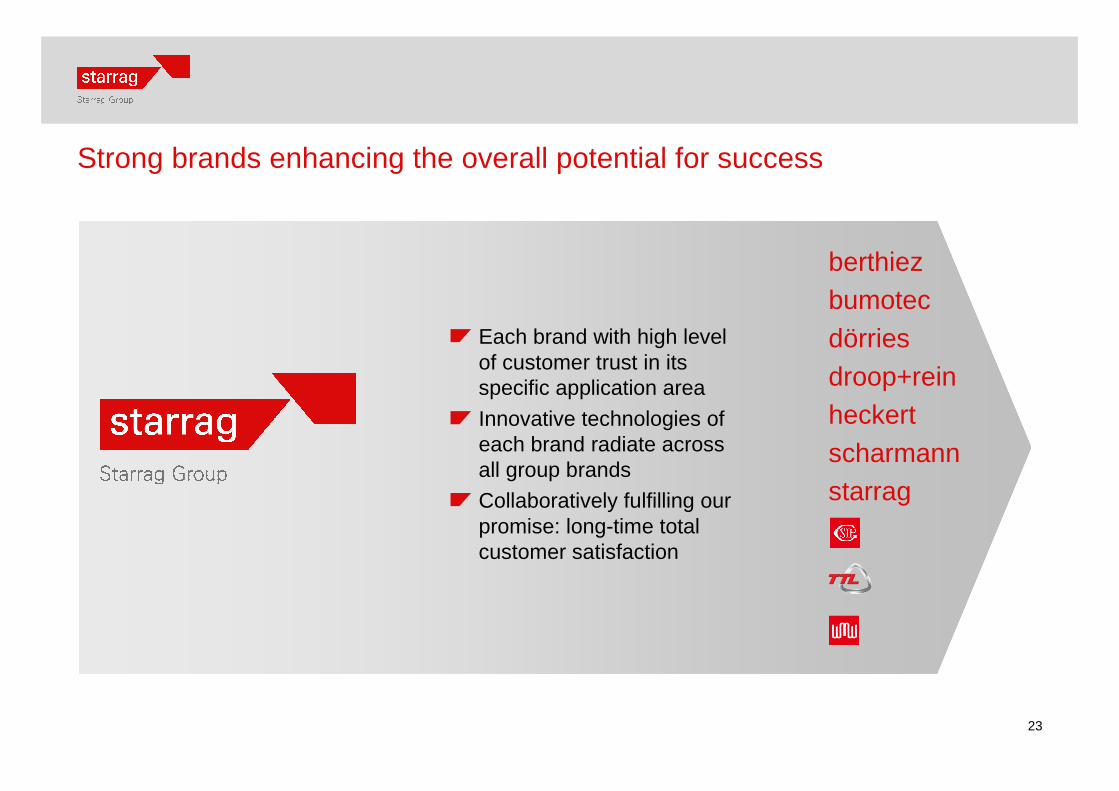
Strong brands enhancing the overall potential for success
berthiezbumotecdörriesdroop+reinheckertscharmannstarrag
Each brand with high levelof customer trust in itsspecific application area
Innovative technologies of each brand radiate acrossall group brands
Collaboratively fulfilling ourpromise: long-time total customer satisfaction

24
High-precision machine tools for greater productivity
Starrag Group is a global technology leader in manufacturing high-precision machinetools for milling turning, boring and grinding of small, medium-sized and larger workpieces of metallic and composite materials. Principle customers are internationallyactive companies in the Aerospace, Energy, Industrial and Transport sectors. In addition to its portfolio of machine tools, Starrag Group provides integrated technology and maintenance services that significantly enhance customer productivity.
Starrag Group products are marketed under the following strategic brands: Berthiez, Bumotec, Dörries, Droop+Rein, Heckert, Scharmann, SIP, Starrag, TTL, WMW. Headquartered in Rorschach/Switzerland, the Starrag Group operates manufacturingplants in Switzerland, Germany, France, the UK and India and has established a network of sales and service subsidiaries in numerous other countries.
Starrag Group is listed on the SIX Swiss Exchange (STGN).
25
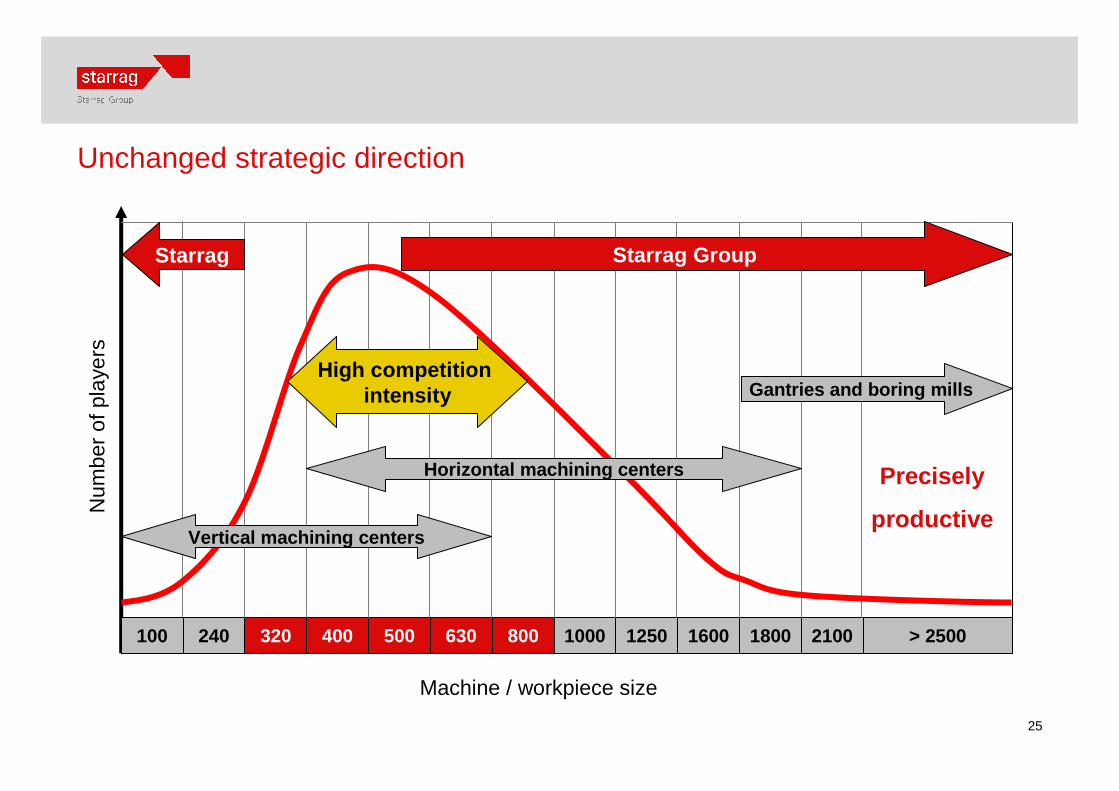
Unchanged strategic direction
100 240 320 400 500 630 800 1000 1250 1600 1800 2100 > 2500100
Num
ber
of p
laye
rs
Vertical machining centers
Horizontal machining centers
Gantries and boring mills
Precisely
productive
Machine / workpiece size
Starrag Group
High competitionintensity
Starrag
26
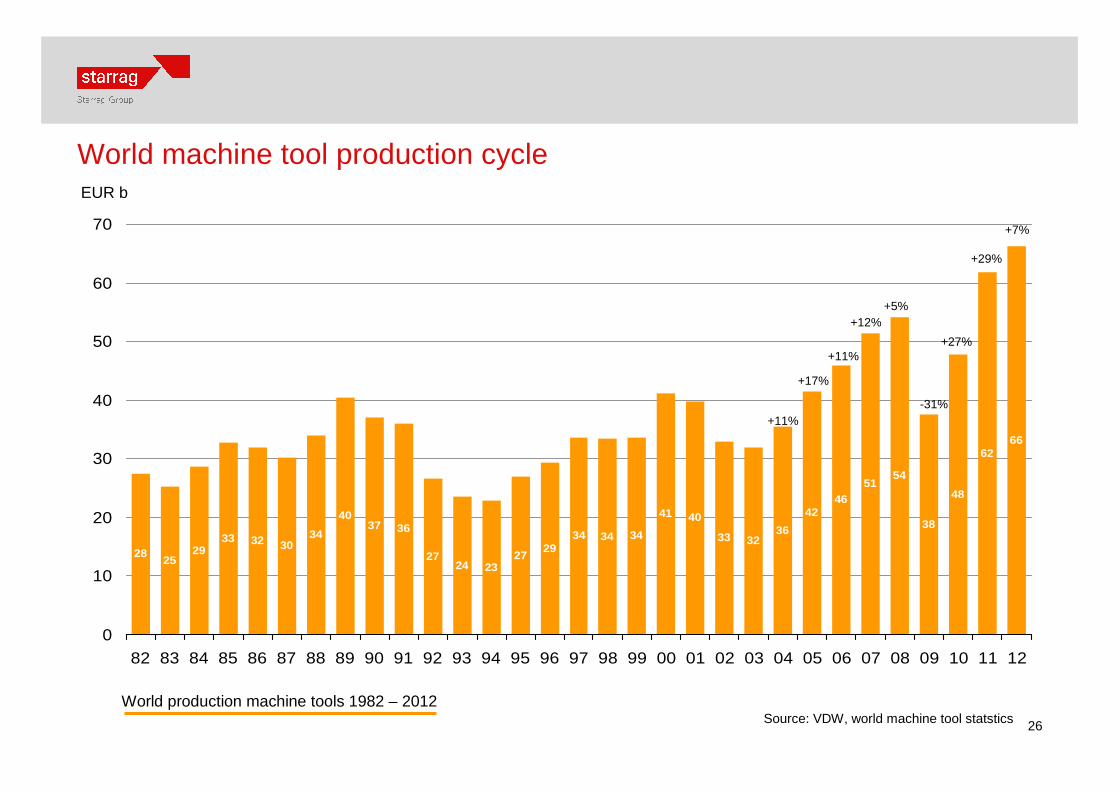
World machine tool production cycle
2825
2933 32 30
34
4037 36
2724 23
2729
34 34 34
41 40
33 3236
4246
5154
38
48
6266
0
10
20
30
40
50
60
70
82 83 84 85 86 87 88 89 90 91 92 93 94 95 96 97 98 99 00 01 02 03 04 05 06 07 08 09 10 11 12
EUR b
+17%
+11%
+12%+5%
+11%-31%
+27%
+29%
Source: VDW, world machine tool statstics
+7%
World production machine tools 1982 – 2012
27
27
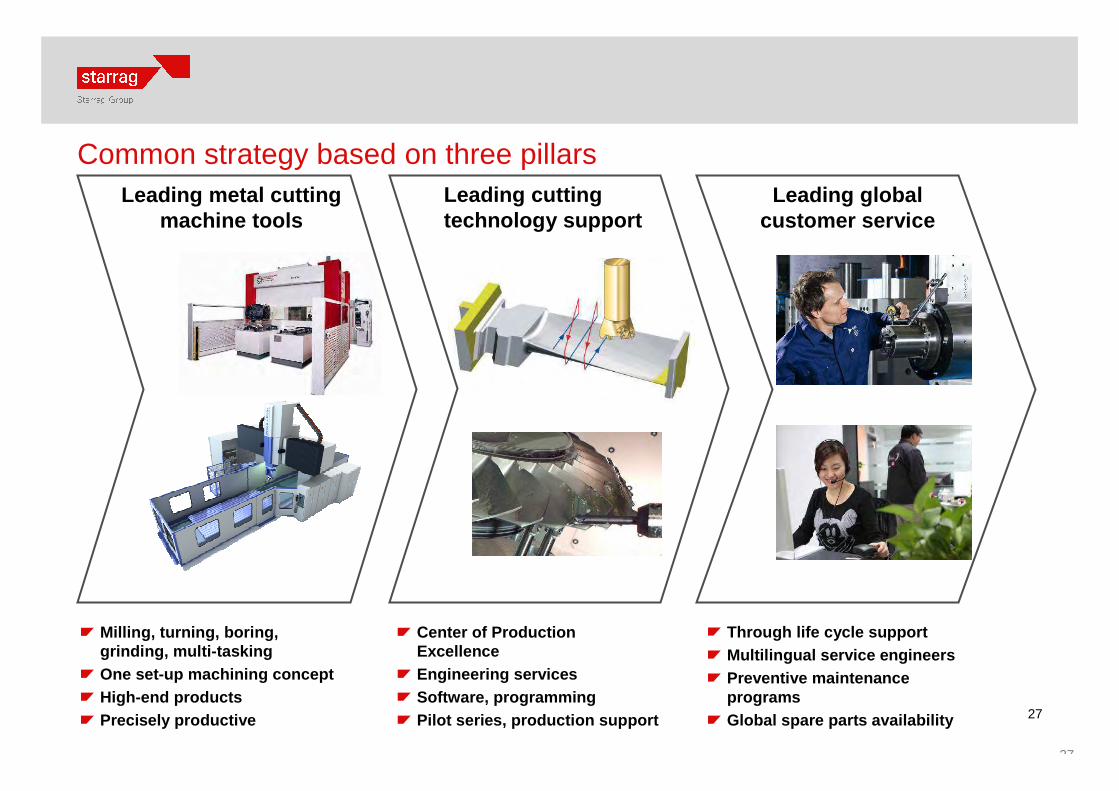
Common strategy based on three pillarsLeading metal cutting
machine toolsLeading global
customer serviceLeading cutting technology support
Center of Production ExcellenceEngineering servicesSoftware, programmingPilot series, production support
Milling, turning, boring, grinding, multi-taskingOne set-up machining conceptHigh-end productsPrecisely productive
Through life cycle supportMultilingual service engineersPreventive maintenance programsGlobal spare parts availability

28
Target markets and product positioning
Aerospace Energy Industrial TransportShare of 2010-2012 order intake
29 % 11 % 32 % 28 %
Business Unit 1- Starrag ██ ██- TTL ██ ██
Business Unit 2- Heckert ██ ██ ██- WMW ██ ██
Business Unit 3- Berthiez ██ ██
- Dörries ██ ██ ██ ██
- Droop+Rein ██ ██ ██ ██- Scharmann ██ ██ ██ ██
Business Unit 4- Bumotec ██ ██- SIP ██ ██ ██
██ = Main Application██ = Application

29
Global presence in sales, application and service support
Manufacturing plant, Sales and service organization
Sales and service organization
Service organization
30
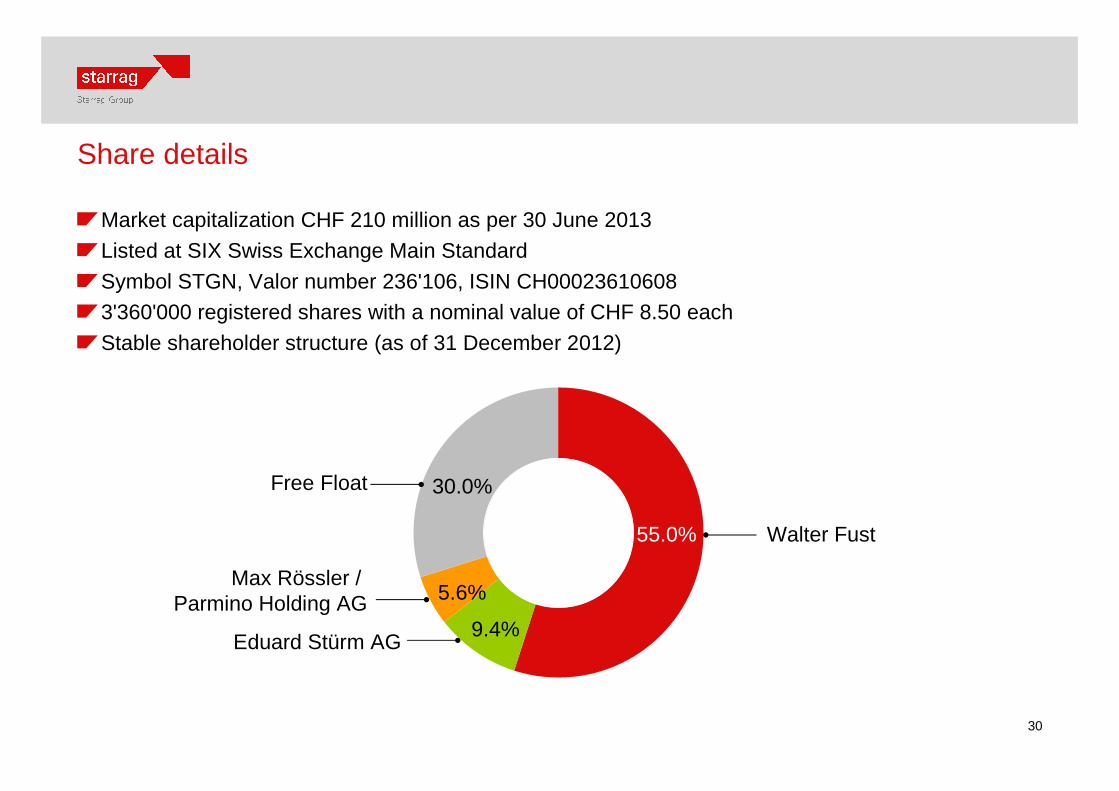
Share details
30.0%
55.0% Walter Fust
9.4%Eduard Stürm AG
Free Float
5.6%Max Rössler /
Parmino Holding AG
Market capitalization CHF 210 million as per 30 June 2013
Listed at SIX Swiss Exchange Main Standard
Symbol STGN, Valor number 236'106, ISIN CH000236106083'360'000 registered shares with a nominal value of CHF 8.50 each
Stable shareholder structure (as of 31 December 2012)
31
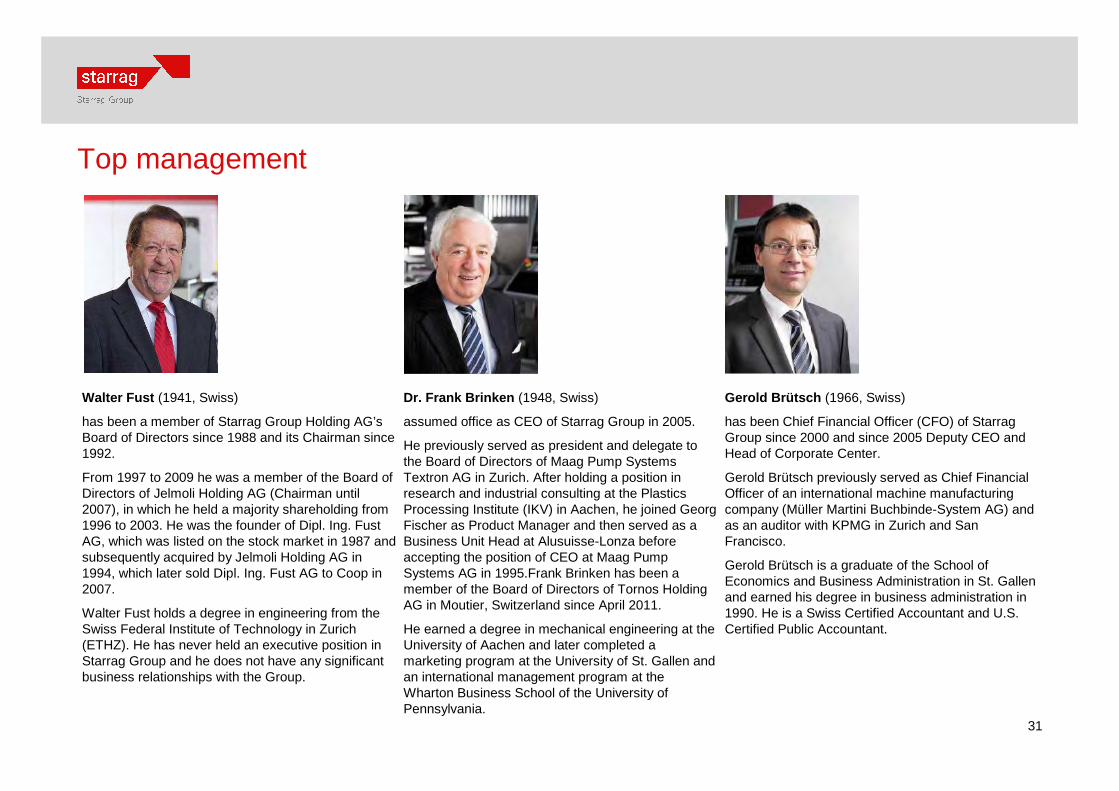
Top management
Walter Fust (1941, Swiss)
has been a member of Starrag Group Holding AG’s Board of Directors since 1988 and its Chairman since 1992.
From 1997 to 2009 he was a member of the Board of Directors of Jelmoli Holding AG (Chairman until 2007), in which he held a majority shareholding from 1996 to 2003. He was the founder of Dipl. Ing. Fust AG, which was listed on the stock market in 1987 and subsequently acquired by Jelmoli Holding AG in 1994, which later sold Dipl. Ing. Fust AG to Coop in 2007.
Walter Fust holds a degree in engineering from the Swiss Federal Institute of Technology in Zurich (ETHZ). He has never held an executive position in Starrag Group and he does not have any significant business relationships with the Group.
Dr. Frank Brinken (1948, Swiss)
assumed office as CEO of Starrag Group in 2005.
He previously served as president and delegate to the Board of Directors of Maag Pump Systems Textron AG in Zurich. After holding a position in research and industrial consulting at the Plastics Processing Institute (IKV) in Aachen, he joined Georg Fischer as Product Manager and then served as a Business Unit Head at Alusuisse-Lonza before accepting the position of CEO at Maag Pump Systems AG in 1995.Frank Brinken has been a member of the Board of Directors of Tornos Holding AG in Moutier, Switzerland since April 2011.
He earned a degree in mechanical engineering at the University of Aachen and later completed a marketing program at the University of St. Gallen and an international management program at the Wharton Business School of the University of Pennsylvania.
Gerold Brütsch (1966, Swiss)
has been Chief Financial Officer (CFO) of Starrag Group since 2000 and since 2005 Deputy CEO and Head of Corporate Center.
Gerold Brütsch previously served as Chief Financial Officer of an international machine manufacturing company (Müller Martini Buchbinde-System AG) and as an auditor with KPMG in Zurich and San Francisco.
Gerold Brütsch is a graduate of the School of Economics and Business Administration in St. Gallen and earned his degree in business administration in 1990. He is a Swiss Certified Accountant and U.S. Certified Public Accountant.
32
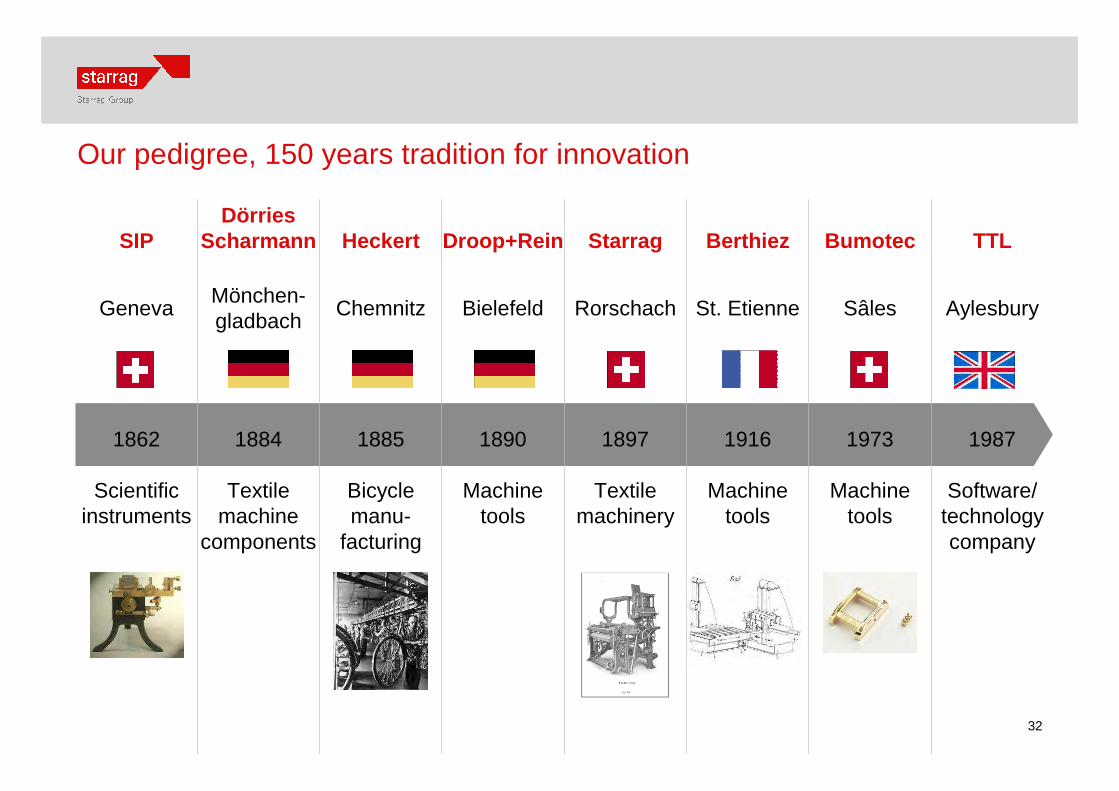
Our pedigree, 150 years tradition for innovation
SIPDörries
Scharmann Heckert Droop+Rein Starrag Berthiez Bumotec TTL
GenevaMönchen-gladbach
Chemnitz Bielefeld Rorschach St. Etienne Sâles Aylesbury
1862 1884 1885 1890 1897 1916 1973 1987
Scientific instruments
Textile machine
components
Bicyclemanu-
facturing
Machinetools
Textile machinery
Machinetools
Machinetools
Software/ technology company