Embed Size (px)
Citation preview
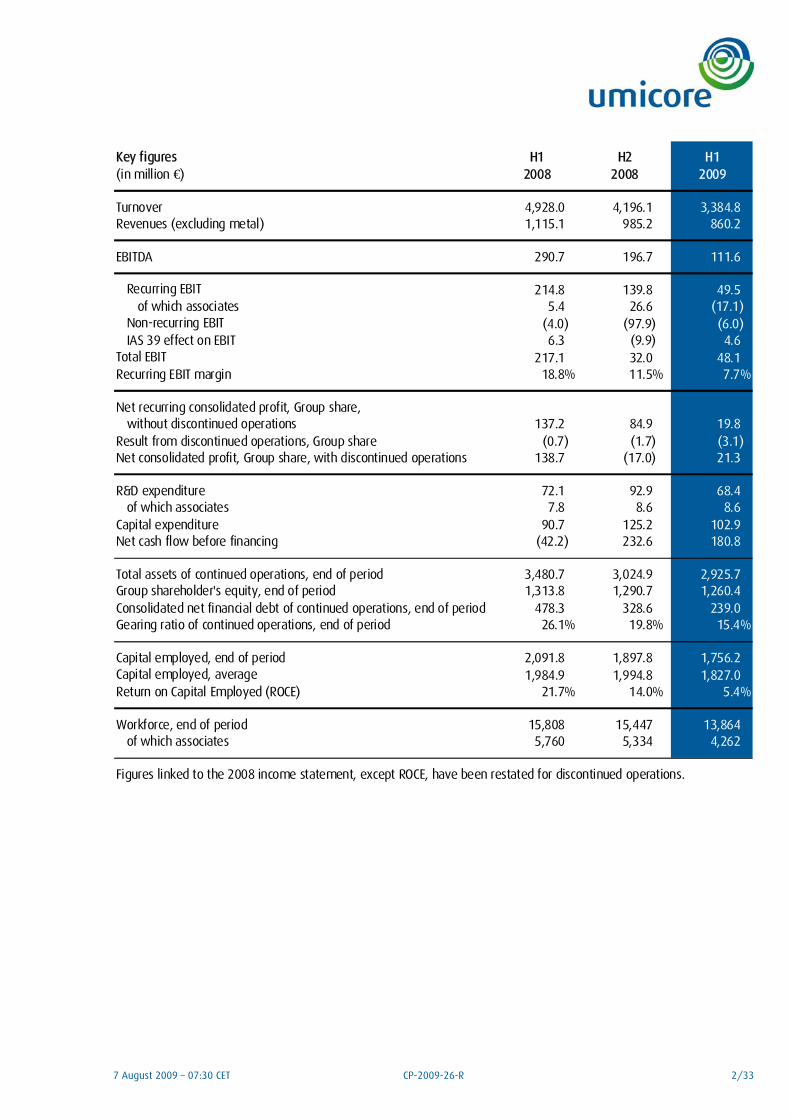
Press Release Regulated information 7 August 2009 - 07:30 CET CP-2009-26-R
n.v. Umicore s.a. Group Communications Broekstraat 31 Rue du Marais phone: +32 2 227 71 11 BTW: BE0401 574 852 B-1000 Brussels fax: +32 2 227 79 00 Bank: 210-0053806-23 www.umicore.com e-mail: [email protected] TRB: 85382
HALF YEAR RESULTS 2009
Highlights
Umicore experienced a very challenging business environment in the first half. Slow demand in many end markets was exacerbated by de-stocking through the production chain. By far the most significant impact was felt in the Precious Metals Products and Catalysts and Advanced Materials activities. In some businesses the de-stocking effect appears to have run its course with customer demand starting to pick up slowly towards the end of the period.
The Group generated strong cashflows resulting from strict working capital management. Net debt now stands at a very low level, offering the Group significant flexibility to pursue its long-term development initiatives.
• Revenues of ¤ 860.2 million (vs ¤ 1,115.1 million in H1 2008);
• Recurring EBIT of ¤ 49.5 million (vs ¤ 214.8 million);
• EBITDA of ¤ 111.6 million (vs ¤ 290.7 million);
• Net recurring profit, Group share, excluding discontinued operations, of ¤ 19.8 million (vs ¤ 137.2 million);
• Adjusted EPS of ¤ 0.18 (vs ¤ 1.17);
• ROCE of 5.4 % (vs 21.6 %);
• Net cashflow before financing of ¤ 180.8 million (vs ¤ -42.2 million);
• Net debt at the end of the period of ¤ 239.0 million (vs ¤ 328.6 million at the end of 2008).
Outlook
The visibility in many of Umicore’s end markets remains limited. There are signs of recovery in some of the sectors served by Advanced Materials and Precious Metals Products and Catalysts, albeit starting from a low base. The supply conditions in the business that has proved most resilient in the first half, Precious Metals Services, are set to weaken in the second half.
Given the above factors and taking into account the usual seasonal slowdown in the third quarter, Umicore expects that recurring EBIT for the second half of 2009 will be of the same magnitude as in the first half.
Note: All comparisons are made with the first half year of 2008, unless mentioned otherwise.
7 August 2009 – 07:30 CET CP-2009-26-R 2/33
Key figures H1 H2 H1(in million €) 2008 2008 2009
Turnover 4,928.0 4,196.1 3,384.8 Revenues (excluding metal) 1,115.1 985.2 860.2
EBITDA 290.7 196.7 111.6
Recurring EBIT 214.8 139.8 49.5 of which associates 5.4 26.6 (17.1)
Non-recurring EBIT (4.0) (97.9) (6.0) IAS 39 effect on EBIT 6.3 (9.9) 4.6
Total EBIT 217.1 32.0 48.1 Recurring EBIT margin 18.8% 11.5% 7.7%
Net recurring consolidated profit, Group share, without discontinued operations 137.2 84.9 19.8 Result from discontinued operations, Group share (0.7) (1.7) (3.1) Net consolidated profit, Group share, with discontinued operations 138.7 (17.0) 21.3
R&D expenditure 72.1 92.9 68.4 of which associates 7.8 8.6 8.6
Capital expenditure 90.7 125.2 102.9 Net cash flow before financing (42.2) 232.6 180.8
Total assets of continued operations, end of period 3,480.7 3,024.9 2,925.7 Group shareholder's equity, end of period 1,313.8 1,290.7 1,260.4 Consolidated net financial debt of continued operations, end of period 478.3 328.6 239.0 Gearing ratio of continued operations, end of period 26.1% 19.8% 15.4%
Capital employed, end of period 2,091.8 1,897.8 1,756.2 Capital employed, average 1,984.9 1,994.8 1,827.0 Return on Capital Employed (ROCE) 21.7% 14.0% 5.4%
Workforce, end of period 15,808 15,447 13,864 of which associates 5,760 5,334 4,262
Figures linked to the 2008 income statement, except ROCE, have been restated for discontinued operations.
7 August 2009 – 07:30 CET CP-2009-26-R 3/33
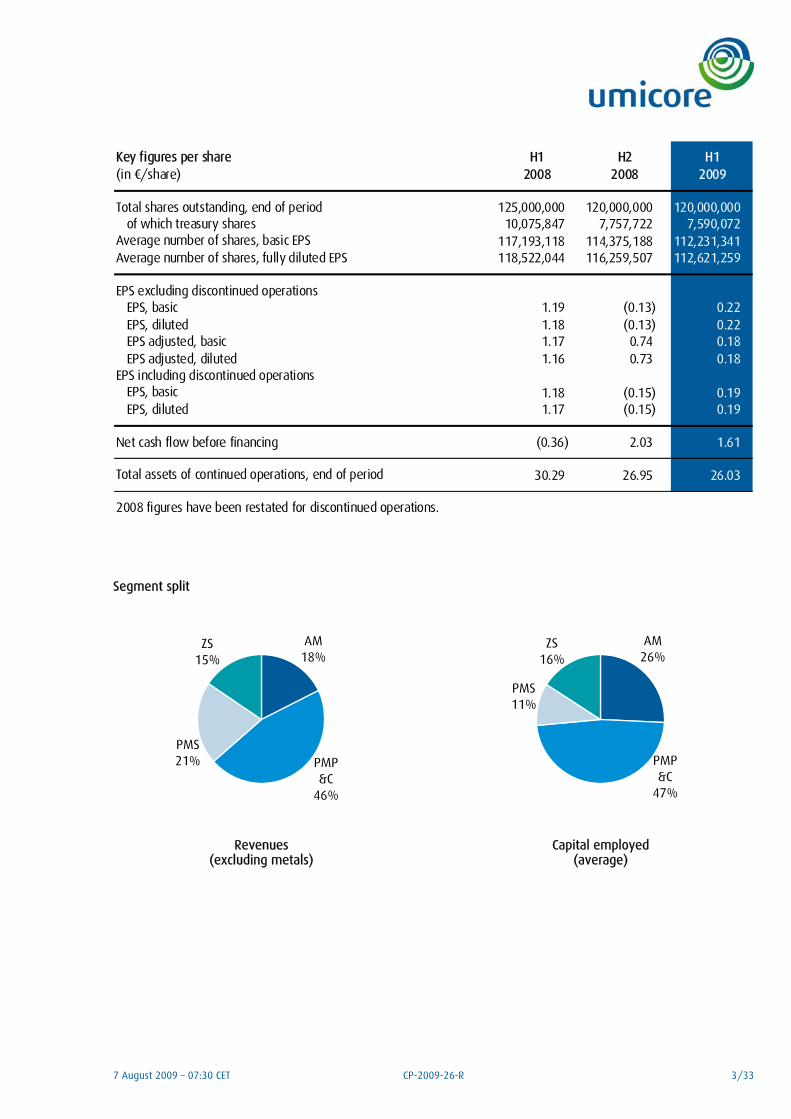
Key figures per share H1 H2 H1(in ¤/share) 2008 2008 2009
Total shares outstanding, end of period 125,000,000 120,000,000 120,000,000 of which treasury shares 10,075,847 7,757,722 7,590,072
Average number of shares, basic EPS 117,193,118 114,375,188 112,231,341 Average number of shares, fully diluted EPS 118,522,044 116,259,507 112,621,259
EPS excluding discontinued operationsEPS, basic 1.19 (0.13) 0.22 EPS, diluted 1.18 (0.13) 0.22 EPS adjusted, basic 1.17 0.74 0.18 EPS adjusted, diluted 1.16 0.73 0.18
EPS including discontinued operationsEPS, basic 1.18 (0.15) 0.19 EPS, diluted 1.17 (0.15) 0.19
Net cash flow before financing (0.36) 2.03 1.61
Total assets of continued operations, end of period 30.29 26.95 26.03
2008 figures have been restated for discontinued operations.
Segment split
AM18%
PMP&C
46%
PMS21%
ZS15%
Revenues (excluding metals)
AM26%
PMP&C
47%
PMS11%
ZS16%
Capital employed (average)
7 August 2009 – 07:30 CET CP-2009-26-R 4/33
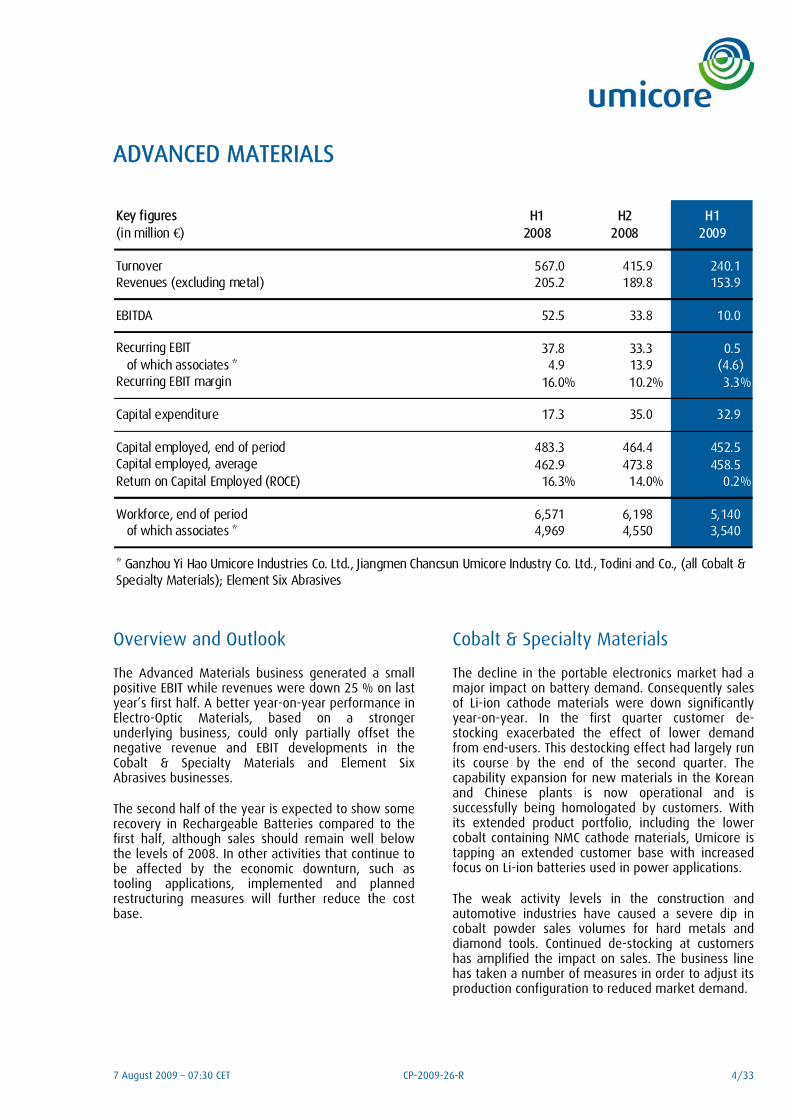
ADVANCED MATERIALS
Key figures H1 H2 H1(in million €) 2008 2008 2009
Turnover 567.0 415.9 240.1 Revenues (excluding metal) 205.2 189.8 153.9
EBITDA 52.5 33.8 10.0
Recurring EBIT 37.8 33.3 0.5 of which associates * 4.9 13.9 (4.6)
Recurring EBIT margin 16.0% 10.2% 3.3%
Capital expenditure 17.3 35.0 32.9
Capital employed, end of period 483.3 464.4 452.5 Capital employed, average 462.9 473.8 458.5 Return on Capital Employed (ROCE) 16.3% 14.0% 0.2%
Workforce, end of period 6,571 6,198 5,140 of which associates * 4,969 4,550 3,540
* Ganzhou Yi Hao Umicore Industries Co. Ltd., Jiangmen Chancsun Umicore Industry Co. Ltd., Todini and Co., (all Cobalt & Specialty Materials); Element Six Abrasives
Overview and Outlook
The Advanced Materials business generated a small positive EBIT while revenues were down 25 % on last year’s first half. A better year-on-year performance in Electro-Optic Materials, based on a stronger underlying business, could only partially offset the negative revenue and EBIT developments in the Cobalt & Specialty Materials and Element Six Abrasives businesses.
The second half of the year is expected to show some recovery in Rechargeable Batteries compared to the first half, although sales should remain well below the levels of 2008. In other activities that continue to be affected by the economic downturn, such as tooling applications, implemented and planned restructuring measures will further reduce the cost base.
Cobalt & Specialty Materials
The decline in the portable electronics market had a major impact on battery demand. Consequently sales of Li-ion cathode materials were down significantly year-on-year. In the first quarter customer de-stocking exacerbated the effect of lower demand from end-users. This destocking effect had largely run its course by the end of the second quarter. The capability expansion for new materials in the Korean and Chinese plants is now operational and is successfully being homologated by customers. With its extended product portfolio, including the lower cobalt containing NMC cathode materials, Umicore is tapping an extended customer base with increased focus on Li-ion batteries used in power applications.
The weak activity levels in the construction and automotive industries have caused a severe dip in cobalt powder sales volumes for hard metals and diamond tools. Continued de-stocking at customers has amplified the impact on sales. The business line has taken a number of measures in order to adjust its production configuration to reduced market demand.
7 August 2009 – 07:30 CET CP-2009-26-R 5/33
The ceramics and chemicals product activities proved more resilient. While sales volumes of nickel compounds were slightly lower than in the prior year, as a result of lower demand in automotive applications, volumes of cobalt-containing products were stable. For example, cobalt precursors, used in hydro-desulphurisation catalysts, sold well as the oil refining industry intensified maintenance replacements on its installations in the first half year. It was decided to cease production of cobalt salts in Maxton, North Carolina, and consolidate this activity with that of other plants in the US, Belgium and China.
Refining and recycling throughput of cobalt fell by some 50 % following the weaker offer of scraps and raw materials, reflecting lower metal prices and lower industrial activity. The rechargeable battery recycling operations attracted some 17 % higher volumes of spent batteries year-on-year. Efforts to promote the new technology with the world’s major automotive producers are being intensified.
Electro-Optic Materials
Electro-Optic Materials continued to perform well throughout the period.
Sales volumes of germanium semiconductor substrates grew, mainly as a result of rising use of ultra high-brightness LEDs in applications such as backlighting of LCD screens and vehicle head and tail lights. Demand for space solar cells from the satellite industry remained stable.
Sales of germanium blanks used mainly in night vision systems grew further. Sales of GASIR® were subdued, reflecting low demand for automotive applications. Sales of germanium tetrachloride for optical fibres fell in line with reduced demand for fibre optic networks.
Thin Film Products
Capacity utilisation in the micro-electronics industry decreased substantially as customers depleted their inventories. As a result, revenues in this market segment were significantly down. The situation appears to have stabilized towards the end of the period. Sales of materials for optical applications were somewhat more resilient.
In large area coatings, revenues were up as a result of increased sales of ITO targets. The interest in Umicore’s rotary ITO targets continues to grow, mainly for glass coating and thin-film photovoltaics uses.
Element Six Abrasives
Sales of abrasive products for oil and drilling applications were down significantly year-on-year. Oil drilling activity began declining from late 2008, and drill-bit suppliers started to de-stock from the middle of the first quarter of 2009. Some signs of recovery appeared towards the end of June, however.
In other markets, particularly construction and automotive, de-stocking by customers started earlier and has not yet come to an end. Sales of abrasive products to these industries remain at low levels.
The cemented carbide abrasives activity, primarily used in the mining and road construction areas, has also faced reduced demand, though not to the same extent, as its end markets have seen more sustained activity levels.
A far-reaching restructuring programme in the Element Six Abrasives activities is on-going, resulting in reduction of manufacturing capacity and workforce, while also reducing working capital. In this respect, Element Six Abrasives announced after the June closing its intention to cease production in Shannon, Ireland, which would affect 370 positions, while maintaining R&D and Group support activities at the site. Alternative ways to make the site more cost-competitive are also being explored.
7 August 2009 – 07:30 CET CP-2009-26-R 6/33
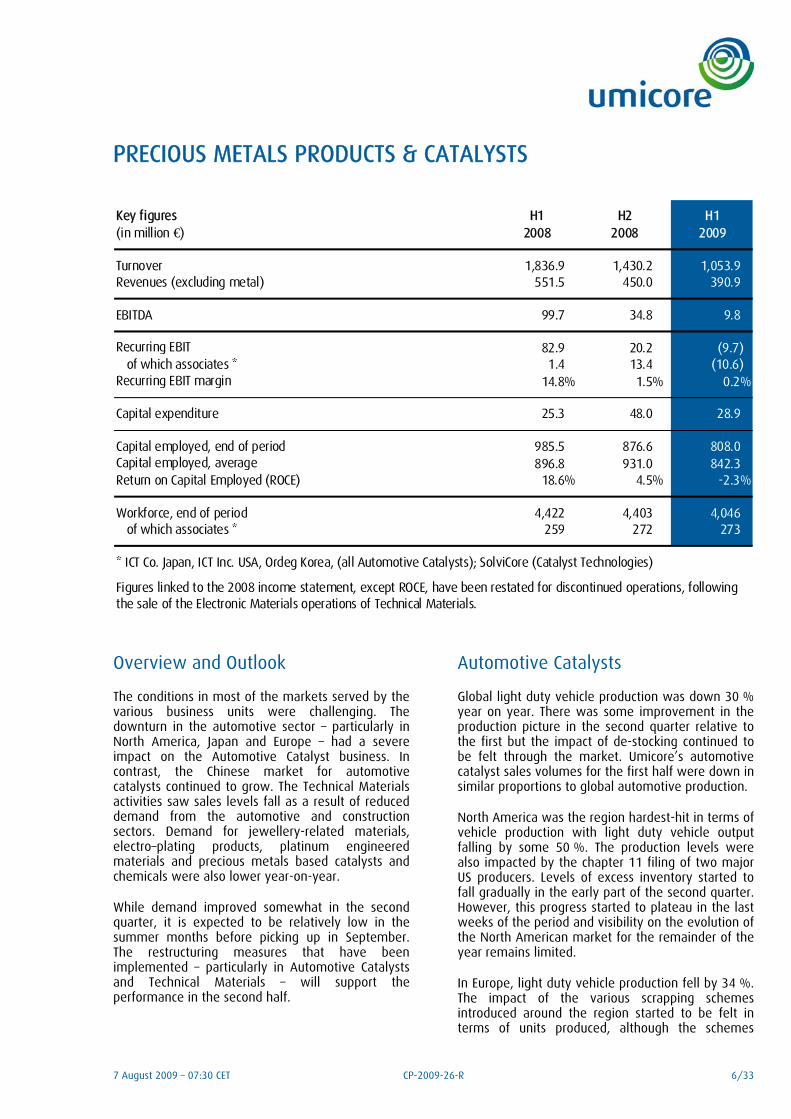
PRECIOUS METALS PRODUCTS & CATALYSTS
Key figures H1 H2 H1(in million €) 2008 2008 2009
Turnover 1,836.9 1,430.2 1,053.9 Revenues (excluding metal) 551.5 450.0 390.9
EBITDA 99.7 34.8 9.8
Recurring EBIT 82.9 20.2 (9.7) of which associates * 1.4 13.4 (10.6)
Recurring EBIT margin 14.8% 1.5% 0.2%
Capital expenditure 25.3 48.0 28.9
Capital employed, end of period 985.5 876.6 808.0 Capital employed, average 896.8 931.0 842.3 Return on Capital Employed (ROCE) 18.6% 4.5% -2.3%
Workforce, end of period 4,422 4,403 4,046 of which associates * 259 272 273
* ICT Co. Japan, ICT Inc. USA, Ordeg Korea, (all Automotive Catalysts); SolviCore (Catalyst Technologies)
Figures linked to the 2008 income statement, except ROCE, have been restated for discontinued operations, following the sale of the Electronic Materials operations of Technical Materials.
Overview and Outlook
The conditions in most of the markets served by the various business units were challenging. The downturn in the automotive sector – particularly in North America, Japan and Europe – had a severe impact on the Automotive Catalyst business. In contrast, the Chinese market for automotive catalysts continued to grow. The Technical Materials activities saw sales levels fall as a result of reduced demand from the automotive and construction sectors. Demand for jewellery-related materials, electro–plating products, platinum engineered materials and precious metals based catalysts and chemicals were also lower year-on-year.
While demand improved somewhat in the second quarter, it is expected to be relatively low in the summer months before picking up in September. The restructuring measures that have been implemented – particularly in Automotive Catalysts and Technical Materials – will support the performance in the second half.
Automotive Catalysts
Global light duty vehicle production was down 30 % year on year. There was some improvement in the production picture in the second quarter relative to the first but the impact of de-stocking continued to be felt through the market. Umicore’s automotive catalyst sales volumes for the first half were down in similar proportions to global automotive production.
North America was the region hardest-hit in terms of vehicle production with light duty vehicle output falling by some 50 %. The production levels were also impacted by the chapter 11 filing of two major US producers. Levels of excess inventory started to fall gradually in the early part of the second quarter. However, this progress started to plateau in the last weeks of the period and visibility on the evolution of the North American market for the remainder of the year remains limited.
In Europe, light duty vehicle production fell by 34 %. The impact of the various scrapping schemes introduced around the region started to be felt in terms of units produced, although the schemes
7 August 2009 – 07:30 CET CP-2009-26-R 7/33
stimulated production primarily of small, gasoline-powered cars in the A and B categories.
In Asia, production of light duty vehicles was down overall, with production in Japan and South Korea falling by 40 %. This affected the performance of Umicore’s local associate operations. In contrast, production in China grew by 11 %.
Against this challenging backdrop, Umicore has implemented measures to adjust its production infrastructure and further enhance the efficiency of its operations. The production footprint in Europe, North America and South Africa has been adjusted in function of market developments. The testing configuration has also been adapted to maximize the use of in-house capabilities.
Although overall investment levels will be somewhat lower year-on-year, the long-term capability improvement investments remain on course. As an example, the further investments in the testing and R&D capabilities were finalised in Germany and work is on-going to set up a plant in India.
Catalyst Technologies
The downturn in the automotive sector meant that sales of PGM salts for the production of automotive catalysts were heavily affected. Sales in the other product categories were not impacted to the same extent and the Japanese market showed the first signs of a recovery later in the semester. Sales of materials for life science applications grew well and the ramp-up of API production in Pilar, Argentina, continues.
In Fuel Cells, the levels of public funding for the SolviCore joint-venture increased and revenue levels continued to grow steadily.
Platinum Engineered Materials
In the area of glass industry applications, sales volumes of equipment used in the production of high purity glass recovered in the second quarter. Inventories in the supply chain have been almost cleared with some manufacturers reporting a shortage of glass. Sales volumes of LCD monitors and televisions continue to grow and several glass manufacturers have moved from idling to almost full production capacity utilization. Sales of equipment for the production of optical, technical and fibre glass remained subdued.
In the area of performance catalysts, sales levels were stable compared to the first quarter. The tight credit market continues to hamper customers in Eastern Europe while the summer months are typically slower in the agrochemical sector.
Technical Materials
In Contact Materials, sales of products were down significantly year-on-year, with Europe being the most affected. There were some signs of stabilization in the last weeks of the semester as major customers in the automotive, electrical and industrial equipment industries started re-ordering following a period of de-stocking.
In Brazetec, sales of brazing alloys sales were also down with products used by customers in the automotive industry being the hardest hit. Customer inventory levels reached more normalized levels towards the end of the period. As part of a strategic review of the Chinese operations it was decided to move and integrate the production of silver brazing products from Yangzhong to the existing Technical Materials site in Suzhou.
The smaller Power Technology Materials activity performed steadily. The application areas for these products include energy saving lighting, medium and high voltage electrics which have seen little impact from the economic downturn.
7 August 2009 – 07:30 CET CP-2009-26-R 8/33
Jewellery & Electroplating
In Jewellery and Industrial Metals, sales of gold semi-finished products were much lower year-on-year. Global sales by the manufacturers of luxury, high-quality, branded jewellery products fell sharply in the first quarter and did not show any signs of recovery thereafter. In contrast, sales of silver products were up year-on-year. This was due to increased demand for silver coinage for investment purposes, particularly in Germany and other parts of Europe. The new facility in Guangzhou, China, is set to be opened late in the third quarter. The product qualification process and the marketing effort for the recycling services are well underway.
In Electroplating, sales of products for electrical, electronic and decorative applications were well below those of the previous year. Towards the end of the period there were signs of some improvement in demand in Asia. Conditions in the Asian electronics market have picked up somewhat and the lower price of rhodium compared to 2008 has encouraged more of its use, particularly for decorative applications such as plating white gold jewellery.
.
7 August 2009 – 07:30 CET CP-2009-26-R 9/33
PRECIOUS METALS SERVICES
Key figures H1 H2 H1(in million €) 2008 2008 2009
Turnover 2,118.9 2,026.4 1,829.6 Revenues (excluding metal) 207.4 212.7 182.7
EBITDA 106.0 112.2 77.0
Recurring EBIT 86.0 97.8 60.9 Recurring EBIT margin 41.4% 46.0% 33.3%
Capital expenditure 32.9 28.0 27.5
Capital employed, end of period 247.5 221.1 168.0 Capital employed, average 224.6 234.3 194.6 Return on Capital Employed (ROCE) 76.5% 83.5% 62.6%
Workforce, end of period 1,497 1,514 1,467
Overview and outlook
The business continued to generate very strong returns although the current supply environment and lower metals prices meant that the performance of the refining operations was lower than the exceptional levels of 2008. Trading conditions on the metal markets were more in line with historical patterns compared to the extraordinary volatility and price swings seen the previous year, thereby leading to a reduced contribution from the Precious Metals Management activity.
Supply conditions for the refining operations are set to worsen in the second half. Prices of specialty metals and by-products are anticipated to remain low which also impacts the comparison to last year’s performance.
Precious Metals Refining
The refining operations continued to produce strong results. As anticipated, arrivals of secondary materials are slowing down as a result of production cuts in the non-ferrous metals refining sector. This slowdown will have a more pronounced impact on the operations in the second half of the year. Input of end-of-life materials also fell back, particularly for supplies of spent automotive catalysts. Arrivals of electronic and electrical scrap as well as spent industrial catalysts were stable.
Prices of precious metals were significantly lower year-on-year. The protection afforded by those contracts which were secured at much higher price levels will gradually reduce during the second half of 2009 and 2010. Prices of specialty metals such as ruthenium, selenium, nickel and indium were also much lower compared with the same period last year.
Revenues generated by by-products were significantly lower year-on-year. The price of sulphuric acid has fallen drastically and in some instances it has been necessary to accept negative premiums.
7 August 2009 – 07:30 CET CP-2009-26-R 10/33
Strenuous efforts were made to further reduce working capital during the period.
In July, Umicore Precious Metals Refining was nominated as a finalist for the EFQM Excellence Award 2009, Europe‘s most prestigious award for organisational excellence.
Precious Metals Management
The Precious Metals Management activities experienced a less beneficial business environment than the extraordinary conditions seen a year ago. Price levels, price volatility and lease rates were all lower than the same period in 2008. Physical metal sales were negatively impacted by lower industrial demand and customer de-stocking. This was somewhat offset by increased sales of gold as investors continued to turn to gold ingots as a “safe haven”.
7 August 2009 – 07:30 CET CP-2009-26-R 11/33
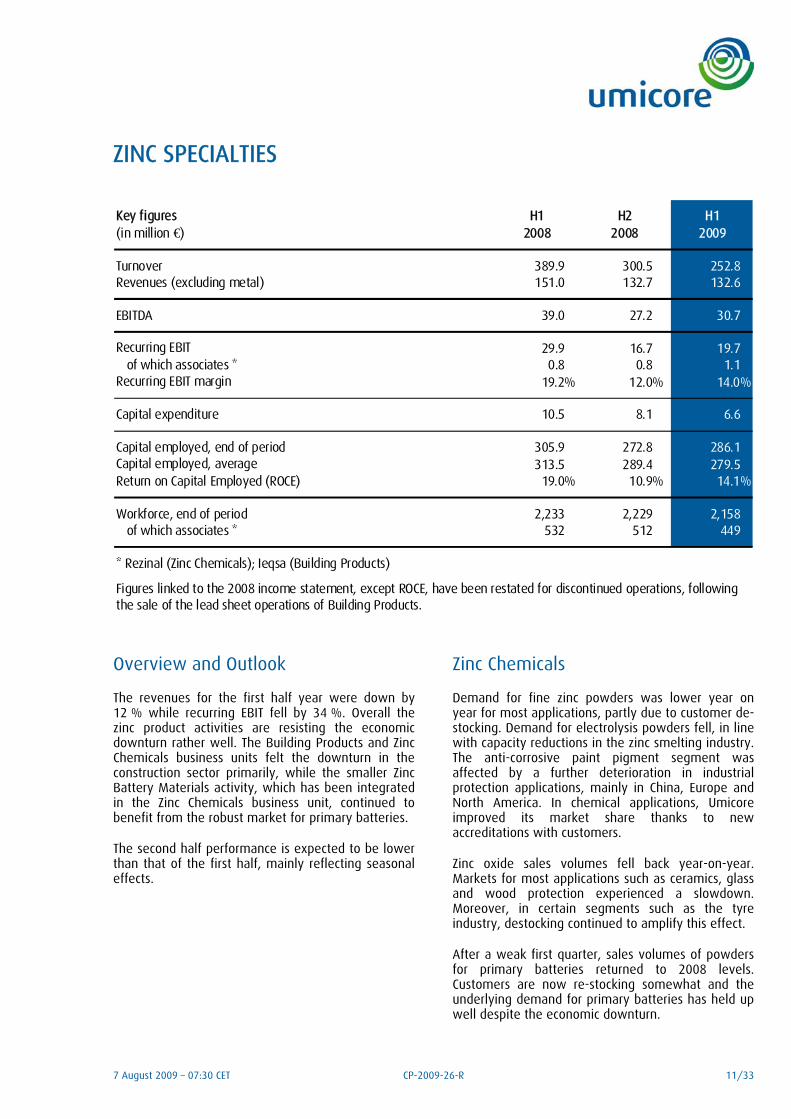
ZINC SPECIALTIES
Key figures H1 H2 H1(in million €) 2008 2008 2009
Turnover 389.9 300.5 252.8 Revenues (excluding metal) 151.0 132.7 132.6
EBITDA 39.0 27.2 30.7
Recurring EBIT 29.9 16.7 19.7 of which associates * 0.8 0.8 1.1
Recurring EBIT margin 19.2% 12.0% 14.0%
Capital expenditure 10.5 8.1 6.6
Capital employed, end of period 305.9 272.8 286.1 Capital employed, average 313.5 289.4 279.5 Return on Capital Employed (ROCE) 19.0% 10.9% 14.1%
Workforce, end of period 2,233 2,229 2,158 of which associates * 532 512 449
* Rezinal (Zinc Chemicals); Ieqsa (Building Products)
Figures linked to the 2008 income statement, except ROCE, have been restated for discontinued operations, following the sale of the lead sheet operations of Building Products.
Overview and Outlook
The revenues for the first half year were down by 12 % while recurring EBIT fell by 34 %. Overall the zinc product activities are resisting the economic downturn rather well. The Building Products and Zinc Chemicals business units felt the downturn in the construction sector primarily, while the smaller Zinc Battery Materials activity, which has been integrated in the Zinc Chemicals business unit, continued to benefit from the robust market for primary batteries.
The second half performance is expected to be lower than that of the first half, mainly reflecting seasonal effects.
Zinc Chemicals
Demand for fine zinc powders was lower year on year for most applications, partly due to customer de-stocking. Demand for electrolysis powders fell, in line with capacity reductions in the zinc smelting industry. The anti-corrosive paint pigment segment was affected by a further deterioration in industrial protection applications, mainly in China, Europe and North America. In chemical applications, Umicore improved its market share thanks to new accreditations with customers.
Zinc oxide sales volumes fell back year-on-year. Markets for most applications such as ceramics, glass and wood protection experienced a slowdown. Moreover, in certain segments such as the tyre industry, destocking continued to amplify this effect.
After a weak first quarter, sales volumes of powders for primary batteries returned to 2008 levels. Customers are now re-stocking somewhat and the underlying demand for primary batteries has held up well despite the economic downturn.
7 August 2009 – 07:30 CET CP-2009-26-R 12/33
The zinc recycling operations performed well despite the reduced availability of certain secondary materials and benefited from margins that were secured in previous periods.
Building Products
Despite the slowdown in the European building sector, use of zinc in construction showed some resilience. The slow start to the season, after an exceptionally cold winter, was partially offset by a better second quarter. Umicore’s exposure to the new build residential market is limited. Its activity levels were
supported by solid demand from the renovation and non-residential segments in France and Benelux in particular.
Higher value-added advanced products, such as pre-weathered zinc sheet elements (QUARTZ-ZINC®, ANTHRA-ZINC® and PIGMENTO®), continue to grow their share in the business unit’s revenues and were the spearhead for increased sales in the newly developed North American and Asian markets. There has been an increase in the use of these zinc cladding elements to protect insulation applied on outer walls in energy efficiency renovation projects.
7 August 2009 – 07:30 CET CP-2009-26-R 13/33
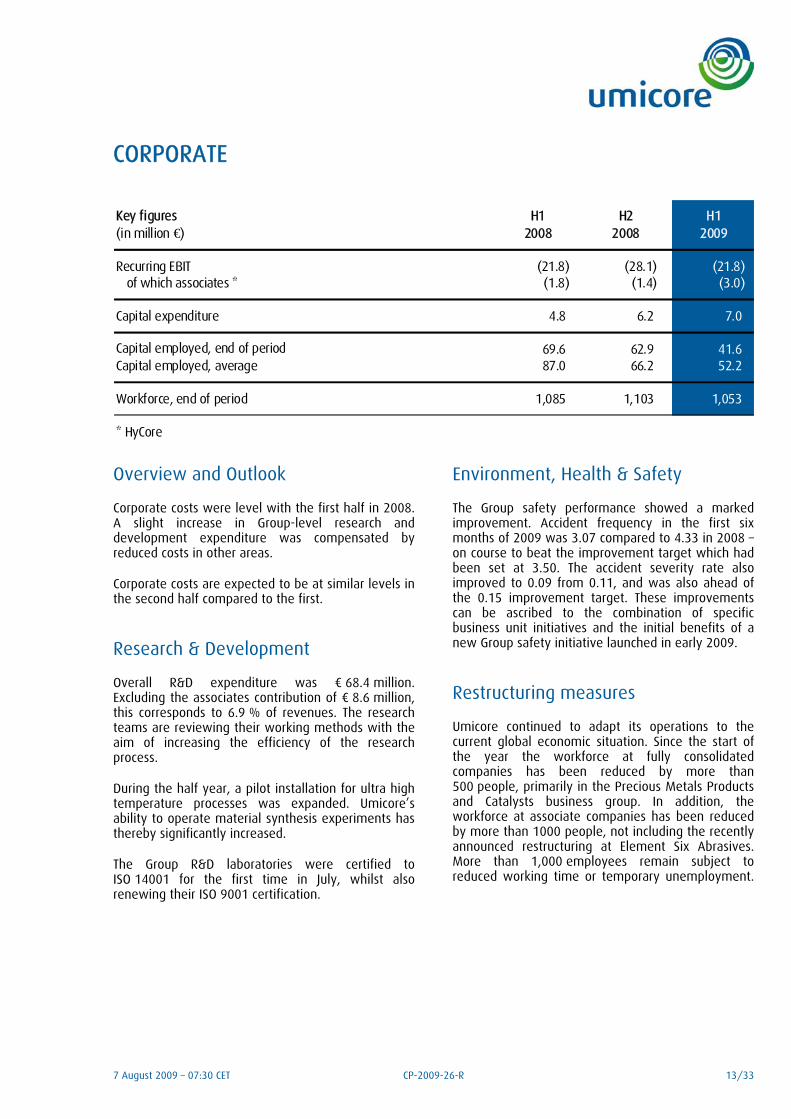
CORPORATE
Key figures H1 H2 H1(in million €) 2008 2008 2009
Recurring EBIT (21.8) (28.1) (21.8) of which associates * (1.8) (1.4) (3.0)
Capital expenditure 4.8 6.2 7.0
Capital employed, end of period 69.6 62.9 41.6 Capital employed, average 87.0 66.2 52.2
Workforce, end of period 1,085 1,103 1,053
* HyCore
Overview and Outlook
Corporate costs were level with the first half in 2008. A slight increase in Group-level research and development expenditure was compensated by reduced costs in other areas.
Corporate costs are expected to be at similar levels in the second half compared to the first.
Research & Development
Overall R&D expenditure was ¤ 68.4 million. Excluding the associates contribution of ¤ 8.6 million, this corresponds to 6.9 % of revenues. The research teams are reviewing their working methods with the aim of increasing the efficiency of the research process.
During the half year, a pilot installation for ultra high temperature processes was expanded. Umicore’s ability to operate material synthesis experiments has thereby significantly increased.
The Group R&D laboratories were certified to ISO 14001 for the first time in July, whilst also renewing their ISO 9001 certification.
Environment, Health & Safety
The Group safety performance showed a marked improvement. Accident frequency in the first six months of 2009 was 3.07 compared to 4.33 in 2008 – on course to beat the improvement target which had been set at 3.50. The accident severity rate also improved to 0.09 from 0.11, and was also ahead of the 0.15 improvement target. These improvements can be ascribed to the combination of specific business unit initiatives and the initial benefits of a new Group safety initiative launched in early 2009.
Restructuring measures
Umicore continued to adapt its operations to the current global economic situation. Since the start of the year the workforce at fully consolidated companies has been reduced by more than 500 people, primarily in the Precious Metals Products and Catalysts business group. In addition, the workforce at associate companies has been reduced by more than 1000 people, not including the recently announced restructuring at Element Six Abrasives. More than 1,000 employees remain subject to reduced working time or temporary unemployment.
7 August 2009 – 07:30 CET CP-2009-26-R 14/33
FINANCIAL REVIEW
Non-recurring items
Non-recurring EBIT stood at ¤ -6.0 million, impacting the Group share’s net result by ¤ -5.2 million. Restructuring costs and provisions in Automotive Catalysts, Technical Materials and Advanced Materials amounted to ¤ 18.5 million. Reversal of metal impairments on permanent metal inventories totalled ¤ 11.7 million, mainly related to zinc inventories.
IAS 39
IAS 39 accounting rules had a positive effect on EBIT of ¤ 4.6 million. The impact concerns timing differences imposed by IFRS that relate primarily to transactional and structural metal and currency hedges. All IAS 39 impacts are non-cash in nature.
Discontinued operations
In the course of the period Umicore sold its lead sheet operations in Overpelt, Belgium, and the Electronic Materials activities. The Group also disposed of its stake in Duksan Hi Metal Co. Ltd in South Korea. The combined proceeds of these transactions are ¤ 22.5 million, of which some ¤ 9.5 million have yet to be received.
Discontinued operations had a net negative impact on Umicore’s result of ¤ 3.1 million.
Financial results
Net financial charges for the first half year totalled ¤ 10.3 million. Net interest charges were ¤ 8.0 million, compared with ¤ 13.6 million the previous year, in line with lower average net debt. The average interest rate on net debt stood at 4.08 %, down from 5.83 % in the first half of 2008. Net exchange rate gains amounted to ¤ 5.7 million, including a ¤ 7.0 million gain linked to the IAS 39 impact.
Taxation
The tax charge for the period amounted to ¤ 10.4 million. The recurring tax charge for the period was ¤ 9.8 million, corresponding to an overall recurring effective tax rate of 19.9 %. The reduction in tax rate can be attributed to the geographic spread of earnings generated. A tax charge of ¤ 1.3 million was related to the IAS 39 effect, while the tax impact connected to the non-recurring results reduced the total tax charge by ¤ 0.7 million.
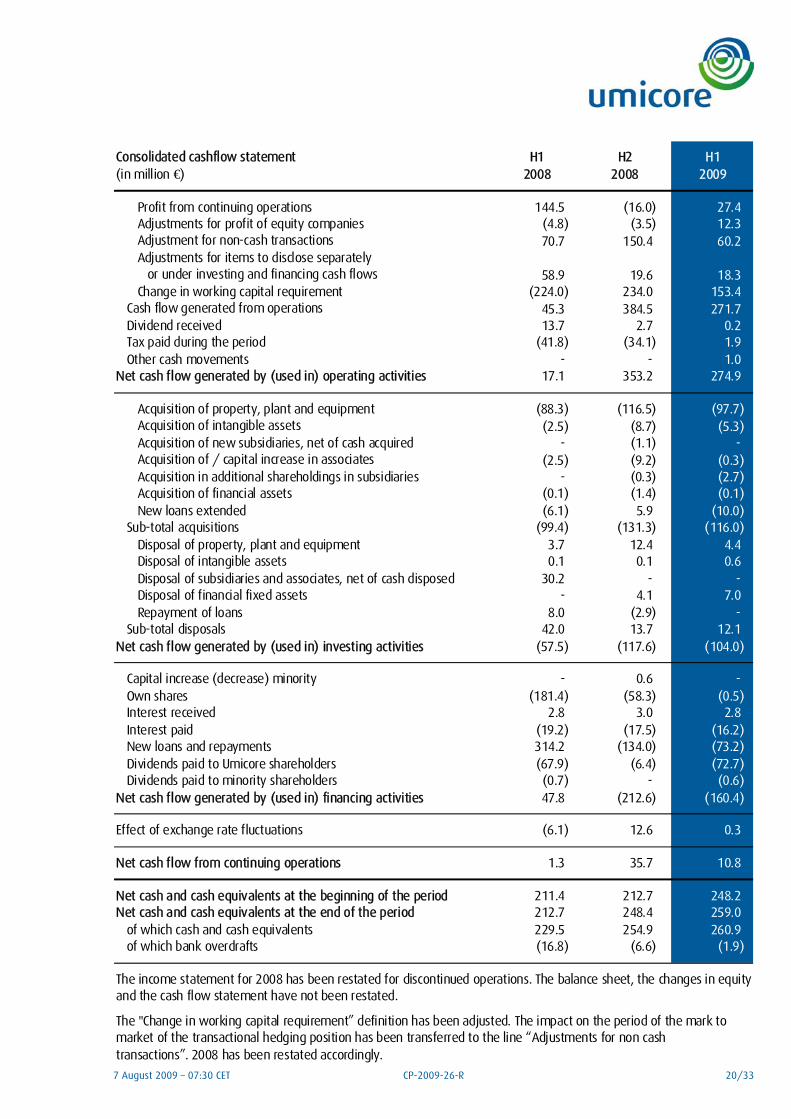
Cashflows
Net cashflow from operations was ¤ 274.9 million, including working capital reductions of ¤ 153.4 million.
Capital expenditures totalled ¤ 102.9 million. The investments in Korea and China for increased rechargeable battery capabilities were finalised, while in the US construction started at the new substrates plant in Quapaw. Further automotive catalyst testing and technology infrastructure was installed in Hanau, Germany, while the precious metals refining site upgrade in Hoboken, Belgium, is nearing completion. The capital expenditures include ¤ 5.2 million of intangibles, consisting of capitalized development costs in new information systems.
Financial debt
At 30 June Umicore’s net financial debt stood at ¤ 239.0 million and total equity at ¤ 1,307.9 million, leading to a gearing ratio of 15.4 %.
Shares
On 6 August Umicore held 7,572,822 of its own shares in treasury (or 6.31 %), down from the previously reported number of 7,657,397 shares, as a result of the exercise of stock options in the period. No share buybacks took place in the period.
7 August 2009 – 07:30 CET CP-2009-26-R 15/33
CONDENSED CONSOLIDATED INTERIM FINANCIAL INFORMATION OF 2009
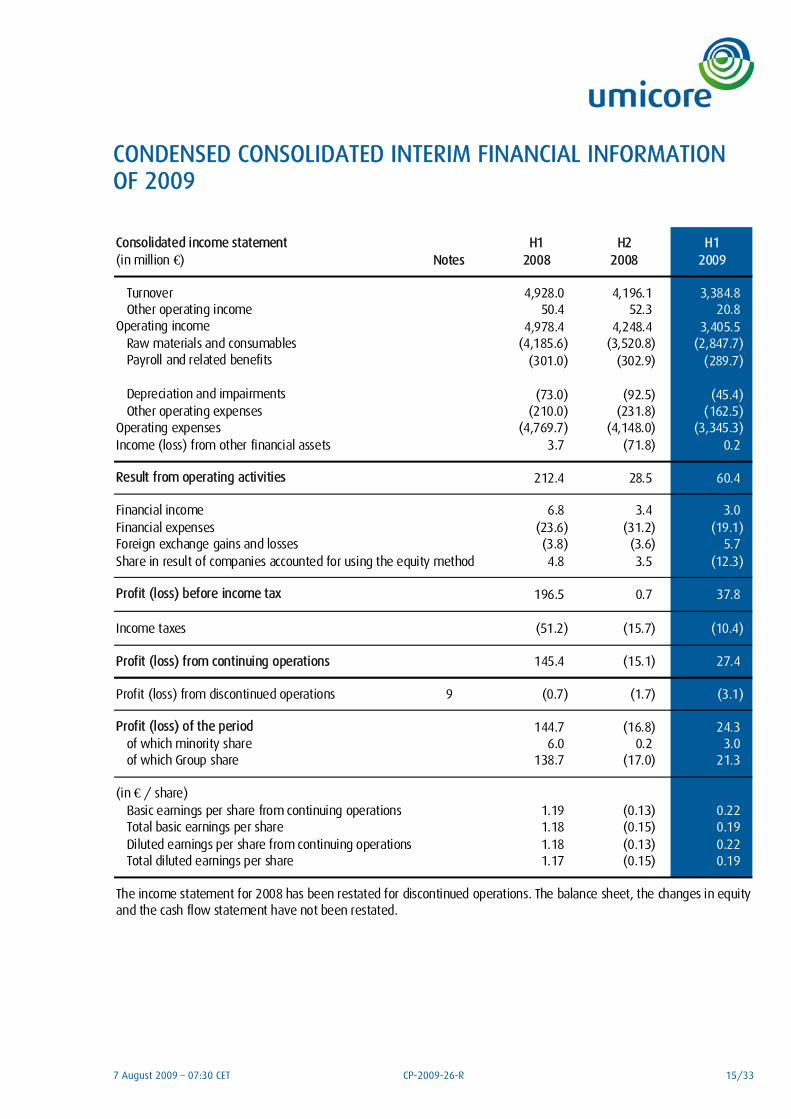
Consolidated income statement H1 H2 H1(in million €) Notes 2008 2008 2009
Turnover 4,928.0 4,196.1 3,384.8 Other operating income 50.4 52.3 20.8
Operating income 4,978.4 4,248.4 3,405.5 Raw materials and consumables (4,185.6) (3,520.8) (2,847.7) Payroll and related benefits (301.0) (302.9) (289.7)
Depreciation and impairments (73.0) (92.5) (45.4) Other operating expenses (210.0) (231.8) (162.5)
Operating expenses (4,769.7) (4,148.0) (3,345.3) Income (loss) from other financial assets 3.7 (71.8) 0.2
Result from operating activities 212.4 28.5 60.4
Financial income 6.8 3.4 3.0 Financial expenses (23.6) (31.2) (19.1) Foreign exchange gains and losses (3.8) (3.6) 5.7
4.8 3.5 (12.3)
Profit (loss) before income tax 196.5 0.7 37.8
Income taxes (51.2) (15.7) (10.4)
Profit (loss) from continuing operations 145.4 (15.1) 27.4
Profit (loss) from discontinued operations 9 (0.7) (1.7) (3.1)
Profit (loss) of the period 144.7 (16.8) 24.3 of which minority share 6.0 0.2 3.0 of which Group share 138.7 (17.0) 21.3
(in € / share)1.19 (0.13) 0.22
Total basic earnings per share 1.18 (0.15) 0.19 1.18 (0.13) 0.22
Total diluted earnings per share 1.17 (0.15) 0.19
Share in result of companies accounted for using the equity method
Basic earnings per share from continuing operations
Diluted earnings per share from continuing operations
The income statement for 2008 has been restated for discontinued operations. The balance sheet, the changes in equity and the cash flow statement have not been restated.
7 August 2009 – 07:30 CET CP-2009-26-R 16/33
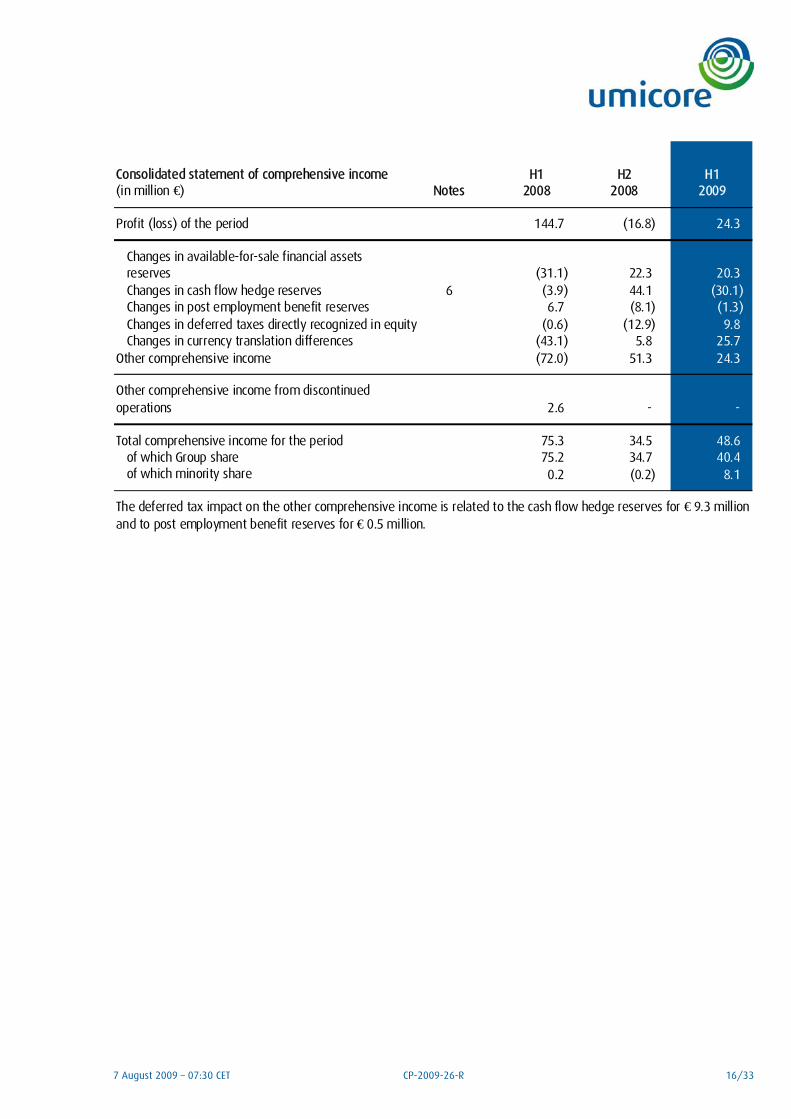
Consolidated statement of comprehensive income H1 H2 H1(in million €) Notes 2008 2008 2009
Profit (loss) of the period 144.7 (16.8) 24.3
Changes in available-for-sale financial assets reserves (31.1) 22.3 20.3 Changes in cash flow hedge reserves 6 (3.9) 44.1 (30.1) Changes in post employment benefit reserves 6.7 (8.1) (1.3)
(0.6) (12.9) 9.8 Changes in currency translation differences (43.1) 5.8 25.7
Other comprehensive income (72.0) 51.3 24.3
Other comprehensive income from discontinued operations 2.6 - -
Total comprehensive income for the period 75.3 34.5 48.6 of which Group share 75.2 34.7 40.4 of which minority share 0.2 (0.2) 8.1
Changes in deferred taxes directly recognized in equity
The deferred tax impact on the other comprehensive income is related to the cash flow hedge reserves for € 9.3 million and to post employment benefit reserves for € 0.5 million.
7 August 2009 – 07:30 CET CP-2009-26-R 17/33
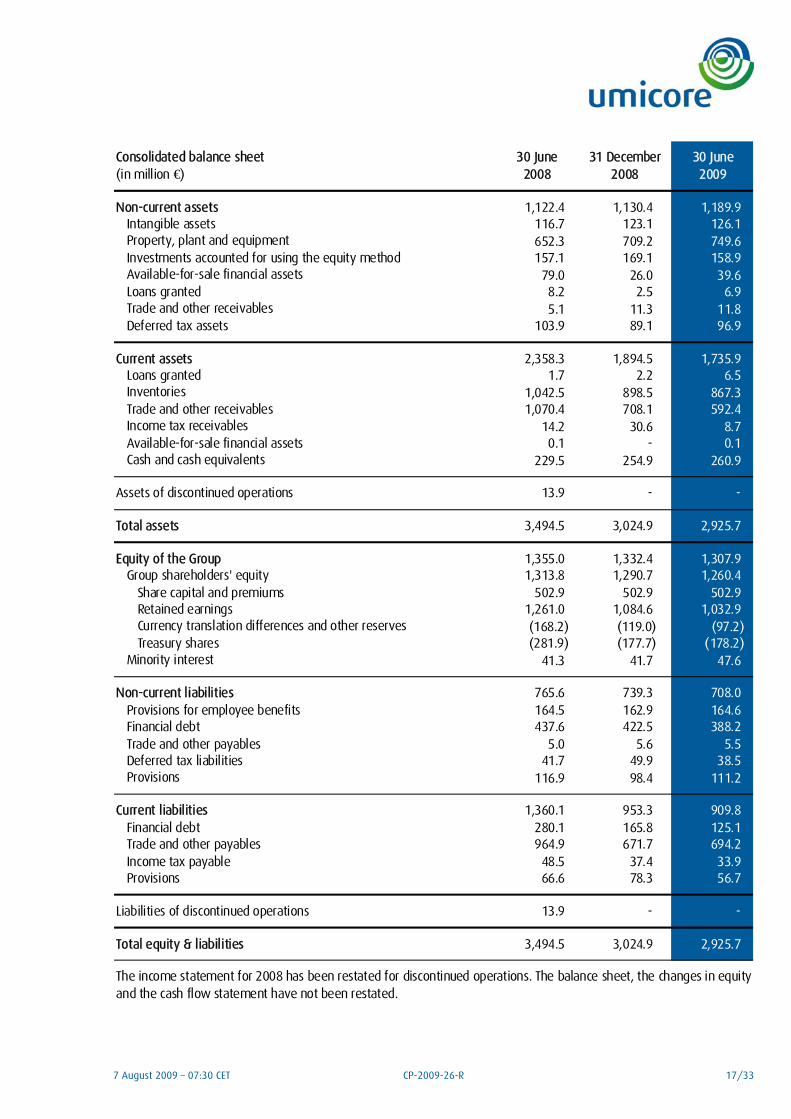
Consolidated balance sheet 30 June 30 June(in million €) 2008 2008 2009
Non-current assets 1,122.4 1,130.4 1,189.9 Intangible assets 116.7 123.1 126.1 Property, plant and equipment 652.3 709.2 749.6 Investments accounted for using the equity method 157.1 169.1 158.9 Available-for-sale financial assets 79.0 26.0 39.6 Loans granted 8.2 2.5 6.9 Trade and other receivables 5.1 11.3 11.8 Deferred tax assets 103.9 89.1 96.9
Current assets 2,358.3 1,894.5 1,735.9 Loans granted 1.7 2.2 6.5 Inventories 1,042.5 898.5 867.3 Trade and other receivables 1,070.4 708.1 592.4 Income tax receivables 14.2 30.6 8.7 Available-for-sale financial assets 0.1 - 0.1 Cash and cash equivalents 229.5 254.9 260.9
Assets of discontinued operations 13.9 - -
Total assets 3,494.5 3,024.9 2,925.7
Equity of the Group 1,355.0 1,332.4 1,307.9 Group shareholders' equity 1,313.8 1,290.7 1,260.4
Share capital and premiums 502.9 502.9 502.9 Retained earnings 1,261.0 1,084.6 1,032.9 Currency translation differences and other reserves (168.2) (119.0) (97.2) Treasury shares (281.9) (177.7) (178.2)
Minority interest 41.3 41.7 47.6
Non-current liabilities 765.6 739.3 708.0 Provisions for employee benefits 164.5 162.9 164.6 Financial debt 437.6 422.5 388.2 Trade and other payables 5.0 5.6 5.5 Deferred tax liabilities 41.7 49.9 38.5 Provisions 116.9 98.4 111.2
Current liabilities 1,360.1 953.3 909.8 Financial debt 280.1 165.8 125.1 Trade and other payables 964.9 671.7 694.2 Income tax payable 48.5 37.4 33.9 Provisions 66.6 78.3 56.7
Liabilities of discontinued operations 13.9 - -
Total equity & liabilities 3,494.5 3,024.9 2,925.7
31 December
The income statement for 2008 has been restated for discontinued operations. The balance sheet, the changes in equity and the cash flow statement have not been restated.
7 August 2009 – 07:30 CET CP-2009-26-R 18/33
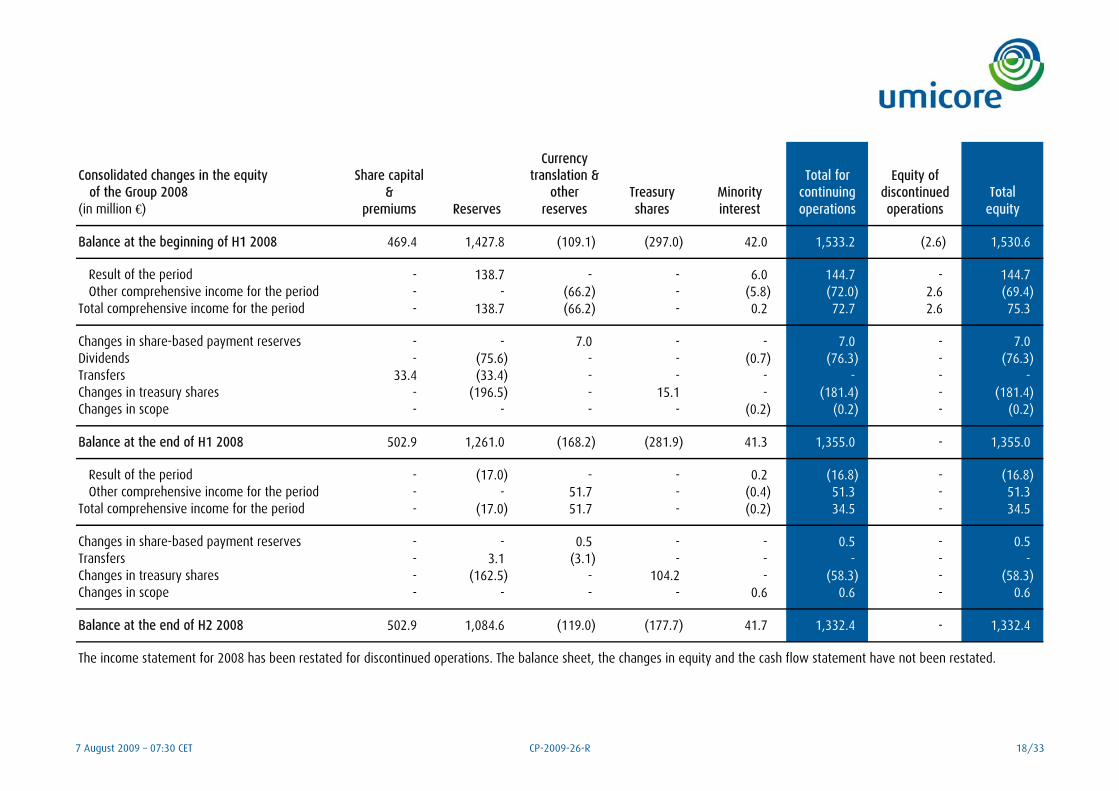
Consolidated changes in the equity of the Group 2008
Share capital &
Currency translation &
other Treasury MinorityTotal for
continuing Total(in million €) premiums Reserves reserves shares interest operations operations equity
Balance at the beginning of H1 2008 469.4 1,427.8 (109.1) (297.0) 42.0 1,533.2 (2.6) 1,530.6
Result of the period - 138.7 - - 6.0 144.7 - 144.7 Other comprehensive income for the period - - (66.2) - (5.8) (72.0) 2.6 (69.4)
Total comprehensive income for the period - 138.7 (66.2) - 0.2 72.7 2.6 75.3
Changes in share-based payment reserves - - 7.0 - - 7.0 - 7.0 Dividends - (75.6) - - (0.7) (76.3) - (76.3) Transfers 33.4 (33.4) - - - - - - Changes in treasury shares - (196.5) - 15.1 - (181.4) - (181.4) Changes in scope - - - - (0.2) (0.2) - (0.2)
Balance at the end of H1 2008 502.9 1,261.0 (168.2) (281.9) 41.3 1,355.0 - 1,355.0
Result of the period - (17.0) - - 0.2 (16.8) - (16.8) Other comprehensive income for the period - - 51.7 - (0.4) 51.3 - 51.3
Total comprehensive income for the period - (17.0) 51.7 - (0.2) 34.5 - 34.5
Changes in share-based payment reserves - - 0.5 - - 0.5 - 0.5 Transfers - 3.1 (3.1) - - - - - Changes in treasury shares - (162.5) - 104.2 - (58.3) - (58.3) Changes in scope - - - - 0.6 0.6 - 0.6
Balance at the end of H2 2008 502.9 1,084.6 (119.0) (177.7) 41.7 1,332.4 - 1,332.4
Equity of discontinued
The income statement for 2008 has been restated for discontinued operations. The balance sheet, the changes in equity and the cash flow statement have not been restated.

7 August 2009 – 07:30 CET CP-2009-26-R 19/33
Consolidated changes in the equity of the Group 2009
Share capital &
Currency translation &
other Treasury MinorityTotal for
continuing Total(in million €) premiums Reserves reserves shares interest operations operations equity
Balance at the beginning of H1 2009 502.9 1,084.6 (119.0) (177.7) 41.7 1,332.4 - 1,332.4
Result of the period - 21.3 - - 3.0 24.3 - 24.3 Other comprehensive income for the period - - 19.1 - 5.2 24.3 - 24.3
Total comprehensive income for the period - 21.3 19.1 - 8.1 48.6 - 48.6
Changes in share-based payment reserves - - 2.8 - - 2.8 - 2.8 Dividends - (73.0) - - (0.6) (73.6) - (73.6) Changes in treasury shares - - - (0.5) - (0.5) - (0.5) Changes in scope - - - - (1.7) (1.7) - (1.7)
Balance at the end of H1 2009 502.9 1,032.9 (97.2) (178.2) 47.6 1,307.9 - 1,307.9
Equity of discontinued
7 August 2009 – 07:30 CET CP-2009-26-R 20/33
Consolidated cashflow statement H1 H2 H1(in million €) 2008 2008 2009
Profit from continuing operations 144.5 (16.0) 27.4 Adjustments for profit of equity companies (4.8) (3.5) 12.3 Adjustment for non-cash transactions 70.7 150.4 60.2 Adjustments for items to disclose separately or under investing and financing cash flows 58.9 19.6 18.3 Change in working capital requirement (224.0) 234.0 153.4
Cash flow generated from operations 45.3 384.5 271.7 Dividend received 13.7 2.7 0.2 Tax paid during the period (41.8) (34.1) 1.9 Other cash movements - - 1.0
17.1 353.2 274.9
Acquisition of property, plant and equipment (88.3) (116.5) (97.7) Acquisition of intangible assets (2.5) (8.7) (5.3) Acquisition of new subsidiaries, net of cash acquired - (1.1) - Acquisition of / capital increase in associates (2.5) (9.2) (0.3) Acquisition in additional shareholdings in subsidiaries - (0.3) (2.7) Acquisition of financial assets (0.1) (1.4) (0.1) New loans extended (6.1) 5.9 (10.0)
Sub-total acquisitions (99.4) (131.3) (116.0) Disposal of property, plant and equipment 3.7 12.4 4.4 Disposal of intangible assets 0.1 0.1 0.6 Disposal of subsidiaries and associates, net of cash disposed 30.2 - - Disposal of financial fixed assets - 4.1 7.0 Repayment of loans 8.0 (2.9) -
Sub-total disposals 42.0 13.7 12.1 (57.5) (117.6) (104.0)
Capital increase (decrease) minority - 0.6 - Own shares (181.4) (58.3) (0.5) Interest received 2.8 3.0 2.8 Interest paid (19.2) (17.5) (16.2) New loans and repayments 314.2 (134.0) (73.2) Dividends paid to Umicore shareholders (67.9) (6.4) (72.7) Dividends paid to minority shareholders (0.7) - (0.6)
47.8 (212.6) (160.4)
Effect of exchange rate fluctuations (6.1) 12.6 0.3
1.3 35.7 10.8
211.4 212.7 248.2 212.7 248.4 259.0
of which cash and cash equivalents 229.5 254.9 260.9 of which bank overdrafts (16.8) (6.6) (1.9)
Net cash and cash equivalents at the beginning of the period
Net cash flow generated by (used in) operating activities
Net cash flow from continuing operations
transactions”. 2008 has been restated accordingly.
Net cash and cash equivalents at the end of the period
The income statement for 2008 has been restated for discontinued operations. The balance sheet, the changes in equity and the cash flow statement have not been restated.
The "Change in working capital requirement” definition has been adjusted. The impact on the period of the mark to market of the transactional hedging position has been transferred to the line “Adjustments for non cash
Net cash flow generated by (used in) investing activities
Net cash flow generated by (used in) financing activities
7 August 2009 – 07:30 CET CP-2009-26-R 21/33
NOTES TO THE CONDENSED CONSOLIDATED INTERIM FINANCIAL STATEMENTS OF 2009
Note 1: Basis of preparation
The condensed consolidated interim financial statements for the six months ended 30 June 2009 have been prepared in accordance with IAS 34 Interim Financial Reporting as adopted by the European Union. They do not include all the information required for full annual financial statements and should therefore be read in conjunction with the consolidated financial statements for the year 2008 as published in the 2008 Report to Shareholders and Society. The condensed consolidated interim financial statements were authorised for issue by the Board of Directors held on 6 August 2009. The consolidated 2008 income statement has been restated for discontinued operations. The balance sheet and cash flow statement have not been restated.
Note 2: Changes in accounting policies and presentation rules
Except if described below, the accounting policies adopted in the preparation of the interim consolidated financial statements are consistent with those applied in the preparation of the consolidated financial statement for the year ended 31 December 2008. The following new standards have been adopted and impact the presentation of the condensed consolidated interim financial statements in 2009.
a) IAS 1 (revised), ‘Presentation of Financial Statements’
The Group has elected to present two statements: an income statement and a statement of comprehensive income. The statement of changes in equity presents separately the non-owner and the owner changes in equity.
b) IFRS 8, ‘Operating segments’
IFRS 8 replaces IAS 14, ‘Segment reporting’. The application of IFRS 8 has no impact Umicore’s segment presentation, nor on the 2008 comparative figures. Umicore is organised in business units, which are aggregated by management into a more limited number of operating segments.
Operating segments under IFRS 8 at Umicore are differentiated by their business type and by metal or group of metals in which Umicore’s business units are predominantly active. Businesses at Umicore are refining oriented or transformation oriented. Refining oriented businesses will attract raw materials to produce and sell refined metals. Transformation oriented businesses will start from metals to manufacture products and chemicals for end user applications. The predominant metal groups Umicore businesses are active in are “Precious Metals”, Zinc”, and “Other Metals” such as cobalt and germanium.
Operating segments are reported in a manner consistent with the internal reporting provided to the Board and the Executive Committee. The Executive Committee reviews the performance of the operating segments based on Earnings before Interest and Tax (EBIT), Capital Employed and Return on Capital Employed. Financial and tax results are not allocated to the operating segments. The segment results, assets and liabilities include items directly attributable to the segment as well as those elements that can reasonably be allocated to a segment. The pricing of inter-segment sales is based on an arm's length transfer pricing system. In the absence of relevant market price references, 'cost plus' mechanisms are used.
The Group is organized into the following reporting segments:
• Advanced Materials is a transformation segment, based on “other metals” a.o. cobalt and germanium. It includes the units Cobalt Specialty Materials, Electro-Optic Materials and Thin Film Products. The business group also includes Umicore’s shareholding in Element Six Abrasives.
7 August 2009 – 07:30 CET CP-2009-26-R 22/33
• Precious Metals Products and Catalysts is a transformation segment, based on “precious metals”. It includes the Automotive Catalysts, Jewellery & Electroplating, Catalyst Technologies, Technical Materials, and the Platinum Engineered Materials business units. The activity of the Electronic Materials has been divested in the first half of 2009.
• Precious Metals Services is a refining segment, based on “precious metals”. It includes the Precious Metals Refining and the Precious Metals Management business units.
• Zinc Specialties is a transformation segment based on”zinc”. It includes Zinc Chemicals and Building Products. The rather small Zinc Battery Materials unit has been integrated in Zinc Chemicals since 2009.
• Corporate covers corporate activities as well as some shared services and the central Research, Development & Innovation unit.
This disclosure only refers to continuing operations. Associate companies are allocated to the business group with the closest fit from a market segment perspective.
7 August 2009 – 07:30 CET CP-2009-26-R 23/33
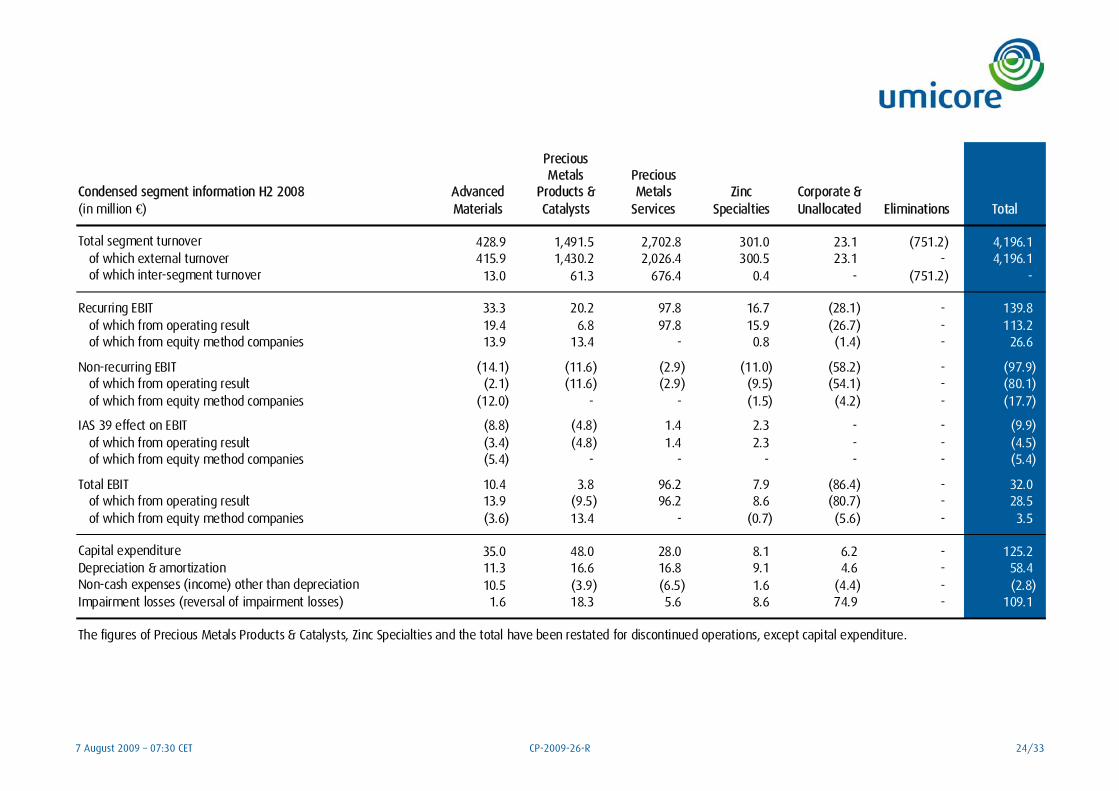
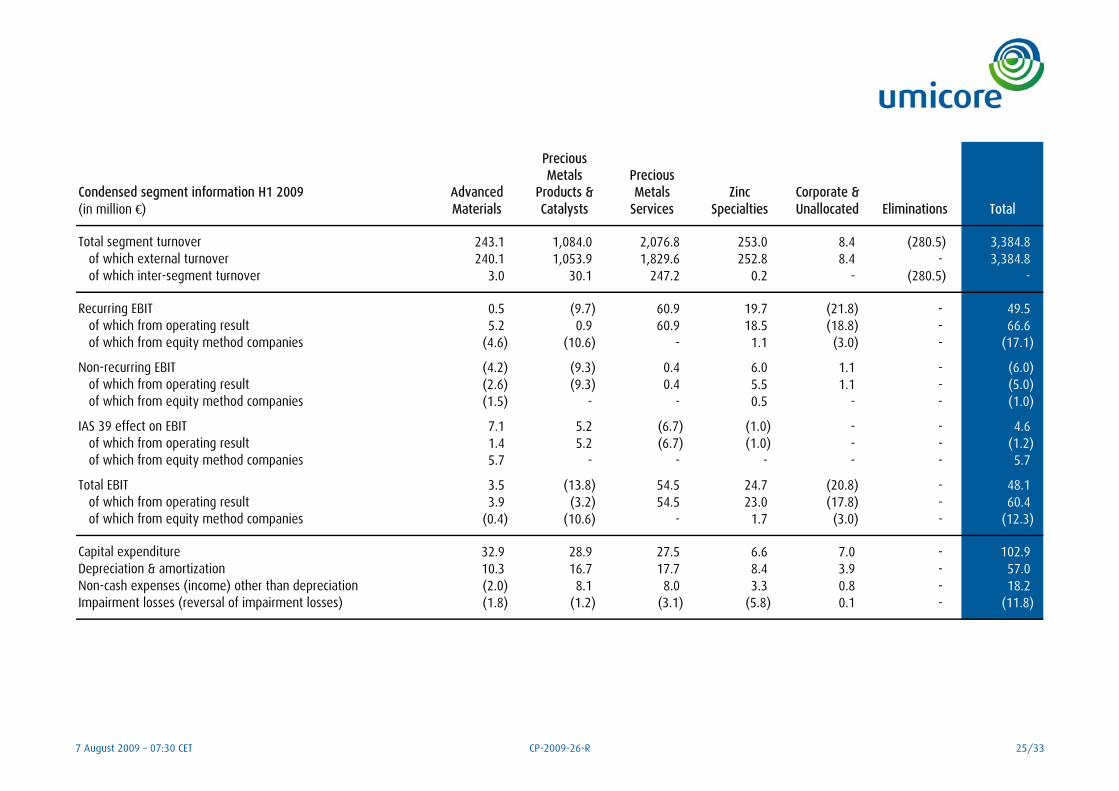
Note 3: Segment information
Condensed segment information H1 2008 Advanced
Precious Metals
Products &Precious Metals Zinc Corporate &
(in million €) Materials Catalysts Services Specialties Unallocated Eliminations Total
Total segment turnover 571.6 1,908.2 2,461.4 390.3 15.2 (418.6) 4,928.0 of which external turnover 567.0 1,836.9 2,118.9 389.9 15.2 - 4,928.0 of which inter-segment turnover 4.5 71.2 342.5 0.3 - (418.6) -
Recurring EBIT 37.8 82.9 86.0 29.9 (21.8) - 214.8 of which from operating result 32.9 81.5 86.0 29.1 (20.0) - 209.4 of which from equity method companies 4.9 1.4 - 0.8 (1.8) - 5.4
Non-recurring EBIT (1.8) (0.3) (0.3) (6.0) 4.4 - (4.0) of which from operating result (1.7) (0.3) (0.3) (6.0) 4.4 - (3.9) of which from equity method companies (0.1) - - - - - (0.1)
IAS 39 effect on EBIT 1.9 3.8 0.1 0.6 - - 6.3 of which from operating result 2.4 3.8 0.1 0.6 - - 6.9 of which from equity method companies (0.5) - - - - - (0.5)
Total EBIT 37.9 86.5 85.8 24.4 (17.4) - 217.1 of which from operating result 33.6 85.1 85.8 23.6 (15.6) - 212.4 of which from equity method companies 4.3 1.4 - 0.8 (1.8) - 4.8
Capital expenditure 17.3 25.3 32.9 10.5 4.8 - 90.7 Depreciation & amortization 11.4 15.1 15.2 8.1 4.4 - 54.3 Non-cash expenses (income) other than depreciation (2.0) (5.7) 2.4 0.4 5.4 - 0.5 Impairment losses (reversal of impairment losses) 5.2 3.8 2.6 6.1 1.1 - 18.7
The figures of Precious Metals Products & Catalysts, Zinc Specialties and the total have been restated for discontinued operations, except capital expenditure.
7 August 2009 – 07:30 CET CP-2009-26-R 24/33
Condensed segment information H2 2008 Advanced
Precious Metals
Products &Precious Metals Zinc Corporate &
(in million €) Materials Catalysts Services Specialties Unallocated Eliminations Total
Total segment turnover 428.9 1,491.5 2,702.8 301.0 23.1 (751.2) 4,196.1 of which external turnover 415.9 1,430.2 2,026.4 300.5 23.1 - 4,196.1 of which inter-segment turnover 13.0 61.3 676.4 0.4 - (751.2) -
Recurring EBIT 33.3 20.2 97.8 16.7 (28.1) - 139.8 of which from operating result 19.4 6.8 97.8 15.9 (26.7) - 113.2 of which from equity method companies 13.9 13.4 - 0.8 (1.4) - 26.6
Non-recurring EBIT (14.1) (11.6) (2.9) (11.0) (58.2) - (97.9) of which from operating result (2.1) (11.6) (2.9) (9.5) (54.1) - (80.1) of which from equity method companies (12.0) - - (1.5) (4.2) - (17.7)
IAS 39 effect on EBIT (8.8) (4.8) 1.4 2.3 - - (9.9) of which from operating result (3.4) (4.8) 1.4 2.3 - - (4.5) of which from equity method companies (5.4) - - - - - (5.4)
Total EBIT 10.4 3.8 96.2 7.9 (86.4) - 32.0 of which from operating result 13.9 (9.5) 96.2 8.6 (80.7) - 28.5 of which from equity method companies (3.6) 13.4 - (0.7) (5.6) - 3.5
Capital expenditure 35.0 48.0 28.0 8.1 6.2 - 125.2 Depreciation & amortization 11.3 16.6 16.8 9.1 4.6 - 58.4 Non-cash expenses (income) other than depreciation 10.5 (3.9) (6.5) 1.6 (4.4) - (2.8) Impairment losses (reversal of impairment losses) 1.6 18.3 5.6 8.6 74.9 - 109.1
The figures of Precious Metals Products & Catalysts, Zinc Specialties and the total have been restated for discontinued operations, except capital expenditure.
7 August 2009 – 07:30 CET CP-2009-26-R 25/33
Condensed segment information H1 2009 Advanced
Precious Metals
Products &Precious Metals Zinc Corporate &
(in million €) Materials Catalysts Services Specialties Unallocated Eliminations Total
Total segment turnover 243.1 1,084.0 2,076.8 253.0 8.4 (280.5) 3,384.8 of which external turnover 240.1 1,053.9 1,829.6 252.8 8.4 - 3,384.8 of which inter-segment turnover 3.0 30.1 247.2 0.2 - (280.5) -
Recurring EBIT 0.5 (9.7) 60.9 19.7 (21.8) - 49.5 of which from operating result 5.2 0.9 60.9 18.5 (18.8) - 66.6 of which from equity method companies (4.6) (10.6) - 1.1 (3.0) - (17.1)
Non-recurring EBIT (4.2) (9.3) 0.4 6.0 1.1 - (6.0) of which from operating result (2.6) (9.3) 0.4 5.5 1.1 - (5.0) of which from equity method companies (1.5) - - 0.5 - - (1.0)
IAS 39 effect on EBIT 7.1 5.2 (6.7) (1.0) - - 4.6 of which from operating result 1.4 5.2 (6.7) (1.0) - - (1.2) of which from equity method companies 5.7 - - - - - 5.7
Total EBIT 3.5 (13.8) 54.5 24.7 (20.8) - 48.1 of which from operating result 3.9 (3.2) 54.5 23.0 (17.8) - 60.4 of which from equity method companies (0.4) (10.6) - 1.7 (3.0) - (12.3)
Capital expenditure 32.9 28.9 27.5 6.6 7.0 - 102.9 Depreciation & amortization 10.3 16.7 17.7 8.4 3.9 - 57.0 Non-cash expenses (income) other than depreciation (2.0) 8.1 8.0 3.3 0.8 - 18.2 Impairment losses (reversal of impairment losses) (1.8) (1.2) (3.1) (5.8) 0.1 - (11.8)
7 August 2009 – 07:30 CET CP-2009-26-R 26/33
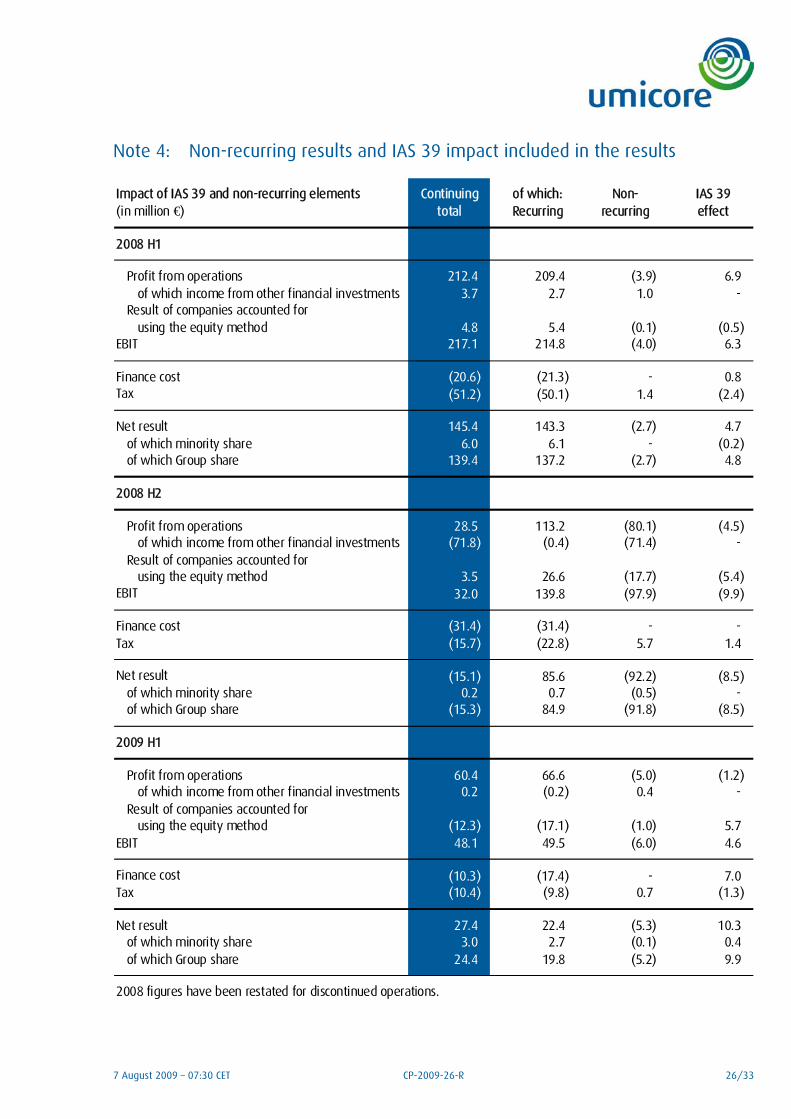
Note 4: Non-recurring results and IAS 39 impact included in the results
Impact of IAS 39 and non-recurring elements Continuing of which: Non- IAS 39(in million €) total Recurring recurring effect
2008 H1
Profit from operations 212.4 209.4 (3.9) 6.9 of which income from other financial investments 3.7 2.7 1.0 -
Result of companies accounted for using the equity method 4.8 5.4 (0.1) (0.5)
EBIT 217.1 214.8 (4.0) 6.3
Finance cost (20.6) (21.3) - 0.8 Tax (51.2) (50.1) 1.4 (2.4)
Net result 145.4 143.3 (2.7) 4.7 of which minority share 6.0 6.1 - (0.2) of which Group share 139.4 137.2 (2.7) 4.8
2008 H2
Profit from operations 28.5 113.2 (80.1) (4.5) of which income from other financial investments (71.8) (0.4) (71.4) -
Result of companies accounted for using the equity method 3.5 26.6 (17.7) (5.4)
EBIT 32.0 139.8 (97.9) (9.9)
Finance cost (31.4) (31.4) - - Tax (15.7) (22.8) 5.7 1.4
Net result (15.1) 85.6 (92.2) (8.5) of which minority share 0.2 0.7 (0.5) - of which Group share (15.3) 84.9 (91.8) (8.5)
2009 H1
Profit from operations 60.4 66.6 (5.0) (1.2) of which income from other financial investments 0.2 (0.2) 0.4 -
Result of companies accounted for using the equity method (12.3) (17.1) (1.0) 5.7
EBIT 48.1 49.5 (6.0) 4.6
Finance cost (10.3) (17.4) - 7.0 Tax (10.4) (9.8) 0.7 (1.3)
Net result 27.4 22.4 (5.3) 10.3 of which minority share 3.0 2.7 (0.1) 0.4 of which Group share 24.4 19.8 (5.2) 9.9
2008 figures have been restated for discontinued operations.
7 August 2009 – 07:30 CET CP-2009-26-R 27/33
Non-recurring EBIT stood at ¤ -6.0 million. Restructuring costs and provisions in Automotive Catalysts, Technical Materials and Advanced Materials amounted to ¤ 18.5 million. Reversal of metal impairments on permanent metal inventories totalled ¤ 11.7 million, mainly related to zinc inventories.
IAS 39 accounting rules had a positive effect on EBIT of ¤ 4.6 million. The impact concerns timing differences imposed by IFRS that relate primarily to transactional and structural metal and currency hedges. All IAS 39 impacts are non-cash in nature.
Note 5: Share based payments
A charge of ¤ 2.8 million was recognised in the income statement in respect of stock options granted to senior executives of the company in 2009.
Note 6: Financial instruments
a) Cash-flow hedges
The ¤ -30.1 million consist of ¤ -38.9 million on forward commodity contracts, ¤ +8.6 million on forward currency contracts and ¤ +0.2 million on forward interest rate swap contracts.
b) Embedded derivative
In 2006 a contractual situation became active whereby variable price adjustments (embedded derivative) occur on the sale (host contract) in 1992 of the participation and loans of Aurifère de Guinée, a gold mining concession in Guinea. The changes in the estimated present value of potential income from this source amounted to ¤ -0.8 million.
Note 7: Shares
The number of shares at the end of June is 120,000,000. Of the 7,757,722 treasury shares held at the end of 2008, 31,750 shares were used for the 2009 employee free share program and 392,900 shares were used to honor the exercising of stock options during the period. During the same period Umicore also bought back 257,000 of its treasury shares. On 30 June 2009 Umicore owned 7,590,072 of its treasury shares, representing 6.33 % of the total number of shares issued at that date.
Note 8: Events after the balance sheet date
A far-reaching restructuring programme in the Element Six Abrasives activities is on-going, resulting in reduction of manufacturing capacity and workforce, while also reducing working capital. In this respect, Element Six Abrasives announced after end of June closing that it would cease production in Shannon, Ireland, which will affect 370 positions. R&D and Group support activities will be maintained at the site. The related restructuring charge will be booked in the second half of the year
Note 9: Discontinued operations
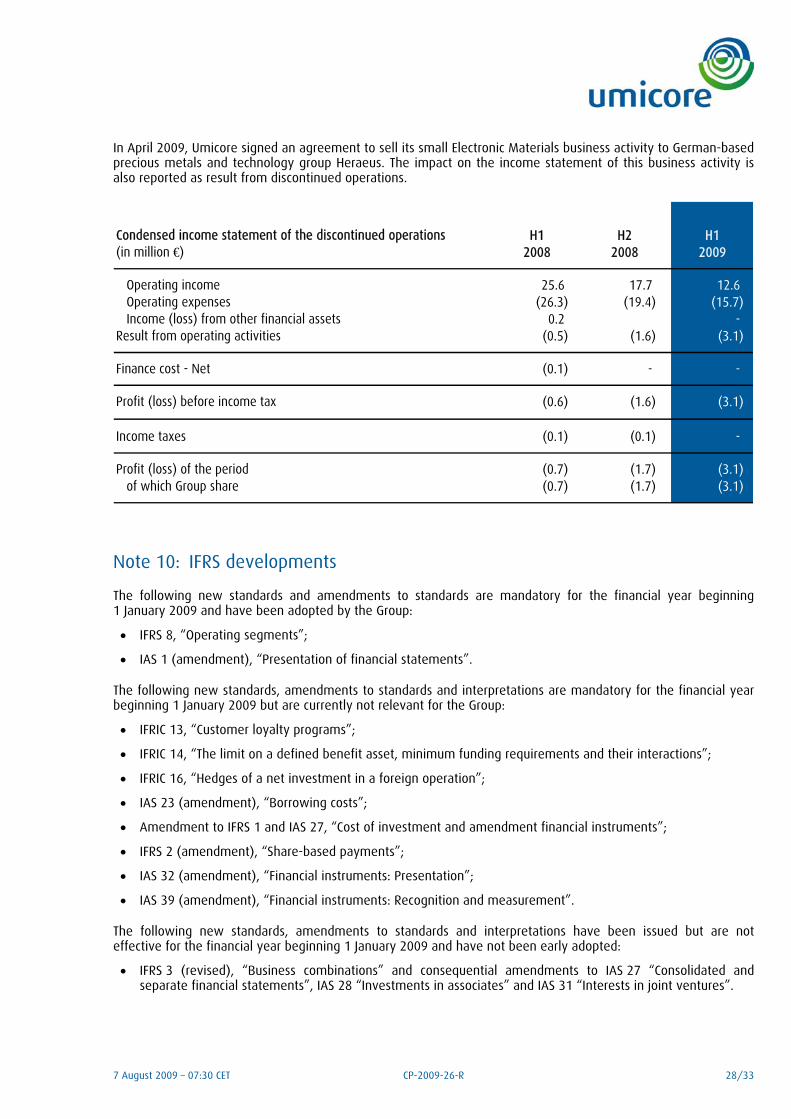
In February 2009, Umicore announced its intention to close lead sheet operations in Overpelt, Belgium. The impact on the consolidated income statement of the lead activities in Belgium is reported as result from discontinued operations.
7 August 2009 – 07:30 CET CP-2009-26-R 28/33
In April 2009, Umicore signed an agreement to sell its small Electronic Materials business activity to German-based precious metals and technology group Heraeus. The impact on the income statement of this business activity is also reported as result from discontinued operations.
Condensed income statement of the discontinued operations H1 H2 H1(in million €) 2008 2008 2009
Operating income 25.6 17.7 12.6 Operating expenses (26.3) (19.4) (15.7) Income (loss) from other financial assets 0.2 -
Result from operating activities (0.5) (1.6) (3.1)
Finance cost - Net (0.1) - -
Profit (loss) before income tax (0.6) (1.6) (3.1)
Income taxes (0.1) (0.1) -
Profit (loss) of the period (0.7) (1.7) (3.1) of which Group share (0.7) (1.7) (3.1)
Note 10: IFRS developments
The following new standards and amendments to standards are mandatory for the financial year beginning 1 January 2009 and have been adopted by the Group:
• IFRS 8, “Operating segments”;
• IAS 1 (amendment), “Presentation of financial statements”.
The following new standards, amendments to standards and interpretations are mandatory for the financial year beginning 1 January 2009 but are currently not relevant for the Group:
• IFRIC 13, “Customer loyalty programs”;
• IFRIC 14, “The limit on a defined benefit asset, minimum funding requirements and their interactions”;
• IFRIC 16, “Hedges of a net investment in a foreign operation”;
• IAS 23 (amendment), “Borrowing costs”;
• Amendment to IFRS 1 and IAS 27, “Cost of investment and amendment financial instruments”;
• IFRS 2 (amendment), “Share-based payments”;
• IAS 32 (amendment), “Financial instruments: Presentation”;
• IAS 39 (amendment), “Financial instruments: Recognition and measurement”.
The following new standards, amendments to standards and interpretations have been issued but are not effective for the financial year beginning 1 January 2009 and have not been early adopted:
• IFRS 3 (revised), “Business combinations” and consequential amendments to IAS 27 “Consolidated and separate financial statements”, IAS 28 “Investments in associates” and IAS 31 “Interests in joint ventures”.
7 August 2009 – 07:30 CET CP-2009-26-R 29/33
The management is currently assessing the impact of these new standards and amendments on the Group’s operations.
Note 11: Contingencies, accounting estimates and adjusting events
There were no changes in contingencies, accounting estimates and no adjusting or non-adjusting events arose between the balance sheet date and the date at which the interim condensed financial statements have been authorised for issue.
Note 12: Related parties’ transactions
With respect to material related parties’ transactions and conflicts of interest, it is noted that the Board of Directors decided on April 28, 2009 to extend by three years the exercise period of the stock options plans granted in 2006, 2007 and 2008. In light of their direct material interest, two directors were not present during the discussions and abstained from voting on the matter in accordance with Art. 523 of the Company Code.
7 August 2009 – 07:30 CET CP-2009-26-R 30/33
Statutory auditor’s report on review of condensed consolidated interim financial information for the period ended 30 June 2009
We have reviewed the accompanying consolidated balance sheet of Umicore S.A. and its subsidiaries, as of 30 June 2009 and the related consolidated statements of income, cash flows, other comprehensive income and changes in the equity for the 6 months period then ended, as well as the condensed explanatory notes. The board of directors is responsible for the preparation and presentation of this condensed consolidated interim financial information in accordance with IAS 34 as adopted by the European Union. Our responsibility is to express a conclusion on this condensed consolidated interim financial information based on our review.
We conducted our review in accordance with the recommendation of the Belgian Institute of Company Auditors related to the performance of reviews. Accordingly, it involved principally analysis, comparison and discussion of the condensed consolidated interim financial information and, accordingly, was less extensive in scope than an audit of that information.
Our review did not reveal any matters requiring correction of the condensed consolidated interim financial information for it to have been prepared, in all material respects, in accordance with IAS 34 as adopted by the European Union.
Brussels, 6 August 2009
PricewaterhouseCoopers Bedrijfsrevisoren / Reviseurs d’Entreprises Represented by
Raf Vander Stichele Bedrijfsrevisor
Management responsibility statement
We hereby certify that, to the best of our knowledge, the condensed Interim Consolidated Financial Statements prepared in accordance with the IAS 34 “Interim Financial Reporting” as adopted by the European Union, give a true and fair view of the assets, liabilities, financial position and profit or loss of the Group for the first semester of 2009. The commentary on the overall performance of the Group from page 1 to 12 in our view offers a fair and balanced review of the overall performance of the business during the first semester of 2009. Any material related parties’ transactions or conflicts of interest have been disclosed in the financial information.
There have been no material changes to the risks and uncertainties for the Group as outlined in the 2008 Report to Shareholders and Society; these risks and uncertainties remain applicable for the financial performance of the Group for the remainder of 2009.
Brussels, 6 August 2009
On behalf of the Executive Committee,
Marc Grynberg Chief Executive Officer
7 August 2009 – 07:30 CET CP-2009-26-R 31/33
Glossary
EBIT Operating profit (loss) of fully consolidated companies, including income from other financial investments + Group share in net profit (loss) of companies accounted for under equity method.
Non-recurring EBIT Includes non-recurring items related to restructuring measures, impairment of assets, and other income or expenses arising from events or transactionsthat are clearly distinct from the ordinary activities of the company. Any write-downs on those metal inventories permanently tied up in operations are part of the non-recurring EBIT of the business groups.
Recurring EBIT EBIT – non-recurring EBIT – IAS 39 effect.
Recurring EBIT margin Recurring EBIT of fully consolidated companies / revenues excluding metals.
IAS 39 effect Non-cash timing differences in revenue recognition in case of non-application of or non-possibility of obtaining IAS hedge accounting to:a) Transactional hedges, which implies that hedged items can no longer be measured at fair value, orb) Structural hedges, which implies that the fair value of the related hedging instruments are recognized in the income statement instead of the equity and this prior to the occurance of the underlying forecasted or committed transactions, orc) Derivatives embedded in executory contracts , which implies that the change in fair value on the embedded derivatives must be recognized in the incomestatement as opposed to the executory component where the fair value change in the income statement cannot be recognized.
EBITDA EBIT + [depreciation & amortization + non-cash expenses other than depreciation(i.e. increase and reversal of provisions, inventory write-downs and write-backs, other impairment result) +/– IAS 39 effect] of fully consolidated companies.
Revenues (excluding metal) All revenue elements – value of purchased metals.
Recurring effective tax rate Recurring tax charge / recurring profit (loss) before income tax of fully consolidated companies.
Return on Capital Employed (ROCE)
Recurring EBIT / average capital employed.
Capital employed Total equity (excluding fair value reserves) + net financial debt + provisions for employee benefits – deferred tax assets and liabilities – IAS 39 impact.
Average capital employed For half years: average of capital employed at start and end of the period.For full year: average of the half year averages.
Capital expenditure Capitalized investments in tangible and intangible assets.
Cash-flow before financing Net cash generated by (used in) operating activities + net cash generated by (used in) investing activities – extensions/repayments of loans granted in a non-operating context.
Net financial debt Non current financial debt + current financial debt – cash and cash equivalents – loans granted in a non-operating context.
Gearing ratio Net financial debt / (net financial debt + equity of the Group)
7 August 2009 – 07:30 CET CP-2009-26-R 32/33
EPS Earnings per share for equity holders.
EPS, basic Net earnings, Group share / average number of (outstanding shares – treasury shares).
EPS, diluted Net earnings, Group share / (average number of (outstanding shares – treasury shares)+ (number of potential new shares to be issued under the existing stock option plans x dilution impact of the stock option plans)).
EPS adjusted, basic Net recurring earnings, Group share / total number of (outstanding shares – treasury shares).
EPS adjusted, diluted Net recurring earnings, Group share / (average number of (outstanding shares – treasury shares)+ (number of potential new shares to be issued under the existing stock option plans x dilution impact of the stock option plans)).
The above financial definitions relate to non-IFRS performance indicators except for 'EPS, basic' and 'EPS, diluted'.
Forward looking statements
This document contains forward-looking information that involves risks and uncertainties, including statements about Umicore’s plans, objectives, expectations and intentions. Readers are cautioned that forward-looking statements include known and unknown risks and are subject to significant business, economic and competitive uncertainties and contingencies, many of which are beyond the control of Umicore. Should one or more of these risks, uncertainties or contingencies materialize, or should any underlying assumptions prove incorrect, actual results could vary materially from those anticipated, expected, estimated or projected. As a result, neither Umicore nor any other person assumes any responsibility for the accuracy of these forward-looking statements.
7 August 2009 – 07:30 CET CP-2009-26-R 33/33
For more information
Director of Group Communications
Mr. Tim WEEKES – +32 2 227 73 98 – [email protected]
Investor relations
Mr. Geoffroy RASKIN – +32 2 227 71 47 – [email protected]
Media relations
Mr. Bart CROLS – +32 2 227 71 29 – +32 476 98 01 21 – [email protected]
Financial calendar
28 October 2009 Q3 trading Update
11 February 2010 Publication of full year results 2009
28 April 2010 AGM and Q1 Trading Update
Umicore profile
Umicore is a materials technology group. Its activities are centred on four business areas: Advanced Materials, Precious Metals Products and Catalysts, Precious Metals Services and Zinc Specialties. Each business area is divided into market-focused business units, be it in products that are essential to everyday life or those at the cutting edge of new technological developments.
Umicore focuses on application areas where it knows its expertise in materials science, chemistry and metallurgy can make a real difference. Umicore generates approximately 50 % of its revenues and spends approximately 80 % of its R&D budget in the area of clean technology, such as emission control catalysts, materials for rechargeable batteries and photovoltaics, fuel cells, and precious metals recycling. Umicore’s overriding goal of sustainable value creation is based on this ambition to develop, produce and recycle materials in a way that fulfils its mission: materials for a better life.
The Umicore Group has industrial operations on all continents and serves a global customer base; it generated a turnover of ¤ 9.2 billion (¤ 2.1 billion excluding metal) in 2008 and currently employs some 14,000 people.
A conference call and audio webcast will take place today at 9:30 CET in Brussels. Please visit: http://www.investorrelations.umicore.com/en/financialCalendar/confCall20090807.htm