Embed Size (px)
Citation preview
Half Year Results 2005
1 August 2005
BUILDING THE FUTURE.
TOGETHER.
WORLDWIDE.
Julien De Wilde, CEO
2
Half Year Results – 1 August 2005
Content
Highlights
Sales
Segment reporting• Advanced wire products• Advanced materials• Advanced coatings
Profitability
Balance sheet
Cash flow
Outlook
3
Half Year Results – 1 August 2005
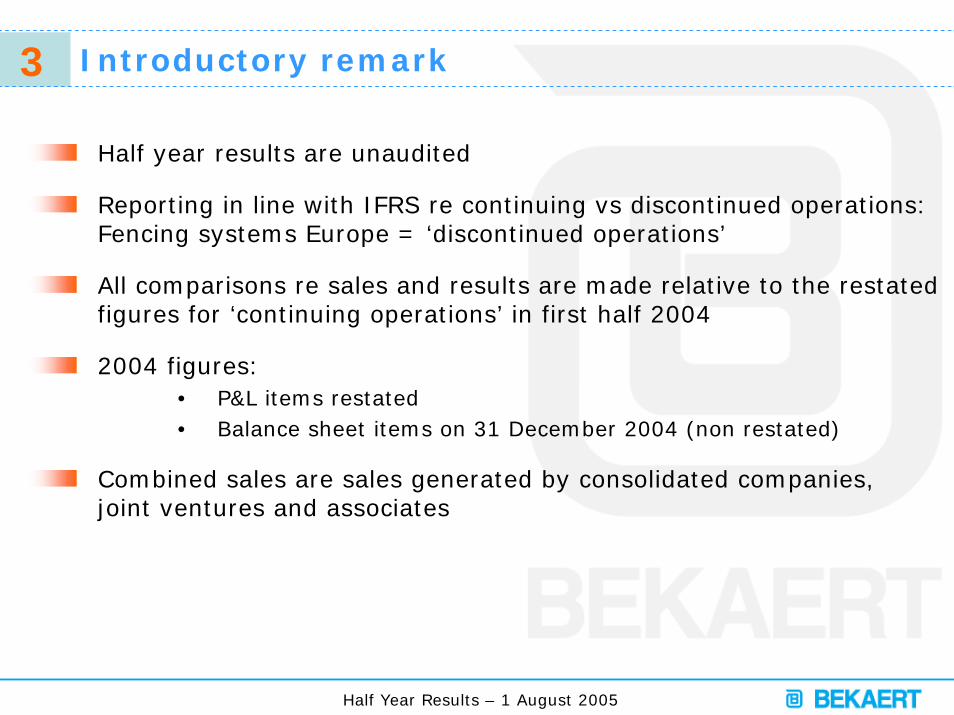
Introductory remark
Half year results are unaudited
Reporting in line with IFRS re continuing vs discontinued operations: Fencing systems Europe = ‘discontinued operations’
All comparisons re sales and results are made relative to the restated figures for ‘continuing operations’ in first half 2004
2004 figures:• P&L items restated• Balance sheet items on 31 December 2004 (non restated)
Combined sales are sales generated by consolidated companies, joint ventures and associates
4
Half Year Results – 1 August 2005
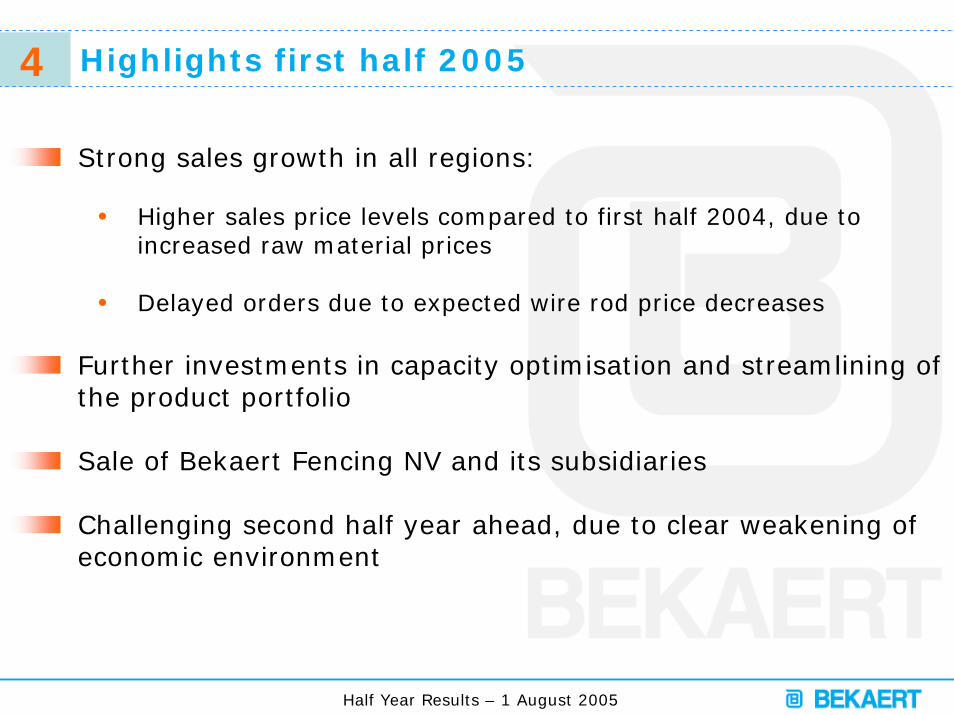
Highlights first half 2005
Strong sales growth in all regions:
• Higher sales price levels compared to first half 2004, due to increased raw material prices
• Delayed orders due to expected wire rod price decreases
Further investments in capacity optimisation and streamlining ofthe product portfolio
Sale of Bekaert Fencing NV and its subsidiaries
Challenging second half year ahead, due to clear weakening of economic environment
5
Half Year Results – 1 August 2005
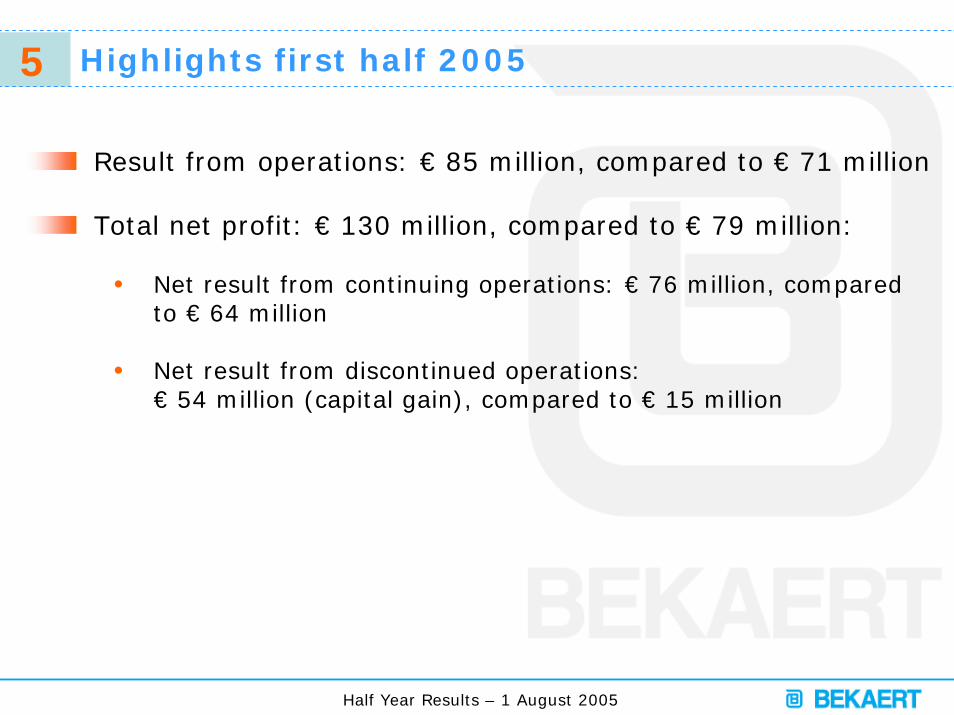
Highlights first half 2005
Result from operations: € 85 million, compared to € 71 million
Total net profit: € 130 million, compared to € 79 million:
• Net result from continuing operations: € 76 million, compared to € 64 million
• Net result from discontinued operations: € 54 million (capital gain), compared to € 15 million
6
Half Year Results – 1 August 2005
Content
Highlights
Sales
Segment reporting• Advanced wire products• Advanced materials• Advanced coatings
Profitability
Balance sheet
Cash flow
Outlook
7
Half Year Results – 1 August 2005
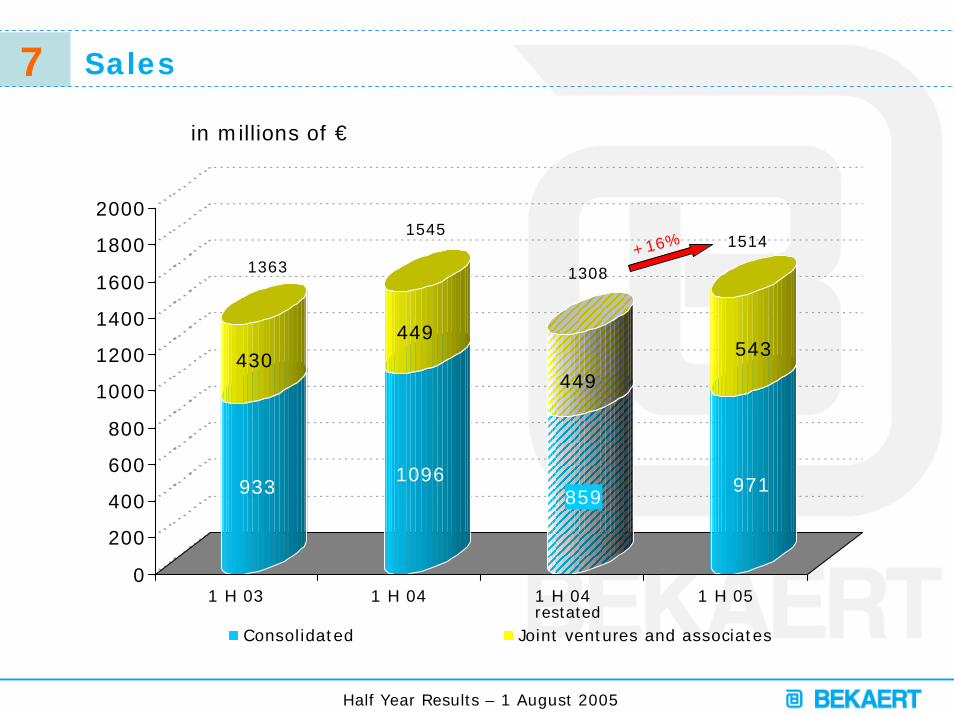
Sales
in millions of €
1363
1545
933
430
1096
449
859
449
971
543
0
200
400
600
800
1000
1200
1400
1600
1800
2000
1 H 03 1 H 04 1 H 04 1 H 05
Consolidated Joint ventures and associates
1308
1514+16%
restated
8
Half Year Results – 1 August 2005
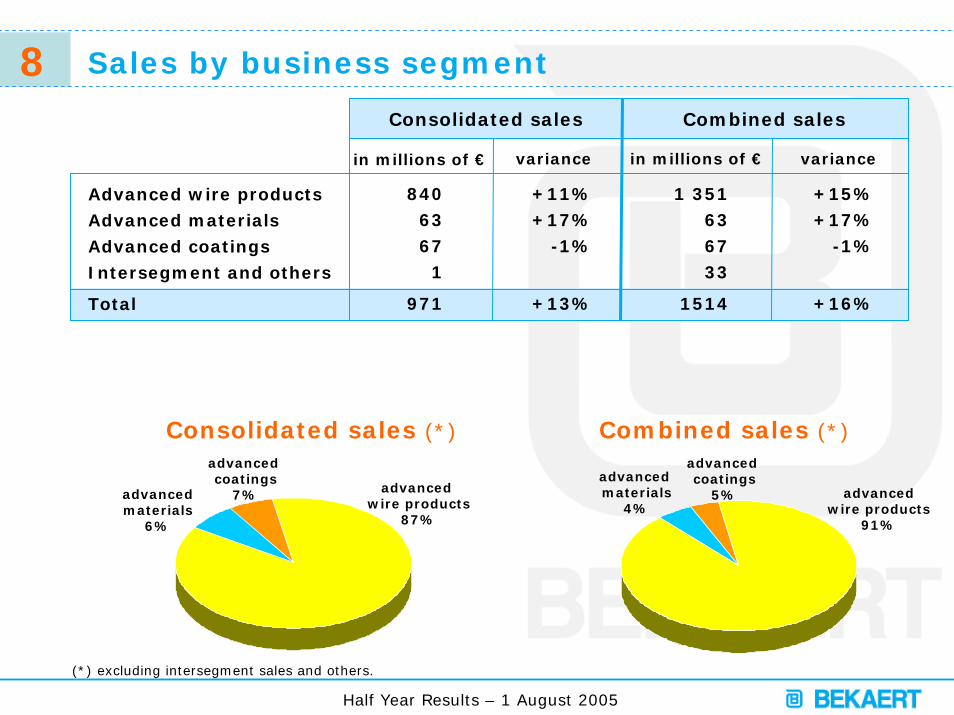
Sales by business segment
Advanced wire productsAdvanced materials Advanced coatings
Intersegment and others
Total
variance
Combined salesConsolidated sales
in millions of € in millions of €
1 351636733
1514
+15%+17%
-1%
+16%
8406367
1
971
+11%+17%
-1%
+13%
variance
Combined sales (*)Consolidated sales (*)
advanced wire products
91%
advancedmaterials
4%
advancedcoatings
5%advanced wire products
87%
advancedmaterials
6%
advancedcoatings
7%
(*) excluding intersegment sales and others.
9
Half Year Results – 1 August 2005
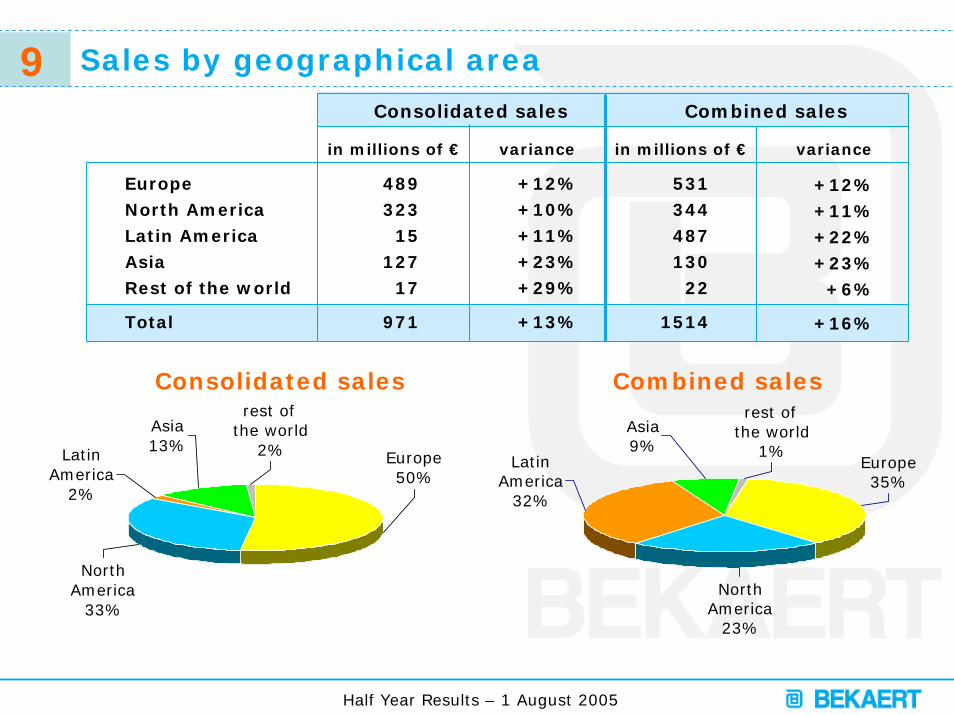
Sales by geographical area
EuropeNorth AmericaLatin AmericaAsiaRest of the world
Total
Combined salesConsolidated sales
in millions of € in millions of €
531344487130
22
1514
489323
15127
17
971
+12%+10%+11%+23%+29%
+13%
+12%+11%+22%+23%
+6%
+16%
variance variance
Consolidated sales Combined sales
Latin America
2%
rest of the world
2%
Asia13%
North America
33%
Europe50%
Europe35%
rest of the world
1%
Asia9%
Latin America
32%
North America
23%
10
Half Year Results – 1 August 2005
Content
Highlights
Sales
Segment reporting• Advanced wire products• Advanced materials• Advanced coatings
Profitability
Balance sheet
Cash flow
Outlook
11
Half Year Results – 1 August 2005
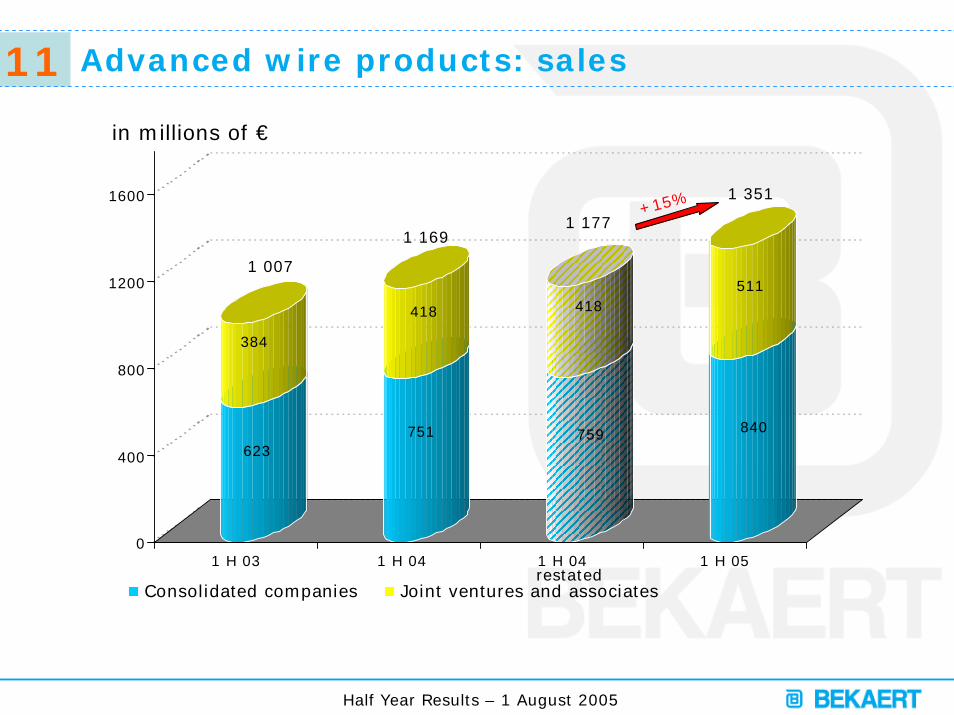
Advanced wire products: sales
in millions of €
623
384
751
418
759
418
840
511
0
400
800
1200
1600
1 H 03 1 H 04 1 H 04 1 H 05
Consolidated companies Joint ventures and associates
1 007
1 169
1 351
1 177+15%
restated
12
Half Year Results – 1 August 2005
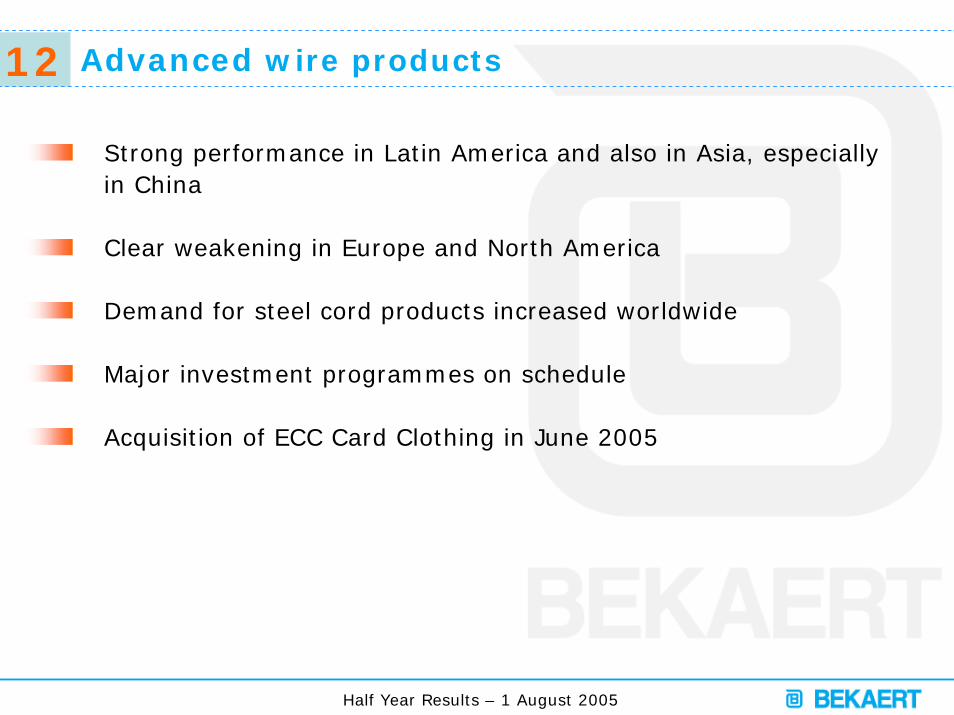
Advanced wire products
Strong performance in Latin America and also in Asia, especiallyin China
Clear weakening in Europe and North America
Demand for steel cord products increased worldwide
Major investment programmes on schedule
Acquisition of ECC Card Clothing in June 2005
13
Half Year Results – 1 August 2005
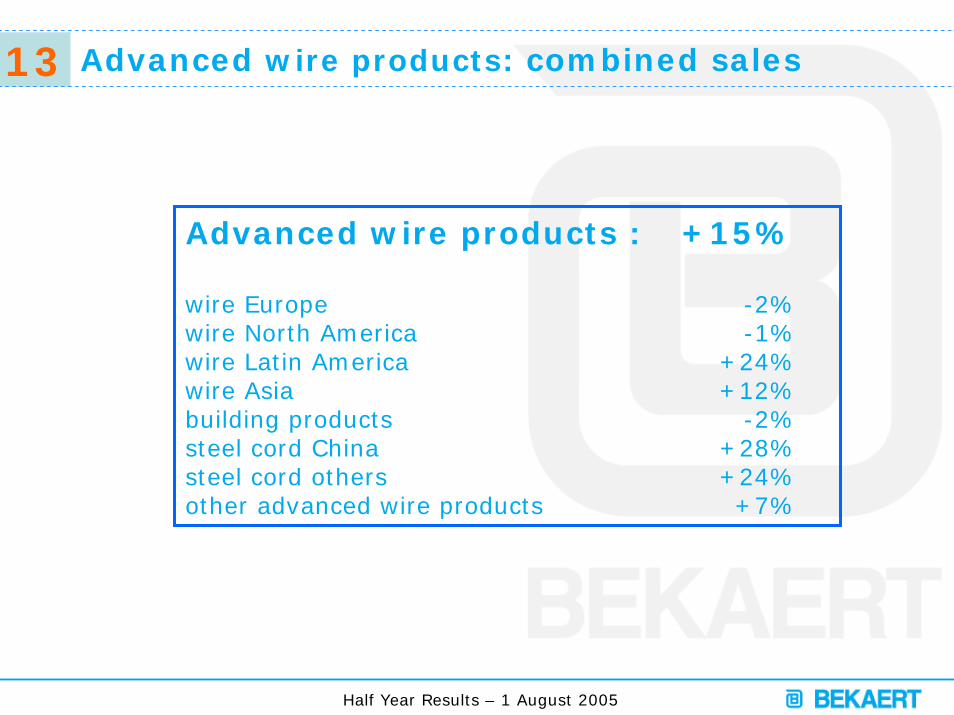
Advanced wire products: combined sales
Advanced wire products : +15%
wire Europe -2%wire North America -1%wire Latin America +24%wire Asia +12%building products -2%steel cord China +28%steel cord others +24%other advanced wire products +7%
14
Half Year Results – 1 August 2005
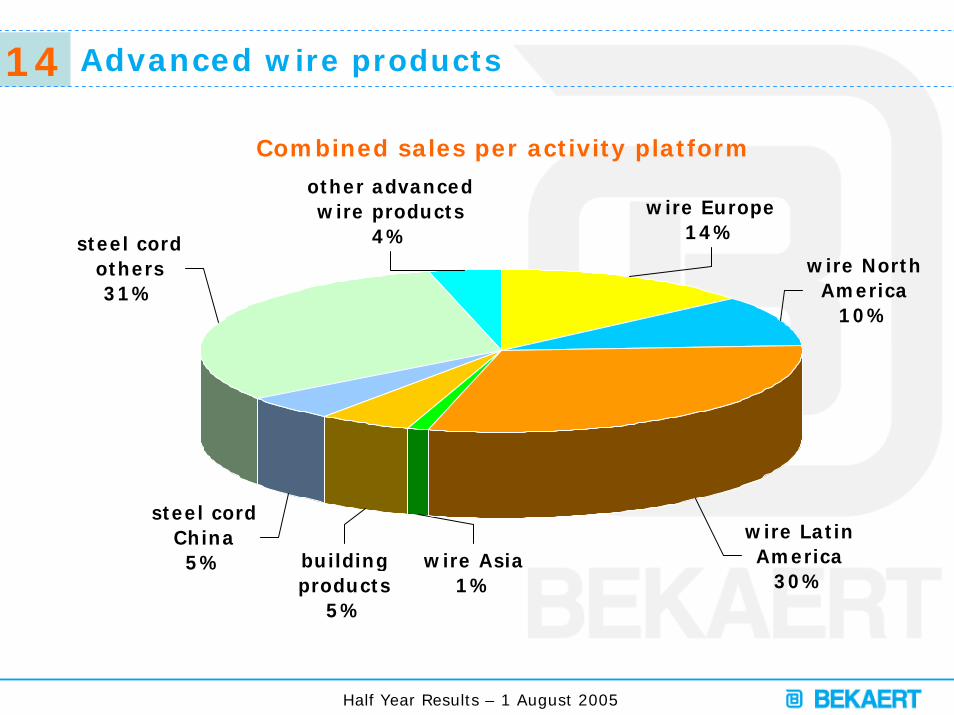
Advanced wire products
other advanced wire products
4%wire Europe
14%
wire Latin America
30%
steel cord others31%
wire North America
10%
steel cord China5% building
products5%
wire Asia1%
Combined sales per activity platform
15
Half Year Results – 1 August 2005
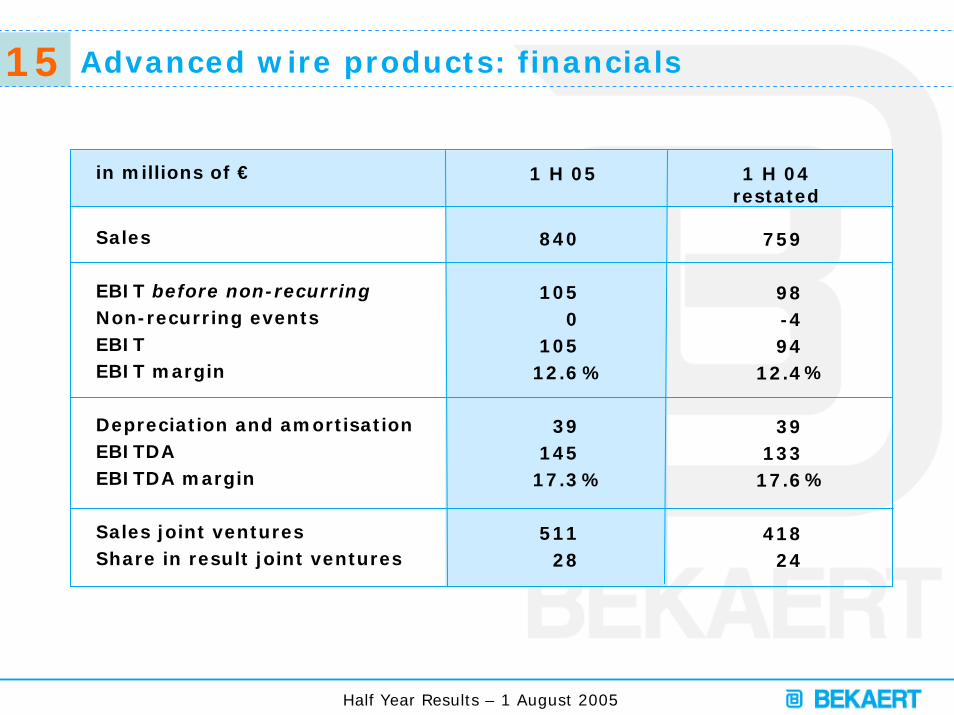
Advanced wire products: financials
in millions of €
Sales
EBIT before non-recurringNon-recurring eventsEBITEBIT margin
Depreciation and amortisationEBITDAEBITDA margin
Sales joint venturesShare in result joint ventures
1 H 05
840
1050
10512.6
39145
17.3
51128
%
%
1 H 04restated
759
98-494
12.4
39133
17.6
41824
%
%
16
Half Year Results – 1 August 2005
Content
Highlights
Sales
Segment reporting• Advanced wire products• Advanced materials• Advanced coatings
Profitability
Balance sheet
Cash flow
Outlook
17
Half Year Results – 1 August 2005
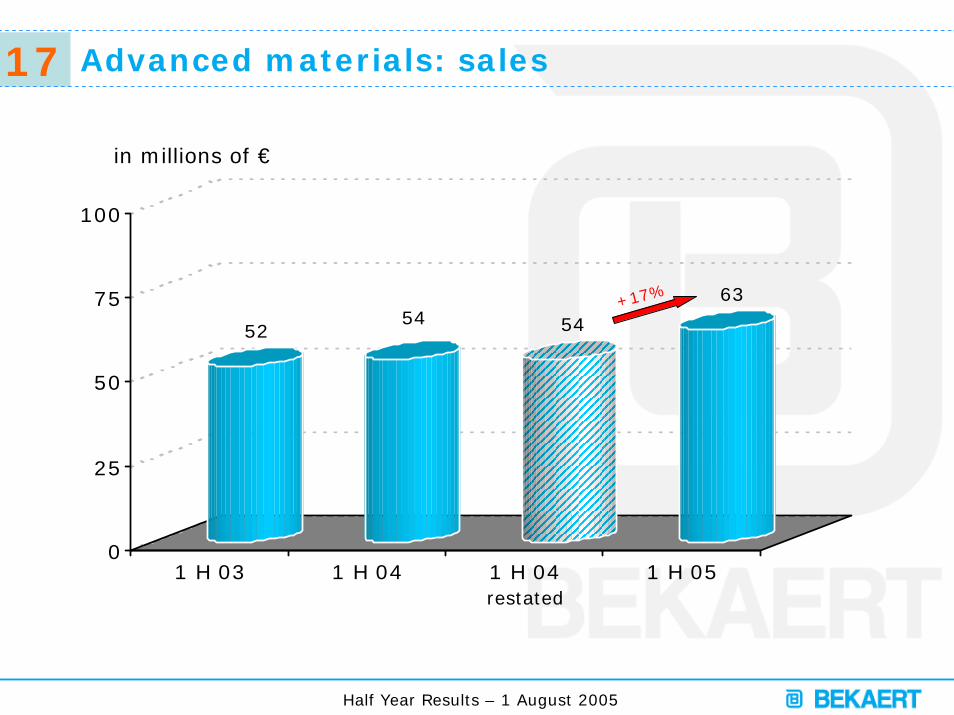
Advanced materials: sales
5254 54
63
0
25
50
75
100
1 H 03 1 H 04 1 H 04 1 H 05
in millions of €
+17%
restated
18
Half Year Results – 1 August 2005
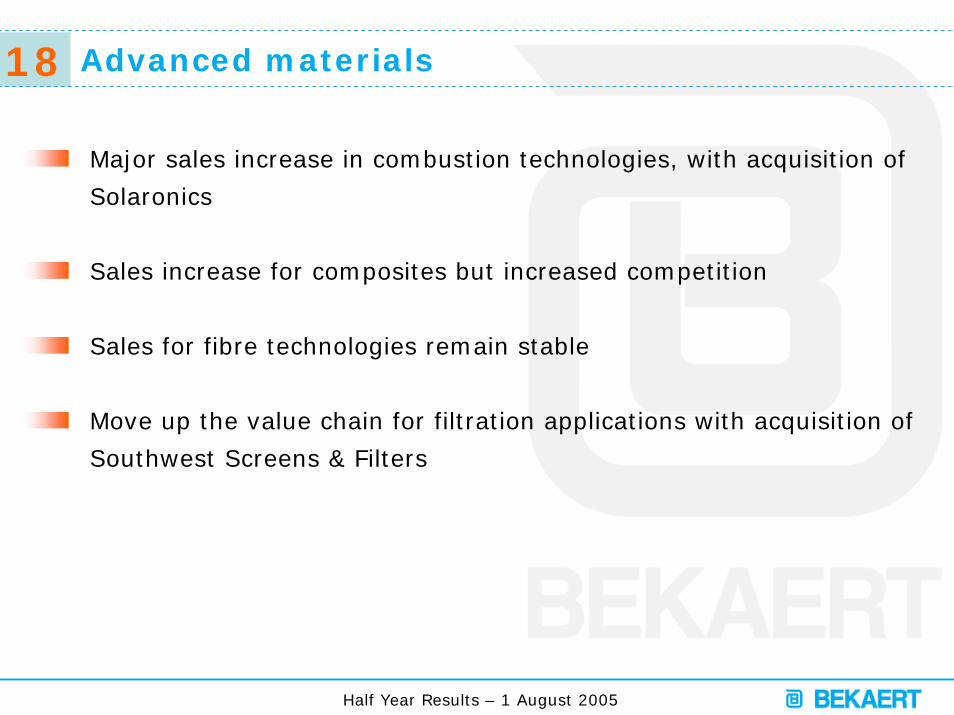
Advanced materials
Major sales increase in combustion technologies, with acquisition of
Solaronics
Sales increase for composites but increased competition
Sales for fibre technologies remain stable
Move up the value chain for filtration applications with acquisition of
Southwest Screens & Filters
19
Half Year Results – 1 August 2005
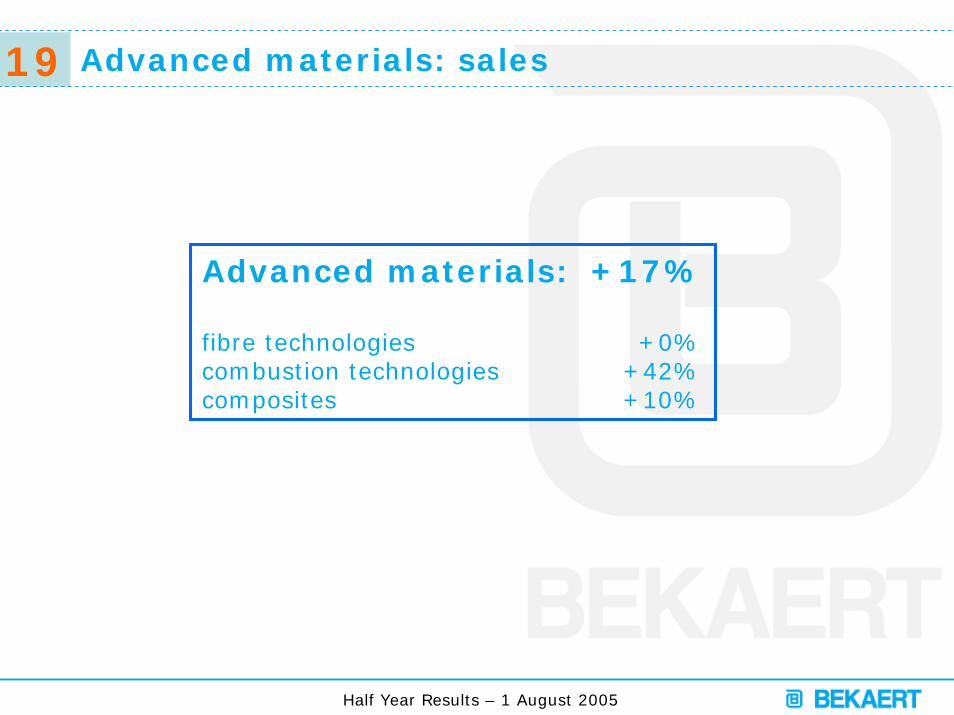
Advanced materials: sales
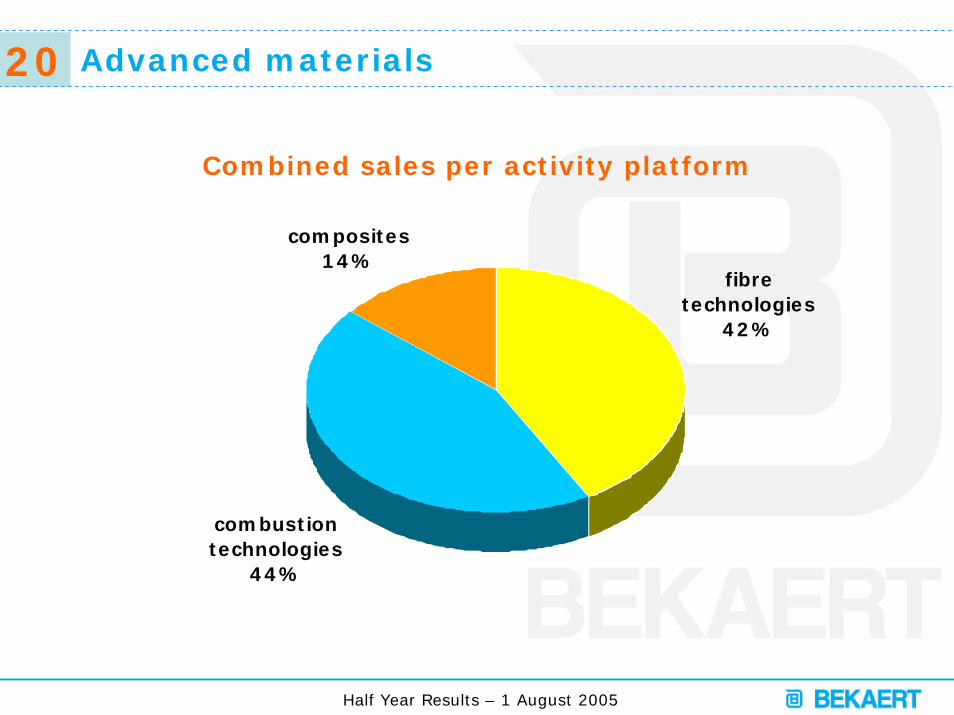
Advanced materials: +17%
fibre technologies +0%combustion technologies +42%composites +10%
20
Half Year Results – 1 August 2005
Advanced materials
Combined sales per activity platform
fibre technologies
42%
combustion technologies
44%
composites14%
21
Half Year Results – 1 August 2005
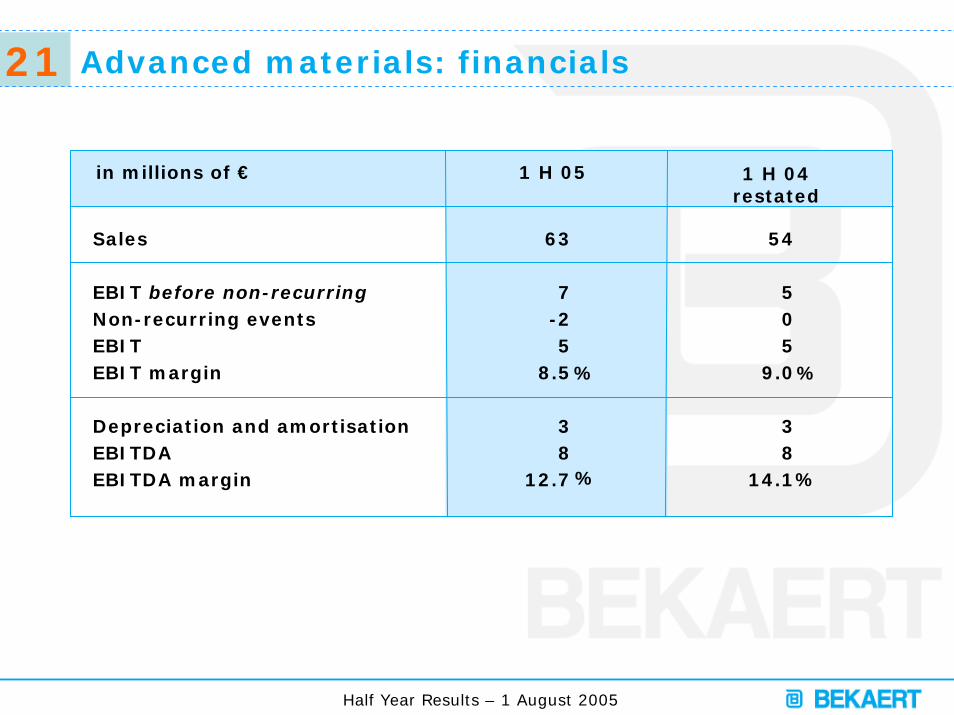
Advanced materials: financials
in millions of €
Sales
EBIT before non-recurringNon-recurring eventsEBITEBIT margin
Depreciation and amortisationEBITDAEBITDA margin
63
7-25
8.5
38
12.7
54
505
9.0
38
14.1
%
%
1 H 05
%
%
1 H 04restated
22
Half Year Results – 1 August 2005
Content
Highlights
Sales
Segment reporting• Advanced wire products• Advanced materials• Advanced coatings
Profitability
Balance sheet
Cash flow
Outlook
23
Half Year Results – 1 August 2005
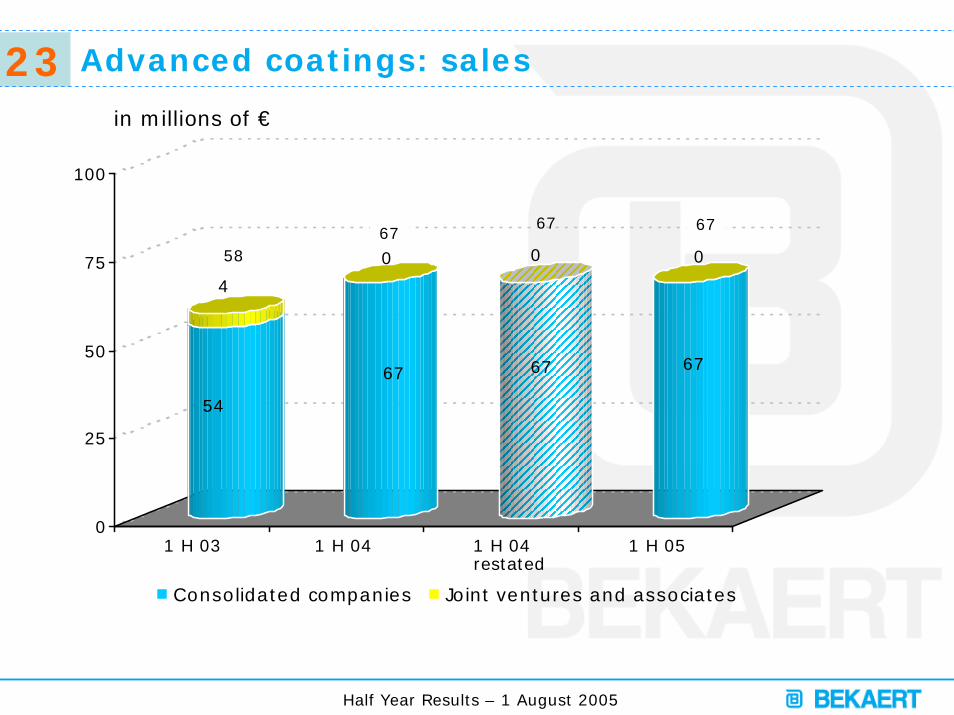
Advanced coatings: sales
54
4
67
0
67
0
67
0
0
25
50
75
100
1 H 03 1 H 04 1 H 04 1 H 05
Consolidated companies Joint ventures and associates
67
58
in millions of €
6767
restated
24
Half Year Results – 1 August 2005
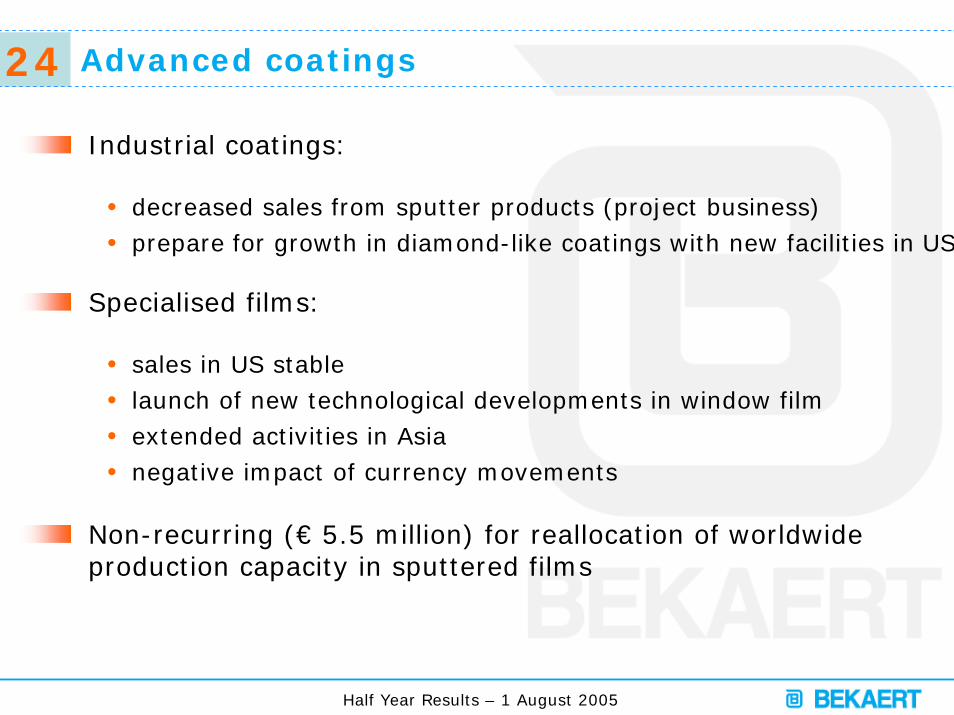
Advanced coatings
Industrial coatings:
• decreased sales from sputter products (project business)• prepare for growth in diamond-like coatings with new facilities in US
Specialised films:
• sales in US stable• launch of new technological developments in window film• extended activities in Asia• negative impact of currency movements
Non-recurring (€ 5.5 million) for reallocation of worldwide production capacity in sputtered films
25
Half Year Results – 1 August 2005
Advanced coatings: sales
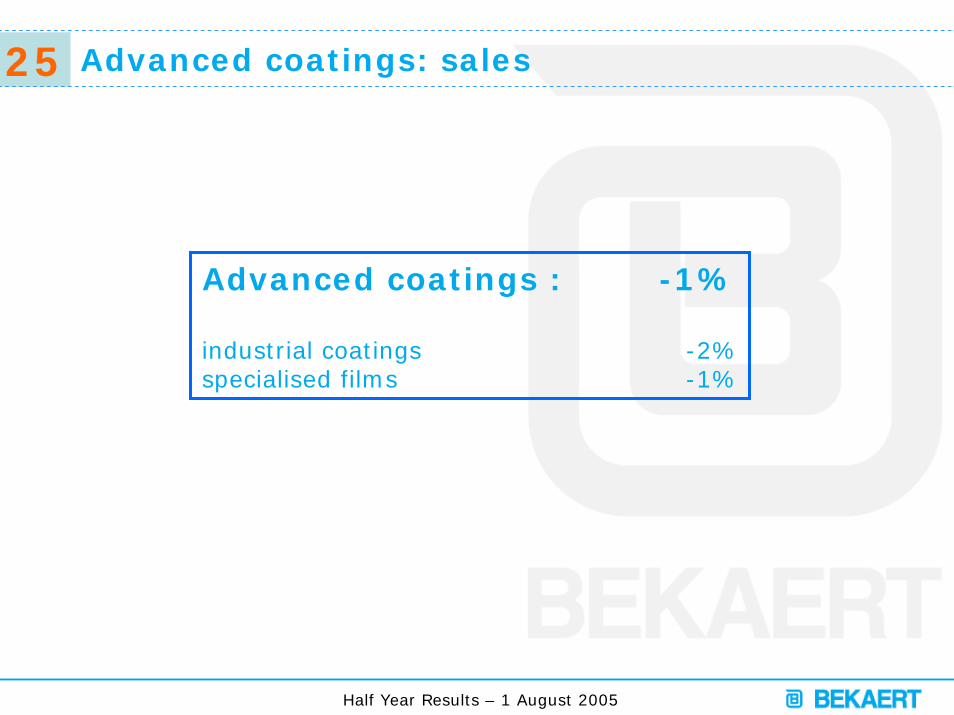
Advanced coatings : -1%
industrial coatings -2%specialised films -1%
26
Half Year Results – 1 August 2005
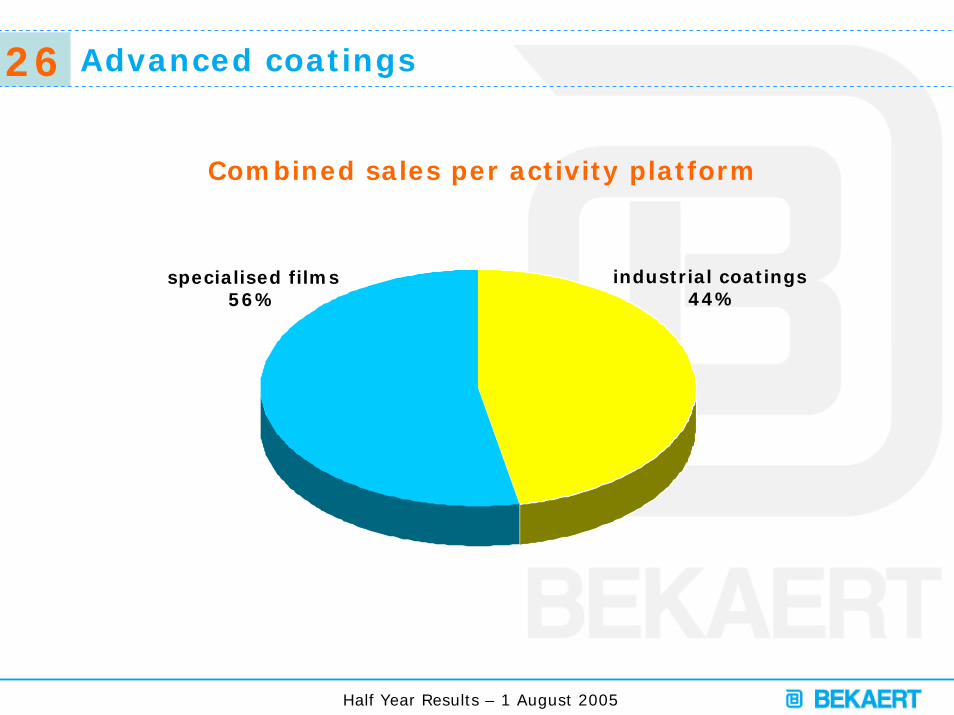
Advanced coatings
specialised films56%
industrial coatings44%
Combined sales per activity platform
27
Half Year Results – 1 August 2005
Advanced coatings: financials
in millions of €
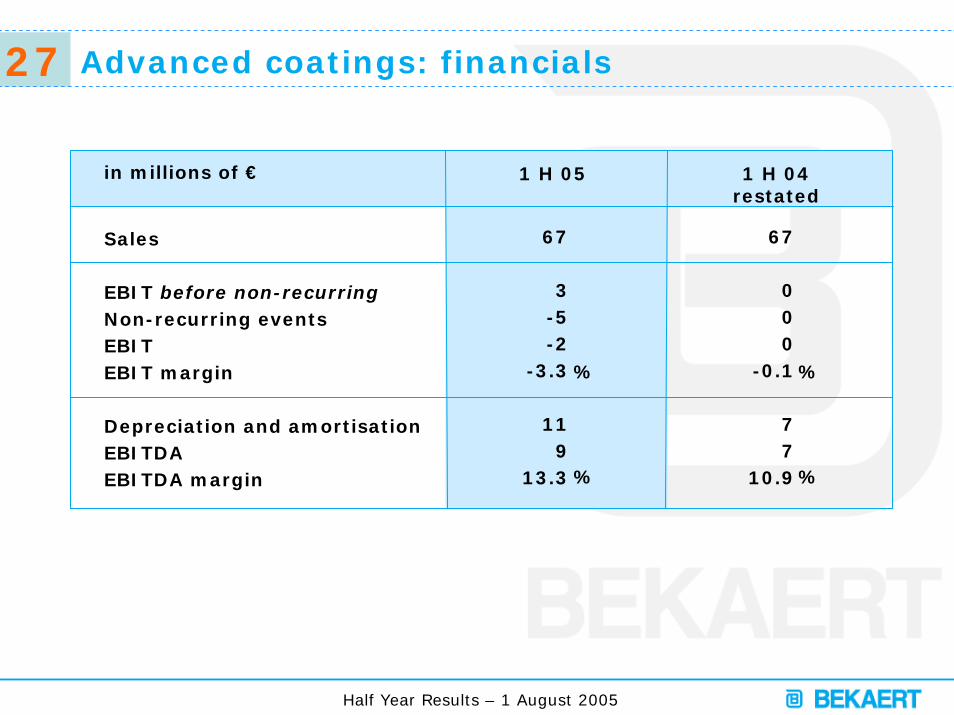
Sales
EBIT before non-recurringNon-recurring eventsEBITEBIT margin
Depreciation and amortisationEBITDAEBITDA margin
67
3-5-2
-3.3
119
13.3
67
000
-0.1
77
10.9
1 H 05
%
%
%
%
1 H 04restated
28
Half Year Results – 1 August 2005
Content
Highlights
Sales
Segment reporting• Advanced wire products• Advanced materials• Advanced coatings
Profitability
Balance sheet
Cash flow
Outlook
29
Half Year Results – 1 August 2005
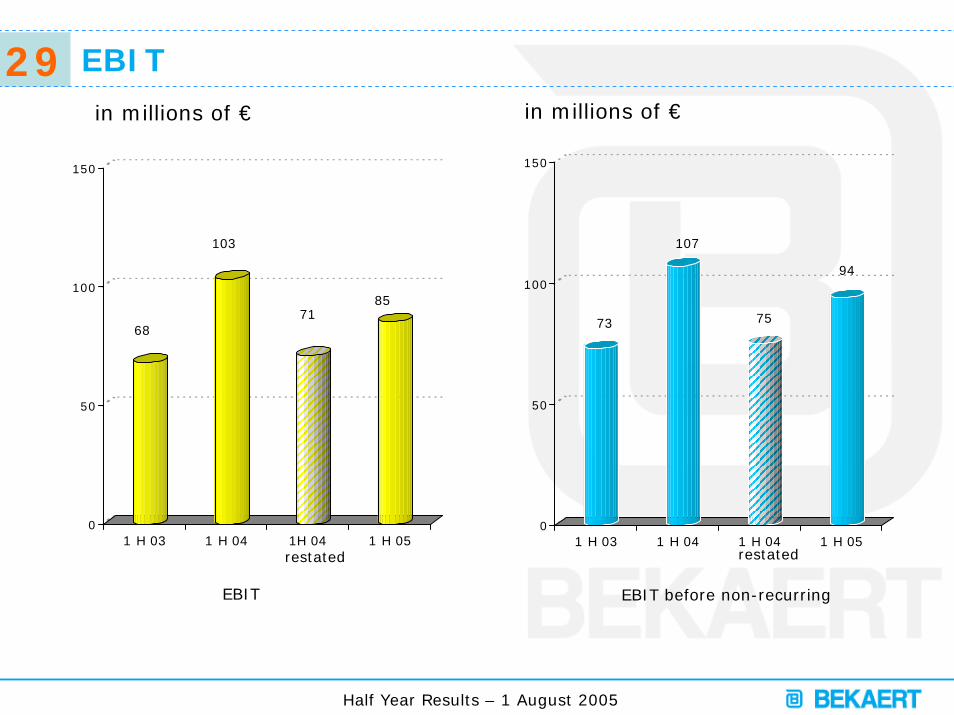
EBITin millions of €in millions of €
73
107
75
94
0
50
100
150
1 H 03 1 H 04 1 H 04 1 H 05restated
EBIT before non-recurring
68
103
7185
0
50
100
150
1 H 03 1 H 04 1H 04 1 H 05restated
EBIT
30
Half Year Results – 1 August 2005
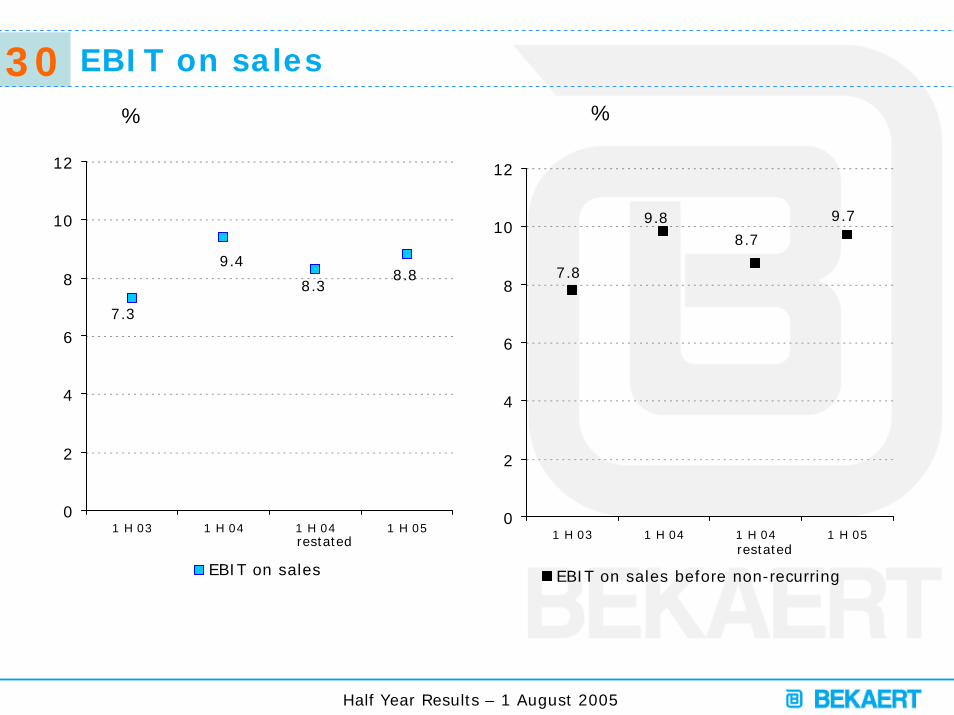
EBIT on sales
%%
8.88.3
9.4
7.3
0
2
4
6
8
10
12
1 H 03 1 H 04 1 H 04 1 H 05
EBIT on sales
restated
8.7
7.8
9.79.8
0
2
4
6
8
10
12
1 H 03 1 H 04 1 H 04 1 H 05
EBIT on sales before non-recurring
restated
31
Half Year Results – 1 August 2005
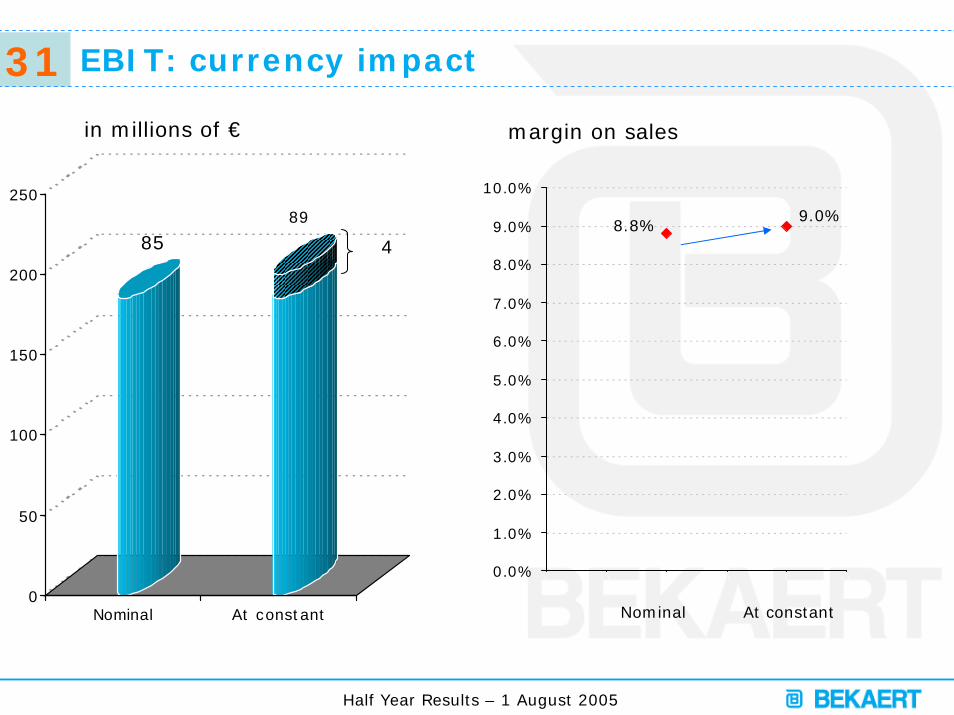
EBIT: currency impact
margin on sales
85
0
50
100
150
200
250
Nominal At constant
4
in millions of €
89 9.0%8.8%
0.0%
1.0%
2.0%
3.0%
4.0%
5.0%
6.0%
7.0%
8.0%
9.0%
10.0%
0 0 . 5 1 1 . 5 2 2 . 5
Nominal At constant
32
Half Year Results – 1 August 2005
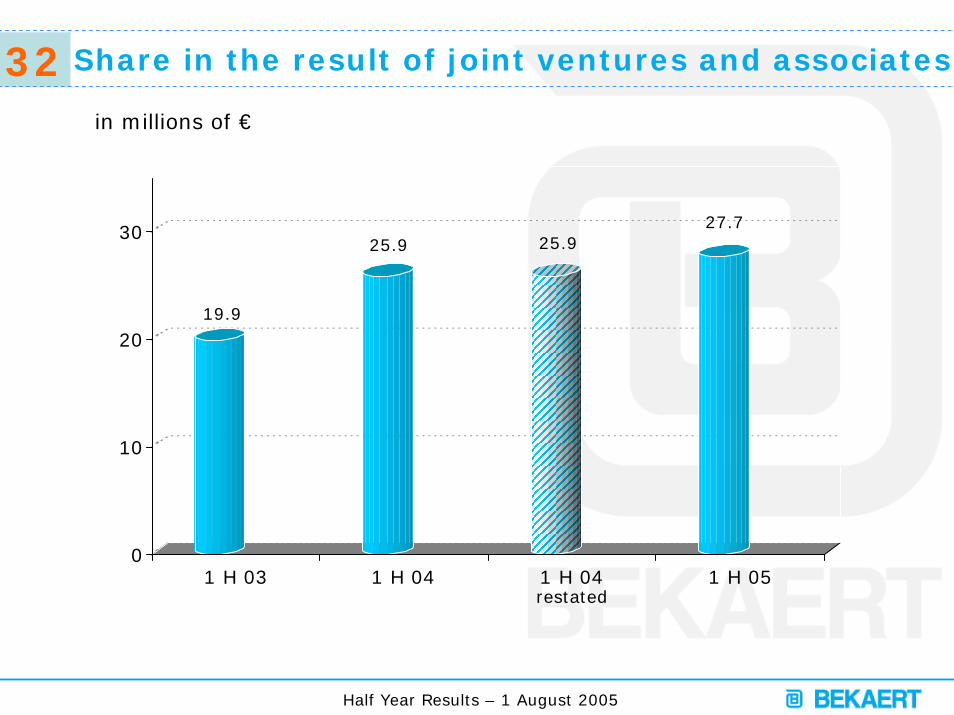
Share in the result of joint ventures and associates
19.9
25.9 25.927.7
0
10
20
30
1 H 03 1 H 04 1 H 04 1 H 05
in millions of €
restated
33
Half Year Results – 1 August 2005
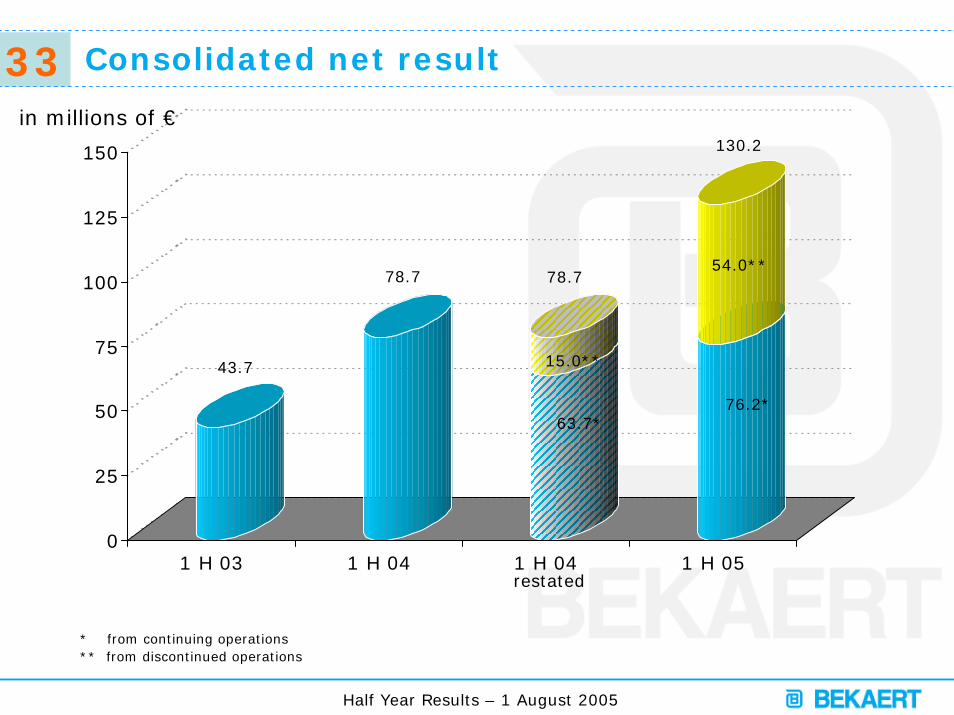
Consolidated net result
in millions of €
43.7
78.7
63.7*76.2*
0
25
50
75
100
125
150
1 H 03 1 H 04 1 H 04 1 H 05
15.0**
* from continuing operations** from discontinued operations
54.0**78.7
130.2
restated
34
Half Year Results – 1 August 2005
Content
Highlights
Sales
Segment reporting• Advanced wire products• Advanced materials• Advanced coatings
Profitability
Balance sheet
Cash flow
Outlook
35
Half Year Results – 1 August 2005
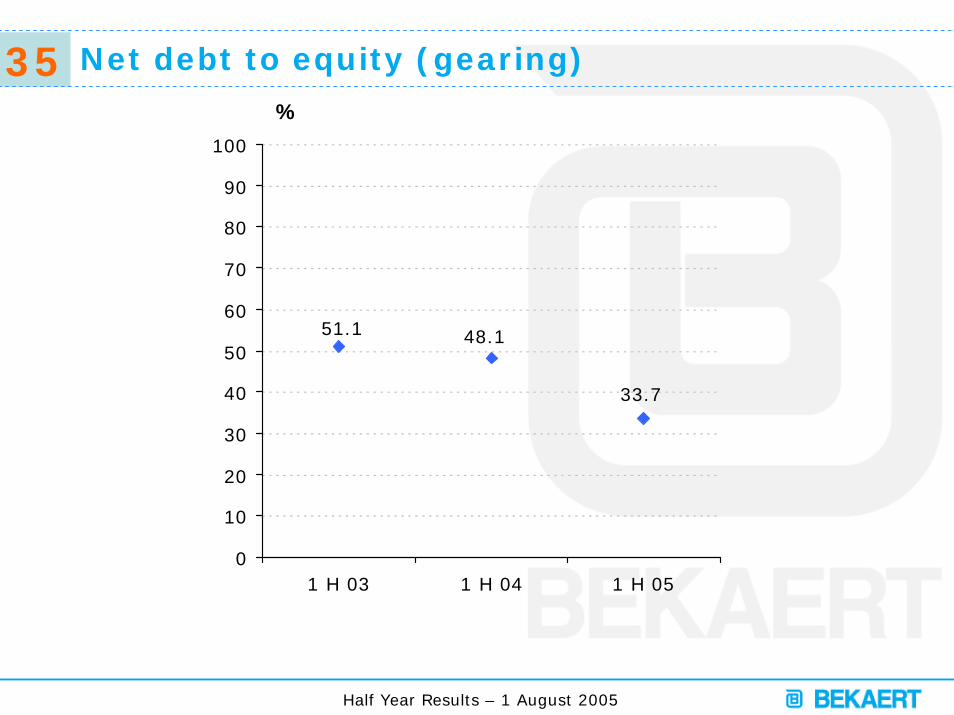
Net debt to equity (gearing)
33.7
48.151.1
0
10
20
30
40
50
60
70
80
90
100
1 H 03 1 H 04 1 H 05
%
36
Half Year Results – 1 August 2005
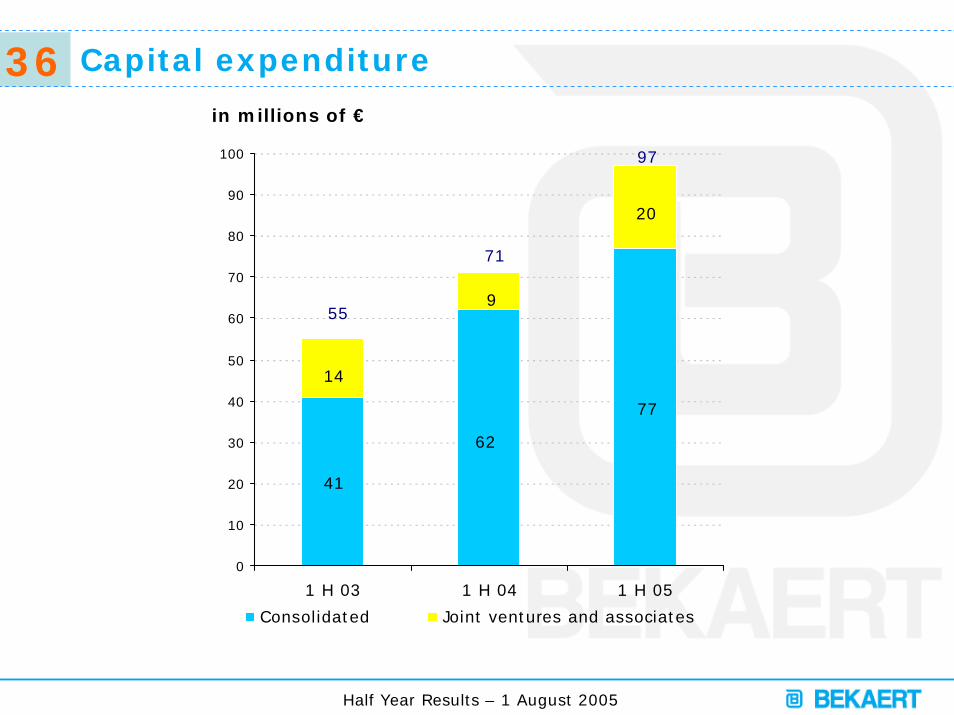
Capital expenditure
in millions of €
41
62
77
20
9
14
97
55
71
0
10
20
30
40
50
60
70
80
90
100
1 H 03 1 H 04 1 H 05
Consolidated Joint ventures and associates
37
Half Year Results – 1 August 2005
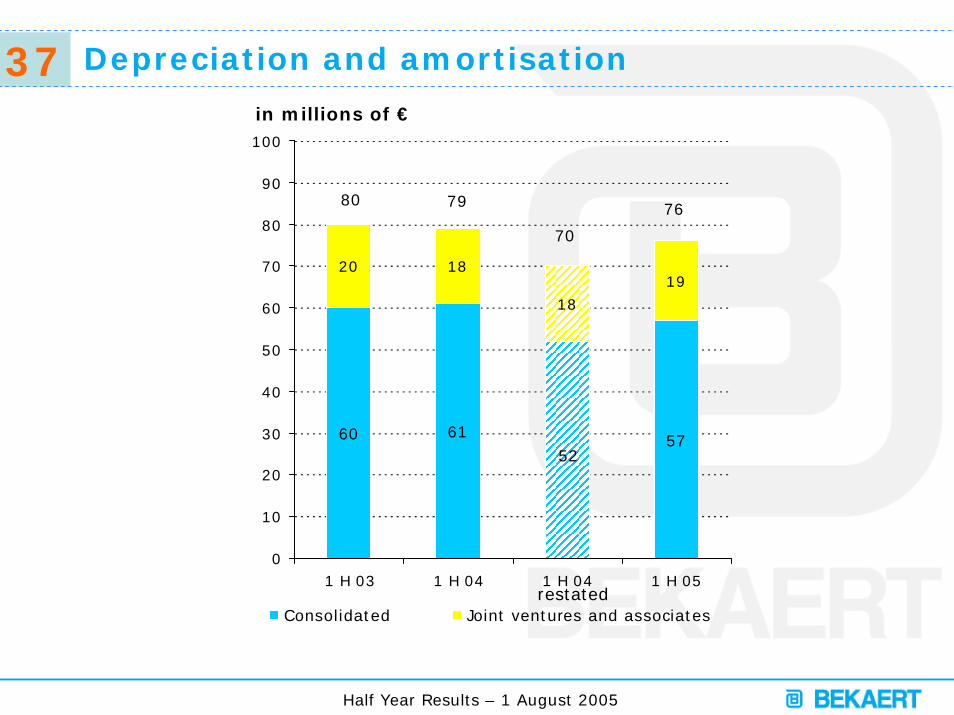
Depreciation and amortisation
60 61 57
20 18
18
19
52
0
10
20
30
40
50
60
70
80
90
100
1 H 03 1 H 04 1 H 04 1 H 05
Consolidated Joint ventures and associates
in millions of €
80 79
70
restated
76
38
Half Year Results – 1 August 2005
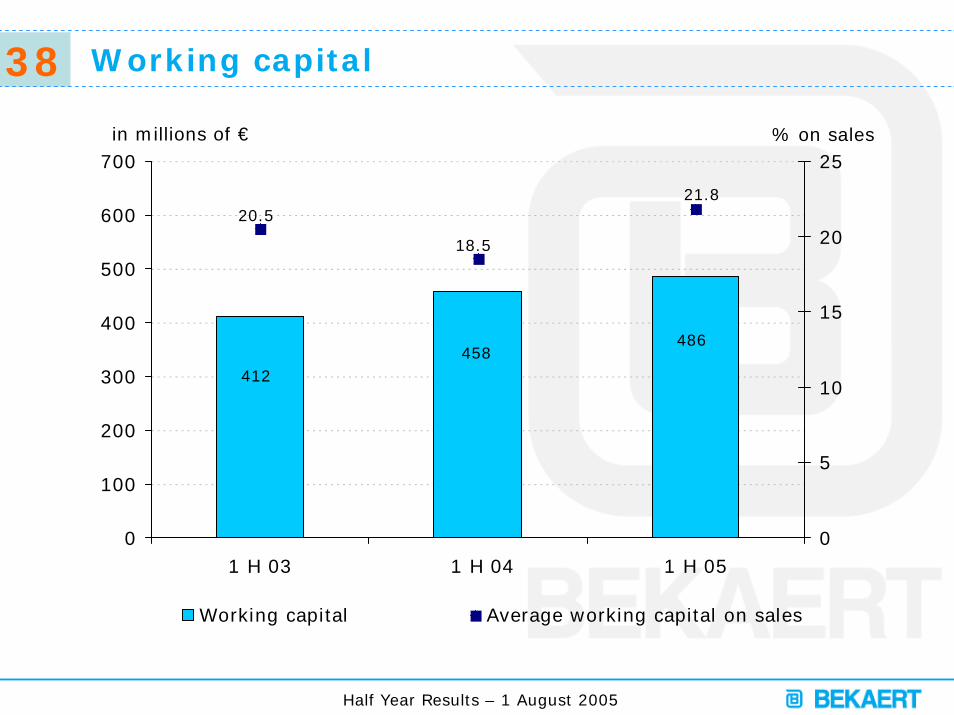
Working capital
486458
412
20.5
18.5
21.8
0
100
200
300
400
500
600
700
1 H 03 1 H 04 1 H 050
5
10
15
20
25
Working capital Average working capital on sales
% on salesin millions of €
39
Half Year Results – 1 August 2005
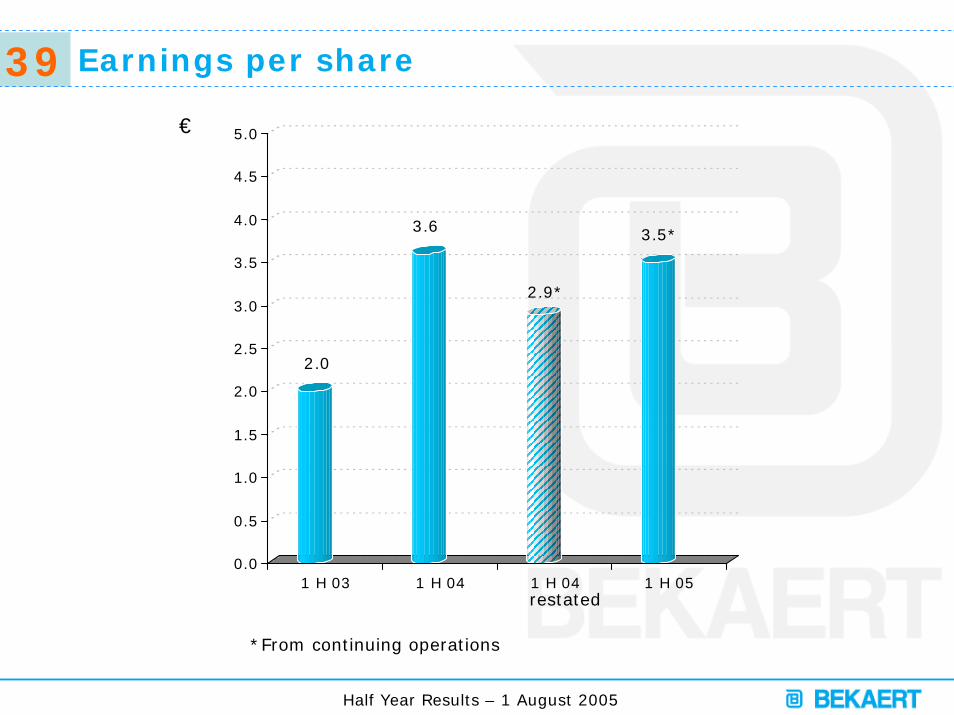
Earnings per share
€
2.0
3.6
2.9*
3.5*
0.0
0.5
1.0
1.5
2.0
2.5
3.0
3.5
4.0
4.5
5.0
1 H 03 1 H 04 1 H 04 1 H 05restated
*From continuing operations
40
Half Year Results – 1 August 2005
Content
Highlights
Sales
Segment reporting• Advanced wire products• Advanced materials• Advanced coatings
Profitability
Balance sheet
Cash flow
Outlook
41
Half Year Results – 1 August 2005
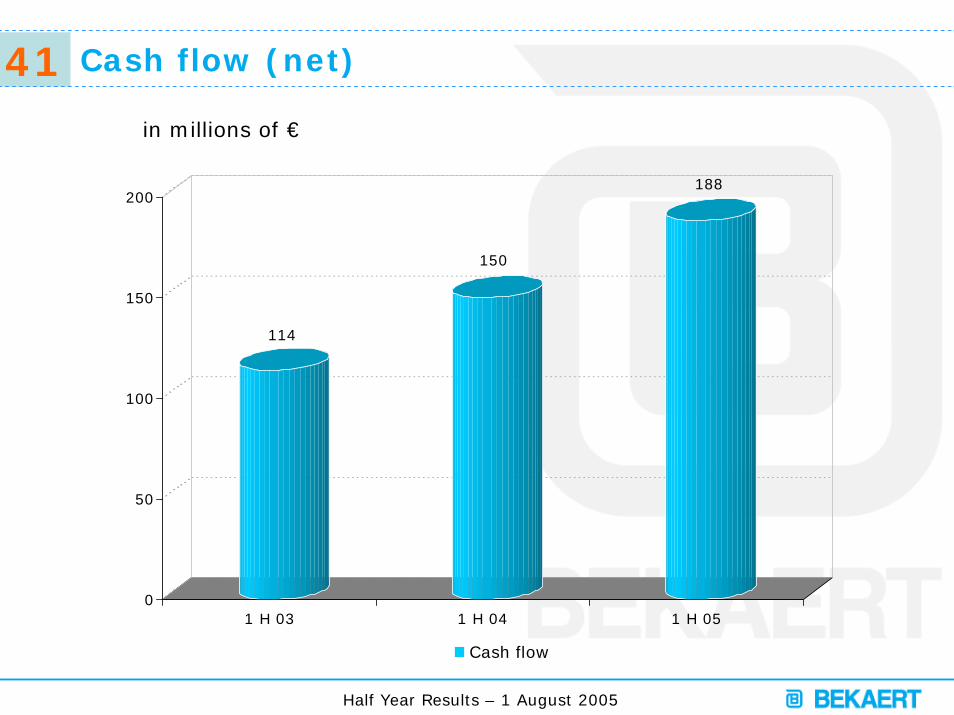
Cash flow (net)
in millions of €
114
150
188
0
50
100
150
200
1 H 03 1 H 04 1 H 05
Cash flow
42
Half Year Results – 1 August 2005
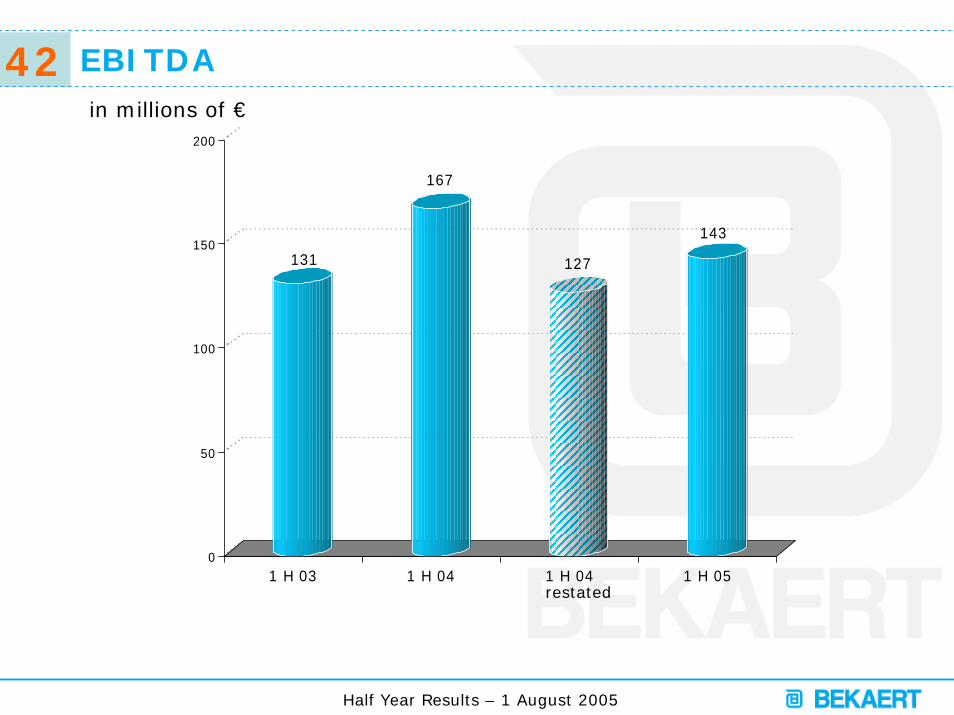
EBITDAin millions of €
131
167
127
143
0
50
100
150
200
1 H 03 1 H 04 1 H 04 1 H 05restated
43
Half Year Results – 1 August 2005
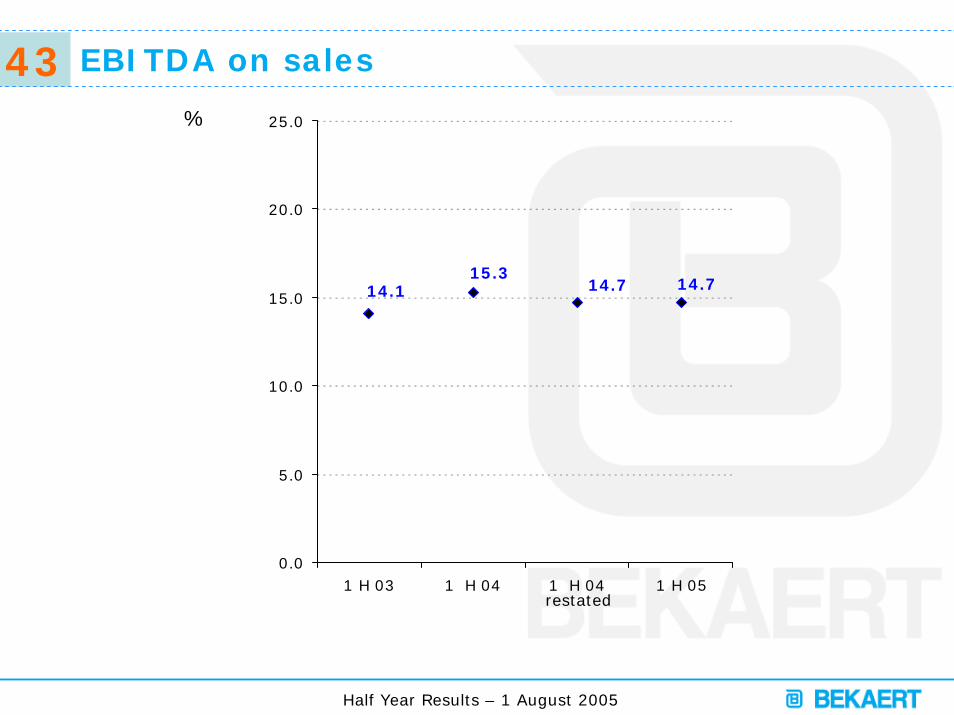
EBITDA on sales
%
14.714.714.115.3
0.0
5.0
10.0
15.0
20.0
25.0
1 H 03 1 H 04 1 H 04 1 H 05restated
44
Half Year Results – 1 August 2005
Content
Highlights
Sales
Segment reporting• Advanced wire products• Advanced materials• Advanced coatings
Profitability
Balance sheet
Cash flow
Outlook
45
Half Year Results – 1 August 2005
Outlook
Challenging second half ahead:
Slowdown in incoming orders, due to weakening of economicenvironment
Sustainted uncertainty in raw materials’ markets