Embed Size (px)
Citation preview


HALF YEAR REPORTFOR THE SIX MONTH PERIOD ENDED 30 JUNE 2017

2
Hal
f Yea
r re
port
Jan
uar
Y - J
un
e 20
17

3
Board of Directors Mr. F. Garcia Chairman Mr. Muhammad Qayyum Chief Executive Mr. Michael Middleton Director Mr. Cesar Panduro Director Mr. Muhammad Ali Malik Director Mr. Muhammad Maqbool Director Mr. Ijaz Ahmad Chaudhry Director Mr. Shahid Anwar (Nominee of NIT) Director Mr. Syed Haroon Rashid (Nominee of NIT) Director Audit Committee Bankers
Mr. Muhammad Maqbool Chairman Habib Bank Limited Mr. Ijaz Ahmad Chaudhry Member Habib Metropolitan Bank Limited Mr. Michael Middleton Member MCB Bank Limited Bank Al Habib Limited Human Resource and Remuneration Committee National Bank of Pakistan Limited United Bank Limited Mr. Ijaz Ahmad Chaudhry Chairman Mr. Muhammad Qayyum Member Mr. Muhammad Maqbool Member Chief Financial Officer (CFO) Mr. Cesar Panduro Company Secretary Registered Office Mr. Amjad Farooq Batapur, G. T. Road, Auditors P.O. Batapur, Lahore. EY Ford Rhodes Share Registrar Chartered Accountants 96 B-1, 4th Floor Pace Mall Building, Corplink (Pvt.) Ltd. M.M. Alam Road, Gulberg II, Wings Arcade, 1-K Commercial Area, Lahore. Model Town, Lahore. Legal Advisor Factories Surridge & Beecheno Batapur, 60, Shahrah-e-Quaid-e-Azam, G. T. Road, Ghulam Rasool Building, P.O. Batapur, Lahore. Lahore. Maraka, Stock Exchange Listing 26 - Km, Multan Road, Lahore. Bata Pakistan Limited is listed on Paksitan Stock Exchange. Liaison Office The Company’s shares are quoted in leading 138 C-II Commercial Area, Newspapers under “Leather and Tanneries” sector. P.E.C.H.S., Tariq Road, Karachi.
CORPORATE INFORMATION

Hal
f Yea
r re
port
Jan
uar
Y - J
un
e 20
17
4
It is my pleasure to present the un-audited Condensed Financial Information and brief review of the Company’s operations
for the 2nd Quarter ended 30 June 2017.
The Company’s turnover in the period under review was Rs. 7.829 billion as compared to Rs. 7.424 billion for the corresponding
period of last year showing a growth of 5%. This is as a result of increase in margins, profit after tax increased from Rs. 626.7
million to Rs. 707.3 million and earnings per share increased from Rs. 82.89 to Rs. 93.56.
Although non-retail division continue under stress during the period but retail division showed a good growth and was able
to achieve 16% increase in turnover with respect to corresponding period. Our focus as a part of our strategy will remain on
expansion of our retail chain and close non-profitable stores which are under minimum benchmark.
During the period under review, our manufacturing units at Batapur and Maraka were fully loaded to meet the demand for
popular items. We are continually making investment in new moulds, the majority of which received very good response in
the market.
The Company continued its Corporate Social Responsibilities activities during the period under review and planted more than
1,000 trees in both the factories. Arranged free Hepatitis screening camps in Government Girls High School Batapur and Bata
Residential Colony No. 3 where our medical team screened more than 250 children, their parents and local community against
Hepatitis B and C. In coordination with Pakistan Army, distributed 200 school bags, 1,000 sets of stationery and 1,500 pairs
of shoes amongst poor and needy children of District Awaran (Balochistan). During the period, 12 trainees were awarded
certificates & stipend on successful completion of three months Upper Stitching Training in Industrial School Batapur. The
Company is also investing a considerable time and money on human resource and training of employees has always been
considered as an investment for the future with the objective to provide them with safe and healthy work place.
We remain confident as regards to our prospects for the remaining year, despite the highly competitive market environment
especially in our non-retail division. We look forward to continue having support from all our stakeholders to achieve the
objectives for the year 2017.
On behalf of the Board
Batapur: (MUHAMMAD QAYYUM)
Lahore: 24 August 2017 Chief Executive
DIRECTORS’ REVIEW

5

Hal
f Yea
r re
port
Jan
uar
Y - J
un
e 20
17
6
Introduction
We have reviewed the accompanying condensed interim balance sheet of Bata Pakistan Limited as at 30 June 2017
and the related condensed interim statement of comprehensive income, condensed interim cash flow statement, condensed
interim statement of changes in equity and notes to the condensed interim financial information for the six-month period
then ended (here-in-after referred to as the ‘interim financial information’). Management is responsible for the preparation
and presentation of this interim financial information in the accordance with approved accounting standards as applicable
in Pakistan for interim financial reporting. Our responsibility is to express a conclusion on this interim financial information
based on our review.
Scope of review
We conducted our review in accordance with International Standard on Review Engagements 2410, “Review of Interim
Financial Information Performed by the Independent Auditor of the Entity”. A review of interim financial information consists
of making inquiries, primarily of persons responsible for financial and accounting matters, and applying analytical and other
review procedures. A review is substantially less in scope than an audit conducted in accordance with International Standards
on Auditing and consequently does not enable us to obtain assurance that we would become aware of all significant matters
that might be identified in an audit. Accordingly, we do not express an audit opinion.
Conclusion
Based on our review, nothing has come to our attention that causes us to believe that the accompanying interim financial
information is not prepared, in all material respects, in accordance with approved accounting standards as applicable in
Pakistan for interim financial reporting.
EY FORD RHODES
Chartered Accountants
Engagement Partner: Farooq Hameed
Lahore: 24 August 2017
AUDITORS REPORT TO MEMBERS ON REVIEW OF CONDENSED INTERIM FINANCIAL INFORMATION

7
(UN - AUDITED) (AUDITED) 31 June 31 December Note 2017 2016
(Rupees in ‘000) NON-CURRENT ASSETS Property, plant and equipment 5 1,443,145 1,420,757 Intangible assets 2,405 2,079 Long term investments 6 45,011 45,000 Long term deposits and prepayments 41,788 31,588
1,532,349 1,499,424 CURRENT ASSETS Stores and spare parts 4,286 248 Stock in trade 7 4,163,011 2,901,903 Trade debts - unsecured 1,861,877 1,336,061 Advances - unsecured 308,914 24,752 Deposits and short term prepayments 205,204 51,871 Other receivables 272,295 602,969 Interest accrued 230 1,790 Tax refunds due from Government 8 508,597 508,597 Short term investment – 1,600,000 Cash and bank balances 9 993,561 556,941
8,317,975 7,585,132 TOTAL ASSETS 9,850,324 9,084,556 EQUITY AND LIABILITIES
Authorized share capital 10,000,000 ordinary shares of Rs. 10 each 100,000 100,000
Issued, subscribed and paid up capital 75,600 75,600 Reserves Capital reserve 483 483 Revenue reserves 6,840,255 6,586,511
6,840,738 6,586,994
TOTAL EQUITY 6,916,338 6,662,594
NON-CURRENT LIABILITIES Long term deposits 45,011 45,000 Deferred liability - employee benefits 10 72,713 72,150 Deferred taxation 22,333 40,480
140,057 157,630 CURRENT LIABILITIES Trade and other payables 2,473,041 1,656,060 Short term borrowings 11 – – Provision for taxation 320,888 608,272
2,793,929 2,264,332 CONTINGENCIES AND COMMITMENTS 12 TOTAL EQUITY AND LIABILITIES 9,850,324 9,084,556 The annexed notes from 1 to 21 form an integral part of this interim financial information.
Chief Executive Director Chief Financial Officer
CONDENSED INTERIM BALANCE SHEET AS AT 30 JUNE 2017

Hal
f Yea
r re
port
Jan
uar
Y - J
un
e 20
17
8
Six month period ended Three month period ended
30 June 30 June 30 June 30 June Note 2017 2016 2017 2016
(Rupees in ‘000)
NET SALES 13 7,828,929 7,424,336 4,765,416 4,201,141COST OF SALES 14 4,539,133 4,450,092 2,777,126 2,532,695
GROSS PROFIT 3,289,796 2,974,244 1,988,290 1,668,446 Distribution Cost 1,674,417 1,481,540 935,439 797,398 Administrative Expenses 486,312 477,030 251,824 249,130 Other expenses 85,273 76,139 57,265 43,869
2,246,002 2,034,709 1,244,528 1,090,397 OTHER INCOME 15 47,073 58,877 16,001 29,666 OPERATING PROFIT 1,090,867 998,412 759,763 607,715 FINANCE COST 16 21,444 18,621 11,044 9,185 PROFIT BEFORE TAXATION 1,069,423 979,791 748,719 598,530 PROVISION FOR TAXATION Current 380,226 369,621 274,036 250,357 Deferred (18,147) (16,499) (9,974) (11,342)
362,079 353,122 264,062 239,015
PROFIT AFTER TAXATION 707,344 626,669 484,657 359,515 Other comprehensive income – – – – TOTAL COMPREHENSIVE INCOME 707,344 626,669 484,657 359,515 EARNINGS PER SHARE - BASIC AND DILUTED 19 Rs.93.56 Rs.82.89 Rs.64.11 Rs.47.55
The annexed notes from 1 to 21 form an integral part of this interim financial information.
CONDENSED INTERIM STATEMENT OF COMPREHENSIVE INCOME - UNAUDITEDFOR THE SIX MONTH PERIOD ENDED 30 JUNE 2017
Chief Executive Director Chief Financial Officer
9
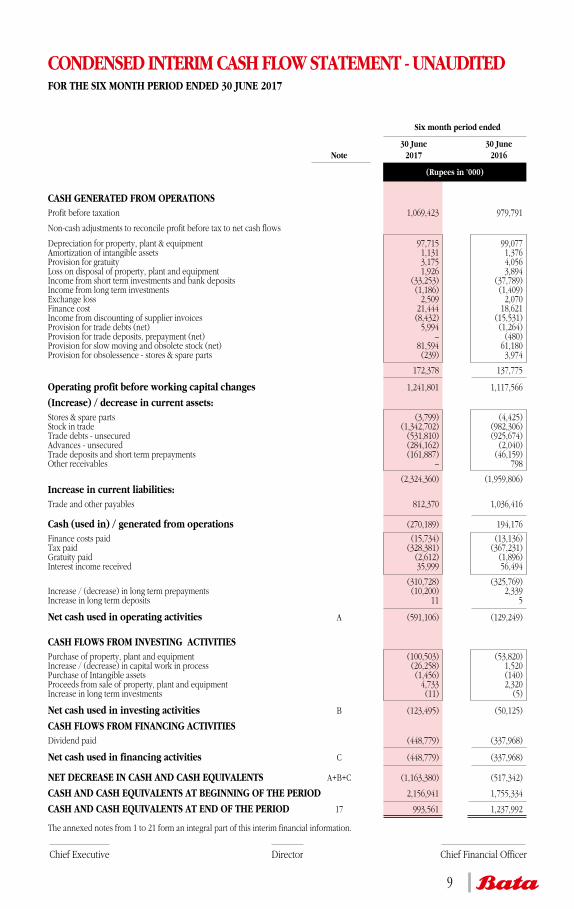
CONDENSED INTERIM CASH FLOW STATEMENT - UNAUDITEDFOR THE SIX MONTH PERIOD ENDED 30 JUNE 2017
Six month period ended
30 June 30 June Note 2017 2016
(Rupees in ’000)
CASH GENERATED FROM OPERATIONSProfit before taxation 1,069,423 979,791
Non-cash adjustments to reconcile profit before tax to net cash flows
Depreciation for property, plant & equipment 97,715 99,077 Amortization of intangible assets 1,131 1,376 Provision for gratuity 3,175 4,056 Loss on disposal of property, plant and equipment 1,926 3,894 Income from short term investments and bank deposits (33,253) (37,789)Income from long term investments (1,186) (1,409)Exchange loss 2,509 2,070 Finance cost 21,444 18,621 Income from discounting of supplier invoices (8,432) (15,531)Provision for trade debts (net) 5,994 (1,264)Provision for trade deposits, prepayment (net) – (480) Provision for slow moving and obsolete stock (net) 81,594 61,180 Provision for obsolessence - stores & spare parts (239) 3,974
172,378 137,775
Operating profit before working capital changes 1,241,801 1,117,566
(Increase) / decrease in current assets: Stores & spare parts (3,799) (4,425)Stock in trade (1,342,702) (982,306)Trade debts - unsecured (531,810) (925,674)Advances - unsecured (284,162) (2,040) Trade deposits and short term prepayments (161,887) (46,159)Other receivables – 798
(2,324,360) (1,959,806)Increase in current liabilities: Trade and other payables 812,370 1,036,416 Cash (used in) / generated from operations (270,189) 194,176
Finance costs paid (15,734) (13,136)Tax paid (328,381) (367,231)Gratuity paid (2,612) (1,896)Interest income received 35,999 56,494
(310,728) (325,769)Increase / (decrease) in long term prepayments (10,200) 2,339 Increase in long term deposits 11 5
Net cash used in operating activities A (591,106) (129,249)
CASH FLOWS FROM INVESTING ACTIVITIES
Purchase of property, plant and equipment (100,503) (53,820)Increase / (decrease) in capital work in process (26,258) 1,520 Purchase of Intangible assets (1,456) (140)Proceeds from sale of property, plant and equipment 4,733 2,320 Increase in long term investments (11) (5)
Net cash used in investing activities B (123,495) (50,125)
CASH FLOWS FROM FINANCING ACTIVITIES
Dividend paid (448,779) (337,968)
Net cash used in financing activities C (448,779) (337,968) NET DECREASE IN CASH AND CASH EQUIVALENTS A+B+C (1,163,380) (517,342)
CASH AND CASH EQUIVALENTS AT BEGINNING OF THE PERIOD 2,156,941 1,755,334
CASH AND CASH EQUIVALENTS AT END OF THE PERIOD 17 993,561 1,237,992 The annexed notes from 1 to 21 form an integral part of this interim financial information.
Chief Executive Director Chief Financial Officer

Hal
f Yea
r re
port
Jan
uar
Y - J
un
e 20
17
10
Share Capital General Unappropriated Total capital reserve reserve profits
Rupees in ‘000’
Balance as at 01 January 2016 75,600 483 4,922,000 1,053,109 6,051,192 Final dividend for 2015 at the rate of Rs. 45 per share – – – (340,200) (340,200) Transfer to general reserve for 2015 – – 712,000 (712,000) – Total comprehensive income for the six month period ended 30 June 2016 – – – 626,669 626,669 Balance as at 30 June 2016 75,600 483 5,634,000 627,578 6,337,661 Balance as at 01 January 2017 75,600 483 5,634,000 952,511 6,662,594 Final dividend for 2016 at the rate of Rs. 60 per share – – – (453,600) (453,600) Transfer to general reserve for 2016 – – 498,000 (498,000) – Total comprehensive income for the six month period ended 30 June 2017 – – – 707,344 707,344 Balance as at 30 June 2017 75,600 483 6,132,000 708,255 6,916,338 The annexed notes from 1 to 21 form an integral part of this interim financial information.
CONDENSED INTERIM STATEMENT OF CHANGES IN EQUITY - UNAUDITEDFOR THE SIX MONTH PERIOD ENDED 30 JUNE 2017
Chief Executive Director Chief Financial Officer

11
NOTES TO THE CONDENSED INTERIM FINANCIAL INFORMATION - UNAUDITEDFOR THE SIX MONTH PERIOD ENDED 30 JUNE 2017
1 LEGAL STATUS AND OPERATIONS Bata Pakistan Limited (the Company) was incorporated in Pakistan as a public limited company and its shares are
quoted on Pakistan Stock Exchange. The registered office of the Company is situated at Batapur, Lahore. The principal activity of the Company is manufacturing and sale of footwear of all kinds along with sale of accessories and hosiery items. The parent company of Bata Pakistan Limited is Bafin B.V. (Nederland), whereas the ultimate parent is Compass Limited, Bermuda.
2 STATEMENT OF COMPLIANCE These condensed interim financial information of the Company for the six month period ended 30 June 2017 have been
prepared in accordance with the requirements of the International Accounting Standard 34 - Interim Financial Reporting and provisions of and directives issued under the Companies Ordinance, 1984 (repealed-note 2.1). In case where requirements differ, the provisions of or directives issued under the Companies Ordinance, 1984 have been followed.
2.1 The Companies Ordinance ,1984 has been repealed after enactment of Companies Act,2017. However as allowed by the SECP vide its Circular No. 17 dated July 20,2017 read with the related press release this condensed interim financial information has been prepared in accordance with the provisions of the repealed Companies Ordinance, 1984.
3 BASIS OF PRESENTATION AND MEASUREMENT This condensed interim financial information of the Company for the six month period ended 30 June 2017 are
unaudited but subject to limited scope review by the independent auditors of the Company. It should be read in conjunction with the financial statements of the Company for the year ended 31 December 2016.
The figures of the condensed interim profit and loss account for the three month period ended 30 June 2017 and 2016 and the respective notes forming part thereof have not been reviewed by the auditors of the Company as they have reviewed the cumulative figures for the six month period ended 30 June 2017 and 2016.
The financial information has been prepared under the historic cost convention. The financial information is prepared in Pak Rupees, which is the functional currency of the Company. Figures have been rounded off to the nearest thousand rupee unless otherwise specified.
4 SIGNIFICANT ACCOUNTING POLICIES The accounting policies and method of computation adopted in the preparation of this condensed interim financial
information are the same as those applied in preparation of the financial statements for the year ended 31 December, 2016 except as described below:
New and amended standards and interpretations
The Company has adopted the following revised standard and amendments which became effective for the current period:
IAS 7 – Disclosure Initiative-Amendments to IAS 7
IAS 12 – Recognition of deferred Tax Assets for Unrealized Losses-Amendments to IAS 12
IFRS 12 – Disclosure of Interests in Other Entities Clarification of the scope of the disclosure requirements in IFRS 12
Improvements to Accounting Standards Issued by the IASB
IFRS 1 – First-time Adoption of International Financial Reporting Standards
IAS 28 – Investments in Associates and Joint Ventures
The adoption of the above amendment and improvement to accounting standards did not have any material effect on the condensed interim financial information.

Hal
f Yea
r re
port
Jan
uar
Y - J
un
e 20
17
12
NOTES TO THE CONDENSED INTERIM FINANCIAL INFORMATION - UNAUDITEDFOR THE SIX MONTH PERIOD ENDED 30 JUNE 2017
5 ACQUISITION AND DISPOSAL OF PROPERTY, PLANT AND EQUIPMENT
(UN - AUDITED)
30 June 30 June 30 June 30 June 2017 2017 2016 2016
Additions Disposal (cost) Additions Disposal (cost)
(Rupees in ‘000)
Buildings - Factory 2,117 – 1,018 – - Others – – – – Plant & Manchinery 1,724 10,494 10,244 10,024 Boiler – 1,402 – – Office Equipment 153 – 150 – Furniture, Fixture and Fittings 92,476 14,071 33,902 14,757 Computers 4,033 148 8,506 4,712
100,503 26,115 53,820 29,493
(UN - AUDITED) (AUDITED)
30 JUNE 31 December Note 2017 2016
(Rupees in ’000)
6 LONG TERM INVESTMENTS
Held to maturity at cost
PLS Term Deposit Receipts 6.1 45,011 45,000
6.1 These deposits are earmarked against the balances due to employees held as securities and personal accounts
maintained with commercial banks undertaking conventional banking services. These carry mark-up at the rate of 6.00% (2016: 5.50%) per annum.
7 STOCK IN TRADE This represents net amount after adjustment for provision against slow moving and obsolete stock amounting to Rs. 81,594 (‘000) (2016: Rs. 22,530 (‘000))
8 TAX REFUNDS DUE FROM GOVERNMENT This represents sales tax paid on raw materials used in zero-rated taxable footwear for which refund claims have been lodged with the Sales Tax Department.
13
NOTES TO THE CONDENSED INTERIM FINANCIAL INFORMATION - UNAUDITEDFOR THE SIX MONTH PERIOD ENDED 30 JUNE 2017
(UN - AUDITED) (AUDITED)
30 JUNE 31 December Note 2017 2016
(Rupees in ’000)
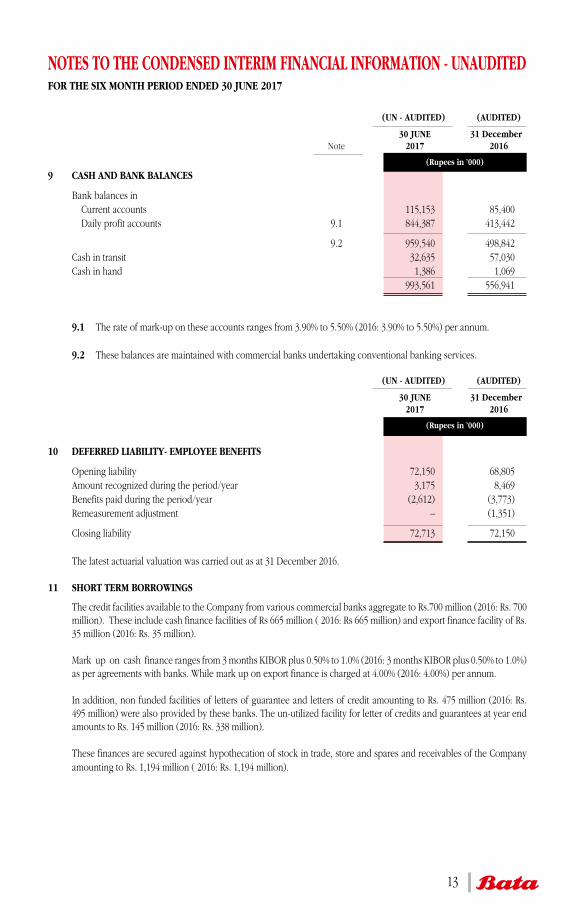
9 CASH AND BANK BALANCES
Bank balances in Current accounts 115,153 85,400 Daily profit accounts 9.1 844,387 413,442
9.2 959,540 498,842 Cash in transit 32,635 57,030 Cash in hand 1,386 1,069 993,561 556,941
9.1 The rate of mark-up on these accounts ranges from 3.90% to 5.50% (2016: 3.90% to 5.50%) per annum.
9.2 These balances are maintained with commercial banks undertaking conventional banking services. (UN - AUDITED) (AUDITED)
30 JUNE 31 December 2017 2016
(Rupees in ’000)
10 DEFERRED LIABILITY- EMPLOYEE BENEFITS
Opening liability 72,150 68,805 Amount recognized during the period/year 3,175 8,469 Benefits paid during the period/year (2,612) (3,773) Remeasurement adjustment – (1,351)
Closing liability 72,713 72,150 The latest actuarial valuation was carried out as at 31 December 2016. 11 SHORT TERM BORROWINGS
The credit facilities available to the Company from various commercial banks aggregate to Rs.700 million (2016: Rs. 700 million). These include cash finance facilities of Rs 665 million ( 2016: Rs 665 million) and export finance facility of Rs. 35 million (2016: Rs. 35 million).
Mark up on cash finance ranges from 3 months KIBOR plus 0.50% to 1.0% (2016: 3 months KIBOR plus 0.50% to 1.0%)
as per agreements with banks. While mark up on export finance is charged at 4.00% (2016: 4.00%) per annum. In addition, non funded facilities of letters of guarantee and letters of credit amounting to Rs. 475 million (2016: Rs.
495 million) were also provided by these banks. The un-utilized facility for letter of credits and guarantees at year end amounts to Rs. 145 million (2016: Rs. 338 million).
These finances are secured against hypothecation of stock in trade, store and spares and receivables of the Company
amounting to Rs. 1,194 million ( 2016: Rs. 1,194 million).

Hal
f Yea
r re
port
Jan
uar
Y - J
un
e 20
17
14
(UN - AUDITED) (AUDITED)
30 JUNE 31 December 2017 2016
(Rupees in ’000)
12 CONTINGENCIES AND COMMITMENTS
12.1 The Company is contingently liable for:
Counter Guarantees given to banks 16,068 16,068 Indemnity Bonds given to Custom Authorities 88,730 46,209 Claims not acknowledged as debts - under appeal 13,053 13,053 Order by sales tax department 138,851 138,851 Order by sales tax department - under appeal 201,252 201,252 Order by sales tax department - under appeal 237,370 237,370 Order by sales tax department - under appeal 25,820 25,820 Order by income tax department - under appeal 954,859 954,859 Order by income tax department - under appeal 1,027,460 1,027,460 Order by sales tax department - under appeal 80,000 80,000 Order by sales tax department - under appeal 52,100 52,100 Order by sales tax department - under appeal 8,225 8,225 Show cause notice by sales tax department 85,000 85,000 Order by income tax department 363,683 363,683 Order by sales tax department - under appeal 60,732 60,732
3,353,203 3,310,682
There is no significant change in contigencies since the date of preceding published annual financial statements. 12.2 Commitments
12.2.1 The Company has entered into rent agreements for retail shops. There are no restrictions placed upon the Company by entering into these agreements. Future minimum lease payable under these agreements are as followos:
(UN - AUDITED) (AUDITED)
30 JUNE 31 December 2017 2016
(Rupees in ’000)
With in one year 1,173,637 1,078,092 After one year but not more than five years 4,375,385 3,546,688 More than five years 1,744,802 2,223,580
7,293,824 6,848,360 12.2.2 Commitments in respect of: - Capital expenditure 30,584 3,183 - Letters of credit and bank contracts 224,872 383,604
255,456 386,787
NOTES TO THE CONDENSED INTERIM FINANCIAL INFORMATION - UNAUDITEDFOR THE SIX MONTH PERIOD ENDED 30 JUNE 2017
15
NOTES TO THE CONDENSED INTERIM FINANCIAL INFORMATION - UNAUDITEDFOR THE SIX MONTH PERIOD ENDED 30 JUNE 2017
Six month period ended Three month period ended
30 June 30 June 30 June 30 June 2017 2016 2017 2016
(Rupees in ‘000)
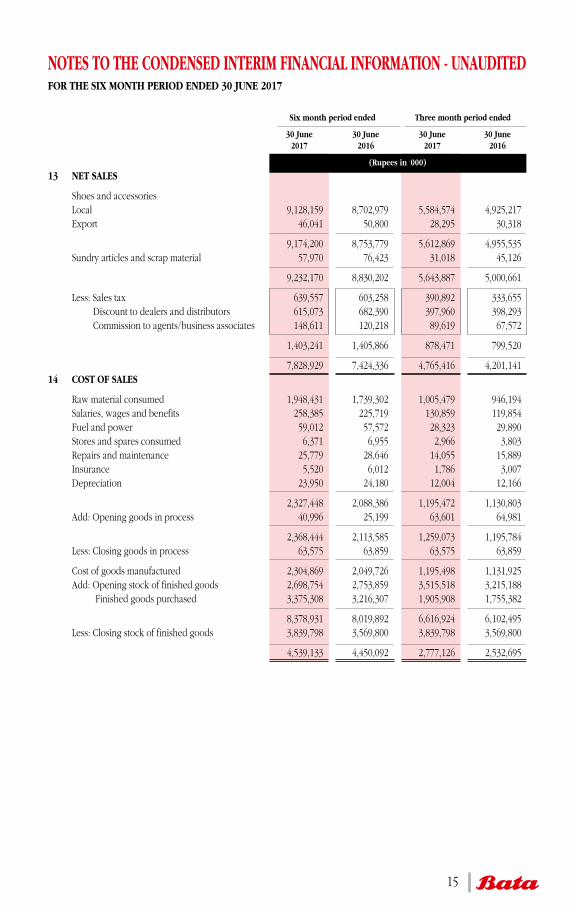
13 NET SALES
Shoes and accessories Local 9,128,159 8,702,979 5,584,574 4,925,217 Export 46,041 50,800 28,295 30,318
9,174,200 8,753,779 5,612,869 4,955,535 Sundry articles and scrap material 57,970 76,423 31,018 45,126
9,232,170 8,830,202 5,643,887 5,000,661
Less: Sales tax 639,557 603,258 390,892 333,655 Discount to dealers and distributors 615,073 682,390 397,960 398,293 Commission to agents/business associates 148,611 120,218 89,619 67,572
1,403,241 1,405,866 878,471 799,520
7,828,929 7,424,336 4,765,416 4,201,141 14 COST OF SALES
Raw material consumed 1,948,431 1,739,302 1,005,479 946,194 Salaries, wages and benefits 258,385 225,719 130,859 119,854 Fuel and power 59,012 57,572 28,323 29,890 Stores and spares consumed 6,371 6,955 2,966 3,803 Repairs and maintenance 25,779 28,646 14,055 15,889 Insurance 5,520 6,012 1,786 3,007 Depreciation 23,950 24,180 12,004 12,166
2,327,448 2,088,386 1,195,472 1,130,803 Add: Opening goods in process 40,996 25,199 63,601 64,981
2,368,444 2,113,585 1,259,073 1,195,784 Less: Closing goods in process 63,575 63,859 63,575 63,859
Cost of goods manufactured 2,304,869 2,049,726 1,195,498 1,131,925 Add: Opening stock of finished goods 2,698,754 2,753,859 3,515,518 3,215,188 Finished goods purchased 3,375,308 3,216,307 1,905,908 1,755,382
8,378,931 8,019,892 6,616,924 6,102,495 Less: Closing stock of finished goods 3,839,798 3,569,800 3,839,798 3,569,800
4,539,133 4,450,092 2,777,126 2,532,695

Hal
f Yea
r re
port
Jan
uar
Y - J
un
e 20
17
16
NOTES TO THE CONDENSED INTERIM FINANCIAL INFORMATION - UNAUDITEDFOR THE SIX MONTH PERIOD ENDED 30 JUNE 2017
(UN - AUDITED) (UN - AUDITED)
30 JUNE 30 JUNE Note 2017 2016
(Rupees in ’000)
15 OTHER INCOME
Income from financial assets Profit on long term investments 1,186 1,409 Profit on short term investment 26,607 29,992 Profit on bank deposits 6,646 7,797
15.1 34,439 39,198 Income from non - financial assets Rental Income 4,202 4,148 Income from financial liability Income from discounting of supplier invoices 8,432 15,531
47,073 58,877
15.1 This represents profit earned on funds maintained with commercial banks undertaking conventional banking services.
(UN - AUDITED) (UN - AUDITED)
30 JUNE 30 JUNE Note 2017 2016
(Rupees in ’000)
16 FINANCE COSTS
Interest / mark-up on: Workers’ profit participation fund 2,779 1,495 Employees / agents’ securities and personal accounts 6 2,931 3,989
5,710 5,484 Bank charges and commission 15,734 13,137
21,444 18,621 17 CASH AND CASH EQUIVALENTS
Bank balances in - Current accounts 115,153 83,767 - Daily profit accounts 844,387 537,949 Short term investment – 480,000 Cash in transit 32,635 134,346 Cash in hand 1,386 1,930
993,561 1,237,992

17
NOTES TO THE CONDENSED INTERIM FINANCIAL INFORMATION - UNAUDITEDFOR THE SIX MONTH PERIOD ENDED 30 JUNE 2017
18 TRANSACTIONS WITH RELATED PARTIES
The related parties comprise of parent company, related group companies, provident fund trusts, directors and key management personnel. Transactions with related parties during the period are as follows:
(UN - AUDITED)
Six month period ended Three month period ended
30 June 30 June 30 June 30 June 2017 2016 2017 2016
Relationship with Nature of transactions (Rupees in ‘000)
the Company
Common Control Companies Purchase of goods and services 575,113 548,491 339,451 255,281 Sale of goods and services 908 2,475 516 918 Trade mark license fee 196,485 187,085 119,494 105,902 Management service fee and IT charges 84,800 83,317 38,424 36,001 Dividend paid 307,037 255,864 307,037 255,864 Staff Retirement Benefits Contribution to provident fund trusts 31,012 28,334 18,277 16,349 Staff Retirement Gratuity paid 2,613 1,896 786 211 Benefits Key management Remuneration 48,294 52,534 26,129 25,865 personnel The Company continues to have a policy whereby all transactions with related parties and common
control companies are entered into at arm’s length price on the same terms and conditions as third party transactions using comparable uncontrolled price methods.
(UN - AUDITED)
Six month period ended Three month period ended
30 June 30 June 30 June 30 June 2017 2016 2017 2016
19 EARNINGS PER SHARE - BASIC
AND DILUTED Profit after taxation attributable to ordinary share holders (Rupees. in ‘000) 707,344 626,669 485,657 359,515 Weighted average number of ordinary shares - Number (in ‘000) 7,560 7,560 7,560 7,560 Earnings per share - Basic (Rs.) 93.56 82.89 64.11 47.55
19.1 No figure for diluted earnings per share has been disclosed as the Company has not issued any instrument which would have a dilutive impact on earnings per share, when exercised.

Hal
f Yea
r re
port
Jan
uar
Y - J
un
e 20
17
18
NOTES TO THE CONDENSED INTERIM FINANCIAL INFORMATION - UNAUDITEDFOR THE SIX MONTH PERIOD ENDED 30 JUNE 2017
20.
SEG
MEN
T RE
PORT
ING
(UN
- AUD
ITED
)
Six
mon
th p
erio
d en
ded
Re
tail
Who
lesa
le
Expo
rt Ot
hers
To
tal
30
June
2017
30
June
2016
30
June
2017
30
June
2016
30
June
2017
30
June
2016
30
June
2017
30
June
2016
30
June
2017
30
June
2016
Ru
pees
in (‘
000)
N
et sa
les
5,5
26,8
18
4,7
79,0
20
2,1
99,8
62
2,5
22,7
50
46,
041
5
0,80
0
56,
208
7
1,76
6
7,8
28,9
29
7,4
24,3
36
In
ter -
segm
ent s
ales
–
–
–
– –
– –
– –
–
To
tal S
ales
5
,526
,818
4
,779
,020
2
,199
,862
2
,522
,750
4
6,04
1
50,
800
5
6,20
8
71,
766
7
,828
,929
7
,424
,336
Se
gmen
t res
ult
befo
re u
nallo
cate
d ex
pens
es
1,3
13,0
02
1,0
24,8
44
375
,008
5
75,2
17
5,1
30
7,2
65
10,
239
1
3,25
9
1,7
03,3
79
1,6
20,5
85
U
nallo
cate
d op
erat
ing
expe
nses
5
74,3
12
604
,911
O
ther
exp
ense
s
8
5,27
3
76,
139
O
ther
inco
me
47,
073
5
8,87
7
O
pera
ting
prof
it
1
,090
,867
9
98,4
12
Fi
nanc
e co
st
2
1,44
4
18,
621
Pr
ofit
befo
re ta
xatio
n
1
,069
,423
9
79,7
91
Ta
xatio
n
3
62,0
79
353
,122
Pr
ofit
afte
r tax
atio
n
7
07,3
44
626
,669
(U
N - A
UDIT
ED)
Th
ree m
onth
per
iod
ende
d
Reta
il W
hole
sale
Ex
port
Othe
rs
Tota
l
30
June
2017
30
June
2016
30
June
2017
30
June
2016
30
June
2017
30
June
2016
30
June
2017
30
June
2016
30
June
2017
30
June
2016
Ru
pees
in (‘
000)
Net
sale
s
3,3
14,8
96
2,6
71,6
38
1,3
91,7
77
1,4
56,7
16
28,
295
3
0,31
8
30,
448
4
2,46
9
4,7
65,4
16
4,2
01,1
41
Inte
r - se
gmen
t sal
es
–
–
– –
– –
– –
– –
Tota
l Sal
es
3,
314,
896
2
,671
,638
1
,391
,777
1
,456
,716
2
8,29
5
30,
318
3
0,44
8
42,
469
4
,765
,416
4
,201
,141
Segm
ent r
esul
t be
fore
una
lloca
ted
expe
nses
8
58,4
97
617
,446
2
44,6
74
329
,049
2
,913
4
,146
4
,121
5
,930
1
,110
,205
9
56,5
71
Una
lloca
ted
oper
atin
g ex
pens
es
309
,178
3
34,6
53
Oth
er e
xpen
ses
57,
265
4
3,86
9
Oth
er in
com
e
1
6,00
1
29,
666
Ope
ratin
g pr
ofit
759
,763
6
07,7
15
Fina
nce
cost
11,
044
9
,185
Prof
it be
fore
taxa
tion
748
,719
5
98,5
30
Taxa
tion
2
64,0
62
239
,015
Prof
it af
ter t
axat
ion
484
,657
3
59,5
15

19
NOTES TO THE CONDENSED INTERIM FINANCIAL INFORMATION - UNAUDITEDFOR THE SIX MONTH PERIOD ENDED 30 JUNE 2017
(UN-AUDITED) (AUDITED) (UN-AUDITED) (AUDITED) Segment assets Segment liabilities
30 June 31 December 30 June 31 December 2017 2016 2017 2016
(Rupees in ‘000)
20.1 SEGMENT ASSETS AND LIABILITIES
Retail 3,815,270 2,992,231 104,257 98,078 Wholesale 2,916,655 2,049,961 26,017 24,977 Export 9,703 8,340 141 3,699 Unallocated 3,108,696 4,034,024 2,803,571 2,295,208
9,850,324 9,084,556 2,933,986 2,421,962 21 DATE OF AUTHORIZATION
This interim financial information was authorized for issue by the Board of Directors on 24th August, 2017.
Chief Executive Director Chief Financial Officer

Hal
f Yea
r re
port
Jan
uar
Y - J
un
e 20
17
20
NOTES

INVESTORS’ EDUCATIONIn compliance with the Securities and Exchange Commission of Pakistan’s SRO 924(1)/2015 dated September
9, 2015, Investors’ attention is invited to the following information message: