Embed Size (px)
Citation preview

Half year report at 30 June 2009
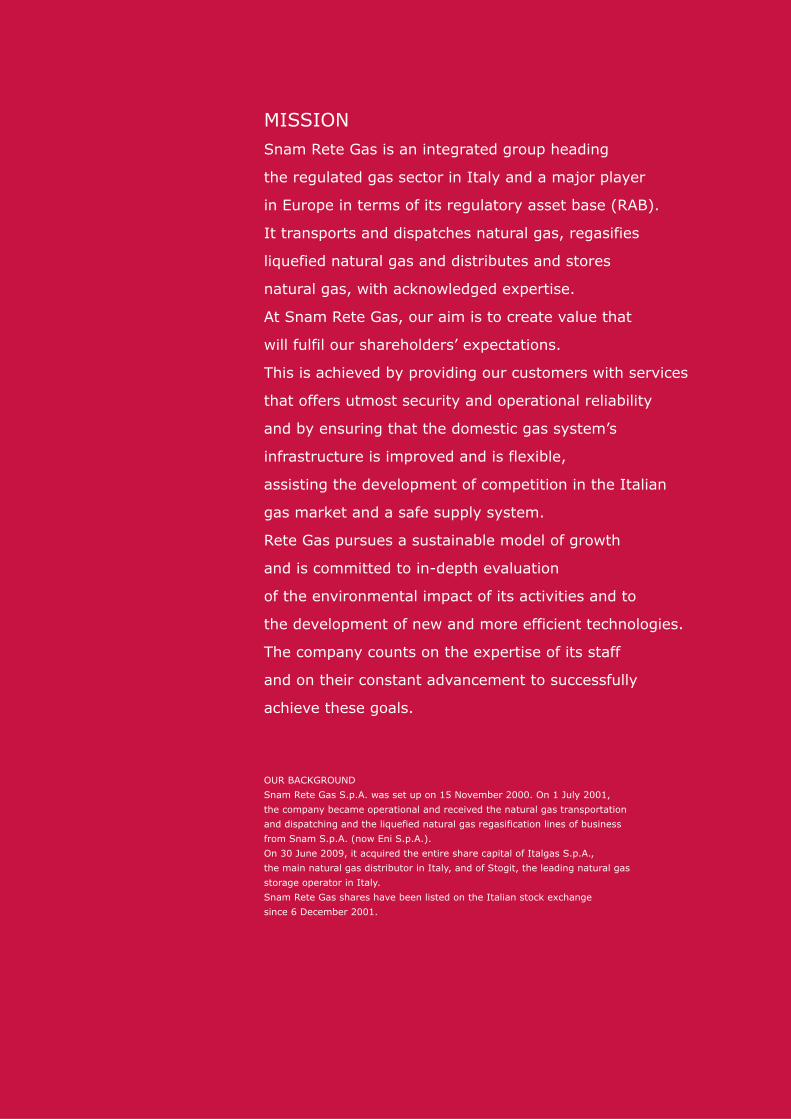
MISSIONSnam Rete Gas is an integrated group heading
the regulated gas sector in Italy and a major player
in Europe in terms of its regulatory asset base (RAB).
It transports and dispatches natural gas, regasifies
liquefied natural gas and distributes and stores
natural gas, with acknowledged expertise.
At Snam Rete Gas, our aim is to create value that
will fulfil our shareholders’ expectations.
This is achieved by providing our customers with services
that offers utmost security and operational reliability
and by ensuring that the domestic gas system’s
infrastructure is improved and is flexible,
assisting the development of competition in the Italian
gas market and a safe supply system.
Rete Gas pursues a sustainable model of growth
and is committed to in-depth evaluation
of the environmental impact of its activities and to
the development of new and more efficient technologies.
The company counts on the expertise of its staff
and on their constant advancement to successfully
achieve these goals.
OUR BACKGROUND
Snam Rete Gas S.p.A. was set up on 15 November 2000. On 1 July 2001,
the company became operational and received the natural gas transportation
and dispatching and the liquefied natural gas regasification lines of business
from Snam S.p.A. (now Eni S.p.A.).
On 30 June 2009, it acquired the entire share capital of Italgas S.p.A.,
the main natural gas distributor in Italy, and of Stogit, the leading natural gas
storage operator in Italy.
Snam Rete Gas shares have been listed on the Italian stock exchange
since 6 December 2001.
Half year reportat 30 June 2009

DisclaimerThis report includes forward-looking statements, especially in the section on the group’s outlook about future gas demand,investment plans and future performance. Such statements are, by their very nature, subject to risk and uncertainty as theydepend on the fact that certain events and developments will take place. The actual results may differ from those communi-cated due to different reasons, such as foreseeable trends in demand, offer and natural gas prices, general macro-economicconditions, the effect of new energy and environment legislation, the successful development and implementation of new tech-nologies, changes in the stakeholders’ expectations and other changes in business conditions.
Half year report at 30 June 2009 Directors’ report4 Acquisition of Italgas and Stogit7 Consolidation policies and scope9 Highlights
10 Key figures12 Operating review17 Financial review31 Other information35 Performance of the acquirees40 Business risk management and outlook42 Glossary
Condensed interim consolidated financial statements46 Condensed interim consolidated financial statements51 Basis of preparation and accounting policies54 Notes
77 Statement on the half year reportpursuant to article 154-bis of the Consolidated Finance Act
78 Independent auditors’ report
By Snam Rete Gas is meant Snam Rete Gas S.p.A. and the consolidated companies.
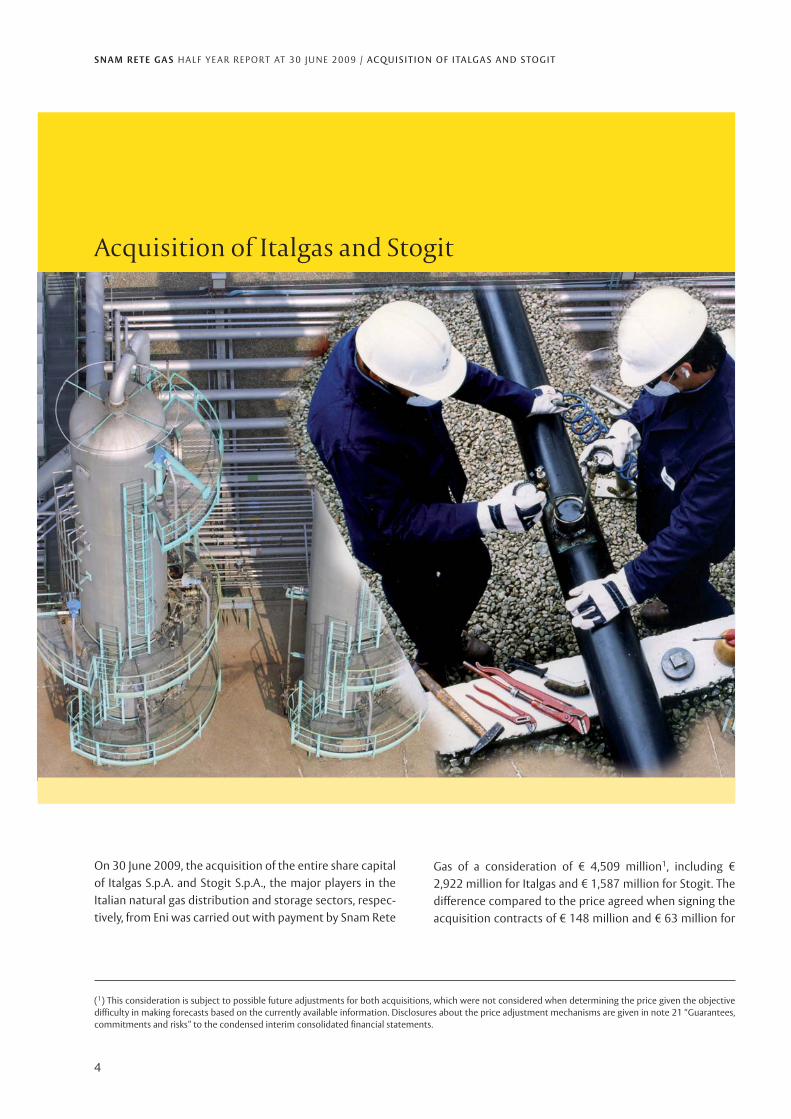
Gas of a consideration of € 4,509 million1, including €2,922 million for Italgas and € 1,587 million for Stogit. Thedifference compared to the price agreed when signing theacquisition contracts of € 148 million and € 63 million for
On 30 June 2009, the acquisition of the entire share capitalof Italgas S.p.A. and Stogit S.p.A., the major players in theItalian natural gas distribution and storage sectors, respec-tively, from Eni was carried out with payment by Snam Rete
4
S N A M R E T E G A S H A L F Y E A R R E P O RT AT 3 0 J U N E 2 0 0 9 / AC Q U I S I T I O N O F I TA LG A S A N D S TO G I T
Acquisition of Italgas and Stogit
(1) This consideration is subject to possible future adjustments for both acquisitions, which were not considered when determining the price given the objectivedifficulty in making forecasts based on the currently available information. Disclosures about the price adjustment mechanisms are given in note 21 “Guarantees,commitments and risks” to the condensed interim consolidated financial statements.

5
S N A M R E T E G A S H A L F Y E A R R E P O RT AT 3 0 J U N E 2 0 0 9 / AC Q U I S I T I O N O F I TA LG A S A N D S TO G I T
(2) Includes collection of the options not exercised during the offering period and auctioned on the stock exchange.(3) On 23 April 2009, Mediobanca, Morgan Stanley and UBS Investment Bank, as global coordinators and joint bookrunners, BNP PARIBAS, Credit Suisse, Merril LynchInternational and Unicredit Group (HVP), as co-bookrunners, agreed to subscribe the share capital increase for which the options had not been taken up at theclose of the stock exchange auction.(4) The predecessor values method entails recognition of amounts equal to those that would have been obtained had the acquired assets and liabilities assumedalways been included in the purchaser’s financial statements.
During the offering period, which commenced on 27 April2009 and closed on 15 May 2009, 1,756,673,448 optionswere exercised and, therefore, 1,610,283,994 new ordinarySnam Rete Gas shares were subscribed, equal to 99.75% ofthe shares offered. The unexercised 4,372,800 options, thatcould have been used to subscribe 4,008,400 new ordinaryshares, were auctioned by the company on the stockexchange, pursuant to article 2441.3 of the Italian Civil Codeduring the period from 21 to 27 May 2009. All the optionswere exercised3; therefore, 1,614,292,394 new ordinaryshares were subscribed, equal to 100% of the shares offered.
Effects of the acquisition on the half year reportThe 2009 half year report includes the effects of consolidat-ing Italgas and Stogit from the acquisition date, ie, from the
date of acquisition of title to the investments by Snam ReteGas S.p.A., ie 30 June 2009. Given the investment structure(Snam Rete Gas, Italgas and Stogit are under the commoncontrol of Eni S.p.A.), the transaction falls under the“Business combination of entities under common control” cat-egory, which is not covered by IFRS 3 “Business combinations”or other standards. The assets and liabilities deriving fromconsolidation of the acquirees, recognised in the consoli-dated financial statements of Snam Rete Gas using thepredecessor values method4, were recognised at the carry-ing amounts in the interim balance sheets at 30 June 2009approved by the acquirees’ directors. The acquisition ofItalgas and Stogit led to the consolidation of the followingassets and liabilities existing at the acquisition executiondate.
Number of ordinay shares offered 1,614,292,394
Exchange ratio no. 11 new shares for each 12 rights
Offering price per share (€) 2.15
Total amount of share capital increase (€) (*) 3,474,139,431
Number of shares composing Snam Rete Gas share capital 3,570,768,494
Snam Rete Gas share capital post offering 3,570,768,494(*) Includes collection of the options not exercised during the offering period and auctioned on the stock exchange.
Italgas and Stogit, respectively, is due to contractually pro-vided-for price adjustment mechanisms which consider,inter alia, the acquirees’ final net financial position, the2008 dividends distributed by Italgas and Stogit to EniS.p.A. and the financial expense accrued from the datewhen the transaction became effective for financial pur-poses (1 January 2009) to the date of its execution (30June 2009). The acquisitions were financed by means of ashare capital increase, issuing shares to be offered underoption to the Snam Rete Gas shareholders, of € 3,474 mil-lion, including the share premium2, and, for the remainder,by new loans disbursed by the ultimate parent Eni S.p.A..The share capital increase was approved by the board of
directors of Snam Rete Gas S.p.A. in its meeting of 23March 2009 when the board resolved to execute the proxy,given to it by the shareholders in their extraordinary meet-ing of 17 March 2009, to increase share capital in one ormore instalments for a maximum of € 3,500 million,including the premium, by issuing ordinary shares againstconsideration with a nominal amount of € 1 and regularrights to dividends to be offered to the Snam Rete Gasshareholders in proportion to their shares.In its meeting of 23 April 2009, the board of directorsapproved the final issue conditions for the share capitalincrease. The key figures for the offering of shares are setout below.
6
S N A M R E T E G A S H A L F Y E A R R E P O RT AT 3 0 J U N E 2 0 0 9 / AC Q U I S I T I O N O F I TA LG A S A N D S TO G I T
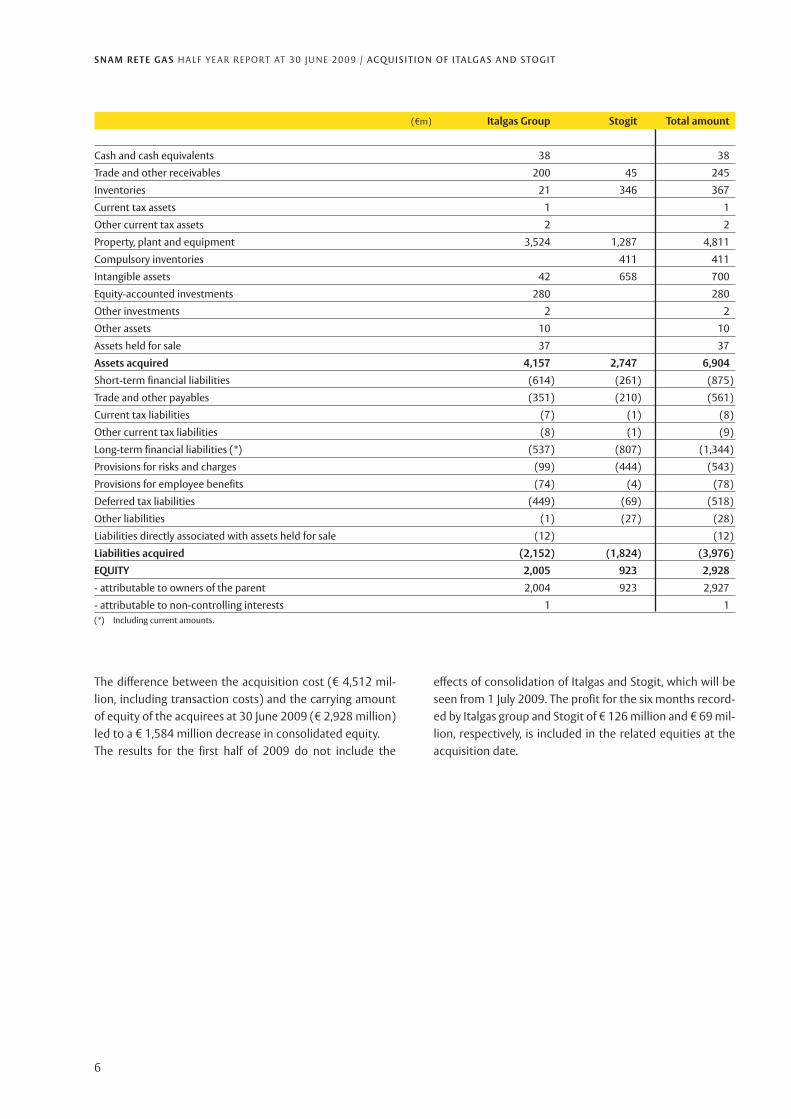
effects of consolidation of Italgas and Stogit, which will beseen from 1 July 2009. The profit for the six months record-ed by Italgas group and Stogit of € 126 million and € 69 mil-lion, respectively, is included in the related equities at theacquisition date.
The difference between the acquisition cost (€ 4,512 mil-lion, including transaction costs) and the carrying amountof equity of the acquirees at 30 June 2009 (€ 2,928 million)led to a € 1,584 million decrease in consolidated equity.The results for the first half of 2009 do not include the
(€m) Italgas Group Stogit Total amount
Cash and cash equivalents 38 38
Trade and other receivables 200 45 245
Inventories 21 346 367
Current tax assets 1 1
Other current tax assets 2 2
Property, plant and equipment 3,524 1,287 4,811
Compulsory inventories 411 411
Intangible assets 42 658 700
Equity-accounted investments 280 280
Other investments 2 2
Other assets 10 10
Assets held for sale 37 37
Assets acquired 4,157 2,747 6,904
Short-term financial liabilities (614) (261) (875)
Trade and other payables (351) (210) (561)
Current tax liabilities (7) (1) (8)
Other current tax liabilities (8) (1) (9)
Long-term financial liabilities (*) (537) (807) (1,344)
Provisions for risks and charges (99) (444) (543)
Provisions for employee benefits (74) (4) (78)
Deferred tax liabilities (449) (69) (518)
Other liabilities (1) (27) (28)
Liabilities directly associated with assets held for sale (12) (12)
Liabilities acquired (2,152) (1,824) (3,976)
EQUITY 2,005 923 2,928
- attributable to owners of the parent 2,004 923 2,927
- attributable to non-controlling interests 1 1(*) Including current amounts.

S N A M R E T E G A S H A L F Y E A R R E P O RT AT 3 0 J U N E 2 0 0 9 / C O N S O L I DAT I O N P O L I C I E S A N D S C O P E
7
Consolidation policies and scope
Following acquisition of Italgas and Stogit, Snam Rete Gas isan integrated group heading in the regulated gas sector anda major gas operator in Europe in terms of its regulatoryasset base (RAB). The group operates in the natural gastransportation and dispatching sectors via the parent SnamRete Gas S.p.A., the liquefied natural gas (LNG) regasifica-
tion sector via the subsidiary GNL Italia S.p.A. and in the nat-ural gas distribution and storage sectors via Italgas andStogit S.p.A., respectively. The group also carries out otherless significant non-regulated activities, mainly consisting oftechnical and commercial services and the distribution ofwater.

S N A M R E T E G A S H A L F Y E A R R E P O RT AT 3 0 J U N E 2 0 0 9 / C O N S O L I DAT I O N P O L I C I E S A N D S C O P E
8
Consolidation scope
The group’s consolidation scope at 30 June 2009 is shown in the following graph.
Distribution
Regasification Storage
SNAM RETE GAS S.p.A.
ITALGAS S.p.A.
100%
NAPOLETANA GAS S.p.A.
99.69%
GNL ITALIA S.p.A.
100%
STOGIT S.p.A.
100%

S N A M R E T E G A S H A L F Y E A R R E P O RT AT 3 0 J U N E 2 0 0 9 / H I G H L I G H T S
9
Highlights
› Snam Rete Gas recorded a profit of € 234 million and EBITof € 444 million for the first half of 2009, down by € 25million (-9.7%) and € 56 million (-11.2%) on the sameperiod of 2008, respectively.
› The CEO intends to propose to the parent’s directors thatthe shareholders receive an interim dividend for 2009 of€ 0.06 per share (€ 0.09 per share in 2008) with an ex-dividend date of 19 October 2009 and payment from 22October 2009. This recommendation is subject to theapproval of the independent auditors as required byarticle 2433-bis of the Italian Civil Code.
› Investments of € 438 million (-8.2% on the first half of2008) were made in the period to develop and maintainthe natural gas transportation network. They specificallyrelated to the new transportation infrastructure along theAdriatic side (Puglia - Basilicata) and the upgrading of theimport infrastructure in Sicily, Calabria and the Po valley.
› Natural gas volumes injected into the transportationnetwork equalled 38.10 billion cubic metres, down 7.28billion cubic metres or 16% on the first half of 2008.Regasified LNG volumes were 0.64 billion cubic metres,
an 0.27 billion cubic metre decrease (-29.7%) on the sameperiod of 2008.
› Natural gas volumes carried on the Group’s distributionnetwork in the period came to 4,432 million cubic metres,compared to 4,376 million cubic metres in the first half of2008, an increase of 56 million cubic metres or 1.3%.
› During the first half of 2009, 10.35 billion cubic metres ofgas were moved in the Group’s storage system, up 3.24billion cubic metres (+45.6%) on the 2008 first half figureof 7.11 billion cubic metres.
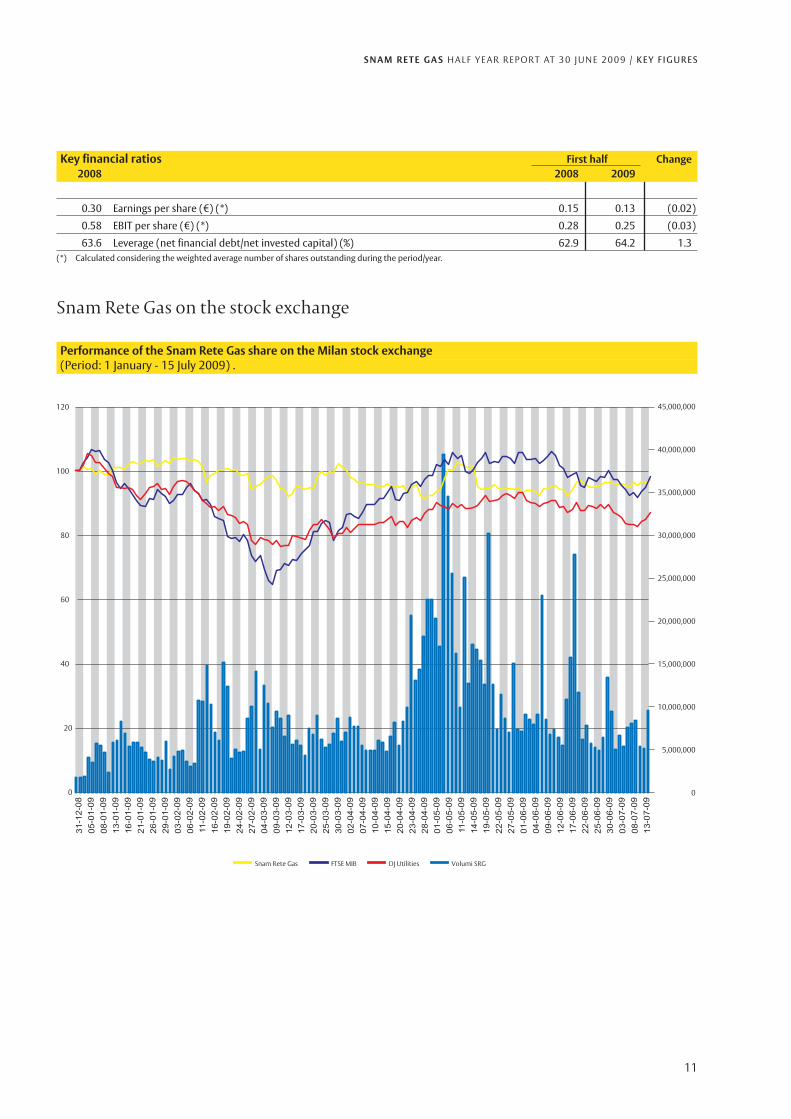
› The Snam Rete Gas share closed the period at the officialprice of € 3.12. During the six months, the companyincreased its share capital involving the issue of1,614,292,394 new ordinary shares offered under optionto its shareholders in proportion to the shares alreadyheld by them. The share’s period-end official pricecompared to the adjusted price at the end of 2008, asrequired by the stock exchange regulations forextraordinary transactions, decreased by 4.3%, mainly dueto the entire European Utilities sector’s negativeperformance (Eurostoxx Utilities index -11.5%).
10
S N A M R E T E G A S H A L F Y E A R R E P O RT AT 3 0 J U N E 2 0 0 9 / K E Y F I G U R E S
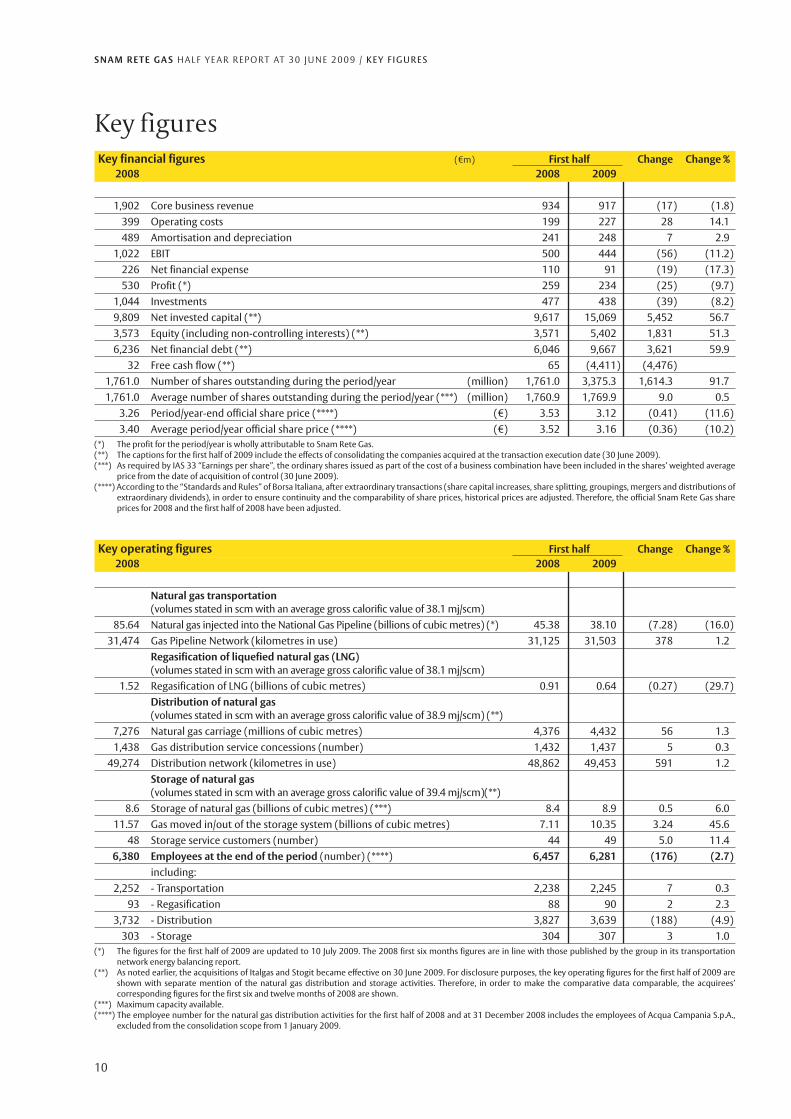
Key financial figures (€m) First half Change Change %2008 2008 2009
1,902 Core business revenue 934 917 (17) (1.8)399 Operating costs 199 227 28 14.1489 Amortisation and depreciation 241 248 7 2.9
1,022 EBIT 500 444 (56) (11.2)226 Net financial expense 110 91 (19) (17.3)530 Profit (*) 259 234 (25) (9.7)
1,044 Investments 477 438 (39) (8.2)9,809 Net invested capital (**) 9,617 15,069 5,452 56.73,573 Equity (including non-controlling interests) (**) 3,571 5,402 1,831 51.36,236 Net financial debt (**) 6,046 9,667 3,621 59.9
32 Free cash flow (**) 65 (4,411) (4,476)1,761.0 Number of shares outstanding during the period/year (million) 1,761.0 3,375.3 1,614.3 91.71,761.0 Average number of shares outstanding during the period/year (***) (million) 1,760.9 1,769.9 9.0 0.5
3.26 Period/year-end official share price (****) (€) 3.53 3.12 (0.41) (11.6)3.40 Average period/year official share price (****) (€) 3.52 3.16 (0.36) (10.2)
(*) The profit for the period/year is wholly attributable to Snam Rete Gas.(**) The captions for the first half of 2009 include the effects of consolidating the companies acquired at the transaction execution date (30 June 2009).(***) As required by IAS 33 “Earnings per share”, the ordinary shares issued as part of the cost of a business combination have been included in the shares’ weighted average
price from the date of acquisition of control (30 June 2009).(****) According to the “Standards and Rules” of Borsa Italiana, after extraordinary transactions (share capital increases, share splitting, groupings, mergers and distributions of
extraordinary dividends), in order to ensure continuity and the comparability of share prices, historical prices are adjusted. Therefore, the official Snam Rete Gas shareprices for 2008 and the first half of 2008 have been adjusted.
Key figures
Key operating figures First half Change Change %2008 2008 2009
Natural gas transportation(volumes stated in scm with an average gross calorific value of 38.1 mj/scm)
85.64 Natural gas injected into the National Gas Pipeline (billions of cubic metres) (*) 45.38 38.10 (7.28) (16.0)31,474 Gas Pipeline Network (kilometres in use) 31,125 31,503 378 1.2
Regasification of liquefied natural gas (LNG)(volumes stated in scm with an average gross calorific value of 38.1 mj/scm)
1.52 Regasification of LNG (billions of cubic metres) 0.91 0.64 (0.27) (29.7)Distribution of natural gas(volumes stated in scm with an average gross calorific value of 38.9 mj/scm) (**)
7,276 Natural gas carriage (millions of cubic metres) 4,376 4,432 56 1.31,438 Gas distribution service concessions (number) 1,432 1,437 5 0.3
49,274 Distribution network (kilometres in use) 48,862 49,453 591 1.2Storage of natural gas(volumes stated in scm with an average gross calorific value of 39.4 mj/scm)(**)
8.6 Storage of natural gas (billions of cubic metres) (***) 8.4 8.9 0.5 6.011.57 Gas moved in/out of the storage system (billions of cubic metres) 7.11 10.35 3.24 45.6
48 Storage service customers (number) 44 49 5.0 11.46,380 Employees at the end of the period (number) (****) 6,457 6,281 (176) (2.7)
including:2,252 - Transportation 2,238 2,245 7 0.3
93 - Regasification 88 90 2 2.33,732 - Distribution 3,827 3,639 (188) (4.9)
303 - Storage 304 307 3 1.0(*) The figures for the first half of 2009 are updated to 10 July 2009. The 2008 first six months figures are in line with those published by the group in its transportation
network energy balancing report.(**) As noted earlier, the acquisitions of Italgas and Stogit became effective on 30 June 2009. For disclosure purposes, the key operating figures for the first half of 2009 are
shown with separate mention of the natural gas distribution and storage activities. Therefore, in order to make the comparative data comparable, the acquirees’corresponding figures for the first six and twelve months of 2008 are shown.
(***) Maximum capacity available.(****) The employee number for the natural gas distribution activities for the first half of 2008 and at 31 December 2008 includes the employees of Acqua Campania S.p.A.,
excluded from the consolidation scope from 1 January 2009.
11
S N A M R E T E G A S H A L F Y E A R R E P O RT AT 3 0 J U N E 2 0 0 9 / K E Y F I G U R E S
Key financial ratios First half Change2008 2008 2009
0.30 Earnings per share (€) (*) 0.15 0.13 (0.02)
0.58 EBIT per share (€) (*) 0.28 0.25 (0.03)
63.6 Leverage (net financial debt/net invested capital) (%) 62.9 64.2 1.3(*) Calculated considering the weighted average number of shares outstanding during the period/year.
80
100
120
60
40
20
0
Snam Rete Gas FTSE MIB DJ Utilities Volumi SRG
0
5,000,000
10,000,000
15,000,000
20,000,000
25,000,000
30,000,000
35,000,000
40,000,000
45,000,000
Performance of the Snam Rete Gas share on the Milan stock exchange(Period: 1 January - 15 July 2009) .
Snam Rete Gas on the stock exchange

S N A M R E T E G A S H A L F Y E A R R E P O RT AT 3 0 J U N E 2 0 0 9 / O P E R AT I N G R E V I E W
12
Operating review
Introduction
The key performance indicators are shown below by busi-ness segment5. The main income statement captions arenot given for the natural gas distribution and storage activ-
ities as the effects of the consolidation of Italgas and Stogitwill be seen from 1 July 2009, as disclosed in the section ontheir acquisition. Their performance in the entire sixmonths is described in the section on the “Performance ofthe acquirees” in order to properly assess their operations.
(5) The business segments (natural gas transportation, LNG regasification, natural gas distribution and storage) are identified, in line with internal reports, by man-agement, and mainly refer to the activities of Snam Rete Gas, GNL Italia, Italgas and its subsidiaries and Stogit, respectively.
S N A M R E T E G A S H A L F Y E A R R E P O RT AT 3 0 J U N E 2 0 0 9 / O P E R AT I N G R E V I E W
13
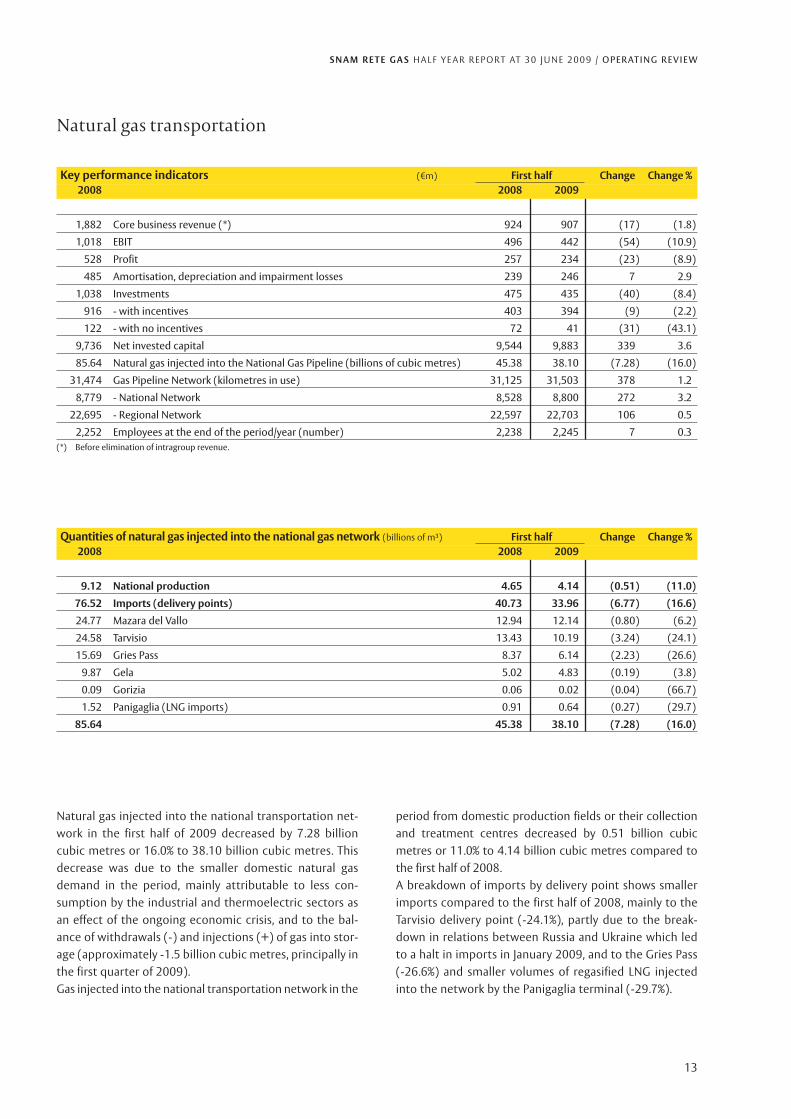
Natural gas transportation
Quantities of natural gas injected into the national gas network (billions of m³) First half Change Change %2008 2008 2009
9.12 National production 4.65 4.14 (0.51) (11.0)
76.52 Imports (delivery points) 40.73 33.96 (6.77) (16.6)
24.77 Mazara del Vallo 12.94 12.14 (0.80) (6.2)
24.58 Tarvisio 13.43 10.19 (3.24) (24.1)
15.69 Gries Pass 8.37 6.14 (2.23) (26.6)
9.87 Gela 5.02 4.83 (0.19) (3.8)
0.09 Gorizia 0.06 0.02 (0.04) (66.7)
1.52 Panigaglia (LNG imports) 0.91 0.64 (0.27) (29.7)
85.64 45.38 38.10 (7.28) (16.0)
Key performance indicators (€m) First half Change Change %2008 2008 2009
1,882 Core business revenue (*) 924 907 (17) (1.8)
1,018 EBIT 496 442 (54) (10.9)
528 Profit 257 234 (23) (8.9)
485 Amortisation, depreciation and impairment losses 239 246 7 2.9
1,038 Investments 475 435 (40) (8.4)
916 - with incentives 403 394 (9) (2.2)
122 - with no incentives 72 41 (31) (43.1)
9,736 Net invested capital 9,544 9,883 339 3.6
85.64 Natural gas injected into the National Gas Pipeline (billions of cubic metres) 45.38 38.10 (7.28) (16.0)
31,474 Gas Pipeline Network (kilometres in use) 31,125 31,503 378 1.2
8,779 - National Network 8,528 8,800 272 3.2
22,695 - Regional Network 22,597 22,703 106 0.5
2,252 Employees at the end of the period/year (number) 2,238 2,245 7 0.3(*) Before elimination of intragroup revenue.
Natural gas injected into the national transportation net-work in the first half of 2009 decreased by 7.28 billioncubic metres or 16.0% to 38.10 billion cubic metres. Thisdecrease was due to the smaller domestic natural gasdemand in the period, mainly attributable to less con-sumption by the industrial and thermoelectric sectors asan effect of the ongoing economic crisis, and to the bal-ance of withdrawals (-) and injections (+) of gas into stor-age (approximately -1.5 billion cubic metres, principally inthe first quarter of 2009).Gas injected into the national transportation network in the
period from domestic production fields or their collectionand treatment centres decreased by 0.51 billion cubicmetres or 11.0% to 4.14 billion cubic metres compared tothe first half of 2008.A breakdown of imports by delivery point shows smallerimports compared to the first half of 2008, mainly to theTarvisio delivery point (-24.1%), partly due to the break-down in relations between Russia and Ukraine which ledto a halt in imports in January 2009, and to the Gries Pass(-26.6%) and smaller volumes of regasified LNG injectedinto the network by the Panigaglia terminal (-29.7%).

14
S N A M R E T E G A S H A L F Y E A R R E P O RT AT 3 0 J U N E 2 0 0 9 / O P E R AT I N G R E V I E W
Investments (€m) First half Change Change %2008 2008 2009
813 Development 359 351 (8) (2.2)
578 Investments with 3% incentive 232 243 11 4.7
235 Investments with 2% incentive 127 108 (19) (15.0)
225 Maintenance and other 116 84 (32) (27.6)
103 Investments with 1% incentive 44 43 (1) (2.3)
122 Investments with no incentives 72 41 (31) (43.1)
1,038 475 435 (40) (8.4)
Volumes injected by shipper (billions of m³) First half Change Change %2008 2008 2009
51.80 Eni 27.23 20.04 (7.19) (26.4)
9.82 Enel Trade 5.05 4.18 (0.87) (17.2)
24.02 Others 13.10 13.88 0.78 6.0
85.64 45.38 38.10 (7.28) (16.0)
Investments made in the first half of 2009 of € 435 millionshow an 8.4% decrease on the same period of 2008.In order to provide a consistent comparison of the differenttypes of investment made in the first halves of 2009 and2008, the investments of the first half of 2009 have beenclassified in accordance with resolution no. 166/05 issued bythe Electricity and Gas Authority. The Authority identifiedseparate project categories which have different incentives.Investments made in the first half of 2009 will be remuner-ated applying the Authority’s standards for the third regula-tory period, which may differ from those of the current reg-ulatory period, which expires on 30 September 2009.
The key development investments related to:- as part of the project for the new transportation infra-
structure along the Adriatic side (€ 140 million), the pur-chase of materials to construct the Massafra-Biccaripipeline in Puglia and Basilicata;
- as part of the project to upgrade the import infrastruc-ture in Sicily and Calabria (€ 54 million): (i) constructionof the Montalbano-Messina pipeline and the Bronte-Montalbano section of the Enna-Montalbano pipeline inSicily and the Rende-Tarsia pipeline in Calabria; and (ii)
work to complete the Mazara-Menfi and Tarsia-Moranopipelines in Sicily and Calabria, respectively;
- as part of the project to improve the import infrastruc-ture from the North East (€ 19 million): (i) assembly of anew turbocompressor to upgrade the Malborghetto sta-tion in Friuli Venezia Giulia; and (ii) construction of theTarvisio-Malborghetto pipeline and assembly of the gascooler at the Istrana station;
- as part of the project to upgrade the transportation infra-structure in the Po valley (€ 27 million): (i) acquisition ofmaterials and labour to construct the Poggio Renatico-Cremona pipeline in Emilia Romagna and Lombardy; and(ii) delivery of spare parts and work to complete thePoggio Renatico station in Emilia Romagna;
- upgrading of the pipeline network in South Piedmont (€12 million), including construction of the Cherasco-Cuneo and Oviglio-Ponti pipelines.
The maintenance and other investments covered a num-ber of works aimed at ensuring adequate safety and qualitylevels of the systems, the replacement of assets and plants,the introduction of new IT systems, the development ofexisting ones and the purchase of other operating assets.

15
S N A M R E T E G A S H A L F Y E A R R E P O RT AT 3 0 J U N E 2 0 0 9 / O P E R AT I N G R E V I E W
The Panigaglia (SP) LNG terminal regasified 0.64 billion cubicmetres of natural gas in the first half of 2009 compared to 0.91billion cubic metres in the same period of 2008. Different sized
methane tankers unloaded 20 loads (including two spot loads)compared to 26 in the first quarter of 2008. The decrease inregasified LNG of 0.27 billion cubic metres equals 29.7%.
LNG regasification
Quantities of regasified gas (billions of m³) First half Change Change %2008 2008 2009
1.23 Enel Trade 0.64 0.50 (0.14) (21.9)
0.29 Eni 0.27 0.08 (0.19) (70.4)
Others 0.06 0.06
1.52 0.91 0.64 (0.27) (29.7)
Key performance indicators (€m) First half Change Change %2008 2008 2009
37 Core business revenue (*) 20 18 (2) (10.0)
4 EBIT 4 2 (2) (50.0)
2 Profit 2 (2) (100.0)
4 Amortisation, depreciation and impairment losses 2 2
6 Investments 2 3 1 50.0
73 Net invested capital 73 77 4 5.5
1.52 Regasification of LNG (billions of cubic metres) 0.91 0.64 (0.27) (29.7)
42 Tankers of unloaded gas (number) 26 20 (6) (23.1)
93 Employees at the end of the period/year (number) 88 90 2 2.3(*) Core business revenue includes the recharging of the costs of transporting gas by Snam Rete Gas S.p.A. from the regasification facility to the entry point in the Panigaglia
network to customers. For consolidation purposes, this revenue is eliminated together with the transportation costs incurred by GNL Italia S.p.A. to present thetransaction’s substance.
Natural gas distribution
Key performance indicators6 First half Change Change %2008 2008 2009
3,237 Net invested capital (€m) 2,996 3,118 122 4.1
7,276 Natural gas carriage (millions of cubic metres) 4,376 4,432 56 1.3
1,438 Gas distribution service concessions (number) 1,432 1,437 5 0.3
49,274 Distribution Network (kilometres in use) 48,862 49,453 591 1.2
5,676,105 Meters in use (number) 5,635,039 5,718,660 83,621 1.5
132 Customers (number) 129 146 17 13.2
3,732 Employees at the end of the period/year (number) 3,827 3,639 (188) (4.9)
(6) The acquisition of Italgas became effective on 30 June 2009. In order to facilitate a comparison between the key performance indicators of the periods shown,the data for the corresponding first six and twelve months of 2008 are shown.
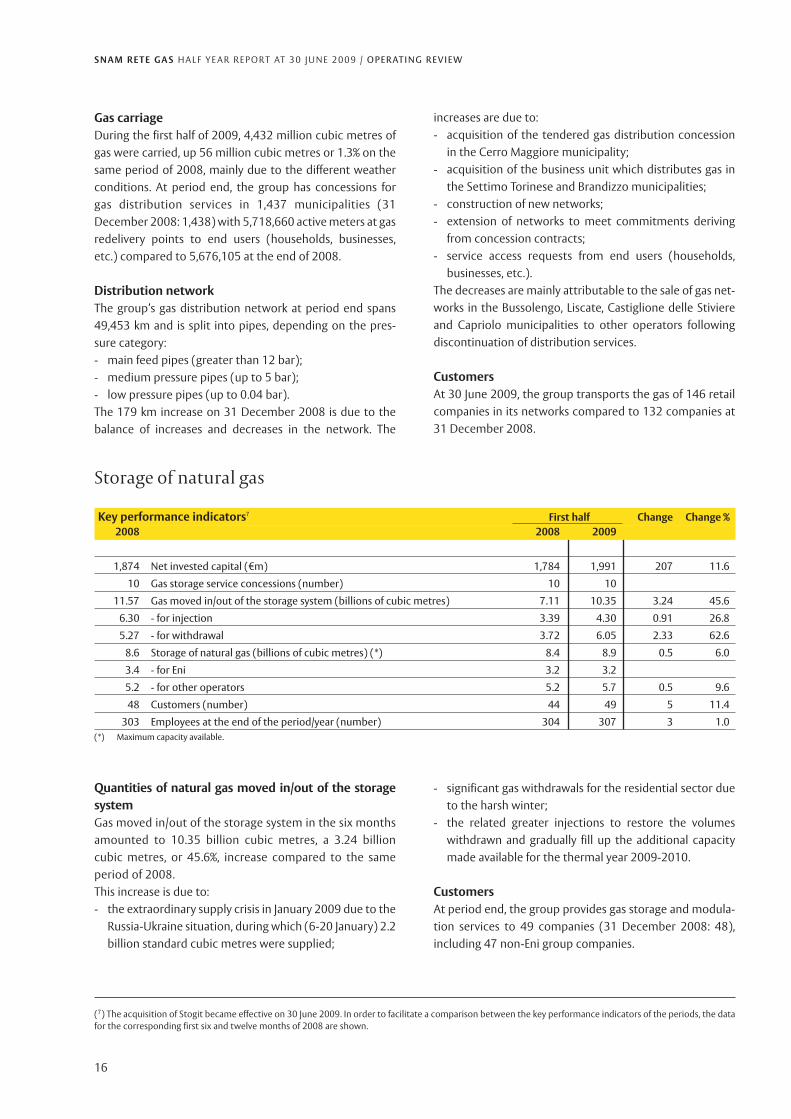
Quantities of natural gas moved in/out of the storagesystemGas moved in/out of the storage system in the six monthsamounted to 10.35 billion cubic metres, a 3.24 billioncubic metres, or 45.6%, increase compared to the sameperiod of 2008.This increase is due to:- the extraordinary supply crisis in January 2009 due to the
Russia-Ukraine situation, during which (6-20 January) 2.2billion standard cubic metres were supplied;
16
S N A M R E T E G A S H A L F Y E A R R E P O RT AT 3 0 J U N E 2 0 0 9 / O P E R AT I N G R E V I E W
Gas carriageDuring the first half of 2009, 4,432 million cubic metres ofgas were carried, up 56 million cubic metres or 1.3% on thesame period of 2008, mainly due to the different weatherconditions. At period end, the group has concessions forgas distribution services in 1,437 municipalities (31December 2008: 1,438) with 5,718,660 active meters at gasredelivery points to end users (households, businesses,etc.) compared to 5,676,105 at the end of 2008.
Distribution networkThe group’s gas distribution network at period end spans49,453 km and is split into pipes, depending on the pres-sure category:- main feed pipes (greater than 12 bar);- medium pressure pipes (up to 5 bar);- low pressure pipes (up to 0.04 bar).The 179 km increase on 31 December 2008 is due to thebalance of increases and decreases in the network. The
increases are due to:- acquisition of the tendered gas distribution concession
in the Cerro Maggiore municipality;- acquisition of the business unit which distributes gas in
the Settimo Torinese and Brandizzo municipalities;- construction of new networks;- extension of networks to meet commitments deriving
from concession contracts;- service access requests from end users (households,
businesses, etc.).The decreases are mainly attributable to the sale of gas net-works in the Bussolengo, Liscate, Castiglione delle Stiviereand Capriolo municipalities to other operators followingdiscontinuation of distribution services.
CustomersAt 30 June 2009, the group transports the gas of 146 retailcompanies in its networks compared to 132 companies at31 December 2008.
- significant gas withdrawals for the residential sector dueto the harsh winter;
- the related greater injections to restore the volumeswithdrawn and gradually fill up the additional capacitymade available for the thermal year 2009-2010.
CustomersAt period end, the group provides gas storage and modula-tion services to 49 companies (31 December 2008: 48),including 47 non-Eni group companies.
Storage of natural gas
Key performance indicators7 First half Change Change %2008 2008 2009
1,874 Net invested capital (€m) 1,784 1,991 207 11.6
10 Gas storage service concessions (number) 10 10
11.57 Gas moved in/out of the storage system (billions of cubic metres) 7.11 10.35 3.24 45.6
6.30 - for injection 3.39 4.30 0.91 26.8
5.27 - for withdrawal 3.72 6.05 2.33 62.6
8.6 Storage of natural gas (billions of cubic metres) (*) 8.4 8.9 0.5 6.0
3.4 - for Eni 3.2 3.2
5.2 - for other operators 5.2 5.7 0.5 9.6
48 Customers (number) 44 49 5 11.4
303 Employees at the end of the period/year (number) 304 307 3 1.0(*) Maximum capacity available.
(7) The acquisition of Stogit became effective on 30 June 2009. In order to facilitate a comparison between the key performance indicators of the periods, the datafor the corresponding first six and twelve months of 2008 are shown.

S N A M R E T E G A S H A L F Y E A R R E P O RT AT 3 0 J U N E 2 0 0 9 / F I N A N C I A L R E V I E W
17
Financial review
RECLASSIFIED CONSOLIDATED INCOME STATEMENT
(€m) First half Change Change %2008 2008 2009
1,902 Core business revenue 934 917 (17) (1.8)
8 Other revenue and income 6 2 (4) (66.7)
1,910 Total revenue 940 919 (21) (2.2)
(399) Operating costs (*) (199) (227) (28) 14.1
1,511 EBITDA 741 692 (49) (6.6)
(489) Amortisation, depreciation and impairment losses (241) (248) (7) 2.9
1,022 EBIT 500 444 (56) (11.2)
(226) Net financial expense (110) (91) 19 (17.3)
796 Profit before tax 390 353 (37) (9.5)
(266) Income taxes (131) (119) 12 (9.2)
530 Profit (**) 259 234 (25) (9.7)(*) Operating costs include the captions “Purchases, services and other costs” and “Personnel expense” of the consolidated income statement included in the condensed
interim consolidated financial statements.(**) The profit for the period is wholly attributable to Snam Rete Gas.

S N A M R E T E G A S H A L F Y E A R R E P O RT AT 3 0 J U N E 2 0 0 9 / F I N A N C I A L R E V I E W
18
The profit (€ 234 million) decreased by € 25 million(9.7%) compared to the same period of 2008, due to thedecrease in EBIT (-€ 54 million) recorded by the trans-portation business, partly offset by the smaller net finan-cial expense (+€ 19 million), thanks to the cutting of mar-ket interest rates, and the downturn in income taxes (+€
12 million), related to the smaller profit before tax.
Non-recurring significant events and transactions andother special itemsNo non-recurring significant transactions and other specialitems took place in either the first half of 2009 or 2008.
Core business revenue (€ 917 million) decreased by € 17million (1.8%), mainly due to the smaller volumes of gastransported (-7.28 billion cubic metres; -16%) following thedownturn in gas demand in the first six months of the year.Revenue from the natural gas transportation business (€907 million) decreased by € 17 million due to the smaller
volumes of gas transported (-€ 47 million) and revision ofthe transportation tariffs (-€ 11 million), the effects ofwhich were partly offset by the investments made in 2007(+€ 38 million).Transportation revenue (€ 900 million) by shipper isanalysed in the following table.
Regasification revenue (€ 18 million) comprises the fee forthe LNG regasification service carried out at the Panigaglia(SP) terminal (€ 10 million) and charges for the transporta-tion capacity and the variable fee that the companyacquires from Snam Rete Gas and subsequently charges to
the regasification service users (€ 8 million). The € 2 milliondecrease on the first half of 2008 is due to the lower chargesfor the transportation service acquired from Snam Rete Gasand subsequently recharged to the regasification serviceusers.
(€m) First half Change Change %2008 2008 2009
1,882 Transportation 924 907 (17) (1.8)
37 Regasification 20 18 (2) (10.0)
(17) Consolidation adjustments (10) (8) 2 (20.0)
1,902 934 917 (17) (1.8)
(€m) First half Change Change %2008 2008 2009
1,081 Eni 553 489 (64) (11.6)
254 Enel Trade 129 121 (8) (6.2)
603 Other 305 348 43 14.1
(74) Revenue and fine adjustment (47) (34) 13 (27.7)
(34) Interruptibility fee as per resolution no. 277/07 (18) (19) (1) 5.6
(8) Regional network transportation fee as per resolution no. 45/07 - Equalisation (4) (5) (1) 25.0
45 Additional fee to cover the greater cost of purchasing gas
1,867 918 900 (18) (2.0)
Core business revenue
Core business revenue by business segment is analysed below.
S N A M R E T E G A S H A L F Y E A R R E P O RT AT 3 0 J U N E 2 0 0 9 / F I N A N C I A L R E V I E W
19
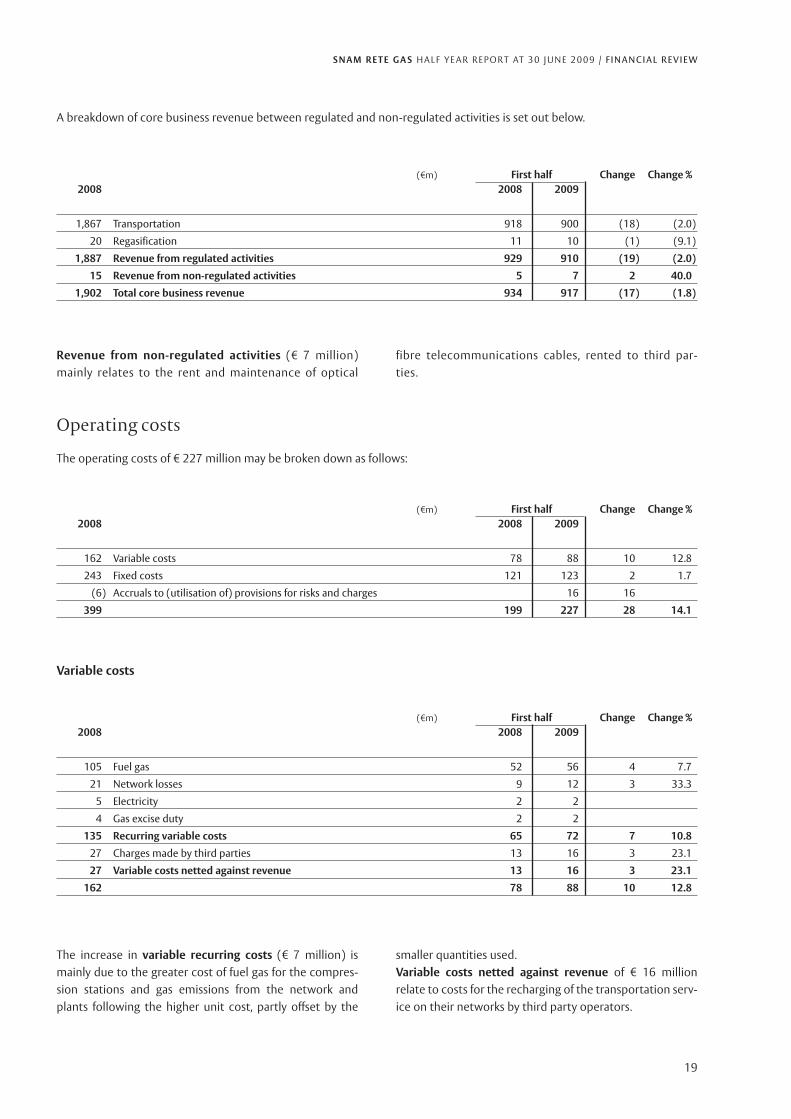
A breakdown of core business revenue between regulated and non-regulated activities is set out below.
Revenue from non-regulated activities (€ 7 million)mainly relates to the rent and maintenance of optical
The operating costs of € 227 million may be broken down as follows:
fibre telecommunications cables, rented to third par-ties.
Operating costs
Variable costs
(€m) First half Change Change %2008 2008 2009
1,867 Transportation 918 900 (18) (2.0)
20 Regasification 11 10 (1) (9.1)
1,887 Revenue from regulated activities 929 910 (19) (2.0)
15 Revenue from non-regulated activities 5 7 2 40.0
1,902 Total core business revenue 934 917 (17) (1.8)
(€m) First half Change Change %2008 2008 2009
162 Variable costs 78 88 10 12.8
243 Fixed costs 121 123 2 1.7
(6) Accruals to (utilisation of) provisions for risks and charges 16 16
399 199 227 28 14.1
(€m) First half Change Change %2008 2008 2009
105 Fuel gas 52 56 4 7.7
21 Network losses 9 12 3 33.3
5 Electricity 2 2
4 Gas excise duty 2 2
135 Recurring variable costs 65 72 7 10.8
27 Charges made by third parties 13 16 3 23.1
27 Variable costs netted against revenue 13 16 3 23.1
162 78 88 10 12.8
The increase in variable recurring costs (€ 7 million) ismainly due to the greater cost of fuel gas for the compres-sion stations and gas emissions from the network andplants following the higher unit cost, partly offset by the
smaller quantities used.Variable costs netted against revenue of € 16 millionrelate to costs for the recharging of the transportation serv-ice on their networks by third party operators.
S N A M R E T E G A S H A L F Y E A R R E P O RT AT 3 0 J U N E 2 0 0 9 / F I N A N C I A L R E V I E W
20
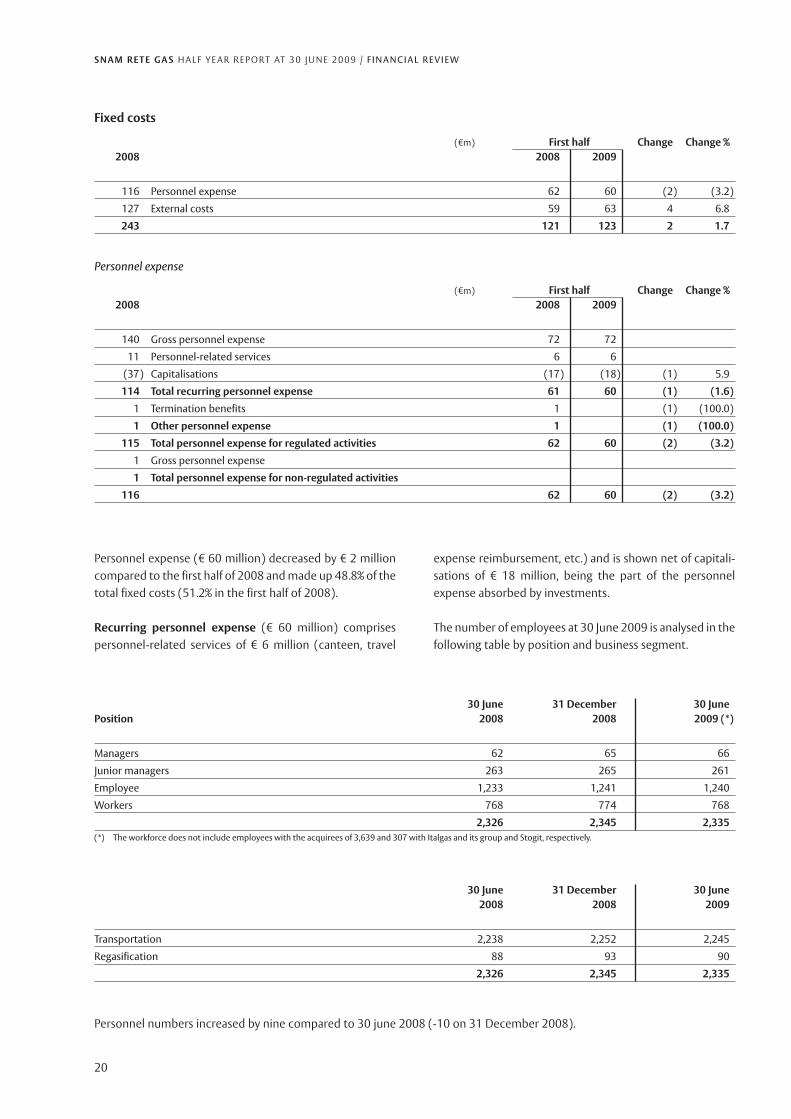
Personnel expense (€ 60 million) decreased by € 2 millioncompared to the first half of 2008 and made up 48.8% of thetotal fixed costs (51.2% in the first half of 2008).
Recurring personnel expense (€ 60 million) comprisespersonnel-related services of € 6 million (canteen, travel
expense reimbursement, etc.) and is shown net of capitali-sations of € 18 million, being the part of the personnelexpense absorbed by investments.
The number of employees at 30 June 2009 is analysed in thefollowing table by position and business segment.
Personnel expense
Fixed costs
(€m) First half Change Change %2008 2008 2009
116 Personnel expense 62 60 (2) (3.2)
127 External costs 59 63 4 6.8
243 121 123 2 1.7
(€m) First half Change Change %2008 2008 2009
140 Gross personnel expense 72 72
11 Personnel-related services 6 6
(37) Capitalisations (17) (18) (1) 5.9
114 Total recurring personnel expense 61 60 (1) (1.6)
1 Termination benefits 1 (1) (100.0)
1 Other personnel expense 1 (1) (100.0)
115 Total personnel expense for regulated activities 62 60 (2) (3.2)
1 Gross personnel expense
1 Total personnel expense for non-regulated activities
116 62 60 (2) (3.2)
30 June 31 December 30 JunePosition 2008 2008 2009 (*)
Managers 62 65 66
Junior managers 263 265 261
Employee 1,233 1,241 1,240
Workers 768 774 768
2,326 2,345 2,335(*) The workforce does not include employees with the acquirees of 3,639 and 307 with Italgas and its group and Stogit, respectively.
30 June 31 December 30 June2008 2008 2009
Transportation 2,238 2,252 2,245
Regasification 88 93 90
2,326 2,345 2,335
Personnel numbers increased by nine compared to 30 june 2008 (-10 on 31 December 2008).
S N A M R E T E G A S H A L F Y E A R R E P O RT AT 3 0 J U N E 2 0 0 9 / F I N A N C I A L R E V I E W
21
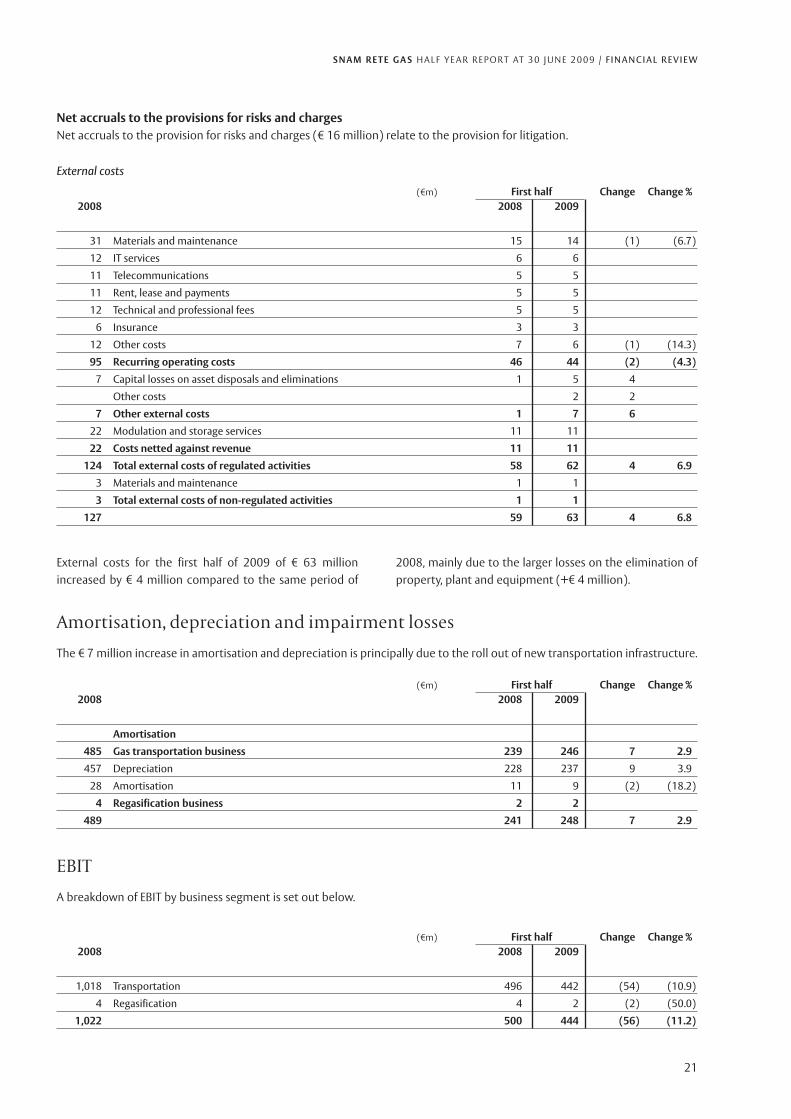
External costs for the first half of 2009 of € 63 millionincreased by € 4 million compared to the same period of
Amortisation, depreciation and impairment losses
The € 7 million increase in amortisation and depreciation is principally due to the roll out of new transportation infrastructure.
External costs
(€m) First half Change Change %2008 2008 2009
31 Materials and maintenance 15 14 (1) (6.7)
12 IT services 6 6
11 Telecommunications 5 5
11 Rent, lease and payments 5 5
12 Technical and professional fees 5 5
6 Insurance 3 3
12 Other costs 7 6 (1) (14.3)
95 Recurring operating costs 46 44 (2) (4.3)
7 Capital losses on asset disposals and eliminations 1 5 4
Other costs 2 2
7 Other external costs 1 7 6
22 Modulation and storage services 11 11
22 Costs netted against revenue 11 11
124 Total external costs of regulated activities 58 62 4 6.9
3 Materials and maintenance 1 1
3 Total external costs of non-regulated activities 1 1
127 59 63 4 6.8
(€m) First half Change Change %2008 2008 2009
Amortisation
485 Gas transportation business 239 246 7 2.9
457 Depreciation 228 237 9 3.9
28 Amortisation 11 9 (2) (18.2)
4 Regasification business 2 2
489 241 248 7 2.9
EBIT
A breakdown of EBIT by business segment is set out below.
(€m) First half Change Change %2008 2008 2009
1,018 Transportation 496 442 (54) (10.9)
4 Regasification 4 2 (2) (50.0)
1,022 500 444 (56) (11.2)
Net accruals to the provisions for risks and chargesNet accruals to the provision for risks and charges (€ 16 million) relate to the provision for litigation.
2008, mainly due to the larger losses on the elimination ofproperty, plant and equipment (+€ 4 million).

S N A M R E T E G A S H A L F Y E A R R E P O RT AT 3 0 J U N E 2 0 0 9 / F I N A N C I A L R E V I E W
EBIT8 recorded for the first half of 2009 amounts to € 444million, down € 56 million or 11.2%, on the correspondingperiod of 2008, mainly due to: (i) smaller transportationactivities (-€ 54 million) attributable to lower transporta-tion revenue (-€ 20 million, net of revenue offset againstcosts) principally due to the decreased volumes of naturalgas transported; (ii) higher operating costs (-€ 25 million,net of costs offset against revenue), principally due to thesmaller accruals to the provisions for risks and charges (-€
16 million) and the rise in variable costs for the purchase offuel gas used by the compression stations and network andsystem losses (-€ 7 million); and (iii) greater amortisationand depreciation expense (-€ 7 million) following the roll-out of new transportation infrastructure during the period.
EBIT of the regasification business (€ 2 million) decreasedby € 2 million following the smaller income from the sale ofgas and smaller LNG regasification revenue.
22
(8) EBIT is analysed by considering only those elements that have led to a change therein, as application of the gas sector tariff regulations generate costs and rev-enue which are netted.
Net financial expense
(€m) First half Change Change %2008 2008 2009
(276) Interest expense on net financial debt (134) (76) 58 (43.3)
(276) - Interest expense on short-term and long-term financial liabilities (134) (76) 58 (43.3)
27 Gains (losses) on derivatives 12 (21) (33)
(2) - Adjustment to fair value (1) (2) (1) 100.0
29 - Interest accrued during the year 13 (19) (32)
(3) Other financial income (expense) (1) (2) (1) 100.0
2 - Other income 1 1
(1) - Discounting interest
(4) - Other financial expense (2) (3) (1) 50.0
26 Financial expense on internal work capitalised 13 8 (5) (38.5)
(226) (110) (91) 19 (17.3)
Net financial expense (€ 91 million) decreased by € 19 mil-lion, mainly due to the market interest rate cuts. The average
cost of borrowing decreased from 4.2% in the first half of2008 to 3.2% following the sharp cut in market interest rates.
Income taxes(€m) First half Change Change %
2008 2008 2009
291 Current taxes 145 137 (8) (5.5)
Deferred tax (income) expense
(37) Deferred tax expense (19) (16) 3 (15.8)
12 Deferred tax income 5 (2) (7)
(25) (14) (18) (4) 28.6
266 131 119 (12) (9.2)
Income taxes (€ 119 million) decreased by € 12 millioncompared to the corresponding period of 2008, mainly dueto the smaller profit before tax.
The tax rate is 33.7% compared to 33.6% in the same periodof 2008.

S N A M R E T E G A S H A L F Y E A R R E P O RT AT 3 0 J U N E 2 0 0 9 / F I N A N C I A L R E V I E W
RECLASSIFIED CONSOLIDATED BALANCE SHEET (*)
23
Net invested capital (€ 15,069 million) increased by €5,260 million compared to 31 December 2008 due to therise in non-current assets (+€ 6,371 million), partly offset bythe reduction in net working capital (-€ 1,057 million).Non-current assets (€ 16,673 million) increased by € 6,371million, mainly due to the change in consolidation scope(+€ 6,110 million).Assets held for sale and the directly related liabilities of €25 million relate to: (i) a property owned by Italgas (€ 17
million, net of the environmental provisions for the proper-ty’s restoration)9; and (ii) sale of an investment (17.77%)held by Italgas S.p.A. in the gas distribution companyToscana Energia Clienti S.p.A. to Eni S.p.A. (€ 8 million). Thistransaction is part of the ongoing restructuring plan, toconcentrate the gas distribution activities in Italgas.
Changes in property, plant and equipment and intangibleassets (+€ 5,658 million) are analysed below:
(€m) 31.12.2008 30.06.2009 Change
Property, plant and equipment 10,549 15,508 4,959
Compulsory inventories 411 411
Intangible assets 39 738 699
Investments 282 282
Financial receivables held for operating activities 1 1
Net payables for investments (286) (267) 19
Non-current assets 10,302 16,673 6,371
Net working capital (464) (1,521) (1,057)
Provision for employee benefits (29) (108) (79)
Assets held for sale and directly related liabilities 25 25
NET INVESTED CAPITAL 9,809 15,069 5,260
Equity (including non-controlling interests) 3,573 5,402 1,829
Net financial debt 6,236 9,667 3,431
COVERAGE 9,809 15,069 5,260(*) Reference should be made to the paragraph on the reconciliation of the reclassified consolidated balance sheet with the legally-required consolidated balance sheet.
Reclassified consolidated balance sheet
The reclassified consolidated balance sheet combines theassets and liabilities of the balance sheet format included inthe annual consolidated financial statements and con-densed interim financial statements in accordance withtheir function, split into the three basic functions: invest-ment, operations and financing.
Group management holds that this format presents addi-tional information useful for investors as it allows identifica-tion of the sources of financing (own and third party funds)and the application of such funds for non-current assetsand working capital.
The reclassified balance sheet format is used by manage-ment to calculate the key leverage ratios.
(€m) Property, plant Intangible Totaland equipment assets
Opening balance at 31 December 2008 10,549 39 10,588
Investments 430 8 438
Effect of changes in consolidation scope 4,811 700 5,511
Amortisation, depreciation and impairment losses (239) (9) (248)
Sales, eliminations and disposals (5) (5)
Other changes (38) (38)
Closing balance at 30 June 2009 15,508 738 16,246
(9) Note 21 “Guarantees, commitments and risks – commitments deriving from the acquisition of Italgas and Stogit from Eni” sets out the commitments taken on by the parties.
S N A M R E T E G A S H A L F Y E A R R E P O RT AT 3 0 J U N E 2 0 0 9 / F I N A N C I A L R E V I E W
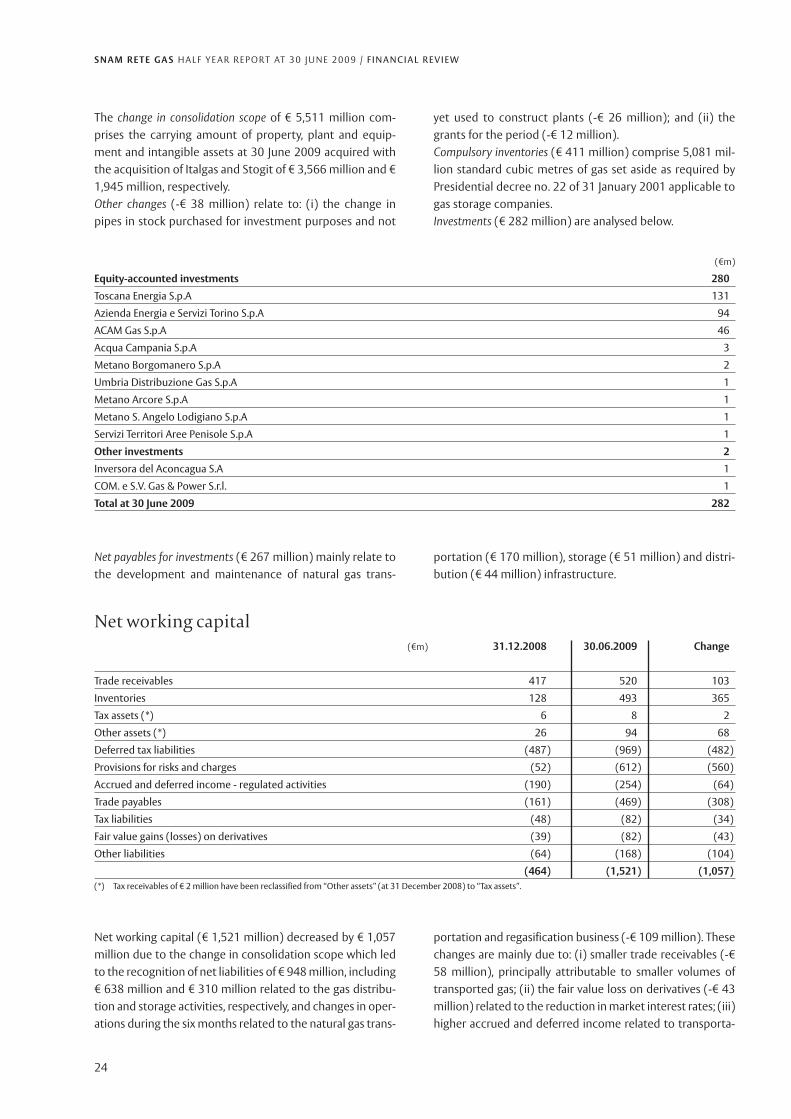
The change in consolidation scope of € 5,511 million com-prises the carrying amount of property, plant and equip-ment and intangible assets at 30 June 2009 acquired withthe acquisition of Italgas and Stogit of € 3,566 million and €1,945 million, respectively.Other changes (-€ 38 million) relate to: (i) the change inpipes in stock purchased for investment purposes and not
yet used to construct plants (-€ 26 million); and (ii) thegrants for the period (-€ 12 million).Compulsory inventories (€ 411 million) comprise 5,081 mil-lion standard cubic metres of gas set aside as required byPresidential decree no. 22 of 31 January 2001 applicable togas storage companies.Investments (€ 282 million) are analysed below.
24
Net payables for investments (€ 267 million) mainly relate tothe development and maintenance of natural gas trans-
portation (€ 170 million), storage (€ 51 million) and distri-bution (€ 44 million) infrastructure.
Net working capital(€m) 31.12.2008 30.06.2009 Change
Trade receivables 417 520 103
Inventories 128 493 365
Tax assets (*) 6 8 2
Other assets (*) 26 94 68
Deferred tax liabilities (487) (969) (482)
Provisions for risks and charges (52) (612) (560)
Accrued and deferred income - regulated activities (190) (254) (64)
Trade payables (161) (469) (308)
Tax liabilities (48) (82) (34)
Fair value gains (losses) on derivatives (39) (82) (43)
Other liabilities (64) (168) (104)
(464) (1,521) (1,057)(*) Tax receivables of € 2 million have been reclassified from “Other assets” (at 31 December 2008) to “Tax assets”.
(€m)
Equity-accounted investments 280
Toscana Energia S.p.A 131
Azienda Energia e Servizi Torino S.p.A 94
ACAM Gas S.p.A 46
Acqua Campania S.p.A 3
Metano Borgomanero S.p.A 2
Umbria Distribuzione Gas S.p.A 1
Metano Arcore S.p.A 1
Metano S. Angelo Lodigiano S.p.A 1
Servizi Territori Aree Penisole S.p.A 1
Other investments 2
Inversora del Aconcagua S.A 1
COM. e S.V. Gas & Power S.r.l. 1
Total at 30 June 2009 282
Net working capital (€ 1,521 million) decreased by € 1,057million due to the change in consolidation scope which ledto the recognition of net liabilities of € 948 million, including€ 638 million and € 310 million related to the gas distribu-tion and storage activities, respectively, and changes in oper-ations during the six months related to the natural gas trans-
portation and regasification business (-€ 109 million). Thesechanges are mainly due to: (i) smaller trade receivables (-€58 million), principally attributable to smaller volumes oftransported gas; (ii) the fair value loss on derivatives (-€ 43million) related to the reduction in market interest rates; (iii)higher accrued and deferred income related to transporta-
S N A M R E T E G A S H A L F Y E A R R E P O RT AT 3 0 J U N E 2 0 0 9 / F I N A N C I A L R E V I E W
25
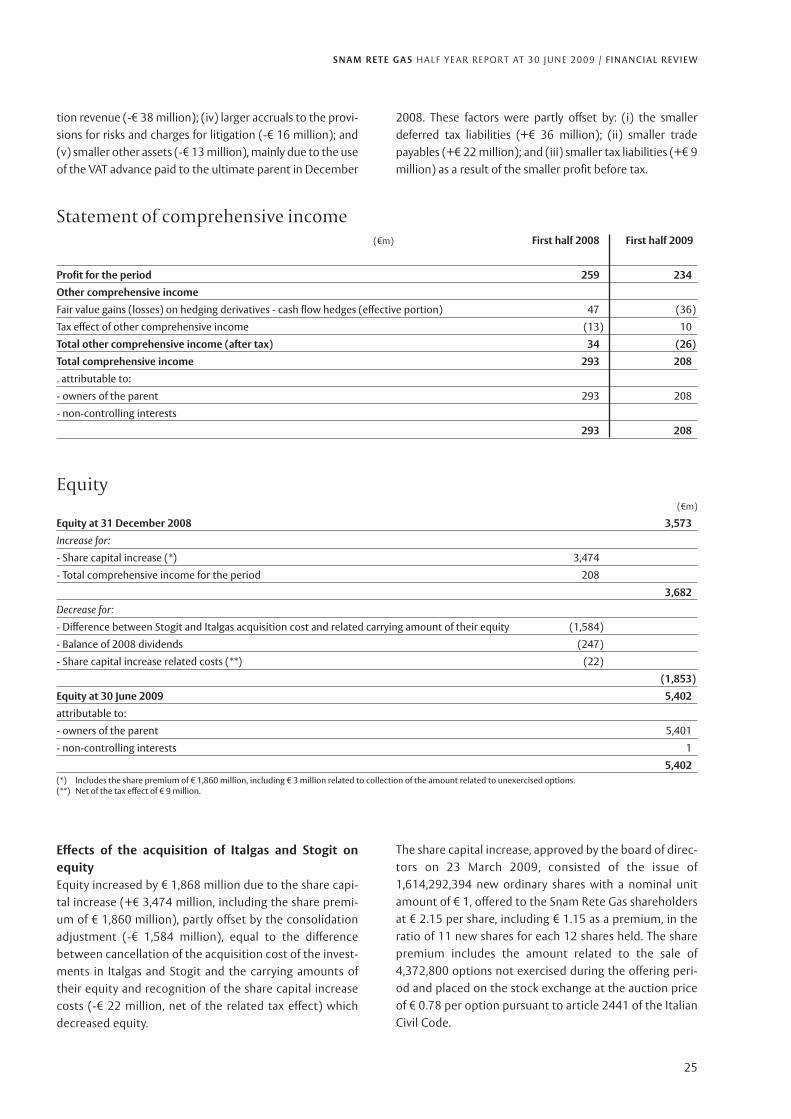
tion revenue (-€ 38 million); (iv) larger accruals to the provi-sions for risks and charges for litigation (-€ 16 million); and(v) smaller other assets (-€ 13 million), mainly due to the useof the VAT advance paid to the ultimate parent in December
2008. These factors were partly offset by: (i) the smallerdeferred tax liabilities (+€ 36 million); (ii) smaller tradepayables (+€ 22 million); and (iii) smaller tax liabilities (+€ 9million) as a result of the smaller profit before tax.
Statement of comprehensive income(€m) First half 2008 First half 2009
Profit for the period 259 234
Other comprehensive income
Fair value gains (losses) on hedging derivatives - cash flow hedges (effective portion) 47 (36)
Tax effect of other comprehensive income (13) 10
Total other comprehensive income (after tax) 34 (26)
Total comprehensive income 293 208
. attributable to:
- owners of the parent 293 208
- non-controlling interests
293 208
(€m)
Equity at 31 December 2008 3,573
Increase for:
- Share capital increase (*) 3,474
- Total comprehensive income for the period 208
3,682
Decrease for:
- Difference between Stogit and Italgas acquisition cost and related carrying amount of their equity (1,584)
- Balance of 2008 dividends (247)
- Share capital increase related costs (**) (22)
(1,853)
Equity at 30 June 2009 5,402
attributable to:
- owners of the parent 5,401
- non-controlling interests 1
5,402(*) Includes the share premium of € 1,860 million, including € 3 million related to collection of the amount related to unexercised options.(**) Net of the tax effect of € 9 million.
Equity
Effects of the acquisition of Italgas and Stogit onequityEquity increased by € 1,868 million due to the share capi-tal increase (+€ 3,474 million, including the share premi-um of € 1,860 million), partly offset by the consolidationadjustment (-€ 1,584 million), equal to the differencebetween cancellation of the acquisition cost of the invest-ments in Italgas and Stogit and the carrying amounts oftheir equity and recognition of the share capital increasecosts (-€ 22 million, net of the related tax effect) whichdecreased equity.
The share capital increase, approved by the board of direc-tors on 23 March 2009, consisted of the issue of1,614,292,394 new ordinary shares with a nominal unitamount of € 1, offered to the Snam Rete Gas shareholdersat € 2.15 per share, including € 1.15 as a premium, in theratio of 11 new shares for each 12 shares held. The sharepremium includes the amount related to the sale of4,372,800 options not exercised during the offering peri-od and placed on the stock exchange at the auction priceof € 0.78 per option pursuant to article 2441 of the ItalianCivil Code.
S N A M R E T E G A S H A L F Y E A R R E P O RT AT 3 0 J U N E 2 0 0 9 / F I N A N C I A L R E V I E W
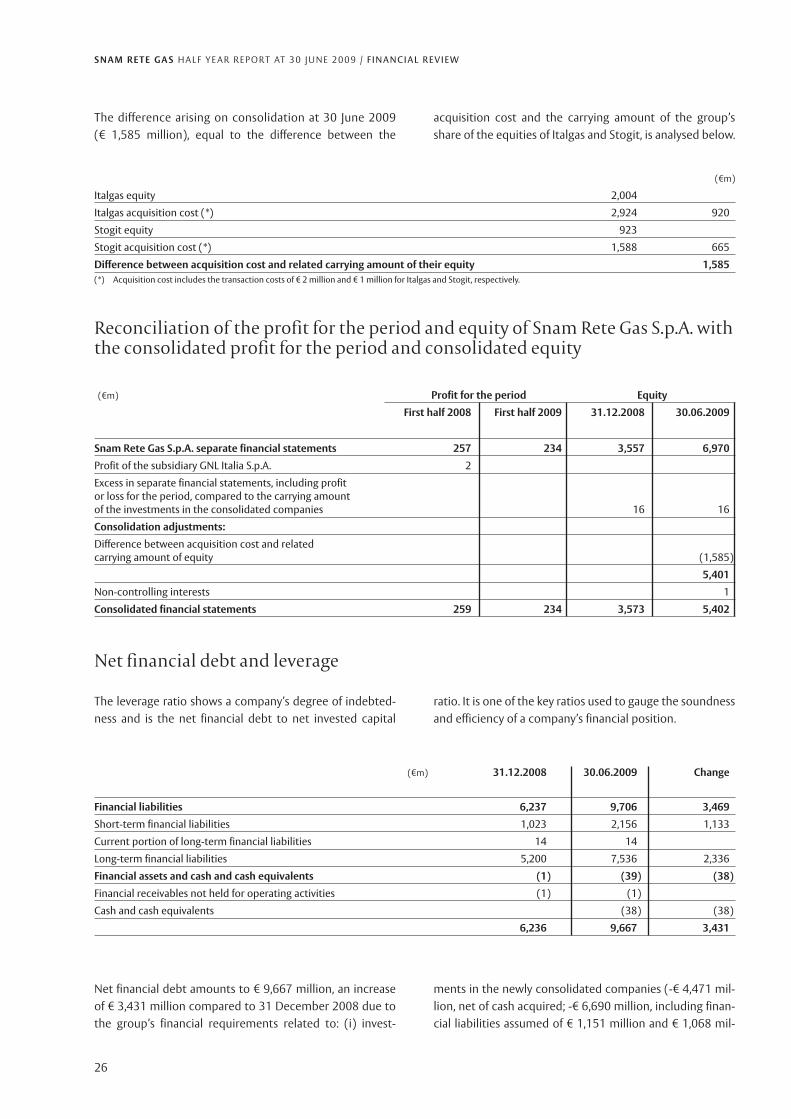
The difference arising on consolidation at 30 June 2009(€ 1,585 million), equal to the difference between the
acquisition cost and the carrying amount of the group’sshare of the equities of Italgas and Stogit, is analysed below.
26
(€m)
Italgas equity 2,004
Italgas acquisition cost (*) 2,924 920
Stogit equity 923
Stogit acquisition cost (*) 1,588 665
Difference between acquisition cost and related carrying amount of their equity 1,585(*) Acquisition cost includes the transaction costs of € 2 million and € 1 million for Italgas and Stogit, respectively.
Reconciliation of the profit for the period and equity of Snam Rete Gas S.p.A. withthe consolidated profit for the period and consolidated equity
(€m) Profit for the period Equity
First half 2008 First half 2009 31.12.2008 30.06.2009
Snam Rete Gas S.p.A. separate financial statements 257 234 3,557 6,970
Profit of the subsidiary GNL Italia S.p.A. 2
Excess in separate financial statements, including profitor loss for the period, compared to the carrying amountof the investments in the consolidated companies 16 16
Consolidation adjustments:
Difference between acquisition cost and relatedcarrying amount of equity (1,585)
5,401
Non-controlling interests 1
Consolidated financial statements 259 234 3,573 5,402
The leverage ratio shows a company’s degree of indebted-ness and is the net financial debt to net invested capital
ratio. It is one of the key ratios used to gauge the soundnessand efficiency of a company’s financial position.
Net financial debt and leverage
(€m) 31.12.2008 30.06.2009 Change
Financial liabilities 6,237 9,706 3,469
Short-term financial liabilities 1,023 2,156 1,133
Current portion of long-term financial liabilities 14 14
Long-term financial liabilities 5,200 7,536 2,336
Financial assets and cash and cash equivalents (1) (39) (38)
Financial receivables not held for operating activities (1) (1)
Cash and cash equivalents (38) (38)
6,236 9,667 3,431
Net financial debt amounts to € 9,667 million, an increaseof € 3,431 million compared to 31 December 2008 due tothe group’s financial requirements related to: (i) invest-
ments in the newly consolidated companies (-€ 4,471 mil-lion, net of cash acquired; -€ 6,690 million, including finan-cial liabilities assumed of € 1,151 million and € 1,068 mil-

S N A M R E T E G A S H A L F Y E A R R E P O RT AT 3 0 J U N E 2 0 0 9 / F I N A N C I A L R E V I E W
27
(€m) 31.12.2008 % 30.06.2009 % Change
. Floating rate 2,524 40 4,541 47 2,017
. Fixed rate 3,713 60 5,165 53 1,452
6,237 100 9,706 100 3,469
All the financial liabilities are due to Eni and they are almostall in Euros.Floating rate financial liabilities (€ 4,541 million) increasedby € 2,017 million, partly due to the change in consolidationscope (€ 1,461 million) and the taking out of a new floatingrate loan from the ultimate parent, Eni S.p.A., of € 300 mil-lion to be repaid in 2016 and to be used by Snam Rete Gasto finance part of the acquisition of Stogit and Italgas.Fixed rate financial liabilities (€ 5,165 million) increased by€ 1,452 million, mainly due to the liabilities deriving fromconsolidation of the acquirees (€ 758 million) and the tak-ing out of a new floating rate loan from Eni S.p.A. of € 700
million. This was converted into a fixed rate loan by an inter-est rate swap.Fixed rate financial liabilities at 30 June 2009 include sevenfloating rate loans converted into fixed rate loans by inter-est rate swaps for a total notional amount of € 3,500 mil-lion. Note 14 “Other current liabilities” gives informationabout these derivatives.The leverage ratio, ie, the ratio of net financial debt to netinvested capital, is 64.2% (63.6% at 31 December 2008).There are no financial liabilities subject to covenants.Cash and cash equivalents (€ 38 million) relate to thechange in consolidation scope.
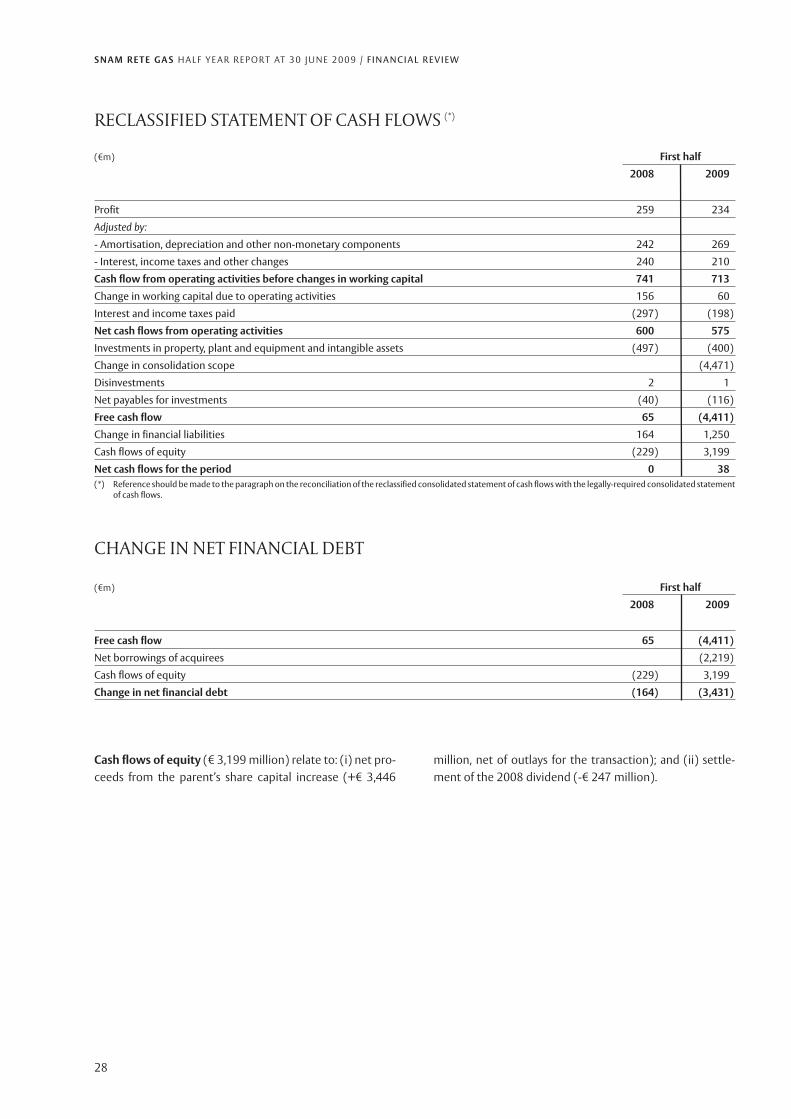
Reclassified consolidated statement of cash flows
The reclassified consolidated statement of cash flows set outbelow summarises the legally-required format. This reclassi-fied consolidated statement of cash flows shows the open-ing and closing cash and cash equivalents and the change innet financial debt during the period. The two statements arereconciled through the free cash flow, ie the cash surplus ordeficit left over after servicing capital expenditure. The free
cash flow closes either: (i) with the change in cash and cashequivalents for the period, after adding/deducting all cashflows related to financial liabilities/assets (takingout/repayment of loans) and equity (payment of divi-dends/capital injections); or (ii) with the change in net finan-cial debt for the period, after adding/deducting the debt flowsrelated to equity (payment of dividend/capital injections).
lion for Italgas and Stogit, respectively); (ii) net investmentsfor the period (-€ 515 million); (iii) settlement of the 2008dividend of € 0.14 per share, paid from 23 May 2008 (-€ 247million). These factors were partly offset by: (i) net cashflows of equity related to the share capital increase (+€3,446 million, including the share premium and net of out-flows to cover the transaction costs); and (ii) cash inflowsfrom operating activities (+€ 575 million).
Long-term financial liabilities of € 7,536 million make up78% of net financial debt (83% at 31 December 2008). Theaverage maturity of the long-term financing, including thecurrent portion, is just over four years (unchanged from 31December 2008).
A breakdown of the liabilities by type of interest rate at 30June 2009 is as follows:
S N A M R E T E G A S H A L F Y E A R R E P O RT AT 3 0 J U N E 2 0 0 9 / F I N A N C I A L R E V I E W
28
Cash flows of equity (€ 3,199 million) relate to: (i) net pro-ceeds from the parent’s share capital increase (+€ 3,446
million, net of outlays for the transaction); and (ii) settle-ment of the 2008 dividend (-€ 247 million).
(€m) First half
2008 2009
Profit 259 234
Adjusted by:
- Amortisation, depreciation and other non-monetary components 242 269
- Interest, income taxes and other changes 240 210
Cash flow from operating activities before changes in working capital 741 713
Change in working capital due to operating activities 156 60
Interest and income taxes paid (297) (198)
Net cash flows from operating activities 600 575
Investments in property, plant and equipment and intangible assets (497) (400)
Change in consolidation scope (4,471)
Disinvestments 2 1
Net payables for investments (40) (116)
Free cash flow 65 (4,411)
Change in financial liabilities 164 1,250
Cash flows of equity (229) 3,199
Net cash flows for the period 0 38(*) Reference should be made to the paragraph on the reconciliation of the reclassified consolidated statement of cash flows with the legally-required consolidated statement
of cash flows.
CHANGE IN NET FINANCIAL DEBT
RECLASSIFIED STATEMENT OF CASH FLOWS (*)
(€m) First half
2008 2009
Free cash flow 65 (4,411)
Net borrowings of acquirees (2,219)
Cash flows of equity (229) 3,199
Change in net financial debt (164) (3,431)

S N A M R E T E G A S H A L F Y E A R R E P O RT AT 3 0 J U N E 2 0 0 9 / F I N A N C I A L R E V I E W
29
RECONCILIATION OF THE RECLASSIFIED BALANCE SHEET FORMATS WITHTHE LEGALLY-REQUIRED FORMATS
(€m)
Reclassified consolidated balance sheet items 31.12.2008 30.06.2009(where not expressly stated, the component is taken directly Notes to the condensed Partial amount Amount from Partial amount Amount fromfrom the legally-required format) interim consolidated from legally- reclassified from legally- reclassified
financial statements required format format required format format
Non-current assetsProperty, plant and equipment 10,549 15,508Compulsory inventories 411Intangible assets 39 738Investments 282Financial receivables and securities held for operating activities (see note 2) 1Net payables for investments, consisting of: (286) (267)- Payables for investments (see note 12) (298) (292)- Receivables for investments/disinvestments (see note 2) 12 25Total non-current assets 10,302 16,673Net working capitalTrade receivables (see note 2) 417 520Inventories 128 493Tax assets, consisting of: 6 8- Current tax assets 1 1- Other current tax assets (*) 2 4- IRES receivables to parent for national consolidated tax scheme (see note 2) 3- Receivable to parent for group consolidated VAT scheme (see note 2) 3Trade payables (see note 12) (161) (469)Tax liabilities, consisting of: (48) (82)- Current tax liabilities (1) (11)- Other current tax liabilities (4) (12)- IRES payables to parent for national consolidated tax scheme (see note 12) (3) (42)- Payable to parent for group consolidated VAT scheme (see note 12) (40) (17)Deferred tax liabilities (487) (969)Provisions for risks and charges (52) (612)Other current assets (liabilities) consisting of: (267) (410)- Other receivables (see note 2) 20 74- Other current assets 52 58- Other non-current assets 3 9- Payments on account and advances, Other payables (see note 12) (34) (138)- Other current liabilities (52) (103)- Other non-current liabilities (256) (310)Total net working capital (464) (1,521)Provisions for employee benefits (29) (108)Net assets available for sale including related liabilities 25- Assets held for sale (see note 10) 37- Liabilities directly related to assets held for sale (see note 10) (12)NET INVESTED CAPITAL 9,809 15,069Equity 3,573 5,402Net financial debtFinancial labilities, consisting of: 6,237 9,706- Long-term financial liabilities 5,200 7,536- Current portion of long-term financial liabilities 14 14- Short-term financial liabilities 1,023 2,156Financial receivables, cash and cash equivalents consisting of: (1) (39)- Other financial assets (1) (1)- Cash and cash equivalents (38)Total net financial debt 6,236 9,667COVERAGE 9,809 15,069(*) VAT receivables of € 2 million have been reclassified from “Other assets” to “Tax assets” compared to 31 December 2008.
Reclassified consolidated balance
30
S N A M R E T E G A S H A L F Y E A R R E P O RT AT 3 0 J U N E 2 0 0 9 / F I N A N C I A L R E V I E W
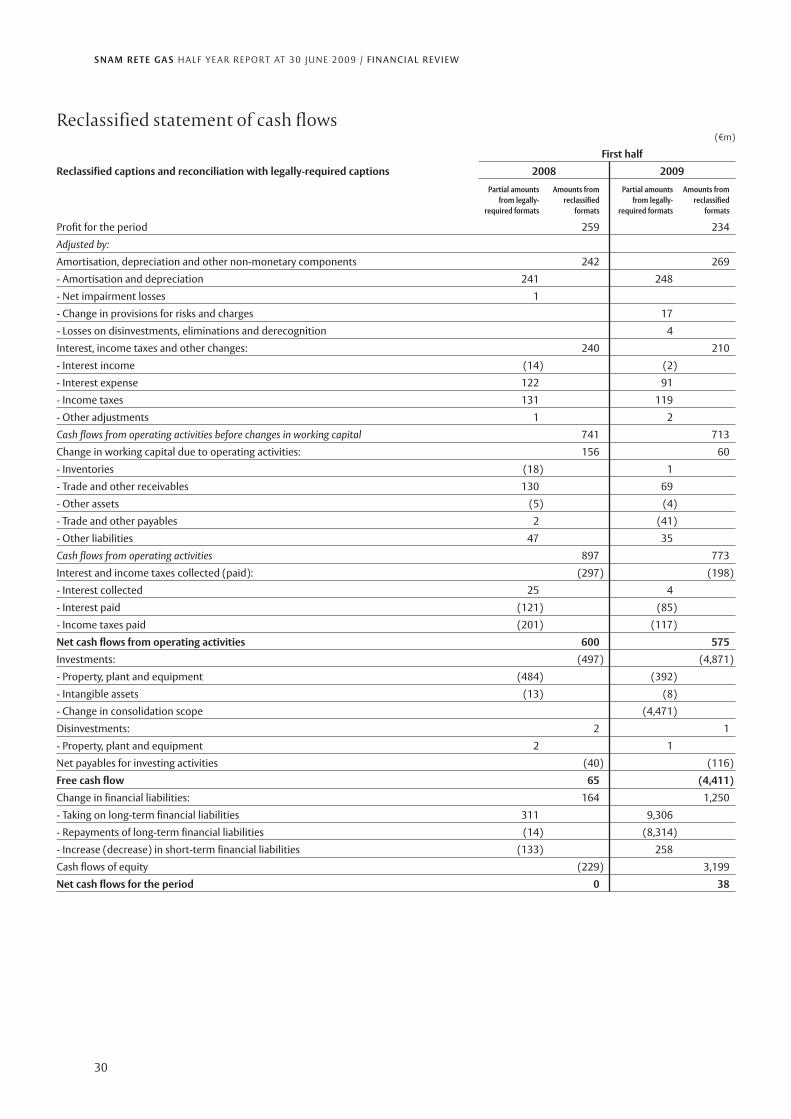
(€m)
First half
Reclassified captions and reconciliation with legally-required captions 2008 2009
Partial amounts Amounts from Partial amounts Amounts fromfrom legally- reclassified from legally- reclassified
required formats formats required formats formats
Profit for the period 259 234
Adjusted by:
Amortisation, depreciation and other non-monetary components 242 269
- Amortisation and depreciation 241 248
- Net impairment losses 1
- Change in provisions for risks and charges 17
- Losses on disinvestments, eliminations and derecognition 4
Interest, income taxes and other changes: 240 210
- Interest income (14) (2)
- Interest expense 122 91
- Income taxes 131 119
- Other adjustments 1 2
Cash flows from operating activities before changes in working capital 741 713
Change in working capital due to operating activities: 156 60
- Inventories (18) 1
- Trade and other receivables 130 69
- Other assets (5) (4)
- Trade and other payables 2 (41)
- Other liabilities 47 35
Cash flows from operating activities 897 773
Interest and income taxes collected (paid): (297) (198)
- Interest collected 25 4
- Interest paid (121) (85)
- Income taxes paid (201) (117)
Net cash flows from operating activities 600 575
Investments: (497) (4,871)
- Property, plant and equipment (484) (392)
- Intangible assets (13) (8)
- Change in consolidation scope (4,471)
Disinvestments: 2 1
- Property, plant and equipment 2 1
Net payables for investing activities (40) (116)
Free cash flow 65 (4,411)
Change in financial liabilities: 164 1,250
- Taking on long-term financial liabilities 311 9,306
- Repayments of long-term financial liabilities (14) (8,314)
- Increase (decrease) in short-term financial liabilities (133) 258
Cash flows of equity (229) 3,199
Net cash flows for the period 0 38
Reclassified statement of cash flows
S N A M R E T E G A S H A L F Y E A R R E P O RT AT 3 0 J U N E 2 0 0 9 / O T H E R I N F O R M AT I O N
31
Other information
Incentive plans for managersinvolving Snam Rete Gas shares
Stock grant planAt 30 June 3009, Snam Rete Gas did not have any commit-ments to assign stock grants.
Stock option planReference should be made to the 2008 Annual Report forinformation on the 2002-2004, 2005 and 2006-2008 stockoption plans. No new stock option plans were issued in thefirst half of 2009. Variations that took place in the period aredescribed below.
In its meeting of 11 March 2009, the board of directorsset the exercise percentage for the stock optionsassigned in 2006 considering the company’s TSR posi-tioning in the three years 2006, 2007 and 2008 com-pared to that of the six leading European utilities compa-nies. At that date, 731,325 options related to 2006 hadbeen forfeited due to this positioning, calculated at theend of the vesting period.In April 2009, 30,500 shares were issued with a nominalvalue of € 1, subscribed by the managers benefitting fromthe 2004 stock option plan, as part of the resolutiontaken by the board of directors for the managers’ incen-tive plans.
S N A M R E T E G A S H A L F Y E A R R E P O RT AT 3 0 J U N E 2 0 0 9 / O T H E R I N F O R M AT I O N
32
Year Option exercised Forfeited options (*) Exercised Existing options
2002 608,500 (21,000) (587,500)
2003 640,500 (433,000) 207,500
2004 677,000 (30,000) (286,500) 360,500
2005 658,000 (51,000) (69,000) 538,000
2006 2,597,500 (1,061,525) 1,535,975
2007 2,326,500 (242,900) 2,083,600
2008 2,235,000 2,235,000
9,743,000 (1,406,425) (1,376,000) 6,960,575(*) Includes forfeited options due to termination of employment relationship and, beginning from the 2006-2008 plan, the options forfeited as a result of the TSR positioning
at the end of the vesting period.
Changes in the stock option plans for each year of assignment are as follows:
Treasury shares
At 30 June 2009, Snam Rete Gas had 195,429,850 treasuryshares (unchanged from 31 December 2008), equal toapproximately 5.47% of the share capital. Their market valuewas roughly € 610 million at period end10.
Related party transactions
Snam Rete Gas S.p.A. is a subsidiary of Eni S.p.A..Transactions undertaken by Snam Rete Gas S.p.A. with relat-ed parties, as per IAS 24 “Related party disclosures”, mainlyinvolve the exchange of goods, provision of services and theprovision and utilisation of financial resources in addition totransactions to hedge interest rate risk with the ultimateparent, Eni S.p.A., and its subsidiaries and associates as wellas with Enel, a state-controlled company, and its sub-sidiaries. All these transactions are part of its ordinary busi-ness activities, usually take place at market conditions, ie,those conditions that would be applied between two inde-pendent parties, and are performed in the interests of theSnam Rete Gas group. Given the activities performed andthe nature of the relationship (company entirely or nearlyentirely owned by Eni), the services provided by certaincompanies are charged at rates agreed based on the specif-ic costs incurred and minimum profit margin to cover thegeneral costs and remuneration of invested capital. Theamounts of trade, other and financial transactions carriedout with related parties are disclosed in note 28 “Relatedparty transactions” to the condensed interim consolidatedfinancial statements. On 30 June 2009, as disclosed earlier,the acquisition of the entire share capital of Italgas andStogit from Eni was executed with payment by Snam ReteGas of a consideration of € 4,509 million, including € 2,922million for Italgas and € 1,587 million for Stogit. The acqui-sition represents a related party transaction as: (i) Eni is the
controlling shareholder of Snam Rete Gas; (ii) on 12February 2009, Snam Rete Gas received a commitment let-ter to enter into a contract, before the acquisition execu-tion date, for a long-term loan of a maximum of € 1,300 mil-lion to be used to pay part of the acquisition consideration;and (iii) on 12 February 2009, Eni agreed to subscribe theshares arising from the share capital increase. Informationon the transaction is given in the section on the“Acquisition of Italgas and Stogit” in this report to whichreference should be made.
Litigation
This section sets out developments in litigation comparedto the information given in the 2008 Annual Report and themost significant proceedings in which the acquirees areinvolved. Unless indicated otherwise, no provision has beenmade as Snam Rete Gas deems it improbable that the out-come of the proceedings will be unfavourable to it orbecause the accrual cannot be determined reliably.
Tax litigation
GNL Italia S.p.A. - Local property tax (ICI)With respect to the local property tax litigation betweenthe subsidiary GNL Italia S.p.A., the Porto Venere municipalauthorities and the La Spezia local body, the La Spezia taxcommission:- admitted the claims made by the local body whereby the
conditions for the application of the ICI tax would be inte-grated for the subsidiary in its ruling no. 136/7/08 of 18December 2008;
- accepted the claims made by GNL Italia in its ruling no.83/07/2009 of 9 April 2009 admitting that the greater taxassessed by the Porto Venere municipal authorities is duefrom 2007.
(10) Calculated by multiplying the number of treasury shares by the official price at 30 June 2009 (€ 3.12 per share).

S N A M R E T E G A S H A L F Y E A R R E P O RT AT 3 0 J U N E 2 0 0 9 / O T H E R I N F O R M AT I O N
33
While awaiting filing of the rulings, the company has notused its provision for risks of € 2.6 million.
The key proceedings in which the acquirees are involved aresummarised below.
Penal cases
Italgas S.p.AIn May 2007, Italgas was served a search and seizure meas-ure as part of proceeding no. 1183/06 RGNR commencedby the public prosecutor before the Milan court. The deedwas also served to the company’s chairman. It set outalleged unlawful conduct beginning from 2003 withrespect to use of gas metering instruments, the relatedexcise duties, invoicing to customers and relationships withthe supervisory authorities. The alleged violations include,inter alia, crimes covered by Legislative decree no. 231 of 8June 2001, which envisages the company’s administrativeliability in the case of crimes committed by its employees inthe interests, or to the benefit of the company.Italgas is cooperating with the relevant authorities.
Tax litigation
Stoccaggi Gas Italia S.p.A. - Local property tax (ICI)On 26 February 2009, the subsidiary presented two appealsto the Chieti provincial tax commission against the assess-ment reports of the Chieti municipal local body and theCupello municipal authorities about payment of ICI on itscompression station.It has already recognised a provision of € 1.3 million for thislitigation.
Antitrust Authority
Italgas S.p.AOn 6 May 2009, the Antitrust Authority notified Italgas ofcommencement of an investigation into the possible abuseof a dominant position violating article 82 of the EU Treaty.This investigation also covers other companies in the gas sec-tor and is based on a communication made by another oper-ator, also active in the gas distribution sector. The latter com-pany communicated alleged blocking and time-wastingactions taken by Italgas when carrying out operating andcommercial switching procedures for the migration of cus-tomers from one company to another. The investigationshould end before 30 June 2010, Italgas obtained access tothe proceeding’s documents on 26 May 2009 in order to gaina clear understanding of the other operator’s allegations.
Stoccaggi Gas Italia S.p.AFinalisation of the preliminary investigation by the AntitrustAuthority and the Electricity and Gas Authority published
on 3 June 2009 wound up the procedure commenced inNovember 2007.The investigation covered: (i) discovering potential obsta-cles to the development of new storage capacity in financialand strategic terms; (ii) assessing the existence of alterna-tive flexibility instruments to storage and access thereto bynewcomers; and (iii) analysing the legislative and regulato-ry context, also to assess its impact on competition. Stogitcomplied with the formal requests for documents andinformation in July 2008 and provided additional informa-tion in October 2008 as requested.Upon concluding the investigation, the Authorities recog-nised that Stogit had conducted itself in line with the estab-lished legislative and regulatory requirements without preju-dice to other operators and that the existing framework of sys-tem balancing rules and access and use of storage capacityhave significantly influenced access to the gas distributionmarket, especially to industrial and thermoelectric customers.
Rome urban area
Following the sale by the French company Suez S.A. (nowGdF-Suez S.A. after their merger) of its Belgium subsidiaryDistrigaz, Eni agreed to sell Suez, on the basis of preliminarynegotiations with Italgas, the latter’s distribution activitiesin the Rome urban area together with other gas and elec-tricity business assets. On 29 May 2008, the related prelim-inary agreements were signed, including the sales terms forthe gas distribution activities. The final agreement for suchgas distribution activities was entered into by Italgas andGdF-Suez on 30 October 2008.The transaction relates to the business unit which distrib-utes gas in the municipalities of Rome, Fiumicino,Ciampino, Marino, Grottaferrata, Rocca di Papa and Frascati(the concession for Rome expires on 31 December 2009),including the distribution networks (spanning roughly5,300 km) and the related systems, approximately 1.3 mil-lion delivery points (equal to approximately 28% of theusers served), together with roughly 800 employees.The set price, based on 31 December 2008, is € 1,018 mil-lion.The contract provides that execution of the transactionshall take place with the transfer by Italgas of the businessunit to Rete Gas Roma S.r.l. (a newco set up on 26November 2008 wholly owned by Italgas) and is subject toattainment of approval by the Rome municipality authori-ties of transfer of the concession before 30 June 2009,which date the buyer may extend to 31 August 2009.The Rome municipal authorities agreed the transfer of theconcession contract to Rete Gas Roma with its communica-tion no. 1231 of 25 June 2009, acknowledging Italgas’ inten-tion to transfer its entire investment in this company to GdF-Suez. The concession covers the distribution of gas in Rome.

S N A M R E T E G A S H A L F Y E A R R E P O RT AT 3 0 J U N E 2 0 0 9 / O T H E R I N F O R M AT I O N
34
On 6 July 2009, the Rome mayor subsequently specifiedthat this communication is the sole document necessary tolegitimately and effectively express the municipal authori-ty’s consent to the transaction and that the town councilwould be informed thereof.However, on 13 July 2009, GdF-Suez informed Italgas that itnot believe that the conditions for transfer of the Romeurban area gas distribution activities had been met in theestablished timeframe. Therefore, it decided not to contin-ue with finalisation of the acquisition as set out in the con-tract agreed by the parties on 30 October 2008.Snam Rete Gas is evaluating the contract’s content to assesswhat actions could be taken to best protect its interests.
Disclosure required by article 37 ofConsob regulation no. 16191/07
On 12 February 2009, the directors checked that the parentmeets the requirements set out in article 37.1 of Consobresolution no. 16191/07 for the listing of shares of sub-
sidiaries managed and coordinated by another company onan Italian regulated market as: a) it has complied with thedisclosure obligations set by article 2497-bis of the ItalianCivil Code; b) negotiates terms with its customers and sup-pliers independently; c) has a centralised treasury arrange-ment with its parent, Eni S.p.A., which meets its interests;and d) the board of directors has nine members, five ofwhom meet the independence requirements set for statu-tory auditors as per article 148.3 of Legislative decree no. 58of 24 February 1998 and article 3 of the Code of Conduct.No variations had taken place at 30 June 2009 with respectto the above information.
Subsequent events
The Electricity and Gas Authority published the secondpublic discussion document (DCO 24/09 dated 23 July2009) regarding the determination of the transport rev-enue and natural gas transportation and dispatching tariffsfor the third regulatory period.
S N A M R E T E G A S H A L F Y E A R R E P O RT AT 3 0 J U N E 2 0 0 9 / PERFORMANCE OF THE ACQUIREES
35
Performance of the acquirees
Natural gas distribution
Natural gas distribution takes place on a concession basiswhereby the local state bodies entrust the service to opera-tors that carry the gas using local networks from the deliv-ery points at the reduction and measuring cabins (city-gates) to the gas distribution network redelivery points forthe end customers (households, businesses, etc.). The serv-ice is provided to retail companies authorised to sell gas tothe end customers by transporting the gas on urban net-works. Italgas distributes natural gas using an integratedinfrastructure system, which it mostly owns, consisting ofcabins for gas withdrawal from the transportation network,pressure reduction cabins, a local transportation network, alocal distribution network, derivation systems and redeliv-
ery points consisting of technical equipment housingmeters for the end users (households, commercial compa-nies, the services sector and SMEs.The Electricity and Gas Authority has introduced a newmethod to determine gas carriage tariffs in its resolutionno. 159/08 applicable from 1 January 2009 and for theentire four years of the regulatory period (ie, until 2012).The main variation is the method used to determine rev-enue due to the gas distributors for their services. Beforeintroduction of the above resolution, this revenue wasdetermined using the tariffs set by the Authority for theeffectively carried volumes in the reference period. Now,however, total revenue for each year of the regulatory peri-od equals an amount decided when the tariff requests areapproved, called the Total Revenue Limit (VRT - Vincolo dei
36
(11) The figures at 30 June 2009 do not include the consolidation of Acqua Campania S.p.A. as Italgas no longer has full control thereof. For comparative purposes,the figures for the first six months and 12 months of 2008 are shown with separate mention of those for Acqua Campania S.p.A.. Measurement of the investmentusing the equity method does not change the profit for the period/year and equity attributable to the owners of the parent.
S N A M R E T E G A S H A L F Y E A R R E P O RT AT 3 0 J U N E 2 0 0 9 / PERFORMANCE OF THE ACQUIREES
Gas carriage revenue decreased by € 27 million in the firsthalf of 2009 compared to the corresponding period of2008. Such reduction is mainly due to the different meth-
ods used to recognise revenue in 2009 as described earlier.EBIT amounts to € 195 million, down € 21 million, or 9.7%,compared to the corresponding period of 2008. The
Key financial figures11 (€m) First half Change Change %including Acqua including Acqua
2008 Campania 2008 Campania 2009
781 49 Core business revenue 449 23 396 (53) (11.8)
323 5 EBIT 219 3 195 (24) (11.0)
228 3 Profit 141 126 (15) (10.6)
288 Investments 118 162 44 37.3
3,237 (20) Net invested capital 2,996 11 3,118 122 4.1
1,134 (30) Net financial position (debt) 987 (19) 1,113 126 12.8
(7) 5 Free cash flow 160 (7) 267 107 66.9
For comparative purposes, the following comments donot consider Acqua Campania’s figures for the sixmonths ended 30 June 2008 as it was not consolidated
(€m) First half Change Change %2008 2009
Carriage revenue (*) 409 382 (27) (6.6)
Technical assistance, engineering, information technology and other services 13 11 (2) (15.4)
Water distribution 2 2
Sales of materials 2 1 (1) (50.0)
426 396 (30) (7.0)(*) Carriage revenue for the first half of 2008 is shown net of payments borne by the users which go to the Fondo Nazionale di Compensazione (€ 5 million). These payments
are no longer required by resolution no. 159/08.
Ricavi Totali), being the maximum remuneration recog-nised by the Authority for each operator to cover its costs.Any positive or negative differences between the TotalRevenue Limit and the revenue arising from the amountsinvoiced for the volumes effectively carried by the carriersare settled using an equalisation mechanism with receiv-ables and payables due from and to the Cassa Conguagliodel Settore Elettrico. Therefore, revenue is distributed overthe year on a constant basis rather than being based on theseasonality of the carried volumes. Following application ofthis criterion, carriage revenue for the six months ended 30June 2009 equalled 50% of the company’s annual TotalRevenue Limit while the revenue for the correspondingperiod of 2008, calculated considering the actual gas vol-umes carried, was approximately 60% of the annual rev-
enue. It is clear that this effect will be absorbed in the sec-ond half of the year and, moreover, the tariff method intro-duced by resolution no. 159/08 should not lead to adecrease in total annual revenue. Italgas and its group com-panies sent the Electricity and Gas Authority their 2009 tar-iff proposals within the deadline of 30 April 2009. TheAuthority issued resolution no. 79/09 on 30 June 2009which introduced variations to the previous resolution no.159/08. They include the deferral of the original deadline of30 June to year end for approval of the Total Revenue Limitdue for 2009 to each distribution company and introduc-tion of a gradual increase mechanism in the new regulatoryperiod to adjust the previous tariffs in order to cover thehigher depreciation expense compared to that already pro-vided for in the RAB.
(as disclosed in the footnote).Core business revenue (€ 396 million) is analysedbelow.

S N A M R E T E G A S H A L F Y E A R R E P O RT AT 3 0 J U N E 2 0 0 9 / PERFORMANCE OF THE ACQUIREES
37
Financial liabilities are due to Eni S.p.A..The reduction in net financial debt is mainly due to thedecrease in short-term financial liabilities (€ 49 million) andcash and cash equivalents (€ 26 million).
The average cost of borrowing for the six months was 2.72%.The long-term loans are due after more than seven years.A breakdown of the liabilities by type of interest rate at 30June 2009 is as follows:
(€m) 31.12.2008 30.06.2009 Change
Financial liabilities 1,200 1,151 (49)
Short-term financial liabilities 663 614 (49)
Current portion of long-term financial liabilities 2 2
Long-term financial liabilities 535 535
Financial assets and cash and cash equivalents (66) (38) 28
Financial receivables not held for operating activities (2) 2
Cash and cash equivalents (64) (38) 26
1,134 1,113 (21)
(€m) 31.12.2008 % 30.06.2009 % Change
. Floating rate 850 71 801 70 (49)
. Fixed rate 350 29 350 30
1,200 100 1,151 100 (49)
Natural gas storage
Natural gas storage in Italy takes place on a concession basisand matches the different gas supply and consumptionrequirements. Supplies are fairly constant throughout theyear while demand is highly seasonal with demand signifi-cantly greater in winter than in summer. Storage activitiescan be split into two stages: (i) injection, usually in the peri-od from April to October, which consists of the injection ofnatural gas from the national transportation network into
storage; and (ii) supply, usually in the period fromNovember to March of the subsequent year, when the gas istaken from the deposits, treated and redelivered to the cus-tomers using the transportation network. The storage activ-ities include an integrated infrastructure consisting ofdeposits, gas treatment systems, compression stations andthe operating dispatching system.Stogit is currently the largest Italian operator and one of themain European players with eight storage fields inLombardy (four), Emilia Romagna (three) and Abruzzo
decrease is mainly due to: (i) smaller core business revenue(-€ 30 million), principally attributable to the differentmethod used to recognise carriage revenue in 2009 (-€ 27million); (ii) smaller operating costs (€ 12 million), derivingfrom the reduction in personnel expense (€ 10 million) andexternal costs for purchases, services and other services (€2 million).Italgas group’s profit for the period (€ 126 million)decreased by € 15 million (-10.6%) mainly due to the com-bined effect of the following: (i) smaller EBIT of € 21 million;(ii) smaller net financial expense of € 2 million; (iii) smallernet gains on investments of € 1 million; and (iv) smaller
income taxes of € 5 million, due to the downturn in theprofit.Investments came to € 162 million (€ 118 million in thecorresponding period of 2008). They include grants of € 13million but do not include the acquisition of the businessunit which distributes gas in the municipalities of SettimoTorinese and Brandizzo (€ 18 million). The investmentsrelated to new constructions, improvements to existingnetworks and, specifically, the gas meter replacement proj-ect.Net financial debt amounted to € 1,113 million, a decreaseof € 21 million on 31 December 2008.
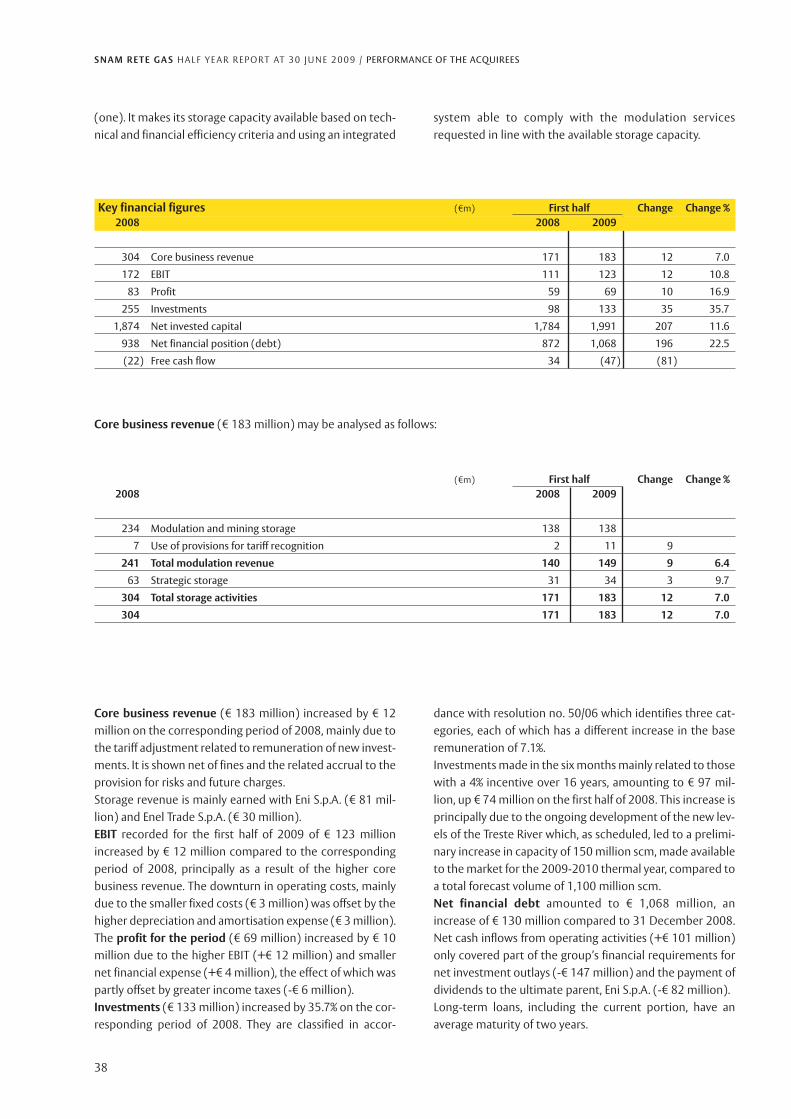
38
S N A M R E T E G A S H A L F Y E A R R E P O RT AT 3 0 J U N E 2 0 0 9 / PERFORMANCE OF THE ACQUIREES
(one). It makes its storage capacity available based on tech-nical and financial efficiency criteria and using an integrated
system able to comply with the modulation servicesrequested in line with the available storage capacity.
Key financial figures (€m) First half Change Change %2008 2008 2009
304 Core business revenue 171 183 12 7.0
172 EBIT 111 123 12 10.8
83 Profit 59 69 10 16.9
255 Investments 98 133 35 35.7
1,874 Net invested capital 1,784 1,991 207 11.6
938 Net financial position (debt) 872 1,068 196 22.5
(22) Free cash flow 34 (47) (81)
(€m) First half Change Change %2008 2008 2009
234 Modulation and mining storage 138 138
7 Use of provisions for tariff recognition 2 11 9
241 Total modulation revenue 140 149 9 6.4
63 Strategic storage 31 34 3 9.7
304 Total storage activities 171 183 12 7.0
304 171 183 12 7.0
Core business revenue (€ 183 million) may be analysed as follows:
Core business revenue (€ 183 million) increased by € 12million on the corresponding period of 2008, mainly due tothe tariff adjustment related to remuneration of new invest-ments. It is shown net of fines and the related accrual to theprovision for risks and future charges.Storage revenue is mainly earned with Eni S.p.A. (€ 81 mil-lion) and Enel Trade S.p.A. (€ 30 million).EBIT recorded for the first half of 2009 of € 123 millionincreased by € 12 million compared to the correspondingperiod of 2008, principally as a result of the higher corebusiness revenue. The downturn in operating costs, mainlydue to the smaller fixed costs (€ 3 million) was offset by thehigher depreciation and amortisation expense (€ 3 million).The profit for the period (€ 69 million) increased by € 10million due to the higher EBIT (+€ 12 million) and smallernet financial expense (+€ 4 million), the effect of which waspartly offset by greater income taxes (-€ 6 million).Investments (€ 133 million) increased by 35.7% on the cor-responding period of 2008. They are classified in accor-
dance with resolution no. 50/06 which identifies three cat-egories, each of which has a different increase in the baseremuneration of 7.1%.Investments made in the six months mainly related to thosewith a 4% incentive over 16 years, amounting to € 97 mil-lion, up € 74 million on the first half of 2008. This increase isprincipally due to the ongoing development of the new lev-els of the Treste River which, as scheduled, led to a prelimi-nary increase in capacity of 150 million scm, made availableto the market for the 2009-2010 thermal year, compared toa total forecast volume of 1,100 million scm.Net financial debt amounted to € 1,068 million, anincrease of € 130 million compared to 31 December 2008.Net cash inflows from operating activities (+€ 101 million)only covered part of the group’s financial requirements fornet investment outlays (-€ 147 million) and the payment ofdividends to the ultimate parent, Eni S.p.A. (-€ 82 million).Long-term loans, including the current portion, have anaverage maturity of two years.
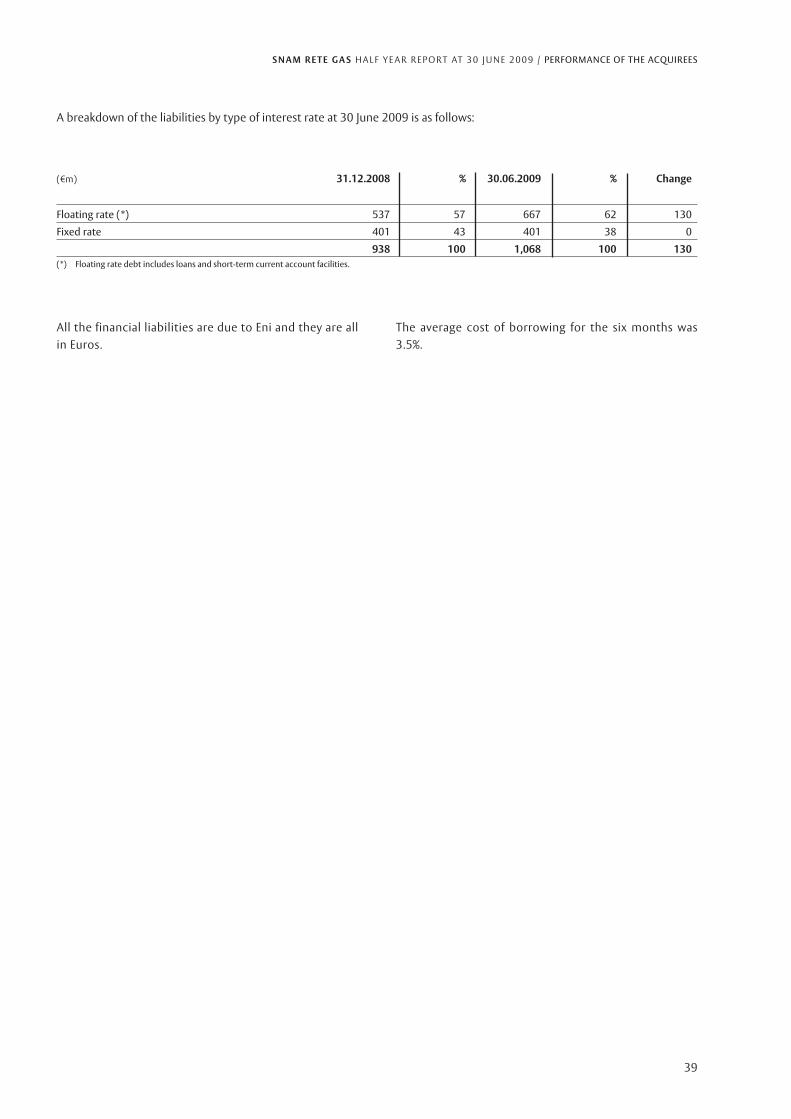
S N A M R E T E G A S H A L F Y E A R R E P O RT AT 3 0 J U N E 2 0 0 9 / PERFORMANCE OF THE ACQUIREES
39
A breakdown of the liabilities by type of interest rate at 30 June 2009 is as follows:
(€m) 31.12.2008 % 30.06.2009 % Change
Floating rate (*) 537 57 667 62 130
Fixed rate 401 43 401 38 0
938 100 1,068 100 130(*) Floating rate debt includes loans and short-term current account facilities.
All the financial liabilities are due to Eni and they are allin Euros.
The average cost of borrowing for the six months was3.5%.
S N A M R E T E G A S H A L F Y E A R R E P O RT AT 3 0 J U N E 2 0 0 9 / B U S I N E S S R I S K M A N AG E M E N T A N D O U T LO O K
40
Business risk management and outlook
Introduction
Reference should be made to the notes to the consolidatedfinancial statements at 31 December 2008 for a descriptionof market, credit and liquidity risks and related manage-ment policies. This section provides an update of thegroup’s key risk factors. The subsequent section commentson operating risk and the specific risks related to the natu-ral gas carrier and storage activities. No further risks anduncertainties are expected to be encountered in the sec-ond half of the year.
Market risk
Interest rate riskInterest rate fluctuations affect the fair value of the groupcompanies’ financial assets and liabilities and net financialexpense.Part of the loans bear interest rates indexed to market rates,especially the Euribor. Therefore, fluctuations in interestrates could affect the cost of floating rate financing whichamounts to € 4,541 million at 30 June 2009 (€ 2,524 million
at 31 December 2008), including € 1,461 million for theacquirees, equal to 47% of the group’s financial debt (40% at31 December 2008). Assuming a 10% increase/decrease ininterest rates, the group’s profit for the period woulddecrease or increase by € 2 million.
Other price riskSnam Rete Gas uses nearly all the gas purchased as fuel forits compression stations. The cost of such gas in the first halfof 2009 was € 56 million (€ 52 million in the first six monthsof 2008). As shown in the 2008 Annual Report, the currenttariff system establishes that these costs are recognisedconsidering the 2004 financial statements data and updat-ed using the price capping mechanism for the current regu-latory period.
Credit risk
The group did not encounter significant cases of defaultingcustomers in the period. Its maximum exposure to creditrisk at period end is based on the carrying amount of itsfinancial assets. At 30 June 2009, overdue but not impaired

41
S N A M R E T E G A S H A L F Y E A R R E P O RT AT 3 0 J U N E 2 0 0 9 / B U S I N E S S R I S K M A N AG E M E N T A N D O U T LO O K
receivables (as there is no doubt about their collection)amount to € 31 million (€ 13 million at 31 December2008), including € 14 million related to the acquirees. Thegroup is not exposed to significant credit risk. At periodend, roughly 76% of its receivables (81% at 31 December2008) were due from very reliable customers, including theultimate parent, Eni S.p.A., whose receivables made upapproximately 49% of the total (50% at 31 December 2008).
Liquidity risk
At present, the group believes that cash flows from itsoperations and its current financial and capital structurecan reasonably allow access to a wide range of financingfrom the capital market and banks at normal market con-ditions. Moreover, Snam Rete Gas entirely finances itselfthrough the ultimate parent, Eni S.p.A.. Therefore, shouldEni S.p.A. sell control of Snam Rete Gas, there is no guaran-tee that the company would be able to obtain loans andfinancing from other sources at the same conditions asthose currently applied.
Operating risk
Risks related to the expiry of gas distribution conces-sions/contracts held by Italgas and Italgas group compa-nies and the possible early termination of the conces-sions by the grantors
Risks related to tenders for the allocation of new gas distri-bution concessions
At 30 June 2009, the group has more than 1,400 natural gasdistribution concessions covering the whole of Italy.Upon the legal expiry of concessions and contracts held byItalgas and Italgas group companies or should the munici-pal authorities terminate the concessions in advance, thelocal bodies call tenders to assign the new gas distributionconcessions. Following these tenders, Italgas and Italgasgroup companies may not be awarded one or more of thenew concessions or they could be awarded the concessionsat less favourable conditions to those currently applied,with possible adverse effects on the group’s operations,financial position and financial performance. This wouldnot, however, prejudice their collection of the compensa-tion due to the outgoing concession holder should it not bere-awarded the concession.
Risks relating to title to gas storage concessionsStogit has ten gas storage concessions, of which one expireson 14 June 2012, eight on 1 January 2017 and one on 6November 2021. They can all be extended by the Ministryfor Economic Development twice for ten years each timepursuant to article 1.61 of Law no. 239/2004. Should Stogitbe unable to maintain title to one or more concessions or,upon renewal, be awarded the concession at less favourableconditions to those currently applied, this could have anadverse effect on its operations, financial position andfinancial performance.
Outlook
Natural gas storage
Domestic gas demand
Based on natural gas consumption trends in the first sixmonths of 2009 and the currently available information,natural gas demand at year end is forecast to decrease onthe end of 2008.
Investments
Snam Rete Gas confirms its investment plan to upgrade itstransportation infrastructure in the four years from 2009 to2012. The forecast outlay of roughly € 4.3 billion, includingapproximately € 1 billion in 2009, will ensure, inter alia,higher safety levels and greater flexibility.
Efficiency
The group will continue to focus on operating efficiency in2009, benefitting from the available organisational andtechnological tools.
Natural gas distributionBased on the development investments made, the numberof active redelivery points is expected to increase slightly atyear end.
Natural gas storageThe group communicated its total capacity for the servic-es offered in the thermal year 2009-2010 of approximate-ly 14 billion cubic metres, up roughly 0.3 billion cubicmetres on the maximum available capacity for the previ-ous thermal year.

S N A M R E T E G A S H A L F Y E A R R E P O RT AT 3 0 J U N E 2 0 0 9 / G LO S S A R Y
42
GlossaryThe financial, commercial, technical and measuring unitglossary is available on the company’s internet sitewww.snamretegas.it. The most frequently used terms are asfollows.
Financial terms
Adjusted profitAdjusted profit is profit net of non-recurring transactionsand other special items. The income-generating items areclassified as special items, when material, if: (i) they derivefrom events or transactions of a non-recurring nature ortransactions or events that occur infrequently during nor-mal business activities; or (ii) they derive from events ortransactions that do not form part of the company’s normalbusiness activities. Consob resolution no. 15519 of 27 July2006 provides that income-generating items deriving fromnon-recurring transactions or events are disclosed, whenmaterial, separately in the directors’ report and in the notesto the financial statements.
Controllable fixed costsThese are the operating fixed costs of the regulated activi-ties being the sum of “Total recurring personnel expense”and “Recurring external operating costs” as described in thesection on the “Comments on the results” of the directors’report.
LeverageFinancial structure indicator; measures the degree of debtand is calculated as the ratio of net financial debt to netinvested capital.
Operating profit (EBIT)Difference between revenue and cost of goods sold in a cer-tain period. The profit or loss of operations before costs andrevenue from financial transactions and taxes.
TRANSPORTATION ANDREGASIFICATION
Commercial terms
National network entry pointEach of the points or a local group of physical points on thenational pipeline network where the gas is delivered by theShipper to the Transporter.
Network codeSet of rules governing the rights and obligations of partiesinvolved in the supply of a transportation service.
Regasification tariffsUnit prices applied to the regasification service. They includetariffs for used capacity (“Capacity”) and tariffs for unit ofenergy transported (“Commodity”) connected, respectively,to the regasification capacity required by the Shippers andthe volume of gas unloaded from the methane tankers.
Regolatory periodA period of time, usually four years, for which the regulationsare defined for the service of transportation and dispatchingof natural gas and regasification of liquefied natural gas. Thefirst regulatory period started on 1 October 2001 and endedon 30 September 2005. The second regulatory period forthe transportation activity began on 1 October 2005 andwill end on 30 September 2009, while for the regasificationactivity it has been provisionally reduced to three yearsbeginning on 1 October 2005 to end on 30 September2008. The third regulatory period began on 1 October 2008and will end on 30 September 2012.
Thermal yearA period of time into which the regulation period is dividedand that runs from 1 October to 30 September of the fol-lowing year.
Transportation tariffsUnit prices applied to the natural gas transportation anddispatching service. They include tariffs for used capacity(“Capacity”) and tariffs for unit of energy transported(“Commodity”) connected, respectively, to the transporta-tion capacity requested by the Shippers and to the volumeof gas injected into the network.
Technical terms
Liquefied natural gas (LNG)Natural gas, mainly consisting of liquefied methane cooledat approximately -160°C under normal atmospheric pres-sure in order to make it suitable for transportation by specialships (methane tankers) or for storage in tanks. In order tobe injected into the transportation network, the liquid prod-uct must first be reconverted into its gas state in regasifica-tion plants and brought up to pressure in the pipelines.

S N A M R E T E G A S H A L F Y E A R R E P O RT AT 3 0 J U N E 2 0 0 9 / G LO S S A R Y
43
NATURAL GAS DISTRIBUTION
Commercial terms
ConcessionContract whereby the local body entrusts a company withmanagement of a service that falls within the body’s businessobject and for which the company takes on the operating risk.
End customersCustomers that purchase gas for their own use.
Gas distribution serviceNatural gas transportation service using local pipelines fromone or more delivery points to redelivery points, usually atlow pressure in urban areas, for delivery to end customers.
Network codeSet of rules governing the rights and obligations of partiesinvolved in the supply of a distribution service.
Sales or retail companyCompany that sells gas under a contract providing access ofnetworks managed by a Distributor.
Thermal yearA period of time into which the regulatory period is dividedequal to the calendar year.
Technical terms
Carried gasThe volume of gas redelivered to the users of distributionnetworks at the redelivery points.
EqualisationThe difference between revenue for the period (6/12 ofannual VRT) and that invoiced to the distribution compa-
nies based on volumes carried. The net positions with theCassa Conguaglio Settore Elettrico are defined at the end ofthe thermal year and settled in financial terms during theyear by advances.
VRT (Total Revenue Limit)Total revenue allowed by the supervisory body for the distri-bution companies to cover the cost of providing the distri-bution and measuring services.
NATURAL GAS STORAGE
Commercial terms
Injection stagePeriod from 1 April to 31 October of the same year.
Supply stagePeriod from 1 November of each year to 31 March of thesubsequent year.
Thermal yearPeriod from 1 April of each year to 31 March of the subse-quent year.
Technical terms
Field storageNecessary for technical and financial reasons and to allowthe best cultivation of natural gas fields in Italy.
Modulation storageAimed at satisfying modulation of hourly, daily and season-al demand trends.
Strategic storageAimed at stop gapping or covering reductions in supplies ofnon-EU imports or gas system crises.

Condensed interim consolidatedfinancial statements

S N A M R E T E G A S CO N D E NS E D I N T E R I M CO NS O L I DAT E D F I N A N C I A L S TAT E M E N T S / F I N A N C I A L S TAT E M E N T S
46
Consolidated balance sheet(€m) 31.12.2008 30.06.2009
Total including with Total including withrelated parties related parties
ASSETSCurrent assetsCash and cash equivalents (NOTE 1) 38 37Trade and other receivables (NOTE 2) 452 289 623 359Inventories (NOTE 3) 128 493Current tax assets (NOTE 4) 1 1Other current tax assets (NOTE 4) 2 4Other current assets (NOTE 5) 52 6 58 4
635 1,217Non-current assetsProperty, plant and equipment (NOTE 6) 10,549 15,508Compulsory inventories (NOTE 7) 411Intangible assets (NOTE 8) 39 738Equity-accounted investments (NOTE 9) 280 280Other investments (NOTE 9) 2 2Other financial assets 1 1Other non-current assets 3 1 9
10,592 16,949Assets held for sale (NOTE10) 37TOTAL ASSETS 11,227 18,203LIABILITIES AND EQUITYCurrent liabilitiesShort-term financial liabilities (NOTE 11) 1,023 1,023 2,156 2,156Short-term portion of long-term financial liabilities (NOTE 15) 14 14 14 14Trade and other payables (NOTE 12) 536 129 958 291Current tax liabilities (NOTE 13) 1 11Other current tax liabilities (NOTE 13) 4 12Other current liabilities (NOTE 14) 52 25 103 54
1,630 3,254Non-current liabilitiesLong-term financial liabilities (NOTE 15) 5,200 5,200 7,536 7,535Provisions for risks and charges (NOTE 16) 52 612Provisions for employee benefits 29 108Deferred tax liabilities (NOTE 17) 487 969Other non-current liabilities (NOTE 18) 256 19 310 29
6,024 9,535Liabilities directly associated with assetsheld for sale (NOTE 10) 12TOTAL LIABILITIES 7,654 12,801EQUITY (NOTE 19)Equity attributable to owners of the parent:Share capital 1,956 3,570Consolidation reserve (1,585)Share premium reserve 116 1,976Other reserves 1,190 1,164Retained earnings 733 836Profit for the period 530 234Treasury shares (794) (794)Interim dividend (158)Total equity attributable to owners of the parent 3,573 5,401Total equity attributable to non-controlling interests 1TOTAL EQUITY 3,573 5,402TOTAL LIABILITIES AND EQUITY 11,227 18,203

S N A M R E T E G A S CO N D E NS E D I N T E R I M CO NS O L I DAT E D F I N A N C I A L S TAT E M E N T S / F I N A N C I A L S TAT E M E N T S
47
Consolidated income statement(€m) First half 2008 First half 2009
including with including including with includingTotal related parties non-recurring Total related parties non-recurring
REVENUE (NOTE 22)
Core business revenue (NOTE 22) 934 689 917 621
Other revenue and income 6 2
Total revenue 940 919
OPERATING COSTS (NOTE 23)
Purchases, services and other costs (143) (92) (173) (92)
Personnel expense (56) (54)
Amortisation, depreciationand impairment losses (241) (248)
OPERATING PROFIT 500 444
FINANCIAL INCOME (EXPENSE) (NOTE 24)
Financial income 1 1
Financial expense (123) (120) (71) (67)
Derivatives (*) 12 12 (21) (21)
(110) (91)
PROFIT BEFORE TAX 390 353
Income taxes (NOTE 25) (131) (119)
Profit for the period 259 234
Attributable to:
- attributable to owners of the parent 259 234
- attributable to non-controlling interests
259 234
Earnings per share on the basis of the profitattributable to owners of the parent (NOTE 26)
(€ per share)
- Basic 0.15 0.13
- Diluited 0.15 0.13
(*) Beginning from the financial statements at 31 December 2008 and in order to give a better presentation of the income statement, financial income and expense are stat-ed separately and give separate mention of gains and losses on derivatives; the 2008 first half year figures have been reclassified accordingly.
(€m) First half 2008 First half 2009
Profit for the period 259 234
Other comprehensive income
Fair value gains (losses) on hedging derivatives - cash flow hedges (effective portion) 47 (36)
Tax effect of other comprehensive income (13) 10
Total other comprehensive income (after tax) 34 (26)
Total comprehensive income 293 208
. attributable to:
- attributable to owners of the parent 293 208
- attributable to non-controlling interests
293 208
Statement of comprehensive income
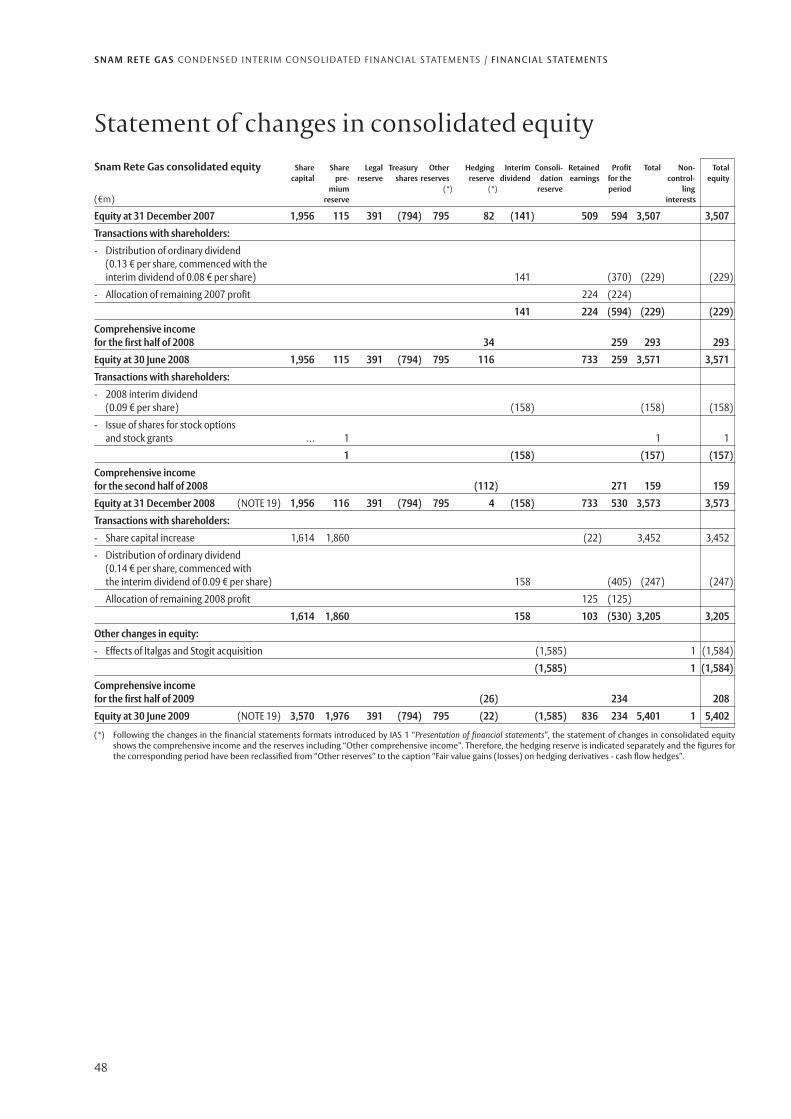
S N A M R E T E G A S CO N D E NS E D I N T E R I M CO NS O L I DAT E D F I N A N C I A L S TAT E M E N T S / F I N A N C I A L S TAT E M E N T S
48
Statement of changes in consolidated equity Snam Rete Gas consolidated equity Share Share Legal Treasury Other Hedging Interim Consoli- Retained Profit Total Non- Total
capital pre- reserve shares reserves reserve dividend dation earnings for the control- equitymium (*) (*) reserve period ling
(€m) reserve interests
Equity at 31 December 2007 1,956 115 391 (794) 795 82 (141) 509 594 3,507 3,507
Transactions with shareholders:
- Distribution of ordinary dividend(0.13 € per share, commenced with theinterim dividend of 0.08 € per share) 141 (370) (229) (229)
- Allocation of remaining 2007 profit 224 (224)
141 224 (594) (229) (229)
Comprehensive incomefor the first half of 2008 34 259 293 293
Equity at 30 June 2008 1,956 115 391 (794) 795 116 733 259 3,571 3,571
Transactions with shareholders:
- 2008 interim dividend(0.09 € per share) (158) (158) (158)
- Issue of shares for stock optionsand stock grants … 1 1 1
1 (158) (157) (157)
Comprehensive incomefor the second half of 2008 (112) 271 159 159
Equity at 31 December 2008 (NOTE 19) 1,956 116 391 (794) 795 4 (158) 733 530 3,573 3,573
Transactions with shareholders:
- Share capital increase 1,614 1,860 (22) 3,452 3,452
- Distribution of ordinary dividend(0.14 € per share, commenced withthe interim dividend of 0.09 € per share) 158 (405) (247) (247)
Allocation of remaining 2008 profit 125 (125)
1,614 1,860 158 103 (530) 3,205 3,205
Other changes in equity:
- Effects of Italgas and Stogit acquisition (1,585) 1 (1,584)
(1,585) 1 (1,584)
Comprehensive incomefor the first half of 2009 (26) 234 208
Equity at 30 June 2009 (NOTE 19) 3,570 1,976 391 (794) 795 (22) (1,585) 836 234 5,401 1 5,402
(*) Following the changes in the financial statements formats introduced by IAS 1 “Presentation of financial statements”, the statement of changes in consolidated equityshows the comprehensive income and the reserves including “Other comprehensive income”. Therefore, the hedging reserve is indicated separately and the figures forthe corresponding period have been reclassified from “Other reserves” to the caption “Fair value gains (losses) on hedging derivatives - cash flow hedges”.

S N A M R E T E G A S CO N D E NS E D I N T E R I M CO NS O L I DAT E D F I N A N C I A L S TAT E M E N T S / F I N A N C I A L S TAT E M E N T S
49
Consolidated statement of cash flows First half
(€m) 2008 2009
Profit for the period 259 234
Amortisation and depreciation (NOTE 23) 241 248
Net impairment losses 1
Change in provisions for risks and charges 17
Losses on disposal of assets, net 4
Interest income (14) (2)
Interest expense 122 91
Income taxes (NOTE 25) 131 119
Other adjustments 1 2
Cash flows from operating activities before changes in working capital 741 713
Changes:
- Inventories (18) 1
- Trade and other receivables 130 69
- Other assets (5) (4)
- Trade and other payables 2 (41)
- Other liabilities 47 35
Cash flows from operating activities 897 773
Interest collected 25 4
Interest paid (121) (85)
Income taxes paid (205) (117)
Income taxes reimbursed 4
Net cash flows from operating activities 600 575
- including with related parties (NOTE 28) 427 481
Investments:
- Property, plant and equipment (NOTE 6) (484) (392)
- Intangible assets (NOTE 8) (13) (8)
- Change in consolidation scope (4,471)
- Change in receivables and payables relating to investing activities (40) (116)
Cash flows used for investments (537) (4,987)
Disinvestments
- Property, plant and equipment 2 1
Cash flows from disinvestments 2 1
Net cash flows used in investing activities (535) (4,986)
- including with related parties (NOTE 28) (32) (4,551)
Taking on of long-term financial liabilities 311 9,306
Repayments of long-term financial liabilities (14) (8,314)
Increase (decrease) in short-term financial liabilities (133) 258
Net capital injections 3,446
Dividends paid (229) (247)
Net cash flows used in financing activities (65) 4,449
- including with related parties (NOTE 28) 37 3,042
Net cash flows for the period 0 38
Cash and cash equivalents at start of period (NOTE 1) 0 0
Cash and cash equivalents at end of period (NOTE 1) 0 38

S N A M R E T E G A S CO N D E NS E D I N T E R I M CO NS O L I DAT E D F I N A N C I A L S TAT E M E N T S / F I N A N C I A L S TAT E M E N T S
50
First half 2009(€m) Partial Total
Change in consolidation scope
Current assets 658
- Cash and cash equivalents 38
- Trade and other receivables 245
- Inventories 367
- Current tax assets 1
- Other current tax assets 2
- Other assets 5
Non-current assets 6,209
- Property, plant and equipment 4,811
- Compulsory inventories 411
- Intangible assets 700
- Equity-accounted investments 280
- Other investments 2
- Other assets 5
Assets held for sale 37
Current liabilities (1,489)
- Short-term financial liabilities (875)
- Short-term portion of long-term financial liabilities (8)
- Trade and other payables (561)
- Current tax liabilities (8)
- Other current tax liabilities (9)
- Other current liabilities (28)
Non-current liabilities (2,475)
- Long-term financial liabilities (1,336)
- Provisions for risks and charges (543)
- Provisions for employee benefits (78)
- Deferred tax liabilities (518)
- Other non-current liabilities
Liabilities directly associated with assets held for sale (12)
Difference between acquisition price and net equity (*) 1,582
Net effect of investments 4,510
Non-controlling interests (1)
Acquisition price 4,509
less:
Cash and cash equivalents (38)
Cash flow on investments 4,471
(*) Equal to € 4,509 million and € 2,927 million, respectively.
The acquisition of 100% of Stogit and Italgas from the ultimate parent, Eni S.p.A., is a related party transaction. Additionalinformation on the transaction is given in the section on the acquisition of Italgas and Stogit in the directors’ report.
Additional disclosures

S N A M R E T E G A S CO N D E NS E D I N T E R I M CO NS O L I DAT E D F I N A N C I A L S TAT E M E N T S / BASIS OF PREPARATION AND ACCOUNTING POLICIES
51
Background information
Snam Rete Gas S.p.A. is an Italian company listed on the Milan stock exchange with its registered office in PiazzaSanta Barbara 7, San Donato Milanese (MI) and controlled by Eni S.p.A. which has a 52.54% stake therein.The group’s business activities consist of the regulated transportation of natural gas, regasification of liquefiednatural gas (LNG) and the storage and distribution of natural gas. It operates using an integrated system of infra-structure all based in Italy.
Basis of preparation and accounting policies
The condensed interim consolidated financial statements have been prepared in line with IAS 34 “InterimFinancial Reporting”. The notes are presented in a short-form version. The consolidation and accounting policies,disclosed in the notes to the annual consolidated financial statements, to which reference should be made, havebeen applied to prepare the condensed interim consolidated financial statements, supplemented by the infor-mation set out below considering the effects of the change in the consolidation scope. The figures given in thefinancial statements and notes thereto are in millions of Euros.The consolidated companies, unconsolidated subsidiaries, jointly controlled entities, associates and other sig-nificant investments pursuant to article 126 of Consob resolution no. 11971 of 14 May 1999 and subsequentamendments are shown separately in the annex “Significant companies and investments at 30 June 2009”,which forms an integral part of these notes. The annex also shows changes in the consolidation scope duringthe period.The board of directors of Snam Rete Gas S.p.A. approved the condensed interim consolidated financial state-ments at 30 June 2009 during its meeting of 29 July 2009. They were reviewed by PricewaterhouseCoopers S.p.A..The scope of a review is significantly less than that of an audit performed in accordance with generally acceptedauditing standards.
Consolidation policies
Assets, liabilities, expense and income of the consolidated companies are recognised in the consolidated finan-cial statements on a line-by-line basis. The carrying amount of the investment is eliminated against the parent’spro rata share of the investee’s equity.Business combinations among entities not subject to common control when the group acquires control of anentity are recognised using the acquisition method. The acquisition cost is the acquisition-date fair value of theassets acquired, the liabilities assumed, equity instruments issued and any other directly related costs. Acquiredassets and assumed liabilities and contingent liabilities are recognised at the acquisition-date fair value. The dif-ference between the acquisition cost and fair value of the acquired assets and assumed liabilities and contingentliabilities is recognised, if positive, under intangible assets as goodwill. If negative and after having checked thecorrect measurement of the fair value of the acquired assets and assumed liabilities and contingent liabilities andthe acquisition cost, the difference is taken directly to profit or loss as income.Business combinations whereby the entities involved are controlled by the same company or the same compa-nies both before and after the business combination and such control is not temporary qualify as transactionsunder common control. They are scoped out from IFRS 3 or the other IFRS. Given the lack of a reference standard,the selection of an accounting treatment for these transactions, for which a significant influence on future cashflows cannot be demonstrated, is based on the principle of prudence leading to application of the predecessorvalues method for the acquired transferred net assets. The assets are recognised at the carrying amounts shownin the acquirees’ accounting records before the transaction or, if available, the carrying amounts in the commonparent’s consolidated financial statements. Should the transfer amounts be higher than these historical carryingamounts, the excess is eliminated adjusting the acquirees’ equity downwards. The equity and profit for the yearattributable to the non-controlling interests are recognised in the relevant financial statements captions. Theequity attributable to the non-controlling interests is determined on the basis of the fair values allocated toassets and liabilities on the date when control is assumed, excluding any related goodwill.
S N A M R E T E G A S CO N D E NS E D I N T E R I M CO NS O L I DAT E D F I N A N C I A L S TAT E M E N T S / BASIS OF PREPARATION AND ACCOUNTING POLICIES
52
Current assets
Inventories
Inventories, including compulsory stocks, other than contract work in progress, are recognised at the lower ofpurchase or production cost and net realisable value, being the amount the company expects to obtain fromtheir sale during normal business activities. Cost is determined using the weighted average cost method. Thecompulsory inventories are included in non-current assets in the caption “Compulsory inventories”. Sales andrepurchases of strategic gas do not entail the effective transfer of risks and rewards of ownership and, therefore,the transaction does not generate revenue and is recognised by using payable and receivable accounts with thecounterparty. Accordingly, these transactions do not involve movements of inventories. Contract work inprogress is measured based on the considerations agreed on the basis of the stage of completion of the work,using the cost to cost method.
Non-current assets
Intangible assets
The carrying amount of storage concessions, determined as instructed by the Ministry for Production Activitiesin its decree of 3 November 2005, is recognised under “Concessions, licences, trademarks and similar rights” andis not amortised.Deferred charges related to costs incurred for share capital increases are offset against equity, net of the relatedtax effect.
Investments
Investments in subsidiaries that are not consolidated, jointly controlled entities and associates are measuredusing the equity method. When no significant effects are had on the group’s financial position and results ofoperations, the unconsolidated subsidiaries, jointly controlled entities and associates are measured at costadjusted for impairment. If the reasons for recognition of the impairment loss are no longer valid, the impairmentloss on investments carried at cost is reversed to the extent of such loss with the effect recognised in “Otherincome (losses) on investments” in profit or loss.Other investments, recognised under non-current assets, are measured at fair value with recognition of theeffects thereof in “Other reserves” under equity. The reserve is reclassified to profit or loss if impairment lossesare recognised or the investment is sold. When the fair value can no longer be reliably determined, the invest-ment is measured at cost adjusted for impairment losses which are not reversed.
Use of estimates
Reference should be made to the annual consolidated financial statements for information on the utilisation of esti-mates, except for that set out below to reflect the more significant effects of the change in the consolidation scope.
Term and carrying amount of assets under concession
The gas distribution business is run on a concession regime, whereby the service is entrusted to the company bythe local public bodies. Legislative decree no. 164/00 (the Letta decree) established that, with respect to theterm of concessions, all contracts shall be tendered for before the end of the so called “temporary period”(before 31 December 2012 for the group) and that the new concession terms shall not exceed 12 years. Uponexpiry of the concession, the outgoing operator is paid compensation defined using the industrial estimate cri-teria for the transfer of its distribution network, excluding any freely transferable assets.With respect to the estimates made by directors for the determination of depreciation criteria, the carryingamount of the assets at the concession expiry date should not exceed the above industrial value.
Financial statements
The interim consolidated financial statements of Snam Rete Gas at 30 June 2009 have been prepared on the basisof the revised IAS 1 “Presentation of financial statements”, endorsed with Regulation 1274/2008 issued by the

S N A M R E T E G A S CO N D E NS E D I N T E R I M CO NS O L I DAT E D F I N A N C I A L S TAT E M E N T S / BASIS OF PREPARATION AND ACCOUNTING POLICIES
53
European Commission on 17 December 2008 and applicable from 1 January 2009. Specifically, the new measuresare aimed at obtaining the separate presentation of changes in equity due to transactions with owners fromother changes in equity.In order to integrate disclosure of its results of operations as required by the revised standard, the parent opted toprepare two separate statements: the “income statement”, which shows the profit of loss for the period, and the“statement of comprehensive income” which includes both the profit or loss for the period and the non-ownerchanges in equity recognised in equity (Other comprehensive income) as expressly provided for by the IFRS.Due to the above changes, the “Statement of changes in consolidated equity” shows the total amount of com-prehensive income and the reserves which include the other comprehensive income items.The balance sheet captions are classified as “current” and “non-current” while the income statement captions areclassified by nature.The statement of changes in consolidated equity reconciles the opening and closing balances of each equity caption.The statement of cash flows is presented using the “indirect” method, adjusting the profit or loss for the year bythe non-monetary items.This form of presentation adequately represents the group’s financial position, results of operations, changes inequity and cash flows.

S N A M R E T E G A S CO N D E NS E D I N T E R I M CO NS O L I DAT E D F I N A N C I A L S TAT E M E N T S / NOTES
54
NOTES
Current assets
Cash and cash equivalentsCash and cash equivalents of € 38 million (31 December 2008: less than € 1 million) are as follows:
(€m) 31.12.2008 30.06.2009
Bank and post office accounts 1
Financial companies 37
38
The € 38 million increase is due to the cash and cash equivalents of the newly consolidated companies. Note 20 “Otherinformation” gives a complete analysis of the assets and liabilities recognised following consolidation of the acquirees.
Trade and other receivablesTrade and other receivables of € 623 million (31 December 2008: € 452 million) comprise:
(€m) 31.12.2008 30.06.2009
Trade receivables 417 520
Receivables for investments/disinvestments 12 25
Financial receivables:
- held for operating activities 1
Other receivables 23 77
452 623
Receivables are shown net of the provision for bad debts of € 29 million (31 December 2008: € 1 million).
Changes inconsolidation
(€m) 31.12.2008 Accrual Utilisation scope 30.06.2009
Provision for bad debts 1 28 29
1 28 29
The € 171 million increase in this caption is due to the change in consolidation scope of € 243 million, including € 200million and € 43 million related to the natural gas distribution and storage sectors, respectively, the effects of which havebeen partly offset by changes in operating activities in the first half of 2009 for the natural gas transportation and regasi-fication activities.The other receivables of € 77 million (31 December 2008: € 23 million) comprise:
(€m) 31.12.2008 30.06.2009
Advances to suppliers 3 15
Parent VAT consolidation scheme receivables 3
VAT advance 17
IRES receivables for national consolidated tax scheme 3
Other receivables 59
23 77
2
1

S N A M R E T E G A S CO N D E NS E D I N T E R I M CO NS O L I DAT E D F I N A N C I A L S TAT E M E N T S / NOTES
55
The other receivables of € 59 million mainly relate to the amounts due from Cassa Conguaglio Settore Elettrico (€ 27million), principally due to redemption of energy efficiency certificates1 (€ 26 million), and from state bodies (€ 9 mil-lion) for local taxes.The other receivables arising from the change in consolidation scope amount to € 72 million.All the receivables are in Euros. Receivables due from related parties are disclosed in note 28 “Related party transac-tions”.
InventoriesInventories of € 493 million (31 December 2008: € 128 million) are analysed in the following table:
31.12.2008 30.06.2009
Gross Provision Net Gross Provision Netcarrying for carrying carrying for carrying
(€m) amount inventories amount amount inventories amount Change
Raw materials, consumables and supplies 135 (7) 128 156 (9) 147 19
Finished products and goods 343 343 343
Contract work in process 3 3 3
135 (7) 128 502 (9) 493 365
Raw materials, consumables, supplies and goods (€ 147 million) mainly comprise: (i) spare parts for the pipeline (€ 65million) and distribution networks (€ 18 million); (ii) natural gas purchased for the transportation network’s compres-sion stations (€ 58 million).Finished goods (€ 343 million) relate to natural gas stored inside storage wells, net of the compulsory inventories recog-nised under non-current assets.Contract work in progress (€ 3 million) mainly refers to services for energy savings projects carried out as part of the dis-tribution service.Inventories are shown net of the provision for inventories of € 9 million (31 December 2008: € 7 million).Inventories acquired due to the change in consolidation scope amount to € 367 million.
Current tax assets and other current tax assetsCurrent tax assets of € 1 million (unchanged from 31 December 2008) mainly comprise the IRES and IRAP tax credits forwithholdings and larger payments made.Other current tax assets of € 4 million (31 December 2008: € 2 million) principally refer to VAT receivables for subsidiariesthat did not join the Eni group VAT scheme (€ 2 million) and the claim for the recovery of taxes not deducted on pur-chases of vehicles (€ 1 million).Note 25 “Income taxes” gives information about the tax charge for the period.
Other current assetsThe other current assets of € 58 million (31 December 2008: € 52 million) comprise:
(€m) 31.12.2008 30.06.2009
Other prepayments 2 12
Fair value of derivatives 3 1
Accrued interest income on derivatives 2
Other current assets 45 45
52 58
3
5
4
(1) Article 16.4 of Legislative decree no. 164 of 23 May 2000, related to the liberalisation of the gas market, requires that natural gas distribution companies pursueenergy savings objectives for civil use and develop renewable sources of energy and that the distribution companies be assigned the Energy Efficiency Certificates(introduced with Ministerial decree of 20 July 2004), cancellation of which entails reimbursement by the Cassa Conguaglio del Settore Elettrico using the fundsobtained with the Energy Savings component of the distribution tariffs.
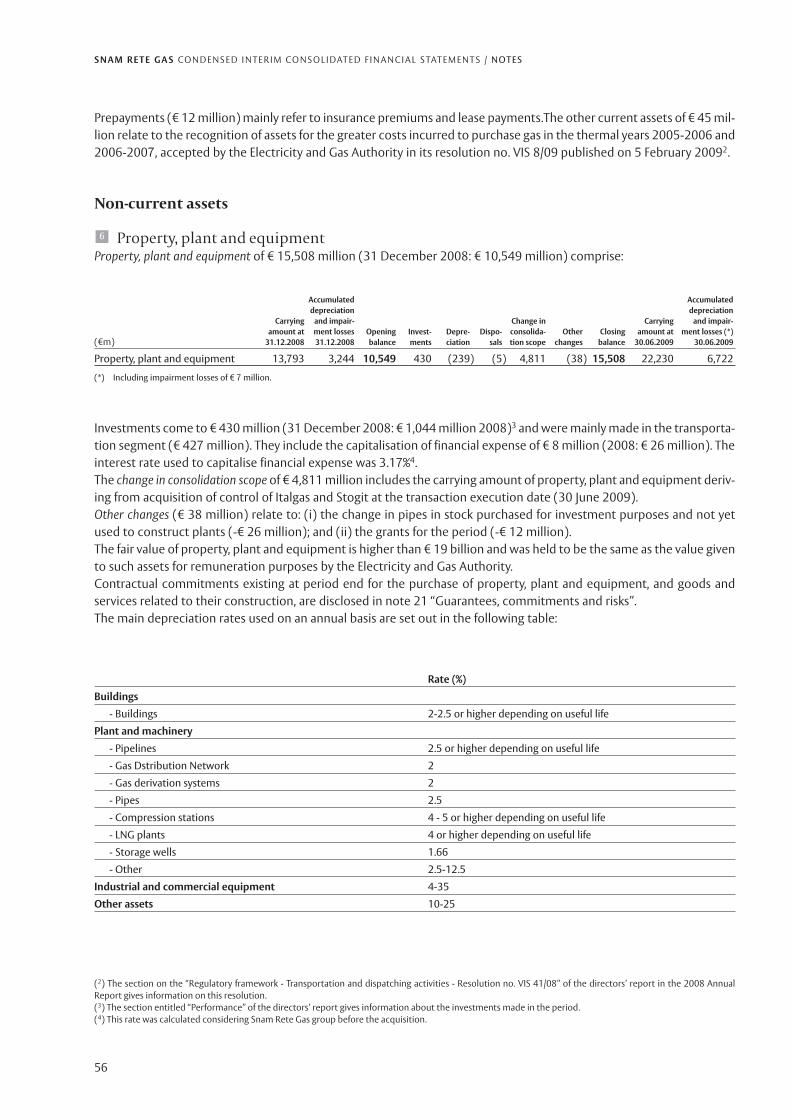
S N A M R E T E G A S CO N D E NS E D I N T E R I M CO NS O L I DAT E D F I N A N C I A L S TAT E M E N T S / NOTES
56
Prepayments (€ 12 million) mainly refer to insurance premiums and lease payments.The other current assets of € 45 mil-lion relate to the recognition of assets for the greater costs incurred to purchase gas in the thermal years 2005-2006 and2006-2007, accepted by the Electricity and Gas Authority in its resolution no. VIS 8/09 published on 5 February 20092.
Non-current assets
Property, plant and equipmentProperty, plant and equipment of € 15,508 million (31 December 2008: € 10,549 million) comprise:
Accumulated Accumulateddepreciation depreciation
Carrying and impair- Change in Carrying and impair-amount at ment losses Opening Invest- Depre- Dispo- consolida- Other Closing amount at ment losses (*)
(€m) 31.12.2008 31.12.2008 balance ments ciation sals tion scope changes balance 30.06.2009 30.06.2009
Property, plant and equipment 13,793 3,244 10,549 430 (239) (5) 4,811 (38) 15,508 22,230 6,722
(*) Including impairment losses of € 7 million.
Investments come to € 430 million (31 December 2008: € 1,044 million 2008)3 and were mainly made in the transporta-tion segment (€ 427 million). They include the capitalisation of financial expense of € 8 million (2008: € 26 million). Theinterest rate used to capitalise financial expense was 3.17%4.The change in consolidation scope of € 4,811 million includes the carrying amount of property, plant and equipment deriv-ing from acquisition of control of Italgas and Stogit at the transaction execution date (30 June 2009).Other changes (€ 38 million) relate to: (i) the change in pipes in stock purchased for investment purposes and not yetused to construct plants (-€ 26 million); and (ii) the grants for the period (-€ 12 million).The fair value of property, plant and equipment is higher than € 19 billion and was held to be the same as the value givento such assets for remuneration purposes by the Electricity and Gas Authority.Contractual commitments existing at period end for the purchase of property, plant and equipment, and goods andservices related to their construction, are disclosed in note 21 “Guarantees, commitments and risks”.The main depreciation rates used on an annual basis are set out in the following table:
Rate (%)
Buildings
- Buildings 2-2.5 or higher depending on useful life
Plant and machinery
- Pipelines 2.5 or higher depending on useful life
- Gas Dstribution Network 2
- Gas derivation systems 2
- Pipes 2.5
- Compression stations 4 - 5 or higher depending on useful life
- LNG plants 4 or higher depending on useful life
- Storage wells 1.66
- Other 2.5-12.5
Industrial and commercial equipment 4-35
Other assets 10-25
6
(2) The section on the “Regulatory framework - Transportation and dispatching activities - Resolution no. VIS 41/08” of the directors’ report in the 2008 AnnualReport gives information on this resolution.(3) The section entitled “Performance” of the directors’ report gives information about the investments made in the period.(4) This rate was calculated considering Snam Rete Gas group before the acquisition.

S N A M R E T E G A S CO N D E NS E D I N T E R I M CO NS O L I DAT E D F I N A N C I A L S TAT E M E N T S / NOTES
57
Net property, plant and equipment by business segment
(€m)
31.12.2008 30.06.2009
Natural gas transportation 10,463 10,610
LNG regasification 86 87
Natural gas distribution 3,524
Natural gas storage 1,287
10,549 15,508
Compulsory inventoriesCompulsory inventories of € 411 million comprise natural gas equal to 5,081 million standard cubic metres as requiredby Presidential decree no. 22 of 31 January 2001, for storage activities. The Ministry for Economic Development sets thecompulsory volumes once a year.
Intangible assetsIntangible assets of € 738 million (31 December 2008: € 39 million) comprise:
Accumulated Accumulatedamortisation amortisation
Carrying and impair- Change in Carrying and impair-amount at ment losses Opening Invest- Amorti- consolida- Other Closing amount at ment losses
(€m) 31.12.2008 31.12.2008 balance ments sation tion scope changes balance 30.06.2009 30.06.2009
Intangible assets with finite useful lives 323 284 39 8 (9) 691 729 1,363 634
Intangible assets with indefinite useful lives 9 9 9
Total intangible assets 323 284 39 8 (9) 700 738 1,372 634
Investments in intangible assets of € 8 million (31 December 2008: € 39 million) mainly relate to internal information sys-tem development projects.Contractual commitments existing at period end for the purchase of intangible assets, and services related to theirdevelopment, are disclosed in note 21 “Guarantees, commitments and risks”.The change in consolidation scope of € 700 million includes the carrying amount of the intangible assets acquired as partof the transaction involving Italgas and Stogit. It mainly refers to: (i) with respect to intangible assets with finite useful lives,storage concessions (€ 655 million) and, to a lesser degree, gas distribution service concessions (€ 9 million); and (ii) forthe intangible assets with indefinite useful lives, goodwill recognised upon acquisition by Italgas of 100% of Siciliana GasS.p.A. (€ 9 million).Recoverability of goodwill was checked by discounting the estimated cash flows determined by considering recent mar-ket trends. The assumptions used are based on the present interest rates levels.
Equity-accounted investments and other investmentsEquity-accounted investments (€ 280 million) and other investments (€ 2 million) relate to the investments acquiredwith control of Italgas. They include:
Equity-accounted investments(€m)
30.06.2009
Investments in jointly controlled entities 231
Investments in associates 49
280
9
8
7

S N A M R E T E G A S CO N D E NS E D I N T E R I M CO NS O L I DAT E D F I N A N C I A L S TAT E M E N T S / NOTES
58
The carrying amount of equity-accounted investments relates to:
(€m)
30.06.2009
Investments in jointly controlled entities:
- Toscana Energia S.p.A. 131
- Azienda Energia e Servizi Torino S.p.A. 94
- Metano Borgomanero S.p.A. 2
- Servizi Territori Aree e Penisole S.p.A. 1
- Metano S.Angelo Lodigiano S.p.A. 1
- Metano Arcore S.p.A. 1
- Umbria Distribuzione Gas S.p.A. 1
Total Investments in jointly controlled entities 231
Investments in associates:
- ACAM Gas S.p.A. 46
- Acqua Campania S.p.A. 3
Total investments in associates 49
280
Other investments
(€m)
30.06.2009
Other investments
- COM. e S.V. Gas & Power S.r.l. 1
- Inversora del Aconcagua S.A 1
2
Assets held for sale and directly related liabilitiesAssets held for sale (€ 37 million) include: (i) property owned by Italgas (€ 29 million), no longer used by it in its opera-tions, following the commitments arising from the agreement with Eni to acquire Italgas5; (ii) the sale of Italgas’ invest-ment (17.77%) in the natural gas distribution company Toscana Energia Clienti S.p.A. (€ 8 million) to Eni S.p.A.. This trans-action is part of the ongoing rationalisation aimed at centralising the gas distribution business in Italgas.Liabilities directly associated with assets held for sale (€ 12 million) relate to environmental provisions for the restorationwork on the property.
Current liabilities
Short-term financial liabilitiesShort-term financial liabilities of € 2,156 million (31 December 2008: € 1,023 million) are all in Euros and relate to thecredit lines granted by Eni S.p.A..The € 1,133 million increase is mainly due to the financial liabilities assumed with consolidation of the acquirees of € 875million.They only comprise floating rate loans. The average interest rate on short-term financial liabilities, related to Snam ReteGas Group before the acquisition, was 1.40% (first half of 2008: 4.17%).
11
10
(5) Note 21 “Guarantees, commitments and risks - Commitments deriving from the acquisition of Italgas and Stogit from Eni” provides information on the parties’commitments.

S N A M R E T E G A S CO N D E NS E D I N T E R I M CO NS O L I DAT E D F I N A N C I A L S TAT E M E N T S / NOTES
59
The market value of short-term financial liabilities equals their carrying amount.At 30 June 2009, the group has complied with all the loan conditions and covenants.
Trade and other payablesTrade and other payables of € 958 million (31 December 2008: € 536 million) comprise:
(€m) 31.12.2008 30.06.2009
Trade payables 161 469
Payables for investments 298 292
Payables on account and advance 4 21
Other payables 73 176
536 958
The increase of € 422 million is mainly due to the change in consolidation scope (€ 560 million, including € 351 millionand € 209 million related to the natural gas distribution and storage sectors, respectively), the effects of which werepartly offset by the decrease in payables for investments made in the natural gas transportation segment.Payables for investments of € 292 million (31 December 2008: € 298 million) mainly relate to the transportation (€ 186million), distribution (€ 54 million) and natural gas storage (€ 51 million) segments.Other payables of € 176 million (31 December 2008: € 73 million) comprise:
(€m) 31.12.2008 30.06.2009
IRES payables to parent for national tax consolidation scheme 3 42
Payables to employees 13 32
Payable to Cassa Conguaglio Settore Elettrico (Electricity Equalisation Fund) 9 28
Social security contributions 7 23
Public administrations 21
Payable for group VAT scheme 40 17
Other 1 13
73 176
Payables due to the Cassa Conguaglio per il Settore Elettrico (€ 28 million) comprise: (i) the fees to be paid as per reso-lution no. 277/07 (Interrupibility) and resolution no. 45/07 (Equalisation) of the Electricity and Gas Authority (€ 16 mil-lion); and (ii) the amounts to be paid for exceeding the maximum daily limit (€ 12 million) pursuant to article 9 of res-olution no. 50/06 covering storage activities.Note 28 “Related party transactions” gives information about payables due to related parties.
Current tax liabilities and other current tax liabilitiesCurrent tax liabilities of € 11 million (31 December 2008: € 1 million) relate to IRAP (€ 10 million) and IRES (€ 1 million),for the group companies that have not adopted the national consolidated tax scheme.Other current tax liabilities of € 12 million (31 December 2008: € 4 million) mainly relate to IRPEF withholdings onemployees’ remuneration (€ 8 million) and VAT (€ 3 million) for the group companies that have not joined Eni group’sVAT scheme.Current tax liabilities and other current tax liabilities related to the change in consolidation scope amount to € 8 millionand € 9 million, respectively.Note 25 “Income taxes” gives information about the tax charge for the year.
13
12

S N A M R E T E G A S CO N D E NS E D I N T E R I M CO NS O L I DAT E D F I N A N C I A L S TAT E M E N T S / NOTES
60
Other current liabilitiesThe other current liabilities of € 103 million (31 December 2008: € 52 million) comprise:
(€m) 31.12.2008 30.06.2009
Fair value of derivatives 25 50
Accrued interest expense on derivatives 4
Accrued and deferred income 2 4
Other current liabilities 25 45
52 103
The disclosures about the fair value of the derivatives existing at period end are summarised below.
31.12.2008 30.06.2009
(€m) Assets Liabilities Assets Liabilities
Interest rate swaps - Cash flow hedges 3 (44) 1 (79)
Less:
- Non-current portion 19 29
Current portion 3 (25) 1 (50)
The fair value of hedging derivatives and their classification as a current/non-current asset/liability are determined usinggenerally accepted financial valuation models and market prices at the balance sheet date.Fair value losses taken to equity amount to € 26 million, net of the related tax effect (31 December 2008: € 78 million).The loss related to the ineffective portion of hedging derivatives taken to profit or loss (Financial income and expense -derivatives) amounts to € 2 million (first half of 2008: € 1 million).At 30 June 2009, Snam Rete Gas has nine cash flow hedges. The characteristics of these contracts and their fair values areanalysed below:
(€m)Contract Contract Term Nominal amount Rate Rate Fair value
Type of contract start date expiry date (years) 31.12.2008 30.06.2009 sold purchased 31.12.2008 30.06.2009
Interest rate swap 01.10.2002 30.09.2009 7 500 500 euribor fixed rate 2.73% (6) (4)plus inflation
rate FOI
Interest rate swap 19.10.2004 19.10.2009 5 300 300 euribor fixed rate 1 (3)
Interest rate swap 24.11.2005 24.11.2010 5 700 700 euribor fixed rate (6) (18)
Interest rate swap 24.11.2005 24.11.2015 10 500 500 euribor fixed rate (4) (15)
Interest rate swap 26.03.2007 26.03.2012 5 500 500 euribor fixed rate (17) (26)
Interest rate swap 20.03.2008 20.03.2011 3 300 300 euribor fixed rate (7) (11)
Interest rate swap 30.06.2009 28.01.2016 7 700 euribor fixed rate (4)
Interest rate swap 30.09.2009 30.09.2011 2 500 euribor fixed rate (1)
Interest rate swap 19.10.2009 19.10.2011 2 300 euribor fixed rate
2,800 4,300 (39) (82)
The group agrees with the counterparty to exchange the difference between a floating rate and fixed rate or inflation-linked rate calculated using the reference nominal amount at fixed dates.The group agreed three new interest rate swaps during the period, including: (i) two swaps of € 500 million and € 300million hedging floating-rate loans of the same amounts and an original maturity (September 2009 and October 2009)which was extended for two years. The two derivative contracts are valid from the loans’ original expiry date until theextension date; and (ii) a € 700 million swap agreed to hedge a new floating rate loan maturing in 2016.The other current liabilities (€ 45 million) include the current portion of the greater revenue invoiced compared to theceiling established by the Electricity and Gas Authority and the fines charged to shippers that exceeded their capacityallowances for the transportation and storage activities of € 20 million and € 25 million respectively, to be returned tothe shippers as per resolutions no. 166/05 and 50/06 of the Electricity and Gas Authority.
14
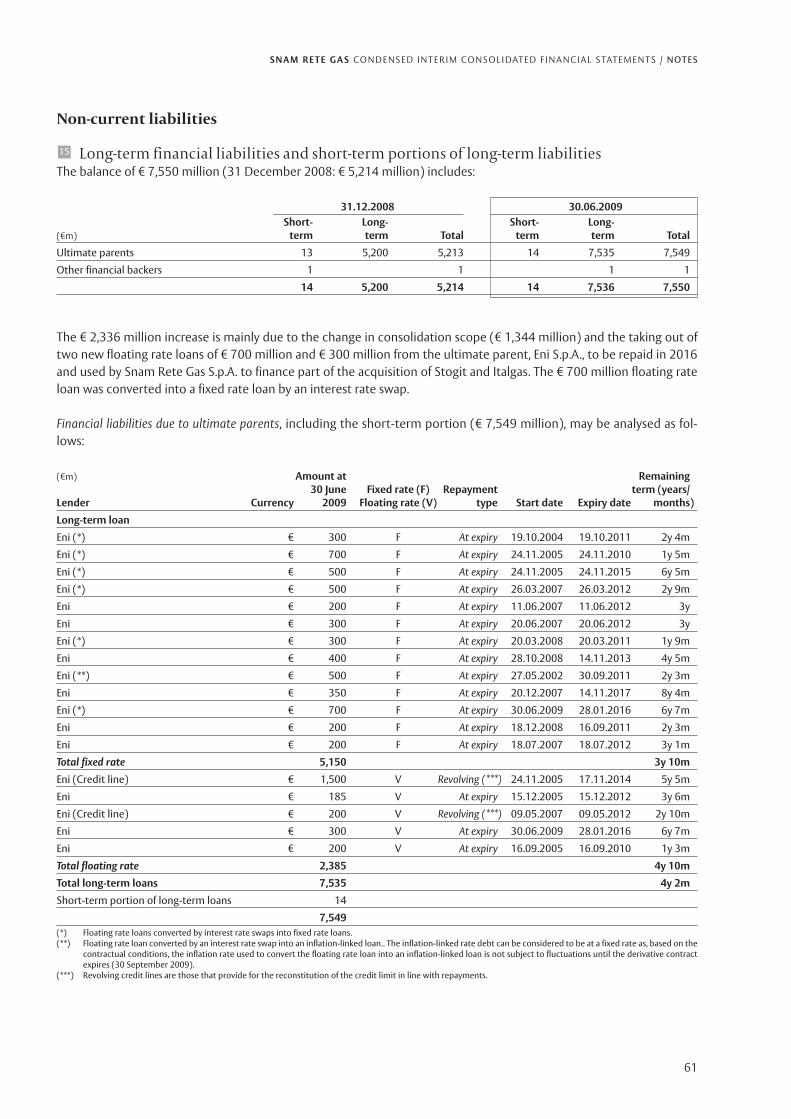
S N A M R E T E G A S CO N D E NS E D I N T E R I M CO NS O L I DAT E D F I N A N C I A L S TAT E M E N T S / NOTES
61
Non-current liabilities
Long-term financial liabilities and short-term portions of long-term liabilitiesThe balance of € 7,550 million (31 December 2008: € 5,214 million) includes:
31.12.2008 30.06.2009Short- Long- Short- Long-
(€m) term term Total term term Total
Ultimate parents 13 5,200 5,213 14 7,535 7,549
Other financial backers 1 1 1 1
14 5,200 5,214 14 7,536 7,550
The € 2,336 million increase is mainly due to the change in consolidation scope (€ 1,344 million) and the taking out oftwo new floating rate loans of € 700 million and € 300 million from the ultimate parent, Eni S.p.A., to be repaid in 2016and used by Snam Rete Gas S.p.A. to finance part of the acquisition of Stogit and Italgas. The € 700 million floating rateloan was converted into a fixed rate loan by an interest rate swap.
Financial liabilities due to ultimate parents, including the short-term portion (€ 7,549 million), may be analysed as fol-lows:
(€m) Amount at Remaining30 June Fixed rate (F) Repayment term (years/
Lender Currency 2009 Floating rate (V) type Start date Expiry date months)
Long-term loan
Eni (*) € 300 F At expiry 19.10.2004 19.10.2011 2y 4m
Eni (*) € 700 F At expiry 24.11.2005 24.11.2010 1y 5m
Eni (*) € 500 F At expiry 24.11.2005 24.11.2015 6y 5m
Eni (*) € 500 F At expiry 26.03.2007 26.03.2012 2y 9m
Eni € 200 F At expiry 11.06.2007 11.06.2012 3y
Eni € 300 F At expiry 20.06.2007 20.06.2012 3y
Eni (*) € 300 F At expiry 20.03.2008 20.03.2011 1y 9m
Eni € 400 F At expiry 28.10.2008 14.11.2013 4y 5m
Eni (**) € 500 F At expiry 27.05.2002 30.09.2011 2y 3m
Eni € 350 F At expiry 20.12.2007 14.11.2017 8y 4m
Eni (*) € 700 F At expiry 30.06.2009 28.01.2016 6y 7m
Eni € 200 F At expiry 18.12.2008 16.09.2011 2y 3m
Eni € 200 F At expiry 18.07.2007 18.07.2012 3y 1m
Total fixed rate 5,150 3y 10m
Eni (Credit line) € 1,500 V Revolving (***) 24.11.2005 17.11.2014 5y 5m
Eni € 185 V At expiry 15.12.2005 15.12.2012 3y 6m
Eni (Credit line) € 200 V Revolving (***) 09.05.2007 09.05.2012 2y 10m
Eni € 300 V At expiry 30.06.2009 28.01.2016 6y 7m
Eni € 200 V At expiry 16.09.2005 16.09.2010 1y 3m
Total floating rate 2,385 4y 10m
Total long-term loans 7,535 4y 2m
Short-term portion of long-term loans 14
7,549(*) Floating rate loans converted by interest rate swaps into fixed rate loans.(**) Floating rate loan converted by an interest rate swap into an inflation-linked loan.. The inflation-linked rate debt can be considered to be at a fixed rate as, based on the
contractual conditions, the inflation rate used to convert the floating rate loan into an inflation-linked loan is not subject to fluctuations until the derivative contractexpires (30 September 2009).
(***) Revolving credit lines are those that provide for the reconstitution of the credit limit in line with repayments.
15

S N A M R E T E G A S CO N D E NS E D I N T E R I M CO NS O L I DAT E D F I N A N C I A L S TAT E M E N T S / NOTES
62
The revolving credit lines had been fully used at 30 June 2009 (like at 31 December 2008). There were no cases of breachof loan agreements at the reporting date.There are no financial liabilities subject to covenants.
Long-term financial liabilities are broken down in the following table by type of interest rate:
31.12.2008 30.06.2009
(€m) Value % Value %
Fixed rate 3,713 71 5,165 68
Floating rate 1,501 29 2,385 32
5,214 100 7,550 100
Net financial debt, commented on in the section on the group’s performance in the directors’ report, is as follows:
31.12.2008 30.06.2009
Non- Non-(€m) Current current Total Current current Total
A. Cash and cash equivalents with related parties 37 37
B. Cash and cash equivalents 1 1
C. Securities not held for operating activities
D. Cash and cash equivalents (A+B+C) 38 38
E. Financial receivables not held for operating activities 1 1 1 1
F. Short-term financial liabilities to banks
G. Long-term financial liabilities to banks
H. Bond issues
I. Short-term financial liabilities to related parties 1,023 1,023 2,156 2,156
L. Long-term financial liabilities to related parties 14 5,200 5,214 14 7,535 7,549
M. Other short-term financial liabilities
N. Other long-term financial liabilities 1 1
O. Gross financial debt (F+G+H+I+L+M+N) 1,037 5,200 6,237 2,170 7,536 9,706
P. Net financial debt (O-D-E) 1,037 5,199 6,236 2,132 7,535 9,667
Provisions for risks and chargesProvisions for risks and charges of € 612 million (31 December 2008: € 52 million) include:
Change inUtilisation consoli-
Opening Effect of for for dation Closing(€m) balance Accrual discounting charges excess scope Other balance
Provision for site dismantlement and restoration 12 375 387
Provision for legal disputes 35 16 16 67
Provision for future costs(Cassa Conguaglio Settore Elettrico) 66 66
Provision for environmental risks and charges 61 61
Provision for termination benefits 1 1
Other provisions 4 1 25 30
52 17 543 612
The change in consolidation scope of € 543 million includes the acquirees’ provisions.
16
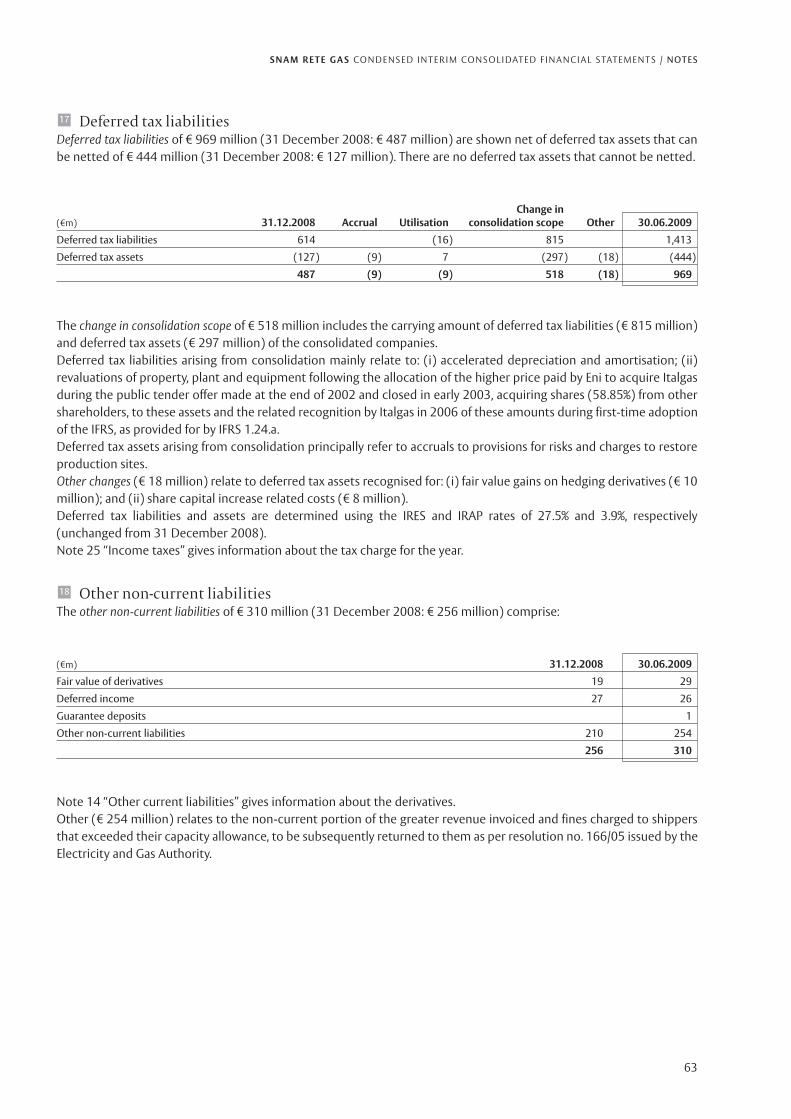
S N A M R E T E G A S CO N D E NS E D I N T E R I M CO NS O L I DAT E D F I N A N C I A L S TAT E M E N T S / NOTES
63
Deferred tax liabilitiesDeferred tax liabilities of € 969 million (31 December 2008: € 487 million) are shown net of deferred tax assets that canbe netted of € 444 million (31 December 2008: € 127 million). There are no deferred tax assets that cannot be netted.
Change in(€m) 31.12.2008 Accrual Utilisation consolidation scope Other 30.06.2009
Deferred tax liabilities 614 (16) 815 1,413
Deferred tax assets (127) (9) 7 (297) (18) (444)
487 (9) (9) 518 (18) 969
The change in consolidation scope of € 518 million includes the carrying amount of deferred tax liabilities (€ 815 million)and deferred tax assets (€ 297 million) of the consolidated companies.Deferred tax liabilities arising from consolidation mainly relate to: (i) accelerated depreciation and amortisation; (ii)revaluations of property, plant and equipment following the allocation of the higher price paid by Eni to acquire Italgasduring the public tender offer made at the end of 2002 and closed in early 2003, acquiring shares (58.85%) from othershareholders, to these assets and the related recognition by Italgas in 2006 of these amounts during first-time adoptionof the IFRS, as provided for by IFRS 1.24.a.Deferred tax assets arising from consolidation principally refer to accruals to provisions for risks and charges to restoreproduction sites.Other changes (€ 18 million) relate to deferred tax assets recognised for: (i) fair value gains on hedging derivatives (€ 10million); and (ii) share capital increase related costs (€ 8 million).Deferred tax liabilities and assets are determined using the IRES and IRAP rates of 27.5% and 3.9%, respectively(unchanged from 31 December 2008).Note 25 “Income taxes” gives information about the tax charge for the year.
Other non-current liabilitiesThe other non-current liabilities of € 310 million (31 December 2008: € 256 million) comprise:
(€m) 31.12.2008 30.06.2009
Fair value of derivatives 19 29
Deferred income 27 26
Guarantee deposits 1
Other non-current liabilities 210 254
256 310
Note 14 “Other current liabilities” gives information about the derivatives.Other (€ 254 million) relates to the non-current portion of the greater revenue invoiced and fines charged to shippersthat exceeded their capacity allowance, to be subsequently returned to them as per resolution no. 166/05 issued by theElectricity and Gas Authority.
17
18

S N A M R E T E G A S CO N D E NS E D I N T E R I M CO NS O L I DAT E D F I N A N C I A L S TAT E M E N T S / NOTES
64
EquityEquity at 30 June 2009 of € 5,402 million (31 December 2008: € 3,573 million) is analysed below.
(€m) 31.12.2008 30.06.2009
Snam shareholders' equity
Share capital 1,956 3,570
Legal reserve 391 391
Share premium reserve 116 1,976
Consolidation reserve (1,585)
Other reserves 799 773
Retained earnings 733 836
Profit for the period 530 234
less
. Treasury shares (794) (794)
. Interim dividend (158)
3,573 5,401
Minority interest
Napoletana Gas 1
3,573 5,402
Dividends
The shareholders resolved the distribution of an ordinary dividend of € 0.14 per share in their ordinary meeting of 24April 2009 to complete the distribution commenced with the interim dividend of € 0.09 per share. The dividend (bal-ance of € 247 million) was paid from 21 May 2009 with an ex dividend date of 18 May 2009.In its meeting of 29 July 2009, the parent’s board of directors has drawn up the report pursuant to article 2433-bis.5 ofthe Italian Civil Code and, should it be approved by the independent auditors, it will be called upon to resolve the distri-bution of an interim dividend of € 0,06 per share, excluding treasury shares held by the company at the ex dividend date,to be taken from the 2009 profit with payment from 22 October 2009 and an ex dividend date of 19 October 2009.
Share capital
At 30 June 2009, the fully subscribed and paid-up share capital of Snam Rete Gas S.p.A. consists of 3,570,768,494 ordi-nary shares with a nominal amount of € 1 (31 December 2008: 1,956,445,600). The € 1,614,322,894 increase on 31December 2008 is due to: (i) the issue of 1,614,292,394 shares with a unit nominal amount of € 1, resolved by the boardof directors on 23 March 2009 in line with the proxy given to it by the shareholders in their extraordinary meeting of 17March 2009 to increase share capital in one or more instalments, against consideration, up to a maximum, including theshare premium, of € 3.5 billion, by issuing shares with a nominal amount of € 1 each with regular rights to dividends, tobe offered under option to the shareholders in proportion to the shares already held by them; and (ii) the issue of 30,500shares with a unit nominal amount of € 1 subscribed by the managers as part of the 2004 stock option plan.At the same date, the parent had commitments to assign 568,000 shares for stock option plans by increasing share cap-ital.
Share premium reserve
The share premium reserve of € 1,976 million shows a € 1,860 million increase on 31 December 2008. The variation isdue to: (i) the issue of 1,614,292,394 shares with a share premium of € 1.15 resolved by the board of directors on 23March 2009 (€ 1,857 million); and (ii) the placing on the stock exchange of options that had not been exercised duringthe option offering period (€ 3 million).
Consolidation reserve
The consolidation reserve (-€ 1,585 million) shows the difference between the acquisition cost of the investments inItalgas and Stogit (€ 2,924 million and € 1,588 million, respectively, including the transaction costs of € 3 million) andthe carrying amount of their equities attributable to the owners of the parent (€ 2,004 million and € 923 million, respec-tively).
19

S N A M R E T E G A S CO N D E NS E D I N T E R I M CO NS O L I DAT E D F I N A N C I A L S TAT E M E N T S / NOTES
65
Other reserves
This caption (€ 773 million) principally comprises: (i) the reserve set up to cover the cost of the 195,429,850 treasuryshares in portfolio (€ 794 million); and (ii) the hedging reserve (-€ 22 million).
Retained earnings
Retained earnings (€ 836 million) increased by € 103 million as a result of: (i) allocation of the undistributed 2008profit (+€ 125 million); (ii) recognition of the share capital increase related costs (-€ 22 million, net of the relatedtax effect).
Treasury shares
At 30 June 2009, Snam Rete Gas held 195,429,850 treasury shares (unchanged from 31 December 2008), equivalent to5.47% of share capital, for a total amount of € 794 million, equal to an average unit price of € 4.06.At 30 June 2009, the company had commitments to assign 6,392,575 treasury shares for the stock option plans.Information about changes in such options during the six months is given in the section on “Other information” in thedirectors’ report.At 30 June 2009, the treasury shares’ market value was approximately € 610 million6.
Reconciliation of the profit for the period and equity of Snam Rete Gas S.p.A. with the consolidated profit for theperiod and consolidated equity
Reference should be made to the section on “Comments on the results” of the directors’ report for the reconciliation ofthe profit for the period and equity of Snam Rete Gas S.p.A. with the consolidated figures.
Other information
Business combinations
On 30 June 2009, the acquisition of 100% of Italgas S.p.A. and Stogit S.p.A. from Eni was executed. The former is the lead-ing natural gas distributor in Italy while the latter is the leading Italian natural gas storage operator. The acquisition costof € 4,509 million, was financed by increasing share capital with the issue of shares offered to Snam Rete Gas sharehold-ers for € 3,474 million, including a share premium, and by taking out new loans from the ultimate parent Eni S.p.A. forthe remainder7.
Cost of the acquisition of Italgas and Stogit
Determination of the cost, equal to € 2,922 million and € 1,587 million for Italgas and Stogit, respectively, was based ona valuation made using generally accepted methods (also internationally) for transactions of this kind and for companiesactive in the relevant sectors. Specifically, the discounted cash flow (“DCF”) method was applied and the sum of the parts(“SOTP”) method, ie the RAB (Regulatory Asset Base) method, based on the net invested capital defined by theElectricity and Gas Authority for tariff purposes.
(€m)
Italgas acquisition cost 2,922
Stogit acquisition cost 1,587
4,509
The consideration is subject to future potential adjustments for both companies. These amounts were not consideredwhen determining the acquisition price due to the objective difficulty in making forecasts using the currently availableinformation. Note 21 “Guarantees, commitments and risks” gives information about the transaction cost adjustmentmechanisms.
20
(6) Calculated by multiplying the number of treasury shares by the official price at 30 June 2009 (€ 3.12 per share).(7) More information on the transaction is given in the section on the “ Acquisition of Italgas and Stogit” in the directors’ report.
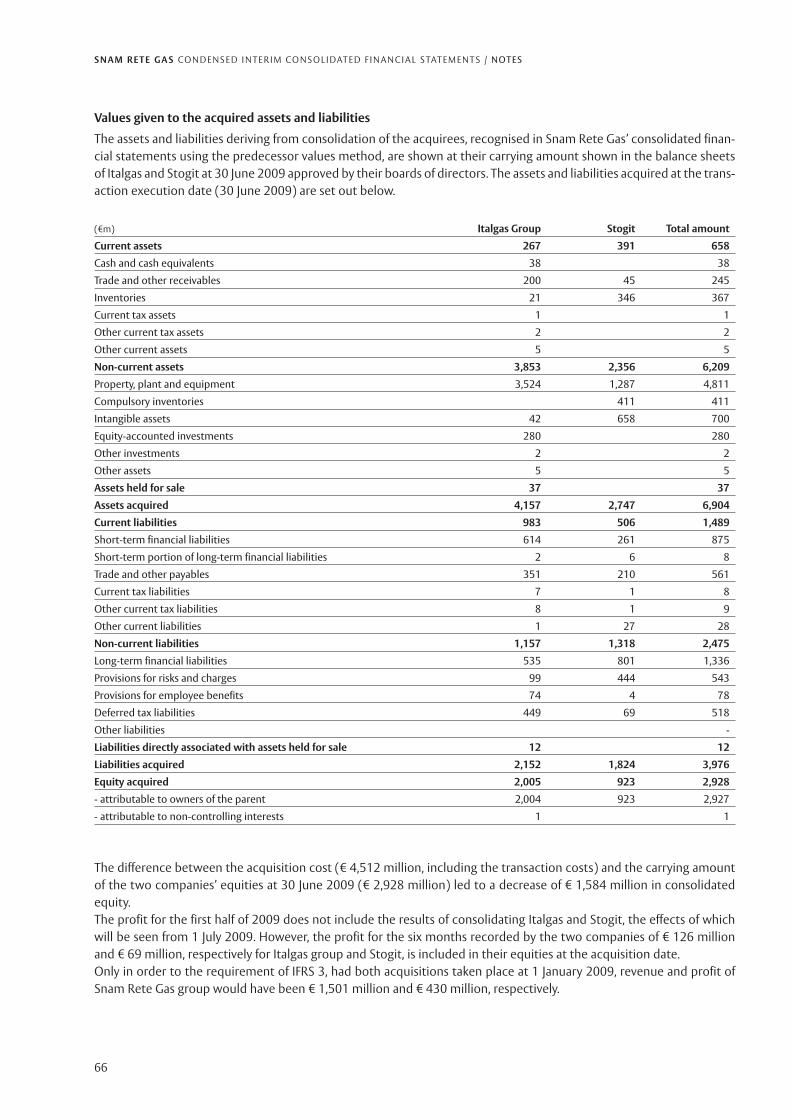
S N A M R E T E G A S CO N D E NS E D I N T E R I M CO NS O L I DAT E D F I N A N C I A L S TAT E M E N T S / NOTES
66
Values given to the acquired assets and liabilities
The assets and liabilities deriving from consolidation of the acquirees, recognised in Snam Rete Gas’ consolidated finan-cial statements using the predecessor values method, are shown at their carrying amount shown in the balance sheetsof Italgas and Stogit at 30 June 2009 approved by their boards of directors. The assets and liabilities acquired at the trans-action execution date (30 June 2009) are set out below.
(€m) Italgas Group Stogit Total amount
Current assets 267 391 658
Cash and cash equivalents 38 38
Trade and other receivables 200 45 245
Inventories 21 346 367
Current tax assets 1 1
Other current tax assets 2 2
Other current assets 5 5
Non-current assets 3,853 2,356 6,209
Property, plant and equipment 3,524 1,287 4,811
Compulsory inventories 411 411
Intangible assets 42 658 700
Equity-accounted investments 280 280
Other investments 2 2
Other assets 5 5
Assets held for sale 37 37
Assets acquired 4,157 2,747 6,904
Current liabilities 983 506 1,489
Short-term financial liabilities 614 261 875
Short-term portion of long-term financial liabilities 2 6 8
Trade and other payables 351 210 561
Current tax liabilities 7 1 8
Other current tax liabilities 8 1 9
Other current liabilities 1 27 28
Non-current liabilities 1,157 1,318 2,475
Long-term financial liabilities 535 801 1,336
Provisions for risks and charges 99 444 543
Provisions for employee benefits 74 4 78
Deferred tax liabilities 449 69 518
Other liabilities -
Liabilities directly associated with assets held for sale 12 12
Liabilities acquired 2,152 1,824 3,976
Equity acquired 2,005 923 2,928
- attributable to owners of the parent 2,004 923 2,927
- attributable to non-controlling interests 1 1
The difference between the acquisition cost (€ 4,512 million, including the transaction costs) and the carrying amountof the two companies’ equities at 30 June 2009 (€ 2,928 million) led to a decrease of € 1,584 million in consolidatedequity.The profit for the first half of 2009 does not include the results of consolidating Italgas and Stogit, the effects of whichwill be seen from 1 July 2009. However, the profit for the six months recorded by the two companies of € 126 millionand € 69 million, respectively for Italgas group and Stogit, is included in their equities at the acquisition date.Only in order to the requirement of IFRS 3, had both acquisitions taken place at 1 January 2009, revenue and profit ofSnam Rete Gas group would have been € 1,501 million and € 430 million, respectively.

S N A M R E T E G A S CO N D E NS E D I N T E R I M CO NS O L I DAT E D F I N A N C I A L S TAT E M E N T S / NOTES
67
Guarantees, commitments and risksGuarantees, commitments and risks of € 2,205 million (31 December 2008: € 912 million) comprise:
31.12.2008 30.06.2009
Other Otherpersonal Risks and personal Risks and
(€m) guarantees commitments Total guarantees commitments Total
Other personal guaranteesgiven on its own behalf:
- Ultimate parents 32 32 45 45
Collateral
- Third parties …
Commitments
Commitments for the purchaseof goods and services 880 880 989 989
Other 1 1
Risks
- Third party assets on deposit 1,151 1,151
- Risks for litigations 19 19
32 880 912 45 2,160 2,205
Guarantees
Other personal guarantees (€ 45 million) mainly relate to hold harmless letters issued to Eni S.p.A. for sureties issuedon behalf of Snam Rete Gas, mainly performance bonds.
Commitments
Commitments with suppliers to purchase property, plant and equipment and services for investments in non-currentassets under construction/development approximate € 989 million at period end.
Risks
Third party goods on deposit (€ 1,151 million) relate to natural gas deposited in the storage systems (approximately 5.2billion standard cubic metres). This amount was determined by applying the estimated unit repurchase cost of approx-imately € 0.22 per standard cubic metre to the deposited gas. The actual commitment is in line with the nominalamount.Risks related to compensation and litigation (€ 19 million) relate to third party claims for compensation arising fromongoing litigation. The risk that the group will be required to pay is low.Guarantees, commitments and risks contributed by the acquirees amount to € 1,293 million.
Commitments deriving from the acquisition of Italgas and Stogit from Eni
Acquisition of Italgas
The acquisition price for Italgas is subject to adjustment mechanisms applicable also after the execution date.Specifically, the price will be adjusted by an amount equal to the difference between the provisional combined value ofRAB at 31 December 2007 of Italgas and certain of its subsidiaries, determined to be € 4,560 million as set out by Eni inthe acquisition contract, and the RAB of Italgas and the same subsidiaries at the same date approved by the Electricityand Gas Authority.The acquisition price for Italgas will also be adjusted to reflect the benefits deriving from the sale by Italgas to Eni of aproperty which it owns and no longer uses for its operating activities.
21
S N A M R E T E G A S CO N D E NS E D I N T E R I M CO NS O L I DAT E D F I N A N C I A L S TAT E M E N T S / NOTES
68
Acquisition of Stogit
The acquisition price for Stogit may be adjusted, to reflect the different value compared to the present value, that maybe recognised by the Electricity and Gas Authority for the tariff period from 1 April 2014 to 31 March 2018, for naturalgas volumes owned by Stogit at the share transfer date and included in the assets making up its RAB.The acquisition contract also includes hedging mechanisms in order that Eni keeps the risks and/or benefits that mayarise from:• the increase in value of the gas owned by Stogit at the date of transfer of the shares compared to that currently recog-
nised by the Electricity and Gas Authority in the case of the (partial) sale of such gas, should certain volumes no longerbe necessary for the concessions and, thus, become available for sale;
• the possible sale of storage capacity which may become available for sale and is no longer regulated or from the saleof concessions held by Stogit at the time of transfer of the shares which could be mostly used for storage activities thatare not regulated.
Rome urban area and the “Romana gas” business unit
Following the sale by the French company Suez S.A. (now GdF-Suez S.A. after their merger) of its Belgium subsidiaryDistrigaz, Eni agreed to sell Suez, on the basis of preliminary negotiations with Italgas, the latter’s distribution activitiesin the Rome urban area together with other gas and electricity business assets. On 29 May 2008, the related preliminaryagreements were signed, including the sales terms for the gas distribution activities. The final agreement for such gas dis-tribution activities was entered into by Italgas and GdF-Suez on 30 October 2008.The transaction relates to the business unit which distributes gas in the municipalities of Rome, Fiumicino, Ciampino,Marino, Grottaferrata, Rocca di Papa and Frascati (the concession for Rome expires on 31 December 2009), includingthe distribution networks (spanning roughly 5,300 km) and the related systems, approximately 1.3 million deliverypoints (equal to approximately 28% of the users served), together with roughly 800 employees.The set price, based on 31 December 2008, is € 1,018 million.The contract provides that execution of the transaction shall take place with the transfer by Italgas of the business unitto Rete Gas Roma S.r.l. (a newco set up on 26 November 2008 wholly owned by Italgas) and is subject to attainment ofapproval by the Rome municipality authorities of transfer of the concession before 30 June 2009, which date the buyermay extend to 31 August 2009.The Rome municipal authorities agreed to the transfer of the concession contract to Rete Gas Roma with its communi-cation no. 1231 of 25 June 2009, acknowledging Italgas’ intention to transfer its entire investment in this company toGdF-Suez. The concession covers the distribution of gas in Rome.On 6 July 2009, the Rome mayor subsequently specified that this communication is the sole document necessary tolegitimately and effectively express the municipal authority’s consent to the transaction and that the town councilwould be informed thereof.However, on 13 July 2009, GdF-Suez informed Italgas that it did not believe that the conditions for transfer of the Romeurban area gas distribution activities had been met in the established timeframe. Therefore, it decided not to continuewith finalisation of the acquisition as set out in the contract agreed by the parties on 30 October 2008.Snam Rete Gas is evaluating the contract’s content to assess what actions could be taken to best protect its interests.
BUSINESS RISK MANAGEMENTThe section on risk factors and outlook of the directors’ report describes the management and monitoring policies forthe main business risks.
LITIGATIONCertain group companies are involved in civil and administrative proceedings and legal actions related to their normalbusiness activities. According to the information currently available and considering the existing provisions for risks, thegroup believes that these proceedings and actions will not have material adverse effects on its financial statements. Thesection on “Other information - litigation” in the directors’ report provides an update on this issue.

S N A M R E T E G A S CO N D E NS E D I N T E R I M CO NS O L I DAT E D F I N A N C I A L S TAT E M E N T S / NOTES
69
RevenueThe key captions making up revenue are described in this part of the notes. Reference should be made to the sectionon “Comments on the results” of the directors’ report for the reasons underlying the main changes and commentsthereon.
(€m) First half 2008 First half 2009
Core business revenue 934 917
Other revenue and income 6 2
940 919
Core business revenue (€ 917 million) is shown net of the following captions:
(€m) First half 2008 First half 2009
Interruptibility fee as per resolution no. 277/07 18 19
Regional Network transportation fee as per resolution no. 45/07 - Equalisation 4 5
22 24
Core business revenue is analysed in the following table by type of business:
(€m) First half 2008 First half 2009
Transportation 918 900
Regasification 11 10
Regasification and transportation revenue 929 910
Revenue from other activities 5 7
934 917
Core business revenue is analysed by business segment in note 27 “Segment reporting”. The group’s business is notaffected by seasonal factors such that would have a significant impact on its interim and annual financial position andresults of operations.
Operating costsThe key captions making up operating costs are described in this part of the notes. Reference should be made to the sec-tion on “Comments on the results” of the directors’ report for the reasons underlying the main changes.
(€m) First half 2008 First half 2009
Purchases, services and other costs 143 173
Personnel expense 56 54
199 227
22
23

S N A M R E T E G A S CO N D E NS E D I N T E R I M CO NS O L I DAT E D F I N A N C I A L S TAT E M E N T S / NOTES
70
Purchases, services and other costs
Purchases, services and other costs (€ 173 million) may be analysed as follows:
(€m) First half 2008 First half 2009
Costs incurred for raw materials, consumables, supplies and goods 261 225
Costs for services 75 77
Costs for the use of third party assets 6 5
Change in raw materials, consumables, supplies and goods (47) 27
Accrual to (utilisation of) provisions for risks and charges 16
Other expenses 6 10
301 360
Less:
Raw materials, consumables, supplies and goods
. Increase on internal work capitalised in non-current assets - purchases (145) (174)
. Recharge of internal consumption of natural gas by the LNG terminal (*) (4) (3)
(149) (177)
Services
. Increase on internal work capitalised in non-current assets - services (9) (10)
(9) (10)
143 173
(*) The recharge of internal consumption of natural gas relates to natural gas used for regasification purchased and subsequently recharged to the service user.
Costs for raw materials, consumables, supplies and goods (€ 225 million), gross of increases for internal work andrecharges of internal consumption of natural gas) relate to costs for fuel gas used by the compression stations (€ 66 mil-lion) and other costs and materials (€ 159 million), mainly for the purchase of pipes.Costs for services of € 67 million comprise:
(€m) First half 2008 First half 2009
Purchase of transportation capacity (interconnection) 13 16
Modulation and storage services 11 11
Maintenance 9 9
IT services and software 6 6
Technical, legal, administrative and professional services 6 6
Personnel-related services 6 6
Telecommunications services 5 5
Utilities 5 4
Insurance 4 4
Other services 10 10
75 77
less:
. increase on internal work capitalised in non-current assets - services (9) (10)
(9) (10)
66 67
Other services of € 10 million mainly relate to security and porter, communication and third party processing services.Costs for the use of third party assets of € 5 million relate to easement concessions (€ 2 million) and operating leases ofbuildings for office use (€ 3 million).The increase in raw materials, consumables, supplies and goods of € 27 million refers to other materials (€ 25 million)and natural gas used at the compression stations (€ 2 million).

S N A M R E T E G A S CO N D E NS E D I N T E R I M CO NS O L I DAT E D F I N A N C I A L S TAT E M E N T S / NOTES
71
Personnel expense
Personnel expense of € 54 million may be analysed as follows:
(€m) First half 2008 First half 2009
Wages and salaries 51 51
Social security contributions (pensions and healthcare assistance) 16 16
Defined contribution plan costs 4 4
Termination benefits 1
Other expense 1 1
less:
. increase on internal work capitalised in non-current assets (17) (18)
56 54
The average number of employees on payroll at the consolidated companies, broken down by category, is as follows:
Position 30.06.2008 31.12.2008 30.06.2009
Managers 64 64 121
Junior managers 258 261 487
Employee 1,238 1,237 3,405
Workers 774 772 2,324
2,334 2,334 6,337
The average number of employees is calculated as the average of the monthly figures.
Incentive plans for managers involving Snam Rete Gas shares
The plans’ general conditions and other disclosures are given in the consolidated financial statements at 31 December2008. Changes in the plans are described in the section on “Other information” in the directors’ report.
Amortisation, depreciation and impairment losses
Amortisation and depreciation of € 248 million include:
(€m) First half 2008 First half 2009
Depreciation 230 239
Amortisation 11 9
241 248
The € 9 million increase in depreciation charges is due to the roll-out of new transportation infrastructure.
Financial income and expense
Financial expense
Financial expense of € 71 million comprises:
(€m) First half 2008 First half 2009
Interest expense on financial liabilities 134 76
Other expense 2 3
less:
. increase on internal work capitalised in non-current assets (13) (8)
123 71
24

S N A M R E T E G A S CO N D E NS E D I N T E R I M CO NS O L I DAT E D F I N A N C I A L S TAT E M E N T S / NOTES
72
The decrease in interest expense on financial liabilities (€ 58 million) is mainly due to the lower market interest rates.The average cost of borrowing decreased from 4.2% in the first half of 2008 to 3.2% in the first six months of 20098 dueto the significant drop in market interest rates.The increase on internal work capitalised in non-current assets (€ 8 million) relates to the part of financial expenseabsorbed by investments. The interest rate applied to capitalise financial expense was 3.17% (first half of 2008: 4.18%).
Derivatives
Net losses on derivatives of € 21 million comprise:
(€m) First half 2008 First half 2009
Gains on derivative contracts:
. Interest accrued during the period 13 2
Losses on derivative contracts:
. Interest accrued during the period (21)
. Adjustment to fair value (1) (2)
12 (21)
Losses on derivatives refer to fair value losses on the ineffective portion of hedges (€ 2 million). They relate to financialliabilities of € 500 million.All the derivatives existing at period end were agreed with the ultimate parent, Eni S.p.A..
Income taxesThis caption (€ 119 million) may be analysed as follows:
(€m) First half 2008 First half 2009
Current taxes:
. IRES 116 110
. IRAP 29 27
145 137
Deferred tax (income) expense
. deferred tax expense (19) (16)
. deferred tax income 5 (2)
(14) (18)
131 119
Income taxes (€ 119 million) decreased by € 12 million compared to the corresponding period of 2008, due to thesmaller profit before taxes.The effective tax rate for the period is 33.7% (first half of 2008: 33.6%), substantially in line with the theoretical tax rate.
Earnings per shareBasic earnings per share are determined by dividing profit for the period by the weighted average number of outstand-ing Snam Rete Gas shares during the period, excluding treasury shares.For comparative purposes, the number of outstanding shares of the periods used as a comparison considers bonusshares. Therefore, the number of bonus shares issued in the period from the first half of 2008 and the first half of 2009(39,100) increases the number of outstanding shares in the first half of 2008. Accordingly, the weighted average num-ber of outstanding shares is 1,760,937,288 and 1,769,949,827 in the first six months of 2008 and 2009, respectively.Diluted earnings per share are determined by dividing profit for the period by the weighted average number of outstand-ing shares during the period, excluding treasury shares, increased by the number of shares that could potentially be
26
25
(8) The average cost of borrowing is calculated considering Snam Rete Gas group before the acquisition. The average cost for the first half of 2009 for Italgas groupand Stogit is 2.7% and 3.5%, respectively.
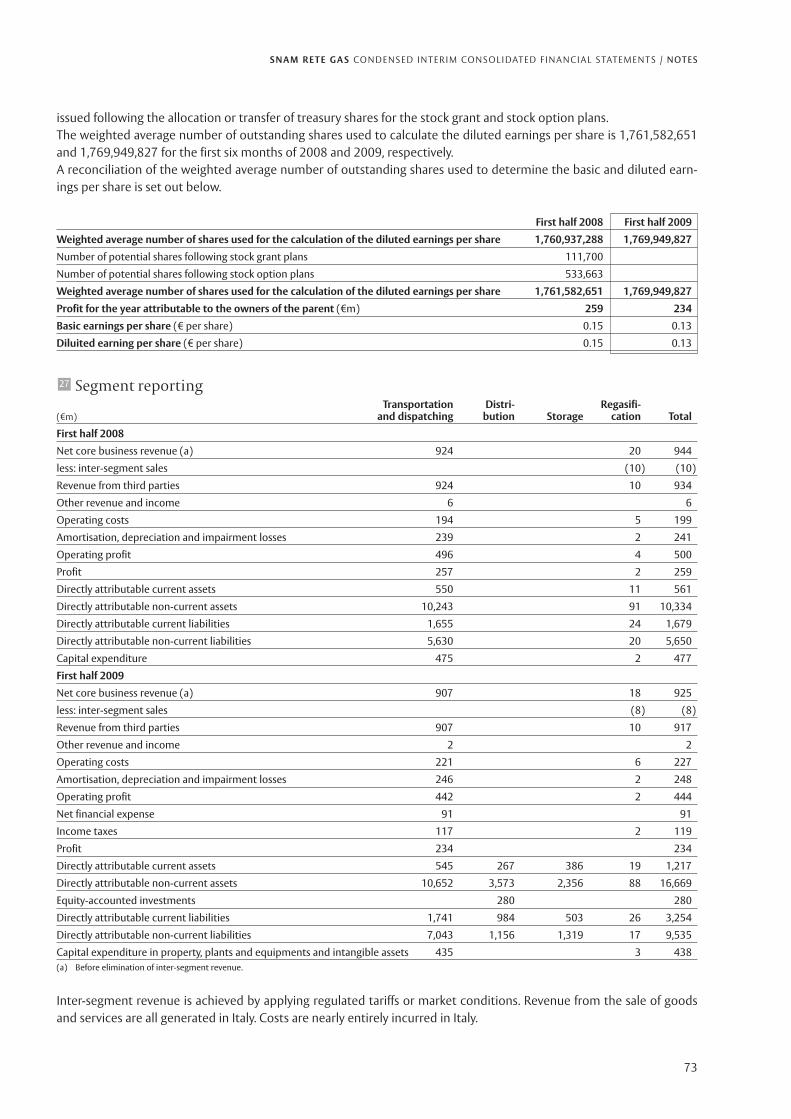
S N A M R E T E G A S CO N D E NS E D I N T E R I M CO NS O L I DAT E D F I N A N C I A L S TAT E M E N T S / NOTES
73
issued following the allocation or transfer of treasury shares for the stock grant and stock option plans.The weighted average number of outstanding shares used to calculate the diluted earnings per share is 1,761,582,651and 1,769,949,827 for the first six months of 2008 and 2009, respectively.A reconciliation of the weighted average number of outstanding shares used to determine the basic and diluted earn-ings per share is set out below.
First half 2008 First half 2009
Weighted average number of shares used for the calculation of the diluted earnings per share 1,760,937,288 1,769,949,827
Number of potential shares following stock grant plans 111,700
Number of potential shares following stock option plans 533,663
Weighted average number of shares used for the calculation of the diluted earnings per share 1,761,582,651 1,769,949,827
Profit for the year attributable to the owners of the parent (€m) 259 234
Basic earnings per share (€ per share) 0.15 0.13
Diluited earning per share (€ per share) 0.15 0.13
Segment reportingTransportation Distri- Regasifi-
(€m) and dispatching bution Storage cation Total
First half 2008
Net core business revenue (a) 924 20 944
less: inter-segment sales (10) (10)
Revenue from third parties 924 10 934
Other revenue and income 6 6
Operating costs 194 5 199
Amortisation, depreciation and impairment losses 239 2 241
Operating profit 496 4 500
Profit 257 2 259
Directly attributable current assets 550 11 561
Directly attributable non-current assets 10,243 91 10,334
Directly attributable current liabilities 1,655 24 1,679
Directly attributable non-current liabilities 5,630 20 5,650
Capital expenditure 475 2 477
First half 2009
Net core business revenue (a) 907 18 925
less: inter-segment sales (8) (8)
Revenue from third parties 907 10 917
Other revenue and income 2 2
Operating costs 221 6 227
Amortisation, depreciation and impairment losses 246 2 248
Operating profit 442 2 444
Net financial expense 91 91
Income taxes 117 2 119
Profit 234 234
Directly attributable current assets 545 267 386 19 1,217
Directly attributable non-current assets 10,652 3,573 2,356 88 16,669
Equity-accounted investments 280 280
Directly attributable current liabilities 1,741 984 503 26 3,254
Directly attributable non-current liabilities 7,043 1,156 1,319 17 9,535
Capital expenditure in property, plants and equipments and intangible assets 435 3 438(a) Before elimination of inter-segment revenue.
Inter-segment revenue is achieved by applying regulated tariffs or market conditions. Revenue from the sale of goodsand services are all generated in Italy. Costs are nearly entirely incurred in Italy.
27

S N A M R E T E G A S CO N D E NS E D I N T E R I M CO NS O L I DAT E D F I N A N C I A L S TAT E M E N T S / NOTES
74
Related party transactionsThe following table details the trade, financial and other transactions with related parties and the nature of the more sig-nificant ones.
Trade and other transactions(€m)
30 June 2009 First half 2009Recei- Paya- Guaran- Risks and Costs (*) Revenue (**)
Name vables bles tees commitments Goods Services Other Goods Services Other
Ultimate parent
Eni S.p.A. 273 177 45 418 65 5 1 492
Eni subsidiaries
Saipem S.p.A. 37 23
Stoccaggi Gas Italia S.p.A. 11
Sofid S.p.A. 2 3 2
Eniservizi 6 16 3
Serfactoring S.p.A. 13
Energy Maintenance Services S.p.A. 1 13
Other companies controlled by ENI 1 7 1 4 1
Jointly-controlled entities and associates
A.E.S. S.p.A. 1 3
Toscana Energia S.p.A. 13
Other Jointly-controlled entities and associates 4
Total Eni group 301 269 45 418 66 48 1 493
State-owned or controlled companies
Enel Group 55 17 128
Other 3 5
Total 359 291 45 418 66 48 1 621
(*) Include costs for goods and services to be used in investing activities.(**) Includes the interruptibility and equalisation amounts due to the Cassa Conguaglio Settore Elettrico.
Ultimate parent
As described in detail in the directors’ report, on 30 June 2009, the acquisition of the entire share capital of Italgas andStogit from Eni was executed with payment by Snam Rete Gas of a consideration of € 4,509 million, including € 2,922million for Italgas and € 1,587 million for Stogit. The acquisition represents a related party transaction as: (i) Eni is thecontrolling shareholder of Snam Rete Gas; (ii) on 12 February 2009, Snam Rete Gas received a commitment letter toenter into a contract, before the acquisition execution date, for a long-term loan of a maximum of € 1,300 million to beused to pay part of the acquisition consideration; and (iii) on 12 February 2009, Eni agreed to subscribe the shares aris-ing from the share capital increase.The main trade transactions performed with the ultimate parent Eni S.p.A. relate to regulated gas transportation, regasi-fication, distribution and storage services provided to it, based on the tariffs set by the Electricity and Gas Authority. Themain trade services received from the ultimate parent relate to the supply of goods (natural gas and electricity used bythe group to carry out its activities) and consultancy and technical-operating assistance, charged at fees determined onan arms’ length basis.
Subsidiaries of Eni
The key transactions performed with Eni’s subsidiaries relate to:Saipem S.p.A. engineering and work supervision services for the construction of natural gas transportation infrastruc-tures.Stoccaggi Gas Italia S.p.A.9 Snam Rete Gas uses the natural gas modulation and storage services, which are part of theactivities regulated by the Electricity and Gas Authority
28
(9) The effects of consolidating Stogit are effective from 1July 2009. The costs incurred by the Group in the first half of 2009 were not eliminated as intragroup trans-actions.

S N A M R E T E G A S CO N D E NS E D I N T E R I M CO NS O L I DAT E D F I N A N C I A L S TAT E M E N T S / NOTES
75
Energy Maintenance Services S.p.A. supply of maintenance services for the storage systems.Serfactoring S.p.A. factoring transactions performed by the company’s suppliers.The group also works with special purpose entities that provide services to Eni group, including: (i) Eni servizi S.p.A. whichprovides general services such as maintenance of buildings, related structures and related systems, transportation serv-ices, healthcare services, catering, security, supply of non-strategic goods, centralised management of the company’sarchives and personnel administration services; and (ii) Sofid S.p.A., which provides accounting and administrative serv-ices.Given the activities performed and nature of the relationship (companies owed entirely or almost entirely by Eni), theservices provided are regulated using tariffs set considering the specific costs incurred and minimum margin to recovergeneral costs and ensure a return on invested capital.
Jointly controlled entities and associates
The main transactions carried out with jointly controlled entities and associates relate to the supply of IT services.
State-owned or controlled companies
Transactions carried out with state-owned or controlled companies mainly relate to Enel S.p.A. and its subsidiaries for thetransportation, regasification, distribution and storage of natural gas by the group.
Financial transactions(€m)
30 June 2009 First half 2009
Name Receivables Other assets Payables (*) Other liabilities Guarantees (**) (***) Expense (****) Income
Ultimate parent
. Eni S.p.A. 1 (*) 9,705 83 1 98 2
Eni subsidiaries
Eni Insurance Ltd 3
4 9,705 83 1 98 2(*) Assets and liabilities deriving from the measurement of derivatives.(**) Include financial expense for investments.(***) Includes € 23 million related to losses on derivatives.(****) Relating to derivatives.
Ultimate parent
Transactions with the ultimate parent, Eni S.p.A., relate to the covering of financial requirements, utilisation of liquidityand interest rate hedges using derivative contracts.
Subsidiaries of Eni
Transactions with subsidiaries of Eni relate to Eni Insurance Ltd for insurance services.
Effect of transactions or positions with related parties on the financial position, results of operations and cash flows
The effect of transactions or positions with related parties on the balance sheet is summarised in the following table.
31.12.2008 30.06.2009
Total Related Effect Total Related Effect(€m) parties (%) parties (%)
Cash and cash equivalents 38 37 97.4
Trade and other receivables 452 289 63.9 623 359 57.6
Other current assets 52 6 11.5 58 4 6.9
Equity-accounted investments 280 280 100.0
Other investments 2 2 100.0
Other non-current assets 3 1 33.3 9
Short-term financial liabilities 1,023 1,023 100.0 2,156 2,156 100.0
Long-term financial liabilities 5,214 5,214 100.0 7,550 7,549 100.0
Trade and other payables 536 129 24.1 958 291 30.4
Other current liabilities 52 25 48.1 103 54 52.4
Other non-current liabilities 256 19 7.4 310 29 9.4

S N A M R E T E G A S CO N D E NS E D I N T E R I M CO NS O L I DAT E D F I N A N C I A L S TAT E M E N T S / NOTES
76
The effect of transactions or positions with related parties on the income statement is summarised in the following table:
First half 2008 First half 2009
Total Related Effect Total Related Effect(€m) parties (%) parties (%)
Core business revenue 934 689 73.8 917 621 67.7
Purchases, services and other costs 143 92 64.3 173 92 53.2
Financial expense 123 120 97.6 71 67 94.4
Income/(expense) on derivatives 12 12 100.0 (21) (21) 100.0
The key cash flows with related parties are given in the following table:
(€m) First half 2008 First half 2009
Revenue and income 689 621
Cost and expense (92) (92)
Change in trade and other receivables 16 54
Change in trade and other payables (78) (22)
Interest collected 13 4
Interest paid (121) (84)
Net cash flows from operating activities 427 481
Investments in property, plant and equipment and intangible assets (41) (31)
Change in consolidation scope (4,509)
Disinvestments 1
Change in payables related to investments 8 (11)
Net cash flow from investing activities (32) (4,551)
Change in financial liabilities 164 1,250
Cash flows of equity (127) 1,792
Net cash flows from financing activities 37 3,042
Total cash flows with related parties 432 (1,028)
The effect of cash flows with related parties is shown in the following table:
First half 2008 First half 2009
Total Related Effect Total Related Effect(€m) parties (%) parties (%)
Cash flows from operating activities 600 427 71.2 575 481 83.7
Cash flows from investing activities (535) (32) 6.0 (4,986) (4,551) 91.3
Cash flows from financing activities (65) 37 4,449 3,042 68.4
Non-recurring significant events and transactions and other special itemsNo non-recurring transactions or other special items took place in the first six months of 2009 and 2008.
Positions or transactions deriving from atypical and/or unusual transactionsNo such positions or transactions existed.
30
29

77
Statement pursuant to the guidelines of article 154 - bis.5of Legislative decree no. 58/1998 (CONSOLIDATEDFINANCE ACT)
1. The undersigned Carlo Malacarne and Antonio Paccioretti, as CEO and Manager in charge of financial reporting ofSnam Rete Gas S.p.A., state, also considering article 154 - bis.3/4 of Legislative decree no. 58 of 24 February 1998:• the adequacy considering the group’s characteristics, and• effective application, of the administrative and accounting procedures for the preparation of the condensed
interim consolidated financial statements at 30 June 2009 during the first six months of 2009.
2. The administrative and accounting procedures for the preparation of the condensed interim consolidated financialstatements at 30 June 2009 were designed and the assessment of their adequacy was carried out using the rules andmethods defined in line with the Internal Control - Integrated Framework model issued by the Committee ofSponsoring Organisations of the Treadway Commission, a benchmark framework for the internal control system gen-erally accepted at international level.The administrative and accounting procedures of Italgas and Stogit, acquired on 30 June 2009, have been added tothe parent’s internal control system.
3. They also state that:3.1. the condensed interim consolidated financial statements at 30 June 2009:
a) have been prepared in accordance with the IFRS issued by the International Accounting Standards Board andendorsed by the European Commission under the procedure as per article 6 of the EC Regulation no.1606/2002 of the European Parliament and Council of 19 July 2002;
b) are consistent with the results of the accounting ledgers and entries:c) are suitable to give a true and fair view of the financial position, results of operations and changes in cash
flows of the issuer and the companies included in the consolidation scope.3.2. The directors’ report on the condensed interim consolidated financial statements includes references to signifi-
cant events that took place during the first six months of 2009 and their impact on the condensed interim con-solidated financial statements. It also describes the key risks and uncertainties for the second six months of theyear as well as analysing the related party transactions.
29 July 2009
(signed on the original) (signed on the original)
Carlo Malacarne Antonio Paccioretti CEO CFO

78
Independent auditors’ report
79


Limited CompanyFull paid-up capital 3,570,768,494.00
Tax code and Milan Company Register No 13271390158
R.E.A. (Economic-Admin. Roll) No 1633443
VAT No 13271390158
Company controlled and coordinated by Eni S.p.A.
Graphics
Inarea and Opera
Pre-printing
Opera
Printing
Arti Grafiche Alpine S.a.s.
Printed on Symbol Free Life ecological paper
September 2009
Registered office in San Donato Milanese (Milan)Piazza Santa Barbara, 7Tel +39.025201

www.snamretegas.it