Embed Size (px)
Citation preview
THIS DOCUMENT SHOULD BE READ IN CONJUNCTION WITH THE 30 JUNE 2017 ANNUAL REPORT OF THE COMPANY
LODGED ON ASX ON 31 OCTOBER 2017
ASX Code: BEL
Bentley Capital Limited A.B.N. 87 008 108 218
REGISTERED OFFICE: SHARE REGISTRY: Level 2 23 Ventnor Avenue West Perth, Western Australia 6005 T |(08) 9214 9757 F |(08) 9214 9701 E |[email protected]
W |www.bel.com.au
Advanced Share Registry Services Western Australia – Main Office 110 Stirling Highway Nedlands, Western Australia 6009 PO Box 1156, Nedlands Western Australia 6909 T | (08) 9389 8033 F | (08) 9262 3723 E | [email protected]
W | www.advancedshare.com.au
New South Wales – Branch Office Suite 8H, 325 Pitt Street Sydney, New South Wales 2000 PO Box Q1736 Queen Victoria Building NSW 1230 T | (02) 8096 3502
HALF YEAR REPORT
31 December 2017

31 DECEMBER 2017 BENTLEY CAPITAL LIMITED A.B.N. 87 008 108 218
HALF YEAR REPORT | 1
CONTENTS CORPORATE DIRECTORY ASX Appendix 4D – Results for 2 BOARD
Announcement to the Market Farooq Khan Executive Chairman William M. Johnson Executive Director Directors’ Report 5 Simon K. Cato Non-Executive Director Auditor’s Independence Declaration 16 COMPANY SECRETARY Consolidated Statement of 17 Victor P. H. Ho Profit or Loss and Other Comprehensive Income REGISTERED AND PRINCIPAL OFFICE
Level 2 Consolidated Statement of 18 23 Ventnor Avenue Financial Position West Perth, Western Australia 6005 Telephone: (08) 9214 9757 Consolidated Statement of 19 Facsimile: (08) 9214 9701 Changes in Equity Email: [email protected] Website: www.bel.com.au Consolidated Statement of Cash Flows 20 AUDITORS Notes to the Consolidated 21 Rothsay Auditing Financial Statements Chartered Accountants Level 1, Lincoln House Directors’ Declaration 28 4 Ventnor Avenue West Perth, Western Australia 6005 Auditor’s Independent Review Report 29 Telephone: (08) 9486 7094 Website: www.rothsayresources.com.au Securities Information 30 STOCK EXCHANGE Australian Securities Exchange Perth, Western Australia Website: www.asx.com.au ASX CODE BEL SHARE REGISTRY Advanced Share Registry Services Main Office 110 Stirling Highway Nedlands, Western Australia 6009 Telephone: (08) 9389 8033 Facsimile: (08) 9262 3723 Email: [email protected] Investor Web: www.advancedshare.com.au Visit www.bel.com.au for: · Market Announcements Sydney Office · Financial Reports Suite 8H, 325 Pitt Street · Corporate Governance Sydney, New South Wales 2000 · NTA Backing History Telephone: (02) 8096 3502 · Distribution History · Forms · Email subscription

31 DECEMBER 2017 BENTLEY CAPITAL LIMITED A.B.N. 87 008 108 218
APPENDIX 4D HALF YEAR REPORT
HALF YEAR REPORT | 2
This Half Year Report is provided to the Australian Securities Exchange (ASX) under ASX Listing Rule 4.2A.3. Current reporting period: 1 July 2017 to 31 December 2017 Previous corresponding period: 1 July 2016 to 31 December 2016 Reporting Date: 31 December 2017 Company: Bentley Capital Limited (BEL or the Company) Consolidated Entity: BEL and controlled entities (Bentley) RESULTS FOR ANNOUNCEMENT TO THE MARKET
CONSOLIDATED Dec 2017
$’000 Dec 2016
$’000 %
Change Up /
Down Net gain on financial assets at fair value through profit or loss 1,573 - N/A N/A Share of Associate entity’s Profit 27 - N/A N/A Dividends 170 33 405% Up Interest 2 13 81% Down Other income 9 10 8% Down Total revenue 1,781 56 3058% Up
Net loss on financial assets at fair value through profit or loss - (645) N/A N/A Software development expenses (480) (789) 39% Down Salaries, fees and employee benefits (178) (178) 0% N/A Investment expenses (12) (19) 33% Down Corporate expenses (45) (50) 11% Down Administration expenses and other expenses (173) (201) 14% Down Total expenses (888) (1,882) 53% Down
Profit/(Loss) before tax 893 (1,826) 149% Profit Up Income tax benefit/(expense) - -
Profit/(Loss) after tax attributable to members 893 (1,826) 149% Profit Up
Other comprehensive income (net of tax) - 368 N/A N/A
Total Comprehensive Income/(Loss) for the half year 893 (1,458) 161% Income Up
Basic and diluted earnings/(loss) per share (cents) 1.17 (1.93) 161% Earnings Up
CONSOLIDATED Dec 2017
cents June 2017
cents % Change Up / Down
Pre-Tax NTA backing per share 15.87 15.43 3% Up
Post-Tax NTA backing per share 15.87 15.43 3% Up
Pre and Post-Tax NTA backing per share 16.37 15.43 6% Up (with the dividend paid during the Current Reporting Period added back)
BRIEF EXPLANATION OF RESULTS The net gain on financial assets of $1.573 million relates principally to the investment portfolio including positions in Santos Limited (ASX:STO), Pioneer Credit Limited (ASX:PNC)) and Strike Resources Limited (ASX:SRK). Please refer to the Directors’ Report and financial statements and notes for information on a review of Bentley’s operations and the financial position and performance of Bentley for the half year ended 31 December 2017.

31 DECEMBER 2017 BENTLEY CAPITAL LIMITED A.B.N. 87 008 108 218
APPENDIX 4D HALF YEAR REPORT
HALF YEAR REPORT | 3
DIVIDENDS Consistent with its stated Dividend Policy to make annual distributions of at least one cent per share (referred to below), Bentley has recently paid a fully franked dividend as follows:
Dividend Rate Record Date Payment Date DRP Issue Price (cents) DRP Shares Acquired
0.5 cent per share 12 January 2018 25 January 2018 12.25 222,650 The Company’s Dividend Reinvestment Plan (DRP) applied to this dividend with the DRP issue price set at a 2.5% discount to the Company’s volume weighted average price on ASX in the 5-day period up to and including the dividend record date. Pursuant to the DRP Rules, the Company acquired shares on-market to satisfy its obligations to participants under the DRP. A copy of Bentley’s DRP Rules1 (which were updated on 31 July 2017) and DRP Application Form may be obtained from the Company or downloaded from the Company’s website: http://bel.com.au/forms The Company paid a 0.5 cent per share fully franked dividend during the financial half year as follows:
Dividend Rate Record Date Payment Date DRP Issue Price (cents) DRP Shares Acquired
0.5 cent per share 17 August 2017 31 August 2017 11.72 243,088 This continues Bentley’s long distribution track record with recent payments as illustrated below 2:
Rate per share Nature Record Date Payment Date Franking DRP Issue Price 0.50 cent Dividend 17 August 2017 31 August 2017 100% $0.1172 0.50 cent Dividend 24 March 2017 31 March 2017 100% $0.1371 0.50 cent Dividend 22 September 2016 29 September 2016 100% $0.1399 0.50 cent Dividend 11 March 2016 18 March 2016 100% $0.1322 0.50 cent Dividend 11 September 2015 25 September 2015 100% $0.1453 0.55 cent Dividend 13 March 2015 20 March 2015 100% $0.1327 0.95 cent Dividend 12 September 2014 26 September 2014 100% $0.1486 One cent Dividend 14 March 2014 21 March 2014 100% $0.1441 One cent Return of capital 6 December 2013 12 December 2013 N/A N/A One cent Return of capital 15 April 2013 18 April 2013 N/A N/A One cent Return of capital 26 November 2012 30 November 2012 N/A N/A One cent Return of capital 16 April 2012 19 April 2012 N/A N/A 5 cents Return of capital 12 October 2011 14 October 2011 N/A N/A 2.4 cents Dividend (Special) 5 September 2011 26 September 2011 100% $0.2188 One cent Dividend 5 September 2011 26 September 2011 100% $0.2188
Dividend Policy It is the objective of Bentley to provide a regular and stable distribution to shareholders after the announcement of its December half year end and June year end NTA backing results. These NTA backings are normally announced in mid January and July each year and Bentley will endeavour to announce its proposed distribution at this time. Bentley intends to make annual distributions to shareholders of at least one cent per share, to the extent permitted by law and subject to prudent business practice. It is envisaged that shareholder distributions will be made twice per year. Dividends will be franked to the extent that available franking credits permit. Capital returns will be subject to prior shareholder approval
1 Refer Bentley’s ASX Announcement dated 1 August 2017: Updated Dividend Reinvestment Plan
2 Bentley paid a distribution to shareholders every year (save on 4 occasions) since its admission to ASX in 1986.
31 DECEMBER 2017 BENTLEY CAPITAL LIMITED A.B.N. 87 008 108 218
APPENDIX 4D HALF YEAR REPORT
HALF YEAR REPORT | 4
ASSOCIATE ENTITY The Company has accounted for the following share investment at the Balance Date as an investment in an Associate entity (on an equity accounting basis):
· 20.06% interest (31,700,000 shares) in ASX-listed Keybridge Capital Limited (ASX: KBC) (30 June 2017 and 31 December 2016: 19.96%; 31,700,000 shares).
Keybridge was reclassified from being an investment in a financial asset (valued based on the last bid price on ASX under AASB 13) to being an investment in an Associate entity (valued under the equity method pursuant to Accounting Standard AASB 128), with effect on 1 January 2017. CONTROLLED ENTITIES On 11 July 2017, Social Stream, Inc. was incorporated in the State of Delaware, United States, as a wholly owned subsidiary of Devisd Pty Limited (itself a wholly owned subsidiary of BEL). For and on behalf of the Directors,
Date: 28 February 2018 Victor Ho Company Secretary Telephone: (08) 9214 9757 Email: [email protected]
31 DECEMBER 2017 BENTLEY CAPITAL LIMITED A.B.N. 87 008 108 218
DIRECTORS’ REPORT
HALF YEAR REPORT | 5
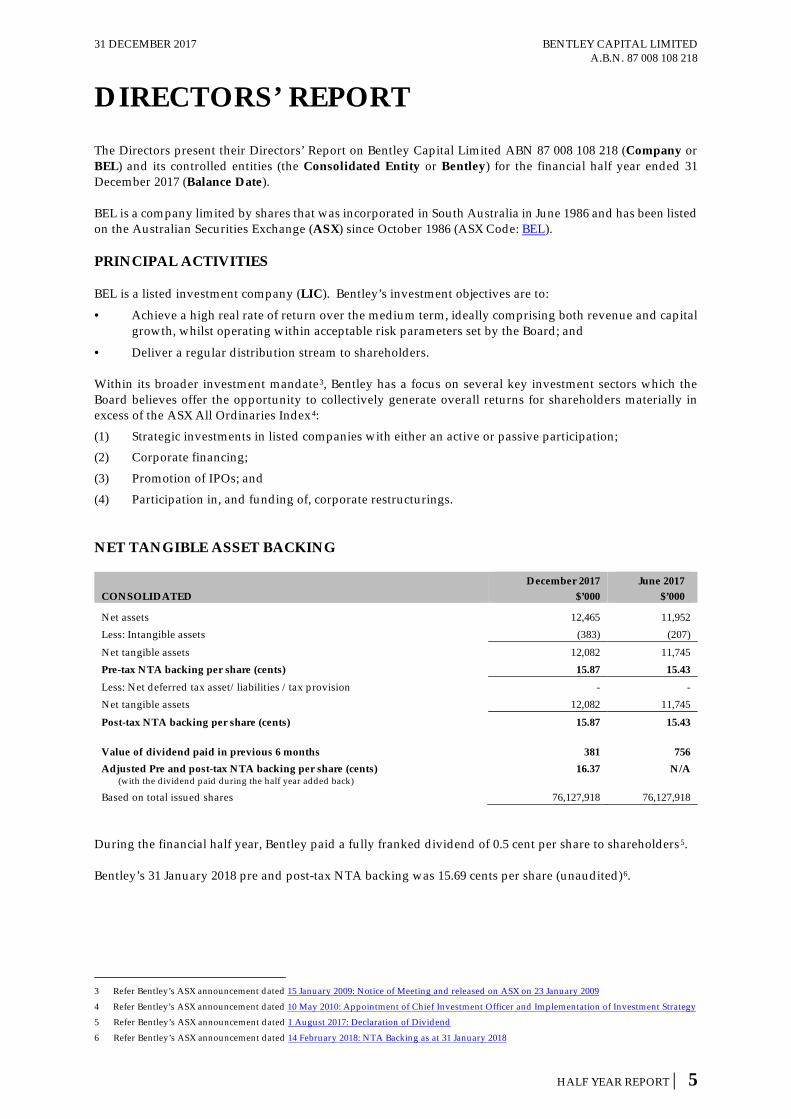
The Directors present their Directors’ Report on Bentley Capital Limited ABN 87 008 108 218 (Company or BEL) and its controlled entities (the Consolidated Entity or Bentley) for the financial half year ended 31 December 2017 (Balance Date). BEL is a company limited by shares that was incorporated in South Australia in June 1986 and has been listed on the Australian Securities Exchange (ASX) since October 1986 (ASX Code: BEL). PRINCIPAL ACTIVITIES BEL is a listed investment company (LIC). Bentley’s investment objectives are to:
· Achieve a high real rate of return over the medium term, ideally comprising both revenue and capital growth, whilst operating within acceptable risk parameters set by the Board; and
· Deliver a regular distribution stream to shareholders. Within its broader investment mandate3, Bentley has a focus on several key investment sectors which the Board believes offer the opportunity to collectively generate overall returns for shareholders materially in excess of the ASX All Ordinaries Index4: (1) Strategic investments in listed companies with either an active or passive participation; (2) Corporate financing; (3) Promotion of IPOs; and (4) Participation in, and funding of, corporate restructurings. NET TANGIBLE ASSET BACKING
CONSOLIDATED December 2017
$’000 June 2017
$’000
Net assets 12,465 11,952 Less: Intangible assets (383) (207) Net tangible assets 12,082 11,745 Pre-tax NTA backing per share (cents) 15.87 15.43 Less: Net deferred tax asset/liabilities /tax provision - - Net tangible assets 12,082 11,745 Post-tax NTA backing per share (cents) 15.87 15.43 Value of dividend paid in previous 6 months 381 756 Adjusted Pre and post-tax NTA backing per share (cents) 16.37 N/A (with the dividend paid during the half year added back)
Based on total issued shares 76,127,918 76,127,918 During the financial half year, Bentley paid a fully franked dividend of 0.5 cent per share to shareholders5. Bentley’s 31 January 2018 pre and post-tax NTA backing was 15.69 cents per share (unaudited)6.
3 Refer Bentley’s ASX announcement dated 15 January 2009: Notice of Meeting and released on ASX on 23 January 2009
4 Refer Bentley’s ASX announcement dated 10 May 2010: Appointment of Chief Investment Officer and Implementation of Investment Strategy 5 Refer Bentley’s ASX announcement dated 1 August 2017: Declaration of Dividend
6 Refer Bentley’s ASX announcement dated 14 February 2018: NTA Backing as at 31 January 2018

31 DECEMBER 2017 BENTLEY CAPITAL LIMITED A.B.N. 87 008 108 218
DIRECTORS’ REPORT
HALF YEAR REPORT | 6
OPERATING RESULTS
CONSOLIDATED December 2017
$’000 December 2016
$’000
Net gain on financial assets at fair value through profit or loss 1,573 - Share of Associate entity’s profit 27 - Dividends 170 33 Interest 2 13 Other income 9 10
Total revenue 1,781 56
Net loss on financial assets at fair value through profit or loss - (645) Software development expenses (480) (789) Salaries, fees and employee benefits (178) (178) Investment expenses (12) (19) Corporate expenses (45) (50) Administration expenses and other expenses (173) (201)
Total expenses 888 (1,882)
Profit / (Loss) before income tax expense 893 (1,826)
Income tax expense - - Profit / (Loss) after income tax expense 893 (1,826)
The net gain on financial assets of $1.573 million relates principally to the investment portfolio including positions in Santos Limited (ASX:STO), Pioneer Credit Limited (ASX:PNC)) and Strike Resources Limited (ASX:SRK). EARNINGS/(LOSS) PER SHARE
CONSOLIDATED December 2017
cents December 2016
cents
Earnings/(Loss) per share (cents) 1.17 (1.93) FINANCIAL POSITION
CONSOLIDATED December 2017
$'000 June 2017
$’000 Investments 3,828 5,142 Non-current asset held for sale 3,153 3,825 Investment in Associate entity 3,852 2,207 Cash and cash equivalents 1,443 569 Net deferred tax asset / liabilities - - Intangible assets 383 207 Other assets 101 212 Liabilities (295) (210)
Net assets 12,465 11,952
Issued capital 19,477 19,477 Profits Reserve 4,058 2,791 Accumulated losses (11,070) (10,316)
Total equity 12,465 11,952
31 DECEMBER 2017 BENTLEY CAPITAL LIMITED A.B.N. 87 008 108 218
DIRECTORS’ REPORT
HALF YEAR REPORT | 7
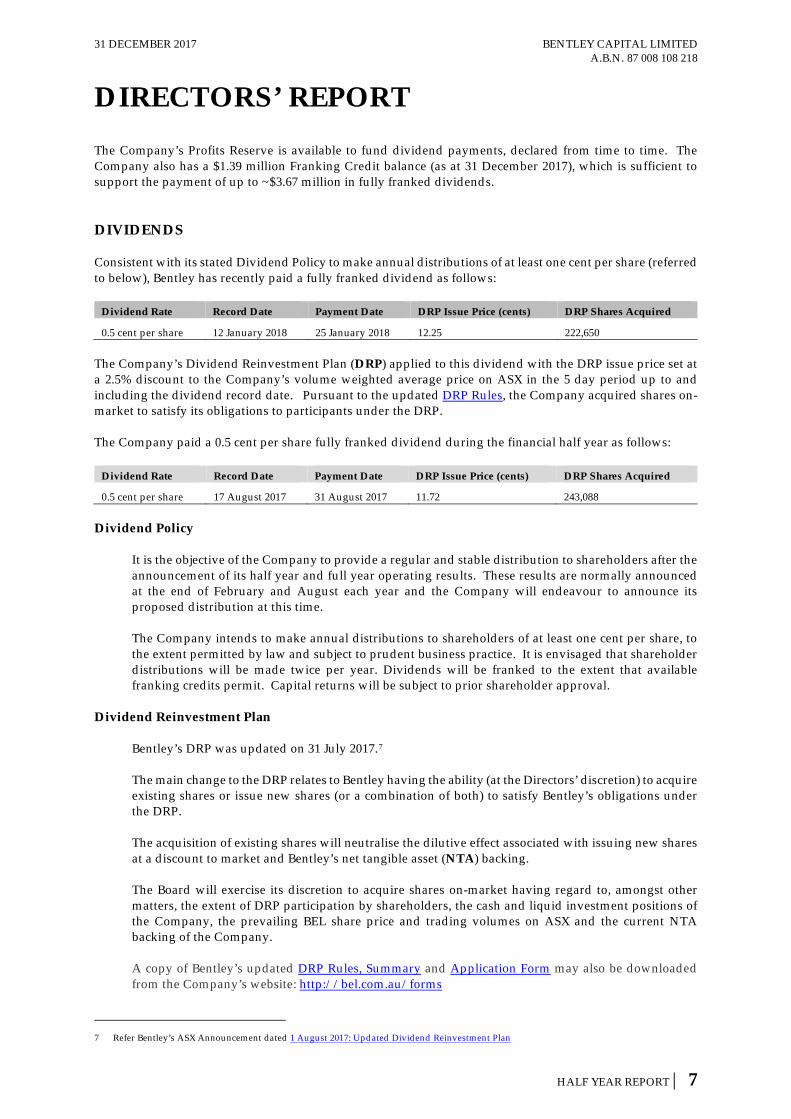
The Company’s Profits Reserve is available to fund dividend payments, declared from time to time. The Company also has a $1.39 million Franking Credit balance (as at 31 December 2017), which is sufficient to support the payment of up to ~$3.67 million in fully franked dividends. DIVIDENDS Consistent with its stated Dividend Policy to make annual distributions of at least one cent per share (referred to below), Bentley has recently paid a fully franked dividend as follows:
Dividend Rate Record Date Payment Date DRP Issue Price (cents) DRP Shares Acquired
0.5 cent per share 12 January 2018 25 January 2018 12.25 222,650 The Company’s Dividend Reinvestment Plan (DRP) applied to this dividend with the DRP issue price set at a 2.5% discount to the Company’s volume weighted average price on ASX in the 5 day period up to and including the dividend record date. Pursuant to the updated DRP Rules, the Company acquired shares on-market to satisfy its obligations to participants under the DRP. The Company paid a 0.5 cent per share fully franked dividend during the financial half year as follows:
Dividend Rate Record Date Payment Date DRP Issue Price (cents) DRP Shares Acquired
0.5 cent per share 17 August 2017 31 August 2017 11.72 243,088 Dividend Policy
It is the objective of the Company to provide a regular and stable distribution to shareholders after the announcement of its half year and full year operating results. These results are normally announced at the end of February and August each year and the Company will endeavour to announce its proposed distribution at this time. The Company intends to make annual distributions to shareholders of at least one cent per share, to the extent permitted by law and subject to prudent business practice. It is envisaged that shareholder distributions will be made twice per year. Dividends will be franked to the extent that available franking credits permit. Capital returns will be subject to prior shareholder approval.
Dividend Reinvestment Plan Bentley’s DRP was updated on 31 July 2017.7 The main change to the DRP relates to Bentley having the ability (at the Directors’ discretion) to acquire existing shares or issue new shares (or a combination of both) to satisfy Bentley’s obligations under the DRP. The acquisition of existing shares will neutralise the dilutive effect associated with issuing new shares at a discount to market and Bentley’s net tangible asset (NTA) backing. The Board will exercise its discretion to acquire shares on-market having regard to, amongst other matters, the extent of DRP participation by shareholders, the cash and liquid investment positions of the Company, the prevailing BEL share price and trading volumes on ASX and the current NTA backing of the Company.
A copy of Bentley’s updated DRP Rules, Summary and Application Form may also be downloaded from the Company’s website: http://bel.com.au/forms
7 Refer Bentley’s ASX Announcement dated 1 August 2017: Updated Dividend Reinvestment Plan
31 DECEMBER 2017 BENTLEY CAPITAL LIMITED A.B.N. 87 008 108 218
DIRECTORS’ REPORT
HALF YEAR REPORT | 8
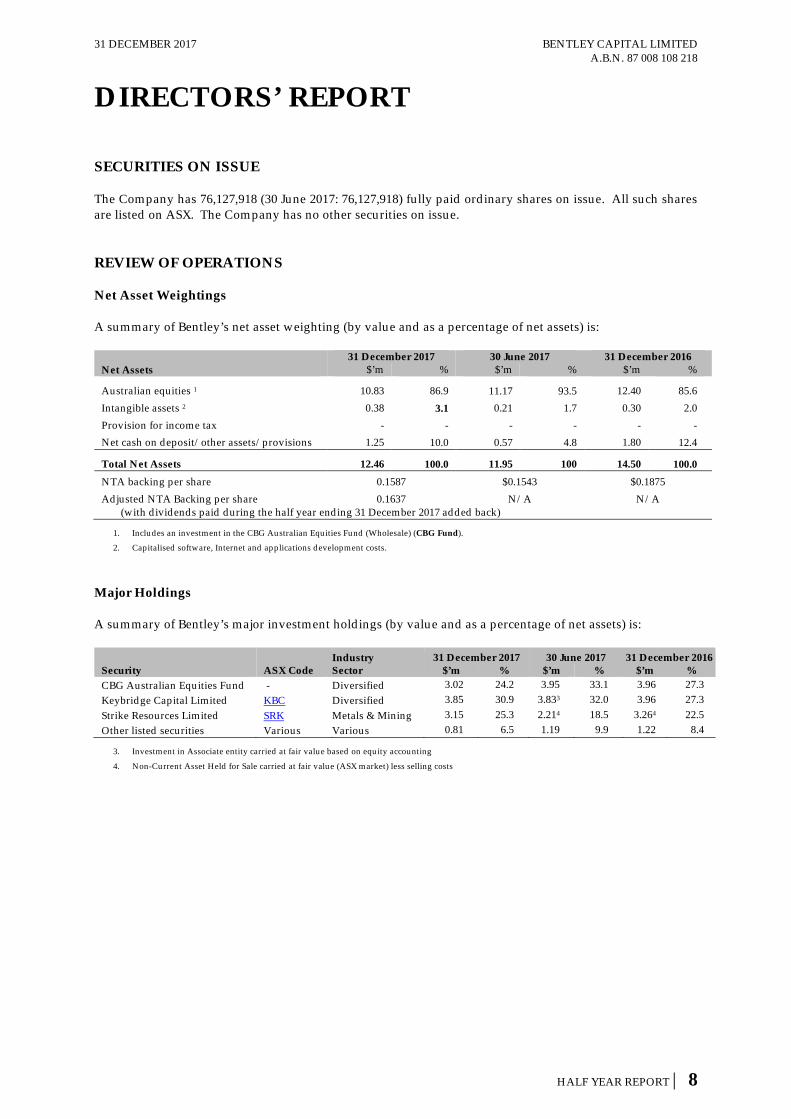
SECURITIES ON ISSUE The Company has 76,127,918 (30 June 2017: 76,127,918) fully paid ordinary shares on issue. All such shares are listed on ASX. The Company has no other securities on issue. REVIEW OF OPERATIONS Net Asset Weightings A summary of Bentley’s net asset weighting (by value and as a percentage of net assets) is:
Net Assets 31 December 2017 30 June 2017 31 December 2016
$’m % $’m % $’m %
Australian equities 1 10.83 86.9 11.17 93.5 12.40 85.6 Intangible assets 2 0.38 3.1 0.21 1.7 0.30 2.0 Provision for income tax - - - - - - Net cash on deposit/other assets/provisions 1.25 10.0 0.57 4.8 1.80 12.4
Total Net Assets 12.46 100.0 11.95 100 14.50 100.0 NTA backing per share 0.1587 $0.1543 $0.1875 Adjusted NTA Backing per share 0.1637 N/A N/A (with dividends paid during the half year ending 31 December 2017 added back)
1. Includes an investment in the CBG Australian Equities Fund (Wholesale) (CBG Fund).
2. Capitalised software, Internet and applications development costs.
Major Holdings A summary of Bentley’s major investment holdings (by value and as a percentage of net assets) is:
Security ASX Code Industry Sector
31 December 2017 30 June 2017 31 December 2016 $’m % $’m % $’m %
CBG Australian Equities Fund - Diversified 3.02 24.2 3.95 33.1 3.96 27.3 Keybridge Capital Limited KBC Diversified 3.85 30.9 3.833 32.0 3.96 27.3 Strike Resources Limited SRK Metals & Mining 3.15 25.3 2.214 18.5 3.264 22.5 Other listed securities Various Various 0.81 6.5 1.19 9.9 1.22 8.4
3. Investment in Associate entity carried at fair value based on equity accounting
4. Non-Current Asset Held for Sale carried at fair value (ASX market) less selling costs
31 DECEMBER 2017 BENTLEY CAPITAL LIMITED A.B.N. 87 008 108 218
DIRECTORS’ REPORT
HALF YEAR REPORT | 9
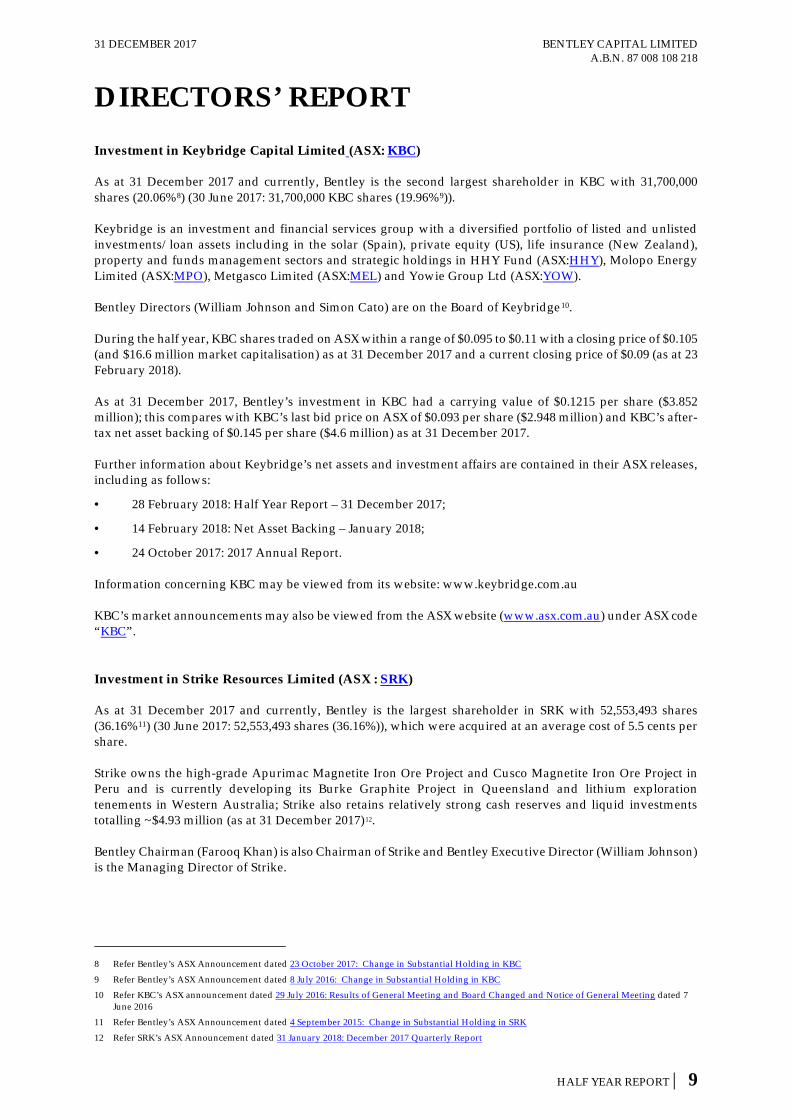
Investment in Keybridge Capital Limited (ASX: KBC) As at 31 December 2017 and currently, Bentley is the second largest shareholder in KBC with 31,700,000 shares (20.06%8) (30 June 2017: 31,700,000 KBC shares (19.96%9)). Keybridge is an investment and financial services group with a diversified portfolio of listed and unlisted investments/loan assets including in the solar (Spain), private equity (US), life insurance (New Zealand), property and funds management sectors and strategic holdings in HHY Fund (ASX:HHY), Molopo Energy Limited (ASX:MPO), Metgasco Limited (ASX:MEL) and Yowie Group Ltd (ASX:YOW). Bentley Directors (William Johnson and Simon Cato) are on the Board of Keybridge10. During the half year, KBC shares traded on ASX within a range of $0.095 to $0.11 with a closing price of $0.105 (and $16.6 million market capitalisation) as at 31 December 2017 and a current closing price of $0.09 (as at 23 February 2018). As at 31 December 2017, Bentley’s investment in KBC had a carrying value of $0.1215 per share ($3.852 million); this compares with KBC’s last bid price on ASX of $0.093 per share ($2.948 million) and KBC’s after-tax net asset backing of $0.145 per share ($4.6 million) as at 31 December 2017. Further information about Keybridge’s net assets and investment affairs are contained in their ASX releases, including as follows:
· 28 February 2018: Half Year Report – 31 December 2017;
· 14 February 2018: Net Asset Backing – January 2018;
· 24 October 2017: 2017 Annual Report. Information concerning KBC may be viewed from its website: www.keybridge.com.au KBC’s market announcements may also be viewed from the ASX website (www.asx.com.au) under ASX code “KBC”. Investment in Strike Resources Limited (ASX : SRK) As at 31 December 2017 and currently, Bentley is the largest shareholder in SRK with 52,553,493 shares (36.16%11) (30 June 2017: 52,553,493 shares (36.16%)), which were acquired at an average cost of 5.5 cents per share. Strike owns the high-grade Apurimac Magnetite Iron Ore Project and Cusco Magnetite Iron Ore Project in Peru and is currently developing its Burke Graphite Project in Queensland and lithium exploration tenements in Western Australia; Strike also retains relatively strong cash reserves and liquid investments totalling ~$4.93 million (as at 31 December 2017)12. Bentley Chairman (Farooq Khan) is also Chairman of Strike and Bentley Executive Director (William Johnson) is the Managing Director of Strike.
8 Refer Bentley’s ASX Announcement dated 23 October 2017: Change in Substantial Holding in KBC
9 Refer Bentley’s ASX Announcement dated 8 July 2016: Change in Substantial Holding in KBC 10 Refer KBC’s ASX announcement dated 29 July 2016: Results of General Meeting and Board Changed and Notice of General Meeting dated 7
June 2016 11 Refer Bentley’s ASX Announcement dated 4 September 2015: Change in Substantial Holding in SRK
12 Refer SRK’s ASX Announcement dated 31 January 2018: December 2017 Quarterly Report
31 DECEMBER 2017 BENTLEY CAPITAL LIMITED A.B.N. 87 008 108 218
DIRECTORS’ REPORT
HALF YEAR REPORT | 10
During the half year, SRK shares traded on ASX within a range of 4.4 to 6.2 cents with a closing price of 6 cents (and $8.72 million market capitalisation) as at 31 December 2017 and a current closing price of 6.5 cents (as at 23 February 2018). As at 31 December 2017, Bentley’s investment in Strike had a carrying value of $3.153 million, based on SRK’s last bid price on ASX of 6 cents per share as at 31 December 2017 (30 June 2017: 4.2 cents). Further information about Strike’s current projects and activities are contained in their ASX releases, including as follows:
· 31 January 2018: December 2017 Quarterly Reports;
· 17 October 2017: 2017 Annual Report. Information concerning SRK may be viewed from its website: www.strikeresources.com.au . SRK’s market announcements may also be viewed from the ASX website (www.asx.com.au) under ASX code “SRK”. Investment in Yowie Group Ltd (ASX:YOW) In February 2018, Bentley acquired 8,640,000 shares (3.66%) in YOW at an average cost of 10.5 cents per share. Bentley notes that Keybridge is also a major shareholder in YOW with a relevant interest in 34,414,114 shares (15.9851%) acquired in January and February 2018. Yowie Group is a global brand licensing company, specialising in the development of consumer products designed to promote learning, understanding and engagement with the natural world through the adventures and exploits of Yowie characters. Yowie Group employs its intellectual property rights in the outsourcing of the manufacturing and distribution of the Yowie chocolate confectionery product and in the development of a Yowie digital platform and Yowie branded licensed consumer products.13 Since 1 July 2017, YOW shares have traded on the ASX within a range of 35.5 to 9.8 cents with a current closing price of 11 cents (and a $23.681 million market capitalisation) (as at 23 February 2018). Information concerning the Yowie Group may be viewed on its website: www.yowiegroup.com Yowie Group’s market announcements may also be viewed from the ASX website (www.asx.com.au) under ASX code “YOW”. Investment in the CBG Australian Equities Fund (Wholesale) (CBG Fund) 14 As at 31 December 2017, Bentley had ~$3.02 million (24.27%of its net assets) invested in the CBG Australian Equities Fund (Wholesale) (CBG Fund) (December 2016: ~$3.96 million (27.3%)). The 6 month net performance of the CBG Fund to 31 December 2017 was +8.2% (December 2016: +3.0%) compared with its benchmark performance (S&P/ASX 200 Accumulation Index) of +8.4% (December 2016: +10.6%). Bentley’s investment in CBG Fund has generated a realised gain of $0.340 million and incurred an unrealised loss of $0.74 million for the financial half year (December 2016: $0.114 million unrealised loss). The investment’s unrealised gain (from historical cost) is $0.677 million (December 2016: $0.761 million unrealised gain). 13 Refer YOW’s 2017 Annual Report released on ASX on 24 August 2017
14 Based on information provided by investment manager, CBG Asset Management Limited

31 DECEMBER 2017 BENTLEY CAPITAL LIMITED A.B.N. 87 008 108 218
DIRECTORS’ REPORT
HALF YEAR REPORT | 11
The CBG Fund is a wholesale fund not open to retail investors. The objective of the fund is to outperform the S&P/ASX 200 Accumulation Index over the medium term. The Investment Manager is ‘style neutral’ and invests in growth stocks, value stocks, stocks with maintainable dividend yields and special situations. Bentley is able to redeem its investment in the CBG Fund at short notice without any exit fees. CBG Fund details provided to the Company as at 31 December 2017 are as follows:
· The equity weighting was 97.25% (December 2016: 83.65%);
· 81.64% of the equity portfolio is invested in companies contained within the S&P/ASX 200 Index (December 2016: 88.14%) with the balance of 18.36% invested in companies outside of the S&P/ASX 200 Index (December 2016: 17.86%); and
· The equity portfolio contained 43 holdings (December 2016: 47 holdings). CBG Fund Returns To: 1mth 3mths 6mths 1yr 2yrs 3yrs Since Inception 31 December 2017 (%) (%) (%) (%) (% p.a.) (% p.a.) (% p.a.)
CBG Fund 2.5% 8.0% 8.2% 11.2% 3.0% 5.4% 9.3%
ASX / S&P 200 Accumulation Index
1.8% 7.6% 8.4% 11.8% 11.8% 7.9% 8.5%
The monthly performance of the CBG Fund for January 2018 was +1.1% compared with its benchmark performance (S&P/ASX 200 Accumulation Index) of -0.4%. CBG Fund Returns To: 1mth 3mths 6mths 1yr 2yrs 3yrs Since Inception 31 January 2018 (%) (%) (%) (%) (% p.a.) (% p.a.) (% p.a.)
CBG Fund 1.1% 5.6% 9.2% 14.8% 6.8% 4.5% 9.3%
ASX / S&P 200 Accumulation Index
-0.4% 3.0% 7.9% 12.2% 14.7% 7.3% 8.4%
Source: CBG Asset Management Limited Notes:
(a) Shows the net return of the fund over the preceding 3 months for each quarter, compared with that of the benchmark ASX/S&P 200 Accumulation Index.
(b) The information in the table is historical and the past performance of the CBG Australian Equities Fund (Wholesale) is not a reliable predictor of the future performance of such fund; CBG have not made any representation to the Company that it will achieve any specific future rate of return on the fund.
31 DECEMBER 2017 BENTLEY CAPITAL LIMITED A.B.N. 87 008 108 218
DIRECTORS’ REPORT
HALF YEAR REPORT | 12
CBG Fund Top 20 Holdings
CBG Fund Sector Weights
ASX Code Asset Name
Fund Weight
31-Dec-17
Fund Weight
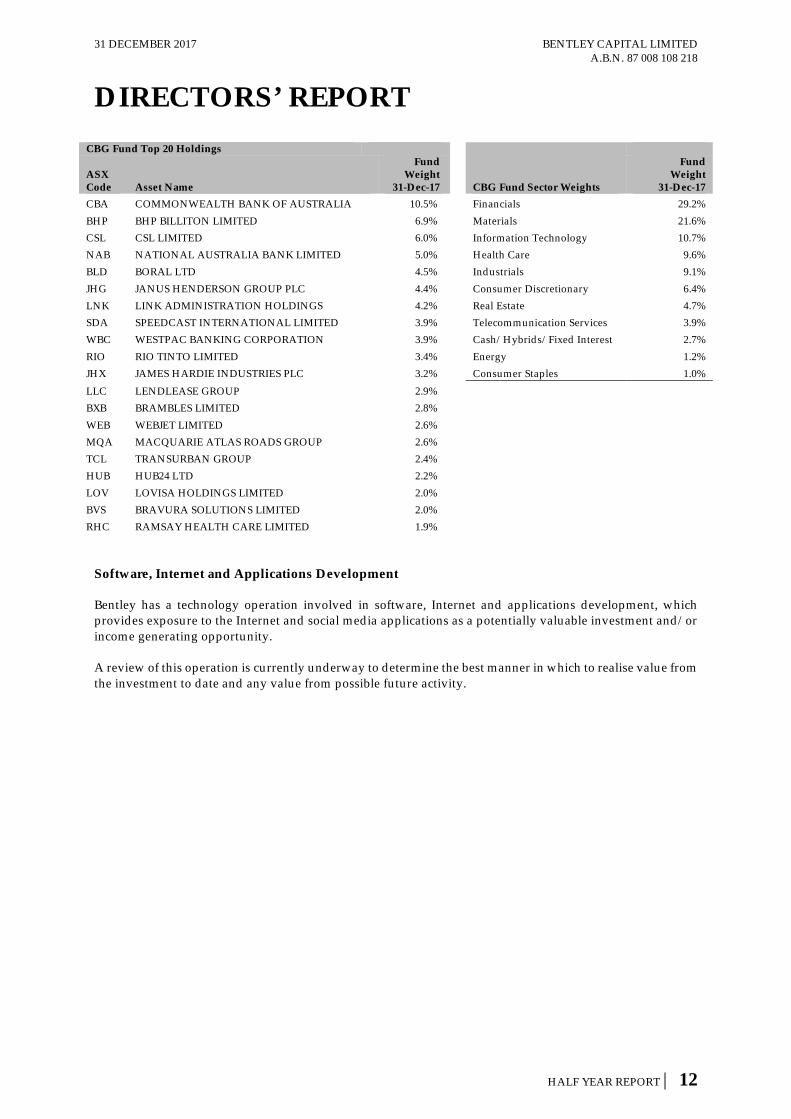
31-Dec-17 CBA COMMONWEALTH BANK OF AUSTRALIA 10.5% Financials 29.2% BHP BHP BILLITON LIMITED 6.9% Materials 21.6% CSL CSL LIMITED 6.0% Information Technology 10.7% NAB NATIONAL AUSTRALIA BANK LIMITED 5.0% Health Care 9.6% BLD BORAL LTD 4.5% Industrials 9.1% JHG JANUS HENDERSON GROUP PLC 4.4% Consumer Discretionary 6.4% LNK LINK ADMINISTRATION HOLDINGS 4.2% Real Estate 4.7% SDA SPEEDCAST INTERNATIONAL LIMITED 3.9% Telecommunication Services 3.9% WBC WESTPAC BANKING CORPORATION 3.9% Cash/Hybrids/Fixed Interest 2.7% RIO RIO TINTO LIMITED 3.4% Energy 1.2% JHX JAMES HARDIE INDUSTRIES PLC 3.2% Consumer Staples 1.0% LLC LENDLEASE GROUP 2.9% BXB BRAMBLES LIMITED 2.8% WEB WEBJET LIMITED 2.6% MQA MACQUARIE ATLAS ROADS GROUP 2.6% TCL TRANSURBAN GROUP 2.4% HUB HUB24 LTD 2.2% LOV LOVISA HOLDINGS LIMITED 2.0% BVS BRAVURA SOLUTIONS LIMITED 2.0% RHC RAMSAY HEALTH CARE LIMITED 1.9%
Software, Internet and Applications Development Bentley has a technology operation involved in software, Internet and applications development, which provides exposure to the Internet and social media applications as a potentially valuable investment and/or income generating opportunity. A review of this operation is currently underway to determine the best manner in which to realise value from the investment to date and any value from possible future activity.

31 DECEMBER 2017 BENTLEY CAPITAL LIMITED A.B.N. 87 008 108 218
DIRECTORS’ REPORT
HALF YEAR REPORT | 12
CBG Fund Top 20 Holdings
CBG Fund Sector Weights
ASX Code Asset Name
Fund Weight
31-Dec-17
Fund Weight
31-Dec-17 CBA COMMONWEALTH BANK OF AUSTRALIA 10.5% Financials 29.2% BHP BHP BILLITON LIMITED 6.9% Materials 21.6% CSL CSL LIMITED 6.0% Information Technology 10.7% NAB NATIONAL AUSTRALIA BANK LIMITED 5.0% Health Care 9.6% BLD BORAL LTD 4.5% Industrials 9.1% JHG JANUS HENDERSON GROUP PLC 4.4% Consumer Discretionary 6.4% LNK LINK ADMINISTRATION HOLDINGS 4.2% Real Estate 4.7% SDA SPEEDCAST INTERNATIONAL LIMITED 3.9% Telecommunication Services 3.9% WBC WESTPAC BANKING CORPORATION 3.9% Cash/Hybrids/Fixed Interest 2.7% RIO RIO TINTO LIMITED 3.4% Energy 1.2% JHX JAMES HARDIE INDUSTRIES PLC 3.2% Consumer Staples 1.0% LLC LENDLEASE GROUP 2.9% BXB BRAMBLES LIMITED 2.8% WEB WEBJET LIMITED 2.6% MQA MACQUARIE ATLAS ROADS GROUP 2.6% TCL TRANSURBAN GROUP 2.4% HUB HUB24 LTD 2.2% LOV LOVISA HOLDINGS LIMITED 2.0% BVS BRAVURA SOLUTIONS LIMITED 2.0% RHC RAMSAY HEALTH CARE LIMITED 1.9%
Software, Internet and Applications Development Bentley has a technology operation involved in software, Internet and applications development, which provides exposure to the Internet and social media applications as a potentially valuable investment and/or income generating opportunity. A review of this operation is currently underway to determine the best manner in which to realise value from the investment to date and any value from possible future activity.
31 DECEMBER 2017 BENTLEY CAPITAL LIMITED A.B.N. 87 008 108 218
DIRECTORS’ REPORT
HALF YEAR REPORT | 13
DIRECTORS Directors in office during or since the financial half year are as follows:
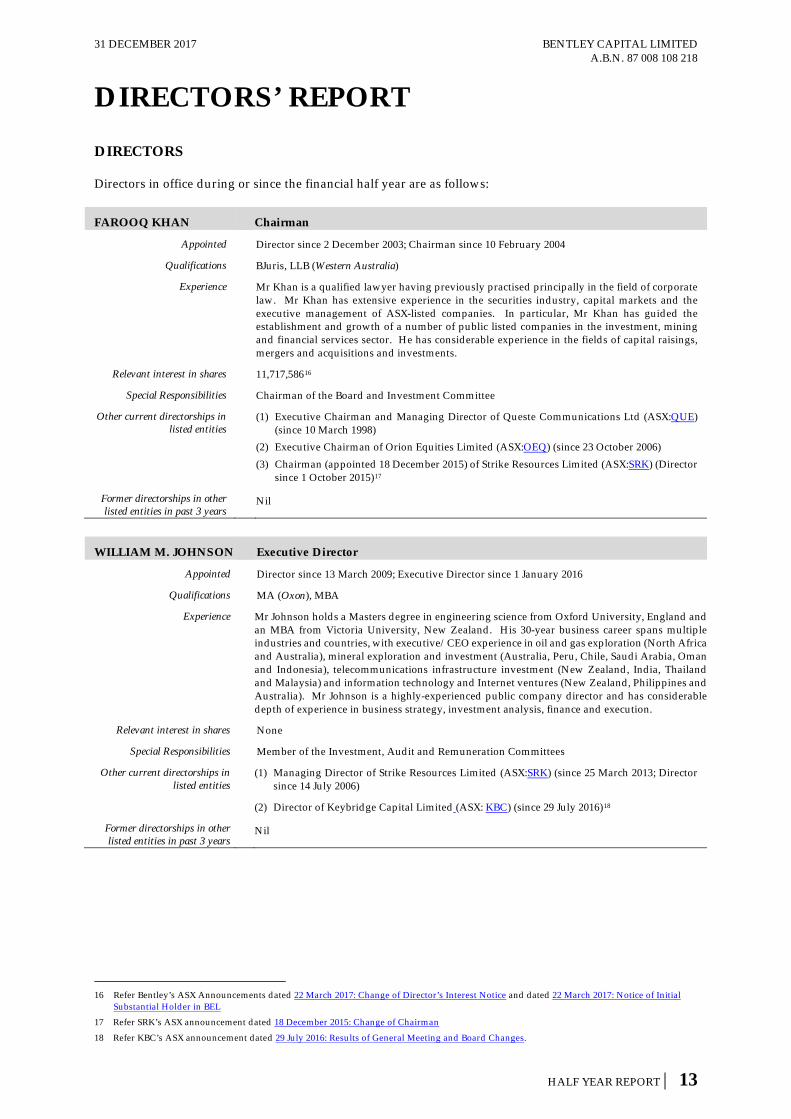
FAROOQ KHAN Chairman
Appointed Director since 2 December 2003; Chairman since 10 February 2004
Qualifications BJuris, LLB (Western Australia)
Experience Mr Khan is a qualified lawyer having previously practised principally in the field of corporate law. Mr Khan has extensive experience in the securities industry, capital markets and the executive management of ASX-listed companies. In particular, Mr Khan has guided the establishment and growth of a number of public listed companies in the investment, mining and financial services sector. He has considerable experience in the fields of capital raisings, mergers and acquisitions and investments.
Relevant interest in shares 11,717,58616
Special Responsibilities Chairman of the Board and Investment Committee
Other current directorships in listed entities
(1) Executive Chairman and Managing Director of Queste Communications Ltd (ASX:QUE) (since 10 March 1998)
(2) Executive Chairman of Orion Equities Limited (ASX:OEQ) (since 23 October 2006) (3) Chairman (appointed 18 December 2015) of Strike Resources Limited (ASX:SRK) (Director
since 1 October 2015)17
Former directorships in other listed entities in past 3 years Nil
WILLIAM M. JOHNSON Executive Director
Appointed Director since 13 March 2009; Executive Director since 1 January 2016
Qualifications MA (Oxon), MBA
Experience Mr Johnson holds a Masters degree in engineering science from Oxford University, England and an MBA from Victoria University, New Zealand. His 30-year business career spans multiple industries and countries, with executive/CEO experience in oil and gas exploration (North Africa and Australia), mineral exploration and investment (Australia, Peru, Chile, Saudi Arabia, Oman and Indonesia), telecommunications infrastructure investment (New Zealand, India, Thailand and Malaysia) and information technology and Internet ventures (New Zealand, Philippines and Australia). Mr Johnson is a highly-experienced public company director and has considerable depth of experience in business strategy, investment analysis, finance and execution.
Relevant interest in shares None
Special Responsibilities Member of the Investment, Audit and Remuneration Committees
Other current directorships in listed entities
(1) Managing Director of Strike Resources Limited (ASX:SRK) (since 25 March 2013; Director since 14 July 2006)
(2) Director of Keybridge Capital Limited (ASX: KBC) (since 29 July 2016)18
Former directorships in other listed entities in past 3 years
Nil
16 Refer Bentley’s ASX Announcements dated 22 March 2017: Change of Director’s Interest Notice and dated 22 March 2017: Notice of Initial
Substantial Holder in BEL 17 Refer SRK’s ASX announcement dated 18 December 2015: Change of Chairman
18 Refer KBC’s ASX announcement dated 29 July 2016: Results of General Meeting and Board Changes.

31 DECEMBER 2017 BENTLEY CAPITAL LIMITED A.B.N. 87 008 108 218
DIRECTORS’ REPORT
HALF YEAR REPORT | 14
SIMON K. CATO Non-Executive Director
Appointed 7 January 2015
Qualifications B.A. (Sydney)
Experience Mr Cato has had over 30 years’ capital markets experience in broking, regulatory roles and as a director of listed companies. He was initially employed by the ASX in Sydney and then in Perth. From 1991 until 2006 he was an executive director and/or responsible executive of three stockbroking firms and in those roles he has been involved in many aspects of broking including management issues such as credit control and reporting to regulatory bodies in the securities industry. As a broker he was also involved in the underwriting of a number of IPO’s and has been through the process of IPO listing in the dual role of broker and director. Currently he holds a number of non-executive roles with other listed companies in Australia.
Relevant interest in shares None
Special Responsibilities Chairman of the Audit and Remuneration Committees
Other current directorships in listed entities
(1) Non-Executive Chairman of Advanced Share Registry Limited (ASX:ASW) (since 22 August 2007)
(2) Non-Executive Director of Greenland Minerals and Energy Limited (ASX:GGG) (since 21 February 2006)
(3) Non-Executive Director of Keybridge Capital Limited (ASX: KBC) (since 29 July 2016)
Former directorships in other listed entities in past 3 years
Nil
COMPANY SECRETARY
VICTOR P. H. HO Company Secretary
Appointed 5 February 2004
Qualifications BCom, LLB (Western Australia), CTA
Experience Mr Ho has been in Executive roles with a number of ASX listed companies across the investments, resources and technology sectors over the past 18+ years. Mr Ho is a Chartered Tax Adviser (CTA) and previously had 9 years’ experience in the taxation profession with the Australian Tax Office (ATO) and in a specialist tax law firm. Mr Ho has been actively involved in the structuring and execution of a number of corporate, M&A and international joint venture (in South America, Indonesia and the Middle East) transactions, capital raisings and capital management initiatives and has extensive experience in public company administration, corporations’ law and stock exchange compliance and investor/shareholder relations.
Special Responsibilities Member of the Investment Committee and Secretary of the Audit and Remuneration Committees
Relevant interest in shares 50,000 ordinary shares (held indirectly)
Other positions held in listed entities
Executive Director and Company Secretary of: (1) Orion Equities Limited (ASX:OEQ) (Secretary since 2 August 2000 and Director since 4 July
2003) (2) Queste Communications Ltd (ASX:QUE) (Secretary since 30 August 2000 and Director
since 3 April 2013) (3) Strike Resources Limited (ASX:SRK) (Director since 24 January 2014 and Secretary since 1
October 2015) Company Secretary of Keybridge Capital Limited (ASX:KBC) (since 13 October 2016)
Former position in other listed entities in past 3 years
Company Secretary of Alara Resources Limited (ASX:AUQ) (4 April 2007 to 31 August 2015)
31 DECEMBER 2017 BENTLEY CAPITAL LIMITED A.B.N. 87 008 108 218
DIRECTORS’ REPORT
HALF YEAR REPORT | 15
AUDITOR’S INDEPENDENCE DECLARATION A copy of the Auditor’s Independence Declaration as required under section 307C of the Corporations Act 2001 forms part of this Directors Report and is set out on page 16. This relates to the Auditor’s Independent Review Report, where the Auditors state that they have issued an independence declaration. Signed for and on behalf of the Directors in accordance with a resolution of the Board,
Farooq Khan Simon Cato Chairman Non-Executive Director and
Chairman of the Audit Committee 28 February 2018

31 DECEMBER 2017 BENTLEY CAPITAL LIMITEDA.B.N. 87 008 108 218
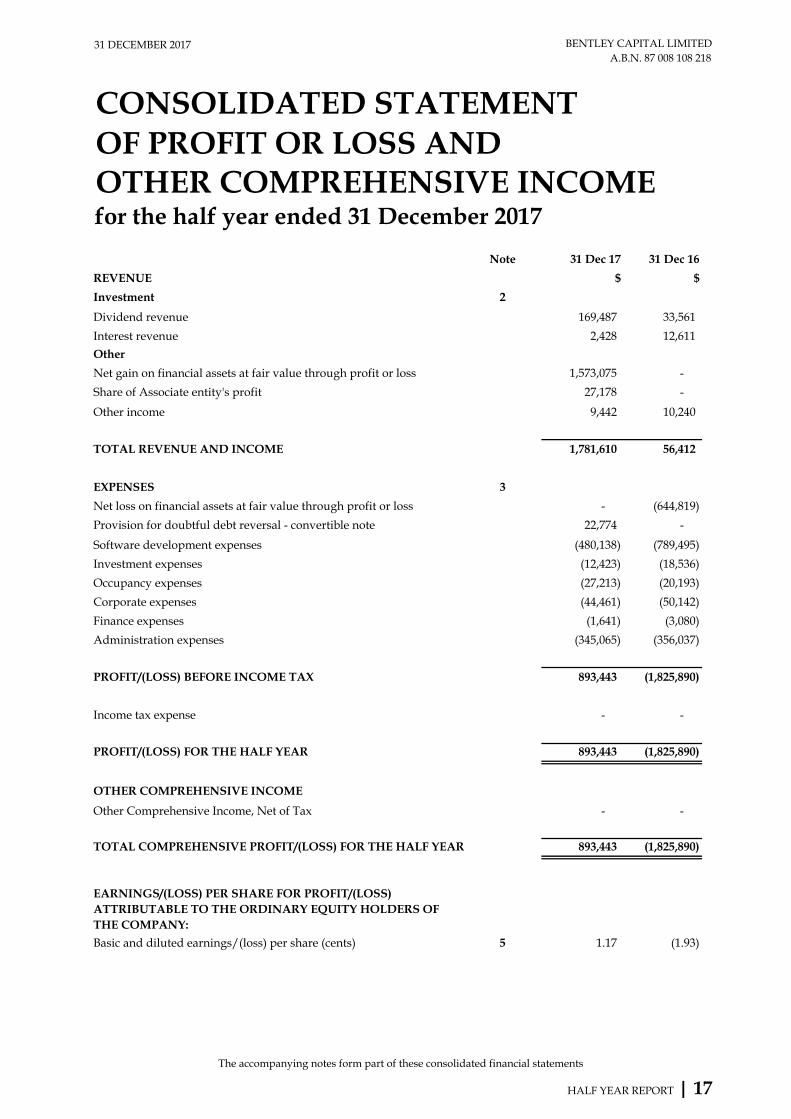
CONSOLIDATED STATEMENTOF PROFIT OR LOSS ANDOTHER COMPREHENSIVE INCOMEfor the half year ended 31 December 2017
Note 31 Dec 17 31 Dec 16
REVENUE $ $
Investment 2
Dividend revenue 169,487 33,561
Interest revenue 2,428 12,611
Other
Net gain on financial assets at fair value through profit or loss 1,573,075 -
Share of Associate entity's profit 27,178 -
Other income 9,442 10,240
TOTAL REVENUE AND INCOME 1,781,610 56,412
EXPENSES 3
Net loss on financial assets at fair value through profit or loss - (644,819)
Provision for doubtful debt reversal - convertible note 22,774 -
Software development expenses (480,138) (789,495)
Investment expenses (12,423) (18,536)
Occupancy expenses (27,213) (20,193)
Corporate expenses (44,461) (50,142)
Finance expenses (1,641) (3,080)
Administration expenses (345,065) (356,037)
PROFIT/(LOSS) BEFORE INCOME TAX 893,443 (1,825,890)
Income tax expense - -
PROFIT/(LOSS) FOR THE HALF YEAR 893,443 (1,825,890)
OTHER COMPREHENSIVE INCOME
Other Comprehensive Income, Net of Tax - -
TOTAL COMPREHENSIVE PROFIT/(LOSS) FOR THE HALF YEAR 893,443 (1,825,890)
Basic and diluted earnings/(loss) per share (cents) 5 1.17 (1.93)
EARNINGS/(LOSS) PER SHARE FOR PROFIT/(LOSS) ATTRIBUTABLE TO THE ORDINARY EQUITY HOLDERS OF THE COMPANY:
The accompanying notes form part of these consolidated financial statements
HALF YEAR REPORT | 17
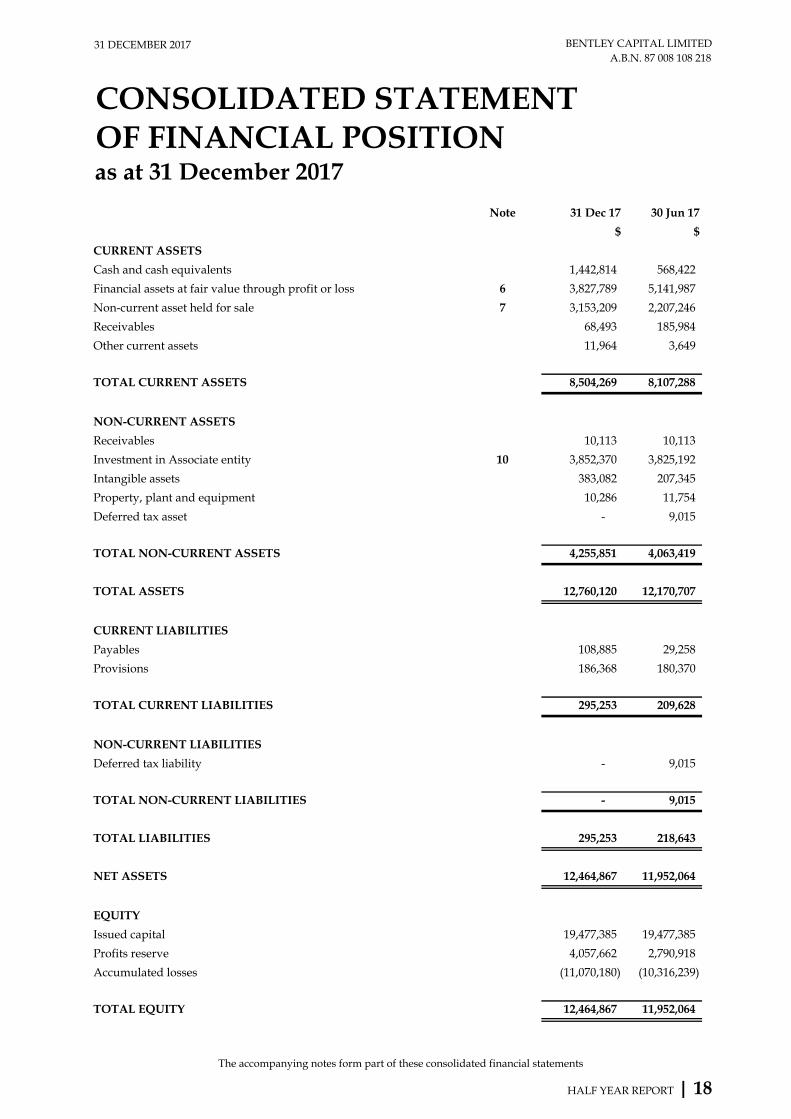
31 DECEMBER 2017 BENTLEY CAPITAL LIMITEDA.B.N. 87 008 108 218
as at 31 December 2017
Note 31 Dec 17 30 Jun 17
$ $
CURRENT ASSETS
Cash and cash equivalents 1,442,814 568,422
Financial assets at fair value through profit or loss 6 3,827,789 5,141,987
Non-current asset held for sale 7 3,153,209 2,207,246
Receivables 68,493 185,984
Other current assets 11,964 3,649
TOTAL CURRENT ASSETS 8,504,269 8,107,288
NON-CURRENT ASSETS
Receivables 10,113 10,113
Investment in Associate entity 10 3,852,370 3,825,192
Intangible assets 383,082 207,345
Property, plant and equipment 10,286 11,754
Deferred tax asset - 9,015
TOTAL NON-CURRENT ASSETS 4,255,851 4,063,419
TOTAL ASSETS 12,760,120 12,170,707
CURRENT LIABILITIES
Payables 108,885 29,258
Provisions 186,368 180,370
TOTAL CURRENT LIABILITIES 295,253 209,628
NON-CURRENT LIABILITIES
Deferred tax liability - 9,015
TOTAL NON-CURRENT LIABILITIES - 9,015
TOTAL LIABILITIES 295,253 218,643
NET ASSETS 12,464,867 11,952,064
EQUITY
Issued capital 19,477,385 19,477,385
Profits reserve 4,057,662 2,790,918
Accumulated losses (11,070,180) (10,316,239)
TOTAL EQUITY 12,464,867 11,952,064
OF FINANCIAL POSITIONCONSOLIDATED STATEMENT
The accompanying notes form part of these consolidated financial statements
HALF YEAR REPORT | 18
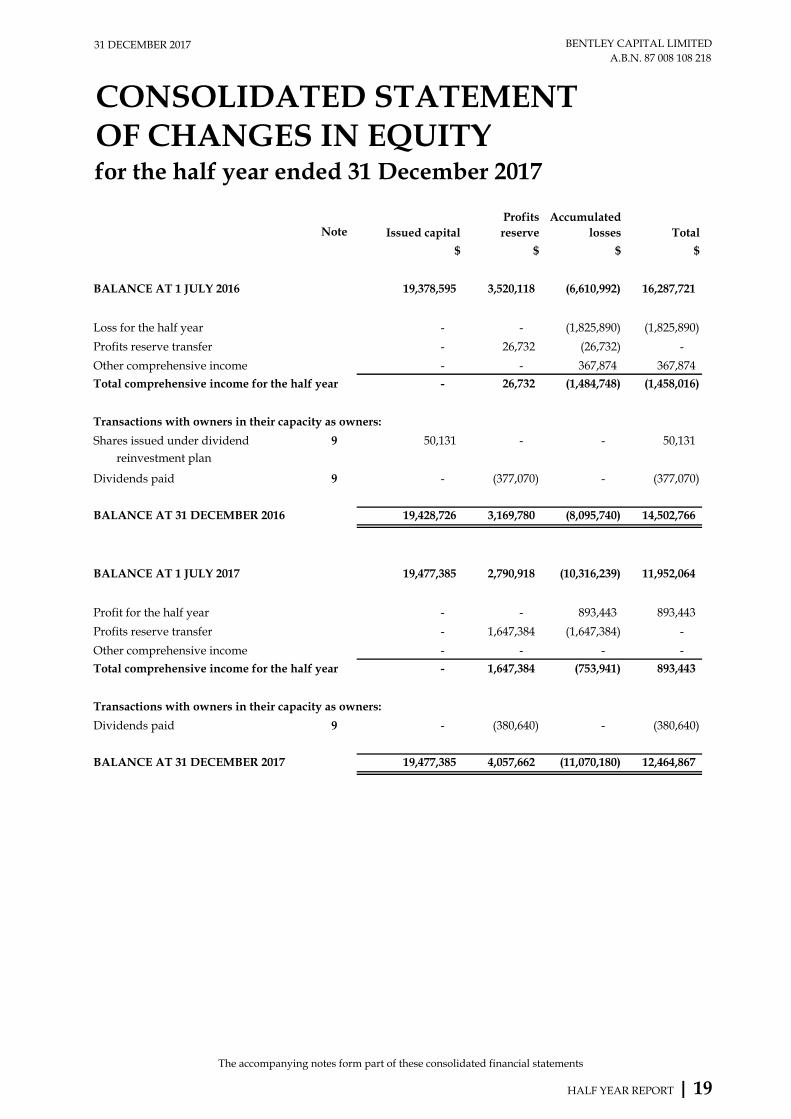
31 DECEMBER 2017 BENTLEY CAPITAL LIMITEDA.B.N. 87 008 108 218
Note
$ $ $ $
BALANCE AT 1 JULY 2016 19,378,595 3,520,118 (6,610,992) 16,287,721
Loss for the half year - - (1,825,890) (1,825,890)
Profits reserve transfer - 26,732 (26,732) -
Other comprehensive income - - 367,874 367,874
Total comprehensive income for the half year - 26,732 (1,484,748) (1,458,016)
Transactions with owners in their capacity as owners:
Shares issued under dividend 9 50,131 - - 50,131 reinvestment plan
Dividends paid 9 - (377,070) - (377,070)
BALANCE AT 31 DECEMBER 2016 19,428,726 3,169,780 (8,095,740) 14,502,766
BALANCE AT 1 JULY 2017 19,477,385 2,790,918 (10,316,239) 11,952,064
Profit for the half year - - 893,443 893,443
Profits reserve transfer - 1,647,384 (1,647,384) -
Other comprehensive income - - - -
Total comprehensive income for the half year - 1,647,384 (753,941) 893,443
Transactions with owners in their capacity as owners:
Dividends paid 9 - (380,640) - (380,640)
BALANCE AT 31 DECEMBER 2017 19,477,385 4,057,662 (11,070,180) 12,464,867
Profits reserve
Accumulated losses TotalIssued capital
CONSOLIDATED STATEMENTOF CHANGES IN EQUITYfor the half year ended 31 December 2017
The accompanying notes form part of these consolidated financial statements
HALF YEAR REPORT | 19
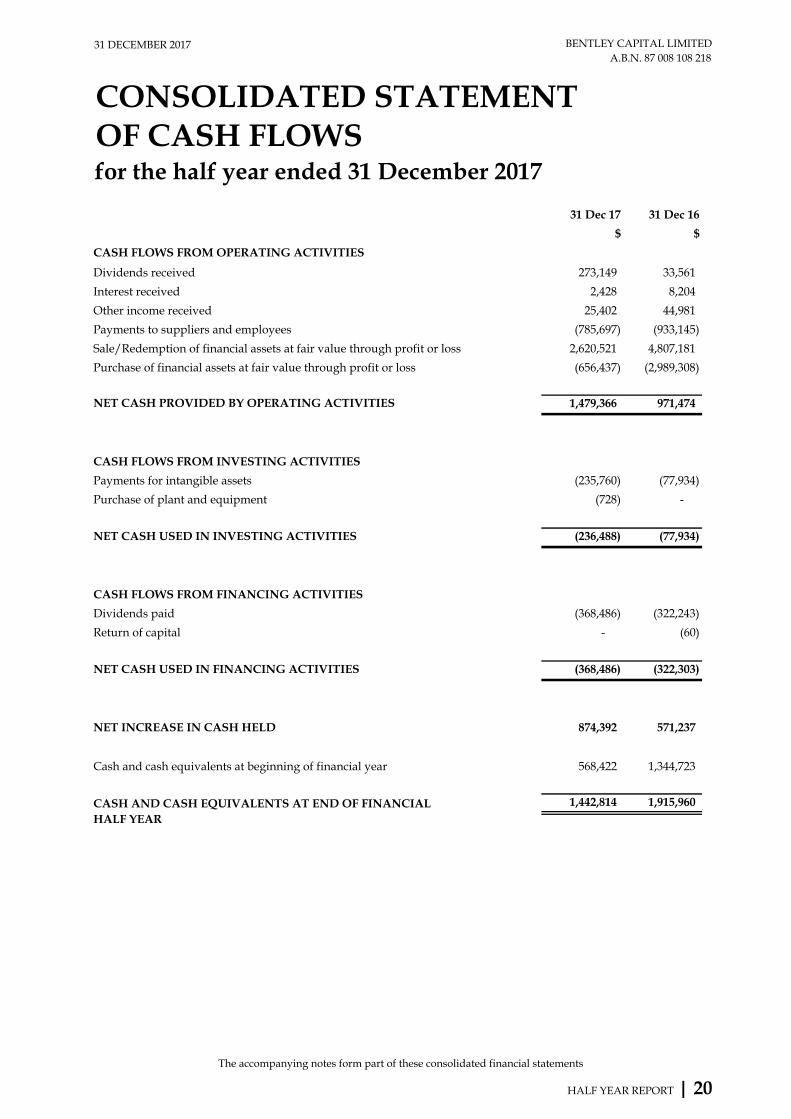
31 DECEMBER 2017 BENTLEY CAPITAL LIMITEDA.B.N. 87 008 108 218
31 Dec 17 31 Dec 16
$ $
Dividends received 273,149 33,561
Interest received 2,428 8,204
Other income received 25,402 44,981
Payments to suppliers and employees (785,697) (933,145)
Sale/Redemption of financial assets at fair value through profit or loss 2,620,521 4,807,181
Purchase of financial assets at fair value through profit or loss (656,437) (2,989,308)
1,479,366 971,474
CASH FLOWS FROM INVESTING ACTIVITIES
Payments for intangible assets (235,760) (77,934)
Purchase of plant and equipment (728) -
NET CASH USED IN INVESTING ACTIVITIES (236,488) (77,934)
CASH FLOWS FROM FINANCING ACTIVITIES
Dividends paid (368,486) (322,243)
Return of capital - (60)
NET CASH USED IN FINANCING ACTIVITIES (368,486) (322,303)
NET INCREASE IN CASH HELD 874,392 571,237
Cash and cash equivalents at beginning of financial year 568,422 1,344,723
1,442,814 1,915,960
CONSOLIDATED STATEMENTOF CASH FLOWSfor the half year ended 31 December 2017
CASH FLOWS FROM OPERATING ACTIVITIES
NET CASH PROVIDED BY OPERATING ACTIVITIES
CASH AND CASH EQUIVALENTS AT END OF FINANCIAL HALF YEAR
The accompanying notes form part of these consolidated financial statements
HALF YEAR REPORT | 20

31 DECEMBER 2017 BENTLEY CAPITAL LIMITEDA.B.N. 87 008 108 218
NOTES TO THE CONSOLIDATEDFINANCIAL STATEMENTSfor the half year ended 31 December 2017
1. SIGNIFICANT ACCOUNTING POLICIES
Basis of Preparation
2. REVENUE
31 Dec 17 31 Dec 16
$ $
Investment
Dividend revenue 169,487 33,561
Interest revenue 2,428 12,611
171,915 46,172
Other
Net gain on financial assets at fair value through profit or loss 1,573,075 -
Share of Associate entity's profit 27,178 -
Other income 9,442 10,240 1,781,610 56,412
3. EXPENSES
Net loss on financial assets at fair value through profit or loss - 644,819
Provision for doubtful debt reversal - convertible note (22,774) -
Software development expenses
Write-off of software development costs 38,879 352,813
Amortisation of software development assets 21,145 33,925
Other software development expenses 420,114 402,757
Statement of Compliance
The half year financial statements are a general purpose financial report prepared in accordance with the CorporationsAct 2001 and AASB 134 'Interim Financial Reporting'. Compliance with AASB 134 ensures compliance with InternationalFinancial Reporting Standard IAS 34 'Interim Financial Reporting'. These half year financial statements do not includenotes of the type normally included in the annual financial statements and should be read in conjunction with the mostrecent annual financial statements and the Company's ASX announcements released from 1 July 2017 to the date of thisreport.
The financial statements have been prepared on the basis of historical cost, except for the revaluation of certain non-current assets and financial instruments. Cost is based on the fair values of the consideration given in exchange forassets. All amounts are presented in Australian dollars, unless otherwise noted.
The accounting policies and methods of computation adopted in the preparation of the half year financial statements areconsistent with those adopted and disclosed in the Consolidated Entity's financial statements for the financial year ended30 June 2017.
The consolidated profit/(loss) before income tax includes the following items ofrevenue:
The consolidated profit/(loss) before income tax includes the following items ofexpenses:
HALF YEAR REPORT | 21
31 DECEMBER 2017 BENTLEY CAPITAL LIMITEDA.B.N. 87 008 108 218
NOTES TO THE CONSOLIDATEDFINANCIAL STATEMENTSfor the half year ended 31 December 2017
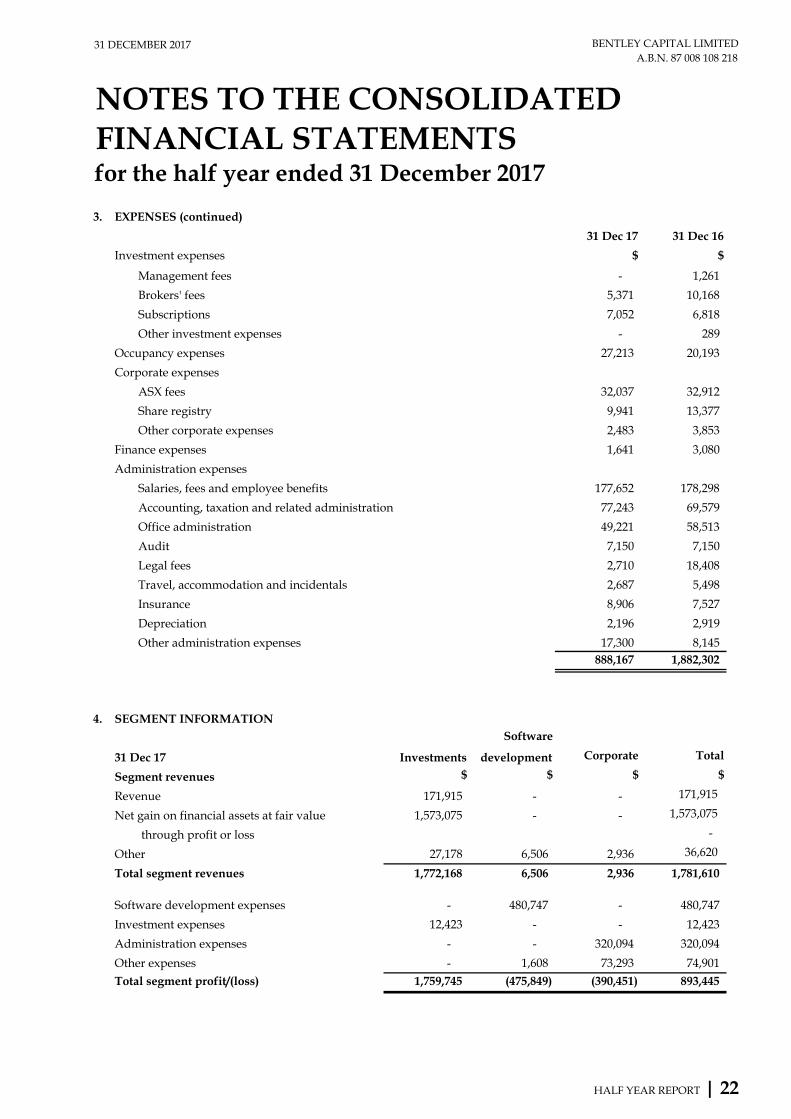
3. EXPENSES (continued)
31 Dec 17 31 Dec 16
Investment expenses $ $
Management fees - 1,261
Brokers' fees 5,371 10,168
Subscriptions 7,052 6,818
Other investment expenses - 289
Occupancy expenses 27,213 20,193
Corporate expenses
ASX fees 32,037 32,912
Share registry 9,941 13,377
Other corporate expenses 2,483 3,853
Finance expenses 1,641 3,080
Administration expenses
Salaries, fees and employee benefits 177,652 178,298
Accounting, taxation and related administration 77,243 69,579
Office administration 49,221 58,513
Audit 7,150 7,150
Legal fees 2,710 18,408
Travel, accommodation and incidentals 2,687 5,498
Insurance 8,906 7,527
Depreciation 2,196 2,919
Other administration expenses 17,300 8,145 888,167 1,882,302
4. SEGMENT INFORMATIONSoftware
31 Dec 17 Investments development Corporate Total
Segment revenues $ $ $ $
Revenue 171,915 - - 171,915
Net gain on financial assets at fair value 1,573,075 - - 1,573,075
through profit or loss -
Other 27,178 6,506 2,936 36,620
Total segment revenues 1,772,168 6,506 2,936 1,781,610
Software development expenses - 480,747 - 480,747
Investment expenses 12,423 - - 12,423
Administration expenses - - 320,094 320,094
Other expenses - 1,608 73,293 74,901
Total segment profit/(loss) 1,759,745 (475,849) (390,451) 893,445
HALF YEAR REPORT | 22
31 DECEMBER 2017 BENTLEY CAPITAL LIMITEDA.B.N. 87 008 108 218
NOTES TO THE CONSOLIDATEDFINANCIAL STATEMENTSfor the half year ended 31 December 2017
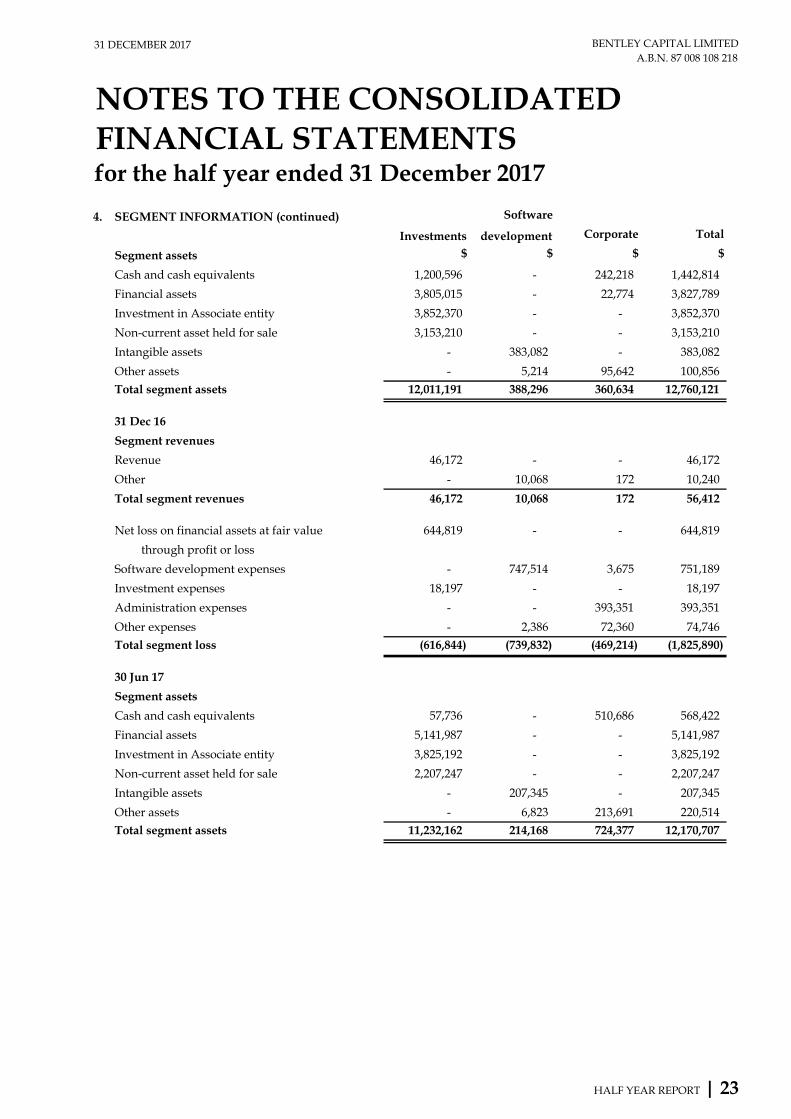
4. SEGMENT INFORMATION (continued) Software
Investments development Corporate Total
Segment assets $ $ $ $
Cash and cash equivalents 1,200,596 - 242,218 1,442,814
Financial assets 3,805,015 - 22,774 3,827,789
Investment in Associate entity 3,852,370 - - 3,852,370
Non-current asset held for sale 3,153,210 - - 3,153,210
Intangible assets - 383,082 - 383,082
Other assets - 5,214 95,642 100,856
Total segment assets 12,011,191 388,296 360,634 12,760,121
31 Dec 16
Segment revenues
Revenue 46,172 - - 46,172
Other - 10,068 172 10,240
Total segment revenues 46,172 10,068 172 56,412
Net loss on financial assets at fair value 644,819 - - 644,819
through profit or loss
Software development expenses - 747,514 3,675 751,189
Investment expenses 18,197 - - 18,197
Administration expenses - - 393,351 393,351
Other expenses - 2,386 72,360 74,746
Total segment loss (616,844) (739,832) (469,214) (1,825,890)
30 Jun 17
Segment assets
Cash and cash equivalents 57,736 - 510,686 568,422
Financial assets 5,141,987 - - 5,141,987
Investment in Associate entity 3,825,192 - - 3,825,192
Non-current asset held for sale 2,207,247 - - 2,207,247
Intangible assets - 207,345 - 207,345
Other assets - 6,823 213,691 220,514
Total segment assets 11,232,162 214,168 724,377 12,170,707
HALF YEAR REPORT | 23

31 DECEMBER 2017 BENTLEY CAPITAL LIMITEDA.B.N. 87 008 108 218
NOTES TO THE CONSOLIDATEDFINANCIAL STATEMENTSfor the half year ended 31 December 2017
5. EARNINGS/(LOSS) PER SHARE 31 Dec 17 31 Dec 16
cents cents
Basic and diluted earnings/(loss) per share 1.17 (1.93)
31 Dec 17 31 Dec 16
$ $
Net profit/(loss) after income tax 893,443 (1,458,016)
Shares Shares
Weighted average number of ordinary shares 76,127,918 75,597,771
6. FINANCIAL ASSETS AT FAIR VALUE THROUGH PROFIT OR LOSS
31 Dec 17 30 Jun 17
$ $
Listed investments at fair value 806,956 1,187,284 Units in unlisted CBG Australian Equities Fund (Wholesale) (CBG Fund) 3,020,833 3,954,703
3,827,789 5,141,987
7. NON-CURRENT ASSET HELD FOR SALE
Cost of investment 2,890,442 2,890,442
Revaluation gain/(loss) 262,767 (683,196)
Investment at fair value 3,153,209 2,207,246
8. FAIR VALUE MEASUREMENT OF FINANCIAL INSTRUMENTS
Fair value hierarchy
(a)
(b)
(c)
31 Dec 17
Level 1 Level 2 Level 3 Total
$ $ $ $
Listed investments at fair value 806,956 - - 806,956
Units in unlisted CBG Fund - 3,020,833 - 3,020,833
Non-current asset held for sale 3,153,209 - - 3,153,209
3,960,165 3,020,833 - 6,980,998
Level 1: quoted prices (unadjusted) in active markets for identical assets or liabilities;
Level 2: inputs other than quoted prices included within Level 1 that are observable for the asset orliability, either directly (as prices) or indirectly (derived from prices); and
The following represents the profit/(loss) and weighted average number of sharesused in the EPS calculations:
Current
Financial assets at fair value through profit or loss:
Level 3: inputs for the asset or liability that are not based on observable market data (unobservableinputs).
The Consolidated Entity has no securities outstanding which have the potential to convert to ordinary shares anddilute the basic earnings/(loss) per share.
The following tables present the Consolidated Entity’s financial assets and liabilities measured and recognised atfair value at 31 December 2017 categorised by the following levels:
HALF YEAR REPORT | 24

31 DECEMBER 2017 BENTLEY CAPITAL LIMITEDA.B.N. 87 008 108 218
NOTES TO THE CONSOLIDATEDFINANCIAL STATEMENTSfor the half year ended 31 December 2017
8. FAIR VALUE MEASUREMENT OF FINANCIAL INSTRUMENTS (continued)
30 Jun 17
Level 1 Level 2 Level 3 Total
$ $ $ $
Listed investments at fair value 1,187,284 - - 1,187,284
Units in unlisted CBG Fund - 3,954,703 - 3,954,703
Non-current asset held for sale 2,207,246 - - 2,207,246
3,394,530 3,954,703 - 7,349,233
There have been no transfers between the levels of the fair value hierarchy during the financial half year.
(a) Valuation techniques
(b) Level 3 fair value measurements
(c) Fair values of other financial instruments 31 Dec 17 30 Jun 17
Financial assets Note $ $
Cash and cash equivalents 1,442,814 568,422
Receivables 68,493 185,984
1,511,307 754,406
Financial liabilities
Payables (108,885) (29,258)
Financial assets at fair value through profit or loss:
If one or more of the significant inputs is not based on observable market data, the instrument is included inLevel 3. Investments in unlisted shares are considered Level 3 investments as their fair value is unable to bederived from market data. The Directors assess the fair value of these investments based on informationobtained from the companies directly.
Unobservable inputs such as earnings growth in respect of unlisted securities are estimated based on marketinformation for similar type of companies. At balance date the investment in unlisted shares has been fullyimpaired.
The fair value of financial instruments that are not traded in an active market is determined using valuationtechniques such as the use of quoted market prices or dealer quotes for similar instruments. These valuationtechniques maximise the use of observable market data where it is available and rely as little as possible onentity specific estimates. If all significant inputs required to fair value an instrument are observable, theinstrument is included in Level 2.
The fair value of the unlisted units in the CBG Fund is determined from unit price information provided bythe investment manager, CBG Asset Management Limited, and as such, this financial instrument is includedin Level 2.
Due to their short-term nature, the carrying amounts of cash, current receivables and current payables isassumed to approximate their fair value.
HALF YEAR REPORT | 25
31 DECEMBER 2017 BENTLEY CAPITAL LIMITEDA.B.N. 87 008 108 218
NOTES TO THE CONSOLIDATEDFINANCIAL STATEMENTSfor the half year ended 31 December 2017
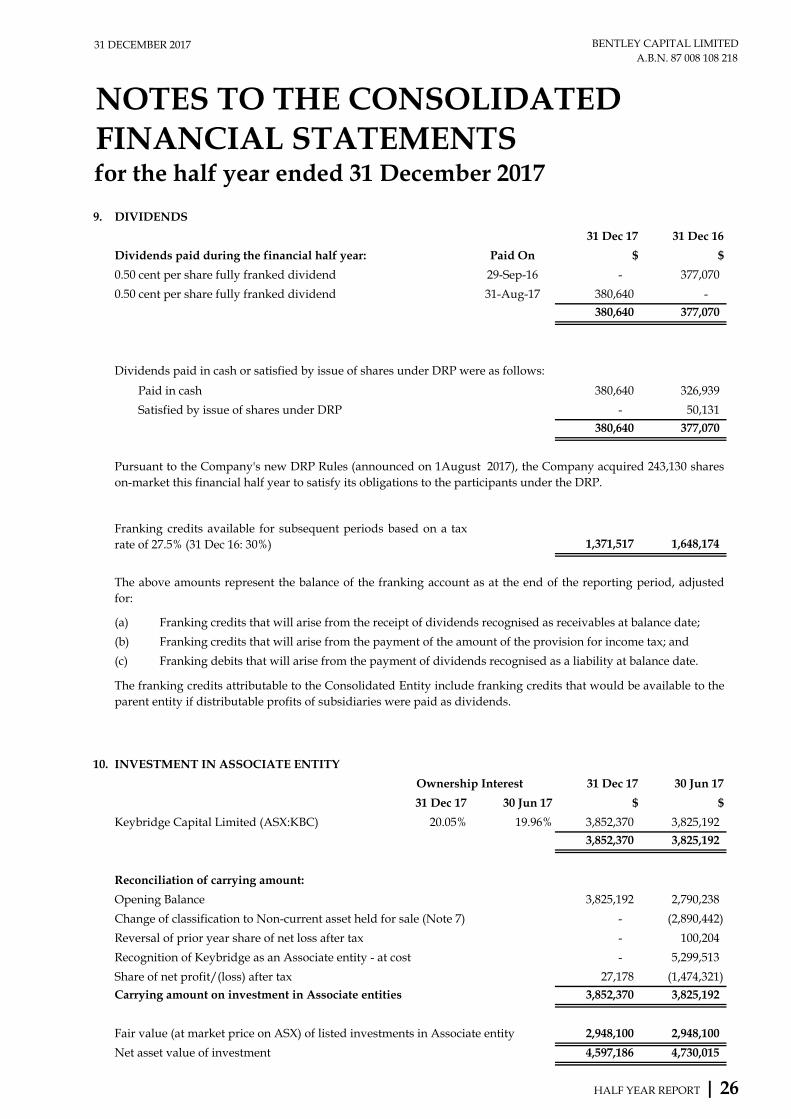
9. DIVIDENDS
31 Dec 17 31 Dec 16
Dividends paid during the financial half year: Paid On $ $
0.50 cent per share fully franked dividend 29-Sep-16 - 377,070
0.50 cent per share fully franked dividend 31-Aug-17 380,640 -
380,640 377,070
Paid in cash 380,640 326,939
Satisfied by issue of shares under DRP - 50,131
380,640 377,070
1,371,517 1,648,174
(a) Franking credits that will arise from the receipt of dividends recognised as receivables at balance date;
(b) Franking credits that will arise from the payment of the amount of the provision for income tax; and
(c) Franking debits that will arise from the payment of dividends recognised as a liability at balance date.
10. INVESTMENT IN ASSOCIATE ENTITY
31 Dec 17 30 Jun 17
31 Dec 17 30 Jun 17 $ $
Keybridge Capital Limited (ASX:KBC) 20.05% 19.96% 3,852,370 3,825,192
3,852,370 3,825,192
Reconciliation of carrying amount:
Opening Balance 3,825,192 2,790,238
Change of classification to Non-current asset held for sale (Note 7) - (2,890,442)
Reversal of prior year share of net loss after tax - 100,204
Recognition of Keybridge as an Associate entity - at cost - 5,299,513
Share of net profit/(loss) after tax 27,178 (1,474,321)
Carrying amount on investment in Associate entities 3,852,370 3,825,192
Fair value (at market price on ASX) of listed investments in Associate entity 2,948,100 2,948,100
Net asset value of investment 4,597,186 4,730,015
The franking credits attributable to the Consolidated Entity include franking credits that would be available to theparent entity if distributable profits of subsidiaries were paid as dividends.
Franking credits available for subsequent periods based on a taxrate of 27.5% (31 Dec 16: 30%)
Pursuant to the Company's new DRP Rules (announced on 1August 2017), the Company acquired 243,130 shareson-market this financial half year to satisfy its obligations to the participants under the DRP.
Ownership Interest
Dividends paid in cash or satisfied by issue of shares under DRP were as follows:
The above amounts represent the balance of the franking account as at the end of the reporting period, adjustedfor:
HALF YEAR REPORT | 26
31 DECEMBER 2017 BENTLEY CAPITAL LIMITEDA.B.N. 87 008 108 218
NOTES TO THE CONSOLIDATEDFINANCIAL STATEMENTSfor the half year ended 31 December 2017
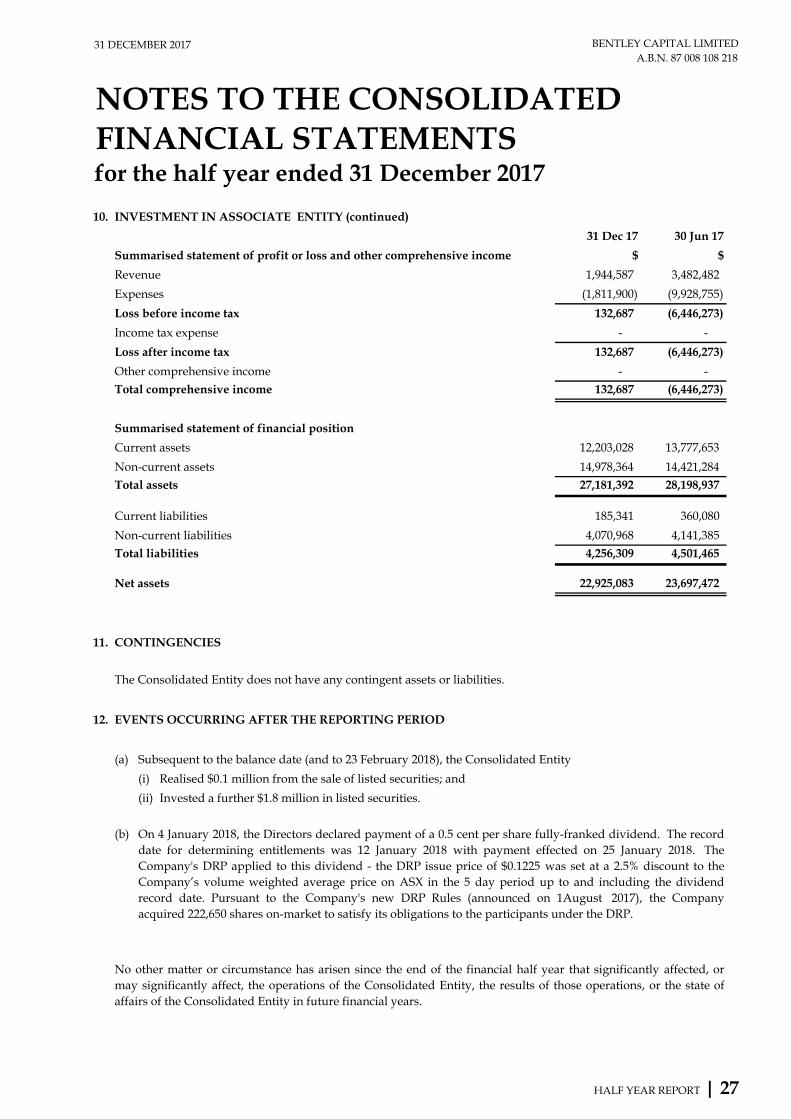
10. INVESTMENT IN ASSOCIATE ENTITY (continued)
31 Dec 17 30 Jun 17
Summarised statement of profit or loss and other comprehensive income $ $
Revenue 1,944,587 3,482,482
Expenses (1,811,900) (9,928,755)
Loss before income tax 132,687 (6,446,273)
Income tax expense - -
Loss after income tax 132,687 (6,446,273)
Other comprehensive income - -
Total comprehensive income 132,687 (6,446,273)
Summarised statement of financial position
Current assets 12,203,028 13,777,653
Non-current assets 14,978,364 14,421,284
Total assets 27,181,392 28,198,937
Current liabilities 185,341 360,080
Non-current liabilities 4,070,968 4,141,385
Total liabilities 4,256,309 4,501,465
Net assets 22,925,083 23,697,472
11. CONTINGENCIES
The Consolidated Entity does not have any contingent assets or liabilities.
12. EVENTS OCCURRING AFTER THE REPORTING PERIOD
(a)
(i)
(ii)
(b) On 4 January 2018, the Directors declared payment of a 0.5 cent per share fully-franked dividend. The recorddate for determining entitlements was 12 January 2018 with payment effected on 25 January 2018. TheCompany's DRP applied to this dividend - the DRP issue price of $0.1225 was set at a 2.5% discount to theCompany’s volume weighted average price on ASX in the 5 day period up to and including the dividendrecord date. Pursuant to the Company's new DRP Rules (announced on 1August 2017), the Companyacquired 222,650 shares on-market to satisfy its obligations to the participants under the DRP.
No other matter or circumstance has arisen since the end of the financial half year that significantly affected, ormay significantly affect, the operations of the Consolidated Entity, the results of those operations, or the state ofaffairs of the Consolidated Entity in future financial years.
Subsequent to the balance date (and to 23 February 2018), the Consolidated Entity
Realised $0.1 million from the sale of listed securities; and
Invested a further $1.8 million in listed securities.
HALF YEAR REPORT | 27
31 DECEMBER 2017 BENTLEY CAPITAL LIMITED A.B.N. 87 008 108 218
DIRECTORS’ DECLARATION
HALF YEAR REPORT | 28
In accordance with a resolution of the Directors of Bentley Capital Limited made pursuant to sub-section 303(5) of the Corporations Act 2001, we state that: In the opinion of the Directors: (1) The financial statements and notes of the Consolidated Entity are in accordance with the Corporations
Act 2001, including:
(a) giving a true and fair view of the Consolidated Entity’s financial position as at 31 December 2017 and of its performance for the half year ended on that date; and
(b) complying with Accounting Standards AASB 134 “Interim Financial Reporting”, Corporations Regulations 2001 and other mandatory professional reporting requirements; and
(2) There are reasonable grounds to believe that the Consolidated Entity will be able to pay its debts as and when they become due and payable.
On behalf of the Board,
Farooq Khan Simon Cato Chairman Non-Executive Director and
Chairman of the Audit Committee 28 February 2018

31 DECEMBER 2017 BENTLEY CAPITAL LIMITED A.B.N. 87 008 108 218
SECURITIES INFORMATION as at 31 December 2017
HALF YEAR REPORT | 30
DISTRIBUTION OF LISTED ORDINARY SHARES
Spread of Holdings Number of Holders Number of Shares % of Total Issued Capital 1 - 1,000 241 119,445 0.157 %
1,001 - 5,000 590 1,811,050 2.379 %
5,001 - 10,000 337 2,452,068 3.221 %
10,001 - 100,000 475 13,161,317 17.288 %
100,001 - and over 81 58,584,038 76.955 %
TOTAL 1,724 76,127,918 100 % UNMARKETABLE PARCELS
Spread of Holdings Number of Holders Number of Shares % of Total Issued Capital
1 - 3,703 725 1,441,205 1.893 %
3,704 - over 999 74,686,713 98.107 %
TOTAL 1,724 76,127,918 100 % An unmarketable parcel is considered, for the purposes of the above table, to be a shareholding of 3,703 shares or less, being a value of $500 or less in total, based upon the Company’s last sale price on ASX as at 31 December 2017 of $0.11 per share.
SUBSTANTIAL SHAREHOLDERS
Substantial Shareholders Registered Shareholder
Total Number of Shares Held
% Voting Power
Queste Communications Ltd (ASX:QUE)
QUE 1,300,000 28.66%(1) OEQ 20,513,783
Mr Azhar Chaudhri, Renmuir Holdings Limited and Chi Tung Investments Ltd
QUE 1,300,000 28.66%(2) OEQ 20,513,783
Orion Equities Limited (ASX:OEQ) OEQ 20,513,783 26.95%(0)
Farooq Khan Farooq Khan 11,717,586 15.39%(3)
Charles W Rockefeller Pty Ltd Charles W Rockefeller Pty Ltd 4,042,232 5.31%(4) Notes: (1) Based on the substantial shareholding notice filed by QUE dated 7 June 2016 (updated to reflect current percentage voting power)
(2) Based on the substantial shareholding notice filed by Azhar Chaudhri dated 2 May 2012 (updated to reflect current registered shareholdings and percentage voting power)
(3) Based on the initial substantial shareholding notice filed by Farooq Khan dated 22 March 2017 (updated to reflect current percentage voting power)
(4) Based on the initial substantial shareholding notice filed by Charles W Rockefeller Pty Ltd dated 4 October 2016 (updated to reflect current registered shareholdings and percentage voting power).
31 DECEMBER 2017 BENTLEY CAPITAL LIMITED A.B.N. 87 008 108 218
SECURITIES INFORMATION as at 31 December 2017
HALF YEAR REPORT | 31
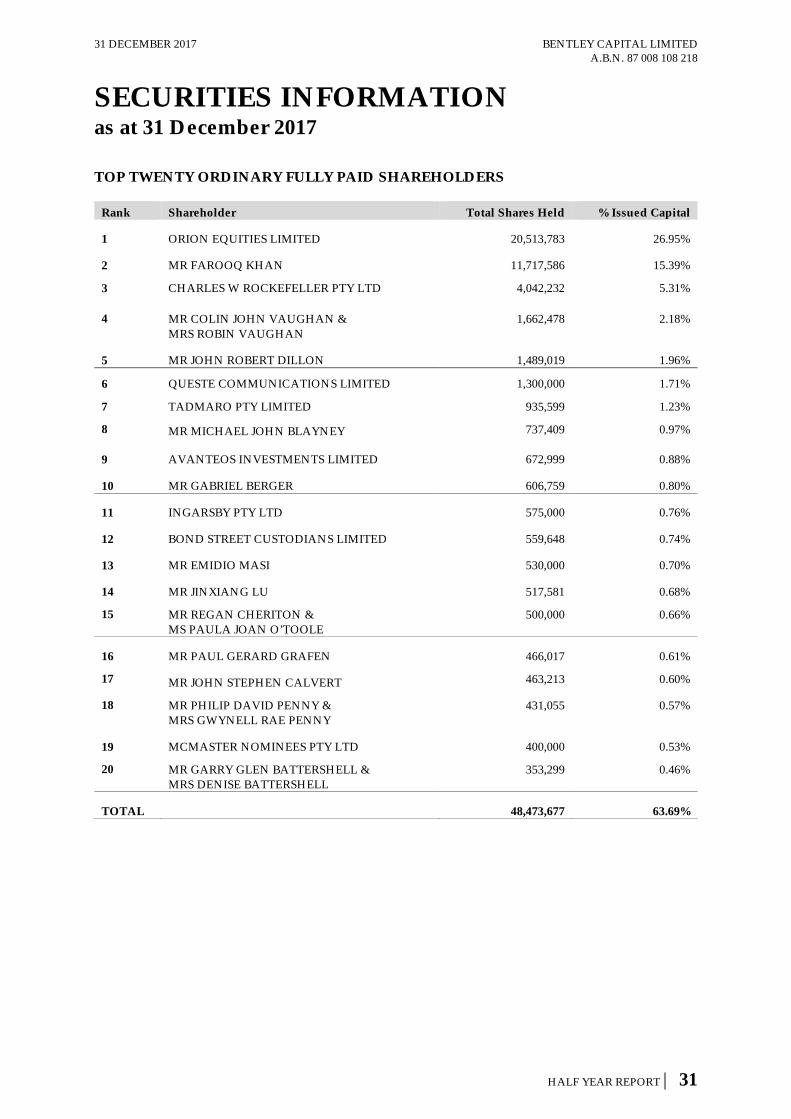
TOP TWENTY ORDINARY FULLY PAID SHAREHOLDERS
Rank Shareholder Total Shares Held % Issued Capital
1 ORION EQUITIES LIMITED 20,513,783 26.95%
2 MR FAROOQ KHAN 11,717,586 15.39%
3 CHARLES W ROCKEFELLER PTY LTD 4,042,232 5.31%
4 MR COLIN JOHN VAUGHAN & MRS ROBIN VAUGHAN
1,662,478 2.18%
5 MR JOHN ROBERT DILLON 1,489,019 1.96%
6 QUESTE COMMUNICATIONS LIMITED 1,300,000 1.71%
7 TADMARO PTY LIMITED 935,599 1.23%
8 MR MICHAEL JOHN BLAYNEY 737,409 0.97%
9 AVANTEOS INVESTMENTS LIMITED 672,999 0.88%
10 MR GABRIEL BERGER 606,759 0.80%
11 INGARSBY PTY LTD 575,000 0.76%
12 BOND STREET CUSTODIANS LIMITED 559,648 0.74%
13 MR EMIDIO MASI 530,000 0.70%
14 MR JINXIANG LU 517,581 0.68%
15 MR REGAN CHERITON & MS PAULA JOAN O’TOOLE
500,000 0.66%
16 MR PAUL GERARD GRAFEN 466,017 0.61%
17 MR JOHN STEPHEN CALVERT 463,213 0.60%
18 MR PHILIP DAVID PENNY & MRS GWYNELL RAE PENNY
431,055 0.57%
19 MCMASTER NOMINEES PTY LTD 400,000 0.53%
20 MR GARRY GLEN BATTERSHELL & MRS DENISE BATTERSHELL
353,299 0.46%
TOTAL 48,473,677 63.69%