Embed Size (px)
Citation preview

Half year financial report
Six-month period ended June 30, 2017
Condensed Consolidated Financial Statements Management Report CEO Attestation Statutory Auditors’ Review Report

Schneider Electric – Half year financial report as at June 30, 2017 2
Table of contents Condensed consolidated financial statements ......................................................................................... 3
Consolidated statement of income............................................................................................................................3
Consolidated statement of other comprehensive income .........................................................................................4
Consolidated statement of cash-flows ......................................................................................................................5
Consolidated balance sheet .....................................................................................................................................6
Consolidated statement of changes in equity ...........................................................................................................8
Notes to the consolidated financial statements .........................................................................................................9
Management report for the period ended June 30, 2017 ................................................................... 21
Review of the consolidated financial statements .................................................................................................... 21
Comments to the consolidated Cash-Flow ............................................................................................................. 27
Significant events of the period ............................................................................................................................... 29
Main risks and areas of uncertainty ........................................................................................................................ 29
Claims, litigations and other risks ........................................................................................................................... 29
Transactions with related parties ............................................................................................................................ 29
CEO attestation ................................................................................................................................................ 30
Statutory Auditors’ review report on the six-month period financial information .......................... 31

Schneider Electric – Half year financial report as at June 30, 2017 3
1. Consolidated statement of income (in millions of euros except for earnings per share) Note First half
2017 First half
2016*
Revenue 3 12,173 11,742
Cost of sales (7,458) (7,225)
Gross profit 4,715 4,517
Research and development 4 (263) (257)
Selling, general and administrative expenses (2,734) (2,673)
EBITA adjusted** 1,718 1,587
Other operating income and expenses 5 71 (8)
Restructuring costs 6 (156) (131)
EBITA*** 1,633 1,448
Amortization and impairment of purchase accounting intangibles 7 (61) (82)
Operating income 1,572 1,366
Interest income 31 30
Interest expense (145) (165)
Finance costs, net (114) (135)
Other financial income and expense 8 (70) (112)
Net financial income/(loss) (184) (247)
Profit from continuing operations before income tax 1,388 1,119
Income tax expense 9 (361) (279)
Income of discontinued operations, net of income tax (76) (14)
Share of profit/(loss) of associates 34 13
PROFIT FOR THE PERIOD 985 839
• attributable to owners of the parent 958 809
• attributable to non-controlling interests 27 30
Basic earnings (attributable to owners of the parent) per share
(in euros per share)
1.72 1.44
Diluted earnings (attributable to owners of the parent) per share
(in euros per share)
1.71 1.42
* 2016 figures were restated for discontinued operations disclosed in note 1. ** Adjusted EBITA Earnings Before Interests, Taxes, Amortization of Purchase Accounting Intangibles). Adjusted EBITA corresponds to operating profit before amortization and impairments of purchase accounting intangible assets before goodwill impairment; other operating income and expenses and restructuring costs. *** EBITA (earnings Before Interest, Taxes and Amortization of Purchase Accounting Intangibles). EBITA corresponds to operating profit before amortization and impairment of purchase accounting intangible assets and before goodwill impairment. The accompanying notes are an integral part of the consolidated financial statements.

Schneider Electric – Half year financial report as at June 30, 2017 4
Other comprehensive income
(in millions of euros) Note First half 2017
First half 2016
Profit for the year 985 839
Other comprehensive income:
Translation adjustment (907) (429)
Cash-flow hedges (69) 16
Income tax effect of Cash-flow hedges 22 9
Net gains (losses) on available-for-sale financial assets (4) (2)
Income tax effect of Net gains (losses) on available-for-sale
financial assets
- 1
Actuarial gains (losses) on defined benefits plans (1) (231)
Income tax effect of Actuarial gains (losses) on defined benefits
plans
(11) 32
Other comprehensive income for the year, net of tax (970) (604)
• out of which to be recycled in income statement ultimately (958) 24
• out of which not to be recycled in income statement
ultimately
(12) (628)
TOTAL COMPREHENSIVE INCOME FOR THE YEAR 15 235
Attributable:
• to owners of the parent (8) 209
• to non-controlling interests 23 25 The accompanying notes are an integral part of the consolidated financial statements.

Schneider Electric – Half year financial report as at June 30, 2017 5
2. Consolidated statement of cash flows
(in millions of euros) Note First half 2017
First half 2016*
Profit for the year 985 839
Loss/(gain) from discontinued operations 76 14
Share of (profit)/losses of associates, net of dividends received (34) (13)
Adjustments with no impact on cash-flow :
Depreciation of property, plant and equipment 199 203
Amortization of intangible assets other than goodwill 209 225
Impairment losses on non-current assets 3 72
Increase/(decrease) in provisions - (135)
Losses/(gains) on disposals of fixed assets (114) 41
Difference between tax paid and tax expense (11) 16
Other non-cash adjustments 54 58
Net cash provided by operating activities before changes
in operating assets and liabilities
1,367 1,320
Decrease/(increase) in accounts receivable 63 107
Decrease/(increase) in inventories and work in process (343) (211)
(Decrease)/increase in accounts payable 42 (172)
Change in other current assets and liabilities (277) (208)
Change in working capital requirement (515) (484)
Total I - Cash flows from operating activities 852 836
Purchases of property, plant and equipment (204) (218)
Proceeds from disposals of property, plant and equipment 21 16
Purchases of intangible assets (171) (198)
Proceeds from disposals of intangible assets 3 -
Net cash used by investment in operating assets (351) (400)
Net financial investments 2 (189) (18)
Proceeds from sale of financial assets 2 747 7
Purchases of other long-term investments (19) (33)
Increase in long-term pension assets (135) (82)
Sub-total 404 (126)
Total II - Cash flows from/(used in) investing activities 53 (526)
Issuance of bonds 17 - -
Repayment of bonds 17 (97) -
Increase/(reduction) in other financial debt 537 282
Proceeds from issuance of shares 10 5
Sale/(purchase) of own shares - (278)
Dividends paid by Schneider Electric SE (1,133) (1,127)
Dividends paid to non-controlling interests (24) (21)
Total III - Cash flows from/(used in) financing activities (707) (1,139)
IV - Net foreign exchange difference: (31) (105)
V - Effect of discontinued operations 78 10
Increase/(decrease) in cash and cash equivalents: I + II
+ III + IV + V
245 (924)
Cash and cash equivalents at January 1st 2,530 2,849
Increase/(decrease) in cash and cash equivalents 245 (924)
CASH AND CASH EQUIVALENTS AT JUNE 30 17 2,775 1,925 * 2016 figures were restated for discontinued operations disclosed in note 1.
The accompanying notes are an integral part of the consolidated financial statements.

Schneider Electric – Half year financial report as at June 30, 2017 6
3. Consolidated balance sheet
Assets (in millions of euros) Note June 30,
2017 Dec.31, 2016
NON-CURRENT ASSETS
Goodwill, net 10 16,337 17,785
Intangible assets, net 4,094 4,574
Property, plant and equipment, net 2,510 2,642
Total tangible and intangible assets 11 6,604 7,216
Investments in associates 12 568 601
Available-for-sale financial assets 13 145 161
Other non-current financial assets 13 292 378
Non-current financial assets 437 539
Deferred tax assets 2,556 2,573
Total non-current assets 26,502 28,714
CURRENT ASSETS
Inventories and work in progress 3,043 2,876
Trade and other operating receivables 5,572 5,929
Other receivables and prepaid expenses 1,681 1,507
Current financial assets 13 30 30
Cash and cash equivalents 17 3,057 2,795
Total current assets 13,383 13,137
Discontinued operations 157 -
TOTAL ASSETS 40,042 41,851
The accompanying notes are an integral part of the consolidated financial statements.

Schneider Electric – Half year financial report as at June 30, 2017 7
Liabilities (in millions of euros) Note June 30,
2017 Dec.31, 2016
Equity 14
Share capital 2,377 2,370
Additional paid-in capital 5,007 6,232
Retained earnings 11,939 10,895
Translation reserve 94 997
Equity attributable to owners of the parent 19,417 20,494
Non-controlling interests 150 159
Total equity 19,567 20,653
Non-current provisions
Pensions and other post-employment benefit obligations 15 1,975 2,229
Other non-current provisions 16 1,478 1,650
Total non-current provisions 3,453 3,879
Non-current financial liabilities
Bonds 17 5,666 5,721
Other non-current debt 17 25 45
Non-current financial liabilities 5,691 5,766
Deferred tax liabilities 1,335 1,367
Other non-current liabilities 10 142
Total non-current liabilities 10,489 11,154
Current liabilities
Trade and other operating payables 3,928 4,146
Accrued taxes and payroll costs 1,740 2,006
Current provisions 16 822 857
Other current liabilities 1,111 1,182
Current debt 17 2,314 1,853
Total current liabilities 9,915 10,044
Discontinued operations 71 -
TOTAL EQUITY AND LIABILITIES 40,042 41,851
The accompanying notes are an integral part of the consolidation financial
statements.

Schneider Electric – Half year financial report as at June 30, 2017 8
4. Consolidated statement of changes in equity
(in millions of
euros except for
number of
shares)
Number of
shares
(thousands)
Capital Additional
paid-in
capital
Treasury
shares
Retained
earnings
Translation
reserve
Equity
attributable
to owners
of the
parent
Non-
controlling
interests
TOTAL
Dec.31, 2015 588,734 2,355 7,267 (1,027) 11,214 1,039 20,848 441 21,289
Profit for the
year 1,750 1,750 61 1,811
Other
comprehensive
income
(345) (42) (387) (1) (388)
Comprehensive
income for the
year
1,405 (42) 1,363 60 1,423
Capital increase 2,843 11 119 130 130
Exercise of
stock options 922 4 30 34 34
Dividends (1,127) (1,127) (100) (1,227)
Change in
treasury shares (853) (853) (853)
Share-based
compensation
expense
118 118 118
Other (57) 38 (19) (242) (261)
Dec.31, 2016 592,499 2,370 6,232 (1,880) 12,775 997 20,494 159 20,653
Profit for the
year 958 958 27 985
Other
comprehensive
income
(63) (903) (966) (4) (970)
Comprehensive
income for the
year
895 (903) (8) 23 15
Capital increase 1,486 6 - 6 6
Exercise of
stock options 257 1 8 (6) 3 3
Dividends (1,133) - (1,133) (32) (1,165)
Change in
treasury shares 17 (17) - -
Share-based
compensation
expense
55 55 55
Other (100) (119) 219 - -
June 30, 2017 594,242 2,377 5,007 (1,982) 13,921 94 19,417 150 19,567
The accompanying notes are an integral part of the consolidated financial statements.

Schneider Electric – Half year financial report as at June 30, 2017 9
5. Notes to the Consolidated Financial Statements
All amounts in millions of Euros unless otherwise indicated. The accompanying notes are an integral part of the consolidated financial statements. The Schneider Electric Group’s consolidated financial statements for the financial half year ended June 30, 2017 were drawn up by the board of directors on July 26, 2017.
Note 1 - Summary of significant accounting policies
Accounting standards and basis of preparation
The consolidated financial statements for the six months ended June 30, 2017 have been prepared in accordance with IAS 34 - Interim Financial Reporting. As condensed financial statements, they do not include all the disclosures required by International Financial Reporting Standards (IFRS) and should be read in conjunction with the December 31, 2016 annual consolidated financial statements included in the Annual Report filed with the French securities regulator (AMF) under no. D.17-0177, except for the differences in accounting treatment between the annual and interim financial statements described below. The interim consolidated financial statements have been prepared in compliance with the international accounting standards adopted by the European Union as of June 30, 2017. The same accounting methods were used as for the consolidated financial statements for the year ended December 31, 2016. The Group did not apply the following standards and interpretations that have not yet been adopted by the European Union as of June 30, 2017 or that were not mandatory for January 1, 2017:
Standards adopted by the European Union:
- IFRS 15 - Revenue from Contracts with Customers
- IFRS 9 - Financial Instruments
Standards not adopted by the European Union:
- IFRS 16 - Leases
- IFRS 15 - Clarifications
- IFRS 17- Insurance Contracts
- Amendments to IAS 7: Statement of Cash Flows - Disclosure Initiative
- Annual improvements to IFRSs 2014-2016 Cycle (December 2016)
- Amendments to IAS 40: Transfers of Investment Property
- IFRIC 23 - Uncertainty over Income Tax Treatments
- IFRIC 22 - Foreign Currency Transactions and Advance Consideration
- Amendments to IFRS 2: Share-based payments, Classification and Measurement
- Amendments to IAS 12: Recognition of Deferred Tax Assets for Unrealized Losses
- Amendments to IFRS 4: Apply IFRS 9 Financial instruments with IFRS 4 Insurance contracts
- Amendments to IFRS 10 and IA 28: Sales or Contributions of Assets between an Investor and its
Associate or Joint Venture
Finally, the standards applied by Schneider Electric as of June 30, 2017 are consistent with the IFRS standards issued by the International Accounting Standards board (IASB). Schneider Electric is currently assessing the potential effect on the Group’s consolidated financial statements of the standards not yet applicable. At this stage of the analysis, the Group does not expect the impact on its consolidated statements to be material, except for IFRS 9 and IFRS 16, for which main effect would be, in 2019, the inclusion of lease commitments for operating leases into financial debt. Regarding IFRS 15, no significant impact is expected with regards to current practice, for transactional and services revenue. Regarding long-term contracts, analyses are currently being performed to assess the potential accounting impacts. At this stage of the analysis, the Group does not expect any significant impacts.
Discontinued operations
On April 20, 2017, the Group announced the disposal of its Solar activity (“Solar”). At the end of this ongoing process, the Group will have a minority representation on Solar’s board. This activity used to be reported within the Building business segment of Schneider Electric. Solar activity net income and the estimated loss incurred from

Schneider Electric – Half year financial report as at June 30, 2017 10
the disposal of the business have been reclassified to discontinued operations in the Group consolidated financial statements. The comparative information has been restated.
Impairment of assets No impairment at June 30, 2017 was identified, thus no impairment tests were implemented to date.
Seasonal variations The Group faces seasonal variations on its activities that may impact the level of revenue from one quarter to another. Therefore, the half-year results are not necessarily as significant as the full year figures.
Income tax expense Current and deferred taxes for interim periods are calculated by applying the estimated average effective tax rate for the current year to pre-tax profit for the period.
Note 2 - Changes in the scope of consolidation
2.1 Additions and removals
Acquisitions of the period No material acquisition occurred during the first half-year 2017. Besides, the Group also acquired the minority interest of Luminous.
Disposals of the period On April 3rd, 2017 – the Group announced that it has signed an agreement to sell its Telvent DTN business, to TBG AG. On May 31st, 2017, the transaction was finalized with a final base sale price established at USD 900 million.
2.2 Impact of changes in the scope of consolidation on the Group cash flow
Changes in the scope of consolidation at June 30, 2017, described in note 2.1, increased the Group’s cash position by a net EUR 558 million inflow, as described below:
First Half 2017
First Half 2016
Acquisitions (189) (18)
Cash and cash equivalents paid (189) (18)
Cash and cash equivalents acquired - -
Disposals 747 7
FINANCIAL INVESTMENTS NET OF DISPOSALS 558 (11)
Note 3 - Segment information
The Group is organized into 4 businesses: Building, Infrastructure, Industry and IT: • Building provides low voltage power and building automation products and solutions that address the needs
of all end markets from buildings to industries and infrastructure to data centers to help customers improve the energy efficiency of the buildings;
• Infrastructure combines all Medium Voltage activities; the business is in charge of the end-customer segments Electric Utilities, and Transportation when it relates to integrated solutions;
• Industry, which includes Automation & Control and four end-customer segments: OEMs, Water, Mining Minerals & Metals, Oil & Gas, and Food & Beverages when it relates to solutions integrating the offers of several activities from the Group;
• IT, which covers Critical Power & Cooling Services and three end-customer segments (Data centers, Finance, Cloud computing and Telecom).

Schneider Electric – Half year financial report as at June 30, 2017 11
Expenses concerning General Management that cannot be allocated to a particular segment are presented under “Corporate costs”. Operating segment data is identical to that presented to the board of directors, which has been identified as the main decision-making body for allocating resources and evaluating segment performance. Performance assessments used by the board of directors are notably based on Adjusted EBITA. Share-based payment is presented under “Corporate costs”. The board of directors does not review assets and liabilities by Business. The same accounting principles governing the consolidated financial statements apply to segment data. Details are provided in the Management Report.
3.1 Information by operating segment
First Half 2017
Building Infrastructure Industry IT Corporate costs
Total
Revenue 5,341 2,156 2,907 1,769 - 12,173
Adjusted EBITA** 1 ,111 180 487 256 (316) 1,718
Adjusted EBITA (%)
20.8% 8.4% 16.7% 14.5% 14.1%
* Adjusted EBITA: EBITA before restructuring costs and other operating income and expense. First Half 2016
Building Infrastructure Industry IT Corporate costs
Total
Revenue* 5,082 2,300 2,667 1,693 - 11,742
Adjusted EBITA** 1,042 158 424 266 (303) 1,587
Adjusted EBITA (%) 20.5% 6.9% 15.9% 15.7% - 13.5% * 2016 figures were restated for discontinued operations disclosed in note 1.
** Adjusted EBITA: EBITA before restructuring costs and other operating income and expense.
3.2 Information by region
The geographic regions covered by the Group are: - Western Europe, - North America (including Mexico), - Asia-Pacific, - and Rest of the World (Eastern Europe, Middle East, Africa, South America). Non-current assets include net goodwill, net intangible assets and net property, plant and equipment. First Half 2017
Western Europe
Asia-Pacific
North America
Rest of the world
Total
Sales by country market 3,322 3,334 3,433 2,084 12,173
Non-current assets 8,899 4,033 8,700 1,309 22,941

Schneider Electric – Half year financial report as at June 30, 2017 12
First Half 2016
Western Europe
Asia-Pacific
North America
Rest of the world
Total
Sales by country market* 3,337 3,112 3,295 1,998 11,742
Non-current assets 8,729 4,163 10,093 1,322 24,307
*2016 figures were restated for discontinued operations disclosed in note 1. Moreover, the Group follows the share of new economies in revenue:
First half 2017 First half 2016*
Revenue - Mature countries 7,148 7,034
Revenue - New economies 5,025 4,708
TOTAL 12,173 11,742 * 2016 figures were restated for discontinued operations disclosed in note 1.
Note 4 - Research and development
Research and development costs are as follows:
First half
2017
First half
2016*
Research and development costs in costs of sales (183) (169)
Research and development costs in commercial expenses (1) (263) (257)
Capitalized development costs (164) (183)
TOTAL RESEARCH AND DEVELOPMENT COSTS FOR THE PERIOD (610) (609)
* 2016 figures were restated for discontinued operations disclosed in note 1. (1) of which EUR 24 million of research and development tax credit in first half 2017 and EUR 16 million in first half 2016.
Amortization of capitalized development costs came to EUR 126 million in the first half of 2017 and EUR 113 million in the first half of 2016.
Note 5 - Other operating income and expense
Other operating income and expenses are as follows:
First half
2017
First half
2016*
Impairment losses and reversals on assets 11 (63)
Gains on asset disposals 3 2
Losses on asset disposals (6) (8)
Costs of acquisition and disposals (18) (14)
Gains/Losses on business disposals 117 1
Others (36) 74
OTHER OPERATING INCOME AND EXPENSES 71 (8)
*2016 figures were restated for discontinued operations disclosed in note 1. In 2017, gains on business disposals mostly include the impact of the disposal of Telvent DTN business. Others in 2016 includes mainly the release of a provision against a legal claim which was settled in the first half of 2016.
Note 6 - Restructuring costs
Restructuring costs in six-month period ended June 30, 2017 totaled EUR 156 million and primarily stemmed from
the reorganization of manufacturing operations and support functions.

Schneider Electric – Half year financial report as at June 30, 2017 13
Note 7 - Amortization and impairment of purchase accounting intangibles
First half 2017
First half 2016*
Amortization of purchase accounting intangibles (61) (82)
AMORTIZATION AND IMPAIRMENT OF PURCHASE ACCOUNTING INTANGIBLES
(61) (82)
*2016 figures were restated for discontinued operations disclosed in note 1.
Note 8 - Other financial income and expenses
First half 2017
First half 2016
Exchange gains and losses, net (3) (40)
Financial component of defined benefit plan cost (39) (37)
Dividend income - 3
Net gains/(losses) on disposal of assets available for sale (2) (5)
Other financial expenses, net (26) (33)
OTHER FINANCIAL INCOME AND EXPENSES (70) (112)
Note 9 - Income tax
Wherever the regulatory environment allows it, Group entities file consolidated tax returns. Schneider Electric SE files a consolidated tax return with its French subsidiaries held directly or indirectly through Schneider Electric Industries SAS.
9.1 Analysis of income tax expense for the year
First half 2017
First half 2016*
Current taxes (303) (233)
Deferred taxes (58) (46)
INCOME TAX (EXPENSE) / BENEFIT (361) (279)
*2016 figures were restated for discontinued operations disclosed in note 1.
9.2 Tax proof
First half 2017
First half 2016*
Profit attributable to owners of the parent 958 809
Income tax (expense)/benefit (361) (279)
Non-controlling interests (27) (30)
Share of profit of associates 34 13
Discontinued Operations (76) (14)
Profit before tax 1,388 1,119
Statutory tax rate 34.43% 34.43%
Income tax expense calculated at the statutory rate (478) (385)
Reconciling items:
Difference between French and foreign tax rates 126 81
Tax credits and other tax reductions 117 89
Impact of tax losses (22) (26)
Other permanent differences (104) (38)
Income tax (expense)/benefit (361) (279)
EFFECTIVE TAX RATE 26% 25%
* 2016 figures were restated for discontinued operations disclosed in note 1.

Schneider Electric – Half year financial report as at June 30, 2017 14
Note 10 - Goodwill
The main changes during the period are summarized in the following table:
June 30, 2017 Dec.31, 2016
Net goodwill at opening 17,785 17,781
Acquisitions 30 9
Disposals (536) (384)
Impairment - -
Reclassifications (53) -
Translation adjustment (889) 379
Net goodwill at year end 16,337 17,785
Included cumulative impairment (368) (392)
The main variations are linked to the variations mentioned in the note 2.1 Additions and removals.
Translation adjustment
Currency translation adjustments concern principally goodwill in U.S. dollars.
Note 11 - Intangible assets and property, plant and equipment
Changes in intangible assets and property, plant and equipment over the six-month period from January 1, 2017 are mainly related to the variations mentioned in the note 2.1 Additions and removals.
Note 12 - Investments in associates
The variations of the period correspond mainly to the share of profit and loss of investment in associates.
Note 13 - Financial assets
13.1 Available-for-sale financial assets
Available-for-sale financial assets amount to EUR 145 million as of June 30, 2017.
13.2 Other non-current financial assets
The other non-current financial assets amount to EUR 292 million as of June 30, 2017.
13.3 Current financial assets
Current financial assets amount EUR 30 million as of June 30, 2017 and mainly comprise non-monetary short-term investments.
Note 14 - Shareholder’s equity
14.1 Share-based payments
A total of 256,676 Schneider Electric SE shares were issued during six-month period ended June 30, 2017 upon exercise of stock options, in an amount of EUR 9.4 million. Based upon the assumptions described in the notes to the 2016 consolidated financial statements, the expense recorded under "Selling, general and administrative expenses" for stock option or stock grant plans totaled EUR 55 million in six-month period ended June 30, 2017 (EUR 54 million for the six-month period ended June 30, 2016). This expense was booked as an adjustment to “Retained earnings” in Shareholders’ Equity.

Schneider Electric – Half year financial report as at June 30, 2017 15
14.2 Worldwide Employee Stock Purchase Plan
Schneider Electric gives its employees the opportunity to become group shareholders thanks to employee share issues. Employees in countries that meet legal and fiscal requirements have been proposed the classic plan.
Under the classic plan, employees may purchase Schneider Electric shares at a 15% discount to the price quoted for the shares on the stock market. Employees must then hold their shares for five years, except in certain cases provided for by law. The share-based payment expense recorded in accordance with IFRS 2 is measured by reference to the fair value of the discount on the locked-up shares. The lock-up cost is determined on the basis of a two-step strategy that involves first selling the locked-up shares on the forward market and then purchasing the same number of shares on the spot market (i.e., shares that may be sold at any time) using a bullet loan.
This strategy is designed to reflect the cost the employee would incur during the lock-up period to avoid the risk of carrying the shares subscribed under the classic plan. The borrowing cost corresponds to the cost of borrowing for the employees concerned, as they are the sole potential buyers in this market. It is based on the average interest rate charged by banks for an ordinary, non-revolving personal loan with a maximum maturity of five years granted to an individual with an average credit rating.
As regards the first semester 2017, Schneider Electric gave its employees the opportunity to purchase shares at a price of EUR 59.11 per share, depending on the country, as part of its commitment to employee share ownership, on April 3rd, 2017. This represented a 15% discount to the reference price of EUR 69.23 calculated as the average opening price quoted for the share during the 20 days preceding the Management Board’s decision to launch the employee share issue.
Altogether, 2.4 million shares were subscribed, increasing the Company’s capital by EUR 143 million as of July 11, 2017. Due to significant changes in valuation assumptions, specifically the interest rate available to market participant, the value of the lock-up period is higher than the discount cost since 2012. Therefore, the Group did not recognize any cost related to the transaction.
The tables below summarize the main characteristics of the plans, the amounts subscribed, the valuation assumptions and the plans’ cost for 2017 and 2016.

Schneider Electric – Half year financial report as at June 30, 2017 16
Non-leveraged plans 2017 2016
% Value % Value
Plan characteristics
Maturity (years) 5 5
Reference price (euros) 69.23 56.31
Subscription price (euros):
Between 59.11 47.86
And 59.11 45.04
Discount:
Between 15% 15%
And 15% 20%
Amount subscribed by employees 142.7 130.0
Total amount subscribed 142.7 130.0
Total number of shares subscribed (millions of
shares)
2.4 2.8
Valuation assumptions
Interest rate available to market participant
(bullet loan) (1)
3.8%
3.5%
Five-year risk-free interest rate (euro zone) 0.3%
0.0%
Annual interest rate (repo) 1.0%
1.0%
(a) Value of discount:
Between 15% 9.0 15% 8.7
And 15% 15.4 20% 20.4
(b) Value of the lock-up period for market
participant
23.8%
39.8
23.9% 38.3
Total expense for the Group (a-b) - -
Sensitivity
• decrease in interest rate for market
participant (2)
(0.5%)
4.7
(0.5%) 4.5
Amounts in millions of euros, unless otherwise stated.
(1) Average interest rate charged on an ordinary, non-revolving personal loan, with a five-year maturity to an individual with an average credit rating.
(2) A decline in the interest rate for market participants reduces the lock-up cost and increases the expense booked by the issuer.

Schneider Electric – Half year financial report as at June 30, 2017 17
Note 15 - Pensions and other post-employment benefit obligations
Changes in provisions for pensions and other post-employment benefit obligations were as follows:
Pensions and termination
benefits
Other Post-employment
and long-term benefits
Provisions for pensions and
other post-employment
benefits
Dec. 31, 2016 1,530 452 1,982
Net cost recognized in the statement of income 56 11 67
Service cost 24 4 28
Curtailments and settlements - - -
Interest cost 145 7 152
Interest income (113) - (113)
Benefits paid (13) (20) (33)
Plan participants’ contributions (136) - (136)
Actuarial gains and losses recognized in equity 1 - 1
Translation adjustment (49) (26) (75)
Change in the scope of consolidation (9) 6 (3)
Other changes - - -
June 30, 2017 1,380 423 1,803
Surplus of plans recognized as assets (172) - (172)
Provisions recognized as liabilities 1,552 423 1,975
Following the agreement reached with the Trustee of the Invensys Pension Scheme in the UK on February 7, 2014, Schneider Electric SE guaranteed all obligations of the Invensys subsidiaries which participate in the Scheme, up to a maximum amount of GBP 1.75 billion. At June 30, 2017, plan assets exceed the value of obligations subject to this guarantee and thus this guarantee cannot be called. The pension net assets are included in other non-current financial assets.
Note 16 - Provisions
Economic
risks
Customer
risks
Products
risks
Environmental
risks
Restructuring Other
risks
Provisions
Dec. 31,
2016 907 103 452 340 164 541 2,507
Of which
long-term
portion
710 87 164 330 18 341 1,650
Additions 23 9 68 2 89 102 293
Utilizations (60) (9) (51) (9) (64) (135) (328)
Reversals of
surplus
provisions
(12) (4) (2) (1) (1) (8) (28)
Translation
adjustments
(39) (7) (18) (21) (5) (33) (123)
Changes in
the scope of
consolidation
and other
(5) 3 (18) - (1) - (21)
June 30,
2017
814 95 431 311 182 467 2,300
Of which
long-term
portion
617 74 160 303 11 313 1,478

Schneider Electric – Half year financial report as at June 30, 2017 18
Schneider Electric – Half year financial report as at June 30, 2017 19
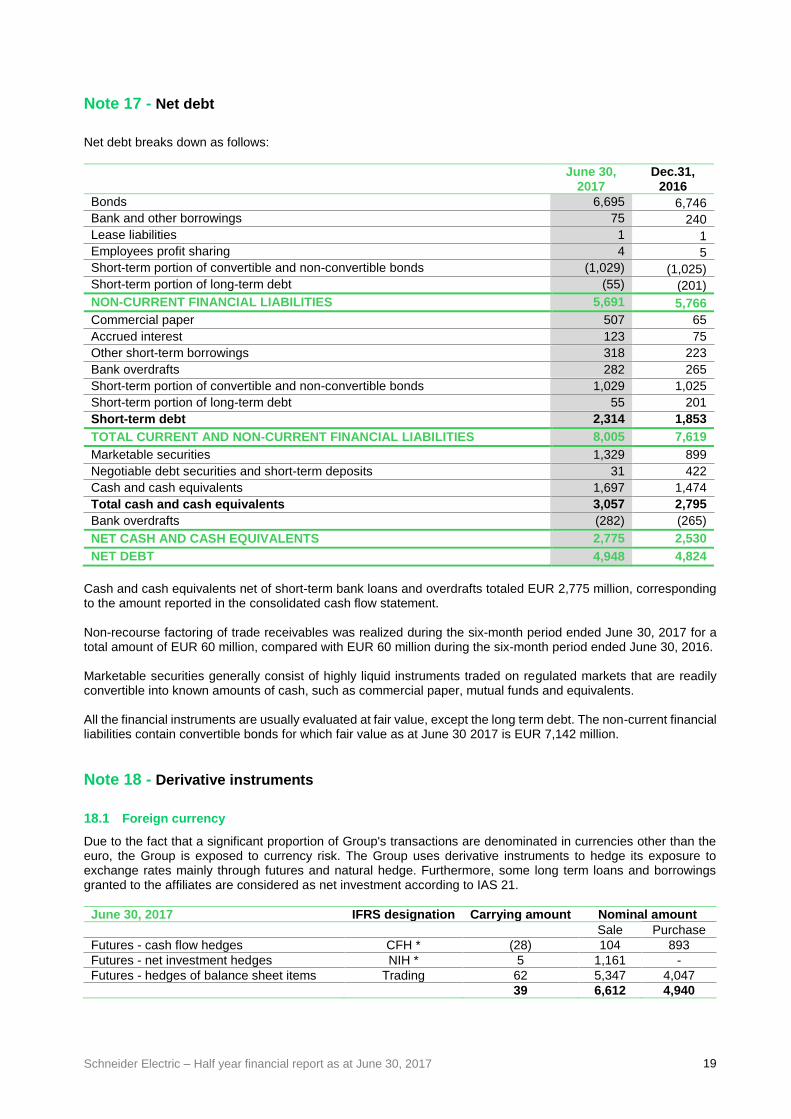
Note 17 - Net debt
Net debt breaks down as follows:
June 30, 2017
Dec.31, 2016
Bonds 6,695 6,746
Bank and other borrowings 75 240
Lease liabilities 1 1
Employees profit sharing 4 5
Short-term portion of convertible and non-convertible bonds (1,029) (1,025)
Short-term portion of long-term debt (55) (201)
NON-CURRENT FINANCIAL LIABILITIES 5,691 5,766
Commercial paper 507 65
Accrued interest 123 75
Other short-term borrowings 318 223
Bank overdrafts 282 265
Short-term portion of convertible and non-convertible bonds 1,029 1,025
Short-term portion of long-term debt 55 201
Short-term debt 2,314 1,853
TOTAL CURRENT AND NON-CURRENT FINANCIAL LIABILITIES 8,005 7,619
Marketable securities 1,329 899
Negotiable debt securities and short-term deposits 31 422
Cash and cash equivalents 1,697 1,474
Total cash and cash equivalents 3,057 2,795
Bank overdrafts (282) (265)
NET CASH AND CASH EQUIVALENTS 2,775 2,530
NET DEBT 4,948 4,824
Cash and cash equivalents net of short-term bank loans and overdrafts totaled EUR 2,775 million, corresponding to the amount reported in the consolidated cash flow statement. Non-recourse factoring of trade receivables was realized during the six-month period ended June 30, 2017 for a total amount of EUR 60 million, compared with EUR 60 million during the six-month period ended June 30, 2016. Marketable securities generally consist of highly liquid instruments traded on regulated markets that are readily convertible into known amounts of cash, such as commercial paper, mutual funds and equivalents. All the financial instruments are usually evaluated at fair value, except the long term debt. The non-current financial liabilities contain convertible bonds for which fair value as at June 30 2017 is EUR 7,142 million.
Note 18 - Derivative instruments
18.1 Foreign currency
Due to the fact that a significant proportion of Group's transactions are denominated in currencies other than the euro, the Group is exposed to currency risk. The Group uses derivative instruments to hedge its exposure to exchange rates mainly through futures and natural hedge. Furthermore, some long term loans and borrowings granted to the affiliates are considered as net investment according to IAS 21.
June 30, 2017 IFRS designation Carrying amount Nominal amount
Sale Purchase
Futures - cash flow hedges CFH * (28) 104 893
Futures - net investment hedges NIH * 5 1,161 -
Futures - hedges of balance sheet items Trading 62 5,347 4,047
39 6,612 4,940

Schneider Electric – Half year financial report as at June 30, 2017 20
December 31, 2016 IFRS designation Carrying amount Nominal amount
Sale Purchase
Futures - cash flow hedges CFH * (74) 411 867
Futures - net investment hedges NIH * 12 1,257 -
Futures - hedges of balance sheet items Trading (86) 4,780 3,209
(148) 6,348 4,076
* CFH - Cash flow hedges * NIH - Net investment hedges
18.2 Interest rate
Interest rate risk on borrowings is managed at the Group level, based on consolidated debt and taking into consideration market conditions in order to optimize overall borrowing costs. The Group uses derivative instruments to hedge its exposure to interest rates through swaps. The Group didn’t use any derivative instrument to hedge its exposure to interest rates during the six-month period ended June 30, 2017.
18.3 Raw materials
The Group subscribes to futures and options to hedge the price fluctuations of all or part of forecasted purchases of copper, lead, aluminum, zinc, nickel and silver.
June 30, 2017 IFRS designation Carrying amount Nominal amount
Metal prices
Futures and options CFH * 1 (168)
December 31, 2016 IFRS designation Carrying amount Nominal amount
Metal prices
Futures and options CFH * 9 (159)
18.4 Share-based payment
This hedging covers Schneider Electric shares that are granted to the US employees as part of the Share Appreciation Rights.
June 30, 2017 IFRS designation
Carrying amount
Nominal amount
Number of shares
Share-based payment
Call options CFH * 14 (22) 519,745
December 31, 2016 IFRS designation
Carrying amount
Nominal amount
Number of shares
Share-based payment
Call options CFH * 16 (27) 629,447
Note 19 - Related party transactions
19.1 Associates
These are primarily companies over which the Group has significant influence. They are accounted for by the equity method. Transactions with these related parties are carried out on arm's length terms and were not material during the period.
19.2 Related parties with significant influence

Schneider Electric – Half year financial report as at June 30, 2017 21
No transactions were carried out during the period with members of the Supervisory Board or Management Board.
Note 20 - Commitments and contingent liabilities
20.1 Guarantees given and received
Guarantees given and received amounted to EUR 3,857 million and EUR 60 million, respectively, as of June 30, 2017.
20.2 Contingent liabilities
Management is confident that balance sheet provisions for known disputes in which the Group is involved are sufficient to ensure that these disputes do not have a material impact on its financial position or profit. This is notably the case for the potential consequences of a current dispute in Belgium involving former senior executives and managers of the Group. The loan agreements related to the Group's long-term debt do not include any rating triggers.
Note 21 - Subsequent events
Issuance of shares to employees
On July 11, 2017, the employee share purchase program described in note 14.2, led to a share capital increase of EUR 143 million for 2.4 million shares subscribed.

Schneider Electric – Half year financial report as at June 30, 2017 22
MANAGEMENT REPORT FOR THE PERIOD ENDED JUNE 30, 2017
Consolidated financial statements
Business and Statement of Income highlights
Changes in the scope of consolidation
Acquisitions during the period
No material acquisition occurred during the first half-year 2017. Besides, the Group also acquired the minority
interest of Luminous.
Disposals of the period
On April 3rd, 2017 – the Group announced that it has signed an agreement to sell its Telvent DTN business, to TBG AG. On May 31st, 2017, the transaction was finalized with a final base sale price established at USD 900 million. Discontinued operations
On April 20, 2017, the Group announced the disposal of its Solar activity (“Solar”). At the end of this ongoing process, the Group will have a minority representation on Solar’s board. This activity used to be reported within the Building business segment of Schneider Electric. Solar activity net income and the estimated loss incurred from the disposal of the business have been reclassified to discontinued operations in the Group consolidated financial statements. The comparative information has been restated.
Exchange rate changes
Fluctuations in the euro exchange rate had a positive impact in six-month period ended June 30, 2017, increasing
consolidated revenue by EUR 159 million and adjusted EBITA by EUR 19 million, due mainly to the positive effect of the Russian Ruble and US Dollar compared to the Euro.

Schneider Electric – Half year financial report as at June 30, 2017 23
Results of Operations
The following table sets forth our results of operations for the six-month period ended June 30, 2017 and 2016 :
(in millions of Euros except for earnings per share)
1st half-year 2017
1st half-year 2016*
% variance
Revenue 12,173 11,742 3.7%
Cost of sales (7,458) (7,225)
Gross profit 4,715 4,517 4.4%
% Gross profit 38.7% 38.5%
Research and development (263) (257)
Selling, general and administrative expenses (2,734) (2,673)
Adjusted EBITA 1,718 1,587 8.3%
% Adjusted EBITA 14.1% 13.5%
Other operating income and expenses 71 (8)
Restructuring costs (156) (131)
EBITA 1,633 1,448 12.8%
% EBITA 13.4% 12.3%
Amortization and impairment of purchase accounting intangibles
(61) (82)
Operating income 1,572 1,366 15.0%
% Operating income 12.9% 11.6%
Interest income 31 30
Interest expense (145) (165)
Finance costs, net (114) (135)
Other financial income and expense (70) (112)
Net financial income/loss (184) (247)
Profit from continued operations before income tax
1,388 1,119 24.0%
Income tax expense (361) (279)
Income of discontinued operations, net of income tax
(76) (14)
Share of profit/(losses) of associates 34 13
Profit for the period 985 839 17.4%
-Attributable to owners of the parent 958 809
-Attributable to non-controlling interests 27 30
Basic earnings per share –attributable to owners of the parent (in Euros per share)
1.72 1.44 19.4%
*2016 figures were restated for discontinued operations.

Schneider Electric – Half year financial report as at June 30, 2017 24
Revenue
Consolidated revenue totaled EUR 12,173 million for the period ended June 30, 2017, up 3.7% on a current structure and currency basis from the year-earlier period. Organic growth was positive for 2.7%, acquisitions net of disposals accounted for -0.4% and the currency effect
for 1.4% due mainly to the positive effect of the Russian Ruble and the US dollar compared to the Euro. Breakdown by business
The following table sets forth our revenue by business segment for the six-month periods ended June 30, 2017 and 2016.
(in millions of Euros)
Building Infrastructure Industry IT Total
June 30, 2017 5,341 2,156 2,907 1,769 12,173
June 30, 2016* 5,082 2,300 2,667 1,693 11,742
*2016 figures were restated for discontinued operations.
Building (Low Voltage, 43% of H1 revenues) was up +4.0% organically with solid growth in all four regions. Final Distribution & Wiring Devices continued to grow strongly (+6%), in last with past trends. EcoStruxure Power / Building connected points were up double-digit. Low Voltage activity grew double-digit in Datacenters.
IT (Secure Power, 15% of H1 revenues) was up +2.1% organically, benefitting from strong growth (+7%) in New Economies. Product business grew low single-digit despite destocking in Japan thanks to residential power, edge computing and medium offers. Group sales in Datacenters were up mid-single-digit of which IT sales grew low single-digit while low and medium voltage offers posted double-digit growth. Services performed strongly.
Industry (Industrial Automation, 24% of the H1 revenues) grew +5.7% organic in H1 with strong growth across all four regions, with good growth in China. The Group saw strong products & OEM performance driven by channel initiatives. EcoStruxure Machine offer grew double-digit. Process Automation revenues returned to growth with increasing opportunities in brownfield operations. Software orders were up in Q2, with O&G market showing initial positive signs.
Infrastructure (Medium Voltage, 18% of H1 revenues) was down -3.7% in H1 due to the selectivity initiatives as the Group executed its Rebound plan. Products sold through Low Voltage partners grew high single-digit, and services orders were up high single-digit. The Group saw good results from its offers in the new digital landscape through EcoStruxure Grid offer: the ADMS (Advanced Distribution Management System, the software enabling smart grid) was ranked leader in 2017 Gartner Magic Quadrant. Additionally, ADMS showed good traction with numerous wins.
Gross margin
Gross margin increased to EUR 4,715 million for the six-month period ended June 30, 2017 (EUR 4,517 million for the six-month period ended June 30, 2016) mainly linked to an increase in revenue. As a percentage of revenues, gross profit is improving to 38.7% in first half of 2017 from 38.5% in first half of 2016, thanks to strong industrial productivity and positive pricing.
Support Function costs: Research and development and selling, general and administrative expenses
Research and development expenses, net of capitalized development costs, increased by 2.3% from EUR 257 million for the six-month period ended June 30, 2016 to EUR 263 million for the six-month period ended June 30, 2017. As a percentage of revenues, the net cost of research and development remained stable at 2.2% of revenues for six-month period ended June 30, 2017 (2.2% for the six-month period ended June 30, 2016). Total research and development expense, including capitalized development costs and development costs reported as cost of sales (see Note 4 to the Audited Consolidated Financial Statements) increased by 0.1% from

Schneider Electric – Half year financial report as at June 30, 2017 25
EUR 609 million for the six-month period ended June 30, 2016 to EUR 610 million for the six-month period ended June 30, 2017. As a percentage of revenues, total research and development expenses decreased slightly to 5.0% for the six-month period ended June 30, 2017 (5.2% for the six-month period ended June 30, 2016). On the first semester 2017, the net effect of capitalized development costs and amortization of capitalized development costs amounts to EUR 38 million on operating income (EUR 70 million on the first semester 2016). Selling, general and administrative expenses increased by 2.3% to EUR 2,734 million for the six-month period ended June 30, 2017 (EUR 2,673 million for the six-month period ended June 30, 2016). As a percentage of revenues, selling, general and administrative expenses decreased to 22.5% for the six-month period ended June 30, 2017 (22.8% for the six-month period ended June 30, 2016). Combined, total support function costs, that is, research and development expenses together with selling, general and administrative costs, totaled EUR 2,997 million six-month period ended June 30, 2017 compared to EUR 2,930 million six-month period ended June 30, 2016, an increase of 2.3%. As a result, support functions costs to sales ratio decreased from 25.0% for the six-month period ended June 30, 2016 to 24.6% for the six-month period ended June 30, 2017.
Other operating income and expenses
For the six-month period ended June 30, 2017, other operating income and expenses amounted to a net income of EUR 71 million, mainly including costs of acquisitions and disposals of EUR 18 million, reversal of impairment of assets for EUR 11 million, loss on assets for EUR 6 million, and EUR 117 million gain on business disposal mainly coming from the impact of the disposal of Telvent DTN business.
Restructuring costs
For the six-month period ended June 30, 2017, restructuring costs amounted to EUR 156 million compared to EUR
131 million for the six-month period ended June 30, 2016, attributed to Support Function Costs improvement initiatives. EBITA and Adjusted EBITA
We define adjusted EBITA as EBITA before restructuring costs and before other operating income and expenses, which includes acquisition, integration and separation costs. We define EBITA as earnings before interest, taxes and amortization of purchase accounting intangibles. EBITA comprises operating profit before amortization and impairment of purchase accounting intangible assets and before goodwill impairment. Adjusted EBITA amounted to EUR 1,718 million for the six-month period ended June 30, 2017, compared to EUR 1,587 million for the six-month period ended June 30, 2016, an increase of 8.3%. As a percentage of revenues, adjusted EBITA improved from 13.5% for the six-month period ended June 30, 2016 to 14.1% for the six-month period ended June 30, 2017. EBITA increased by 12.8% from EUR 1,448 million for the six-month period ended June 30, 2016 to EUR 1,633 million for the six-month period ended June 30, 2017, due to the improvement in other operating income and expenses. As a percentage of revenues, EBITA increased to 13.4% for the six-month period ended June 30, 2017 (12.3% for the six-month period ended June 30, 2016).

Schneider Electric – Half year financial report as at June 30, 2017 26
Adjusted EBITA by business segment
The following table sets out EBITA and adjusted EBITA by business segment:
(in millions of Euros)
Building Infrastructure Industry IT Corporate costs
Total
June 30, 2017
Revenues 5,341 2,156 2,907 1,769 - 12,173
Adjusted EBITA* 1,111 180 487 256 (316) 1,718
Adjusted EBITA (%) 20.8% 8.4% 16.7% 14.5% 14.1% * Adjusted EBITA: EBITA before restructuring costs and before other operating income and expenses.
(in millions of Euros)
Building Infrastructure Industry IT Corporate costs
Total
June 30, 2016*
Revenues 5,082 2,300 2,667 1,693 - 11,742
Adjusted EBITA** 1,042 158 424 266 (303) 1,587
Adjusted EBITA (%) 20.5% 6.9% 15.9% 15.7% 13.5% * 2016 figures were restated for discontinued operations. ** Adjusted EBITA: EBITA before restructuring costs and before other operating income and expenses.
Building recorded an adjusted EBITA margin of 20.8% for the six-month period ended June 30, 2017, up 0.3%
compared to 20.5% for the six-month period ended June 30, 2016, thanks to a higher volume of sales, along with solid productivity and leverage on fixed costs. Infrastructure recorded an adjusted EBITA margin of 8.4% for the six-month period ended June 30, 2017, up
1.5% compared to 6.9% for the six-month period ended June 30, 2016, benefiting from good control of support function costs and ongoing selectivity of projects.
Industry recorded an adjusted EBITA margin of 16.7% for the six-month period ended June 30, 2017, up 0.8% compared to 15.9% for the six-month period ended June 30, 2016. This is explained by productivity gains, and support function costs savings. IT recorded an adjusted EBITA margin of 14.5% for the six-month period ended June 30, 2017, down 1.2% compared to 15.7% for the six-month period ended June 30, 2016, due to unfavorable mix. Corporate costs for the compared to the six-month period ended June 30, 2017 amounted to EUR 316 million or
2.6% of sales, at the same level as last year (EUR 303 million, representing 2.6% of revenues of the six-month
period ended June 30, 2016).
Operating income (EBIT)
Operating income, after amortization and depreciation of purchased intangibles, increased from EUR 1,366 million for the six-month period ended June 30, 2016 to 1,572 million for the six-month period ended June 30, 2017, a significant increase of 15.0% linked to an increase of EBITA and a decrease of amortization of purchase accounting intangibles of EUR 21 million (EUR 61 million on the six-month period ended June 30, 2017 compared to EUR 82 million six-month period ended June 30, 2016).
Net financial income/loss
Net financial loss amounted to EUR 184 million for the six-month period ended June 30, 2017, compared to EUR 247 million for the six-month period ended June 30, 2016. This decrease is explained both by the decrease of cost of net financial debt to EUR 114 million for the six-month
period ended June 30, 2017, compared to EUR 135 million for the six-month period ended June 30, 2016, and a favorable foreign exchange rates effect, generating a foreign exchange loss of EUR 3 million on the six-month period ended June 30, 2017, compared to a EUR 40 million loss for the six-month period ended June 30, 2016.
Schneider Electric – Half year financial report as at June 30, 2017 27
Tax
The effective tax rate was 26% for the six-month period ended June 30, 2017, and 25% for the six-month period ended June 30, 2016. The corresponding income tax expense increased from EUR 279 million for the six-month period ended June 30, 2016 to EUR 361 million for the six-month period ended June 30, 2017.
Share of profit/ (losses) of associates
The share of associates was a EUR 34 million profit for the six-month period ended June 30, 2017, compared to EUR 13 million profit for the six-month period ended June 30, 2016.
Discontinued activities
The net effect of discontinued activities totaled EUR 76 million loss for the six-month period ended June 30, 2017, including the net result after tax over six months of Solar activities, and the impairment in valuation of the Solar business, compared to a EUR 14 million loss for the six-month period ended June 30, 2016, including the net result after tax of Solar activities only.
Non-controlling interests
Minority interests in net income for the six-month period ended June 30, 2017 totaled EUR 27 million, compared to EUR 30 million for the six-month period ended June 30, 2016. This represented the share in net income attributable, in large part, to the minority interests of certain Chinese companies.
Profit for the period
Profit for the period attributable to the equity holders of our parent company amounted to EUR 958 million for the six-month period ended June 30, 2017, compared to EUR 809 profit for the six-month period ended June 30, 2016.
Earnings per share
Earnings per share amounted to EUR 1.72 per share for the six-month period ended June 30, 2017 and EUR 1.44 per share for the six-month period ended June 30, 2016.

Schneider Electric – Half year financial report as at June 30, 2017 28
Comments to the consolidated Cash-flow
The following table sets forth our cash-flow statement for the six-month period ended June 30, 2017 and 2016:
(in millions of Euros)
First half 2017 First half 2016*
Profit for the period 985 839
Less net result from discontinued operations 76 14
Share of (profit)/ losses of associates, net of dividends received (34) (13)
Non-cash adjustments to reconcile profit for the period to net cash flows provided by operating activities
Depreciation of property, plant and equipment 199 203
Amortization of intangible assets other than goodwill 209 225
Losses on non-current assets 3 72
Increase/(decrease) in provisions - (135)
Losses/(gains) on disposals of fixed assets (114) 38
Difference between tax paid and tax expense (11) 16
Other non cash-adjustments 54 61
Net cash provided by operating activities before changes in operating assets and liabilities 1,367 1,320
(Increase)/decrease in accounts receivable 63 107
(Increase)/decrease in inventories and work in process (343) (211)
Increase/(decrease) in accounts payable 42 (172)
Change in other current assets and liabilities (277) (208)
Change in working capital requirement (515) (484)
I - Cash flows from operating activities 852 836
Purchases of property, plant and equipment (204) (218)
Proceeds from disposals of property, plant and equipment 21 16
Purchases of intangible assets (171) (198)
Proceeds from disposals of intangible assets 3 -
Net cash used in investment in operating fixed assets (351) (400)
Acquisition of subsidiaries, net of cash acquired (189) (18)
Proceeds from sale of financial assets 747 7
Purchases of other long-term investments (19) (33)
Long-term pension assets (135) (82)
Net financial investments 404 (126)
II - Cash flows from / used in investing activities: 53 (526)
Issuance of bonds - -
Repayment of bonds (97) -
Increase/(reduction) in financial debt 537 282
Proceeds from issuance of share capital 10 5
Sale/(purchase) of own shares - (278)
Dividends paid: Schneider Electric SE (1,133) (1,127)
Non-controlling interests (24) (21)
III - Cash flows from / used in financing activities (707) (1,139)
IV - Net foreign exchange difference (31) (105)
V – Effect of discontinued operations 78 10
Net increase/(decrease) in cash and cash equivalents: I + II + III + IV + V
245 (924)
Cash and cash equivalents at January, 1st 2,530 2,849
Increase/(decrease) in cash and cash equivalents 245 (924)
CASH AND CASH EQUIVALENTS AT JUNE 30TH 2,775 1,925
* 2016 figures were restated for discontinued operations.

Schneider Electric – Half year financial report as at June 30, 2017 29
Operating Activities
Net cash provided by operating activities before changes in operating assets and liabilities reached EUR 1,367 million for the six-month period ended June 30, 2017, increasing compared to EUR 1,320 million for the six-month period ended June 30, 2016. It represents 11.2% of revenues for first half 2017 (11.2% of revenues from first half 2016). Change in working capital requirement consumed EUR 515 million in cash in the six-month period ended June 30, 2017, compared to EUR 484 million in consumption in the six-month period ended June 30, 2016, reflecting normal cash-flow seasonality. In all, net cash provided by operating activities increased from EUR 836 million in the six-month period ended June 30, 2016 to EUR 852 million in the six-month period ended June 30, 2017.
Investing Activities
Net capital expenditure, which included capitalized development projects, decreases, at EUR 351 million for the six-month period ended June 30, 2017, compared to EUR 400 million for the six-month period ended June 30, 2016, and representing 2.9% of sales on first half 2017 compared to 3.4% of sales on first half 2016. The net acquisitions represented a cash out of EUR 189 million for the six-month period ended June 30, 2017, compared with EUR 18 million for the six-month period ended June 30, 2016. Proceeds from sales of financial assets amount EUR 747 million in the first semester 2017, mainly due to the disposal of Telvent DTN.
Financing Activities
The net increase of financial debts amounted to EUR 440 million during the six-month period ended June 30, 2017, compared to a net increase of financial debts of EUR 282 million during the six-month period ended June 30, 2016. The dividend paid by Schneider Electric was EUR 1,133 million the six-month period ended June 30, 2017, compared with EUR 1,127 million the six-month period ended June 30, 2016.
2017 Targets
Following its strong performance in H1, the Group will continue to execute its strategic priorities. The Group expects the positive environment seen in H1 in its major end-markets to continue. Therefore, the Group upgrades its 2017 objectives:
The Group targets for 2017, organic revenue growth between +3% and +4% for the Group outside Infrastructure. For Infrastructure, the priority remains margin improvement. The selectivity for the division is expected to end in 2017 with an expected impact of c. -4% on revenue for the year. Outside of selectivity, the Group now expects the performance for the Infrastructure division to be a low single-digit organic growth.
For 2017, the Group now targets the upper end of its initial +20 to +50 bps target range for the organic adjusted EBITA margin improvement. Following the evolution of currencies since April, the FX impact is now expected to be -10 to -20bps on the Adjusted EBITA margin for the year.

Schneider Electric – Half year financial report as at June 30, 2017 30
Significant events of the period
In addition to the events described above, there were no major events.
Main risks and areas of uncertainty for the second half of 2017 The main risks and areas of uncertainty for the second half of the year are the same as those outlined in Chapter 1, paragraph 7 (Risk Factors) of the 2016 Registration Document filed with AMF on March 17, 2017.
Claims, litigations and other risks (update to the Registration Document – page 43) No significant event occurred since Registration Document date.
Transactions with related parties These transactions are described in Note 19 to the interim consolidated financial statements.

Schneider Electric – Half year financial report as at June 30, 2017 31
Attestation I hereby declare that, to the best of my knowledge, the half-year financial statements as at June 30, 2017 have been prepared in accordance with applicable accounting standards, that they present fairly, in all material respects, the assets, financial position and results of the company and the consolidated group. To the best of my knowledge, the Management Report presents fairly the information mentioned in Article 222-6 of AMF’s general regulations. Rueil-Malmaison, July 26, 2017 On behalf of the Board of Directors, Jean-Pascal TRICOIRE Chairman of the Board of Directors and CEO

Schneider Electric – Half year financial report as at June 30, 2017 32
Statutory Auditors' Review Report on the first half-yearly information
This is a free translation into English of the statutory auditors’ review report on the condensed half-yearly consolidated
financial statements issued in French and it is provided solely for the convenience of English-speaking users. This
report also includes information relating to the specific verification of information given in the Group’s interim
management report. This report should be read in conjunction with and construed in accordance with French law and
professional standards applicable in France.
To the Shareholders,
In compliance with the assignment entrusted to us by your shareholders’ meeting and in accordance with the
requirements of article L. 451-1-2 III of the French monetary and financial code (Code monétaire et financier), we hereby
report to you on:
the review of the accompanying condensed half-yearly consolidated financial statements of Schneider Electric S.E.,
for the period from January 1 to June 30, 2017, and
the verification of the information contained in the interim management report.
These condensed half-yearly consolidated financial statements are the responsibility of the Board of Directors. Our role
is to express a conclusion on these financial statements based on our review.
1. Conclusion on the financial statements
We conducted our review in accordance with professional standards applicable in France. A review of interim financial
information consists of making inquiries, primarily of persons responsible for financial and accounting matters, and
applying analytical and other review procedures. A review is substantially less in scope than an audit conducted in
accordance with professional standards applicable in France and consequently does not enable us to obtain assurance
that we would become aware of all significant matters that might be identified in an audit. Accordingly, we do not express
an audit opinion.
Based on our review, nothing has come to our attention that causes us to believe that the condensed half-yearly
consolidated financial statements are not prepared in all material respects in accordance with IAS 34 – standard of the
IFRSs as adopted by the European Union applicable to interim financial information.
2. Specific verification
We have also verified the information presented in the interim management report in respect of the condensed half-yearly
consolidated financial statements subject to our review.
We have no matters to report as to its fair presentation and its consistency with the condensed half-yearly financial
statements.
Courbevoie and Paris-La Défense, July 26, 2017
The statutory auditors
French original signed by
MAZARS ERNST & YOUNG et Autres
Loïc Wallaert Jean-Yves Jégourel