Embed Size (px)
Citation preview

HALF YEAR FINANCIAL REPORTJanuary-June 2016
July 29, 2016
Martin à Porta, President and CEOJukka Pahta, CFO

COPYRIGHT©PÖYRY
CONTENTS
1. January – June overview
2. Continuous improvement
3. Key project and contract wins
4. Outlook
Martin à PortaPresident & CEO
5. Financial performance
6. Appendices
Jukka PahtaCFO
JULY 29, 2016Q2/2016 PRESENTATION 2

COPYRIGHT©PÖYRYJULY 29, 2016
Q2/2016 PRESENTATION 3
JANUARY – JUNEOVERVIEW1

COPYRIGHT©PÖYRY
MARKET REVIEW: OVERVIEW
JULY 29, 2016Q2/2016 PRESENTATION 4
• The economic and market outlook for our sectors in 2016 remains challenging• Slowing growth in China, reasonable in the rest of the Asia• Robust economic growth in the US• Our key regions in particular are impacted by fewer investments• However, there are still opportunities in many markets

COPYRIGHT©PÖYRY
MANAGEMENT CONSULTING• Improvement in Central and Southern Europe• Challenging market situation in Northern Europe
REGIONAL OPERATIONS• Challenging market situation continues with respect to our business portfolio• Public sector investment decisions may open opportunities• Despite slight signs on economic recovery the situation in Brazil remains uncertain
INDUSTRY• Production line conversions in forest industry• Pulp-mill equipment relocation projects in Asia• Other parts of Asian market are generally slowing down
ENERGY• Positive development especially in hydro business in Asian market• Low oil prices delay investment decision making in Middle East• Tight market situation in Northern and Central Europe
MARKET REVIEW: BUSINESS LINES
JULY 29, 2016Q2/2016 PRESENTATION 5

COPYRIGHT©PÖYRY
Continued strengthening of sales focus
Reduced number of legal cases
Progress in streamlining the organisation in Energy, Management Consulting
and Latin America
Q2 ORDER INTAKE STABLE, PERFORMANCE FAR BELOWEXPECTATIONS
JULY 29, 2016Q2/2016 PRESENTATION 6
Net sales• Decreased across all business lines partly explained by missing larger EPC-
projects
Order stock• Remained stable compared to 2015 year end• Stable in Management Consulting and the Regional Operations• Decreased in Energy and Industry
• Improved in the Regional Operations• Decreased in other Business Lines
Adjustedoperating result

COPYRIGHT©PÖYRY
LOWER FIGURES AGAINST COMPARABLE PERIOD
JULY 29, 2016Q2/2016 PRESENTATION 7
MEUR 1-6/2016 1-6/2015 Change
Order stock 457.8 502.4 -8.9%Net sales 271.9 297.6 -8.6%Operating result -4.2 2.8 n.a.Adjusted operating result -1.7 4.3 n.a.Net result -5.6 -1.5 n.a.

COPYRIGHT©PÖYRYJULY 29, 2016
Q2/2016 PRESENTATION 8
CONTINUOUSIMPROVEMENT2

COPYRIGHT©PÖYRY
WE CONTINUE IMPLEMENTING OUR OPERATIONALFRAMEWORK AND ENHANCING CLIENT FOCUS
JULY 29, 2016Q2/2016 PRESENTATION 9
2013 2014 2015
Driving sales focus and performance in project management
Improving profitability
Addressing structural and administrative challenges
Strengthening client focus1. Simplify and empower2. Strengthen the core3. Scale up
2016

COPYRIGHT©PÖYRYJULY 29, 2016
Q2/2016 PRESENTATION 10
KEY PROJECT AND CONTRACT WINS3

COPYRIGHT©PÖYRY
ASSIGNMENT FOR RECONSTRUCTION AND EXTENSION OF ATRANSMISSION SYSTEM SUBSTANTION IN AUSTRIA
JULY 29, 2016Q2/2016 PRESENTATION 11
· Client – Austrian Power Grid AG, Austria· Scope – Modernisation and extension of existing 220/380kV switchgears at Lienz
substation, Austria. The frame agreement includes detailed design engineering, projectmanagement and installation services as well as the supply of equipment. Dismantlingof the existing 220kV switchgear and installation of the new components will bemanaged step by step, in close co-operation with the client.
· Duration – Six years

COPYRIGHT©PÖYRY
DETAILED DESIGN SERVICES ASSIGNMENT FORHYDROELECTRIC POWER PLANT, TURKEY
JULY 29, 2016Q2/2016 PRESENTATION 12
· Client – Kalehan Genç Enerji Üretim A.S.· Project – Pöyry has been awarded a detailed design services assignment for the
Lower Kaleköy Hydroelectric Power Plant and Dam in Turkey. The assignment includesthe execution of the detail design for the civil engineering of the powerhouse, andstructural reviews, including the roller-compacted concrete (RCC) dam, power intakeand penstocks, piano-key weir spillway solution, diversion structures with two tunnelsand bottom.
· Expected completion – By the end of 2017

COPYRIGHT©PÖYRY
FINANCIAL ADVISORY SERVICES TO DELTA PACKAGING ON ITSACQUISITION BY HUHTAMÄKI
JULY 29, 2016Q2/2016 PRESENTATION 13
· Client – Delta Print & Packaging· Project – On 19th May 2016 Huhtamäki announced its acquisition of Delta Print &
Packaging. Based in Belfast, Northern Ireland, Delta is a manufacturer of folding cartonpackaging, supplying major food service brands including KFC, Kellogg's, McDonald'sand United Biscuits. The company has recently expanded its manufacturing operationsby building a factory in southern Poland.
· Pöyry acted as financial adviser to Delta and its owners.

COPYRIGHT©PÖYRY
BASIC ENGINEERING ASSIGNMENT FOR THE NEW WASTEWATERSOLUTION IN LAPPEENRANTA, FINLAND
JULY 29, 2016Q2/2016 PRESENTATION 14
· Client – Lappeenrannan Lämpövoima Oy· Project – Pöyry has been awarded the basic engineering assignment for the new
Lappeenranta wastewater treatment plant and its wastewater transfer system. Theassignment also includes identification and comparison of process solutions, piloting ofthe selected solution, optimisation of the wastewater balancing and pumping systemsand preparation of the building permit documents.
· Expected completion - Summer 2021

COPYRIGHT©PÖYRY
DETAILED ENGINEERING ASSIGNMENTS FOR BLOMINMÄKIWASTEWATER TREATMENT PLANT IN FINLAND
JULY 29, 2016Q2/2016 PRESENTATION 15
· Client – Helsinki Region Environmental Services (HSY)· Project – Pöyry has been awarded detailed engineering assignments for the
Blominmäki wastewater treatment plant to be built in Espoo, Finland. The assignmentsinclude the structural and architectural design of the treatment plant, electrical,instrumentation and automation design, area planning, and the geotechnicalengineering of aboveground structures.
· Expected completion – 2020

COPYRIGHT©PÖYRYJULY 29, 2016
Q2/2016 PRESENTATION 16
OUTLOOK4

COPYRIGHT©PÖYRY
OUTLOOK FOR 2016
JULY 29, 2016Q2/2016 PRESENTATION 17
Asian market for Industry business slowingdown
Opportunities in Energy sector especiallyin Asia, South-America and Africa
In Europe public sector investments oninfrastructure in order to stimulate economic
growth.
For energy and other industrial sectors relevantto Pöyry’s business, the prospects are
expected to be challenging
The Group’s adjusted operating result is expected to be positive.
Market conditions
Despite some signs for economicrecovery in Brazil, economic and political
situation still uncertain
Decline in structural consumptionof graphic paper continues, outlookreasonable for other forest product
industry sectors

COPYRIGHT©PÖYRYJULY 29, 2016
Q2/2016 PRESENTATION 18
FINANCIALPERFORMANCE5

COPYRIGHT©PÖYRY
0
100
200
300
400
500
600
2012 2013 2014 2015 Q2/2016
Energy Industry Regional Operations Management Consulting
ORDER STOCK
JULY 29, 2016Q2/2016 PRESENTATION 19
457.8 (502.4) MEUR· Order stock remained stable
compared to 2015 year-end.
· Stable in Regional Operations andManagement Consulting
· Decreased in Energy and Industry
Comparable figures after divestments
MEUR
512
462 472 465 458

COPYRIGHT©PÖYRY
NET SALES
JULY 29, 2016Q2/2016 PRESENTATION 20
MEUR
Comparable figures after divestments
271.9 (297.6) MEUR· Net sales decreased partly due to
missing larger EPC-projects
· Remained stable in Industry
· Decreased in other BusinessLines
Q2: 135.9 (150.9) MEUR
706
602552
575 565 550
298272
0
100
200
300
400
500
600
700
800

COPYRIGHT©PÖYRY
ADJUSTED OPERATING RESULT
JULY 29, 2016Q2/2016 PRESENTATION 21
MEUR
-1.7 (4.3) MEUR· Increased in Industry
· Decreased in other BusinessLines
Q2: -1.1 (1.2) MEUR
*) 2013 includes a gain of EUR 14 million from thedivestment of the office real estate in Vantaa
9
11
-5
9
6
3 4
-2
-6
-4
-2
0
2
4
6
8
10
12
14
• Adjusted items -2.6 MEUR (-1.5 MEUR) are mainlyrestructuring expenses and expenses related tolabour claims customary in one of the Groupsoperating countries as well as losses relating toprojects from former Urban Business Group and fromprojects finalized over two years ago.

COPYRIGHT©PÖYRY
NET SALES AND HEADCOUNT 1-6/2016 BY BUSINESS LINE
JULY 29, 2016Q2/2016 PRESENTATION 22
Net salesEUR 271.9 (297.6) million
Headcount5,685 (5,803)
EnergyIndustry
Regional OperationsManagement ConsultingFTEs at the end of period 4,879
26%
8%
54%
12%22%
10%
60%
7%24%
10%
54%
12%21%
11%
61%
7%

COPYRIGHT©PÖYRY
ENERGY BUSINESS GROUP: NET SALES DOWN
JULY 29, 2016Q2/2016 PRESENTATION 23
Adjusted operatingresult 0.7 (1.8) MEUR• Operating result 0.5 (1.8) MEUR• Adjusted items include
restructuring expenses inNorthern Europe
Q2: 0.0 (0.6) MEUR
Sales 65.3 (71.8) MEUR
Q2: 31.7 (37.3) MEUR• Decreased especially in Northern
and Central Europe and inPhilippines where a larger projectwas in execution phase in 2015
Rolling 12 months
Net sales & adjusted operating margin, %MEUR
129
142 141
6%
2%
3%
0%
1%
2%
3%
4%
5%
6%
7%
8%
9%
10%
0
20
40
60
80
100
120
140
160
Q1/14 Q2/14 Q3/14 Q4/14 Q1/15 Q2/15 Q3/15 Q4/15 Q1/16 Q2/16
Net sales Adjusted operating margin, %

COPYRIGHT©PÖYRY
INDUSTRY BUSINESS GROUP: NET SALES STABLE
JULY 29, 2016Q2/2016 PRESENTATION 24
Adjusted operating result2.7 (2.1) MEUR• Adjusted items include profit related
to a project on which losses wererecorded in 2014 and reported as anadjusted item
Q2: 0.8 (1.1) MEUR
Sales 26.8 (25.8) MEUR
Q2: 12.8 (14.1) MEUR• Decline mainly due to development in
Asia
Rolling 12 months
Net sales & adjusted operating margin, %MEUR
46 45
55
5% 5%
10%
0%
2%
4%
6%
8%
10%
12%
14%
0
10
20
30
40
50
60
Q1/14 Q2/14 Q3/14 Q4/14 Q1/15 Q2/15 Q3/15 Q4/15 Q1/16 Q2/16
Net sales Adjusted operating margin, %
COPYRIGHT©PÖYRY
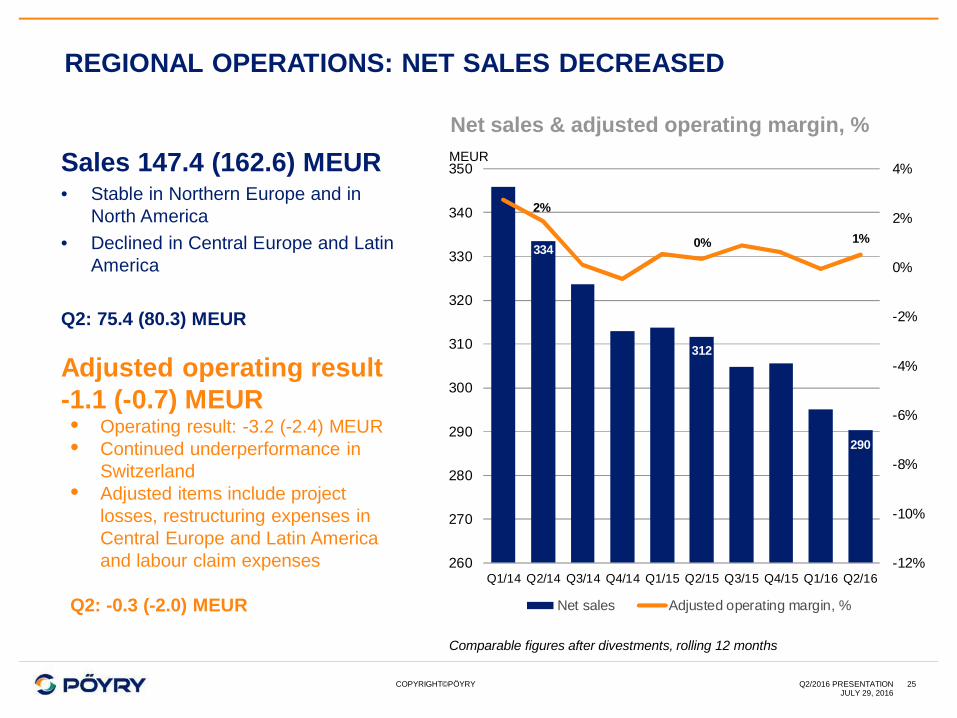
REGIONAL OPERATIONS: NET SALES DECREASED
JULY 29, 2016Q2/2016 PRESENTATION 25
Adjusted operating result-1.1 (-0.7) MEUR• Operating result: -3.2 (-2.4) MEUR• Continued underperformance in
Switzerland• Adjusted items include project
losses, restructuring expenses inCentral Europe and Latin Americaand labour claim expenses
Q2: -0.3 (-2.0) MEUR
Sales 147.4 (162.6) MEUR• Stable in Northern Europe and in
North America• Declined in Central Europe and Latin
America
Q2: 75.4 (80.3) MEUR
Comparable figures after divestments, rolling 12 months
Net sales & adjusted operating margin, %MEUR
334
312
290
2%
0% 1%
-12%
-10%
-8%
-6%
-4%
-2%
0%
2%
4%
260
270
280
290
300
310
320
330
340
350
Q1/14 Q2/14 Q3/14 Q4/14 Q1/15 Q2/15 Q3/15 Q4/15 Q1/16 Q2/16
Net sales Adjusted operating margin, %

COPYRIGHT©PÖYRY
MANAGEMENT CONSULTING: NET SALES DOWN
JULY 29, 2016Q2/2016 PRESENTATION 26
Adjusted operatingresult 2.3 (3.0) MEUR• Operating result 1.8 (3.0) MEUR• Adjusted items include
restructuring expenses in Asiaand expenses related to projectsfinalized over two years ago
Q2: 0.8 (1.5) MEUR
Sales 31.9 (35.2) MEUR
Q2: 15.9 (17.9) MEUR
Q2
Rolling 12 months
Net sales & adjusted operating margin, %MEUR
66 6563
8%8%
6%
0%
2%
4%
6%
8%
10%
12%
14%
16%
0
10
20
30
40
50
60
70
80
Q1/14 Q2/14 Q3/14 Q4/14 Q1/15 Q2/15 Q3/15 Q4/15 Q1/16 Q2/16
Net sales Adjusted operating margin, %

COPYRIGHT©PÖYRY
CASH FLOW
JULY 29, 2016Q2/2016 PRESENTATION 27
Cash flow before financing-35.4 (-8.6) MEUR
Q2: -10.7 (-10.6) MEUR
Cash flow from operations-33.6 (-9.2) MEUR• Change in net working capital
- 28.2 MEUR including advancepayment of 5.0 MEUR for three years’software lease agreement andpayment of 7.7 (4.6) MEUR foraccrued bonuses
• Ongoing implementation of businessmanagement system had a negativeimpact on cash flow from operations
Q2:-10.1 (-12.9) MEUR
*) 2013 includes the divestment of the office real estate in Vantaa, Finland**) 2014 includes the divestment of real estate business in Finland
MEUR
- 2.2
-33.6
5.2
-35.4-40
-30
-20
-10
0
10
20
30
40
50
60
2012 2013*) 2014**) 2015 1-6/2016
From operations Before financing

COPYRIGHT©PÖYRY
NET DEBT, EQUITY AND GEARING
JULY 29, 2016Q2/2016 PRESENTATION 28
Gearing 32.7 (51.1)%
Net debt39.3 (47.5) MEUR
Equity120.2 (92.9) MEUR
The office real estate in Vantaa, Finland, was included in thebalance sheet in 2012 and sold in Q4-2013
MEUR Gearing-%
120.2
39.3
32.7%
0%
10%
20%
30%
40%
50%
60%
70%
0
20
40
60
80
100
120
140
2012 2013 2014 2015 End ofperiod
Equity Net debt Gearing -%

www.poyry.comConsulting. Engineering. Projects. Operations.
Thank you

COPYRIGHT©PÖYRYJULY 29, 2016
Q2/2016 PRESENTATION 30
APPENDICES6

COPYRIGHT©PÖYRY
RETURN ON INVESTMENT, %
JULY 29, 2016Q2/2016 PRESENTATION 31
-2.9%
-12%-10%-8%-6%-4%-2%0%2%4%6%8%
2012 2013 2014 2015 End of period

COPYRIGHT©PÖYRY
STATEMENT OF INCOME
JULY 29, 2016Q2/2016 PRESENTATION 32
MEUR 1-6/2016 1-6/2015Net sales 271.9 297.6Other operating income 0.5 0.8Materials and supplies -1.9 -6.9External charges, sub-consulting -20.7 -24.1Personnel expenses -184.7 -194.9Other operating expenses -69.4 -69.6
Operating result -4.2 2.8Net financial items -0.8 -3.9Share of associated companies’ andjoint ventures results 0.3 0.3
Result before taxes -4.8 -0.9Income taxes -0.8 -0.6
Net result for the period -5.6 -1.5

COPYRIGHT©PÖYRY
BALANCE SHEET
JULY 29, 2016Q2/2016 PRESENTATION 33
MEUR 30 Jun 2016 30 Jun 2015Goodwill 121.4 124.1Other non-current assets 56.1 48.8Work in progress 74.6 88.0Accounts receivable 108.2 113.0Other current assets 30.2 26.1Cash and cash equivalents 36.9 51.6Assets classified as held for sale - 4.6Total assets 427.5 456.3Equity 120.2 92.9Interest bearing liabilities 76.2 99.1Pension obligations and other non-current liabilities 53.6 52.9
Project advances 56.8 81.2Accounts payable 18.0 20.0Other current liabilities 102.6 110.2Total equity and liabilities 427.5 456.3

COPYRIGHT©PÖYRY
CASH FLOW
JULY 29, 2016Q2/2016 PRESENTATION 34
MEUR 1-6/2016 1-6/2015Net result for the period -5.6 -1.5AdjustmentsDepreciation and impairment losses 2.3 2.2Financial items and taxes 1.6 4.6Other adjustments 0.4 -1.3
Change in working capital -28.2 -8.8Paid financial items and taxes -4.2 -4.4Total from operating activities -33.6 -9.2Net cash flow from investing activities -1.8 0.7Net cash before financing -35.4 -8.6Net cash from financing 0.9 7.4Change in cash -34.6 -1.2

COPYRIGHT©PÖYRY
KEY FIGURES
JULY 29, 2016Q2/2016 PRESENTATION 35
1-6/2016 1-6/2015Earnings per share, EUR (diluted) -0.11 -0.03Earnings per share adjusted, EUR -0.07 -0.01Equity per share, EUR 1.98 1.53ROI-% -2.9 4.3ROE-% -10.0 -2.8Equity ratio-% 32.4 24.8Gearing-% 32.7 51.1Net debt, EUR million 39.3 47.5Capital expenditure, EUR million 2.2 3.2Personnel on average (FTE) 4 900 5 091