Embed Size (px)
Citation preview
MEDIOLANUM S.p.A.
Half-YearFinancial Report at
June 30,2013
2 Corporate Governance Officers
3 Group Structure
4 Mediolanum Group’s Financial Highlights
6 Interim Management Report
34 Condensed Consolidated Financial Statements
42 Notes to the Condensed Consolidated Financial Statements
87 Responsibility Statements pursuant to section 154-bis, paragraph 5,
Legislative decree 58/98
Table of Contents
The English version of the Half-Year Financial Report is a translation of the Italian text provided for theconvenience of international readers.
Half-YearFinancial Report at
June 30,2013
Registered Office: Meucci Building, Via F. Sforza – Basiglio – Milano Tre (Milan)Share capital: €73,473,042.30 – fully paid up
Tax, VAT and Milan Register of Companies Registration No. 11667420159

2
Corporate Governance Officers
BOARD OF DIRECTORS
Carlo Secchi Chairman of the Board
Alfredo Messina Deputy Chairman of the Board
Massimo Antonio Doris Executive Deputy Chairman
Ennio Doris Chief Executive Officer
Francesco Barbaro Director
Luigi Berlusconi Director
Pasquale Cannatelli Director
Maurizio Carfagna Director
Edoardo Lombardi Director
Mario Molteni Director
Danilo Pellegrino Director
Angelo Renoldi Director
Paolo Sciumè Director
Maria Alessandra Zunino De Pignier Director
BOARD OF STATUTORY AUDITORS
Ezio Simonelli Chairman
Riccardo Perotta Standing Auditor
Francesco Vittadini Standing Auditor
Ferdinando Gatti Alternate Auditor
Antonio Marchesi Alternate Auditor
BOARD SECRETARY
Luca Maria Rovere
OFFICER RESPONSIBLE FOR PREPARING ACCOUNTING AND FINANCIAL REPORTING DOCUMENTS
Luigi Del Fabbro
INDEPENDENT AUDITORS
Deloitte & Touche S.p.A.
3
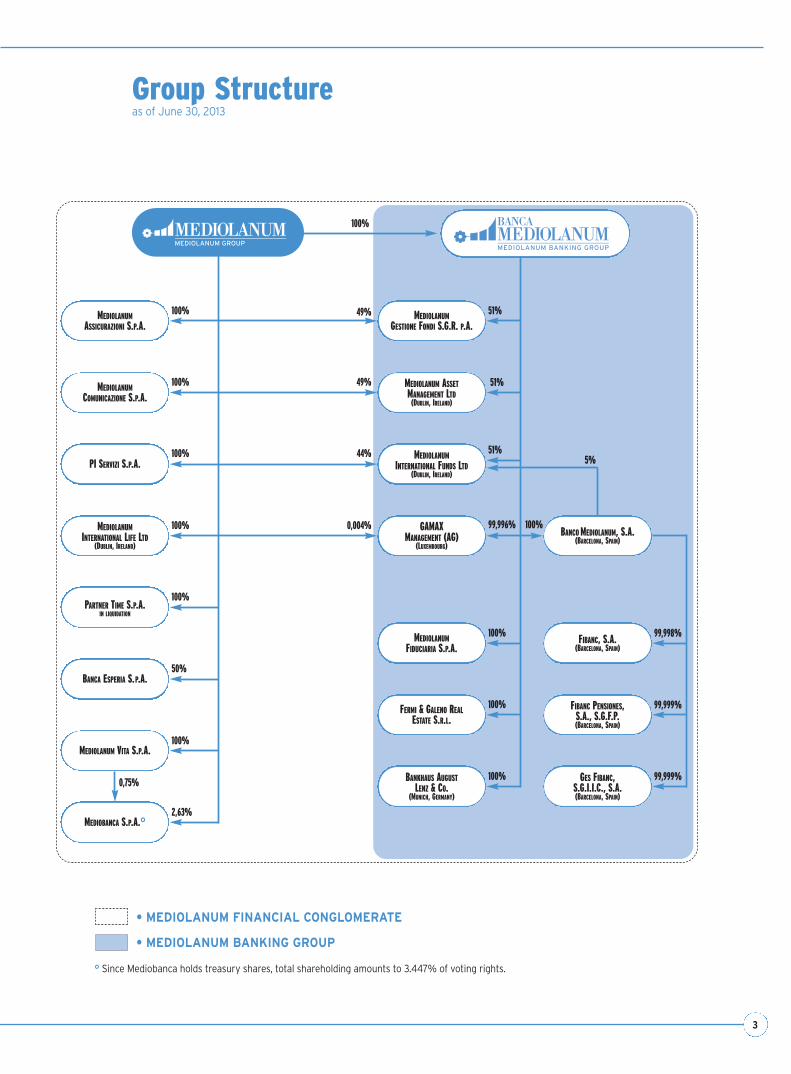
Group Structure as of June 30, 2013
° Since Mediobanca holds treasury shares, total shareholding amounts to 3.447% of voting rights.
• MEDIOLANUM FINANCIAL CONGLOMERATE
• MEDIOLANUM BANKING GROUP
GAMAXMANAGEMENT (AG)
(LUXEMBOURG)
MEDIOLANUMGESTIONE FONDI S.G.R. P.A.
PI SERVIZI S.P.A.
MEDIOLANUM ASSETMANAGEMENT LTD
(DUBLIN, IRELAND)
PARTNER TIME S.P.A.IN LIQUIDATION
100%
100% 49%
FIBANC, S.A.(BARCELONA, SPAIN)
MEDIOLANUMINTERNATIONAL FUNDS LTD
(DUBLIN, IRELAND)
FIBANC PENSIONES, S.A., S.G.F.P.(BARCELONA, SPAIN)
GES FIBANC, S.G.I.I.C., S.A.(BARCELONA, SPAIN)
MEDIOLANUMFIDUCIARIA S.P.A.
MEDIOLANUM VITA S.P.A.
BANCO MEDIOLANUM, S.A.(BARCELONA, SPAIN)
MEDIOLANUMASSICURAZIONI S.P.A.
MEDIOLANUMCOMUNICAZIONE S.P.A.
MEDIOBANCA S.P.A.°
FERMI & GALENO REALESTATE S.R.L.
BANKHAUS AUGUSTLENZ & CO.
(MUNICH, GERMANY)
100% 49%
100% 44%
100% 0,004%
100%
50%
100%
2,63%
0,75%
51%
51%
51%
99,996%
100%
100%
100%
5%
99,999%
99,999%
99,998%
MEDIOLANUMINTERNATIONAL LIFE LTD
(DUBLIN, IRELAND)
BANCA ESPERIA S.P.A.
100%
4
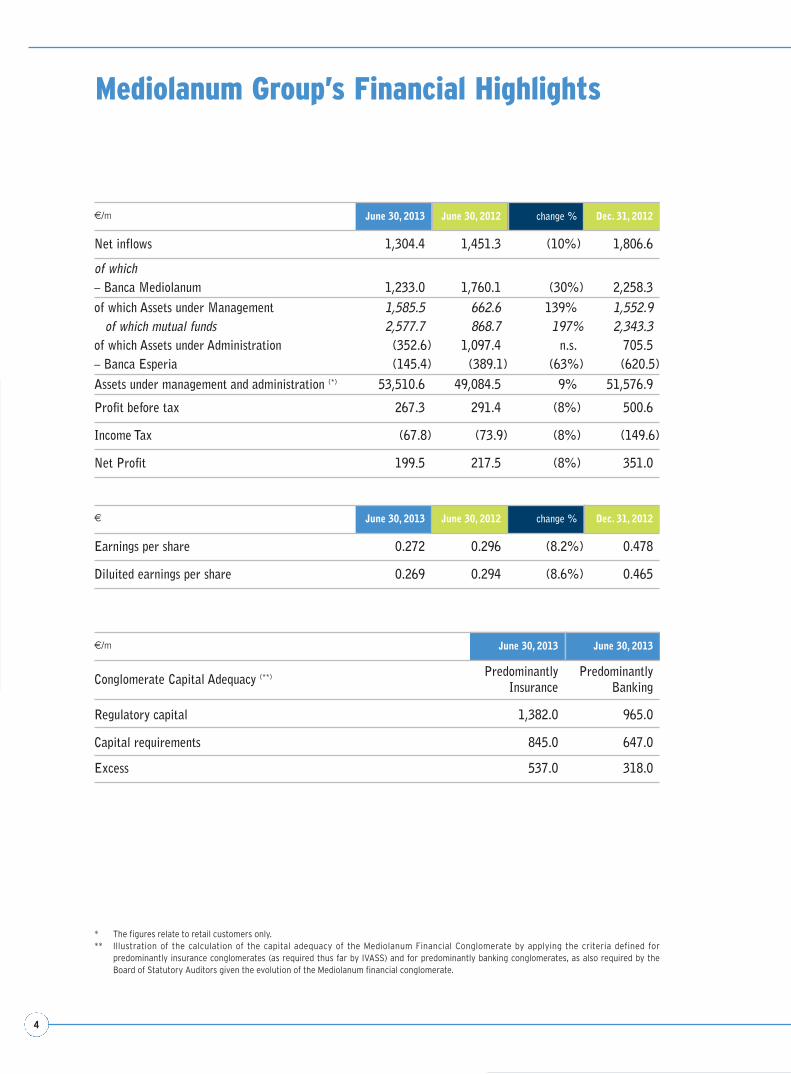
Mediolanum Group’s Financial Highlights
€/m June 30, 2013 June 30, 2012 change % Dec. 31, 2012
Net inflows 1,304.4 1,451.3 (10%) 1,806.6
of which– Banca Mediolanum 1,233.0 1,760.1 (30%) 2,258.3of which Assets under Management 1,585.5 662.6 139% 1,552.9
of which mutual funds 2,577.7 868.7 197% 2,343.3of which Assets under Administration (352.6) 1,097.4 n.s. 705.5– Banca Esperia (145.4) (389.1) (63%) (620.5)Assets under management and administration (*) 53,510.6 49,084.5 9% 51,576.9
Profit before tax 267.3 291.4 (8%) 500.6
Income Tax (67.8) (73.9) (8%) (149.6)
Net Profit 199.5 217.5 (8%) 351.0
€ June 30, 2013 June 30, 2012 change % Dec. 31, 2012
Earnings per share 0.272 0.296 (8.2%) 0.478
Diluited earnings per share 0.269 0.294 (8.6%) 0.465
* The figures relate to retail customers only.** Illustration of the calculation of the capital adequacy of the Mediolanum Financial Conglomerate by applying the criteria defined for
predominantly insurance conglomerates (as required thus far by IVASS) and for predominantly banking conglomerates, as also required by theBoard of Statutory Auditors given the evolution of the Mediolanum financial conglomerate.
€/m June 30, 2013 June 30, 2013
Conglomerate Capital Adequacy (**) PredominantlyInsurance
PredominantlyBanking
Regulatory capital 1,382.0 965.0
Capital requirements 845.0 647.0
Excess 537.0 318.0
InterimManagementReport
6
HALF-YEAR FINANCIALREPORT
2013
The Mediolanum Group realised net profit of €199.5 million in 1H 2013, compared with the record net profit of
€217.5 million in 1H 2012.
The earnings result for 1H 2013 represents the second-best half-year result ever, lower only than 1H 2012, although
that period benefited from the €53 million recovery in value of financial assets held for trading (net of the tax effect)
after the steep fall in market prices at the end of 2011.
The more than positive performance of Group business in 1H 2013 posted a record for the inflows of mutual funds
(up €2,577.7 million), reaching the levels attained during the entire previous year. This translated into a 42%
increase in entry fees (up €23 million) and a 21% increase in management fees, which reached €274 million at the
end of 1H 2013 (up €47 million).
The reduction in interest income (down €23 million) due to the continued aggressive policy of offering customers
high interest rates to attract new bank deposits on current accounts and deposit accounts, while expanding the base
of assets to be transformed later into managed asset products, and the lower profits on investments at fair value
(down €71.2 million), especially due to the large recoveries in value recognised in 1H 2012, are only partly offset
by the net gains realised on disposals of available for sale financial assets(up €37.1 million).
The commission expenses recognised in 1H 2013 rose by about €38.8 million, mainly due to the structural growth
in customer assets that improved the mix of net inflows, with a marked improvement in inflows for managed asset
products. In particular, this has led to higher retrocession of entry fees and increased incentives accrued on the out-
standing commercial results realised.
The Macroeconomic Environment
Statistics confirm the persistent economic slowdown in the Eurozone, while data reported in the United States
exclude the risk of recession there.
In April 2013 the International Monetary Fund cut its global economic growth forecast yet again, confirming that
the recovery proceeds amidst general weakness. The GDP growth forecast for 2013 has been revised downward from
3.5% to 3.3%. In particular, the growth forecast has been revised downward from 1.4% to 1.2% for industriali-
sed economies, and from 5.5% to 5.3% for emerging countries. Moreover, the business cycle in industrialised coun-
tries shows a pronounced divergence between the United States (+2.2% in 2012, +1.9% in 2013, and +3.0% in
2014) and the Eurozone (-0.6% in 2012, -0.3% in 2013 and -1.1% in 2014). The forecasts for the Eurozone
reflect weakness both in periphery countries and in core countries. Germany is expected to remain just inside posi-
tive territory in 2013 (+0.6%), while France is expected to slow down slightly (-0.1%). The Italian and Spanish
economies may contract again in 2013 (by -1.5% and -1.6%, respectively), in anticipation of a return to growth
in 2014 (forecast on the order of +0.5% and +0.7%, respectively).
In 1Q 2013, GDP expanded at an annualised rate of +1.8% in the United States and shrank by -0.2% (not annua-
lised) in the Eurozone, reflecting the lag between the two regions. GDP fell in France (-0.2%), Italy (-0.6%) and
Spain (-0.5%), while rising in Germany (+0.1%). At the same time, the English economy returned to positive ter-
ritory (+0.3%). The readings of the Purchasing Managers Index (PMI) show persistent stagnation or recession in
Interim Management Report
7
INTERIM MANAGEMENTREPORT
the Eurozone since August 2011, while the statistics prepared by the Institute for Supply Management (ISM) con-
tinue to show that both industrial production and services remain near the growth threshold in the United States.
Employment trends are one of the most critical aspects of this phase in the business cycle, due to their impact on
consumer confidence and demand for goods and services. The unemployment rate stands at 7.6% in the United
States and 12.2% in the Eurozone (12.2% in Italy, 6.8% in Germany).
The negative business cycle reduces inflationary pressures. In May, the producer price index and consumer price
index rose by +1.7% and 1.4%, respectively, in the United States while falling -0.1% and rising by +1.4%, respec-
tively, in the Eurozone.
Meeting on May 2, the European Central Bank cut its refinancing rate from 0.75% to the historic low of 0.50%.
During the same period, the Federal Reserve Bank left its own refinancing rate unchanged in the range between 0%
and 0.25%.
Financial Markets
The uncertain evolution of the peripheral country sovereign debt crisis in the Eurozone caused volatility on interna-
tional financial markets during the first several months of 1H 2013. In February and March, the risk of political
chaos loomed after parliamentary elections in Italy and implementation of a bailout plan for Cyprus (which was
significant for the nature of measures used), driving up yields on Italian and Spanish treasuries, pushing down yields
on German treasuries and causing European stock markets to underperform markets elsewhere in the world. In 2Q
2013 financial markets were initially impacted by positive developments in the sovereign debt crisis in peripheral
Eurozone countries and, subsequently, the announced curtailment by the Federal Reserve Bank of its program to
buy back treasuries, aimed at cutting yields and boosting the money supply (quantitative easing). In contrast with
its March meeting, on May 1 the Federal Reserve Bank explicitly announced the possibility of both expanding and
curtailing its buyback program, according to developments in the economy. That announcement and subsequent sta-
tements by the Chairman of the Federal Reserve bank and its most influential members suddenly drove up yields
sharply on the principal bond markets.
Between December 31, 2012 and June 28, 2013, the government bond yield curve rose in the United States (from
0.25% to 0.36% for 2-year notes and from 1.76% to 2.49% for 10-year notes) and in Germany (from -0.02%
to +0.19% for 2-year notes and from 1.32% to 1.73% for 10-year notes). Average yields rose on emerging country
bond markets from 4.28% to 5.17% (Barclays EM Hard Currency Aggregate Yield To Worst index) and on high-
yield bonds markets from 6.13% to 6.66% (Barclays US Corporate High Yield Yield To Worst index).
The spread between Italian and German 10-year notes rose from 318 basis points on December 31, 2012 to 347
bp on March 29, 2013, and then fell back to 282 bp on June 28, 2013, while the spread on 2-year notes fell from
200 bp on December 31, 2012 to 194 bp on March 29, 2013 and 175 bp on June 28, 2013. The Italian treasuries
yield curve changed as follows between December 31, 2012 and June 28, 2013: from 1.38% to 1.21% on 1-year
notes, from 1.99% to 1.93% on 2-year notes, and from 4.50% to 4.55% on 10-year notes.
Global stock markets rose by 8.8% overall between December 31, 2012 and June 28, 2013 (MSCI World dollar
index). In the United States, the S&P500 rose by 12.6% and the Nasdaq Composite by 12.7%. European stock
markets were up 1.9% on average. More specifically, the Italian market (-6.3%) and Spanish market (-5%) under-
performed the German market (+4.6%), French market (+2.7%) and English market (+5.4%). Emerging markets
were down by 9.5% (MSCI EM dollar index).
During the April 4, 2013 trading session, the yen fell sharply against all major currencies following the announce-
ment of new and unexpected measures by the new governor of the Bank of Japan, Kuroda, aimed at realising an

8
HALF-YEAR FINANCIALREPORT
2013
inflation target of 2% within the next two years. The BOJ voted unanimously to set the level of money supply as the
new target for its operations (which totalled JPY 138,000 billion at December 31, 2012, or USD 1,452 billion),
instead of the overnight rate. The BOJ will pursue the aim of annually increasing the money supply by JPY 70,000
billion until it reaches JPY 270,000 billion in 2014. It also decided to buy treasury notes and bonds with maturi-
ties of up to 40 years for a monthly outlay of JPY 7,000 billion. The new monetary policy adopted by the Japanese
central bank and statements by Prime Minister Abe on the expected reform plan caused the yen to weaken (with
the exchange rate slipping from 86.7 to 99.1 yen to the dollar, and from 114.5 to 129 yen to the Euro between
December 31, 2012 and June 28, 2013) and the sharp rebound (+31.6%) and volatility on the Tokyo Stock
Exchange.
The U.S. dollar remained substantially stable against the Euro (moving from USD 1.32/Euro at December 31, 2013
to USD 1.28/Euro on March 29, 2013 and USD 1.30/Euro on June 28, 2013). A correction on emerging markets
resulted in specific local currencies softening against both the dollar and the Euro.
Performance of the Mediolanum Group
Net inflows on the domestic market totalled a positive €1,087.6 million in 1H 2013 compared with €1,370.9 mil-
lion year-on-year (-21%).
Banca Mediolanum had positive net inflows of €1,233.0 million in the first half of the year, compared with a posi-
tive €1,760.1 million in 1H 2012 (-30%), of which a positive €1,585.5 million into asset management products,
and which in the first six months of 2013 topped the level achieved for all of 2012 (December 31, 2012: €1,552.9
million).
Specifically, mutual funds recorded net inflows of €2,577.7 million (June 30, 2012: €868.7 million), topping even
the recent annual record set in 2012 (December 31, 2012: €2,343.3 million).
In contrast, life insurance products had net outflows of €992.8 million (June 30, 2012: net outflows of €311.3 mil-
lion). Net inflows generated by sales of third-party structured bonds also fell sharply, from €105.2 million in 1H
2012 to €0.7 million in 1H 2013.
The Mediolanum Plus insurance policy associated with the Freedom bank account posted a negative balance of
€1,395.4 million, compared with a negative balance of €422.1 million at June 30, 2012.
Net inflows into administered assets totalled €1,042.8 million, compared with €1,519.6 million in 1H 2012.
Including the Freedom policies, net outflows from administered assets aggregated to €352.6 million, compared with
net inflows of €1,097.4 million in 1H 2012.
Net inflows data released by the principal sales networks operating in Italy in 1H 2013, published by the financial
newspaper Il Sole 24 Ore, show that Banca Mediolanum was ranked sixth, with net inflows of €1,263 million.
Data relating to net inflows into mutual funds released by Assogestioni, show that the market share of the
Mediolanum Group rose from 4.93% at December 31, 2013 to 5.14% at June 30, 2013, with it holding steady at
sixth place in terms of volumes of managed assets.
At June 30, 2013 the Mediolanum Group had €53,510.6 million in assets under management and administration,
up €1,933.7 million from €51,576.9 million at December 31, 2012, and up €4,426.1 million from €49,084.5 mil-
lion at June 30, 2012.
9
INTERIM MANAGEMENTREPORT
The contraction in the sales network was reversed, with the number of Banca Mediolanum Family Bankers rising to
4,367 from 4,315 at December 31, 2012, with very low turnover on an annualised basis (4.9%). The average port-
folio managed by each Family Banker amounts to about €9.7 million pro capita.
First Half 2013 Commercial Ventures
The “Ogni mese” service has had strong net inflows since it was launched in November 2012, amounting to €3.6
billion, of which about €1.1 billion invested by customers who fully accepted the service strategy by subscribing to
four or more funds as part of this service.
In regard to banking products, the rates offered for funds deposited on the “Inmediolanum” account remained high
as compared to market rates (2.8% at June 30, 2013), while the rates offered on the “Freedom+” bank account,
which remains the principal tool for attracting new customers who want full banking services, are lower than those
offered by the “Inmediolanum” deposit account (2% at June 30, 2013), but are still competitive with the rates
offered by other Italian banks.
The “Mediolanum Plus” policy is instead undergoing major net outflows towards other Group products, with its net
balance amounting to €2.04 billion at June 30, 2013.
Overall, the strategy of attracting new customers through bank products is producing excellent results in terms of
cross-selling, with the percentage of assets invested in managed asset products amounting to 52% four years after
the deposit account is opened. Bank customer loyalty programs continued in the first half of the year, with the per-
centage of account holders using Banca Mediolanum as their “primary bank” amounting to 55%, (up 17% from
the previous year) and the percentage of account holders who have their only current account at Banca Mediolanum
amounting to 40%.
In regard to asset management, several Mediolanum Best Brands products are offered, including B-class shares for
distribution of earnings, and specifically:
• the Moderate Collection product, renamed Premium Coupon Collection;
• the Aggressive Collection product, renamed Equity Power Coupon Collection;
• the Mediolanum Pimco Inflation Strategy Selection product.
The changes that have been made, and especially the introduction of B-class shares, make it possible to offer finan-
cial instruments that better satisfy the current needs of customers, who are constantly searching for products that
offer a stable, periodic return in the face of volatile and uncertain market conditions.
At the national convention held in Pesaro on June 4-5, 2013, Mediolanum Best Brands line was further expanded
with four new products:
• Singlebrand products (Selection line): Mediolanum Invesco Balanced Risk Coupon Selection and Mediolanum
Carmignac Strategic Selection;
• Multibrand products (Collection line): Infrastructure Opportunity Collection and Convertible Strategy
Collection.
The start of sales of third-party mutual funds was also announced at the national convention, after the signing of
specific placement agreements with 10 major independent investment firms.
10
HALF-YEAR FINANCIALREPORT
2013
Issue of Mediolanum Notes
In implementation of the resolution by the Board of Directors of Banca Mediolanum S.p.A. on May 8, 2013, the
issuance of subordinated notes for a maximum aggregate total of €200,000,000.00 (two hundred million) was
resolved to further reinforce the capital of Banca Mediolanum. This issue adheres to the provisions of the ICAAP
strategic plan approved by the Board of Directors on April 22, 2013, realising benefits both in regard to the ratio
between liabilities and assets (as part of ALM), and in regard to second pillar capital requirements (PILLAR II).
The subordinated notes issued by the Bank were consequently placed in May and June.
The key features of this bond issue are illustrated as follows:
6-year Lower Tier II Fixed-rate Subordinated Notes.
Amount offered: nominal value up to €200 million.
Minimum allowed subscription amount: €100,000 per investor.
Repayment of principal: over five years in equal instalments of 20% of the subscribed nominal capital.
Coupons: semi-annual, bearing 4.5% gross per annum.
Settlement date: June 27, 2013.
Maturity date: June 27, 2019.
At June 27, 2013 these notes had been subscribed by 538 investors for a total of €74,147,000.
11
INTERIM MANAGEMENTREPORT
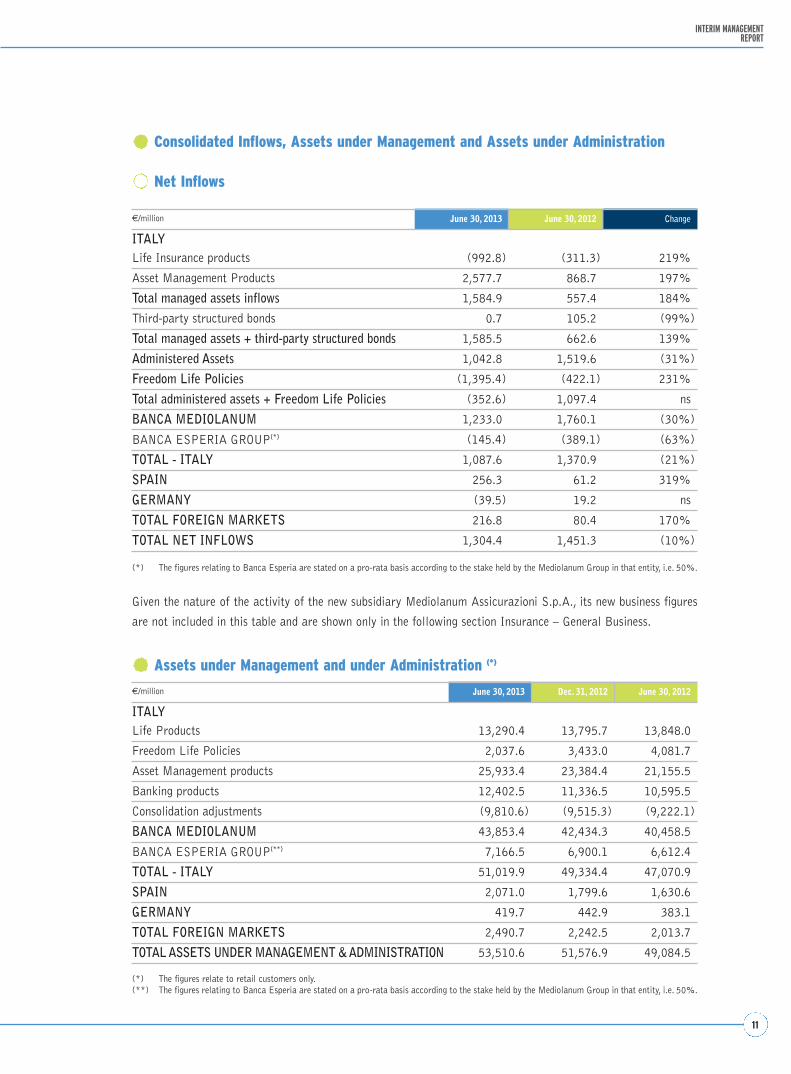
Assets under Management and under Administration (*)
Consolidated Inflows, Assets under Management and Assets under Administration
Net Inflows
Given the nature of the activity of the new subsidiary Mediolanum Assicurazioni S.p.A., its new business figures
are not included in this table and are shown only in the following section Insurance – General Business.
€/million June 30, 2013 Dec. 31, 2012 June 30, 2012
ITALYLife Products 13,290.4 13,795.7 13,848.0
Freedom Life Policies 2,037.6 3,433.0 4,081.7
Asset Management products 25,933.4 23,384.4 21,155.5
Banking products 12,402.5 11,336.5 10,595.5
Consolidation adjustments (9,810.6) (9,515.3) (9,222.1)
BANCA MEDIOLANUM 43,853.4 42,434.3 40,458.5
BANCA ESPERIA GROUP(**) 7,166.5 6,900.1 6,612.4
TOTAL - ITALY 51,019.9 49,334.4 47,070.9
SPAIN 2,071.0 1,799.6 1,630.6
GERMANY 419.7 442.9 383.1
TOTAL FOREIGN MARKETS 2,490.7 2,242.5 2,013.7
TOTAL ASSETS UNDER MANAGEMENT & ADMINISTRATION 53,510.6 51,576.9 49,084.5
€/million June 30, 2013 June 30, 2012 Change
ITALYLife Insurance products (992.8) (311.3) 219%
Asset Management Products 2,577.7 868.7 197%
Total managed assets inflows 1,584.9 557.4 184%
Third-party structured bonds 0.7 105.2 (99%)
Total managed assets + third-party structured bonds 1,585.5 662.6 139%
Administered Assets 1,042.8 1,519.6 (31%)
Freedom Life Policies (1,395.4) (422.1) 231%
Total administered assets + Freedom Life Policies (352.6) 1,097.4 ns
BANCA MEDIOLANUM 1,233.0 1,760.1 (30%)
BANCA ESPERIA GROUP(*) (145.4) (389.1) (63%)
TOTAL - ITALY 1,087.6 1,370.9 (21%)
SPAIN 256.3 61.2 319%
GERMANY (39.5) 19.2 ns
TOTAL FOREIGN MARKETS 216.8 80.4 170%
TOTAL NET INFLOWS 1,304.4 1,451.3 (10%)
(*) The figures relating to Banca Esperia are stated on a pro-rata basis according to the stake held by the Mediolanum Group in that entity, i.e. 50%.
(*) The figures relate to retail customers only.(**) The figures relating to Banca Esperia are stated on a pro-rata basis according to the stake held by the Mediolanum Group in that entity, i.e. 50%.
12
HALF-YEAR FINANCIALREPORT
2013
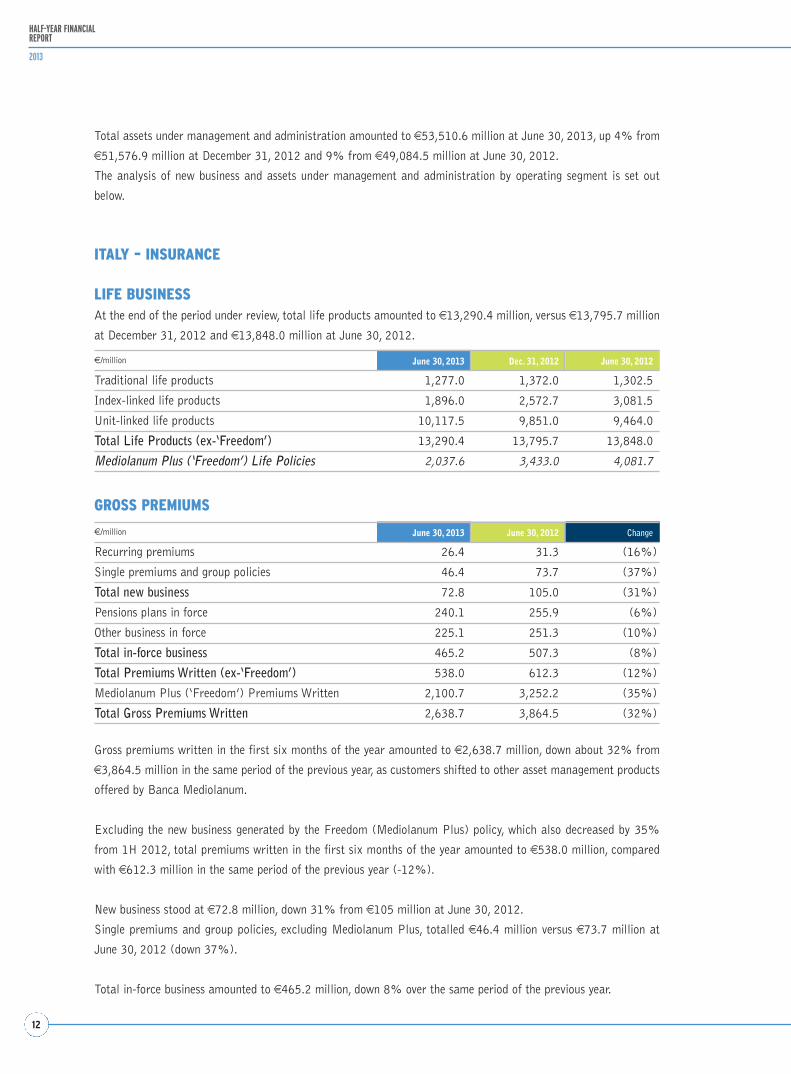
Gross premiums written in the first six months of the year amounted to €2,638.7 million, down about 32% from
€3,864.5 million in the same period of the previous year, as customers shifted to other asset management products
offered by Banca Mediolanum.
Excluding the new business generated by the Freedom (Mediolanum Plus) policy, which also decreased by 35%
from 1H 2012, total premiums written in the first six months of the year amounted to €538.0 million, compared
with €612.3 million in the same period of the previous year (-12%).
New business stood at €72.8 million, down 31% from €105 million at June 30, 2012.
Single premiums and group policies, excluding Mediolanum Plus, totalled €46.4 million versus €73.7 million at
June 30, 2012 (down 37%).
Total in-force business amounted to €465.2 million, down 8% over the same period of the previous year.
GROSS PREMIUMS
€/million June 30, 2013 Dec. 31, 2012 June 30, 2012
Traditional life products 1,277.0 1,372.0 1,302.5
Index-linked life products 1,896.0 2,572.7 3,081.5
Unit-linked life products 10,117.5 9,851.0 9,464.0
Total Life Products (ex-‘Freedom’) 13,290.4 13,795.7 13,848.0
Mediolanum Plus (‘Freedom’) Life Policies 2,037.6 3,433.0 4,081.7
€/million June 30, 2013 June 30, 2012 Change
Recurring premiums 26.4 31.3 (16%)
Single premiums and group policies 46.4 73.7 (37%)
Total new business 72.8 105.0 (31%)
Pensions plans in force 240.1 255.9 (6%)
Other business in force 225.1 251.3 (10%)
Total in-force business 465.2 507.3 (8%)
Total Premiums Written (ex-‘Freedom’) 538.0 612.3 (12%)
Mediolanum Plus (‘Freedom’) Premiums Written 2,100.7 3,252.2 (35%)
Total Gross Premiums Written 2,638.7 3,864.5 (32%)
Total assets under management and administration amounted to €53,510.6 million at June 30, 2013, up 4% from
€51,576.9 million at December 31, 2012 and 9% from €49,084.5 million at June 30, 2012.
The analysis of new business and assets under management and administration by operating segment is set out
below.
ITALY – INSURANCE
LIFE BUSINESSAt the end of the period under review, total life products amounted to €13,290.4 million, versus €13,795.7 million
at December 31, 2012 and €13,848.0 million at June 30, 2012.
13
INTERIM MANAGEMENTREPORT
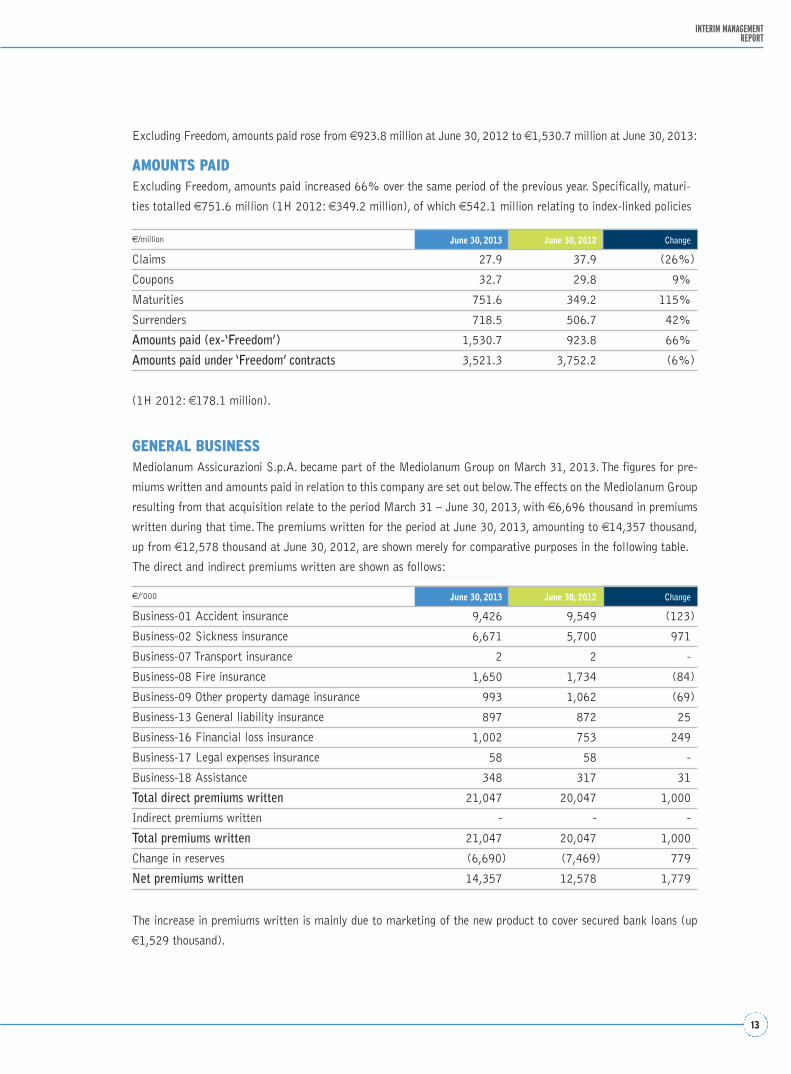
€/’000 June 30, 2013 June 30, 2012 Change
Business-01 Accident insurance 9,426 9,549 (123)
Business-02 Sickness insurance 6,671 5,700 971
Business-07 Transport insurance 2 2 -
Business-08 Fire insurance 1,650 1,734 (84)
Business-09 Other property damage insurance 993 1,062 (69)
Business-13 General liability insurance 897 872 25
Business-16 Financial loss insurance 1,002 753 249
Business-17 Legal expenses insurance 58 58 -
Business-18 Assistance 348 317 31
Total direct premiums written 21,047 20,047 1,000
Indirect premiums written - - -
Total premiums written 21,047 20,047 1,000
Change in reserves (6,690) (7,469) 779
Net premiums written 14,357 12,578 1,779
(1H 2012: €178.1 million).
GENERAL BUSINESSMediolanum Assicurazioni S.p.A. became part of the Mediolanum Group on March 31, 2013. The figures for pre-
miums written and amounts paid in relation to this company are set out below. The effects on the Mediolanum Group
resulting from that acquisition relate to the period March 31 – June 30, 2013, with €6,696 thousand in premiums
written during that time. The premiums written for the period at June 30, 2013, amounting to €14,357 thousand,
up from €12,578 thousand at June 30, 2012, are shown merely for comparative purposes in the following table.
The direct and indirect premiums written are shown as follows:
€/million June 30, 2013 June 30, 2012 Change
Claims 27.9 37.9 (26%)
Coupons 32.7 29.8 9%
Maturities 751.6 349.2 115%
Surrenders 718.5 506.7 42%
Amounts paid (ex-‘Freedom’) 1,530.7 923.8 66%
Amounts paid under ‘Freedom’ contracts 3,521.3 3,752.2 (6%)
Excluding Freedom, amounts paid rose from €923.8 million at June 30, 2012 to €1,530.7 million at June 30, 2013:
AMOUNTS PAIDExcluding Freedom, amounts paid increased 66% over the same period of the previous year. Specifically, maturi-
ties totalled €751.6 million (1H 2012: €349.2 million), of which €542.1 million relating to index-linked policies
The increase in premiums written is mainly due to marketing of the new product to cover secured bank loans (up
€1,529 thousand).
14
HALF-YEAR FINANCIALREPORT
2013
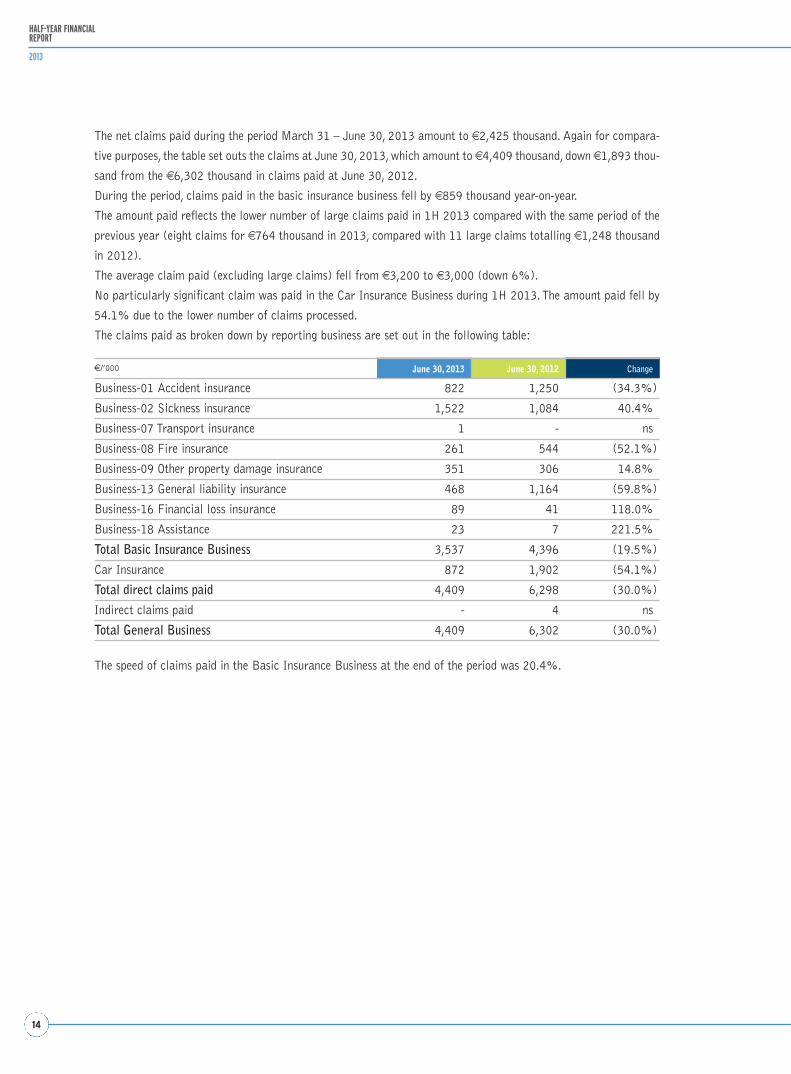
€/’000 June 30, 2013 June 30, 2012 Change
Business-01 Accident insurance 822 1,250 (34.3%)
Business-02 Sickness insurance 1,522 1,084 40.4%
Business-07 Transport insurance 1 - ns
Business-08 Fire insurance 261 544 (52.1%)
Business-09 Other property damage insurance 351 306 14.8%
Business-13 General liability insurance 468 1,164 (59.8%)
Business-16 Financial loss insurance 89 41 118.0%
Business-18 Assistance 23 7 221.5%
Total Basic Insurance Business 3,537 4,396 (19.5%)
Car Insurance 872 1,902 (54.1%)
Total direct claims paid 4,409 6,298 (30.0%)
Indirect claims paid - 4 ns
Total General Business 4,409 6,302 (30.0%)
The net claims paid during the period March 31 – June 30, 2013 amount to €2,425 thousand. Again for compara-
tive purposes, the table set outs the claims at June 30, 2013, which amount to €4,409 thousand, down €1,893 thou-
sand from the €6,302 thousand in claims paid at June 30, 2012.
During the period, claims paid in the basic insurance business fell by €859 thousand year-on-year.
The amount paid reflects the lower number of large claims paid in 1H 2013 compared with the same period of the
previous year (eight claims for €764 thousand in 2013, compared with 11 large claims totalling €1,248 thousand
in 2012).
The average claim paid (excluding large claims) fell from €3,200 to €3,000 (down 6%).
No particularly significant claim was paid in the Car Insurance Business during 1H 2013. The amount paid fell by
54.1% due to the lower number of claims processed.
The claims paid as broken down by reporting business are set out in the following table:
The speed of claims paid in the Basic Insurance Business at the end of the period was 20.4%.
15
INTERIM MANAGEMENTREPORT
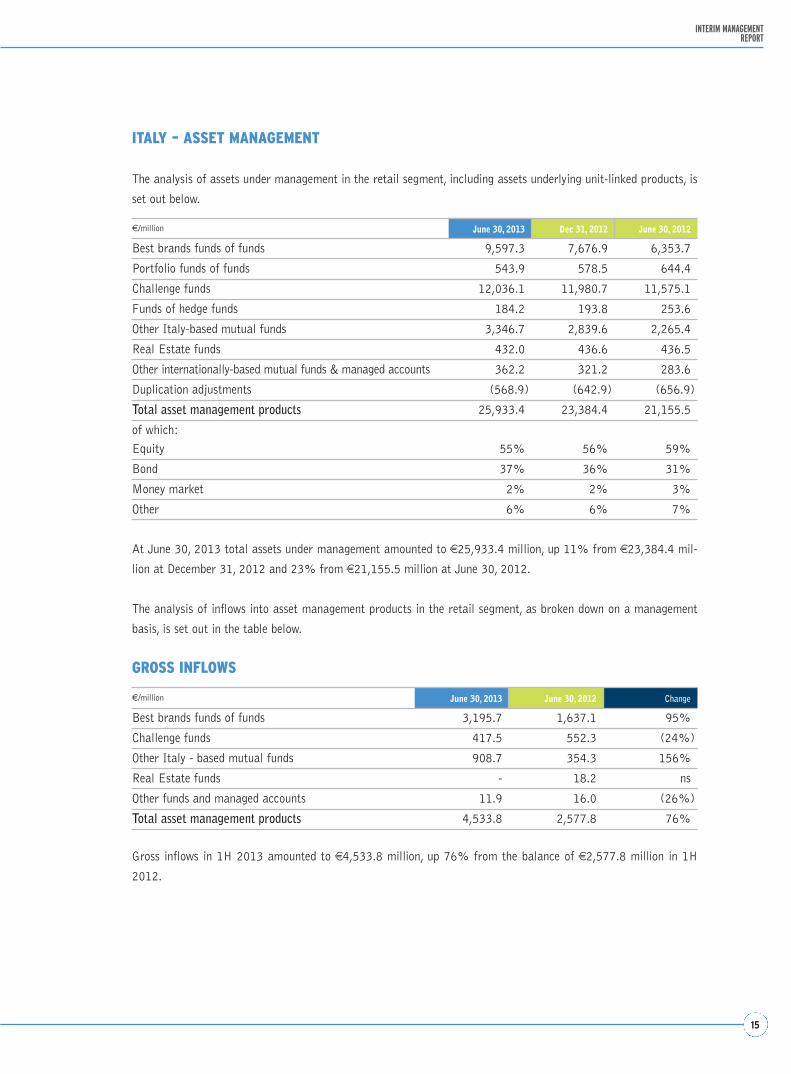
€/million June 30, 2013 June 30, 2012 Change
Best brands funds of funds 3,195.7 1,637.1 95%
Challenge funds 417.5 552.3 (24%)
Other Italy - based mutual funds 908.7 354.3 156%
Real Estate funds - 18.2 ns
Other funds and managed accounts 11.9 16.0 (26%)
Total asset management products 4,533.8 2,577.8 76%
€/million June 30, 2013 Dec 31, 2012 June 30, 2012
Best brands funds of funds 9,597.3 7,676.9 6,353.7
Portfolio funds of funds 543.9 578.5 644.4
Challenge funds 12,036.1 11,980.7 11,575.1
Funds of hedge funds 184.2 193.8 253.6
Other Italy-based mutual funds 3,346.7 2,839.6 2,265.4
Real Estate funds 432.0 436.6 436.5
Other internationally-based mutual funds & managed accounts 362.2 321.2 283.6
Duplication adjustments (568.9) (642.9) (656.9)
Total asset management products 25,933.4 23,384.4 21,155.5
of which:
Equity 55% 56% 59%
Bond 37% 36% 31%
Money market 2% 2% 3%
Other 6% 6% 7%
At June 30, 2013 total assets under management amounted to €25,933.4 million, up 11% from €23,384.4 mil-
lion at December 31, 2012 and 23% from €21,155.5 million at June 30, 2012.
The analysis of inflows into asset management products in the retail segment, as broken down on a management
basis, is set out in the table below.
GROSS INFLOWS
ITALY – ASSET MANAGEMENT
The analysis of assets under management in the retail segment, including assets underlying unit-linked products, is
set out below.
Gross inflows in 1H 2013 amounted to €4,533.8 million, up 76% from the balance of €2,577.8 million in 1H
2012.
16
HALF-YEAR FINANCIALREPORT
2013
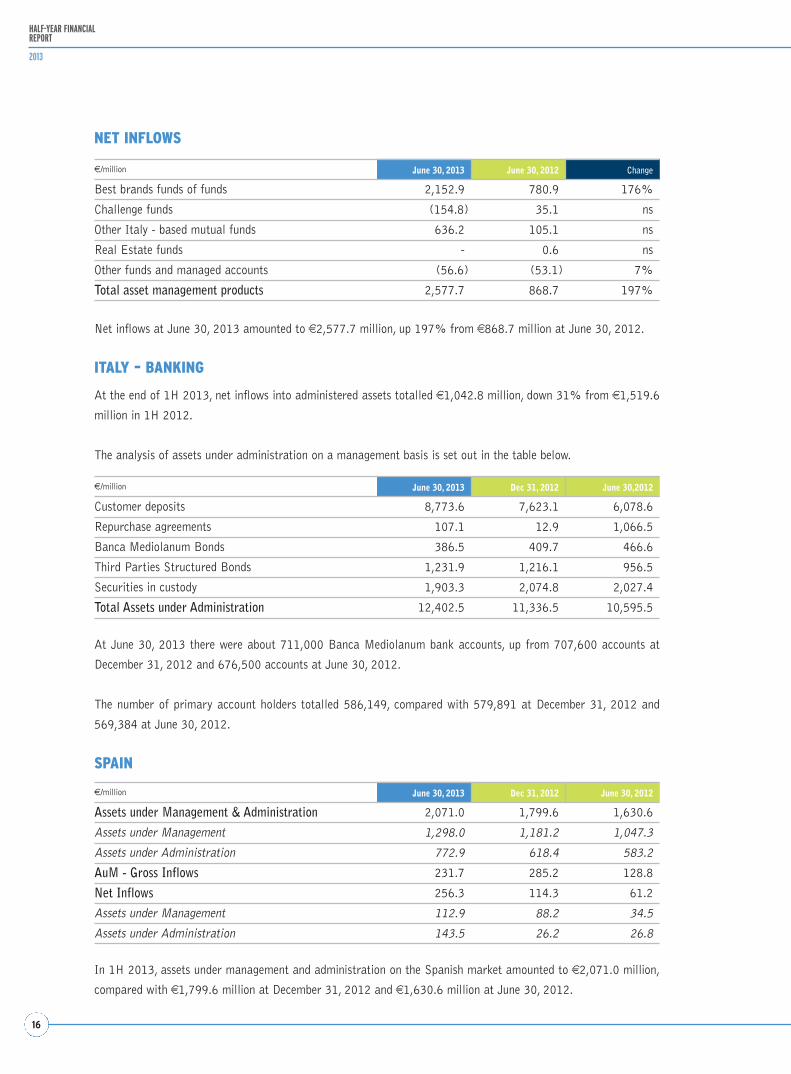
€/million June 30, 2013 Dec 31, 2012 June 30, 2012
Assets under Management & Administration 2,071.0 1,799.6 1,630.6
Assets under Management 1,298.0 1,181.2 1,047.3
Assets under Administration 772.9 618.4 583.2
AuM - Gross Inflows 231.7 285.2 128.8
Net Inflows 256.3 114.3 61.2
Assets under Management 112.9 88.2 34.5
Assets under Administration 143.5 26.2 26.8
€/million June 30, 2013 Dec 31, 2012 June 30,2012
Customer deposits 8,773.6 7,623.1 6,078.6
Repurchase agreements 107.1 12.9 1,066.5
Banca Mediolanum Bonds 386.5 409.7 466.6
Third Parties Structured Bonds 1,231.9 1,216.1 956.5
Securities in custody 1,903.3 2,074.8 2,027.4
Total Assets under Administration 12,402.5 11,336.5 10,595.5
Net inflows at June 30, 2013 amounted to €2,577.7 million, up 197% from €868.7 million at June 30, 2012.
ITALY – BANKING
At the end of 1H 2013, net inflows into administered assets totalled €1,042.8 million, down 31% from €1,519.6
million in 1H 2012.
The analysis of assets under administration on a management basis is set out in the table below.
At June 30, 2013 there were about 711,000 Banca Mediolanum bank accounts, up from 707,600 accounts at
December 31, 2012 and 676,500 accounts at June 30, 2012.
The number of primary account holders totalled 586,149, compared with 579,891 at December 31, 2012 and
569,384 at June 30, 2012.
SPAIN
NET INFLOWS
€/million June 30, 2013 June 30, 2012 Change
Best brands funds of funds 2,152.9 780.9 176%
Challenge funds (154.8) 35.1 ns
Other Italy - based mutual funds 636.2 105.1 ns
Real Estate funds - 0.6 ns
Other funds and managed accounts (56.6) (53.1) 7%
Total asset management products 2,577.7 868.7 197%
In 1H 2013, assets under management and administration on the Spanish market amounted to €2,071.0 million,
compared with €1,799.6 million at December 31, 2012 and €1,630.6 million at June 30, 2012.
17
INTERIM MANAGEMENTREPORT
Number June 30, 2013 Dec 31, 2012 June 30, 2012
Licensed financial advisors 4,367 4,315 4,432
BANCA MEDIOLANUM 4,367 4,315 4,432
SPAIN 630 590 555
GERMANY 45 46 43
Total 5,042 4,951 5,030
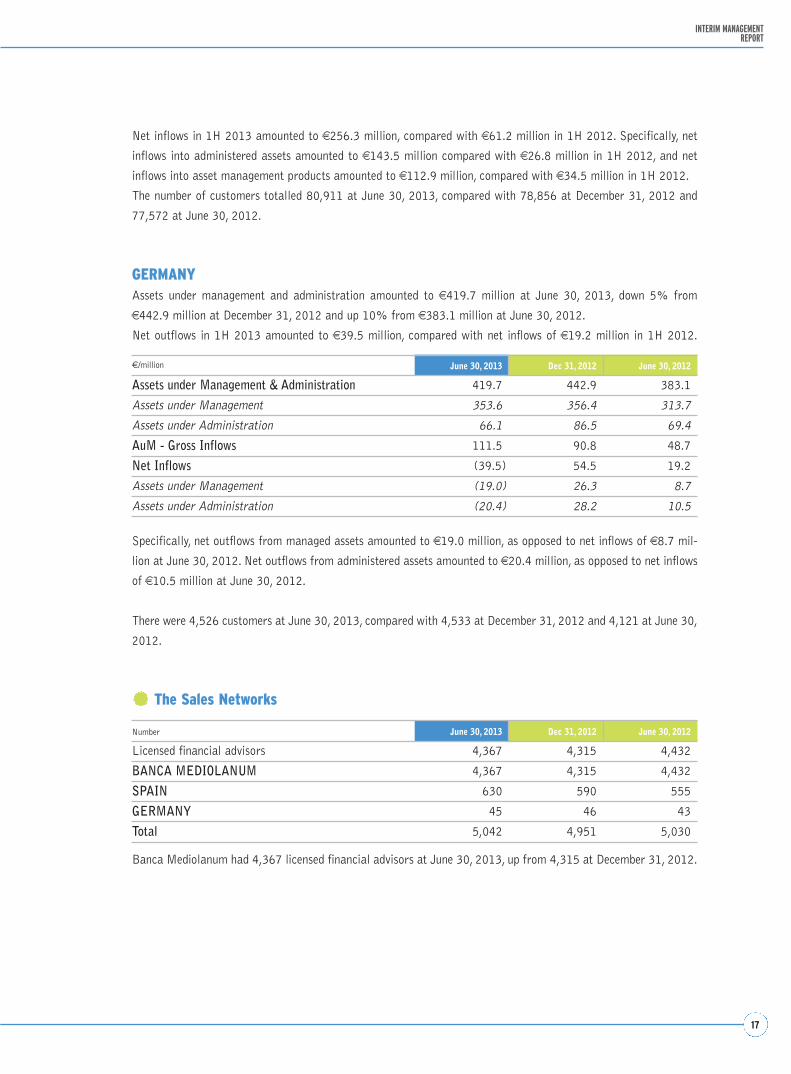
Banca Mediolanum had 4,367 licensed financial advisors at June 30, 2013, up from 4,315 at December 31, 2012.
€/million June 30, 2013 Dec 31, 2012 June 30, 2012
Assets under Management & Administration 419.7 442.9 383.1
Assets under Management 353.6 356.4 313.7
Assets under Administration 66.1 86.5 69.4
AuM - Gross Inflows 111.5 90.8 48.7
Net Inflows (39.5) 54.5 19.2
Assets under Management (19.0) 26.3 8.7
Assets under Administration (20.4) 28.2 10.5
Net inflows in 1H 2013 amounted to €256.3 million, compared with €61.2 million in 1H 2012. Specifically, net
inflows into administered assets amounted to €143.5 million compared with €26.8 million in 1H 2012, and net
inflows into asset management products amounted to €112.9 million, compared with €34.5 million in 1H 2012.
The number of customers totalled 80,911 at June 30, 2013, compared with 78,856 at December 31, 2012 and
77,572 at June 30, 2012.
GERMANYAssets under management and administration amounted to €419.7 million at June 30, 2013, down 5% from
€442.9 million at December 31, 2012 and up 10% from €383.1 million at June 30, 2012.
Net outflows in 1H 2013 amounted to €39.5 million, compared with net inflows of €19.2 million in 1H 2012.
Specifically, net outflows from managed assets amounted to €19.0 million, as opposed to net inflows of €8.7 mil-
lion at June 30, 2012. Net outflows from administered assets amounted to €20.4 million, as opposed to net inflows
of €10.5 million at June 30, 2012.
There were 4,526 customers at June 30, 2013, compared with 4,533 at December 31, 2012 and 4,121 at June 30,
2012.
The Sales Networks
18
HALF-YEAR FINANCIALREPORT
2013
Reclassified Consolidated Income Statement at June 30, 2013(*)
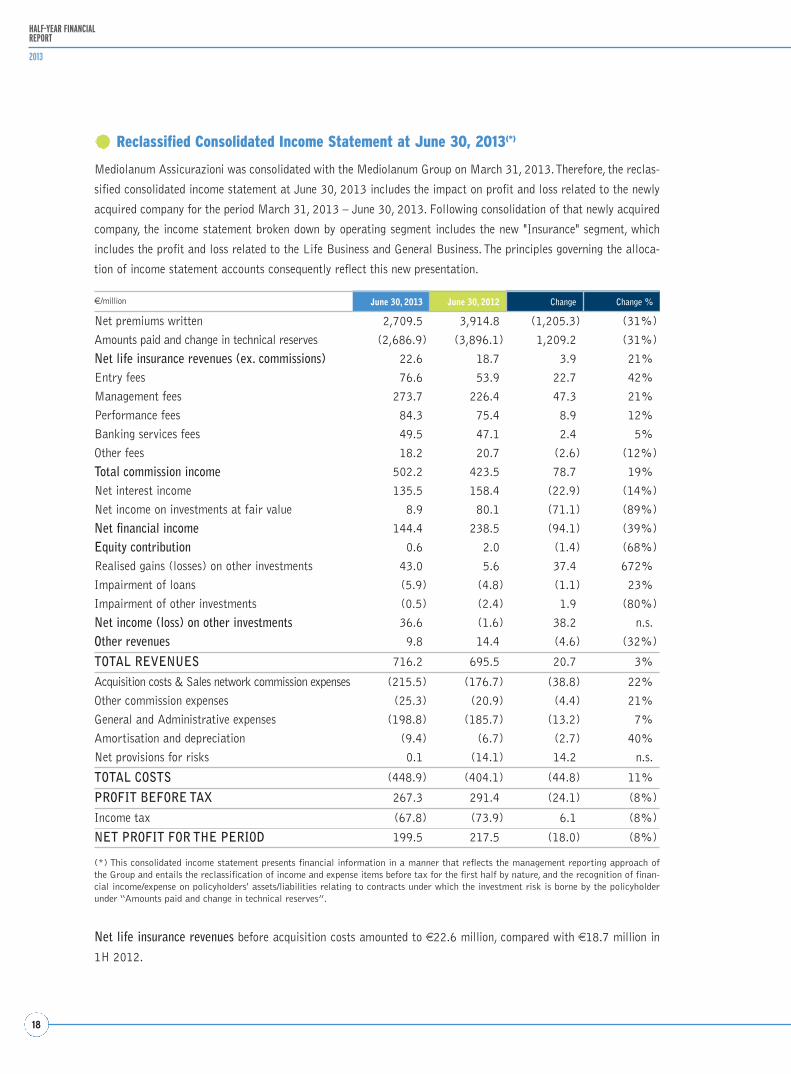
Mediolanum Assicurazioni was consolidated with the Mediolanum Group on March 31, 2013. Therefore, the reclas-
sified consolidated income statement at June 30, 2013 includes the impact on profit and loss related to the newly
acquired company for the period March 31, 2013 – June 30, 2013. Following consolidation of that newly acquired
company, the income statement broken down by operating segment includes the new "Insurance" segment, which
includes the profit and loss related to the Life Business and General Business. The principles governing the alloca-
tion of income statement accounts consequently reflect this new presentation.
€/million June 30, 2013 June 30, 2012 Change Change %
Net premiums written 2,709.5 3,914.8 (1,205.3) (31%)
Amounts paid and change in technical reserves (2,686.9) (3,896.1) 1,209.2 (31%)
Net life insurance revenues (ex. commissions) 22.6 18.7 3.9 21%
Entry fees 76.6 53.9 22.7 42%
Management fees 273.7 226.4 47.3 21%
Performance fees 84.3 75.4 8.9 12%
Banking services fees 49.5 47.1 2.4 5%
Other fees 18.2 20.7 (2.6) (12%)
Total commission income 502.2 423.5 78.7 19%
Net interest income 135.5 158.4 (22.9) (14%)
Net income on investments at fair value 8.9 80.1 (71.1) (89%)
Net financial income 144.4 238.5 (94.1) (39%)
Equity contribution 0.6 2.0 (1.4) (68%)
Realised gains (losses) on other investments 43.0 5.6 37.4 672%
Impairment of loans (5.9) (4.8) (1.1) 23%
Impairment of other investments (0.5) (2.4) 1.9 (80%)
Net income (loss) on other investments 36.6 (1.6) 38.2 n.s.
Other revenues 9.8 14.4 (4.6) (32%)
TOTAL REVENUES 716.2 695.5 20.7 3%
Acquisition costs & Sales network commission expenses (215.5) (176.7) (38.8) 22%
Other commission expenses (25.3) (20.9) (4.4) 21%
General and Administrative expenses (198.8) (185.7) (13.2) 7%
Amortisation and depreciation (9.4) (6.7) (2.7) 40%
Net provisions for risks 0.1 (14.1) 14.2 n.s.
TOTAL COSTS (448.9) (404.1) (44.8) 11%
PROFIT BEFORE TAX 267.3 291.4 (24.1) (8%)
Income tax (67.8) (73.9) 6.1 (8%)
NET PROFIT FOR THE PERIOD 199.5 217.5 (18.0) (8%)
(*) This consolidated income statement presents financial information in a manner that reflects the management reporting approach ofthe Group and entails the reclassification of income and expense items before tax for the first half by nature, and the recognition of finan-cial income/expense on policyholders' assets/liabilities relating to contracts under which the investment risk is borne by the policyholderunder “Amounts paid and change in technical reserves”.
Net life insurance revenues before acquisition costs amounted to €22.6 million, compared with €18.7 million in
1H 2012.

19
INTERIM MANAGEMENTREPORT
Specifically, net premiums written in 1H 2013 amounted to €2,709.5 million, down 31% from €3,914.8 million
in 1H 2012. The decline in net premiums was principally driven by reduced inflows into the Freedom policy, which
fell by 35% or €1,151.5 million.
Total amounts paid and change in reserves fell 31%, from €3,896.1 million at June 30, 2012 to €2,686.9 million
at June 30, 2013, of which €3,521.3 million relating to the policies associated with the Freedom bank account
(June 30, 2012: €3,752.2 million).
For the first six months of the year, total commission income amounted to €502.2 million, up from €423.5 million
at June 30, 2012. The €78.7 million increase was mainly driven by management fees (up €47.3 million), entry fees
(up €22.7 million) and performance fees (up €8.9 million).
Net financial income fell 39%, from €238.5 million in 1H 2012 to €144.4 million at the end of 1H 2013, for a
decrease of €94.1 million.
This decrease stemmed from the fall in net interest income (down €22.9 million), due to the reduced spread on mar-
ket rates. This was partly offset by the higher volume of assets and lower net income on financial assets at fair value,
which fell 89% from €80.1 million in 1H 2012 to €8.9 million in 1H 2013.
The equity contribution fell from €2.0 million in 1H 2012 to €0.6 million in 1H 2013. This account reflects both
the allocable portion of the €3.6 million net profit generated during the period by the investment in the Banca
Esperia Group (€2.0 million at June 30, 2012) and the €3.0 million net loss of Mediobanca S.p.A.
Net income on other investments had a positive balance of €36.6 million, as opposed to a negative balance of €1.6
million in 1H 2012. This was mainly due to the effect of net gains on disposal of available for sale financial assets
(€37.1 million).
Acquisition costs and sales network commission expenses rose from €176.7 million in 1H 2012 to €215.5 million
at the end of 1H 2013. The €38.8 million increase reflects the greater commission expenses on higher sales volu-
mes of mutual funds, higher management fees due to the increase in assets under management, greater amounts
provided for sales network incentives, and higher accruals for sales agent severance indemnities (FIRR and
Enasarco) due to changes in calculation rules.
Net of commission expenses, total costs amounted to €208.1 million, up €1.6 million from the €206.5 million
posted in 1H 2012.
Net provisions for risks fell by €14.2 million and mainly reflect lower provisions by Banca Mediolanum, largely due
to the reversal of €6.4 million reversal in provisions for legal disputes and €2.6 million in lower provisions for
unlawful activity by licensed financial advisors.
General and administrative expenses increased by €13.2 million for higher personnel expense, largely related to
Banca Mediolanum following the increase in average payroll, and for the administrative expenses of Banca
Mediolanum related to information systems, consultancy, organisation of conventions and postal expenses.
Income tax for the period fell from €73.9 million at June 30, 2012 to €67.8 million at June 30, 2013 (tax rate:
25.37%).
20
HALF-YEAR FINANCIALREPORT
2013
The analysis of changes in income statement data by operating segment is set out below.
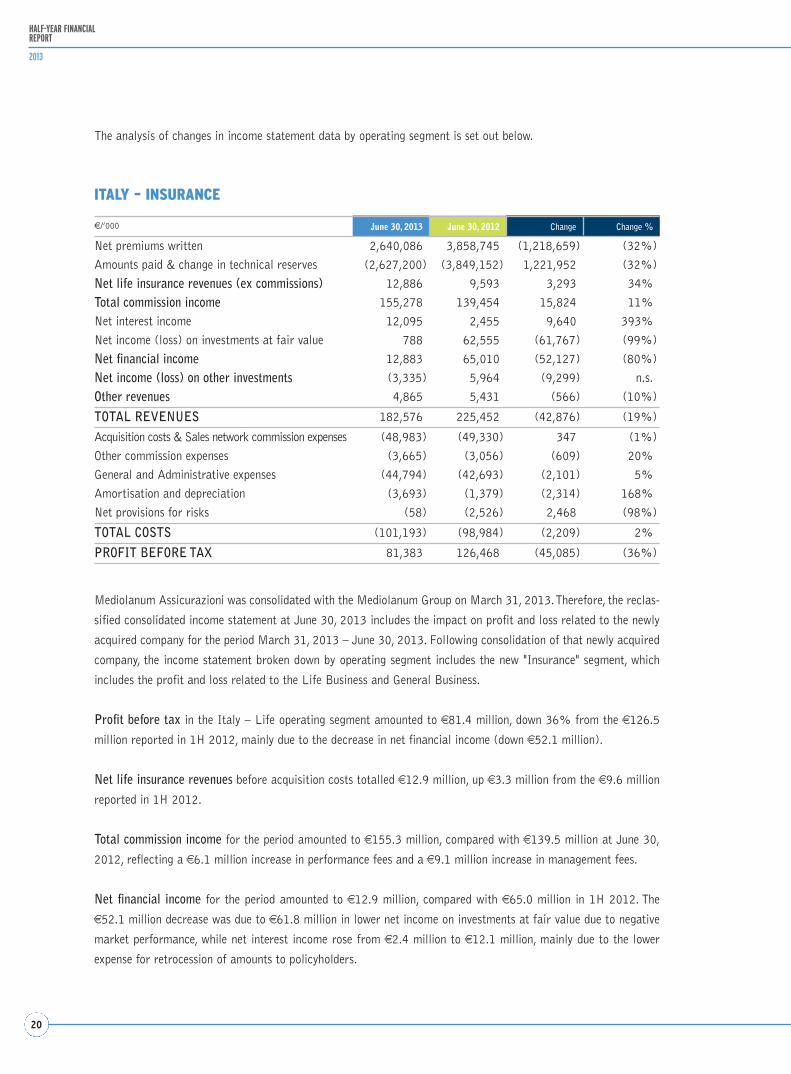
ITALY – INSURANCE
€/’000 June 30, 2013 June 30, 2012 Change Change %
Net premiums written 2,640,086 3,858,745 (1,218,659) (32%)
Amounts paid & change in technical reserves (2,627,200) (3,849,152) 1,221,952 (32%)
Net life insurance revenues (ex commissions) 12,886 9,593 3,293 34%
Total commission income 155,278 139,454 15,824 11%
Net interest income 12,095 2,455 9,640 393%
Net income (loss) on investments at fair value 788 62,555 (61,767) (99%)
Net financial income 12,883 65,010 (52,127) (80%)
Net income (loss) on other investments (3,335) 5,964 (9,299) n.s.
Other revenues 4,865 5,431 (566) (10%)
TOTAL REVENUES 182,576 225,452 (42,876) (19%)
Acquisition costs & Sales network commission expenses (48,983) (49,330) 347 (1%)
Other commission expenses (3,665) (3,056) (609) 20%
General and Administrative expenses (44,794) (42,693) (2,101) 5%
Amortisation and depreciation (3,693) (1,379) (2,314) 168%
Net provisions for risks (58) (2,526) 2,468 (98%)
TOTAL COSTS (101,193) (98,984) (2,209) 2%
PROFIT BEFORE TAX 81,383 126,468 (45,085) (36%)
Mediolanum Assicurazioni was consolidated with the Mediolanum Group on March 31, 2013. Therefore, the reclas-
sified consolidated income statement at June 30, 2013 includes the impact on profit and loss related to the newly
acquired company for the period March 31, 2013 – June 30, 2013. Following consolidation of that newly acquired
company, the income statement broken down by operating segment includes the new "Insurance" segment, which
includes the profit and loss related to the Life Business and General Business.
Profit before tax in the Italy – Life operating segment amounted to €81.4 million, down 36% from the €126.5
million reported in 1H 2012, mainly due to the decrease in net financial income (down €52.1 million).
Net life insurance revenues before acquisition costs totalled €12.9 million, up €3.3 million from the €9.6 million
reported in 1H 2012.
Total commission income for the period amounted to €155.3 million, compared with €139.5 million at June 30,
2012, reflecting a €6.1 million increase in performance fees and a €9.1 million increase in management fees.
Net financial income for the period amounted to €12.9 million, compared with €65.0 million in 1H 2012. The
€52.1 million decrease was due to €61.8 million in lower net income on investments at fair value due to negative
market performance, while net interest income rose from €2.4 million to €12.1 million, mainly due to the lower
expense for retrocession of amounts to policyholders.
21
INTERIM MANAGEMENTREPORT
€/’000 June 30, 2013 June 30, 2012 Change Change %
Entry fees 72,482 51,392 21,090 41%
Management fees 146,584 110,414 36,170 33%
Performance fees 42,681 41,233 1,448 4%
Other fees 13,414 14,191 (777) (5%)
Total commission income 275,161 217,230 57,931 27%
Net interest income 188 422 (234) (55%)
Net income (loss) on investments at fair value 1 1 - -
Net financial income 189 423 (234) (55%)
Net income (loss) on other investments (1) (482) 481 n.s.
Other revenues 118 254 (136) (54%)
TOTAL REVENUES 275,467 217,425 58,042 27%
Acquisition costs & Sales network commission expenses (130,525) (87,083) (43,442) 50%
Other commission expenses (7,877) (5,311) (2,566) 48%
General and Administrative expenses (42,308) (40,924) (1,384) 3%
Amortisation and depreciation (1,112) (1,035) (77) 7%
Net provisions for risks (146) (1,756) 1,610 (92%)
TOTAL COSTS (181,968) (136,109) (45,859) 34%
PROFIT BEFORE TAX 93,499 81,316 12,183 15%
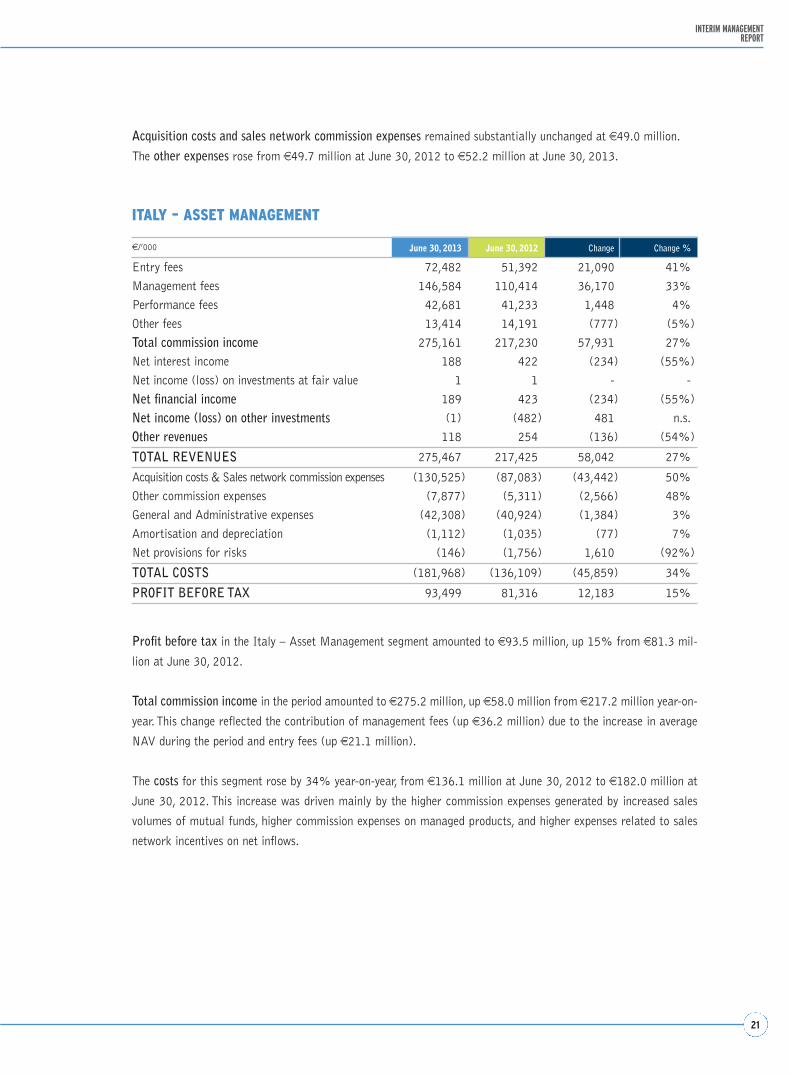
Profit before tax in the Italy – Asset Management segment amounted to €93.5 million, up 15% from €81.3 mil-
lion at June 30, 2012.
Total commission income in the period amounted to €275.2 million, up €58.0 million from €217.2 million year-on-
year. This change reflected the contribution of management fees (up €36.2 million) due to the increase in average
NAV during the period and entry fees (up €21.1 million).
The costs for this segment rose by 34% year-on-year, from €136.1 million at June 30, 2012 to €182.0 million at
June 30, 2012. This increase was driven mainly by the higher commission expenses generated by increased sales
volumes of mutual funds, higher commission expenses on managed products, and higher expenses related to sales
network incentives on net inflows.
Acquisition costs and sales network commission expenses remained substantially unchanged at €49.0 million.
The other expenses rose from €49.7 million at June 30, 2012 to €52.2 million at June 30, 2013.
ITALY – ASSET MANAGEMENT
22
HALF-YEAR FINANCIALREPORT
2013
ITALY – BANKING
€/’000 June 30, 2013 June 30, 2012 Change Change %
Banking services fees 41,236 39,870 1,366 3%
Other fees 2,572 5,417 (2,845) (53%)
Total commission income 43,808 45,287 (1,479) (3%)
Net interest income 121,447 145,752 (24,305) (17%)
Net income (loss) on investments at fair value 7,720 15,750 (8,030) (51%)
Net financial income 129,167 161,502 (32,335) (20%)
Net income (loss) on other investments 30,170 (5,932) 36,102 n.s.
Other revenues 4,495 8,205 (3,710) (45%)
TOTAL REVENUES 207,640 209,062 (1,422) (1%)
Acquisition costs & Sales network commission expenses (22,856) (30,302) 7,446 (25%)
Other commission expenses (6,119) (6,401) 282 (4%)
General and Administrative expenses (91,175) (83,179) (7,996) 10%
Amortisation and depreciation (3,551) (3,144) (407) 13%
Net provisions for risks (29) (6,217) 6,188 n.s.
TOTAL COSTS (123,731) (129,243) 5,512 (4%)
PROFIT BEFORE TAX 83,910 79,819 4,091 5%
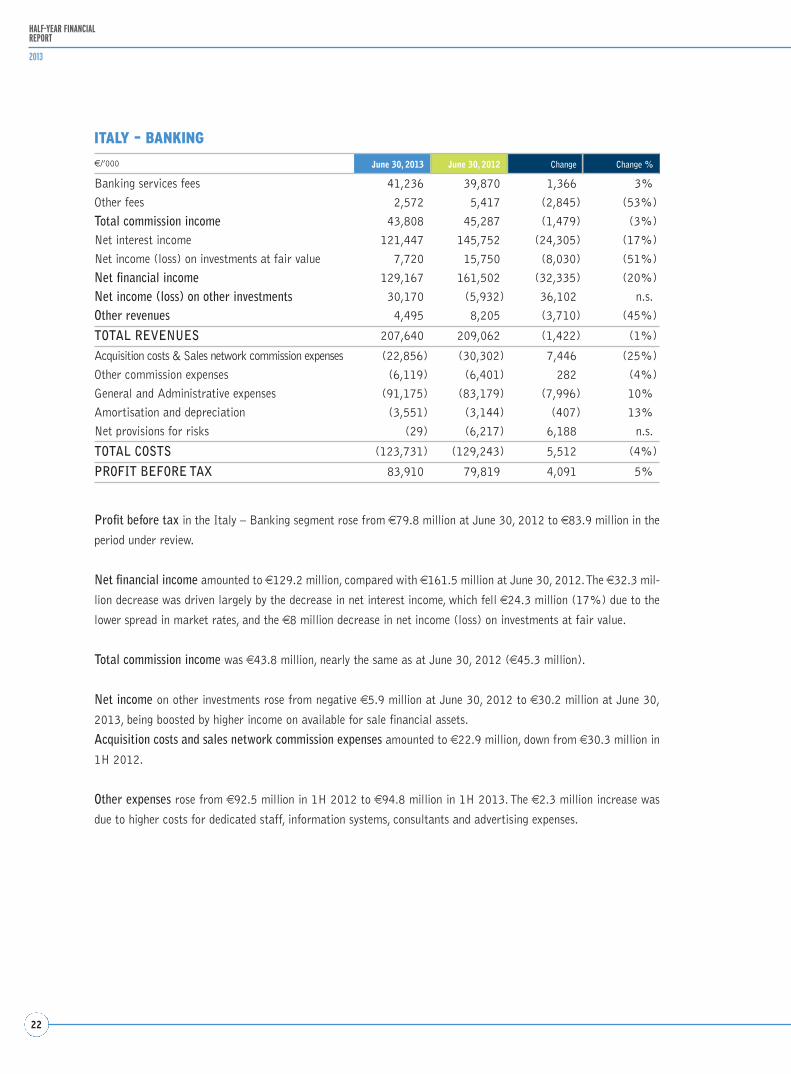
Profit before tax in the Italy – Banking segment rose from €79.8 million at June 30, 2012 to €83.9 million in the
period under review.
Net financial income amounted to €129.2 million, compared with €161.5 million at June 30, 2012. The €32.3 mil-
lion decrease was driven largely by the decrease in net interest income, which fell €24.3 million (17%) due to the
lower spread in market rates, and the €8 million decrease in net income (loss) on investments at fair value.
Total commission income was €43.8 million, nearly the same as at June 30, 2012 (€45.3 million).
Net income on other investments rose from negative €5.9 million at June 30, 2012 to €30.2 million at June 30,
2013, being boosted by higher income on available for sale financial assets.
Acquisition costs and sales network commission expenses amounted to €22.9 million, down from €30.3 million in
1H 2012.
Other expenses rose from €92.5 million in 1H 2012 to €94.8 million in 1H 2013. The €2.3 million increase was
due to higher costs for dedicated staff, information systems, consultants and advertising expenses.
23
INTERIM MANAGEMENTREPORT
€/’000 June 30, 2013 June 30, 2012 Change Change %
Net interest income (7,575) (7,092) (483) 7%Net income (loss) on investments at fair value 1 1 - -Net financial income (7,574) (7,091) (483) 7%Equity contribution 639 1,991 (1,352) (68%)Net income (loss) on other investments - (912) 912 n.s.Other revenues - - - -
TOTAL REVENUES (6,935) (6,012) (923) 15%
PROFIT BEFORE TAX (6,935) (6,012) (923) 15%
ITALY – OTHER
€/’000 June 30, 2013 June 30, 2012 Change Change %
Net premiums written 54,774 44,171 10,603 24%Amounts paid & change in technical reserves (46,192) (36,694) (9,498) 26%Net life insurance revenues (ex-commissions) 8,582 7,477 1,105 15%Total commission income 17,021 12,774 4,247 33%Net interest income 8,933 16,279 (7,346) (45%)Net income (loss) on investments at fair value 473 1,441 (968) (67%)Net financial income 9,406 17,720 (8,314) (47%)Net income (loss) on other investments 9,750 (280) 10,030 n.s.Other revenues 146 262 (116) (44%)
TOTAL REVENUES 44,905 37,953 6,952 18%Acquisition costs & Sales network commission expenses (11,194) (8,298) (2,896) 35%Other commission expenses (1,605) (1,343) (262) 20%General and Administrative expenses (14,338) (12,531) (1,807) 14%Amortisation and depreciation (732) (761) 29 (4%)Net provisions for risks 328 (3,636) 3,964 n.s.
TOTAL COSTS (27,542) (26,569) (973) 4%
PROFIT (LOSS) BEFORE TAX 17,363 11,384 5,979 53%
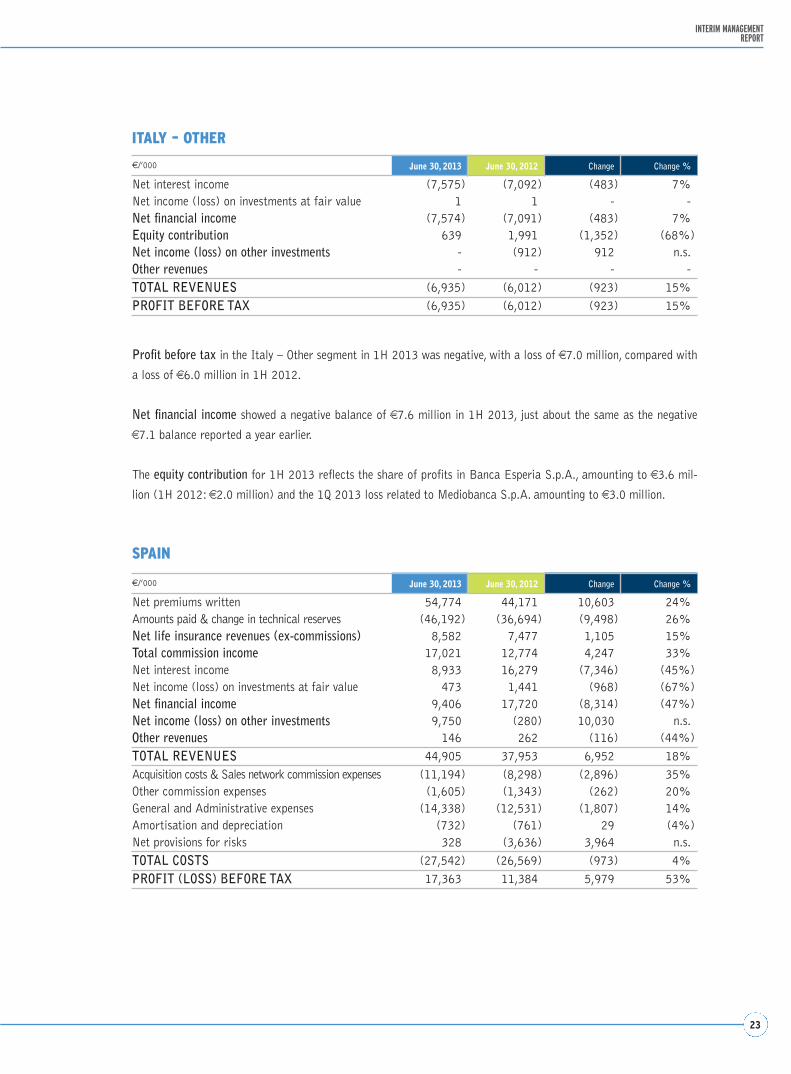
Profit before tax in the Italy – Other segment in 1H 2013 was negative, with a loss of €7.0 million, compared with
a loss of €6.0 million in 1H 2012.
Net financial income showed a negative balance of €7.6 million in 1H 2013, just about the same as the negative
€7.1 balance reported a year earlier.
The equity contribution for 1H 2013 reflects the share of profits in Banca Esperia S.p.A., amounting to €3.6 mil-
lion (1H 2012: €2.0 million) and the 1Q 2013 loss related to Mediobanca S.p.A. amounting to €3.0 million.
SPAIN
24
HALF-YEAR FINANCIALREPORT
2013
The Spain segment reported net life insurance revenues before acquisition costs of €8.6 million, up from €7.5 mil-
lion in the same period a year earlier.
Total commission income rose 33%, from €12.8 million to €17.0 million at June 30, 2013, for a change of €4.2
million.
Net financial income amounted to €9.4 million, as opposed to €17.7 million in the same period a year earlier. The
decrease stemmed mainly from the €7.3 million decrease in net interest income due to the reduced spread in mar-
ket rates.
Net income on other investments amounted to €9.8 million, as compared to a net loss of €0.3 million at June 30,
2012. The change is attributable to the higher income on available for sale financial assets.
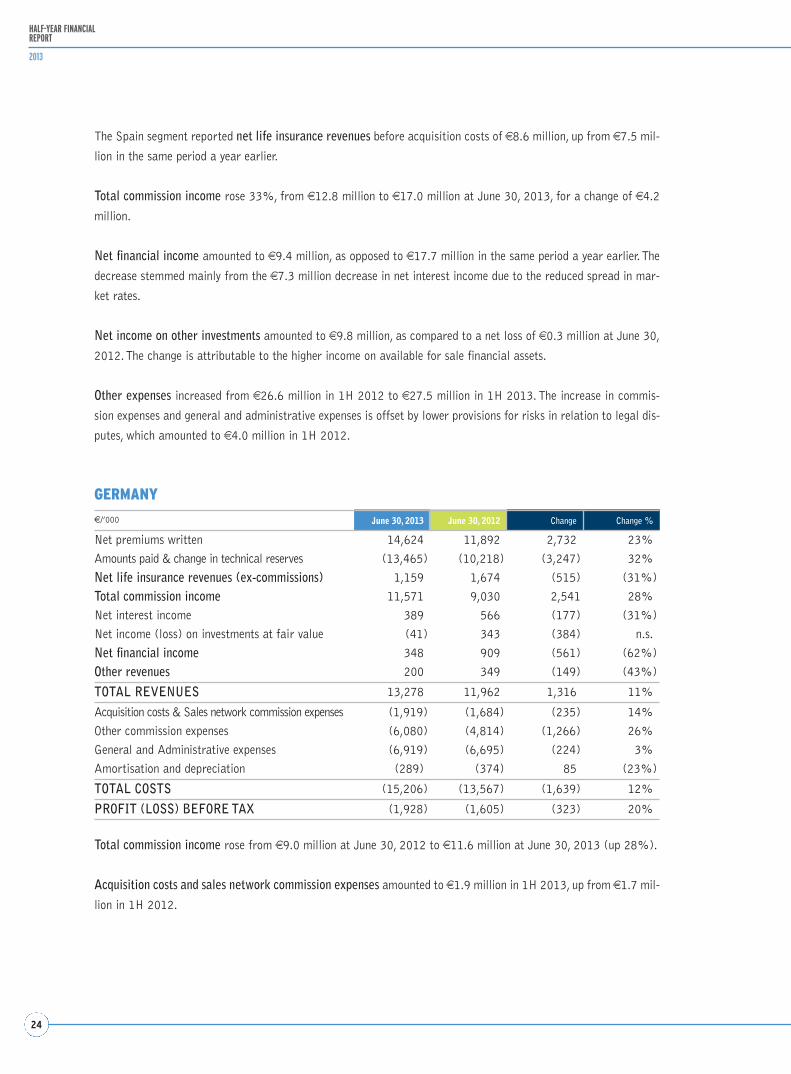
Other expenses increased from €26.6 million in 1H 2012 to €27.5 million in 1H 2013. The increase in commis-
sion expenses and general and administrative expenses is offset by lower provisions for risks in relation to legal dis-
putes, which amounted to €4.0 million in 1H 2012.
GERMANY
€/’000 June 30, 2013 June 30, 2012 Change Change %
Net premiums written 14,624 11,892 2,732 23%
Amounts paid & change in technical reserves (13,465) (10,218) (3,247) 32%
Net life insurance revenues (ex-commissions) 1,159 1,674 (515) (31%)
Total commission income 11,571 9,030 2,541 28%
Net interest income 389 566 (177) (31%)
Net income (loss) on investments at fair value (41) 343 (384) n.s.
Net financial income 348 909 (561) (62%)
Other revenues 200 349 (149) (43%)
TOTAL REVENUES 13,278 11,962 1,316 11%
Acquisition costs & Sales network commission expenses (1,919) (1,684) (235) 14%
Other commission expenses (6,080) (4,814) (1,266) 26%
General and Administrative expenses (6,919) (6,695) (224) 3%
Amortisation and depreciation (289) (374) 85 (23%)
TOTAL COSTS (15,206) (13,567) (1,639) 12%
PROFIT (LOSS) BEFORE TAX (1,928) (1,605) (323) 20%
Total commission income rose from €9.0 million at June 30, 2012 to €11.6 million at June 30, 2013 (up 28%).
Acquisition costs and sales network commission expenses amounted to €1.9 million in 1H 2013, up from €1.7 mil-
lion in 1H 2012.
25
INTERIM MANAGEMENTREPORT
Key Corporate Events and Performance of Companies within the Group
Highlights of the performance of Mediolanum Group companies during the period under review are presented below.
Life Insurance Companies
Mediolanum Vita S.p.A. – The net profit for 1H 2013 determined by this company in accordance with IFRS amoun-
ted to €17.1 million, compared with €53.9 million in 1H 2012.
The decrease in net profit was particularly impacted by the change in financial income.
At June 30, 2013, premiums written amounted to €2,611.6 million, down 31.2% from €3,800.6 million at June
30, 2012.
New business in 1H 2013 amounted to €2,148.3 million, down 34.8% from €3,296.4 million at June 30, 2012.
This was largely due to the 35.4% decrease in premiums written under the “Mediolanum Plus” policy, which
amounted to €1,151.5 million.
In-force business, driven by multi-year and recurring premiums, was down €40.8 million or 8.1%.
Amounts paid in 1H 2013 rose slightly year-on-year, by €35.8 million. Individual maturities rose from €273.7 mil-
lion to €469.6 million in 1H 2013, while individual redemptions amounted to €3,995.1 million (compared with
€4,145.2 million at June 30, 2012), of which €3,509.3 million related to the “Mediolanum Plus” policy (€3,735.0
million at June 30, 2012).
At June 30, 2013, mathematical reserves and financial liabilities to policyholders totalled €13,228 million
(€14,613 million at December 31, 2012) of which €13,153 million related to individual policies (€14,541 million
at December 31, 2012) and €75 million to group policies (€72 million at December 31, 2012).
Mediolanum International Life Ltd – The Irish company reported net profit of €9.2 million for 1H 2013, down
from €10.4 million in 1H 2012.
At June 30, 2013, premiums written totalled €92.6 million, compared with €116.9 million at June 30, 2012.
Aggregate premiums written in foreign countries (Spain and Germany) amounted to €69.4 million, compared with
€56.1 million at June 30, 2012.
At June 30, 2013 mathematical reserves and financial liabilities to policyholders amounted to €2,851 million, down
from €3,300 at December 31, 2012.
Mediolanum International Life Ltd policies are distributed in Italy by Banca Mediolanum, in Spain by Banco
Mediolanum and in Germany by Bankhaus August Lenz.
Mediolanum Assicurazioni S.p.A. – This company became a part of the Mediolanum Group on March 31, 2013 and
has been consolidated line-by-line since that date.
26
HALF-YEAR FINANCIALREPORT
2013
The net profit of Mediolanum Assicurazioni calculated in accordance with IFRS amounted to €971 thousand for
the period March 31, 2013 – June 30, 2013.
New business written during the period amounted to €10.8 million, and was generated largely by sales of the new
product covering secured bank loans (€1.5 million).
The gross technical reserves measured according to IFRS amounted to €69.4 million at June 30, 2013 (€61.7 mil-
lion at December 31, 2012).
Asset Management Companies
Mediolanum International Funds Ltd – This company of Irish funds reported net profit of €146.6 million for 1H
2013, up €15.9 million year-on-year (€130.7 million at June 30, 2012).
Net inflows at June 30, 2013 amounted to €1,765 million, compared with €728 million a year earlier.
Total assets under management amounted to €22,997 million at June 30, 2013, up 9.8% from €20,952 million at
December 31, 2012.
Mediolanum Gestione Fondi SGR p.A. – The Italian asset management company reported net profit of €14 million
at June 30, 2013, up €8.6 million year-on-year, mainly due to higher management and performance fees.
Net inflows during 1H 2013 amounted to €638.5 million, up €528.6 million from the €109.9 million reported in
1H 2012.
Gamax Management A.G. – The Luxembourg asset management company reported net profit of €2.2 million at
June 30, 2013, up from €1.8 million a year earlier.
In the retail segment, the company recorded net outflows of €31.7 million during 1H 2013, compared with net out-
flows of €4.1 million in 1H 2012.
Assets under management in the retail segment amounted to €207.4 million at June 30, 2013, down from €228.4
million at December 31, 2012.
Total assets under management at June 30, 2013 (retail and institutional segments) amounted to €407 million,
down from €409 million at December 31, 2012.
Mediolanum Asset Management Ltd – The Irish asset management company reported net profit of €7.9 million at
June 30, 2013, up from €7.0 million a year earlier.
Mediolanum Fiduciaria S.p.A. – At June 30, 2013 this company reported a net loss of €290.4 thousand, compa-
red with a net loss of €195.1 thousand at June 30, 2012.
Trust assets under management at June 30, 2013 amounted to €16,934 thousand, up from €6,382 thousand at
December 31, 2012.
Fermi & Galeno S.r.l. – This company, acquired December 28, 2012 and owner of the Fermi e Galeno office pro-
perties leased primarily to Banca Mediolanum S.p.A., with the remainder leased to other Mediolanum Group com-
panies, ended 1H 2013 with net profit of €454.8 thousand.
27
INTERIM MANAGEMENTREPORT
Banking operations (including Group product distribution)
Banca Mediolanum S.p.A. – The bank reported net profit of €67.1 million at June 30, 2013, down 6% from €71.8
million a year earlier.
Profit before tax in 1H 2013 amounted to €84.8 million, down €6.1 million from €90.9 million a year earlier. The
change was mainly the result of lower dividends on investments (down €7.2 million). Specifically, net financial inco-
me increased by €3.8 million in 1H 2013, being driven by the positive contribution of gains on disposal of availa-
ble for sale financial assets (€36.2 million) and net income on hedges (€6 million). These benefits were partly off-
set by lower net interest income (down €24.3 million), due to the reduced spread on market rates in spite of higher
asset volumes, and lower trading income (down €14 million) related to lower unrealised gains for the period.
Operating expenses rose by about €0.9 million in 1H 2013, when €7.6 million in higher administrative expenses and
€3.4 million in higher other expenses were offset by €10.8 million in lower provisions for risks.
Net commission income fell from €33.8 million at June 30, 2012 to €32.7 million at June 30, 2013. This was lar-
gely the consequence of greater amounts provided for incentives in recognition of the exceptional net inflows gene-
rated by the managed asset segment.
Specifically, commission income amounted to €229.9 million, up 17% from €196.4 million in the same period a
year earlier. Commission income rose by €33.5 million in 1H 2013 due to the higher fees earned on asset manage-
ment products (up €32.3 million).
Commission expenses rose by about €34.6 million, from €162.5 million at June 30, 2012 to €197.1 million at June
30, 2013. The increase reflects the higher inflows into mutual funds (up €11.9 million), higher management fees
related to the increase in assets under management (up €11.3 million), higher expenses for sales network incenti-
ves (up €6.4 million), and higher contributions for FIRR and Enasarco sales agent severance indemnities (up €1.4
million).
Direct funding from customers rose from €8,897.6 million at December 31, 2012 to €9,903.6 million at June 30, 2013.
Lending to customers grew to €5,276 million from €4,917.8 million at December 31, 2012, largely driven by resi-
dential mortgage loans (up €205.0 million), deposits with Cassa di Compensazione e Garanzia (up €177.0 million)
and personal loans (up €106.6 million). Securities lending remained essentially unchanged (€462.9 million at June
30, 2013).
Non-performing loans as a percentage of total lending to customers amounted to 0.79%.
The coverage of non-performing loans amounted to 45%, while the coverage of performing loans was 0.1%.
The balance on the securities accounts of retail customers fell from €3,625 million at December 31, 2012 to
€3,439 million at June 30, 2013 (€3,376.1 million at June 30, 2012).
Banco Mediolanum S.A. – The Spanish banking group ended 1H 2013 with consolidated net profit of €9.5 million,
up from €7.1 million in 1H 2012.
Net inflows into asset management products amounted to €112.9 million, up from €34.5 million in 1H 2012. Net
inflows into administered assets amounted to €143.5 million in 1H 2013, up from €26.8 million in 1H 2012.
At June 30, 2013 assets under management and administration totalled €2,071 million, compared with €1,799.6
million at December 31, 2012.
28
HALF-YEAR FINANCIALREPORT
2013
The sales network had a headcount of 630 at the end of June 2013 (590 at December 31, 2012), of which 592
were tied advisors (551 at December 31, 2012).
Bankhaus August Lenz & Co. – The German bank reported a net loss of €3.9 million for the six months at June 30,
2013, compared with the €3.7 million net loss made in 1H 2012.
Net inflows into asset management products amounted to €12.7 million in 1H 2013, compared with €12.8 million
in 1H 2012. Net outflows from administered assets amounted to €20.4 million, compared with €10.5 million in 1H
2012.
At June 30, 2013, assets under administration and management amounted to €212.3 million, compared with
€214.5 million at December 31, 2012).
The sales network had a headcount of 45 at June 30, 2013, down from 46 at December 31, 2012.
Joint ventures
In 1H 2013 the Banca Esperia Group had consolidated net profit of €7.2 million, up from €3.8 million at June 30,
2012.
Net outflows during 1H 2013 amounted to €291 million, compared with net outflows of €778 million in 1H 2012.
Total assets under management and administration amounted to €14,333 million at June 30, 2013, up from
€13,800 million at December 31, 2012.
Associates
The consolidated interim management report at March 31, 2013 of the Mediobanca Group shows net profit of
€37.2 million for the first nine months of its financial year, compared with €104.9 million at March 31, 2012. This
change reflected the losses made by the investing principals in the last quarter.
Specifically, the net loss in the third quarter (January-March) amounted to €86.6 million, against net profit of
€41.5 million in the third quarter of the previous year.
The net profit for the first nine months of the year reflects the decrease in net interest income from €813.3 million
to €763.4 million, a 26.3% fall in trading income (€180.9 million as opposed to €245.6 million), and a 22.1%
decrease in commissions and other income, from €300.2 million to €385.6 million.
The consolidated companies also reduced equity by €71 million.
Operating costs fell by 5.6%, from €595.1 million to €561.5 million due to a 3.1% decrease in personnel costs,
an 8.3% decrease in administrative expenses, and an 11.3% increase for adjustments to receivables from €326.8
to €363.7 million.
Consolidated equity after minority interests and net profit for the year amounted to €7,155.6 million at March 31,
2013, up €233.3 million from €6,922.3 million at December 31, 2012.
The Mediobanca Group results at June 30, 2013 will be announced September 17, 2013, after approval of the
financial statements at June 30, 2013 by its Board of Directors.
29
INTERIM MANAGEMENTREPORT
Impairment Test of Investment in Mediobanca S.p.A.
The management of Mediobanca S.p.A. presented the market with its strategic plan for the period 2014-2016 on
June 21, 2013.
This made it necessary to perform an impairment test at June 30, 2013 to determine the consequent carrying value
of the investment in Mediobanca S.p.A., relying on the professional support of the independent expert Ernst &
Young Financial-Business Advisory S.p.A.
Maintaining the approach taken in previous years, the recoverable value of the investment was determined by cal-
culating its value in use.
The recoverable value of the investment in Mediobanca S.p.A. at June 30, 2013 was determined on the basis of
publicly available information and, in particular, the targets set in the strategic plan 2014-2016. However, they did
not state the earnings and equity details of the forecast results. The prospective data were consequently estimated
on the basis of the profitability, capitalisation, RWA and distribution of dividends forecast and set out in the stra-
tegic plan 2014-2016.
The total stake owned by the Mediolanum Group was measured by using the Dividend Discount Model in its variant
form, Excess Capital. This method is customarily used in Italian and international practice to determine the finan-
cial value of businesses operating in the financial sector, is subject to compliance with minimum capitalisation requi-
rements, and was applied in continuity with previous financial years.
The value of Mediobanca S.p.A. was subjected to sensitivity analysis in relation to possible changes in the basic
assumptions that affect its value. Specifically, these are represented by the cost of shareholders' equity, the long-
term growth rate, and net results estimated in reference to the strategic plan 2014-2016. They also reflect the pro-
jections made on the basis of analyst consensus published after presentation of the strategic plan.
On July 22, 2013 Ernst & Young Financial-Business Advisory S.p.A. issued its report on the impairment test at
June 30, 2013 of the investment in Mediobanca S.p.A. This report shows that on the basis of current macroecono-
mic and business sector trend forecasts, the results of Mediobanca S.p.A. at March 31, 2013, the strategic plan
2014-2016, the trend of analysts’ consensus, and the prepared valuation analyses, as set out in that report, there is
no reason to believe that the value in use of the investment in Mediobanca S.p.A. is less than its carrying value at
June 30, 2013.
On the basis of this assessment, the Board of Directors approved the impairment test of Mediobanca S.p.A. at June
30, 2013.
30
HALF-YEAR FINANCIALREPORT
2013
Capital Adequacy
The solvency margin of the Mediolanum S.p.A. financial conglomerate at June 30, 2013, calculated in accordance
with the regulatory provisions applicable to financial conglomerates whose principal business is insurance, is consi-
stent with the requirements of IVASS (formerly ISVAP) pursuant to “Regulation no. 18 of March 12, 2008 con-
cerning verification of the correct solvency pursuant to Title XV, Chapter IV, of Legislative Decree 209 of September
7, 2005, n. 209 – Private Insurance Code – Provisions in Regard to Capital Adequacy at the Financial
Conglomerate Level pursuant to Legislative Decree 142 of May 30, 2005, and the financial conglomerate coordi-
nation agreement signed by ISVAP, Consob and the Bank of Italy on March 30, 2006. Specifically, given the capi-
tal requirements of the conglomerate, which amount to €845 million, the shareholders' equity of the conglomerate
covering the required margin amounts to €1,382 million, with an excess of €537 million.
Given the steady growth of the banking unit, whose banking activities have gradually become preponderant, the
IVASS sent a letter on June 20, 2013 asking the parent company Mediolanum S.p.A. to prepare and send the super-
visory authority a statement illustrating the capital adequacy of the conglomerate. This statement had to be prepa-
red by applying the current solvency rules established for conglomerates whose predominant activity is banking. On
the basis of the foregoing, and given the reduced capital requirements of the conglomerate at June 30, 2013, amoun-
ting to €647 million, the shareholders' equity necessary to cover the required margin has fallen to €965 million,
causing a simultaneous reduction of the excess to €318 million.
Tax Litigation
There have been no new developments since what was disclosed in the Annual Report and Accounts at December
31, 2012 in regard to the tax litigation related to IRES (corporate income tax) and IRAP (regional tax on produc-
tive activity), concerning the amount of commission retrocessions paid by Mediolanum International Fund Ltd to
Banca Mediolanum S.p.A. and to Mediolanum Vita S.p.A.
Significant Events after the First Half
A resolution was passed on July 13, 2013 for the issuance of new notes having a nominal value of €50,000,000
and the same characteristics as the previous notes described in the section “Issue of Mediolanum Notes” and to be
offered between July 9, 2013 and August 2, 2013.
There was no other event after June 30, 2013 that might have a significant impact on the financial position, result
of operations and cash flows of the Mediolanum Group.
31
INTERIM MANAGEMENTREPORT
Outlook
It is expected that monetary policy rates will remain low over the next few quarters, and quantitative easing will
continue in the United States, albeit on a gradually decreasing basis.
The economic situation in the Eurozone remains conditioned by the search for a final solution to the financial cri-
sis. The adoption of economic and fiscal policies jointly agreed by the various governments, together with the con-
ventional and unconventional monetary policy measures implemented by the European Central Bank, may create
favourable conditions for the financial markets.
In this context, the Mediolanum Group remains focused on its global advisory activity by offering increasingly evol-
ved products and tools to enhance the value of its customers' assets. The impact of cash pooling activity on profi-
tability remains tied to market performance.
In light of the foregoing and the results reported herein, considering the risks that are inherent in the business of
the Group, barring any exceptional events or circumstances that depend on variables which are substantially beyond
the control of Directors and Senior Management – and not in the offing at present – the outlook for the Group in
2013 is positive.
Basiglio, July 30, 2013
For the Board of Directors
The Chairman of the Board
(Carlo Secchi)

CondensedConsolidatedFinancial Statements
34
HALF-YEAR FINANCIALREPORT
2013
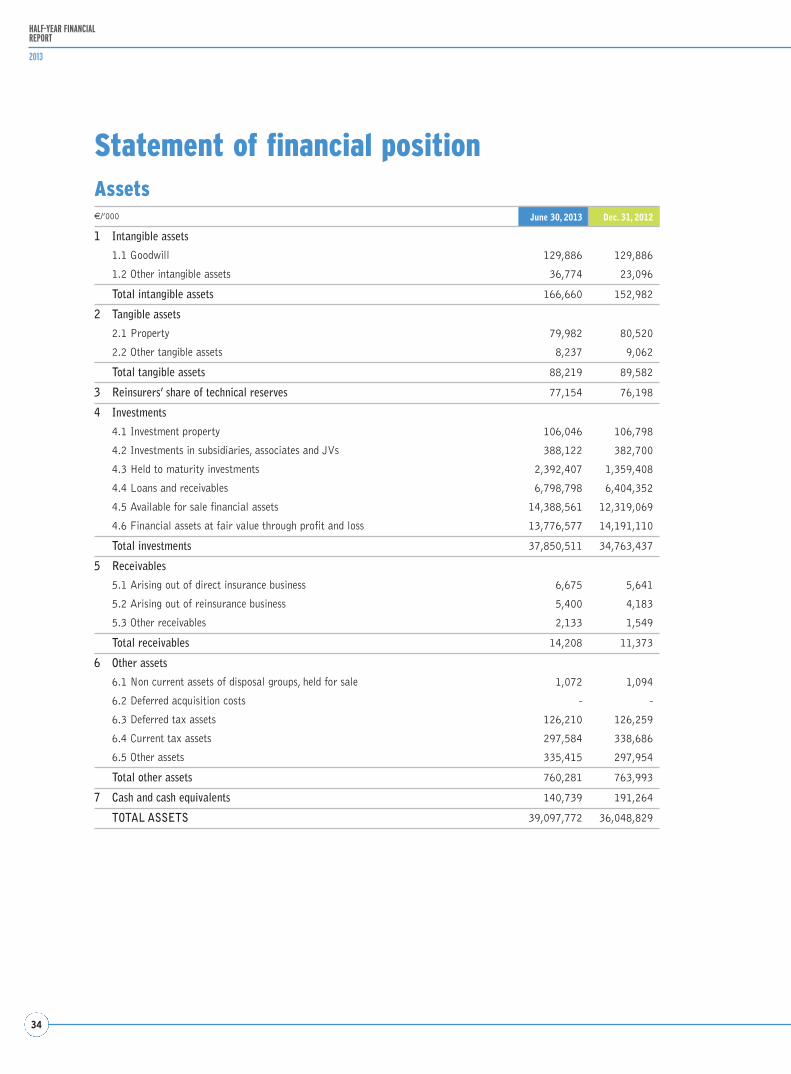
Statement of financial positionAssets€/’000 June 30, 2013 Dec. 31, 2012
1 Intangible assets
1.1 Goodwill 129,886 129,886
1.2 Other intangible assets 36,774 23,096
Total intangible assets 166,660 152,982
2 Tangible assets
2.1 Property 79,982 80,520
2.2 Other tangible assets 8,237 9,062
Total tangible assets 88,219 89,582
3 Reinsurers’ share of technical reserves 77,154 76,198
4 Investments
4.1 Investment property 106,046 106,798
4.2 Investments in subsidiaries, associates and JVs 388,122 382,700
4.3 Held to maturity investments 2,392,407 1,359,408
4.4 Loans and receivables 6,798,798 6,404,352
4.5 Available for sale financial assets 14,388,561 12,319,069
4.6 Financial assets at fair value through profit and loss 13,776,577 14,191,110
Total investments 37,850,511 34,763,437
5 Receivables
5.1 Arising out of direct insurance business 6,675 5,641
5.2 Arising out of reinsurance business 5,400 4,183
5.3 Other receivables 2,133 1,549
Total receivables 14,208 11,373
6 Other assets
6.1 Non current assets of disposal groups, held for sale 1,072 1,094
6.2 Deferred acquisition costs - -
6.3 Deferred tax assets 126,210 126,259
6.4 Current tax assets 297,584 338,686
6.5 Other assets 335,415 297,954
Total other assets 760,281 763,993
7 Cash and cash equivalents 140,739 191,264
TOTAL ASSETS 39,097,772 36,048,829

35
CONDENSED CONSOLIDATEDACCOUNTS
Shareholders’ equity and liabilities€/’000 June 30, 2013 Dec. 31, 2012
1 Shareholders’ equity
1.1 Group shareholders’ equity
1.1.1 Share capital 73,473 73,434
1.1.2 Other equity instruments - -
1.1.3 Capital reserves 57,757 56,497
1.1.4 Retained earnings and other equity reserves 1,122,451 821,182
1.1.5 Treasury shares (-) (2,045) (2,045)
1.1.6 Exchange difference reserves - -
1.1.7 Gains or losses on available for sale financial assets 47,053 88,984
1.1.8 Other gains or losses recognised directly in equity 28,832 31,372
1.1.9 Net profit (loss) for the year attributable to the Group 199,490 351,023
Total capital and reserves attributable to the Group 1,527.011 1,420,447
1.2 Attributable to minority interests
1.2.1 Capital and reserves attributable to minority interests - -
1.2.2 Gains (losses) recognised directly in equity - -
1.2.3 Net profit (loss) for the year attributable to minority interests - -
Total capital and reserves attributable to minority interests - -
Total shareholders’ equity 1,527,011 1,420,447
2 Provisions 186,620 191,022
3 Technical reserves 16,064,899 17,823,829
4 Financial liabilities
4.1 Financial liabilities at fair value through profit and loss 457,261 443,045
4.2 Other financial liabilities 20,224,354 15,491,157
Total financial liabilities 20,681,615 15,934,202
5 Payables
5.1 Arising out of direct insurance business 7,224 5,580
5.2 Arising out of reinsurance business 331 68
5.3 Other payables 235,401 275,679
Total payables 242,956 281,327
6 Other liabilities
6.1 Liabilities of disposal groups held for sale 951 960
6.2 Deferred tax liabilities 72,281 97,210
6.3 Current tax liabilities 136,925 122,578
6.4 Other liabilities 184,514 177,254
Total other liabilities 394,671 398,002
TOTAL SHAREHOLDERS’ EQUITY AND LIABILITIES 39,097,772 36,048,829
36
HALF-YEAR FINANCIALREPORT
2013
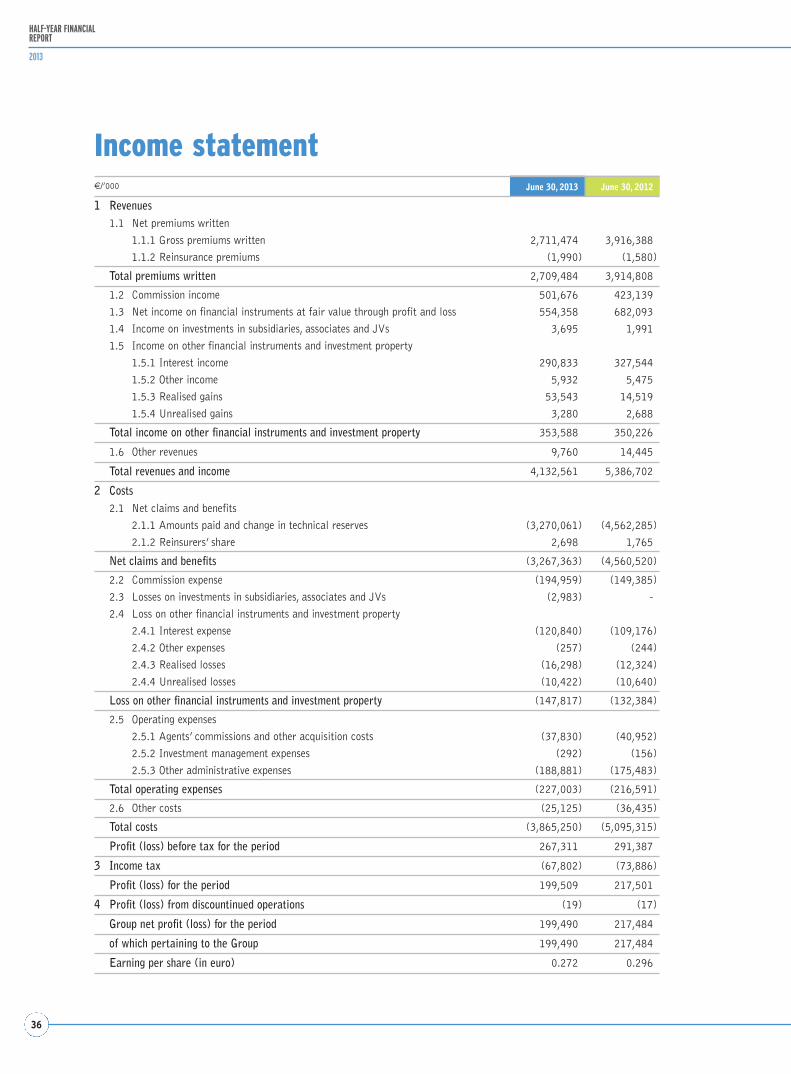
Income statement€/’000 June 30, 2013 June 30, 2012
1 Revenues1.1 Net premiums written
1.1.1 Gross premiums written 2,711,474 3,916,388
1.1.2 Reinsurance premiums (1,990) (1,580)
Total premiums written 2,709,484 3,914,808
1.2 Commission income 501,676 423,139
1.3 Net income on financial instruments at fair value through profit and loss 554,358 682,093
1.4 Income on investments in subsidiaries, associates and JVs 3,695 1,991
1.5 Income on other financial instruments and investment property
1.5.1 Interest income 290,833 327,544
1.5.2 Other income 5,932 5,475
1.5.3 Realised gains 53,543 14,519
1.5.4 Unrealised gains 3,280 2,688
Total income on other financial instruments and investment property 353,588 350,226
1.6 Other revenues 9,760 14,445
Total revenues and income 4,132,561 5,386,702
2 Costs2.1 Net claims and benefits
2.1.1 Amounts paid and change in technical reserves (3,270,061) (4,562,285)
2.1.2 Reinsurers’ share 2,698 1,765
Net claims and benefits (3,267,363) (4,560,520)
2.2 Commission expense (194,959) (149,385)
2.3 Losses on investments in subsidiaries, associates and JVs (2,983) -
2.4 Loss on other financial instruments and investment property
2.4.1 Interest expense (120,840) (109,176)
2.4.2 Other expenses (257) (244)
2.4.3 Realised losses (16,298) (12,324)
2.4.4 Unrealised losses (10,422) (10,640)
Loss on other financial instruments and investment property (147,817) (132,384)
2.5 Operating expenses
2.5.1 Agents’ commissions and other acquisition costs (37,830) (40,952)
2.5.2 Investment management expenses (292) (156)
2.5.3 Other administrative expenses (188,881) (175,483)
Total operating expenses (227,003) (216,591)
2.6 Other costs (25,125) (36,435)
Total costs (3,865,250) (5,095,315)
Profit (loss) before tax for the period 267,311 291,387
3 Income tax (67,802) (73,886)
Profit (loss) for the period 199,509 217,501
4 Profit (loss) from discountinued operations (19) (17)
Group net profit (loss) for the period 199,490 217,484
of which pertaining to the Group 199,490 217,484
Earning per share (in euro) 0.272 0.296
37
CONDENSED CONSOLIDATEDACCOUNTS
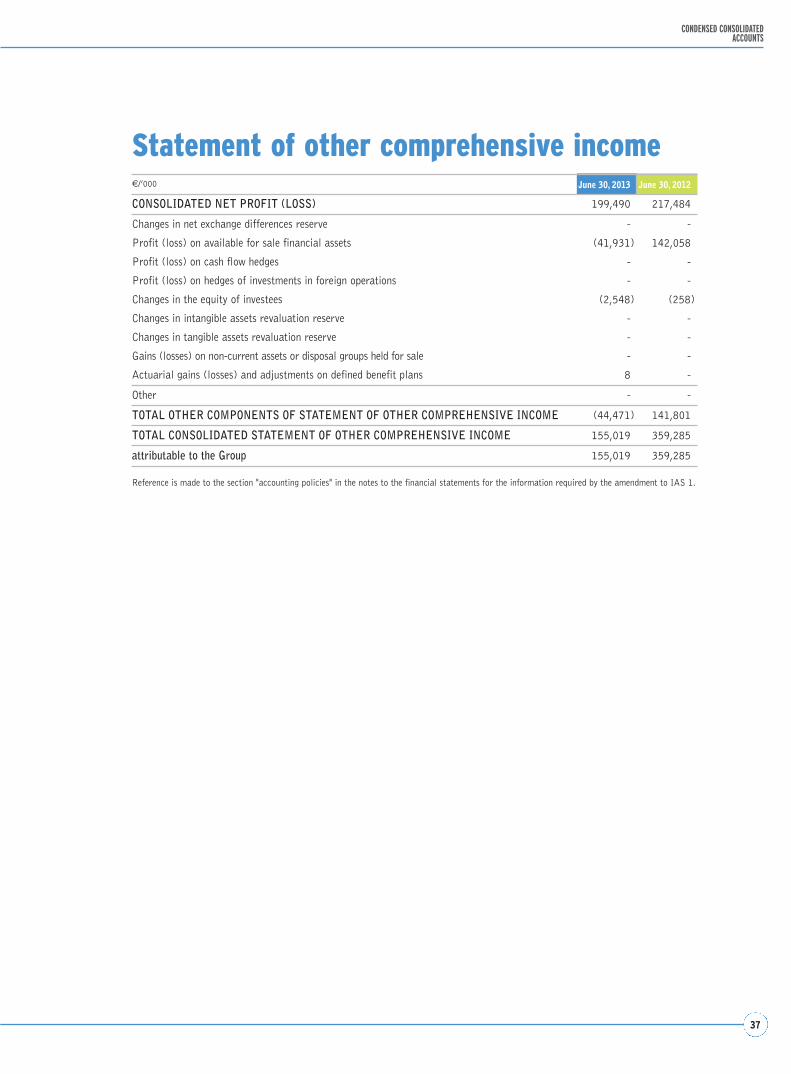
Statement of other comprehensive income€/’000 June 30, 2013 June 30, 2012
CONSOLIDATED NET PROFIT (LOSS) 199,490 217,484
Changes in net exchange differences reserve - -
Profit (loss) on available for sale financial assets (41,931) 142,058
Profit (loss) on cash flow hedges - -
Profit (loss) on hedges of investments in foreign operations - -
Changes in the equity of investees (2,548) (258)
Changes in intangible assets revaluation reserve - -
Changes in tangible assets revaluation reserve - -
Gains (losses) on non-current assets or disposal groups held for sale - -
Actuarial gains (losses) and adjustments on defined benefit plans 8 -
Other - -
TOTAL OTHER COMPONENTS OF STATEMENT OF OTHER COMPREHENSIVE INCOME (44,471) 141,801
TOTAL CONSOLIDATED STATEMENT OF OTHER COMPREHENSIVE INCOME 155,019 359,285
attributable to the Group 155,019 359,285
Reference is made to the section "accounting policies" in the notes to the financial statements for the information required by the amendment to IAS 1.
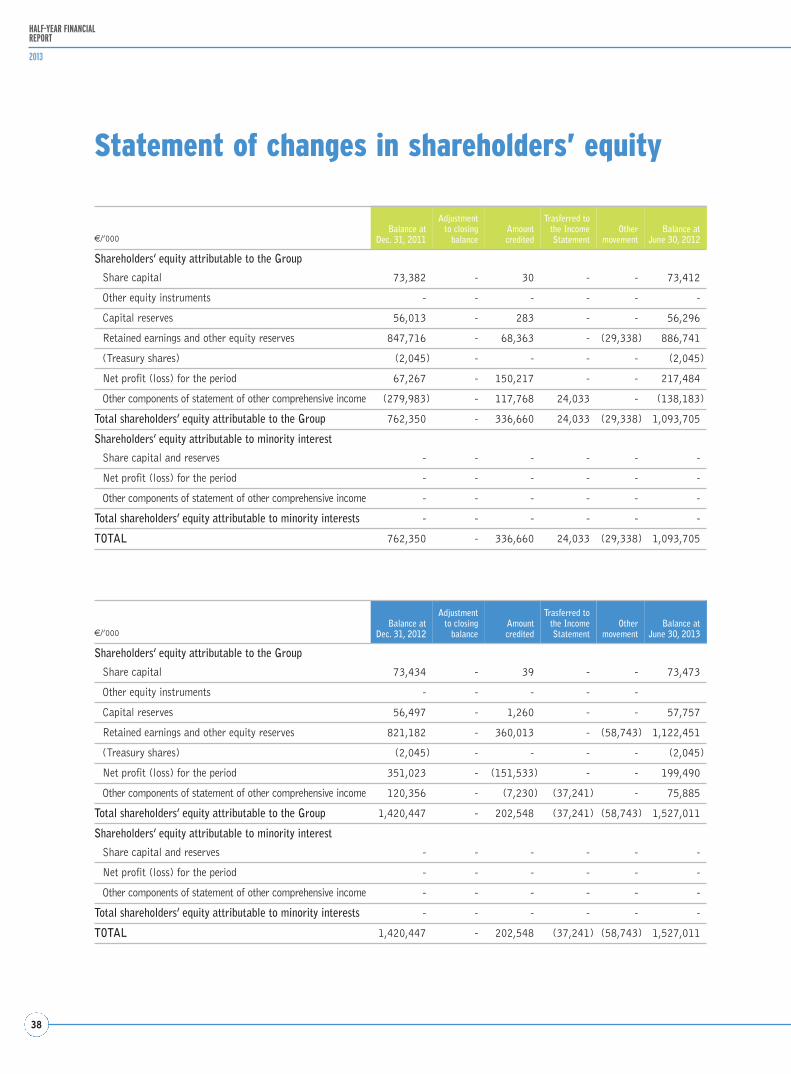
38
HALF-YEAR FINANCIALREPORT
2013
€/’000Balance at
Dec. 31, 2011
Adjustment to closing
balanceAmountcredited
Trasferred tothe IncomeStatement
Othermovement
Balance atJune 30, 2012
Shareholders’ equity attributable to the Group
Share capital 73,382 - 30 - - 73,412
Other equity instruments - - - - - -
Capital reserves 56,013 - 283 - - 56,296
Retained earnings and other equity reserves 847,716 - 68,363 - (29,338) 886,741
(Treasury shares) (2,045) - - - - (2,045)
Net profit (loss) for the period 67,267 - 150,217 - - 217,484
Other components of statement of other comprehensive income (279,983) - 117,768 24,033 - (138,183)
Total shareholders’ equity attributable to the Group 762,350 - 336,660 24,033 (29,338) 1,093,705
Shareholders’ equity attributable to minority interest
Share capital and reserves - - - - - -
Net profit (loss) for the period - - - - - -
Other components of statement of other comprehensive income - - - - - -
Total shareholders’ equity attributable to minority interests - - - - - -
TOTAL 762,350 - 336,660 24,033 (29,338) 1,093,705
€/’000Balance at
Dec. 31, 2012
Adjustment to closing
balanceAmountcredited
Trasferred tothe IncomeStatement
Othermovement
Balance atJune 30, 2013
Shareholders’ equity attributable to the Group
Share capital 73,434 - 39 - - 73,473
Other equity instruments - - - - -
Capital reserves 56,497 - 1,260 - - 57,757
Retained earnings and other equity reserves 821,182 - 360,013 - (58,743) 1,122,451
(Treasury shares) (2,045) - - - - (2,045)
Net profit (loss) for the period 351,023 - (151,533) - - 199,490
Other components of statement of other comprehensive income 120,356 - (7,230) (37,241) - 75,885
Total shareholders’ equity attributable to the Group 1,420,447 - 202,548 (37,241) (58,743) 1,527,011
Shareholders’ equity attributable to minority interest
Share capital and reserves - - - - - -
Net profit (loss) for the period - - - - - -
Other components of statement of other comprehensive income - - - - - -
Total shareholders’ equity attributable to minority interests - - - - - -
TOTAL 1,420,447 - 202,548 (37,241) (58,743) 1,527,011
Statement of changes in shareholders’ equity
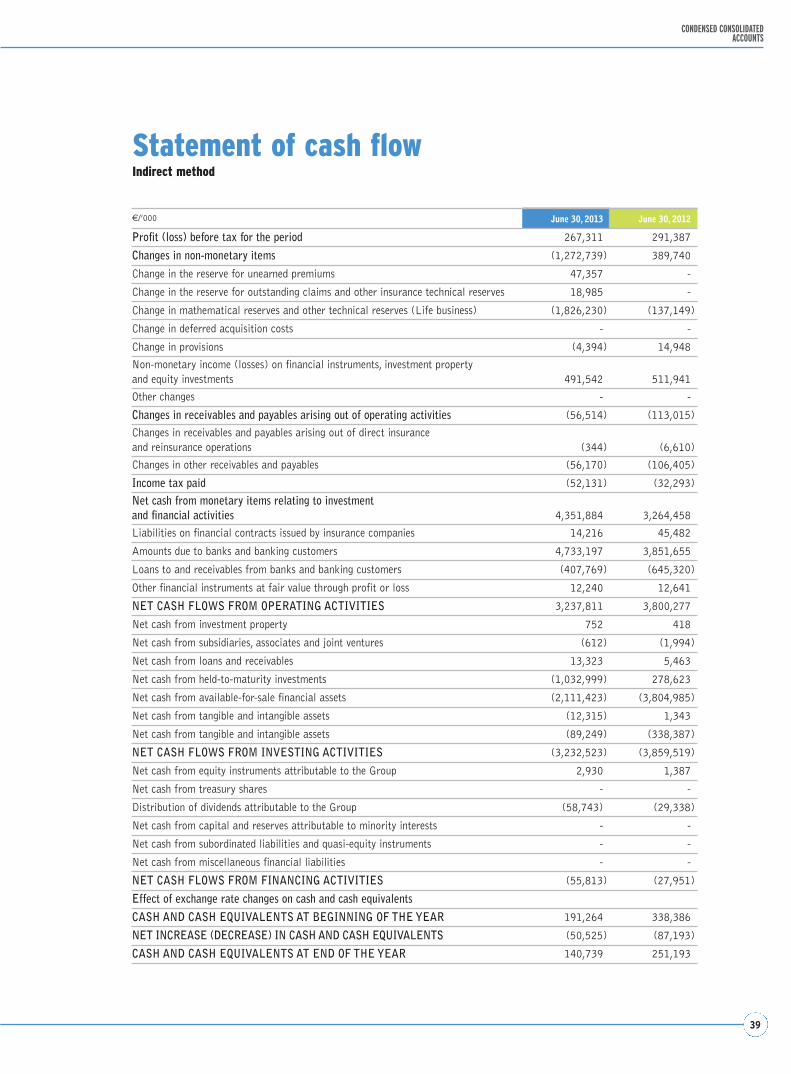
39
CONDENSED CONSOLIDATEDACCOUNTS
Statement of cash flowIndirect method
€/’000 June 30, 2013 June 30, 2012
Profit (loss) before tax for the period 267,311 291,387
Changes in non-monetary items (1,272,739) 389,740
Change in the reserve for unearned premiums 47,357 -
Change in the reserve for outstanding claims and other insurance technical reserves 18,985 -
Change in mathematical reserves and other technical reserves (Life business) (1,826,230) (137,149)
Change in deferred acquisition costs - -
Change in provisions (4,394) 14,948
Non-monetary income (losses) on financial instruments, investment property and equity investments 491,542 511,941
Other changes - -
Changes in receivables and payables arising out of operating activities (56,514) (113,015)
Changes in receivables and payables arising out of direct insurance and reinsurance operations (344) (6,610)
Changes in other receivables and payables (56,170) (106,405)
Income tax paid (52,131) (32,293)
Net cash from monetary items relating to investment and financial activities 4,351,884 3,264,458
Liabilities on financial contracts issued by insurance companies 14,216 45,482
Amounts due to banks and banking customers 4,733,197 3,851,655
Loans to and receivables from banks and banking customers (407,769) (645,320)
Other financial instruments at fair value through profit or loss 12,240 12,641
NET CASH FLOWS FROM OPERATING ACTIVITIES 3,237,811 3,800,277
Net cash from investment property 752 418
Net cash from subsidiaries, associates and joint ventures (612) (1,994)
Net cash from loans and receivables 13,323 5,463
Net cash from held-to-maturity investments (1,032,999) 278,623
Net cash from available-for-sale financial assets (2,111,423) (3,804,985)
Net cash from tangible and intangible assets (12,315) 1,343
Net cash from tangible and intangible assets (89,249) (338,387)
NET CASH FLOWS FROM INVESTING ACTIVITIES (3,232,523) (3,859,519)
Net cash from equity instruments attributable to the Group 2,930 1,387
Net cash from treasury shares - -
Distribution of dividends attributable to the Group (58,743) (29,338)
Net cash from capital and reserves attributable to minority interests - -
Net cash from subordinated liabilities and quasi-equity instruments - -
Net cash from miscellaneous financial liabilities - -
NET CASH FLOWS FROM FINANCING ACTIVITIES (55,813) (27,951)
Effect of exchange rate changes on cash and cash equivalents
CASH AND CASH EQUIVALENTS AT BEGINNING OF THE YEAR 191,264 338,386
NET INCREASE (DECREASE) IN CASH AND CASH EQUIVALENTS (50,525) (87,193)
CASH AND CASH EQUIVALENTS AT END OF THE YEAR 140,739 251,193


Notes to theCondensedConsolidatedFinancialStatements

42
HALF-YEAR FINANCIALREPORT
2013
Notes to the Condensed ConsolidatedFinancial Statements
ACCOUNTING POLICIES
General
The Mediolanum Group’s half-year financial report and accounts at June 30, 2013 were prepared in compliance
with section 154-ter of Legislative Decree 58 of February 24, 1998 (Consolidated Finance Act) as amended by
Legislative Decree 195 of November 6, 2007 (Transparency), and with the regulations for the implementation of
section 9 of Legislative Decree 38/2005. In particular, Statement of financial position and income Statement infor-
mation was prepared in accordance with IAS 34 (Interim Financial Reporting).
These half-year financial report and accounts include the accounts and the notes required by ISVAP regulation No.
7 of July 13, 2007 as amended by ISVAP Rule 2784 of March 8, 2010.
The accounts required by regulatory authorities as minimum disclosure in the explanatory notes are set out in the
schedules attached hereto.
General principles
These half-year financial report and accounts at June 30, 2013 include:
• a statement of financial position for the relevant interim period (six months ended June 30, 2013) as well as a
comparative statement of financial position for the prior financial year (ended December 31, 2012);
• an income statement for the relevant interim period (first half of 2013) and a comparative income statement
for the same interim period of the prior year (first half of 2012);
• a Statement of other comprehensive income for the relevant interim period (first half of 2013) and a compara-
tive Statement of other comprehensive income for the same interim period of the prior year (first half of 2012);
• a statement of changes in shareholders’ equity for the period ranging from the beginning of the financial year to
the end of the relevant interim period as well as a comparative statement of changes in shareholders’ equity for
the same period of the prior year;
• a Statement of Cash Flow for the period ranging from the beginning of the financial year and the end of the rele-
vant interim period as well as a comparative Statement of Chash Flow for the same period of the prior year;
• notes comprising a summary of significant accounting policies and other explanatory notes.
In the interest of timeliness IAS 34 allows an entity to provide less information at interim dates compared with its
annual financial statements (“condensed set of financial statements”), which is intended to provide an update on
the latest complete set of annual financial statements. Therefore, this condensed set of financial statements is to be
read in conjunction with the Group’s Annual Report and Accounts for the year ended December 31, 2012.
43
NOTES TO THE CONDENSED CONSOLIDATED FINANCIAL STATEMENTS
Accounting standards
The Statement of financial position and income statement at June 30, 2013 were prepared in accordance with the
international accounting and financial reporting standards (IAS/IFRS) in force at that date, and which are the same
as those used to prepare the consolidated financial statements for the year at December 31, 2012, as modified by
the amendments made by IASB and applicable from January 1, 2013. Specifically:
– IAS 19 – On June 16, 2011 the IASB issued an amendment to IAS 19 – Employee Benefits, which was subse-
quently endorsed by Regulation 475 of June 5, 2012. This amendment eliminates the option to defer recognition
of actuarial gains and losses with the corridor method, and requires presentation of the Statement of financial
position and financial position of the deficit or surplus of the provisions, and recognition in profit or loss of the
cost components related to the service rendered and net financial expenses, as well as recognition of the actuarial
gains and losses resulting from recalculation of the liabilities and assets under Other comprehensive income/(los-
ses). Moreover, the yield of the assets, included in net financial expenses, must be calculated on the basis of the dis-
count rate of the liabilities and no longer on the basis of their expected yield. Since the new standard did not have
a material impact on 1H 2012 earnings (€239 thousand in lower costs net of the tax effect) or on all of 2012
(€484 thousand in lower costs net of the tax effect), the affected comparative data have not been recalculated.
– IFRS 13 – On May 12, 2011, the IASB issued IFRS 13 – Fair Value Measurement, which clarifies how fair value
must be measured for reporting in the Statement of financial position and applies to all IFRSs that require or
allow fair value measurement or presentation of information based on fair value. This standard was endorsed
through publication of EU Regulation 1255/2012/EC of December 11, 2012 in the Official Gazette L 360 of
December 29, 2012. The assets and liabilities at fair value are measured and classified according to the hierarchy
of fair value established by IFRS 13. That hierarchy consists of three levels assigned according to the observa-
bility of the inputs used in the corresponding measurement techniques that are adopted. The hierarchical levels
of fair value are based on the type of input used to determine fair value:
• Level 1: these are quoted prices observed on active markets for identical assets and liabilities accessible to the
entity on the measurement date;
• Level 2: inputs other than the quoted prices for the asset or liability that are both directly and directly obser-
vable (e.g. listed prices for similar assets and liabilities on active markets);
• Level 3: these are unobservable data for the asset or liability that reflect the assumptions which market par-
ticipants should use when they price the activity or liability, including the assumptions of risk (of the used
model and inputs).
Reference is made to the section “Notes to the Consolidated Financial Statements” for details on the assets and
liabilities measured at fair value and the hierarchy of fair value.
– IAS 1 – Presentation of Items of Other Comprehensive Income
This amendment requires that information be given on the items that might in future be reclassified in profit or
loss.
In regard to the change in the reserve for gains (losses) on available for sale financial assets, which amounted to
negative €41,931 thousand at June 30, 2013 and reported in the Statement of other comprehensive income, it
may be reclassified to profit or loss in future periods, while the €8 thousand change related to the actuarial gains
and losses of defined benefit plans is one of the items that will not be reclassified in profit or loss in future
periods. The component of the Statement of other comprehensive income related to the change in equity of invest-
ments accounted for by the equity method, which had a negative balance of €2,548 thousand at June 30, 2013,
may be reclassified to the income statement in future periods.
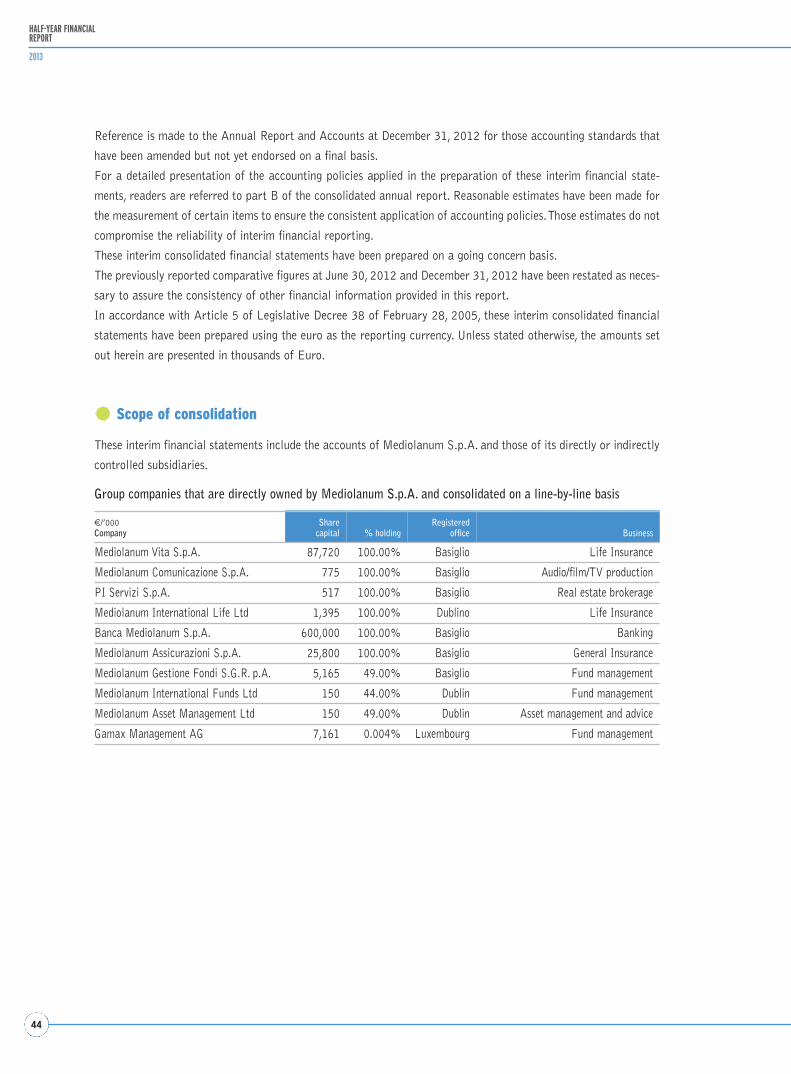
44
HALF-YEAR FINANCIALREPORT
2013
Reference is made to the Annual Report and Accounts at December 31, 2012 for those accounting standards that
have been amended but not yet endorsed on a final basis.
For a detailed presentation of the accounting policies applied in the preparation of these interim financial state-
ments, readers are referred to part B of the consolidated annual report. Reasonable estimates have been made for
the measurement of certain items to ensure the consistent application of accounting policies. Those estimates do not
compromise the reliability of interim financial reporting.
These interim consolidated financial statements have been prepared on a going concern basis.
The previously reported comparative figures at June 30, 2012 and December 31, 2012 have been restated as neces-
sary to assure the consistency of other financial information provided in this report.
In accordance with Article 5 of Legislative Decree 38 of February 28, 2005, these interim consolidated financial
statements have been prepared using the euro as the reporting currency. Unless stated otherwise, the amounts set
out herein are presented in thousands of Euro.
Scope of consolidation
These interim financial statements include the accounts of Mediolanum S.p.A. and those of its directly or indirectly
controlled subsidiaries.
Group companies that are directly owned by Mediolanum S.p.A. and consolidated on a line-by-line basis
€/’000Company
Share capital % holding
Registered office Business
Mediolanum Vita S.p.A. 87,720 100.00% Basiglio Life Insurance
Mediolanum Comunicazione S.p.A. 775 100.00% Basiglio Audio/film/TV production
PI Servizi S.p.A. 517 100.00% Basiglio Real estate brokerage
Mediolanum International Life Ltd 1,395 100.00% Dublino Life Insurance
Banca Mediolanum S.p.A. 600,000 100.00% Basiglio Banking
Mediolanum Assicurazioni S.p.A. 25,800 100.00% Basiglio General Insurance
Mediolanum Gestione Fondi S.G.R. p.A. 5,165 49.00% Basiglio Fund management
Mediolanum International Funds Ltd 150 44.00% Dublin Fund management
Mediolanum Asset Management Ltd 150 49.00% Dublin Asset management and advice
Gamax Management AG 7,161 0.004% Luxembourg Fund management
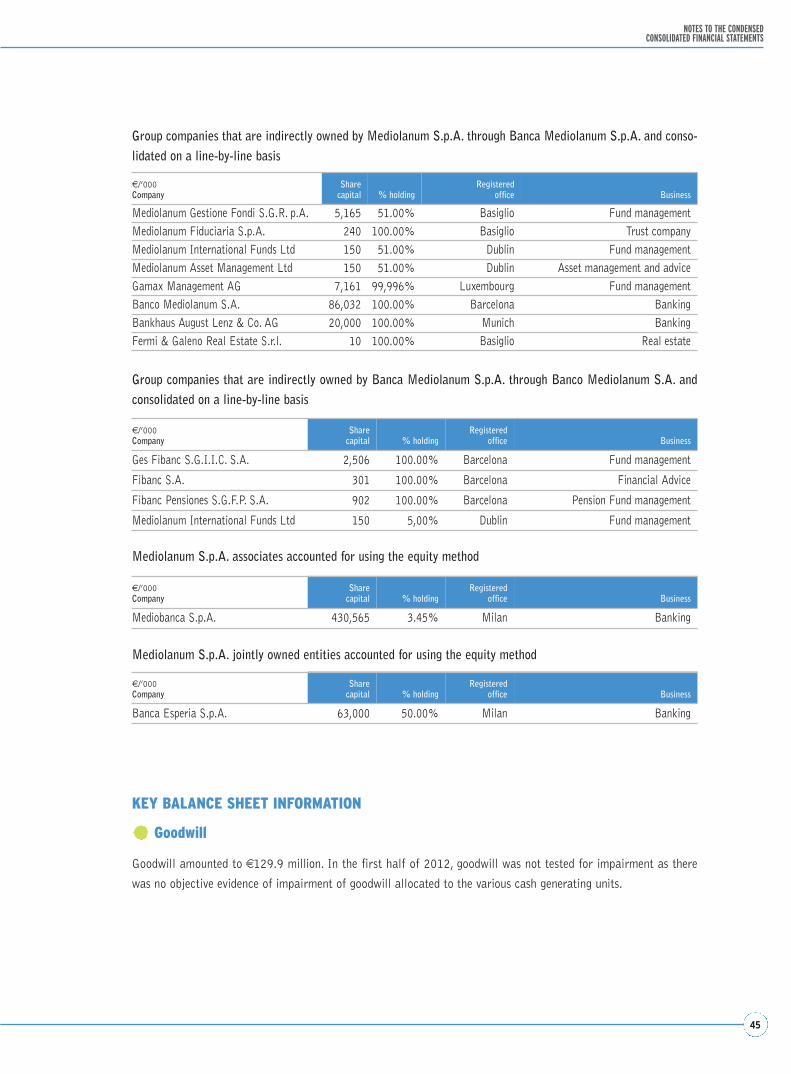
45
NOTES TO THE CONDENSED CONSOLIDATED FINANCIAL STATEMENTS
Group companies that are indirectly owned by Banca Mediolanum S.p.A. through Banco Mediolanum S.A. andconsolidated on a line-by-line basis
€/’000Company
Share capital % holding
Registered office Business
Ges Fibanc S.G.I.I.C. S.A. 2,506 100.00% Barcelona Fund management
Fibanc S.A. 301 100.00% Barcelona Financial Advice
Fibanc Pensiones S.G.F.P. S.A. 902 100.00% Barcelona Pension Fund management
Mediolanum International Funds Ltd 150 5,00% Dublin Fund management
€/’000Company
Share capital % holding
Registered office Business
Mediobanca S.p.A. 430,565 3.45% Milan Banking
€/’000Company
Share capital % holding
Registered office Business
Banca Esperia S.p.A. 63,000 50.00% Milan Banking
Group companies that are indirectly owned by Mediolanum S.p.A. through Banca Mediolanum S.p.A. and conso-lidated on a line-by-line basis
€/’000Company
Share capital % holding
Registered office Business
Mediolanum Gestione Fondi S.G.R. p.A. 5,165 51.00% Basiglio Fund managementMediolanum Fiduciaria S.p.A. 240 100.00% Basiglio Trust companyMediolanum International Funds Ltd 150 51.00% Dublin Fund managementMediolanum Asset Management Ltd 150 51.00% Dublin Asset management and adviceGamax Management AG 7,161 99,996% Luxembourg Fund managementBanco Mediolanum S.A. 86,032 100.00% Barcelona BankingBankhaus August Lenz & Co. AG 20,000 100.00% Munich BankingFermi & Galeno Real Estate S.r.l. 10 100.00% Basiglio Real estate
Mediolanum S.p.A. associates accounted for using the equity method
Mediolanum S.p.A. jointly owned entities accounted for using the equity method
KEY BALANCE SHEET INFORMATION
Goodwill
Goodwill amounted to €129.9 million. In the first half of 2012, goodwill was not tested for impairment as there
was no objective evidence of impairment of goodwill allocated to the various cash generating units.
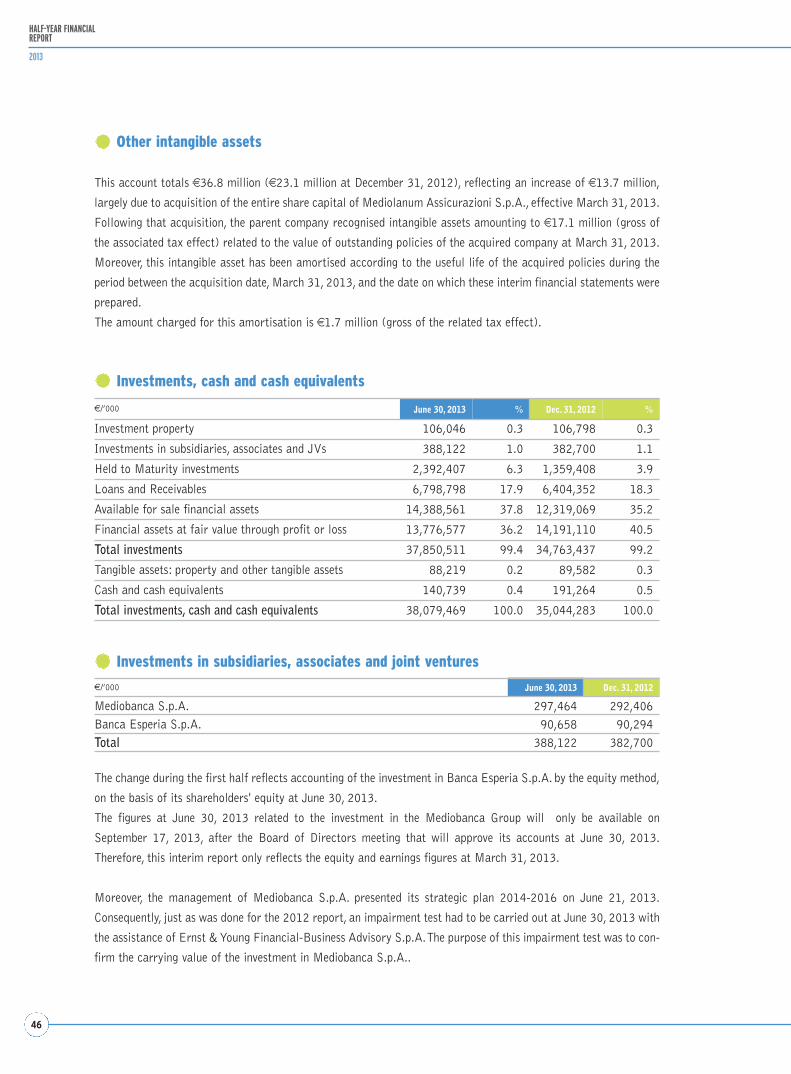
46
HALF-YEAR FINANCIALREPORT
2013
Other intangible assets
This account totals €36.8 million (€23.1 million at December 31, 2012), reflecting an increase of €13.7 million,
largely due to acquisition of the entire share capital of Mediolanum Assicurazioni S.p.A., effective March 31, 2013.
Following that acquisition, the parent company recognised intangible assets amounting to €17.1 million (gross of
the associated tax effect) related to the value of outstanding policies of the acquired company at March 31, 2013.
Moreover, this intangible asset has been amortised according to the useful life of the acquired policies during the
period between the acquisition date, March 31, 2013, and the date on which these interim financial statements were
prepared.
The amount charged for this amortisation is €1.7 million (gross of the related tax effect).
Investments, cash and cash equivalents
Investments in subsidiaries, associates and joint ventures
€/’000 June 30, 2013 % Dec. 31, 2012 %
Investment property 106,046 0.3 106,798 0.3
Investments in subsidiaries, associates and JVs 388,122 1.0 382,700 1.1
Held to Maturity investments 2,392,407 6.3 1,359,408 3.9
Loans and Receivables 6,798,798 17.9 6,404,352 18.3
Available for sale financial assets 14,388,561 37.8 12,319,069 35.2
Financial assets at fair value through profit or loss 13,776,577 36.2 14,191,110 40.5
Total investments 37,850,511 99.4 34,763,437 99.2
Tangible assets: property and other tangible assets 88,219 0.2 89,582 0.3
Cash and cash equivalents 140,739 0.4 191,264 0.5
Total investments, cash and cash equivalents 38,079,469 100.0 35,044,283 100.0
€/’000 June 30, 2013 Dec. 31, 2012
Mediobanca S.p.A. 297,464 292,406Banca Esperia S.p.A. 90,658 90,294
Total 388,122 382,700
The change during the first half reflects accounting of the investment in Banca Esperia S.p.A. by the equity method,
on the basis of its shareholders' equity at June 30, 2013.
The figures at June 30, 2013 related to the investment in the Mediobanca Group will only be available on
September 17, 2013, after the Board of Directors meeting that will approve its accounts at June 30, 2013.
Therefore, this interim report only reflects the equity and earnings figures at March 31, 2013.
Moreover, the management of Mediobanca S.p.A. presented its strategic plan 2014-2016 on June 21, 2013.
Consequently, just as was done for the 2012 report, an impairment test had to be carried out at June 30, 2013 with
the assistance of Ernst & Young Financial-Business Advisory S.p.A. The purpose of this impairment test was to con-
firm the carrying value of the investment in Mediobanca S.p.A..

47
NOTES TO THE CONDENSED CONSOLIDATED FINANCIAL STATEMENTS
Ernst & Young Financial-Business Advisory S.p.A. has issued its report on the impairment test at June 30, 2013
of the investment in Mediobanca. This report shows that on the basis of current macroeconomic and business sec-
tor trend forecasts, the results of Mediobanca S.p.A. at March 31, 2013, the strategic plan 2014-2016, the trend
of analysts' consensus, and the prepared valuation analyses, as set out in that report, there is no reason to believe
that the value in use of the investment in Mediobanca S.p.A. is less than its carrying value at June 30, 2013.
On the basis of this assessment, the Board of Directors approved the impairment test of Mediobanca S.p.A. at June
30, 2013.
Consolidated equity after minority interests and net profit for the year amounted to €7,155.6 million at March 31,
2013, up €233.3 million from €6,922.3 million at December 31, 2012.
The impact of Banca Esperia S.p.A. on the income statement in the first half of 2013 was a positive €3.6 million,
in contrast with a positive balance of €2 million in the first half of 2012.
The impact of Mediobanca S.p.A. on the income statement in 1H 2013 was negative €3.0 million.
The impact of other gains or losses recognised directly in equity was a negative balance of €2.5 million and refers
both to Banca Esperia S.p.A. and to Mediobanca S.p.A.
The analysis of Loans and Receivables is set out in the table below:
€/’000 June 30, 2013 Dec. 31, 2012
Banks 1,232,523 1,191,226Time deposits 169,227 213,715Repurchase agreements 295,979 211,774Other loans 17,402 42,594Debt securities 620,670 651,385Reserve requirements 129,245 71,758
Banking customers 5,558,291 5,204,849Current accounts 415,928 418,564Repurchase agreements 29,849 53,716Mortgage loans 3,432,871 3,221,580Debt securities 585,069 630,446Other loans 1,094,574 880,543
Other loans 7,984 8,277
Total 6,798,798 6,404,352
Loans and Receivables amounted to €6,798.8 million, up €394.4 million from the balance of €6,404.4 million at
December 31, 2012.
Growth was driven mainly by loans to and receivables from banking customers (€353.4 million), especially mort-
gage loans, repurchase agreements and other transactions, notably deposits with the Cassa Compensazione e
Garanzia.
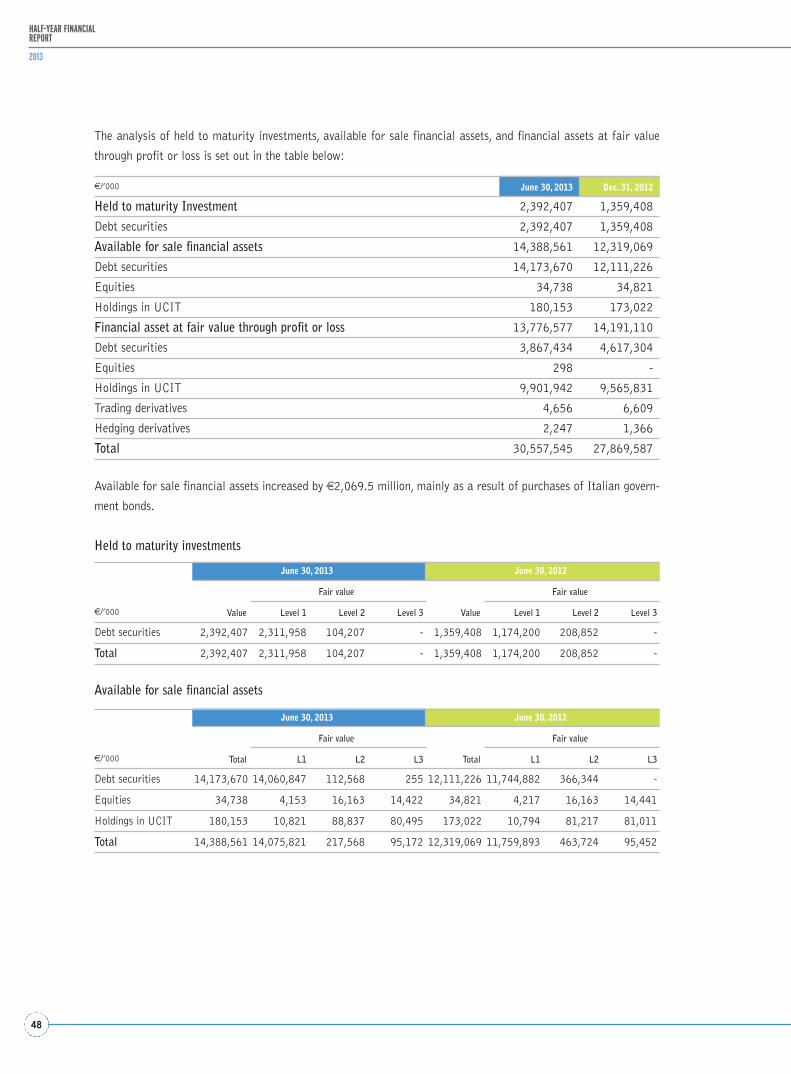
48
HALF-YEAR FINANCIALREPORT
2013
The analysis of held to maturity investments, available for sale financial assets, and financial assets at fair value
through profit or loss is set out in the table below:
€/’000 June 30, 2013 Dec. 31, 2012
Held to maturity Investment 2,392,407 1,359,408
Debt securities 2,392,407 1,359,408
Available for sale financial assets 14,388,561 12,319,069
Debt securities 14,173,670 12,111,226
Equities 34,738 34,821
Holdings in UCIT 180,153 173,022
Financial asset at fair value through profit or loss 13,776,577 14,191,110
Debt securities 3,867,434 4,617,304
Equities 298 -
Holdings in UCIT 9,901,942 9,565,831
Trading derivatives 4,656 6,609
Hedging derivatives 2,247 1,366
Total 30,557,545 27,869,587
Available for sale financial assets increased by €2,069.5 million, mainly as a result of purchases of Italian govern-
ment bonds.
Held to maturity investments
€/’000
June 30, 2013 June 30, 2012
Value
Fair value
Value
Fair value
Level 1 Level 2 Level 3 Level 1 Level 2 Level 3
Debt securities 2,392,407 2,311,958 104,207 - 1,359,408 1,174,200 208,852 -
Total 2,392,407 2,311,958 104,207 - 1,359,408 1,174,200 208,852 -
Available for sale financial assets
€/’000
June 30, 2013 June 30, 2012
Total
Fair value
Total
Fair value
L1 L2 L3 L1 L2 L3
Debt securities 14,173,670 14,060,847 112,568 255 12,111,226 11,744,882 366,344 -
Equities 34,738 4,153 16,163 14,422 34,821 4,217 16,163 14,441
Holdings in UCIT 180,153 10,821 88,837 80,495 173,022 10,794 81,217 81,011
Total 14,388,561 14,075,821 217,568 95,172 12,319,069 11,759,893 463,724 95,452
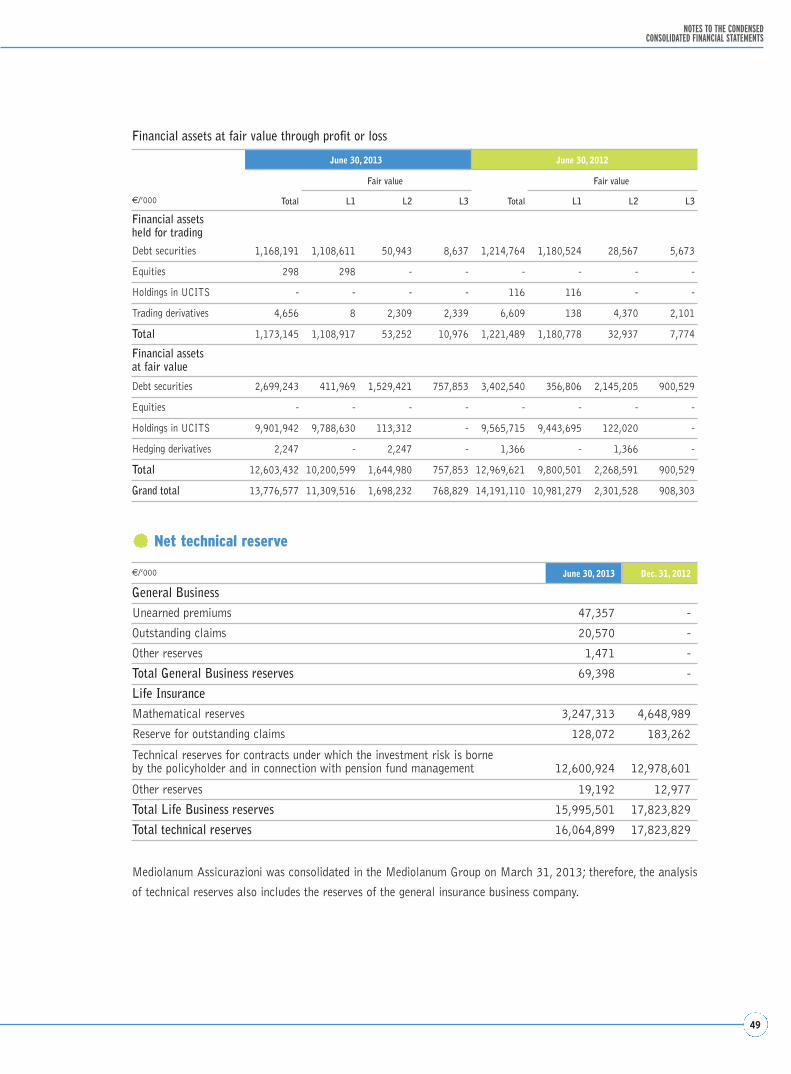
49
NOTES TO THE CONDENSED CONSOLIDATED FINANCIAL STATEMENTS
Financial assets at fair value through profit or loss
€/’000 June 30, 2013 Dec. 31, 2012
General BusinessUnearned premiums 47,357 -
Outstanding claims 20,570 -
Other reserves 1,471 -
Total General Business reserves 69,398 -
Life InsuranceMathematical reserves 3,247,313 4,648,989
Reserve for outstanding claims 128,072 183,262
Technical reserves for contracts under which the investment risk is borneby the policyholder and in connection with pension fund management 12,600,924 12,978,601
Other reserves 19,192 12,977
Total Life Business reserves 15,995,501 17,823,829
Total technical reserves 16,064,899 17,823,829
€/’000
June 30, 2013 June 30, 2012
Total
Fair value
Total
Fair value
L1 L2 L3 L1 L2 L3
Financial assets held for tradingDebt securities 1,168,191 1,108,611 50,943 8,637 1,214,764 1,180,524 28,567 5,673
Equities 298 298 - - - - - -
Holdings in UCITS - - - - 116 116 - -
Trading derivatives 4,656 8 2,309 2,339 6,609 138 4,370 2,101
Total 1,173,145 1,108,917 53,252 10,976 1,221,489 1,180,778 32,937 7,774
Financial assets at fair value
Debt securities 2,699,243 411,969 1,529,421 757,853 3,402,540 356,806 2,145,205 900,529
Equities - - - - - - - -
Holdings in UCITS 9,901,942 9,788,630 113,312 - 9,565,715 9,443,695 122,020 -
Hedging derivatives 2,247 - 2,247 - 1,366 - 1,366 -
Total 12,603,432 10,200,599 1,644,980 757,853 12,969,621 9,800,501 2,268,591 900,529
Grand total 13,776,577 11,309,516 1,698,232 768,829 14,191,110 10,981,279 2,301,528 908,303
Net technical reserve
Mediolanum Assicurazioni was consolidated in the Mediolanum Group on March 31, 2013; therefore, the analysis
of technical reserves also includes the reserves of the general insurance business company.
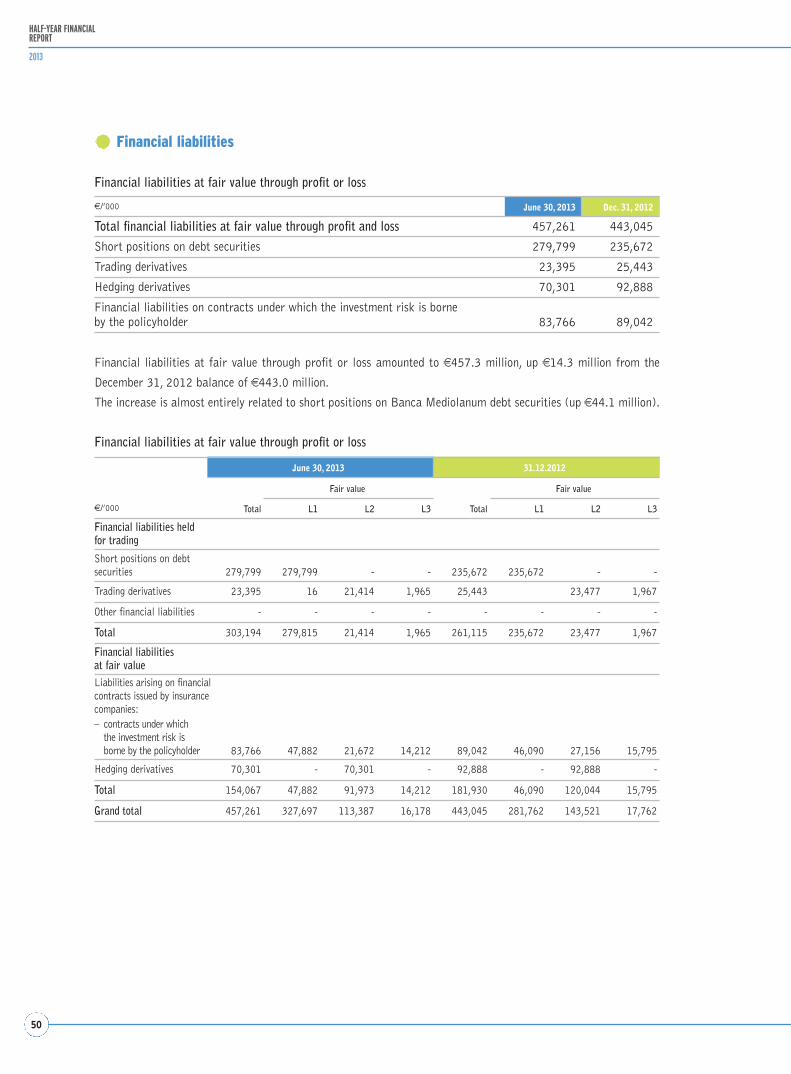
50
HALF-YEAR FINANCIALREPORT
2013
€/’000
June 30, 2013 31.12.2012
Total
Fair value
Total
Fair value
L1 L2 L3 L1 L2 L3
Financial liabilities heldfor trading
Short positions on debtsecurities 279,799 279,799 - - 235,672 235,672 - -
Trading derivatives 23,395 16 21,414 1,965 25,443 23,477 1,967
Other financial liabilities - - - - - - - -
Total 303,194 279,815 21,414 1,965 261,115 235,672 23,477 1,967
Financial liabilities at fair valueLiabilities arising on financial contracts issued by insurance companies:– contracts under which
the investment risk isborne by the policyholder 83,766 47,882 21,672 14,212 89,042 46,090 27,156 15,795
Hedging derivatives 70,301 - 70,301 - 92,888 - 92,888 -
Total 154,067 47,882 91,973 14,212 181,930 46,090 120,044 15,795
Grand total 457,261 327,697 113,387 16,178 443,045 281,762 143,521 17,762
€/’000 June 30, 2013 Dec. 31, 2012
Total financial liabilities at fair value through profit and loss 457,261 443,045
Short positions on debt securities 279,799 235,672
Trading derivatives 23,395 25,443
Hedging derivatives 70,301 92,888
Financial liabilities on contracts under which the investment risk is borneby the policyholder 83,766 89,042
Financial liabilities
Financial liabilities at fair value through profit or loss
Financial liabilities at fair value through profit or loss amounted to €457.3 million, up €14.3 million from the
December 31, 2012 balance of €443.0 million.
The increase is almost entirely related to short positions on Banca Mediolanum debt securities (up €44.1 million).
Financial liabilities at fair value through profit or loss
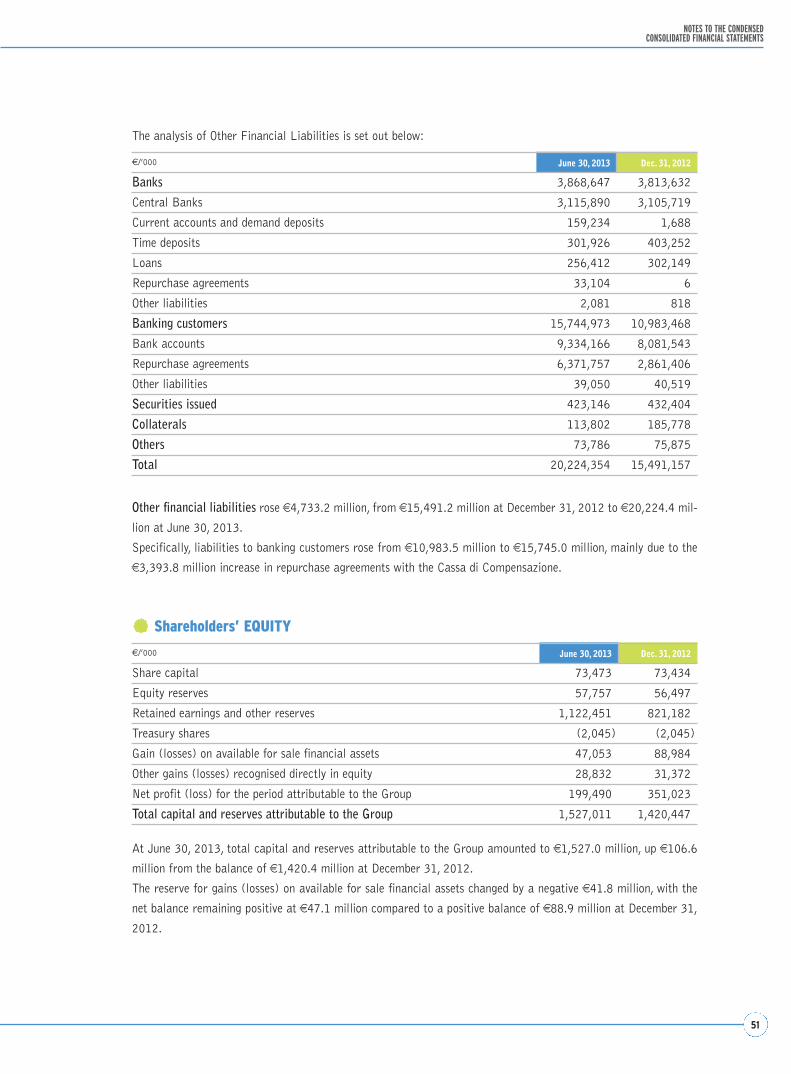
51
NOTES TO THE CONDENSED CONSOLIDATED FINANCIAL STATEMENTS
€/’000 June 30, 2013 Dec. 31, 2012
Banks 3,868,647 3,813,632
Central Banks 3,115,890 3,105,719
Current accounts and demand deposits 159,234 1,688
Time deposits 301,926 403,252
Loans 256,412 302,149
Repurchase agreements 33,104 6
Other liabilities 2,081 818
Banking customers 15,744,973 10,983,468
Bank accounts 9,334,166 8,081,543
Repurchase agreements 6,371,757 2,861,406
Other liabilities 39,050 40,519
Securities issued 423,146 432,404
Collaterals 113,802 185,778
Others 73,786 75,875
Total 20,224,354 15,491,157
€/’000 June 30, 2013 Dec. 31, 2012
Share capital 73,473 73,434
Equity reserves 57,757 56,497
Retained earnings and other reserves 1,122,451 821,182
Treasury shares (2,045) (2,045)
Gain (losses) on available for sale financial assets 47,053 88,984
Other gains (losses) recognised directly in equity 28,832 31,372
Net profit (loss) for the period attributable to the Group 199,490 351,023
Total capital and reserves attributable to the Group 1,527,011 1,420,447
The analysis of Other Financial Liabilities is set out below:
Other financial liabilities rose €4,733.2 million, from €15,491.2 million at December 31, 2012 to €20,224.4 mil-
lion at June 30, 2013.
Specifically, liabilities to banking customers rose from €10,983.5 million to €15,745.0 million, mainly due to the
€3,393.8 million increase in repurchase agreements with the Cassa di Compensazione.
Shareholders’ EQUITY
At June 30, 2013, total capital and reserves attributable to the Group amounted to €1,527.0 million, up €106.6
million from the balance of €1,420.4 million at December 31, 2012.
The reserve for gains (losses) on available for sale financial assets changed by a negative €41.8 million, with the
net balance remaining positive at €47.1 million compared to a positive balance of €88.9 million at December 31,
2012.
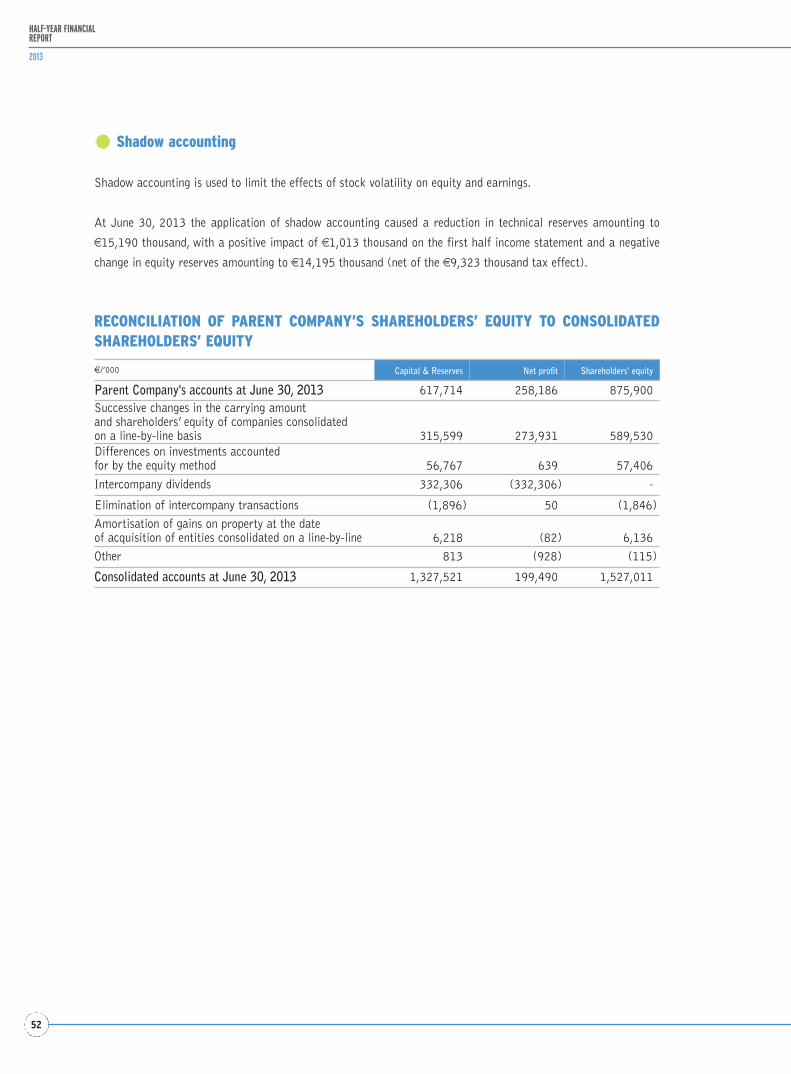
52
HALF-YEAR FINANCIALREPORT
2013
Shadow accounting
Shadow accounting is used to limit the effects of stock volatility on equity and earnings.
At June 30, 2013 the application of shadow accounting caused a reduction in technical reserves amounting to
€15,190 thousand, with a positive impact of €1,013 thousand on the first half income statement and a negative
change in equity reserves amounting to €14,195 thousand (net of the €9,323 thousand tax effect).
RECONCILIATION OF PARENT COMPANY’S SHAREHOLDERS’ EQUITY TO CONSOLIDATEDSHAREHOLDERS’ EQUITY
€/’000 Capital & Reserves Net profit Shareholders' equity
Parent Company's accounts at June 30, 2013 617,714 258,186 875,900Successive changes in the carrying amountand shareholders’ equity of companies consolidated on a line-by-line basis 315,599 273,931 589,530Differences on investments accountedfor by the equity method 56,767 639 57,406
Intercompany dividends 332,306 (332,306) -
Elimination of intercompany transactions (1,896) 50 (1,846)
Amortisation of gains on property at the dateof acquisition of entities consolidated on a line-by-line 6,218 (82) 6,136
Other 813 (928) (115)
Consolidated accounts at June 30, 2013 1,327,521 199,490 1,527,011
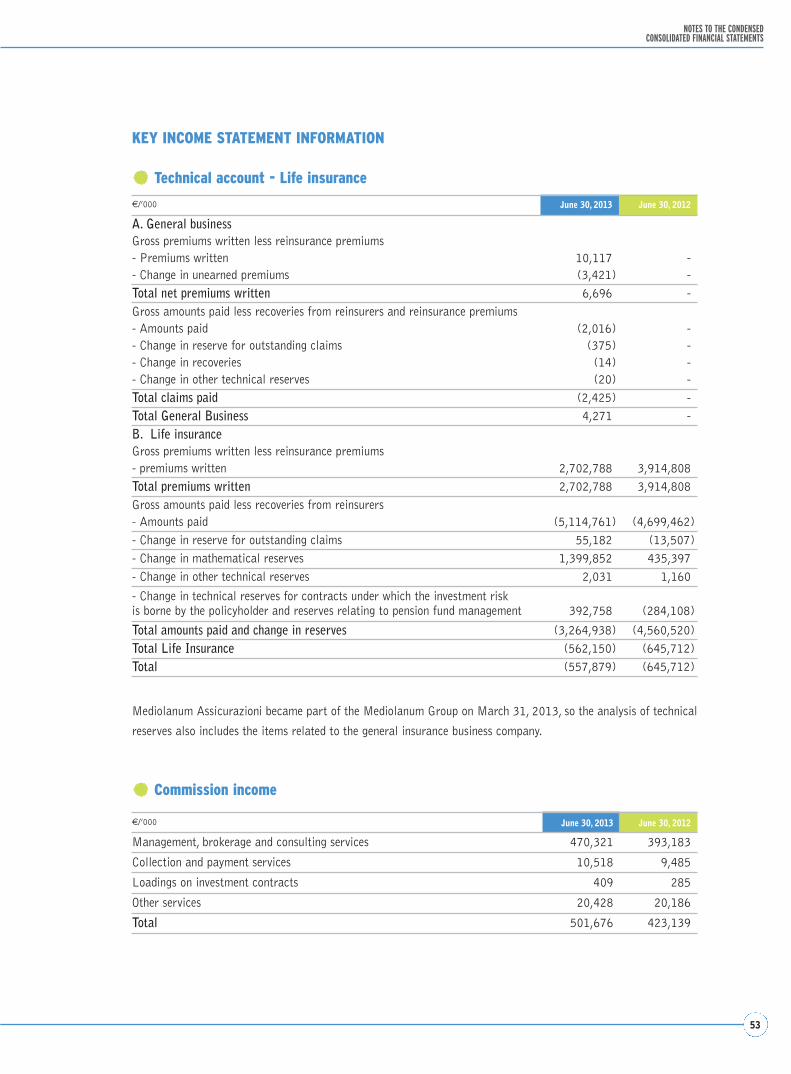
53
NOTES TO THE CONDENSED CONSOLIDATED FINANCIAL STATEMENTS
€/’000 June 30, 2013 June 30, 2012
Management, brokerage and consulting services 470,321 393,183
Collection and payment services 10,518 9,485
Loadings on investment contracts 409 285
Other services 20,428 20,186
Total 501,676 423,139
KEY INCOME STATEMENT INFORMATION
Technical account - Life insurance
€/’000 June 30, 2013 June 30, 2012
A. General businessGross premiums written less reinsurance premiums- Premiums written 10,117 -- Change in unearned premiums (3,421) -
Total net premiums written 6,696 -Gross amounts paid less recoveries from reinsurers and reinsurance premiums- Amounts paid (2,016) -- Change in reserve for outstanding claims (375) -- Change in recoveries (14) -- Change in other technical reserves (20) -
Total claims paid (2,425) -
Total General Business 4,271 -
B. Life insuranceGross premiums written less reinsurance premiums- premiums written 2,702,788 3,914,808
Total premiums written 2,702,788 3,914,808Gross amounts paid less recoveries from reinsurers- Amounts paid (5,114,761) (4,699,462)- Change in reserve for outstanding claims 55,182 (13,507)- Change in mathematical reserves 1,399,852 435,397- Change in other technical reserves 2,031 1,160
- Change in technical reserves for contracts under which the investment riskis borne by the policyholder and reserves relating to pension fund management 392,758 (284,108)
Total amounts paid and change in reserves (3,264,938) (4,560,520)
Total Life Insurance (562,150) (645,712)
Total (557,879) (645,712)
Mediolanum Assicurazioni became part of the Mediolanum Group on March 31, 2013, so the analysis of technical
reserves also includes the items related to the general insurance business company.
Commission income
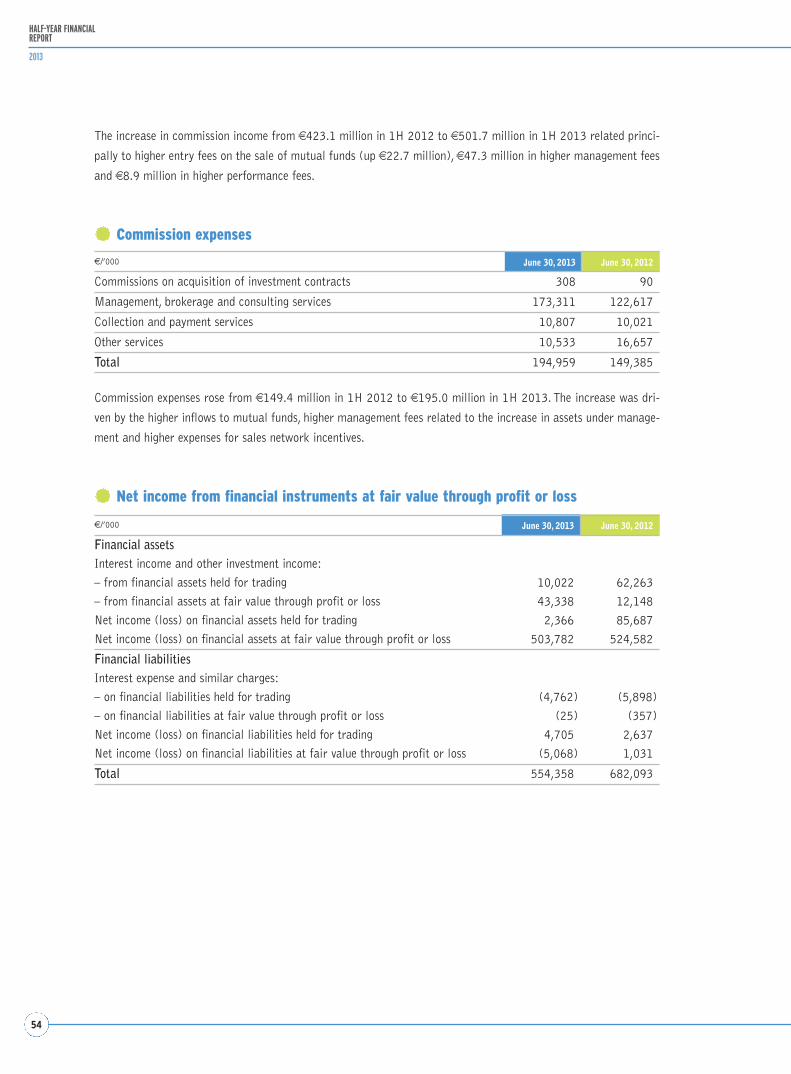
54
HALF-YEAR FINANCIALREPORT
2013
€/’000 June 30, 2013 June 30, 2012
Commissions on acquisition of investment contracts 308 90
Management, brokerage and consulting services 173,311 122,617
Collection and payment services 10,807 10,021
Other services 10,533 16,657
Total 194,959 149,385
The increase in commission income from €423.1 million in 1H 2012 to €501.7 million in 1H 2013 related princi-
pally to higher entry fees on the sale of mutual funds (up €22.7 million), €47.3 million in higher management fees
and €8.9 million in higher performance fees.
Commission expenses
€/’000 June 30, 2013 June 30, 2012
Financial assetsInterest income and other investment income:
– from financial assets held for trading 10,022 62,263
– from financial assets at fair value through profit or loss 43,338 12,148
Net income (loss) on financial assets held for trading 2,366 85,687
Net income (loss) on financial assets at fair value through profit or loss 503,782 524,582
Financial liabilitiesInterest expense and similar charges:
– on financial liabilities held for trading (4,762) (5,898)
– on financial liabilities at fair value through profit or loss (25) (357)
Net income (loss) on financial liabilities held for trading 4,705 2,637
Net income (loss) on financial liabilities at fair value through profit or loss (5,068) 1,031
Total 554,358 682,093
Commission expenses rose from €149.4 million in 1H 2012 to €195.0 million in 1H 2013. The increase was dri-
ven by the higher inflows to mutual funds, higher management fees related to the increase in assets under manage-
ment and higher expenses for sales network incentives.
Net income from financial instruments at fair value through profit or loss
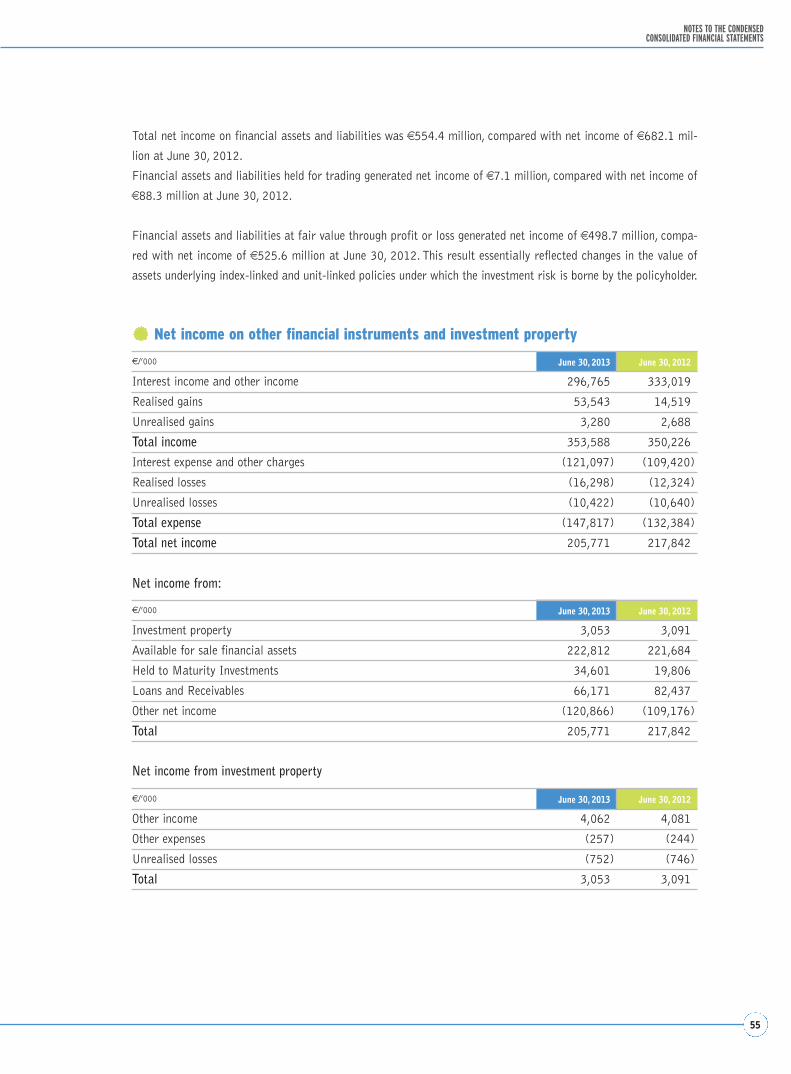
55
NOTES TO THE CONDENSED CONSOLIDATED FINANCIAL STATEMENTS
Total net income on financial assets and liabilities was €554.4 million, compared with net income of €682.1 mil-
lion at June 30, 2012.
Financial assets and liabilities held for trading generated net income of €7.1 million, compared with net income of
€88.3 million at June 30, 2012.
Financial assets and liabilities at fair value through profit or loss generated net income of €498.7 million, compa-
red with net income of €525.6 million at June 30, 2012. This result essentially reflected changes in the value of
assets underlying index-linked and unit-linked policies under which the investment risk is borne by the policyholder.
Net income on other financial instruments and investment property
€/’000 June 30, 2013 June 30, 2012
Interest income and other income 296,765 333,019
Realised gains 53,543 14,519
Unrealised gains 3,280 2,688
Total income 353,588 350,226
Interest expense and other charges (121,097) (109,420)
Realised losses (16,298) (12,324)
Unrealised losses (10,422) (10,640)
Total expense (147,817) (132,384)
Total net income 205,771 217,842
€/’000 June 30, 2013 June 30, 2012
Investment property 3,053 3,091
Available for sale financial assets 222,812 221,684
Held to Maturity Investments 34,601 19,806
Loans and Receivables 66,171 82,437
Other net income (120,866) (109,176)
Total 205,771 217,842
Net income from:
Net income from investment property
€/’000 June 30, 2013 June 30, 2012
Other income 4,062 4,081
Other expenses (257) (244)
Unrealised losses (752) (746)
Total 3,053 3,091

56
HALF-YEAR FINANCIALREPORT
2013
Net income from available for sale financial assets
Net income from held to maturity investments
€/’000 June 30, 2013 June 30, 2012
Interest income and other income 72,125 87,170
Realised gains 14 124
Unrealised gains 3,277 2,688
Realised losses (34) (5)
Unrealised losses (9,211) (7,540)
Total 66,171 82,437
Net income from loans and receivables
€/’000 June 30, 2013 June 30, 2012
Interest income and other income 185,977 221,992
Realised gains 53,508 14,365
Realised losses (16,214) (12,319)
Unrealised losses (459) (2,354)
Total 222,812 221,684
Net expense from financial liabilities
€/’000 June 30, 2013 June 30, 2012
Interest expense and other charges (120,840) (109,176)
Realised gains 21 -
Unrealised gains 3 -
Realised losses (50) -
Total (120,866) (109,176)
€/’000 June 30, 2013 June 30, 2012
Interest income and other income 34,601 19,776
Realised gains - 30
Total 34,601 19,806
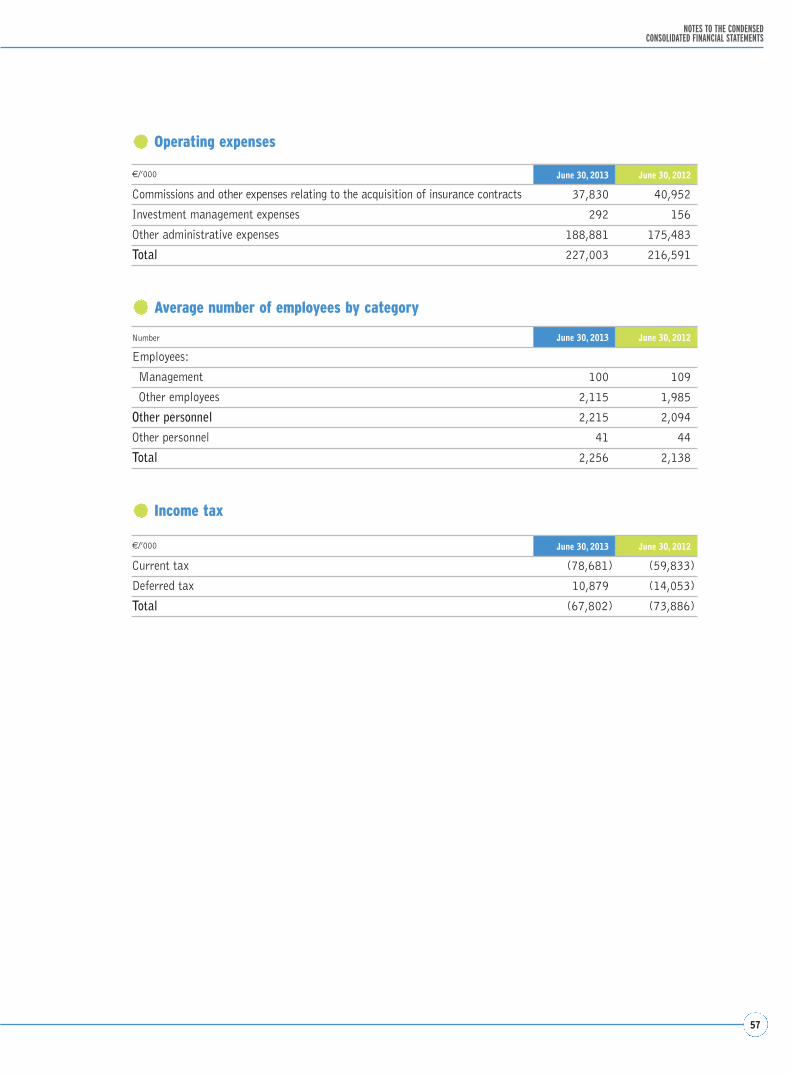
57
NOTES TO THE CONDENSED CONSOLIDATED FINANCIAL STATEMENTS
€/’000 June 30, 2013 June 30, 2012
Commissions and other expenses relating to the acquisition of insurance contracts 37,830 40,952
Investment management expenses 292 156
Other administrative expenses 188,881 175,483
Total 227,003 216,591
Number June 30, 2013 June 30, 2012
Employees:
Management 100 109
Other employees 2,115 1,985
Other personnel 2,215 2,094
Other personnel 41 44
Total 2,256 2,138
€/’000 June 30, 2013 June 30, 2012
Current tax (78,681) (59,833)
Deferred tax 10,879 (14,053)
Total (67,802) (73,886)
Operating expenses
Average number of employees by category
Income tax
58
HALF-YEAR FINANCIALREPORT
2013
BUSINESS COMBINATIONS
Following authorisation by IVASS on March 19, 2013, Mediolanum S.p.A. acquired the entire share capital of
Mediolanum Assicurazioni S.p.A. on March 26, 2013, effective March 31, 2013.
Mediolanum Assicurazioni S.p.A. – whose business complements that of the Mediolanum Group, thus accounting
for its interest in the acquisition – is active in the insurance and reinsurance business. It offers insurance products
to retail customers, with standardised policies providing protection for the family, individuals, assets and property
(i.e. basic insurance businesses, excluding car liability insurance).
The purchase price, initially set at €35.9 million, was adjusted in accordance with the agreement on the basis of the
adjusted shareholders’ equity of the company at March 31, 2013, as confirmed by the accounting due diligence and
value of outstanding policies written calculated at the same date by the independent actuary.
Since the adjusted shareholders’ equity of the company at March 31, 2013 was €33.4 million, and the value of out-
standing policies written was €11.2 million net of the related tax effect, the final price was set at €44.6 million.
Because the sellers were the controlling shareholders of both Mediolanum S.p.A. (the acquiring company) and
Mediolanum Assicurazioni S.p.A. (the acquired company), the transaction qualified as a related party transaction
of “minor significance” (in accordance with the criteria set out in the “Procedures pursuant to Article 4 of Consob
Resolution no. 17221”).
IFRS 3, which regulates business combinations, was applied for first-time consolidation of the new subsidiary.
This standard envisages that upon first-time consolidation, all the assets and liabilities of the acquired company and
consequent consolidation be measured at fair value, which corresponds to the price at which an asset could be
exchanged or a liability extinguished in a normal transaction between informed and independent parties, at the
effective date of the transaction. In this context, all identifiable assets must be recognised and measured, including
any intangible assets having a definite useful life, and any other liabilities not recognised on the statement of finan-
cial position in accordance with IFRSs.
The business combination did not result in the recognition of any business combination.
The fair value measurement of the acquired company at the acquisition date revealed that the value of outstanding
policies written recognised under intangible assets having a definite useful life was €17.1 million before the tax
effect.
59
NOTES TO THE CONDENSED CONSOLIDATED FINANCIAL STATEMENTS
INCOME STATEMENT INFORMATION BY OPERATING SEGMENT
This section presents consolidated financial information by operating segment. In compliance with IFRS 8, segment
reporting reflects the management reporting approach of the Mediolanum Group, and is consistent with the infor-
mation disclosed to the market and to the various stakeholders.
Exclusively for the sake of comparability of financial information, certain reclassifications were made with respect
to comparative information at June 30, 2012.
Note on the method applied to segment reporting
Mediolanum Assicurazioni became a part of the Mediolanum on March 31, 2013. Following its consolidation at
that date, the income segment for the business segment that was previously named “Life” also contains the profits
and loss related to the general business, and was thus renamed “Insurance”.
Pursuant to IFRS 8, for the purpose of segment reporting of consolidated results the Mediolanum Group identified
the following operating segments:
• ITALY – INSURANCE
• ITALY – LIFE
• ITALY – ASSET MANAGEMENT
• ITALY – BANKING
• ITALY – OTHER
• SPAIN
• GERMANY
For the purpose of segment reporting, income and expense items were directly assigned to the various segments by
product type. Indirect costs and other residual items were spread over the various segments applying allocation poli-
cies.
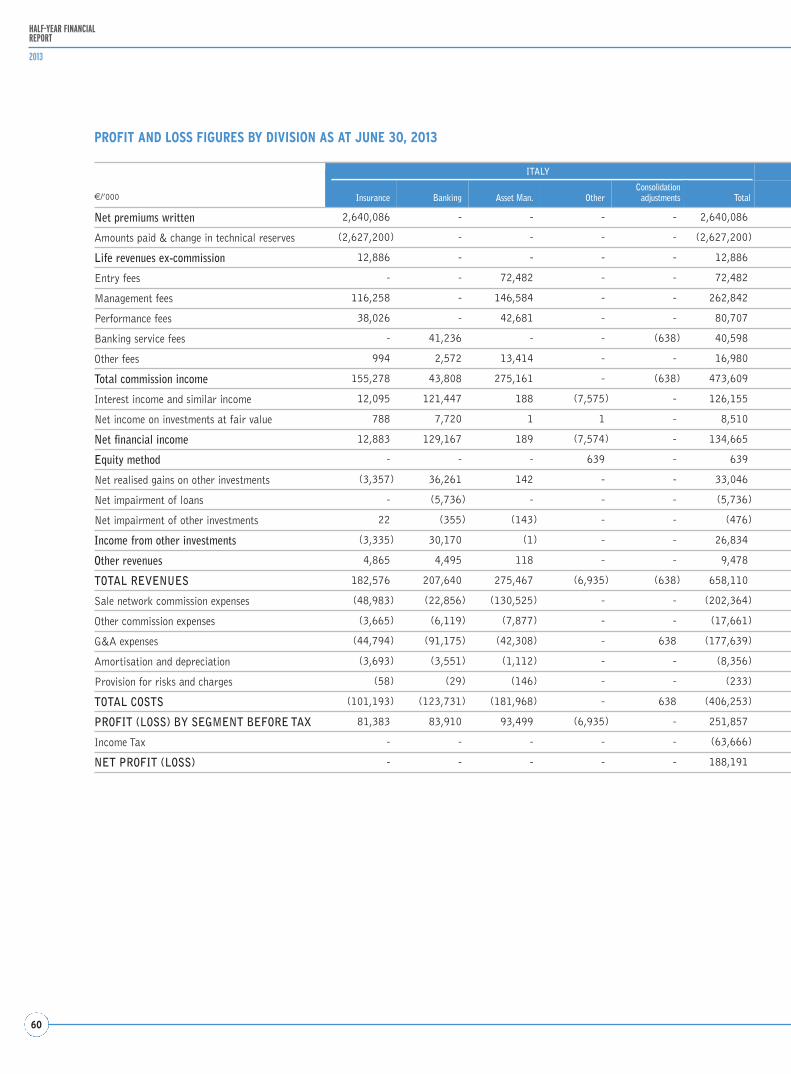
60
HALF-YEAR FINANCIALREPORT
2013
PROFIT AND LOSS FIGURES BY DIVISION AS AT JUNE 30, 2013
ò ITALY
€/’000 Insurance Banking Asset Man. OtherConsolidation
adjustments Total
Net premiums written 2,640,086 - - - - 2,640,086
Amounts paid & change in technical reserves (2,627,200) - - - - (2,627,200)
Life revenues ex-commission 12,886 - - - - 12,886
Entry fees - - 72,482 - - 72,482
Management fees 116,258 - 146,584 - - 262,842
Performance fees 38,026 - 42,681 - - 80,707
Banking service fees - 41,236 - - (638) 40,598
Other fees 994 2,572 13,414 - - 16,980
Total commission income 155,278 43,808 275,161 - (638) 473,609
Interest income and similar income 12,095 121,447 188 (7,575) - 126,155
Net income on investments at fair value 788 7,720 1 1 - 8,510
Net financial income 12,883 129,167 189 (7,574) - 134,665
Equity method - - - 639 - 639
Net realised gains on other investments (3,357) 36,261 142 - - 33,046
Net impairment of loans - (5,736) - - - (5,736)
Net impairment of other investments 22 (355) (143) - - (476)
Income from other investments (3,335) 30,170 (1) - - 26,834
Other revenues 4,865 4,495 118 - - 9,478
TOTAL REVENUES 182,576 207,640 275,467 (6,935) (638) 658,110
Sale network commission expenses (48,983) (22,856) (130,525) - - (202,364)
Other commission expenses (3,665) (6,119) (7,877) - - (17,661)
G&A expenses (44,794) (91,175) (42,308) - 638 (177,639)
Amortisation and depreciation (3,693) (3,551) (1,112) - - (8,356)
Provision for risks and charges (58) (29) (146) - - (233)
TOTAL COSTS (101,193) (123,731) (181,968) - 638 (406,253)
PROFIT (LOSS) BY SEGMENT BEFORE TAX 81,383 83,910 93,499 (6,935) - 251,857
Income Tax - - - - - (63,666)
NET PROFIT (LOSS) - - - - - 188,191
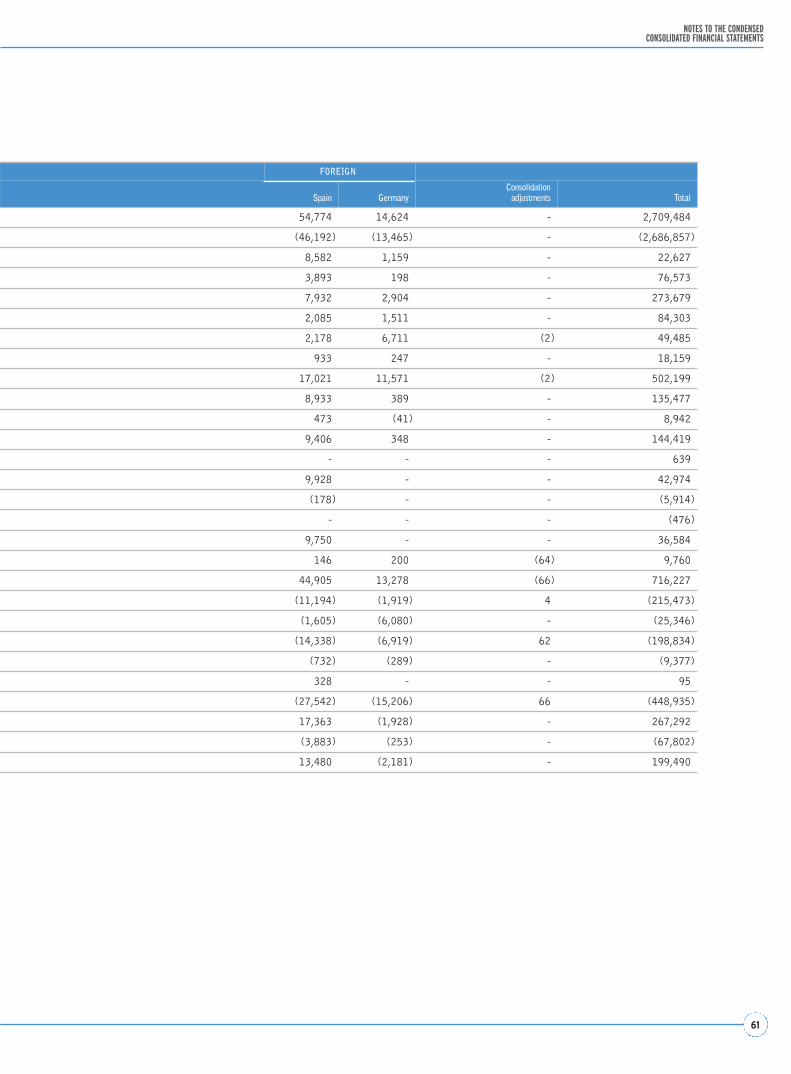
61
NOTES TO THE CONDENSED CONSOLIDATED FINANCIAL STATEMENTS
ò FOREIGN
Spain GermanyConsolidation
adjustments Total
54,774 14,624 - 2,709,484
(46,192) (13,465) - (2,686,857)
8,582 1,159 - 22,627
3,893 198 - 76,573
7,932 2,904 - 273,679
2,085 1,511 - 84,303
2,178 6,711 (2) 49,485
933 247 - 18,159
17,021 11,571 (2) 502,199
8,933 389 - 135,477
473 (41) - 8,942
9,406 348 - 144,419
- - - 639
9,928 - - 42,974
(178) - - (5,914)
- - - (476)
9,750 - - 36,584
146 200 (64) 9,760
44,905 13,278 (66) 716,227
(11,194) (1,919) 4 (215,473)
(1,605) (6,080) - (25,346)
(14,338) (6,919) 62 (198,834)
(732) (289) - (9,377)
328 - - 95
(27,542) (15,206) 66 (448,935)
17,363 (1,928) - 267,292
(3,883) (253) - (67,802)
13,480 (2,181) - 199,490
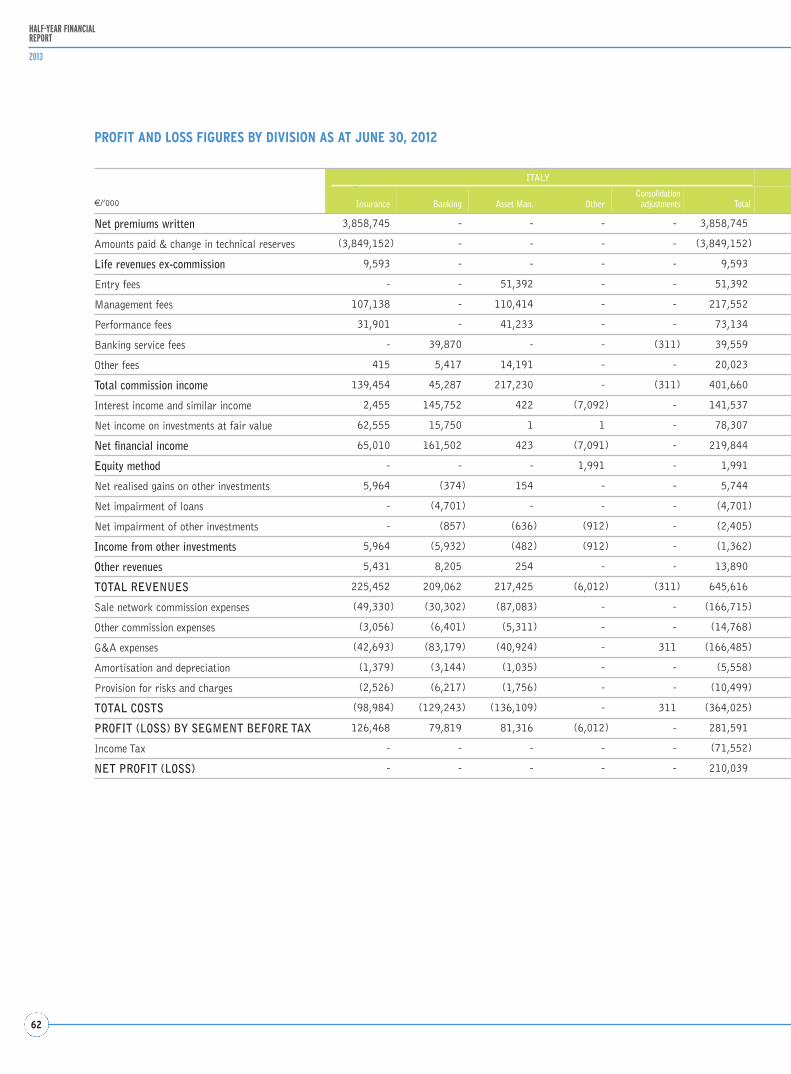
62
HALF-YEAR FINANCIALREPORT
2013
PROFIT AND LOSS FIGURES BY DIVISION AS AT JUNE 30, 2012
ò ITALY
€/’000 Insurance Banking Asset Man. OtherConsolidation
adjustments Total
Net premiums written 3,858,745 - - - - 3,858,745
Amounts paid & change in technical reserves (3,849,152) - - - - (3,849,152)
Life revenues ex-commission 9,593 - - - - 9,593
Entry fees - - 51,392 - - 51,392
Management fees 107,138 - 110,414 - - 217,552
Performance fees 31,901 - 41,233 - - 73,134
Banking service fees - 39,870 - - (311) 39,559
Other fees 415 5,417 14,191 - - 20,023
Total commission income 139,454 45,287 217,230 - (311) 401,660
Interest income and similar income 2,455 145,752 422 (7,092) - 141,537
Net income on investments at fair value 62,555 15,750 1 1 - 78,307
Net financial income 65,010 161,502 423 (7,091) - 219,844
Equity method - - - 1,991 - 1,991
Net realised gains on other investments 5,964 (374) 154 - - 5,744
Net impairment of loans - (4,701) - - - (4,701)
Net impairment of other investments - (857) (636) (912) - (2,405)
Income from other investments 5,964 (5,932) (482) (912) - (1,362)
Other revenues 5,431 8,205 254 - - 13,890
TOTAL REVENUES 225,452 209,062 217,425 (6,012) (311) 645,616
Sale network commission expenses (49,330) (30,302) (87,083) - - (166,715)
Other commission expenses (3,056) (6,401) (5,311) - - (14,768)
G&A expenses (42,693) (83,179) (40,924) - 311 (166,485)
Amortisation and depreciation (1,379) (3,144) (1,035) - - (5,558)
Provision for risks and charges (2,526) (6,217) (1,756) - - (10,499)
TOTAL COSTS (98,984) (129,243) (136,109) - 311 (364,025)
PROFIT (LOSS) BY SEGMENT BEFORE TAX 126,468 79,819 81,316 (6,012) - 281,591
Income Tax - - - - - (71,552)
NET PROFIT (LOSS) - - - - - 210,039
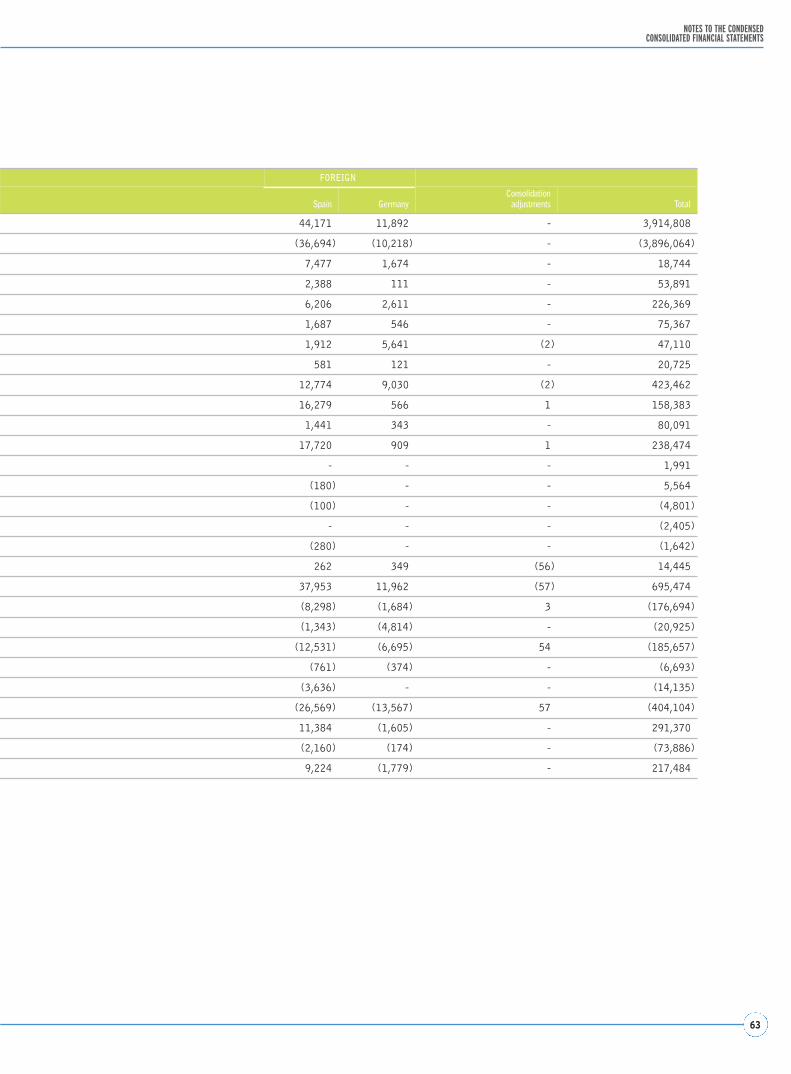
63
NOTES TO THE CONDENSED CONSOLIDATED FINANCIAL STATEMENTS
ò FOREIGN
Spain GermanyConsolidation
adjustments Total
44,171 11,892 - 3,914,808
(36,694) (10,218) - (3,896,064)
7,477 1,674 - 18,744
2,388 111 - 53,891
6,206 2,611 - 226,369
1,687 546 - 75,367
1,912 5,641 (2) 47,110
581 121 - 20,725
12,774 9,030 (2) 423,462
16,279 566 1 158,383
1,441 343 - 80,091
17,720 909 1 238,474
- - - 1,991
(180) - - 5,564
(100) - - (4,801)
- - - (2,405)
(280) - - (1,642)
262 349 (56) 14,445
37,953 11,962 (57) 695,474
(8,298) (1,684) 3 (176,694)
(1,343) (4,814) - (20,925)
(12,531) (6,695) 54 (185,657)
(761) (374) - (6,693)
(3,636) - - (14,135)
(26,569) (13,567) 57 (404,104)
11,384 (1,605) - 291,370
(2,160) (174) - (73,886)
9,224 (1,779) - 217,484
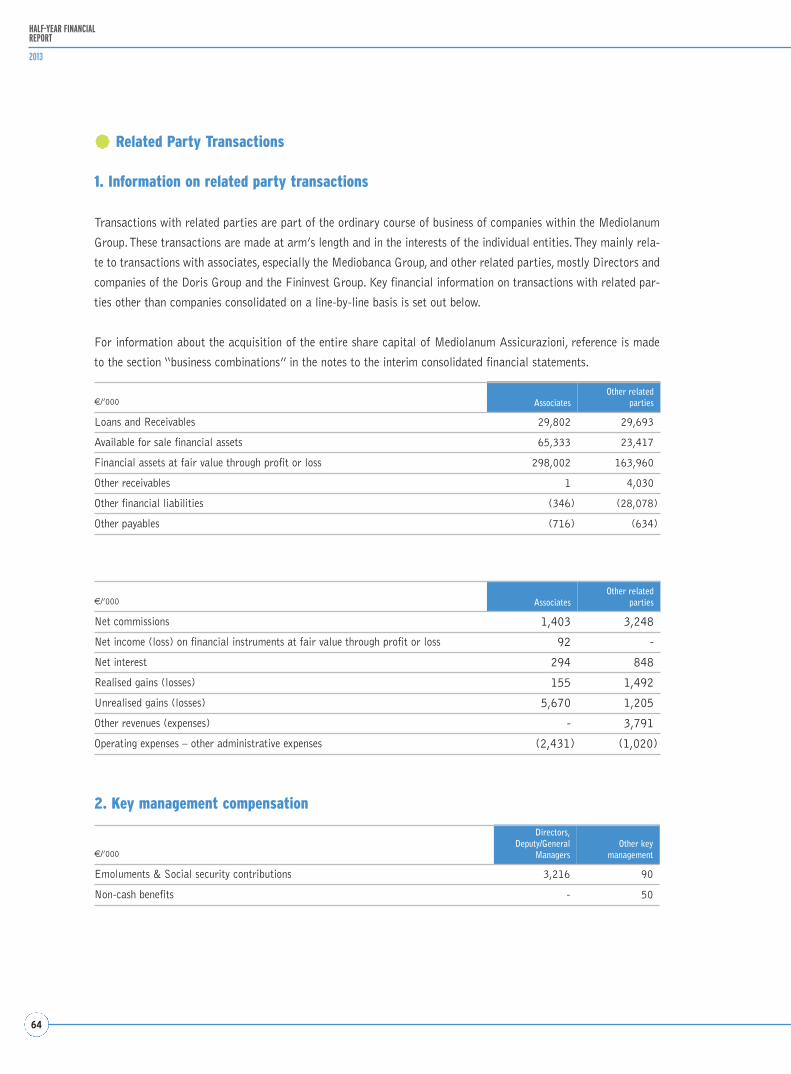
64
HALF-YEAR FINANCIALREPORT
2013
Related Party Transactions
1. Information on related party transactions
Transactions with related parties are part of the ordinary course of business of companies within the Mediolanum
Group. These transactions are made at arm’s length and in the interests of the individual entities. They mainly rela-
te to transactions with associates, especially the Mediobanca Group, and other related parties, mostly Directors and
companies of the Doris Group and the Fininvest Group. Key financial information on transactions with related par-
ties other than companies consolidated on a line-by-line basis is set out below.
For information about the acquisition of the entire share capital of Mediolanum Assicurazioni, reference is made
to the section “business combinations” in the notes to the interim consolidated financial statements.
€/’000 AssociatesOther related
parties
Loans and Receivables 29,802 29,693
Available for sale financial assets 65,333 23,417
Financial assets at fair value through profit or loss 298,002 163,960
Other receivables 1 4,030
Other financial liabilities (346) (28,078)
Other payables (716) (634)
€/’000 AssociatesOther related
parties
Net commissions 1,403 3,248
Net income (loss) on financial instruments at fair value through profit or loss 92 -
Net interest 294 848
Realised gains (losses) 155 1,492
Unrealised gains (losses) 5,670 1,205
Other revenues (expenses) - 3,791
Operating expenses – other administrative expenses (2,431) (1,020)
2. Key management compensation
€/’000
Directors,Deputy/General
ManagersOther key
management
Emoluments & Social security contributions 3,216 90
Non-cash benefits - 50
65
NOTES TO THE CONDENSED CONSOLIDATED FINANCIAL STATEMENTS
Atypical and/or unusual transactions
In the reporting period there were no atypical and/or unusual transactions which for significance, nature of the coun-
terparties, subject of the transaction, pricing method and timing could raise doubts as to the accuracy and complete-
ness of the information disclosed herein, conflicts of interest, the safeguarding of corporate assets or the protection
of minority shareholders (see Consob Communication No. DEM/6064293 of July 28, 2006).
Non recurring transactions
In the reporting period there were no non-recurring events or transactions, i.e. events or transactions which do not
occur frequently in the ordinary course of business (see Consob Communication No. DEM/6064293 of July 28,
2006).
EQUITY-SETTLED SHARE-BASED PAYMENT TRANSACTIONS
Stock options plans
In the first half of 2013, 392,504 new Mediolanum dividend-bearing shares were issued following the exercise of
stock options by directors and sales network members of companies within the Mediolanum Group.
This entailed a €39 thousand increase in Mediolanum ordinary share capital and a €1,260 thousand increase in
the share premium account.
The overall expense for the period in relation to the stock options plans amounted to €1,631.2 thousand (€1,074.4
thousand in 1H 2012).
In execution of the delegation of authority by the Extraordinary General Meeting of April 27, 2010, as amended by
the Ordinary and Extraordinary General Meeting of April 19, 2012, the Board of Directors resolved on May 9,
2013:
– to increase share capital up to a maximum of €136,155.00 for a consideration, by issuing up to 1,361,550 divi-
dend-bearing ordinary shares having a par value of €0.10 each, to be allotted to the directors and executives of
the company and its subsidiaries pursuant to Article 2359(1)(1) Italian Civil Code, waiving any shareholders'
pre-emptive rights pursuant to Article 2441(5) Italian Civil Code. The final deadline for subscription of the sha-
res severally and separately is the fifth business day in the thirty-sixth month subsequent to the expiration of the
three-year term from the date of the resolution approving the capital increase;
– to increase share capital up to a maximum of €95,100.00 for a consideration, by issuing up to 951,000 divi-
dend-bearing ordinary shares having a par value of €0.10 each, to be allotted to the sales network of the com-
pany and its subsidiaries pursuant to Article 2359(1)(1) Italian Civil Code, waiving any shareholders' pre-emp-
tive rights pursuant to Article 2441(5) Italian Civil Code. The final deadline for subscription of the shares seve-
rally and separately is the fifth business day in the thirty-sixth month subsequent to the expiration of the nine-
year term from the date of the resolution approving the capital increase.

66
HALF-YEAR FINANCIALREPORT
2013

Schedules

69
SCHEDULES
SCHEDULES
This section presents financial information pursuant to ISVAP Regulation No. 7 of July 13, 2007, as subsequently
amended by ISVAP Regulation 2784 of March 8, 2010. In accordance with the regulations above, for segment
reporting purposes, Statement of financial position and income statement balances were allocated as follows: ‘Life
Business’ includes only the balances of the Life Insurance companies within the Group while ‘Financial Business’
includes the balances of the parent company Mediolanum S.p.A., the Mediolanum Banking Group and other Group
companies. ‘Intersegment’ shows intercompany balances that were offset against each other.
This presentation of segmental information differs from that of past years The new format was adopted to present
information in a manner that is more in line with the Mediolanum Group management reporting approach, as noted
in the previous section ‘Income statement information by operating segment’.
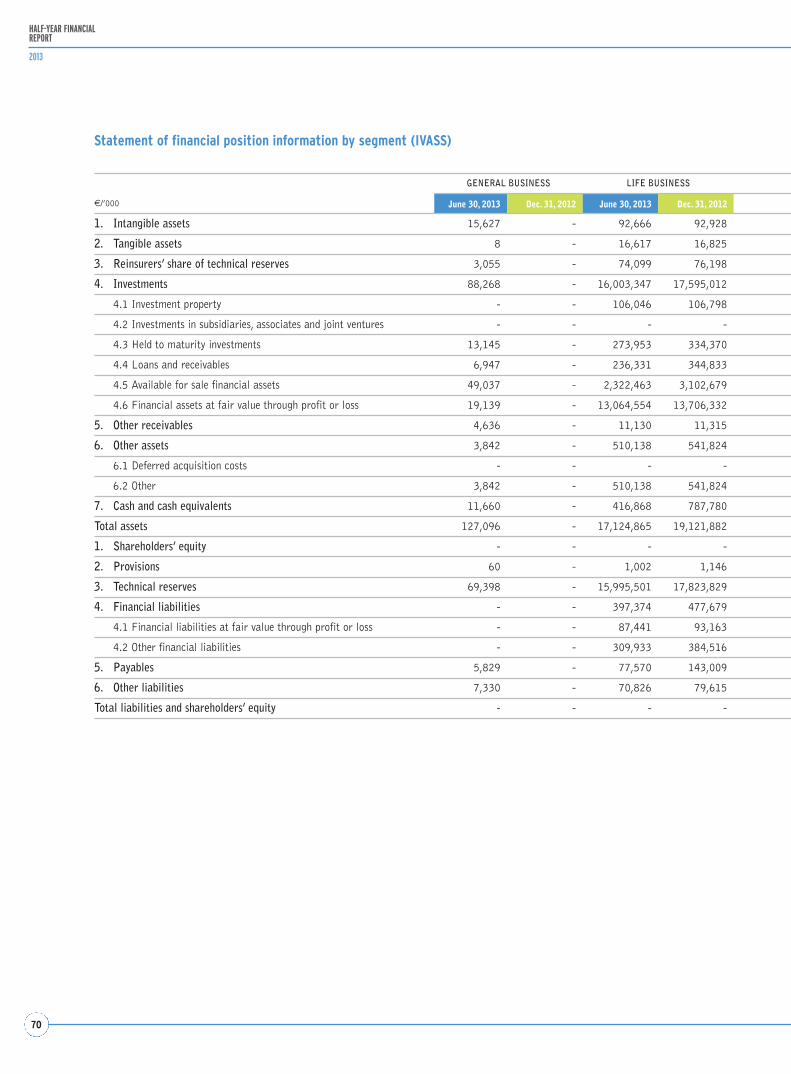
70
HALF-YEAR FINANCIALREPORT
2013
Statement of financial position information by segment (IVASS)
€/’000
GENERAL BUSINESS LIFE BUSINESS
June 30, 2013 Dec. 31, 2012 June 30, 2013 Dec. 31, 2012
1. Intangible assets 15,627 - 92,666 92,928
2. Tangible assets 8 - 16,617 16,825
3. Reinsurers’ share of technical reserves 3,055 - 74,099 76,198
4. Investments 88,268 - 16,003,347 17,595,012
4.1 Investment property - - 106,046 106,798
4.2 Investments in subsidiaries, associates and joint ventures - - - -
4.3 Held to maturity investments 13,145 - 273,953 334,370
4.4 Loans and receivables 6,947 - 236,331 344,833
4.5 Available for sale financial assets 49,037 - 2,322,463 3,102,679
4.6 Financial assets at fair value through profit or loss 19,139 - 13,064,554 13,706,332
5. Other receivables 4,636 - 11,130 11,315
6. Other assets 3,842 - 510,138 541,824
6.1 Deferred acquisition costs - - - -
6.2 Other 3,842 - 510,138 541,824
7. Cash and cash equivalents 11,660 - 416,868 787,780
Total assets 127,096 - 17,124,865 19,121,882
1. Shareholders’ equity - - - -
2. Provisions 60 - 1,002 1,146
3. Technical reserves 69,398 - 15,995,501 17,823,829
4. Financial liabilities - - 397,374 477,679
4.1 Financial liabilities at fair value through profit or loss - - 87,441 93,163
4.2 Other financial liabilities - - 309,933 384,516
5. Payables 5,829 - 77,570 143,009
6. Other liabilities 7,330 - 70,826 79,615
Total liabilities and shareholders’ equity - - - -
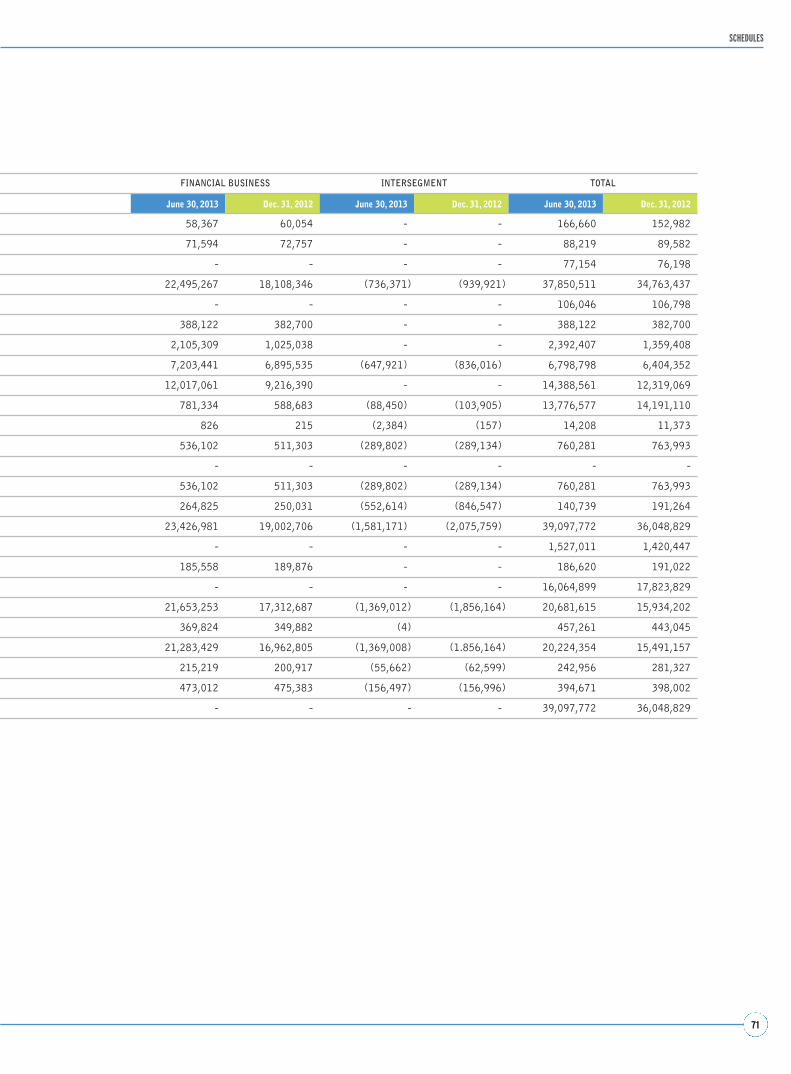
71
SCHEDULES
FINANCIAL BUSINESS INTERSEGMENT TOTAL
June 30, 2013 Dec. 31, 2012 June 30, 2013 Dec. 31, 2012 June 30, 2013 Dec. 31, 2012
58,367 60,054 - - 166,660 152,982
71,594 72,757 - - 88,219 89,582
- - - - 77,154 76,198
22,495,267 18,108,346 (736,371) (939,921) 37,850,511 34,763,437
- - - - 106,046 106,798
388,122 382,700 - - 388,122 382,700
2,105,309 1,025,038 - - 2,392,407 1,359,408
7,203,441 6,895,535 (647,921) (836,016) 6,798,798 6,404,352
12,017,061 9,216,390 - - 14,388,561 12,319,069
781,334 588,683 (88,450) (103,905) 13,776,577 14,191,110
826 215 (2,384) (157) 14,208 11,373
536,102 511,303 (289,802) (289,134) 760,281 763,993
- - - - - -
536,102 511,303 (289,802) (289,134) 760,281 763,993
264,825 250,031 (552,614) (846,547) 140,739 191,264
23,426,981 19,002,706 (1,581,171) (2,075,759) 39,097,772 36,048,829
- - - - 1,527,011 1,420,447
185,558 189,876 - - 186,620 191,022
- - - - 16,064,899 17,823,829
21,653,253 17,312,687 (1,369,012) (1,856,164) 20,681,615 15,934,202
369,824 349,882 (4) 457,261 443,045
21,283,429 16,962,805 (1,369,008) (1.856,164) 20,224,354 15,491,157
215,219 200,917 (55,662) (62,599) 242,956 281,327
473,012 475,383 (156,497) (156,996) 394,671 398,002
- - - - 39,097,772 36,048,829
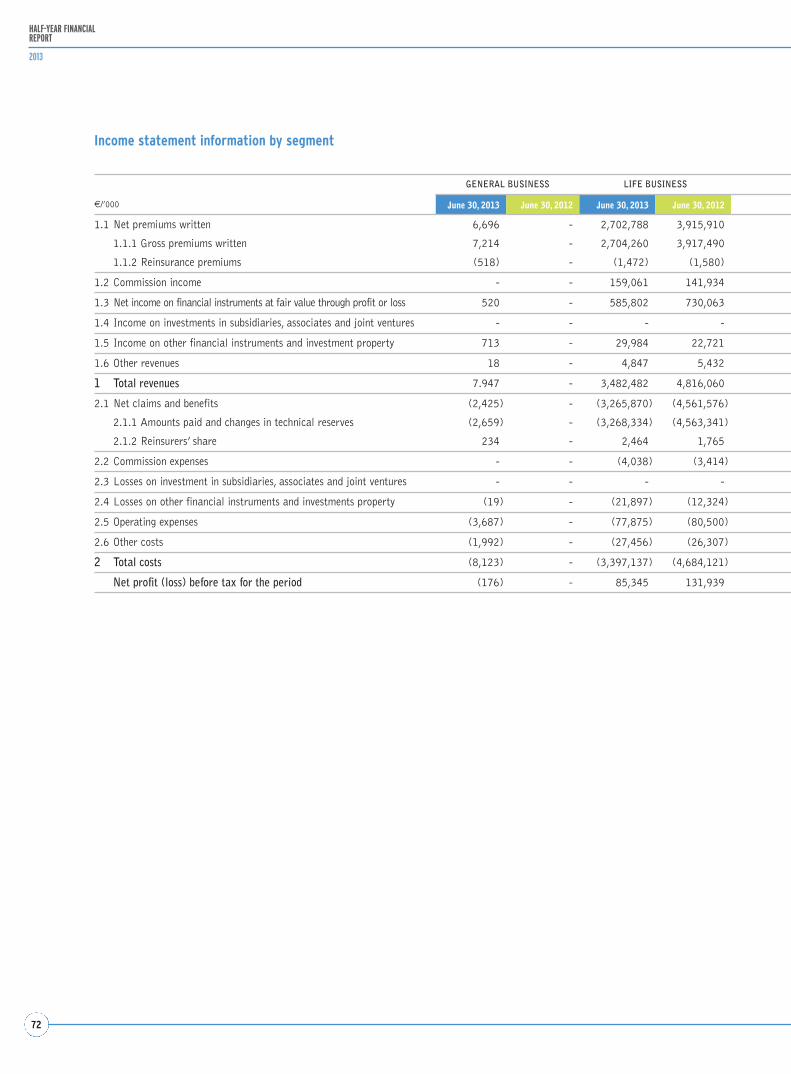
72
HALF-YEAR FINANCIALREPORT
2013
Income statement information by segment
€/’000
GENERAL BUSINESS LIFE BUSINESS
June 30, 2013 June 30, 2012 June 30, 2013 June 30, 2012
1.1 Net premiums written 6,696 - 2,702,788 3,915,910
1.1.1 Gross premiums written 7,214 - 2,704,260 3,917,490
1.1.2 Reinsurance premiums (518) - (1,472) (1,580)
1.2 Commission income - - 159,061 141,934
1.3 Net income on financial instruments at fair value through profit or loss 520 - 585,802 730,063
1.4 Income on investments in subsidiaries, associates and joint ventures - - - -
1.5 Income on other financial instruments and investment property 713 - 29,984 22,721
1.6 Other revenues 18 - 4,847 5,432
1 Total revenues 7.947 - 3,482,482 4,816,060
2.1 Net claims and benefits (2,425) - (3,265,870) (4,561,576)
2.1.1 Amounts paid and changes in technical reserves (2,659) - (3,268,334) (4,563,341)
2.1.2 Reinsurers’ share 234 - 2,464 1,765
2.2 Commission expenses - - (4,038) (3,414)
2.3 Losses on investment in subsidiaries, associates and joint ventures - - - -
2.4 Losses on other financial instruments and investments property (19) - (21,897) (12,324)
2.5 Operating expenses (3,687) - (77,875) (80,500)
2.6 Other costs (1,992) - (27,456) (26,307)
2 Total costs (8,123) - (3,397,137) (4,684,121)
Net profit (loss) before tax for the period (176) - 85,345 131,939
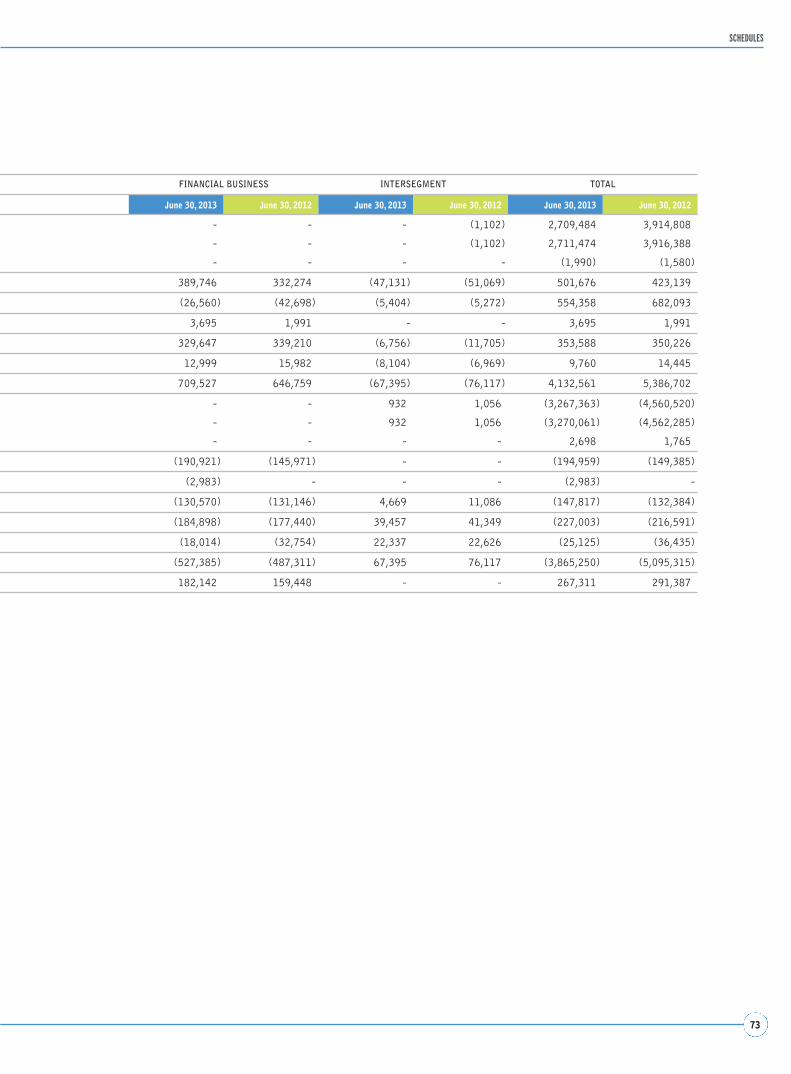
73
SCHEDULES
FINANCIAL BUSINESS INTERSEGMENT TOTAL
June 30, 2013 June 30, 2012 June 30, 2013 June 30, 2012 June 30, 2013 June 30, 2012
- - - (1,102) 2,709,484 3,914,808
- - - (1,102) 2,711,474 3,916,388
- - - - (1,990) (1,580)
389,746 332,274 (47,131) (51,069) 501,676 423,139
(26,560) (42,698) (5,404) (5,272) 554,358 682,093
3,695 1,991 - - 3,695 1,991
329,647 339,210 (6,756) (11,705) 353,588 350,226
12,999 15,982 (8,104) (6,969) 9,760 14,445
709,527 646,759 (67,395) (76,117) 4,132,561 5,386,702
- - 932 1,056 (3,267,363) (4,560,520)
- - 932 1,056 (3,270,061) (4,562,285)
- - - - 2,698 1,765
(190,921) (145,971) - - (194,959) (149,385)
(2,983) - - - (2,983) -
(130,570) (131,146) 4,669 11,086 (147,817) (132,384)
(184,898) (177,440) 39,457 41,349 (227,003) (216,591)
(18,014) (32,754) 22,337 22,626 (25,125) (36,435)
(527,385) (487,311) 67,395 76,117 (3,865,250) (5,095,315)
182,142 159,448 - - 267,311 291,387
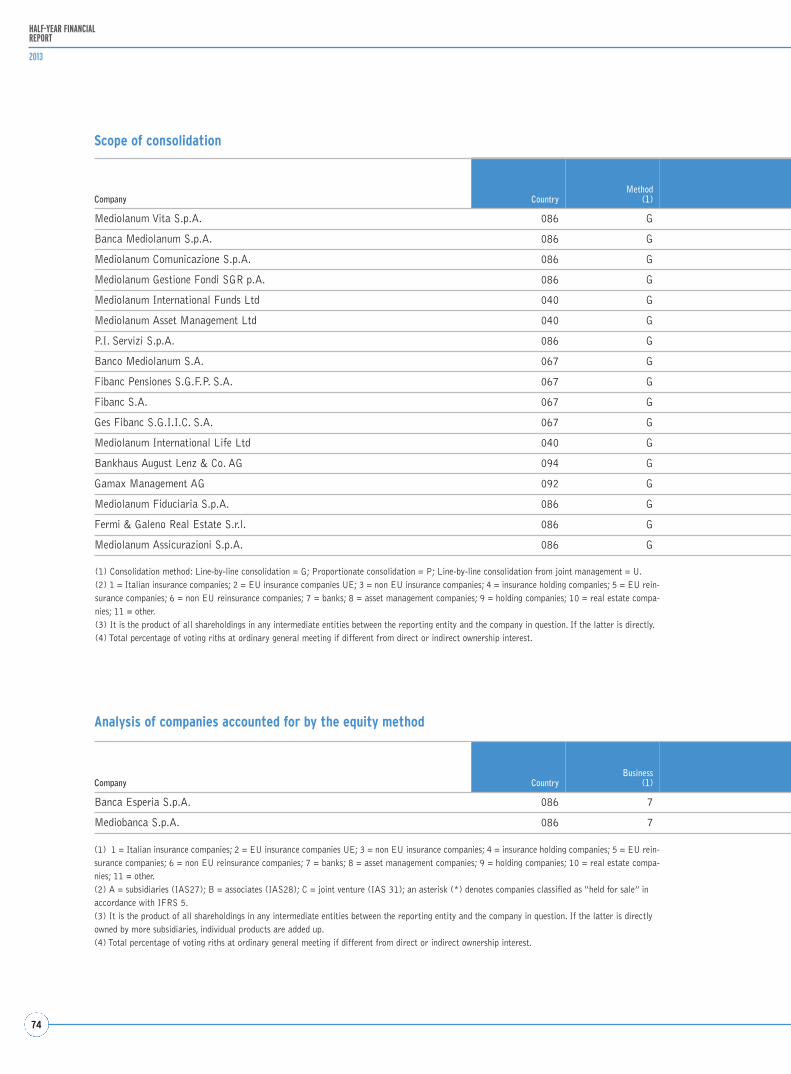
74
HALF-YEAR FINANCIALREPORT
2013
Scope of consolidation
(1) Consolidation method: Line-by-line consolidation = G; Proportionate consolidation = P; Line-by-line consolidation from joint management = U.(2) 1 = Italian insurance companies; 2 = EU insurance companies UE; 3 = non EU insurance companies; 4 = insurance holding companies; 5 = EU rein-surance companies; 6 = non EU reinsurance companies; 7 = banks; 8 = asset management companies; 9 = holding companies; 10 = real estate compa-nies; 11 = other.(3) It is the product of all shareholdings in any intermediate entities between the reporting entity and the company in question. If the latter is directly.(4) Total percentage of voting riths at ordinary general meeting if different from direct or indirect ownership interest.
Company CountryMethod
(1)
Mediolanum Vita S.p.A. 086 G
Banca Mediolanum S.p.A. 086 G
Mediolanum Comunicazione S.p.A. 086 G
Mediolanum Gestione Fondi SGR p.A. 086 G
Mediolanum International Funds Ltd 040 G
Mediolanum Asset Management Ltd 040 G
P.I. Servizi S.p.A. 086 G
Banco Mediolanum S.A. 067 G
Fibanc Pensiones S.G.F.P. S.A. 067 G
Fibanc S.A. 067 G
Ges Fibanc S.G.I.I.C. S.A. 067 G
Mediolanum International Life Ltd 040 G
Bankhaus August Lenz & Co. AG 094 G
Gamax Management AG 092 G
Mediolanum Fiduciaria S.p.A. 086 G
Fermi & Galeno Real Estate S.r.l. 086 G
Mediolanum Assicurazioni S.p.A. 086 G
Analysis of companies accounted for by the equity method
(1) 1 = Italian insurance companies; 2 = EU insurance companies UE; 3 = non EU insurance companies; 4 = insurance holding companies; 5 = EU rein-surance companies; 6 = non EU reinsurance companies; 7 = banks; 8 = asset management companies; 9 = holding companies; 10 = real estate compa-nies; 11 = other.(2) A = subsidiaries (IAS27); B = associates (IAS28); C = joint venture (IAS 31); an asterisk (*) denotes companies classified as “held for sale” inaccordance with IFRS 5.(3) It is the product of all shareholdings in any intermediate entities between the reporting entity and the company in question. If the latter is directlyowned by more subsidiaries, individual products are added up.(4) Total percentage of voting riths at ordinary general meeting if different from direct or indirect ownership interest.
Company CountryBusiness
(1)
Banca Esperia S.p.A. 086 7
Mediobanca S.p.A. 086 7
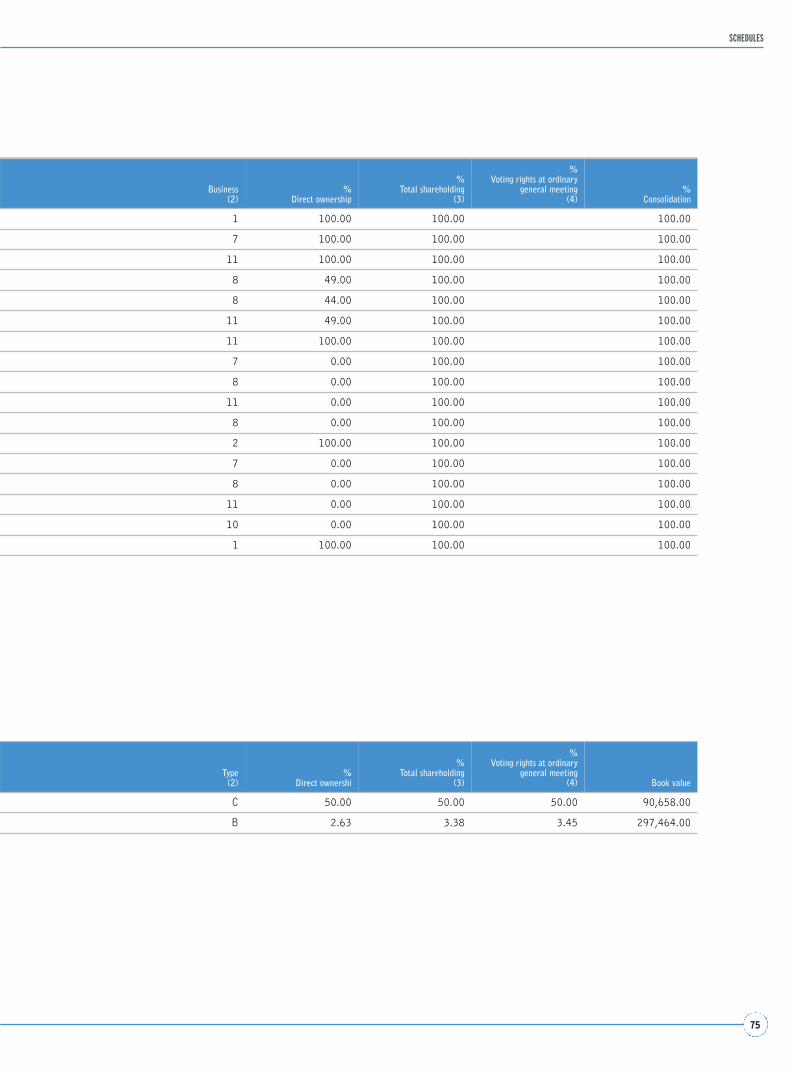
75
SCHEDULES
Business(2)
%Direct ownership
%Total shareholding
(3)
%Voting rights at ordinary
general meeting(4)
% Consolidation
1 100.00 100.00 100.00
7 100.00 100.00 100.00
11 100.00 100.00 100.00
8 49.00 100.00 100.00
8 44.00 100.00 100.00
11 49.00 100.00 100.00
11 100.00 100.00 100.00
7 0.00 100.00 100.00
8 0.00 100.00 100.00
11 0.00 100.00 100.00
8 0.00 100.00 100.00
2 100.00 100.00 100.00
7 0.00 100.00 100.00
8 0.00 100.00 100.00
11 0.00 100.00 100.00
10 0.00 100.00 100.00
1 100.00 100.00 100.00
Type(2)
%Direct ownershi
%Total shareholding
(3)
%Voting rights at ordinary
general meeting(4) Book value
C 50.00 50.00 50.00 90,658.00
B 2.63 3.38 3.45 297,464.00
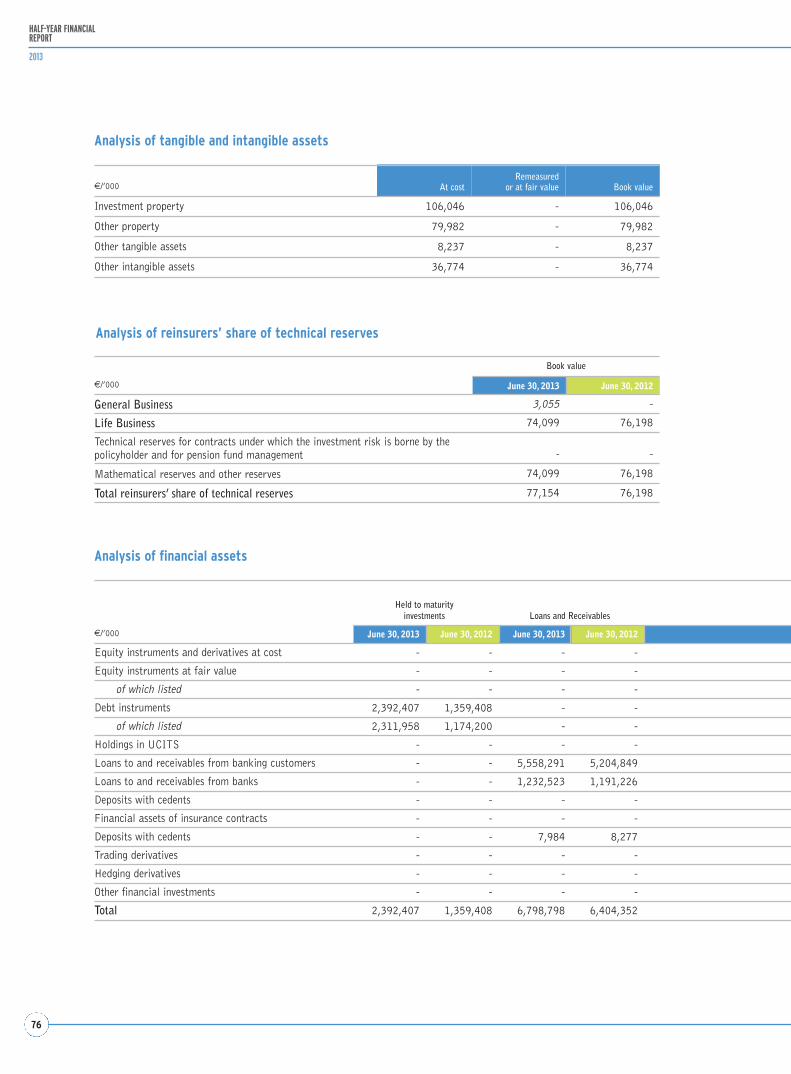
76
HALF-YEAR FINANCIALREPORT
2013
Analysis of tangible and intangible assets
Analysis of financial assets
€/’000 At costRemeasured
or at fair value Book value
Investment property 106,046 - 106,046
Other property 79,982 - 79,982
Other tangible assets 8,237 - 8,237
Other intangible assets 36,774 - 36,774
€/’000
Held to maturityinvestments Loans and Receivables
June 30, 2013 June 30, 2012 June 30, 2013 June 30, 2012
Equity instruments and derivatives at cost - - - -
Equity instruments at fair value - - - -
of which listed - - - -
Debt instruments 2,392,407 1,359,408 - -
of which listed 2,311,958 1,174,200 - -
Holdings in UCITS - - - -
Loans to and receivables from banking customers - - 5,558,291 5,204,849
Loans to and receivables from banks - - 1,232,523 1,191,226
Deposits with cedents - - - -
Financial assets of insurance contracts - - - -
Deposits with cedents - - 7,984 8,277
Trading derivatives - - - -
Hedging derivatives - - - -
Other financial investments - - - -
Total 2,392,407 1,359,408 6,798,798 6,404,352
Analysis of reinsurers’ share of technical reserves
€/’000
Book value
June 30, 2013 June 30, 2012
General Business 3,055 -
Life Business 74,099 76,198
Technical reserves for contracts under which the investment risk is borne by thepolicyholder and for pension fund management - -
Mathematical reserves and other reserves 74,099 76,198
Total reinsurers’ share of technical reserves 77,154 76,198

77
SCHEDULES
Available for salefinancial assets
Financial assets at fair value through profit or loss
Book valueFinancial assets held
for tradingFinancial assets
at fair value
June 30, 2013 June 30, 2012 June 30, 2013 June 30, 2012 June 30, 2013 June 30, 2012 June 30, 2013 June 30, 2012
- - - - - - - -
34,738 34,821 298 - - - 35,036 34,821
4,153 4,217 298 - - - 4,451 4,217
14,173,670 12,111,226 1,168,191 1,214,764 2,699,243 3,402,540 20,433,511 18,087,938
14,060,847 11,744,882 1,108,611 1,180,524 411,969 356,806 17,893,385 14,456,412
180,153 173,022 - 116 9,901,942 9,565,715 10,082,095 9,738,853
- - - - - - 5,558,291 5,204,849
- - - - - - 1,232,523 1,191,226
- - - - - - - -
- - - - - - - -
- - - - - - 7,984 8,277
- - 4,656 6,609 - - 4,656 6,609
- - - - 2,247 1,366 2,247 1,366
- - - - - - - -
14,388,561 12,319,069 1,173,145 1,221,489 12,603,432 12,969,621 37,356,343 34,273,939
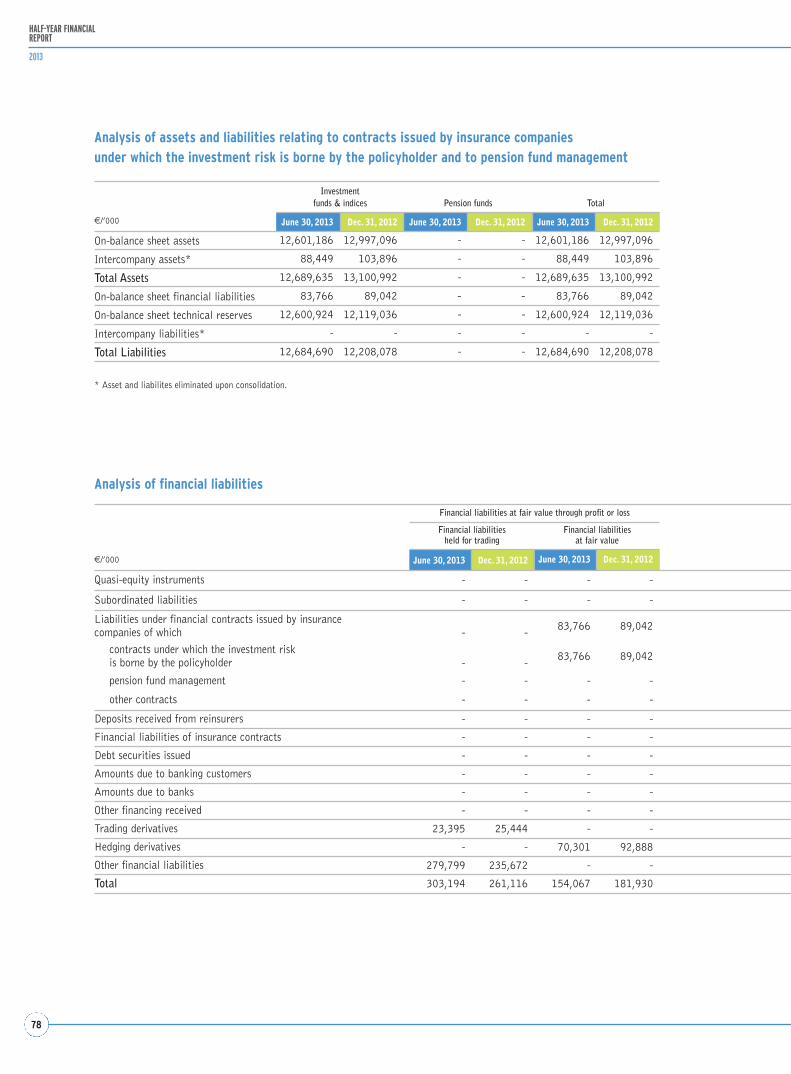
78
HALF-YEAR FINANCIALREPORT
2013
Analysis of assets and liabilities relating to contracts issued by insurance companiesunder which the investment risk is borne by the policyholder and to pension fund management
€/’000
Investmentfunds & indices Pension funds Total
June 30, 2013 Dec. 31, 2012 June 30, 2013 Dec. 31, 2012 June 30, 2013 Dec. 31, 2012
On-balance sheet assets 12,601,186 12,997,096 - - 12,601,186 12,997,096
Intercompany assets* 88,449 103,896 - - 88,449 103,896
Total Assets 12,689,635 13,100,992 - - 12,689,635 13,100,992
On-balance sheet financial liabilities 83,766 89,042 - - 83,766 89,042
On-balance sheet technical reserves 12,600,924 12,119,036 - - 12,600,924 12,119,036
Intercompany liabilities* - - - - - -
Total Liabilities 12,684,690 12,208,078 - - 12,684,690 12,208,078
* Asset and liabilites eliminated upon consolidation.
Analysis of financial liabilities
€/’000
Financial liabilities at fair value through profit or loss
Financial liabilitiesheld for trading
Financial liabilitiesat fair value
June 30, 2013 Dec. 31, 2012 June 30, 2013 Dec. 31, 2012
Quasi-equity instruments - - - -
Subordinated liabilities - - - -
Liabilities under financial contracts issued by insurancecompanies of which - - 83,766 89,042
contracts under which the investment risk is borne by the policyholder - - 83,766 89,042
pension fund management - - - -
other contracts - - - -
Deposits received from reinsurers - - - -
Financial liabilities of insurance contracts - - - -
Debt securities issued - - - -
Amounts due to banking customers - - - -
Amounts due to banks - - - -
Other financing received - - - -
Trading derivatives 23,395 25,444 - -
Hedging derivatives - - 70,301 92,888
Other financial liabilities 279,799 235,672 - -
Total 303,194 261,116 154,067 181,930
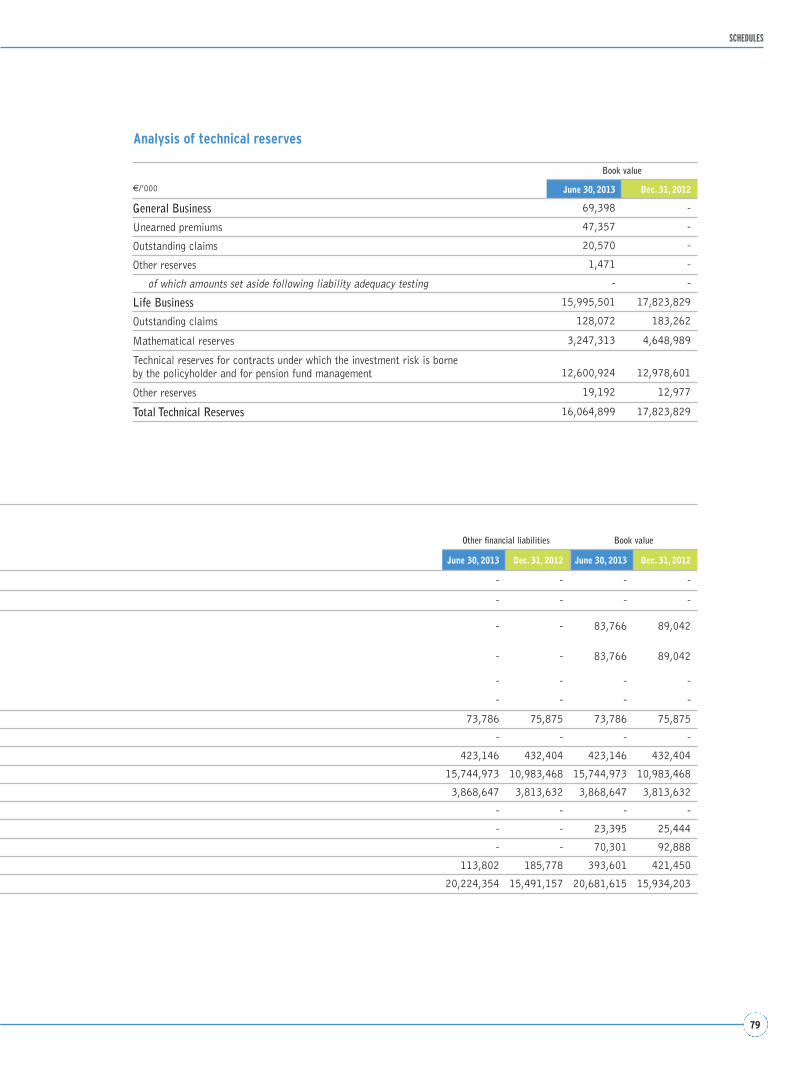
79
SCHEDULES
Analysis of technical reserves
€/’000
Book value
June 30, 2013 Dec. 31, 2012
General Business 69,398 -
Unearned premiums 47,357 -
Outstanding claims 20,570 -
Other reserves 1,471 -
of which amounts set aside following liability adequacy testing - -
Life Business 15,995,501 17,823,829
Outstanding claims 128,072 183,262
Mathematical reserves 3,247,313 4,648,989
Technical reserves for contracts under which the investment risk is borneby the policyholder and for pension fund management 12,600,924 12,978,601
Other reserves 19,192 12,977
Total Technical Reserves 16,064,899 17,823,829
Other financial liabilities Book value
June 30, 2013 Dec. 31, 2012 June 30, 2013 Dec. 31, 2012
- - - -
- - - -
- - 83,766 89,042
- - 83,766 89,042
- - - -
- - - -
73,786 75,875 73,786 75,875
- - - -
423,146 432,404 423,146 432,404
15,744,973 10,983,468 15,744,973 10,983,468
3,868,647 3,813,632 3,868,647 3,813,632
- - - -
- - 23,395 25,444
- - 70,301 92,888
113,802 185,778 393,601 421,450
20,224,354 15,491,157 20,681,615 15,934,203
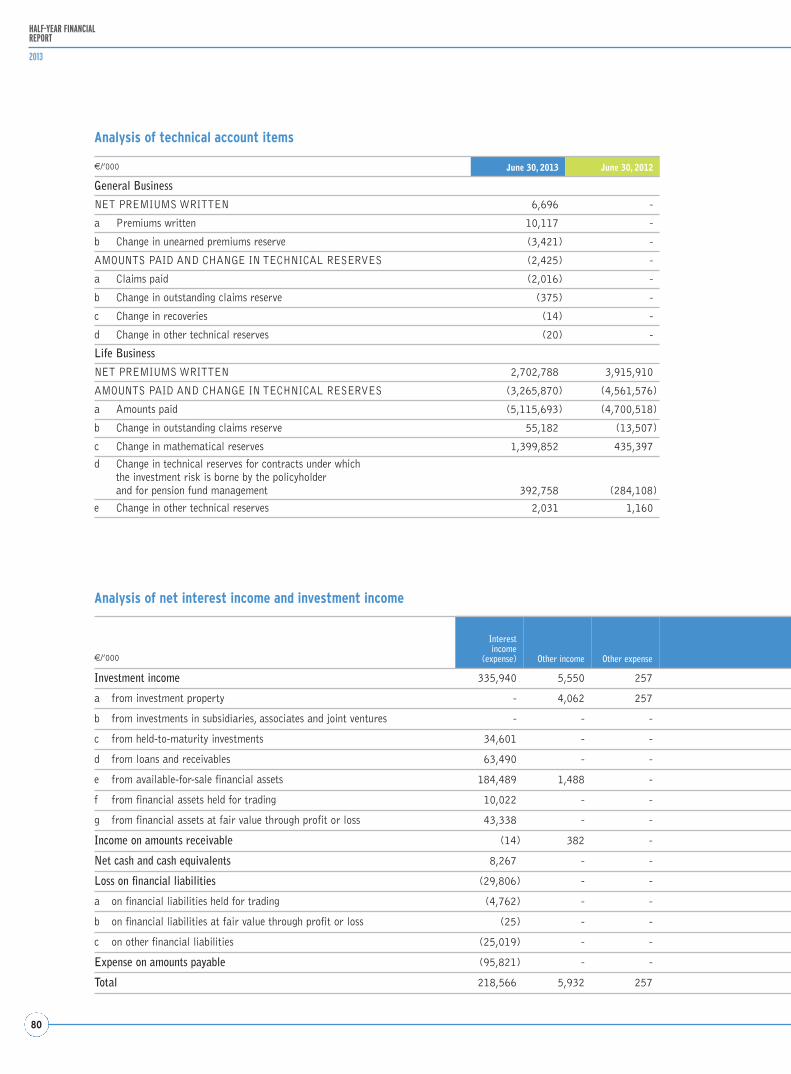
80
HALF-YEAR FINANCIALREPORT
2013
Analysis of technical account items
€/’000 June 30, 2013 June 30, 2012
General Business
NET PREMIUMS WRITTEN 6,696 -
a Premiums written 10,117 -
b Change in unearned premiums reserve (3,421) -
AMOUNTS PAID AND CHANGE IN TECHNICAL RESERVES (2,425) -
a Claims paid (2,016) -
b Change in outstanding claims reserve (375) -
c Change in recoveries (14) -
d Change in other technical reserves (20) -
Life Business
NET PREMIUMS WRITTEN 2,702,788 3,915,910
AMOUNTS PAID AND CHANGE IN TECHNICAL RESERVES (3,265,870) (4,561,576)
a Amounts paid (5,115,693) (4,700,518)
b Change in outstanding claims reserve 55,182 (13,507)
c Change in mathematical reserves 1,399,852 435,397
d Change in technical reserves for contracts under whichthe investment risk is borne by the policyholderand for pension fund management 392,758 (284,108)
e Change in other technical reserves 2,031 1,160
Analysis of net interest income and investment income
€/’000
Interestincome
(expense) Other income Other expense
Investment income 335,940 5,550 257
a from investment property - 4,062 257
b from investments in subsidiaries, associates and joint ventures - - -
c from held-to-maturity investments 34,601 - -
d from loans and receivables 63,490 - -
e from available-for-sale financial assets 184,489 1,488 -
f from financial assets held for trading 10,022 - -
g from financial assets at fair value through profit or loss 43,338 - -
Income on amounts receivable (14) 382 -
Net cash and cash equivalents 8,267 - -
Loss on financial liabilities (29,806) - -
a on financial liabilities held for trading (4,762) - -
b on financial liabilities at fair value through profit or loss (25) - -
c on other financial liabilities (25,019) - -
Expense on amounts payable (95,821) - -
Total 218,566 5,932 257
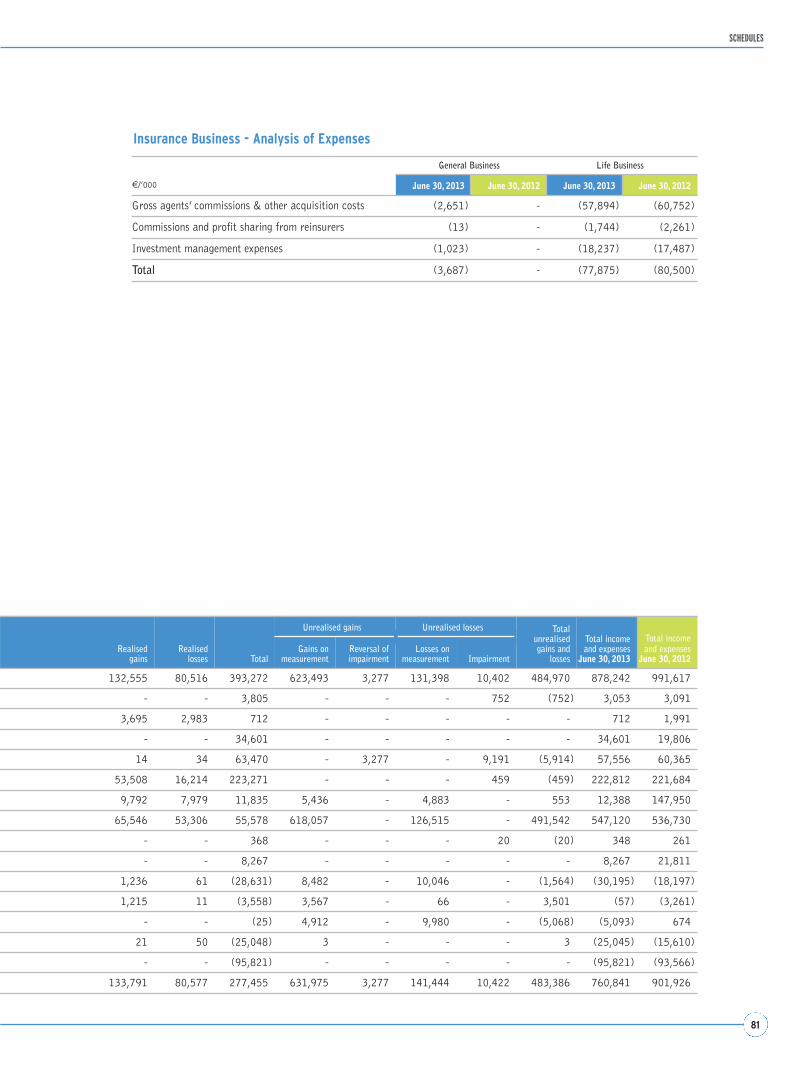
81
SCHEDULES
Realisedgains
Realisedlosses Total
Unrealised gains Unrealised losses Total unrealisedgains and
losses
Total incomeand expenses
June 30, 2013
Total incomeand expenses
June 30, 2012Gains on
measurementReversal ofimpairment
Losses onmeasurement Impairment
132,555 80,516 393,272 623,493 3,277 131,398 10,402 484,970 878,242 991,617
- - 3,805 - - - 752 (752) 3,053 3,091
3,695 2,983 712 - - - - - 712 1,991
- - 34,601 - - - - - 34,601 19,806
14 34 63,470 - 3,277 - 9,191 (5,914) 57,556 60,365
53,508 16,214 223,271 - - - 459 (459) 222,812 221,684
9,792 7,979 11,835 5,436 - 4,883 - 553 12,388 147,950
65,546 53,306 55,578 618,057 - 126,515 - 491,542 547,120 536,730
- - 368 - - - 20 (20) 348 261
- - 8,267 - - - - - 8,267 21,811
1,236 61 (28,631) 8,482 - 10,046 - (1,564) (30,195) (18,197)
1,215 11 (3,558) 3,567 - 66 - 3,501 (57) (3,261)
- - (25) 4,912 - 9,980 - (5,068) (5,093) 674
21 50 (25,048) 3 - - - 3 (25,045) (15,610)
- - (95,821) - - - - - (95,821) (93,566)
133,791 80,577 277,455 631,975 3,277 141,444 10,422 483,386 760,841 901,926
Insurance Business - Analysis of Expenses
€/’000
General Business Life Business
June 30, 2013 June 30, 2012 June 30, 2013 June 30, 2012
Gross agents’ commissions & other acquisition costs (2,651) - (57,894) (60,752)
Commissions and profit sharing from reinsurers (13) - (1,744) (2,261)
Investment management expenses (1,023) - (18,237) (17,487)
Total (3,687) - (77,875) (80,500)

82
HALF-YEAR FINANCIALREPORT
2013
Analysis of reclassified financial assets and effects on profit (loss) and Statement of other comprehensive income
€/’000
Category of reclassifiedfinancial assets Type
of asset
Assetsreclassifiedin H1 2013
Book value ofreclassified assetsat June 30, 2013
Fair value ofreclassified assetsof June 30, 2013
Assetsreclassifiedin H1 2013
Assetsreclassified up
until June 30, 2013
Assetsreclassifiedin H1 2013
Assetsreclassified up
until June 30, 2013
from to
HFT AFS Debt securities - 140,657 - 140,657 -
HFT Loans & Receivables Debt securities - 26,368 - 25,987 -
Total - 167,025 - 166,644 -
Fair value hierarchy of financial assets and financial liabilities
€/’000
Available for sale financial assets
Financial assets at fair value through profit or lossFinancial assets held for trading
Financial assets at fair value
Total
Financial liabilities at fair value through profit or lossFinancial assets held for trading
Financial assets at fair value
Total
Analysis of other components of Statement of other comprehensive income
€/’000
RecognitionAdjustments owed to reclassification
to the income statement
June 30, 2013 June 30, 2012 June 30, 2013 June 30, 2012
Net exchange differences reserve - - - -
Profit (loss) on available for sale financial assets (4,690) 118,025 (37,241) 24,033
Profit (loss) on cash flow hedges - - - -
Profit (loss) on hedges of investments in foreign operations - - - -
Changes in the equity of investees (2,548) (258) - -
Intangible assets revaluation reserve - - - -
Tangible assets revaluation reserve - - - -
Gains (losses) on non-current assets or disposal groups held for sale - - - -
Actuarial gains (losses) and adjustments on defined benefit plans 8 - - -
Other - - - -
Total other components of Statement of other comprehensive income (7,230) 117,768 (37,241) 24,033
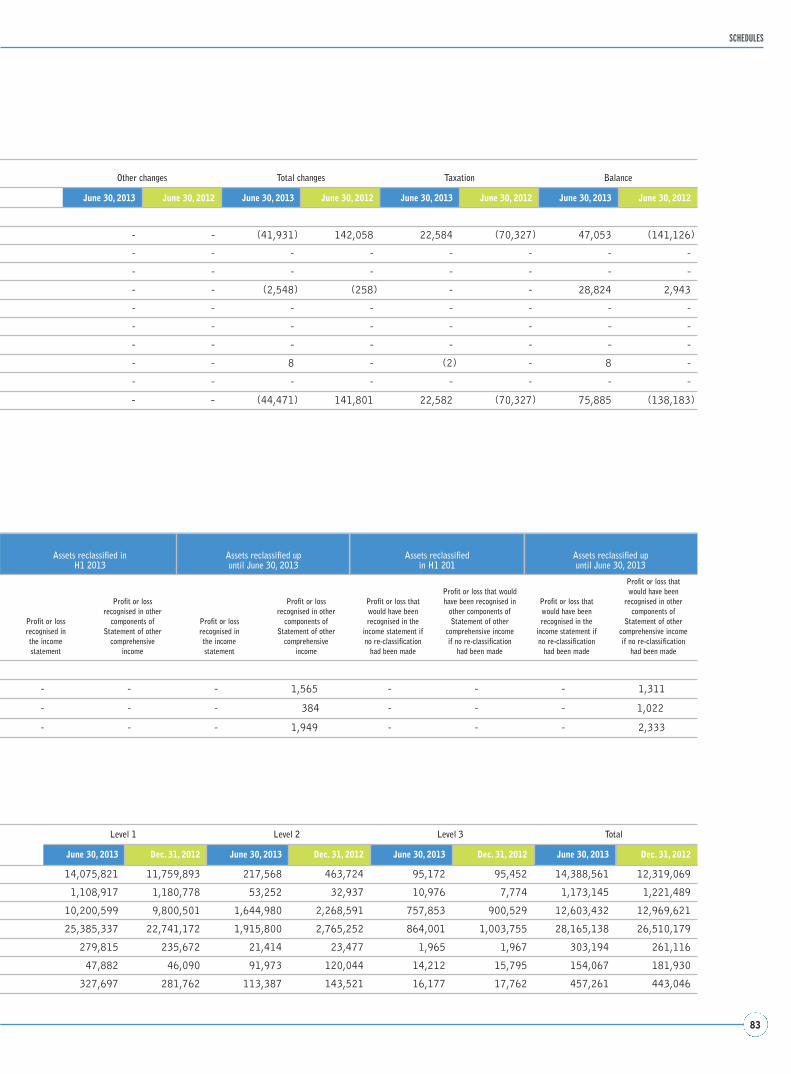
83
SCHEDULES
Assets reclassified inH1 2013
Assets reclassified upuntil June 30, 2013
Assets reclassifiedin H1 201
Assets reclassified upuntil June 30, 2013
Profit or lossrecognised inthe incomestatement
Profit or lossrecognised in other
components ofStatement of other
comprehensiveincome
Profit or lossrecognised inthe incomestatement
Profit or lossrecognised in other
components ofStatement of other
comprehensiveincome
Profit or loss thatwould have beenrecognised in the
income statement ifno re-classification
had been made
Profit or loss that wouldhave been recognised in
other components ofStatement of other
comprehensive incomeif no re-classification
had been made
Profit or loss thatwould have beenrecognised in the
income statement ifno re-classification
had been made
Profit or loss thatwould have been
recognised in othercomponents of
Statement of other comprehensive incomeif no re-classification
had been made
- - - 1,565 - - - 1,311
- - - 384 - - - 1,022
- - - 1,949 - - - 2,333
Level 1 Level 2 Level 3 Total
June 30, 2013 Dec. 31, 2012 June 30, 2013 Dec. 31, 2012 June 30, 2013 Dec. 31, 2012 June 30, 2013 Dec. 31, 2012
14,075,821 11,759,893 217,568 463,724 95,172 95,452 14,388,561 12,319,069
1,108,917 1,180,778 53,252 32,937 10,976 7,774 1,173,145 1,221,489
10,200,599 9,800,501 1,644,980 2,268,591 757,853 900,529 12,603,432 12,969,621
25,385,337 22,741,172 1,915,800 2,765,252 864,001 1,003,755 28,165,138 26,510,179
279,815 235,672 21,414 23,477 1,965 1,967 303,194 261,116
47,882 46,090 91,973 120,044 14,212 15,795 154,067 181,930
327,697 281,762 113,387 143,521 16,177 17,762 457,261 443,046
Other changes Total changes Taxation Balance
June 30, 2013 June 30, 2012 June 30, 2013 June 30, 2012 June 30, 2013 June 30, 2012 June 30, 2013 June 30, 2012
- - (41,931) 142,058 22,584 (70,327) 47,053 (141,126)
- - - - - - - -
- - - - - - - -
- - (2,548) (258) - - 28,824 2,943
- - - - - - - -
- - - - - - - -
- - - - - - - -
- - 8 - (2) - 8 -
- - - - - - - -
- - (44,471) 141,801 22,582 (70,327) 75,885 (138,183)
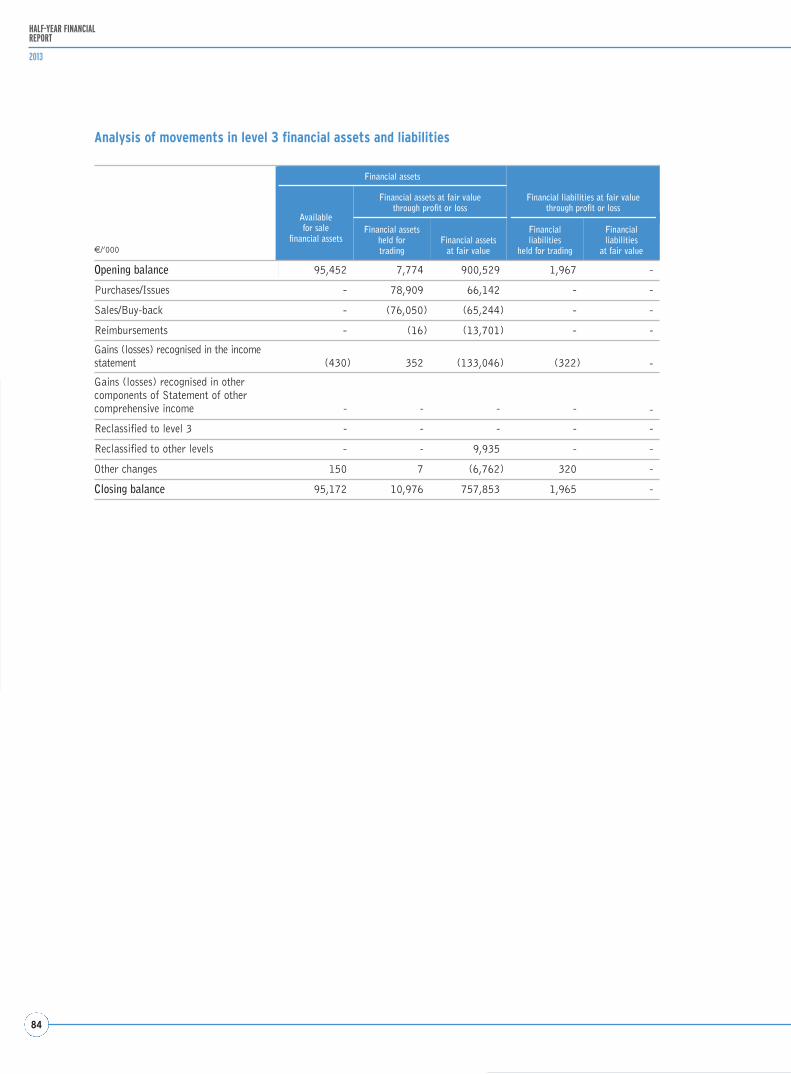
84
Analysis of movements in level 3 financial assets and liabilities
€/’000
Financial assets
Financial liabilities at fair valuethrough profit or loss
Availablefor sale
financial assets
Financial assets at fair valuethrough profit or loss
Financial assetsheld fortrading
Financial assetsat fair value
Financialliabilities
held for trading
Financialliabilities
at fair value
Opening balance 95,452 7,774 900,529 1,967 -
Purchases/Issues - 78,909 66,142 - -
Sales/Buy-back - (76,050) (65,244) - -
Reimbursements - (16) (13,701) - -
Gains (losses) recognised in the incomestatement (430) 352 (133,046) (322) -
Gains (losses) recognised in other components of Statement of other comprehensive income - - - - -
Reclassified to level 3 - - - - -
Reclassified to other levels - - 9,935 - -
Other changes 150 7 (6,762) 320 -
Closing balance 95,172 10,976 757,853 1,965 -
84
HALF-YEAR FINANCIALREPORT
2013

ResponsibilityStatements

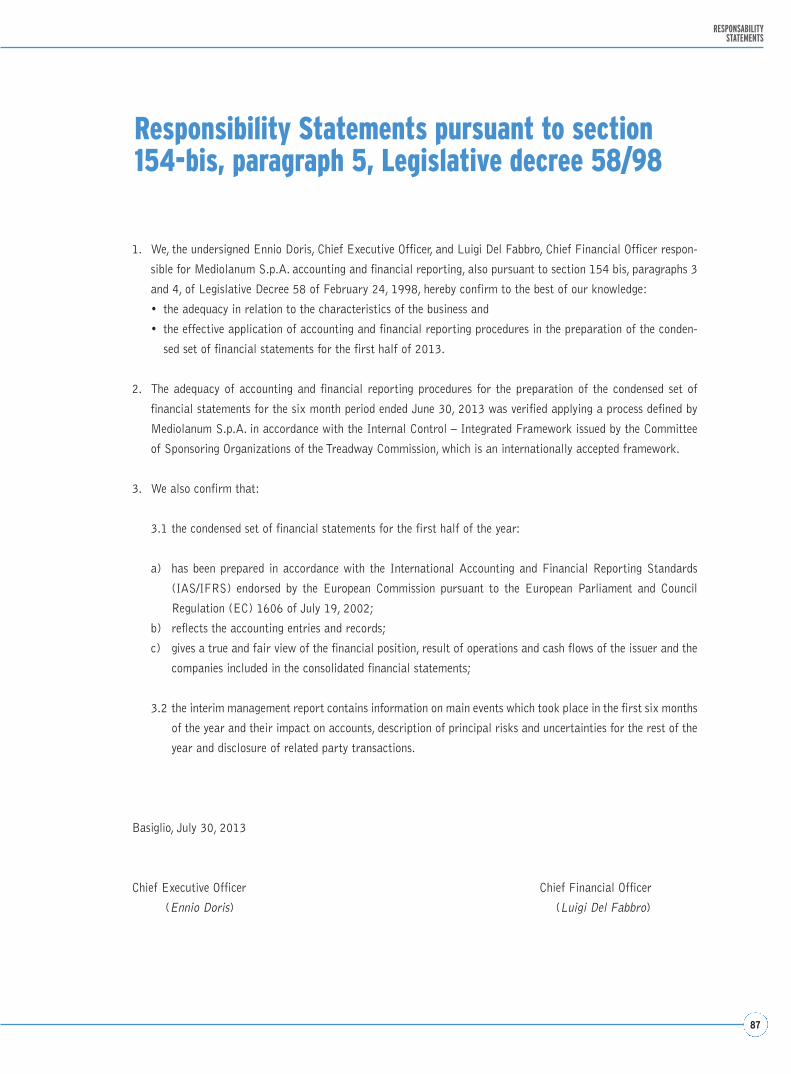
87
RESPONSABILITY STATEMENTS
Responsibility Statements pursuant to section154-bis, paragraph 5, Legislative decree 58/98
1. We, the undersigned Ennio Doris, Chief Executive Officer, and Luigi Del Fabbro, Chief Financial Officer respon-
sible for Mediolanum S.p.A. accounting and financial reporting, also pursuant to section 154 bis, paragraphs 3
and 4, of Legislative Decree 58 of February 24, 1998, hereby confirm to the best of our knowledge:
• the adequacy in relation to the characteristics of the business and
• the effective application of accounting and financial reporting procedures in the preparation of the conden-
sed set of financial statements for the first half of 2013.
2. The adequacy of accounting and financial reporting procedures for the preparation of the condensed set of
financial statements for the six month period ended June 30, 2013 was verified applying a process defined by
Mediolanum S.p.A. in accordance with the Internal Control – Integrated Framework issued by the Committee
of Sponsoring Organizations of the Treadway Commission, which is an internationally accepted framework.
3. We also confirm that:
3.1 the condensed set of financial statements for the first half of the year:
a) has been prepared in accordance with the International Accounting and Financial Reporting Standards
(IAS/IFRS) endorsed by the European Commission pursuant to the European Parliament and Council
Regulation (EC) 1606 of July 19, 2002;
b) reflects the accounting entries and records;
c) gives a true and fair view of the financial position, result of operations and cash flows of the issuer and the
companies included in the consolidated financial statements;
3.2 the interim management report contains information on main events which took place in the first six months
of the year and their impact on accounts, description of principal risks and uncertainties for the rest of the
year and disclosure of related party transactions.
Basiglio, July 30, 2013
Chief Executive Officer Chief Financial Officer
(Ennio Doris) (Luigi Del Fabbro)

MEDIOLANUM S.p.A.
Half-YearFinancial Report at
June 30,2013