Embed Size (px)
Citation preview

Half year financial report
1–6/2017
August 8, 2017
President and CEO
Hille Korhonen
Strong first half of the year with solid full year expectations
2. Nokian Tyres financial performance
3. Business units
4. Nokian Tyres going forward
1. General overview

Market overview 1–6/2017Russia’s growth continued
*) premium and mid-segment
**) Nokian Tyres core product segments
3
Nordic
countriesRussia
Europe (incl. the Nordic
countries)
North America
GDP growth (E2017) +1.6% to +3.0% +1.5% to 2.0% +1.7% +2.2%
New car sales +2% +7% +5% -9%
Car tyre* sell-in -5% +10% to 15% -1% Slightly up
Heavy tyre segments **
Currency impact -

Distribution UnitsChange
1–6/17 (pcs)
Vianor equity 205 -7
Vianor total 1,506 +5
NAD + N-Tyre 1,741 +140
Profitability
Currency effect to net sales, M€ +32.2
Car tyre ASP (€/pcs)
Raw material cost +20.4%
Fixed costs
Car tyre production volume (pcs) +13%
Car tyre productivity (kg/mh) +2%
Sales & SOMNordic
countriesRussia and CIS Other Europe North America
Net sales +3.3% +84.4% +10.6% +8.7%
Car tyre sales pcs - + + +
Car tyre SOM + + + +-
Nokian Tyres’ performance 1–6/2017Sales growth in all key markets
4
1. General overview
3. Business units
4. Nokian Tyres going forward
2. Nokian Tyres financial performance
Summary
Group operating profit
Net sales by market area
Raw material cost development
Total investments

Strong performance in all main markets
Net sales and operating profit improved
Passenger Car Tyres showed strong growth
Production volumes increased
Summary 1–6/2017Strong first half of the year with solid full year expectations
6
Raw material costs continued to go up
Price increases have been implemented, the full effect
will be seen from H2 onwards
Foundation for future growth – product range renewed
Key figures, EUR million 4–6
/17
4–6
/16
Change
%
1–6
/17
1–6
/16
Change
%2016
Net sales 393.0 337.4 16.5 718.9 613.3 17.2 1,391.2
Operating profit 94.1 77.5 21.5 153.0 128.0 19.6 310.5
Operating profit % 24.0 23.0 21.3 20.9 22.3
Profit before tax 87.1 74.8 16.5 146.0 123.2 18.5 298.7
Profit for the period 71.1 61.3 16.0 116.4 101.2 15.1 251.8
Earnings per share, EUR 0.52 0.46 14.7 0.86 0.75 13.8 1.87
Equity ratio, % 76.4 72.0 73.8
Cash flow from operating activities
-5.9 21.3 -46.0 -40.0 364.4
Gearing, % -2.6 6.6 -19.7
Interest-bearing net debt -36.0 79.6 -287.4
Capital expenditure 42.6 25.3 68.4 60.0 44.4 35.0 105.6

Group operating profit per quarter
2013–H1/2017
7
Cumulative operating profit per review period
Group operating profit per quarter
1–6/2017
Net sales 718.9 M€ (613.3 M€), +17.2%
EBIT 153.0 M€ (128.0 M€), +19.6%
0
100
200
300
400
1–3 1–6 1–9 1–12
M€
2013 2014 2015 2016 2017
0
50
100
150
Q1 Q2 Q3 Q4
M€
2013 2014 2015 2016 2017
4–6/2017
Net sales 393.0 M€ (337.4 M€), +16.5%
EBIT 94.1 M€ (77.5 M€), +21.5%

Net sales by market area 1–6/2017Share of Russia increased
8
Finland14% (17%)
Sweden12 % (14%)
Norway11 % (12%)
Russia and CIS25% (16%)
Other Europe
26% (28%)
North America11 % (12%)

Raw material cost developmentIncrease continued in H1
Nokian Tyres’ raw material costs (€/kg)
increased by 20.4% in H1/2017 vs. H1/2016
increased by 5.1% in Q2/2017 vs. Q1/2017
is estimated to increase by approximately 20%
in 2017 vs. 2016
Estimated headwind in 2017 vs. 2016:
approximately 60 M€
Raw material cost development index 2010–E2017
9
100
131 131
114
96
8379
94
70
80
90
100
110
120
130
140
2010 2011 2012 2013 2014 2015 2016 E2017
78 78
82
90
95
70
75
80
85
90
95
100
Q2/2016 Q3/2016 Q4/2016 Q1/2017 Q2/2017

Total investments 2017E: 190 M€ Investments 60.0 M€ in H1/2017 (44.4 M€ in H1/2016)
0
50
100
150
200
250
2012 2013 2014 2015 2016 2017E
M€
Investments Depreciation
Investments 2017E:
Expansion of the Vsevolozhsk factory capacity and
investments in the automation
Capacity 15.5 M tyres 17 M tyres
Total 83 M€
Nokia factory and global development projects
Total 78 M€
Heavy Tyres, sales companies and Vianor chain
Total 29 M€
10

1. General overview
2. Nokian Tyres financial performance
4. Nokian Tyres going forward
3. Business units
General overview
Passenger Car Tyres
Heavy Tyres
Vianor and branded distribution network

Business units 1–6/2017Strong performance in Passenger Car Tyres
Passenger Car Tyres
Net sales: 524.4 M€; +21.2%
EBIT: 160.7 M€; +26.6%
EBIT margin: 30.6% (29.4%)
Vianor
Net sales: 146.1 M€; +2.0%
EBIT: -11.8 M€; -29.0%
EBIT margin: -8.1% (-6.4%)
Heavy Tyres
Net sales: 83.8 M€; +9.8%
EBIT: 14.8 M€; -1.2%
EBIT margin: 17.7% (19.7%)
Net sales 718.9 M€
Business units 1-6/2017 1-6/2016
1. Passenger Car Tyres 70% 66%
2. Vianor 19% 22%
3. Heavy Tyres 11% 12%
EBIT 153.0 M€EBIT Bridge by Business Units
12
1
2
3
0
20
40
60
80
100
120
140
160
180
1-6/16 CarTyres
HeavyTyres
Vianor Elim 1-6/17

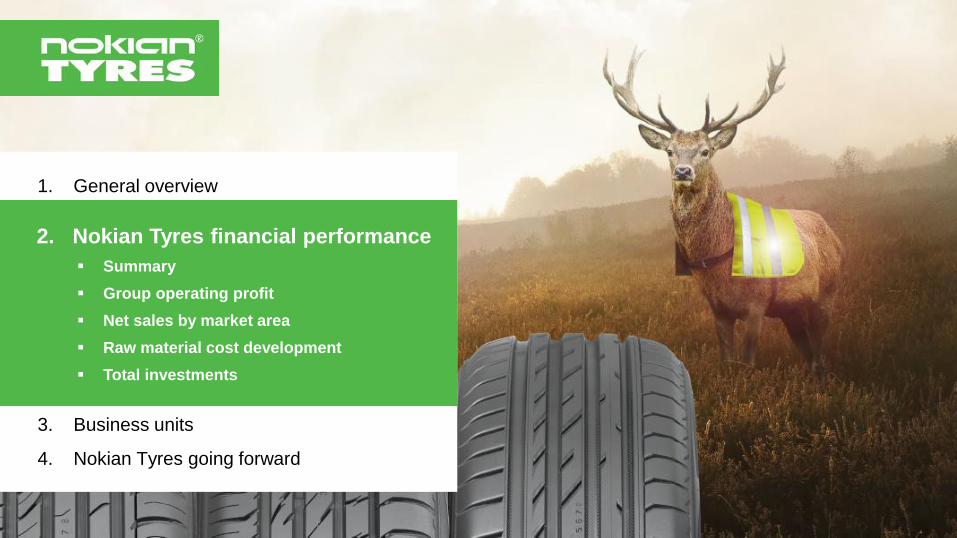
Passenger Car TyresGrowth in all markets, highest growth in Russia
Performance in 1–6/2017
+ Net sales increased clearly mainly due to a significant
net sales increase in Russia
+ In North America, Other Europe, and the Nordic
countries, net sales increased
+ Price increases implemented in all markets
+ ASP increased due to a positive currency impact,
improved product mix and price increases
+ Nokian Tyres excelled in tyre tests
+ Production output increased by 13%
+ Productivity improved by 2%
13
4–6/17
4–6/16
Change%
1–6/17
1–6/16
Change%
2016
Net sales, M€ 276.4 230.1 20.1 524.4 432.6 21.2 981.1
Operating profit, M€ 84.8 64.7 31.0 160.7 127.0 26.6 305.8
Operating profit, % 30.7 28.1 30.6 29.4 31.2
- The full effect of price increases will be seen
from H2/2017 onwards due to the seasonality of
Nokian Tyres’ business model
Passenger Car Tyres
14
Both sales and operating profit improved
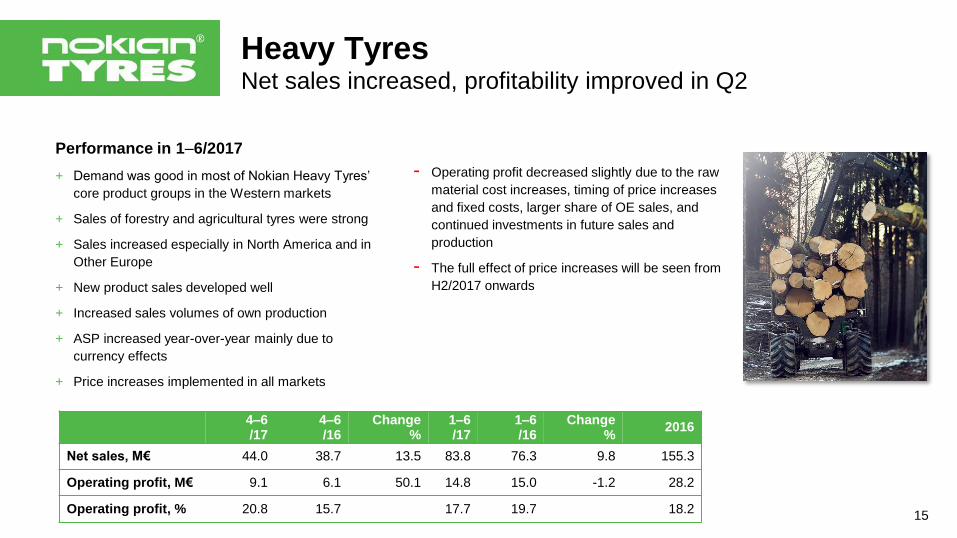
Heavy TyresNet sales increased, profitability improved in Q2
Performance in 1–6/2017
+ Demand was good in most of Nokian Heavy Tyres’
core product groups in the Western markets
+ Sales of forestry and agricultural tyres were strong
+ Sales increased especially in North America and in
Other Europe
+ New product sales developed well
+ Increased sales volumes of own production
+ ASP increased year-over-year mainly due to
currency effects
+ Price increases implemented in all markets
- Operating profit decreased slightly due to the raw
material cost increases, timing of price increases
and fixed costs, larger share of OE sales, and
continued investments in future sales and
production
- The full effect of price increases will be seen from
H2/2017 onwards
15
4–6/17
4–6/16
Change%
1–6/17
1–6/16
Change%
2016
Net sales, M€ 44.0 38.7 13.5 83.8 76.3 9.8 155.3
Operating profit, M€ 9.1 6.1 50.1 14.8 15.0 -1.2 28.2
Operating profit, % 20.8 15.7 17.7 19.7 18.2

Heavy Tyres – new productsThe New Nokian HTS G2 – High performance and reliability
for container handling
The 2nd generation of terminal tyres – high performance and reliability for material and
container handling
The new Nokian HTS G2 tyres have been designed to be even more rugged, efficient
and safe, and tests confirm that Nokian has succeeded in all these areas
Tyres are available either as L-4S slicks or with E-4 treads and have a multilayer, cross-
ply structure that provides stability and a high load-bearing capacity
Increased stability also means enhanced safety, as it prevents reach stackers from
kneeling even when handling the heaviest loads
16

Heavy Tyres – new productsThe new Nokian E-Truck series – Reliable, economical
kilometers for every season and axle position
Nokian E-Truck series of all-season truck and bus tyres is optimized for long and medium
haul in regular weather conditions
The tyres are perfectly balanced to work well in Central Europe as well as on Nordic main
roads
E-Truck products feature a special rubber compound for all-season use
The optimized groove pattern enables low rolling resistance, and economical as well as
ecological kilometers
E-tread series of retreading materials complement the E-Truck series, and make it
possible to squeeze up to even a million kilometers from one tyre
17

Heavy Tyres – new productsThe new Nokian Hakkapeliitta City Bus – Durability and grip
around the year
Nokian Hakkapeliitta City Bus is designed to endure the wear and tear of city streets, and
get there on time, even on snow and slush
Full-fledged city tyre with a deep, aggressive tread pattern and reinforced sidewalls
Quiet and comfortable to drive, which adds to safety and comfort
Good grip even when worn with Spiral Sipe System
Approved winter grip with the 3PMSF marking
18

Heavy Tyres – new productsThe new Nokian Hakka Truck Steer – Stable steering and
good mileage
With Nokian Hakka Truck Steer Nokian Tyres sets out to create an optimized feature set
for all-weather long and medium haul steering axle tyre
New kind of tyre with good wear resistance, low rolling resistance, and grip on wet as well
as snowy roads – all this while being pleasantly quiet
Better grip by new type of sipe activator – called Oka
New generation all-weather tread design with 3PMSF approval
Extended mileage thanks to wide tread and even wear pattern
Less stone trapping with the new stepped rock resistor
19

VianorProfit improvement program ongoing
Performance in 1–6/2017
+ Net sales increased slightly
year-over-year
+ The profit improvement program, including
the network optimization, progressed
according to plan
Atypical summer tyre season
Restructuring costs EUR 1.8 million
The retail business environment continued
to be very challenging
20
Equity operations4–6/17
4–6/16
Change%
1–6/17
1–6/16
Change %
2016
Net sales, M€ 89.8 89.4 0.4 146.1 143.2 2.0 334.8
Operating profit, M€ 4.0* 5.5 -27.6 -11.8** -9.2 -29.0 -8.1
Operating profit, % 4.5* 6.2 -8.1** -6.4 -2.4
Equity stores, pcs 205 202 212
* Excluding non-recurring items: Operating profit EUR 5.8 million, operating profit percentage 6.5%.
** Excluding non-recurring items: Operating profit EUR -10.0 million, operating profit percentage -6.8%.

Nokian Tyres’ branded distribution networkVianor, NAD, N-Tyre – +145 stores in 1–6/2017
21
Vianor – 1,506 stores in 27 countries
205 equity stores and 1,301 partners
Equity stores -7, partner +12 vs. year-end 2016
largest tyre chain in Nordic and Baltic countries:
381 stores (-2 vs. year-end 2016)
largest tyre chain in Russia and CIS:
653 stores (-2 vs. year-end 2016)
Central Europe:
391 stores (+9 vs. year-end 2016)
USA:
81 stores (unchanged vs. year-end 2016)
Nokian Tyres Authorized Dealers (NAD) – 1,618 stores
in 21 European countries and China
increase of 137 stores vs. year-end 2016
N-Tyre – 123 stores
in Russia and the CIS
increase of 3 stores vs. year-end 2016

1. General overview
2. Nokian Tyres financial performance
3. Business units
4. Nokian tyres going forward
4. Nokian Tyres going forward

Nokian Tyres’ assumptions
Markets
New car sales growth 4% in Europe
New car sales in Russia to increase by up to 10%
Passenger car tyre markets
Demand in CE, North America,
and the Nordic countries to grow
Demand in Russia (sell-in) to increase by 10–15%
Raw material costs (€/kg) are estimated to increase by
approximately 20% in 2017 compared with 2016
Investments approximately 190 M€ in 2017
Heavy tyre market demand stable in Nokian Tyres’
core product groups
Nokian Tyres financial position remains solid
Outlook 2017Steadily on the growth track
Outlook 2017
Nokian Tyres’ position is expected to improve in all key markets.
In Russia, the company expects to retain and further strengthen its market
leader position in the A+B segments in 2017.
New flagship products will strengthen Nokian Tyres’ position in core
markets.
Price increases have been implemented in all markets, and the full effect of
these increases will be seen from H2/2017 onwards due to the seasonality
of Nokian Tyres’ business model.
Profitability supported by efficient cost structure and productivity
on the back of high share of Russian production.
Year 2017 guidance (Updated)
In 2017, with the current exchange rates, net sales and operating profit are
expected to grow by at least 10% compared to 2016.
23
Interim Report
January–September 2017
November 1, 2017
www.nokiantyres.com/investors
Thank you!

Appendices
International Group
The investment of the third
factory
Biggest shareholders
Share price development
Competitor comparison
Magazine tests
Examples of new products
Winter tyre regulations
Personnel
Raw material consumption
Financing: Net financial
expenses and interest-bearing
debt
Key figures
25

Appendix: International GroupOwn production, test centers, sales companies and network
Nokia, Finland
– capacity 2.5 M tyres
– heavy tyres’ own production
Vsevolozhsk, Russia
– capacity >15,5 M tyres
Own production
and test centers
Own production:
Nokia, Finland and
Vsevolozhsk, Russia
Own test centers:
Ivalo and Nokia
Sales companies
Finland (parent
company), Sweden,
Norway, Russia, Ukraine,
Kazakhstan, Germany,
Switzerland, Czech
Republic, Belarus, USA,
Canada and China.
Vianor
1,506 stores in 27
countries
Equity -7, partner +12
compared with year-end
2016.
NAD (Nokian Tyres
Authorized Dealers)
1,618 stores
21 European countries
and China
Increase of 137 stores
compared with year-end
2016.
N-Tyre
123 stores
Russia and the CIS
Increase of 3 stores
compared with year-end
2016.
26

Growth strategy supported by a third factory in North America
27
Stock exchange release
May 3, 2017
The Board has made a principal decision on the investment in the third factory and authorized the management of the Company to sign a Letter of Intent with the respective authorities in the USA.
The new factory will be located in Dayton (Rhea County), Tennessee, USA
The annual capacity of the factory will be 4 million tyres with potential to expand in the future
The total amount of the investment at this phase is approximately USD 360 million
Construction is scheduled to begin in early 2018, and the first tyres are to be produced in 2020
Dayton
(Rhea County),
Tennessee,
USA
Appendix

AppendixBiggest Shareholders registered in Finland as of June 30, 2017
28
Division by Category as of June 30, 2017
Options, outstanding as of June 30, 2017
2013A: 166,777 (56,756 in company's possession)
2013B: 1,131,376 (40,321 in company's possession)
2013C: 1,149,415 (136,005 in company's possession)
Biggest Shareholders registered in FinlandNumber of
shares
Share of
capital %
Change from
previous month
1 Varma Mutual Pension Insurance Company 3,772,007 2.8 0
2 Ilmarinen Mutual Pension Insurance Company 2,744,035 2.0 +25,000
3 Odin Norden 1,031,217 0.8 0
4 The State Pension Fund 773,000 0.6 0
5 OP Investment Funds 610,000 0.4 +145,000
6 Evli Europe Fund 590,000 0.4 0
7 Nordea 540,272 0.4 +99,606
8 Schweizer Nationalbank 515,244 0.4 0
9 Svenska litteratursällskapet i Finland r.f. 494,700 0.4 0
10 Barry Staines Linoleum Oy 430,000 0.3 0
Biggest Shareholders total 11,500,475 8.5
Foreign Shareholders 1) 104,013,607 76.3
Bridgestone Corporation 2) 20,000,000 14.7
1) Includes also shares registered in the name of a nominee 2) In the name of a nominee.
See flagging and shareholders:
www.nokiantyres.com/company/investors/share/flagging-notifications/
www.nokiantyres.com/company/investors/share/major-shareholders/ Total number of shares: 136,315,634

AppendixIndexed share price development 2012–Q2/2017
29

AppendixNokian Tyres the most profitable tyre producer
Nokian Tyres’ profitability has been clearly better than that of the main peers during the past 5 years. The better profitability protects the company profits during recessions and potential downturns.
Source: Consensus estimates for the peers
as per Thomson Reuters July 3, 2017.
E2017 FIGURES ARE BASED ON CONSENSUS
ESTIMATES, NOT NOKIAN TYRES GUIDANCE.
30
Net margin E2017
Nokian Tyres 18.0%
Bridgestone 8.2%
Michelin 7.6%
Continental 7.3%

Test success for winter tyres
Winter tyres, autumn 2016Nordic and Russia
Nokian Hakkapeliitta 8 studded winter tyre. Test winner Tekniikan Maailma (shared), Tuulilasi
(Finland), Vi Bilägare, Auto, Motor & Sport (Sweden), Za Rulem, Autoreview, Auto.mail.ru (Russia)
and AutoCentre (Ukraine). Winner also in Sweden (Aftonbladet) and in Norway (Motor) by Test
World test
Nokian Hakkapeliitta R2 non-studded winter tyre. Test winner Auto, Motor & Sport (Sweden).
2nd place Tekniikan Maailma, Tuulilasi (Finland), Vi Bilägare, Aftonbladet (Sweden), Motor
(Norway), Za Rulem (Russia)
Nokian Hakkapeliitta 8 SUV. Test winner Tekniikan Maailma (Finland), Za Rulem (Russia) and
Auto Bild Belarus
Nokian Hakkapeliitta R2 SUV. Test winner Za Rulem (Russia), Auto Bild Belarus, AutoCentre
(Ukraine), 2nd place Automobily (Kazakhstan), 3rd place Tekniikan Maailma (Finland)
Nokian Hakkapeliitta CR3. Test winner Auto Bild Belarus
Nokian Hakkapeliitta C3. Test winner Husbilet (Sweden)
Nokian Hakkapeliitta CR Van. 2nd place Husbilet (Sweden)
Central Europe
Nokian WR D4 winter tyre. Test winner Motor (Poland). 2nd place Auto Motor und Sport
“Recommendable”, Auto Zeitung “Highly recommended” and GTÜ “Very recommendable”, 2nd
place Auto Express (UK). ADAC “Satisfactory”, ÖAMTC and TCS “Recommendable”
Nokian Weatherproof all-weather tyre. Test winner ACE Lenkrad and ARBÖ “Highly
recommendable”. ADAC 3rd place “Sufficient”, 2nd place Auto Express (UK), 2nd place shared
ProMobil
www.nokiantyres.com/test-success
Appendix: Magazine tests autumn 2016
31
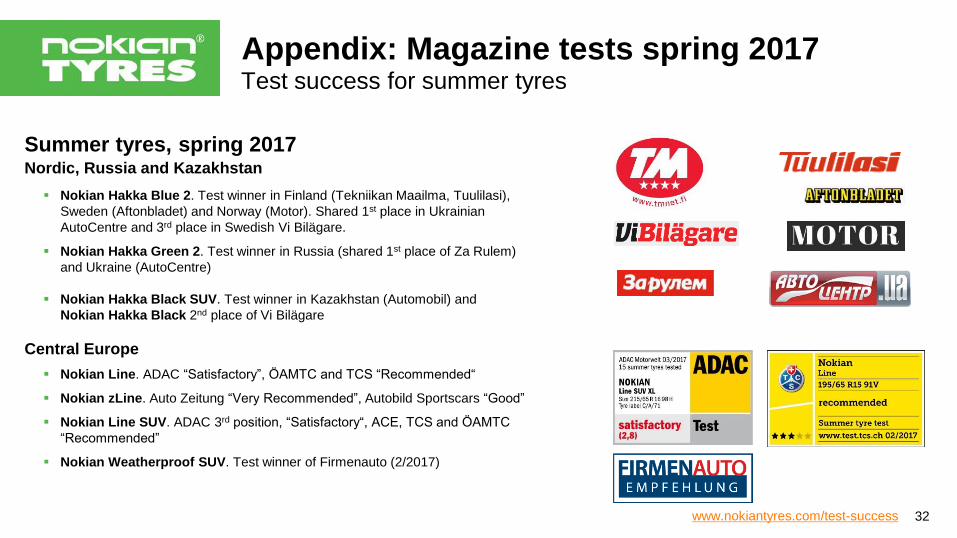
Test success for summer tyres
Summer tyres, spring 2017Nordic, Russia and Kazakhstan
Nokian Hakka Blue 2. Test winner in Finland (Tekniikan Maailma, Tuulilasi),
Sweden (Aftonbladet) and Norway (Motor). Shared 1st place in Ukrainian
AutoCentre and 3rd place in Swedish Vi Bilägare.
Nokian Hakka Green 2. Test winner in Russia (shared 1st place of Za Rulem)
and Ukraine (AutoCentre)
Nokian Hakka Black SUV. Test winner in Kazakhstan (Automobil) and
Nokian Hakka Black 2nd place of Vi Bilägare
Central Europe
Nokian Line. ADAC “Satisfactory”, ÖAMTC and TCS “Recommended“
Nokian zLine. Auto Zeitung “Very Recommended”, Autobild Sportscars “Good”
Nokian Line SUV. ADAC 3rd position, “Satisfactory“, ACE, TCS and ÖAMTC
“Recommended”
Nokian Weatherproof SUV. Test winner of Firmenauto (2/2017)
32www.nokiantyres.com/test-success
Appendix: Magazine tests spring 2017

Nokian Hakkapeliitta 9 and Nokian Hakkapeliitta 9 SUV
- unique Double Stud Technology
Appendix: Passenger Car Tyres – new products
33
Extreme winter safety. The Nokian Hakkapeliitta 9 and Hakkapeliitta 9 SUV studded tyres
adapt to all the challenges of winter and ensure easy and comfortable driving even on the
worst winter days
Nokian Hakkapeliitta 9 and 9 SUV premium winter tyres for Nordic countries, Russia and
North America
The unique, patented Double Stud Technology is at the heart of the new products
The modern Nokian Hakkapeliitta 9 product range covers sizes from 14 inches to 20
inches.
The extensive and modern selection for the flagship product will be available for the winter
tyre season of autumn 2017
Nokian Hakkapeliitta 9
Extreme winter safety
Patented Double Stud Technology

Appendix: Passenger Car Tyres – new productsNokian Nordman 7 and Nokian Nordman 7 SUV
– simple reliability for varying winter weather
34
Nokian Nordman tyres are a reliable choice for the varying Northern conditions offering an
alternative to the premium products in terms of the price to quality ratio
The key markets for Nokian Nordman studded tyres are in the Nordic countries, Russia
and North America
Offers safe and comfortable winter driving
The reliable winter grip and soft road contact are ensured by Air Claw Technology
The comprehensive size selection of these new products will be available to consumers in
the autumn of 2017
Nokian Nordman 7
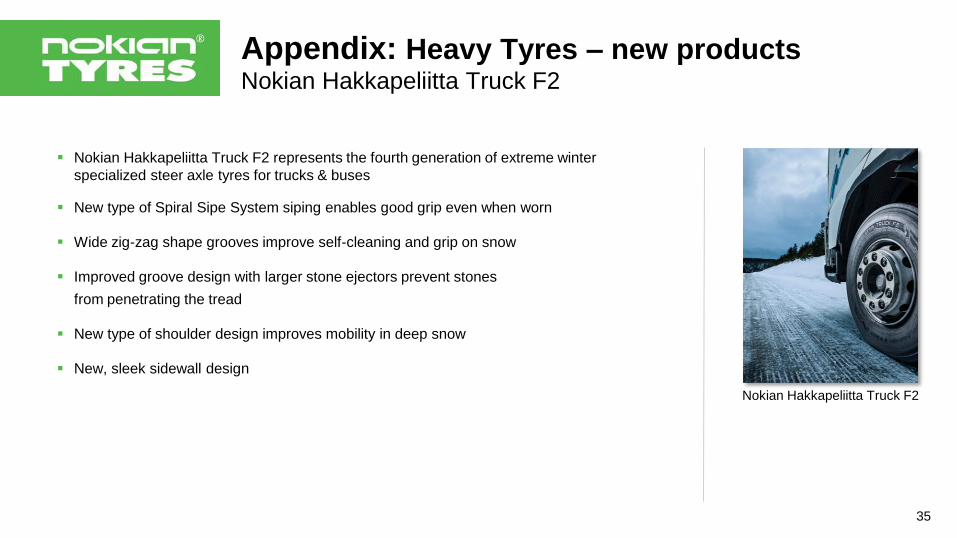
Appendix: Heavy Tyres – new productsNokian Hakkapeliitta Truck F2
35
Nokian Hakkapeliitta Truck F2 represents the fourth generation of extreme winter
specialized steer axle tyres for trucks & buses
New type of Spiral Sipe System siping enables good grip even when worn
Wide zig-zag shape grooves improve self-cleaning and grip on snow
Improved groove design with larger stone ejectors prevent stones
from penetrating the tread
New type of shoulder design improves mobility in deep snow
New, sleek sidewall design
Nokian Hakkapeliitta Truck F2

Appendix: Nokian Tyres – new productsNokian Hakkapeliitta 44 – at home in harsh winter conditions
36
Robust Nokian Hakkapeliitta 44 winter tyre is the newest top-of-the-line product resulting
from the cooperation between Nokian Tyres and Arctic Trucks
The Nokian Hakkapeliitta 44 is especially designed for Arctic Trucks’ heavy SUV-type 4x4
vehicles
Vehicles are used in the harshest environments of the world: such as glaciers, Antarctica,
and the northern part of Eurasia
Nokian Tyres Polar Expedition tread compound combines first class winter grip with
durability excelling in extreme cold weather
Novelty is available exclusively through Arctic Trucks and Nokian TyresNokian Hakkapeliitta 44

AppendixWinter tyre regulations in Europe and Russia
37
Source: Nokian Tyres 6/2017
1) On major roads, regardless of weather conditions, on other roads, in wintry weather conditions
2) Both equally valid
3) Sufficient grip requirement; de facto mandatory winter tyres

Winter tyre regulations in USA
(*) The use is restricted on special use / special regions.
Source: Nokian Tyres 6/2017
Appendix
38

Source: Nokian Tyres 6/2017
39
AppendixWinter tyre regulations in Canada

AppendixPersonnel June 30, 2017
Nokian Tyres Group: 4,495 (4,266)
Finland: 1,715 (1,616)
Russia: 1,430 (1,352)
Equity-owned Vianor: 1,635 (1,661)
40
2000
2500
3000
3500
4000
4500
5000
2013 2014 2015 2016 H1/2017
Nu
mb
er
of
em
plo
yees

AppendixValue of raw material consumption (%)
41
Source: Nokian Tyres 6/2017
Natural Rubber30 %
Synthetic Polymers27 %
Fillers11 %
Reinforcement Material
19 %
Chemicals13 %

AppendixFinancing: Net financial expenses and interest-bearing debt
42
Exchange rate differences in net financial items (M€)
1-6/2017
RUB NOK SEK USD CAD Other Total
Underlying 1) -23.7 -1.7 -0.6 -1.1 -1.1 -1.1 -29.2
Hedging 23.8 0.6 0.6 1.0 0.9 0.2 27.2
Hedging cost -0.4 -0.2 0.0 -0.1 -0.2 0.0 -0.8
Total -0.3 -1.2 0.1 -0.2 -0.3 -0.9 -2.8
1) AP, AR, Internal loans/deposits
- = Expenses, + = Income
Interest-bearing debt
-25
-20
-15
-10
-5
0
5Q2/15 Q3/15 Q4/15 Q1/16 Q2/16 Q3/16 Q4/16 Q1/17 Q2/17
M€
Net interest expenses Exchange rate differences
Q2/15 Q3/15 Q4/15 Q1/16 Q2/16 Q3/16 Q4/16 Q1/17 Q2/17
Cash and cash equivalents 205 68 429 333 144 103 513 480 172
Interest-bearing net debt 91 183 -210 -112 80 121 -287 -253 -36
-400-300-200-100
0100200300400500600
M€
Interest-bearing net debt Cash and cash equivalents
Banks100 %
Pension loans0 %
Finance leases0 %
Market0 %
Interest-bearing debt 136.4 M€(June 30, 2017)
Net financial expenses per quarter

AppendixKey figures 2012–2016
43
Net sales and net sales growth
Net profit and net margin
EBIT and EBIT margin
Interest-bearing net debt and gearing
-20%
-15%
-10%
-5%
0%
5%
10%
15%
0
500
1000
1500
2000
2012 2013 2014 2015 2016
M€
Sales Growth (%)
10%
15%
20%
25%
30%
0
100
200
300
400
500
2012 2013 2014 2015 2016
M€
EBIT Margin %
-100%
-80%
-60%
-40%
-20%
0%
20%
-300
-250
-200
-150
-100
-50
0
50
2012 2013 2014 2015 2016
M€
IB net debt Gearing %
5,0 %
7,5 %
10,0 %
12,5 %
15,0 %
17,5 %
20,0 %
22,5 %
0
50
100
150
200
250
300
350
2012 2013 2014 2015 2016
M€
Net profit Net margin %

AppendixCash flow from operating activities 2012–H1/2017
44
2012 2013 2014 2015 2016 H1/2016 H1/2017
Cash flow from operating activities 389 318 323 283 364 -40 -46
Cash flow from investing activities -203 -143 -85 -105 -113 -45 -59
Cash flow from financing activities -220 -178 -228 -190 -168 -200 -237
Change in cash and cash equivalents -35 -4 11 -12 83 -285 -342
-500
-400
-300
-200
-100
0
100
200
300
400
500
M€

AppendixROE and ROI 2012–2016
45
Return on capital employedReturn on equity
0%
5%
10%
15%
20%
25%
30%
2012 2013 2014 2015 2016
RO
I
0%
5%
10%
15%
20%
25%
30%
2012 2013 2014 2015 2016
RO
E

Interim Report
January–September 2017
November 1, 2017
www.nokiantyres.com/investors
Thank you!