Embed Size (px)
Citation preview
Haiti’s biodiversity threatened by nearly complete lossof primary forestS. Blair Hedgesa,b,1, Warren B. Cohenc,2, Joel Timyand, and Zhiqiang Yange,3
aCenter for Biodiversity, Temple University, Philadelphia, PA 19122; bDepartment of Biology, Temple University, Philadelphia, PA 19122; cPacific NorthwestResearch Station, US Forest Service, Corvallis, OR 97331; dSociété Audubon Haiti, Petionville, Haiti; and eDepartment of Forest Ecosystem and Society,Oregon State University, Corvallis, OR 97331
Edited by Janet Franklin, University of California, Riverside, CA, and approved October 1, 2018 (received for review June 6, 2018)
Tropical forests hold most of Earth’s biodiversity. Their continuedloss through deforestation and agriculture is the main threat to spe-cies globally, more than disease, invasive species, and climatechange. However, not all tropical forests have the same ability tosustain biodiversity. Those that have been disturbed by humans, in-cluding forests previously cleared and regrown (secondary growth),have lower levels of species richness compared with undisturbed(primary) forests. The difference is even greater considering extinc-tions that will later emanate from the disturbance (extinction debt).Here, we find that Haiti has less than 1%of its original primary forestand is therefore among the most deforested countries. Primary for-est has declined over three decades inside national parks, and 42 ofthe 50 highest and largest mountains have lost all primary forest.Our surveys of vertebrate diversity (especially amphibians and rep-tiles) on mountaintops indicates that endemic species have been lostalong with the loss of forest. At the current rate, Haiti will loseessentially all of its primary forest during the next two decadesand is already undergoing a mass extinction of its biodiversity be-cause of deforestation. These findings point to the need, in general,for better reporting of forest cover data of relevance to biodiversity,instead of “total forest” as defined by the United Nation’s Food andAgricultural Organization. Expanded detection and monitoring ofprimary forest globally will improve the efficiency of conservationmeasures, inside and outside of protected areas.
conservation | deforestation | mass extinction | remote sensing | species
Primary forest is critical for maintaining much of the world’sbiodiversity (1, 2), and its loss is the greatest threat to species
survival (3), even if primary forest is later replaced by secondarygrowth (4–7). Nonetheless, most reports of forest cover and defor-estation in tropical countries omit the distinction between primaryforest and disturbed forest. The latter can include secondary growth(regrowth after complete clearance) and degraded primary forestwhere selective removal of trees has occurred through logging.Instead, “forest” is typically measured using the United Nation’sFood and Agricultural Organization’s (FAO) definition of “totalforest,” which is “land spanning more than 0.5 hectares with treeshigher than 5 meters and a canopy cover of more than 10%, or treesable to reach these thresholds in situ” (ref. 8, p. 3). The FAO definesprimary forest as “naturally regenerated forest of native species,where there are no clearly visible indications of human activities andthe ecological processes are not significantly disturbed” (ref. 8, p. 7).Knowledge of the extent of the world’s primary forests re-
mains poor because its value is not yet widely recognized and themethods used to detect it vary greatly. For example, Brazil, oneof the most important countries for biodiversity, reports its pri-mary forest data to the FAO based on indirect (rough) estimatesrather than remote sensing or field surveys (9). Reported esti-mates (10) of primary forest, as a percentage of total forest, varyfrom 99% (Ecuador) to below 1% (Nigeria), but it is unclear howmuch of this variation is based on the methods used.Estimates of Haiti’s forest cover using aerial photo analysis in the
1980s (11) and later by satellite imagery analysis (10, 12, 13) havevaried greatly, from 1 to 32% of total land area. However, none of
those studies explicitly estimated primary forest, which is of im-portance for biodiversity, and therefore we undertook a time-seriessatellite image analysis to quantify the loss of primary forest in Haitifrom 1988 to 2016. We also surveyed the two dominant vertebrategroups with endemics in Haiti, amphibians and reptiles, to assessspecies richness on mountains with and without primary forest.
ResultsPrimary forest in Haiti declined from 4.4% of total land area in1988 to 0.32% in 2016 (Fig. 1). We also found that using dif-ferent levels of tree canopy coverage as the threshold value forforest greatly affects the final proportion of forest cover in Haiti.For example, using a threshold of 10% tree canopy (FAOstandard) will estimate that forests cover 50% of Haiti whereas a70% threshold will estimate that forest covers only 7.5% of Haiti(Fig. 1C). The time-series approach (SI Appendix, Table S1)starts with the stringent 70% threshold and then eliminates casesof major regrowth (secondary growth) by following 30-m pixelsback in time to make sure they always represented forestedareas. These results explain why a recent study (13) obtained a100-fold higher estimate (32%) for forest cover in Haiti. Thatstudy used a low threshold of 10% canopy per pixel withoutperforming a time-series analysis, and therefore their estimateincluded many disturbed habitats that would not support theoriginal biodiversity.
Significance
The loss of forest from human activities is a global threat tobiodiversity, continually diminishing populations of forest-dwelling species. However, species extinction usually is delayeduntil the last habitats disappear. Nonetheless, mass extinctionmay be imminent in a small number of tropical countries withlow forest cover. Here, we find that Haiti has less than 1% of itsoriginal primary forest and is therefore among the most defor-ested countries in the world. Forty-two of the 50 highest andlargest mountains have lost all primary forest. Our surveys ofvertebrates on these mountaintops suggest that endemic spe-cies have been lost along with the loss of forest. This indicatesthat Haiti is already undergoing a mass extinction of its bio-diversity because of deforestation.
Author contributions: S.B.H. designed research; S.B.H., W.B.C., J.T., and Z.Y. performedresearch; S.B.H., W.B.C., J.T., and Z.Y. analyzed data; and S.B.H., W.B.C., J.T., and Z.Y.wrote the paper.
The authors declare no conflict of interest.
This article is a PNAS Direct Submission.
Published under the PNAS license.1To whom correspondence should be addressed. Email: [email protected] address: Department of Forest Ecosystem and Society, Oregon State University,Corvallis, OR 97331.
3Present address: Rocky Mountain Research Station, US Forest Service, Ogden, UT 84401.
This article contains supporting information online at www.pnas.org/lookup/suppl/doi:10.1073/pnas.1809753115/-/DCSupplemental.
Published online October 29, 2018.
11850–11855 | PNAS | November 13, 2018 | vol. 115 | no. 46 www.pnas.org/cgi/doi/10.1073/pnas.1809753115
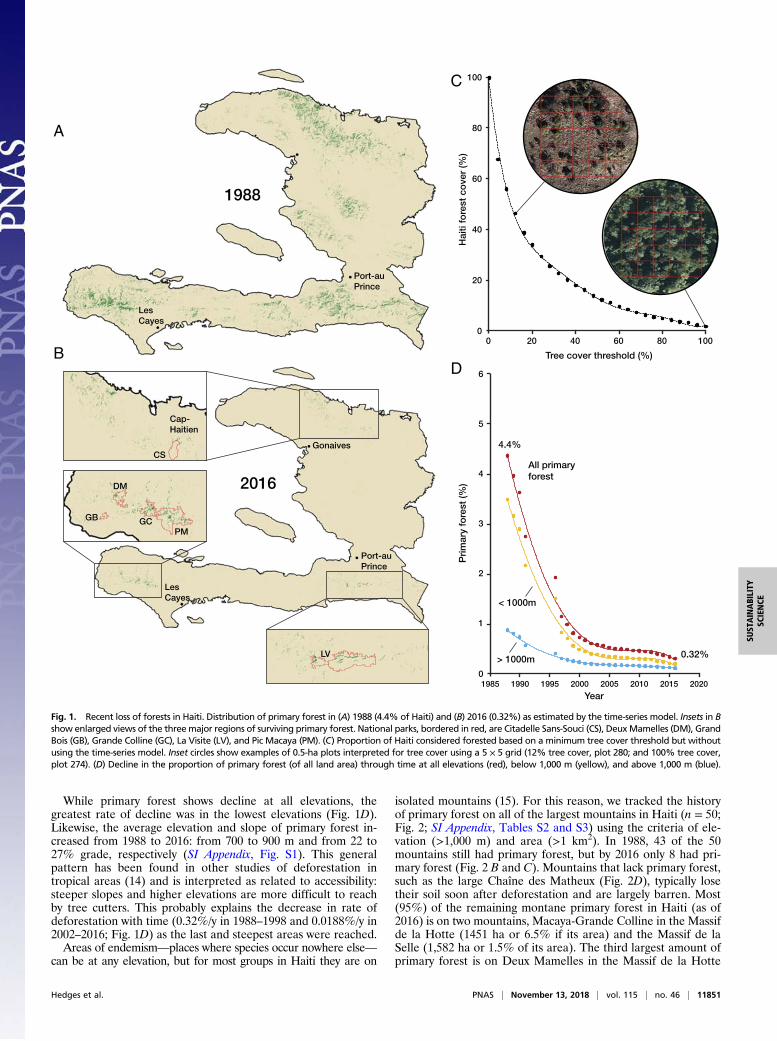
While primary forest shows decline at all elevations, thegreatest rate of decline was in the lowest elevations (Fig. 1D).Likewise, the average elevation and slope of primary forest in-creased from 1988 to 2016: from 700 to 900 m and from 22 to27% grade, respectively (SI Appendix, Fig. S1). This generalpattern has been found in other studies of deforestation intropical areas (14) and is interpreted as related to accessibility:steeper slopes and higher elevations are more difficult to reachby tree cutters. This probably explains the decrease in rate ofdeforestation with time (0.32%/y in 1988–1998 and 0.0188%/y in2002–2016; Fig. 1D) as the last and steepest areas were reached.Areas of endemism—places where species occur nowhere else—
can be at any elevation, but for most groups in Haiti they are on
isolated mountains (15). For this reason, we tracked the historyof primary forest on all of the largest mountains in Haiti (n = 50;Fig. 2; SI Appendix, Tables S2 and S3) using the criteria of ele-vation (>1,000 m) and area (>1 km2). In 1988, 43 of the 50mountains still had primary forest, but by 2016 only 8 had pri-mary forest (Fig. 2 B and C). Mountains that lack primary forest,such as the large Chaîne des Matheux (Fig. 2D), typically losetheir soil soon after deforestation and are largely barren. Most(95%) of the remaining montane primary forest in Haiti (as of2016) is on two mountains, Macaya-Grande Colline in the Massifde la Hotte (1451 ha or 6.5% if its area) and the Massif de laSelle (1,582 ha or 1.5% of its area). The third largest amount ofprimary forest is on Deux Mamelles in the Massif de la Hotte
1988
100
100
80
80
60
60
40
40
20
200
0
Hai
ti fo
rest
co
ver
(%)
Pri
mar
y fo
rest
(%)
Tree cover threshold (%)
Year
4.4%
All primaryforest
< 1000m
> 1000m 0.32%
Gonaives
Port-auPrince
Port-auPrince
LesCayes
LesCayes
Cap-Haitien
CS
DM
GB GCPM
LV
A
B
C
D
2016
6
5
4
3
2
1
01985 1990 1995 2000 2005 2010 2015 2020
Fig. 1. Recent loss of forests in Haiti. Distribution of primary forest in (A) 1988 (4.4% of Haiti) and (B) 2016 (0.32%) as estimated by the time-series model. Insets in Bshow enlarged views of the threemajor regions of surviving primary forest. National parks, bordered in red, are Citadelle Sans-Souci (CS), DeuxMamelles (DM), GrandBois (GB), Grande Colline (GC), La Visite (LV), and Pic Macaya (PM). (C) Proportion of Haiti considered forested based on a minimum tree cover threshold but withoutusing the time-series model. Inset circles show examples of 0.5-ha plots interpreted for tree cover using a 5 × 5 grid (12% tree cover, plot 280; and 100% tree cover,plot 274). (D) Decline in the proportion of primary forest (of all land area) through time at all elevations (red), below 1,000 m (yellow), and above 1,000 m (blue).
Hedges et al. PNAS | November 13, 2018 | vol. 115 | no. 46 | 11851
SUST
AINABILITY
SCIENCE
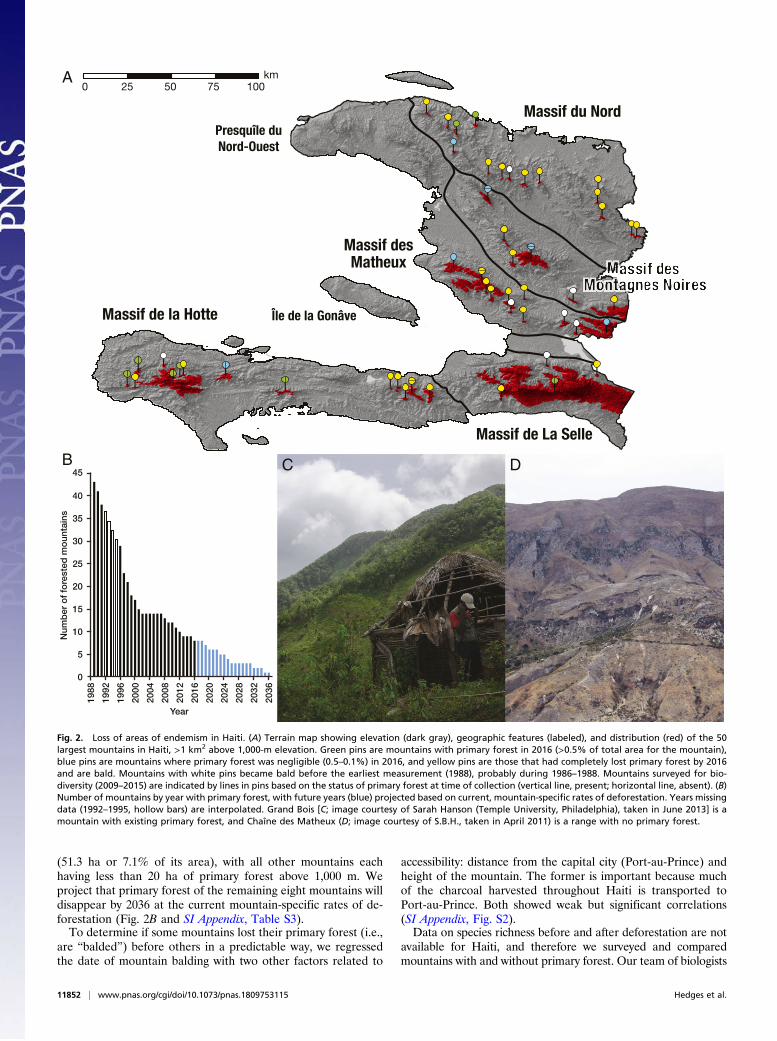
(51.3 ha or 7.1% of its area), with all other mountains eachhaving less than 20 ha of primary forest above 1,000 m. Weproject that primary forest of the remaining eight mountains willdisappear by 2036 at the current mountain-specific rates of de-forestation (Fig. 2B and SI Appendix, Table S3).To determine if some mountains lost their primary forest (i.e.,
are “balded”) before others in a predictable way, we regressedthe date of mountain balding with two other factors related to
accessibility: distance from the capital city (Port-au-Prince) andheight of the mountain. The former is important because muchof the charcoal harvested throughout Haiti is transported toPort-au-Prince. Both showed weak but significant correlations(SI Appendix, Fig. S2).Data on species richness before and after deforestation are not
available for Haiti, and therefore we surveyed and comparedmountains with and without primary forest. Our team of biologists
Massif du Nord
Massif de la Hotte
Massif de La Selle
Massif desMatheux
Presquîle duNord-Ouest
Île de la Gonâve
0 25 50 75 100kmA
B C D
Num
ber
of
fore
sted
mo
unta
ins
45
40
35
30
25
20
15
10
5
0
1988
1992
1996
2000
2004
2008
2012
2016
2020
2024
2028
2032
2036
Year
Fig. 2. Loss of areas of endemism in Haiti. (A) Terrain map showing elevation (dark gray), geographic features (labeled), and distribution (red) of the 50largest mountains in Haiti, >1 km2 above 1,000-m elevation. Green pins are mountains with primary forest in 2016 (>0.5% of total area for the mountain),blue pins are mountains where primary forest was negligible (0.5–0.1%) in 2016, and yellow pins are those that had completely lost primary forest by 2016and are bald. Mountains with white pins became bald before the earliest measurement (1988), probably during 1986–1988. Mountains surveyed for bio-diversity (2009–2015) are indicated by lines in pins based on the status of primary forest at time of collection (vertical line, present; horizontal line, absent). (B)Number of mountains by year with primary forest, with future years (blue) projected based on current, mountain-specific rates of deforestation. Years missingdata (1992–1995, hollow bars) are interpolated. Grand Bois [C; image courtesy of Sarah Hanson (Temple University, Philadelphia), taken in June 2013] is amountain with existing primary forest, and Chaîne des Matheux (D; image courtesy of S.B.H., taken in April 2011) is a range with no primary forest.
11852 | www.pnas.org/cgi/doi/10.1073/pnas.1809753115 Hedges et al.
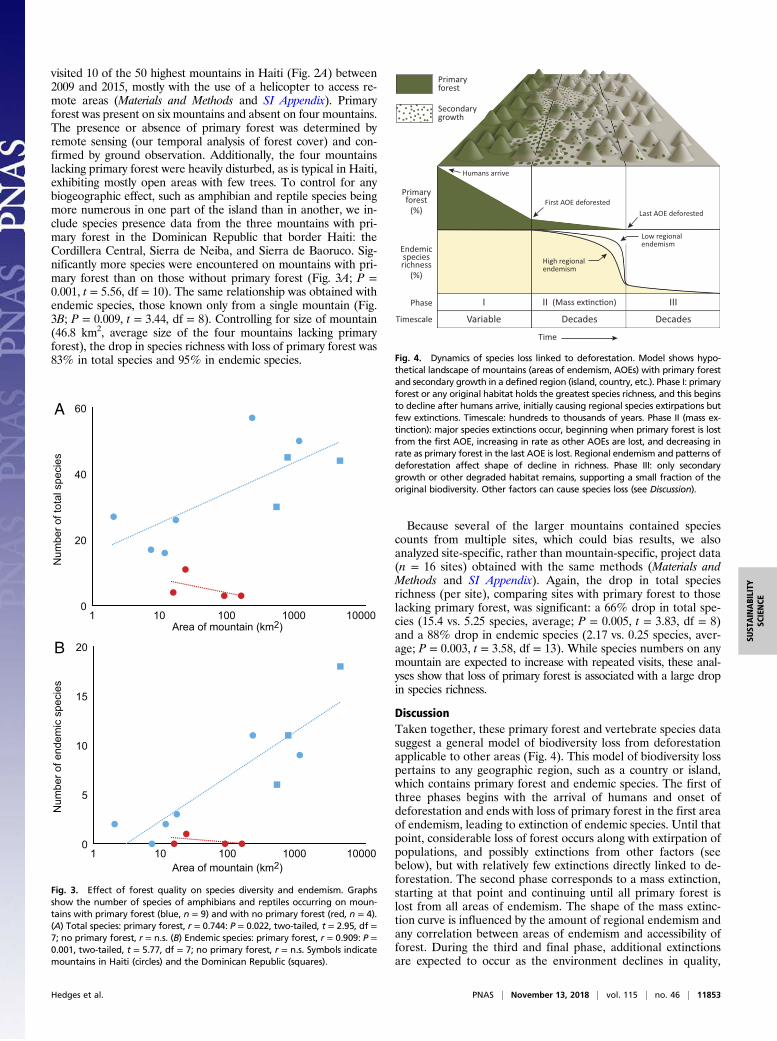
visited 10 of the 50 highest mountains in Haiti (Fig. 2A) between2009 and 2015, mostly with the use of a helicopter to access re-mote areas (Materials and Methods and SI Appendix). Primaryforest was present on six mountains and absent on four mountains.The presence or absence of primary forest was determined byremote sensing (our temporal analysis of forest cover) and con-firmed by ground observation. Additionally, the four mountainslacking primary forest were heavily disturbed, as is typical in Haiti,exhibiting mostly open areas with few trees. To control for anybiogeographic effect, such as amphibian and reptile species beingmore numerous in one part of the island than in another, we in-clude species presence data from the three mountains with pri-mary forest in the Dominican Republic that border Haiti: theCordillera Central, Sierra de Neiba, and Sierra de Baoruco. Sig-nificantly more species were encountered on mountains with pri-mary forest than on those without primary forest (Fig. 3A; P =0.001, t = 5.56, df = 10). The same relationship was obtained withendemic species, those known only from a single mountain (Fig.3B; P = 0.009, t = 3.44, df = 8). Controlling for size of mountain(46.8 km2, average size of the four mountains lacking primaryforest), the drop in species richness with loss of primary forest was83% in total species and 95% in endemic species.
Because several of the larger mountains contained speciescounts from multiple sites, which could bias results, we alsoanalyzed site-specific, rather than mountain-specific, project data(n = 16 sites) obtained with the same methods (Materials andMethods and SI Appendix). Again, the drop in total speciesrichness (per site), comparing sites with primary forest to thoselacking primary forest, was significant: a 66% drop in total spe-cies (15.4 vs. 5.25 species, average; P = 0.005, t = 3.83, df = 8)and a 88% drop in endemic species (2.17 vs. 0.25 species, aver-age; P = 0.003, t = 3.58, df = 13). While species numbers on anymountain are expected to increase with repeated visits, these anal-yses show that loss of primary forest is associated with a large dropin species richness.
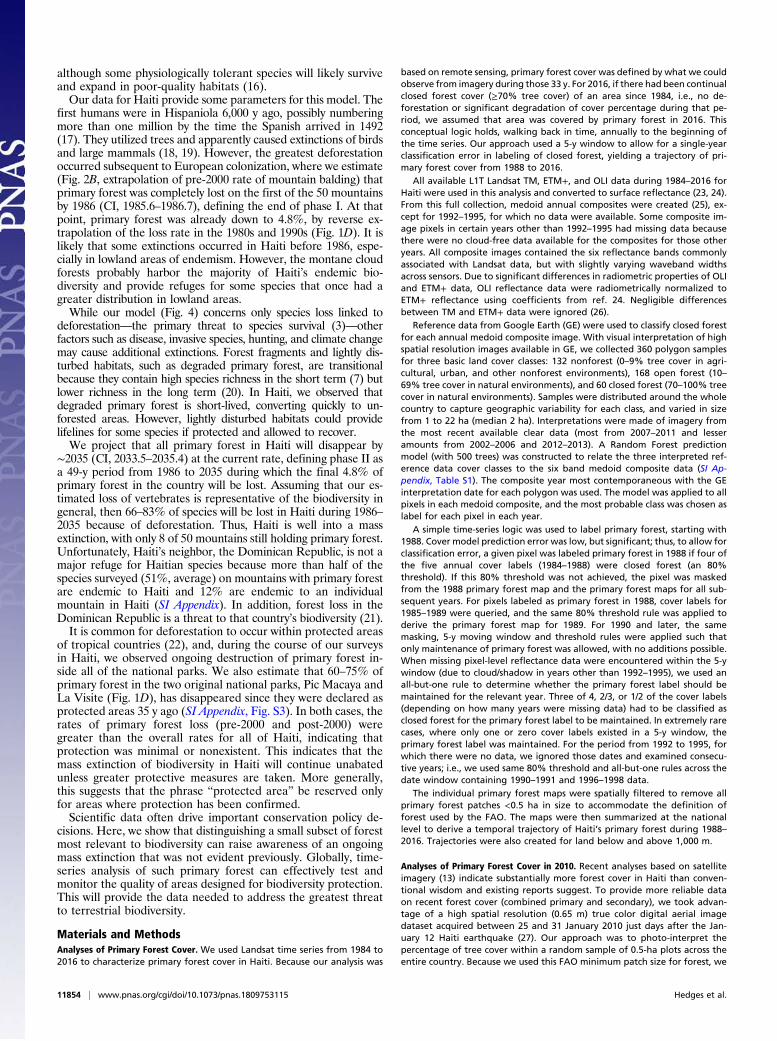
DiscussionTaken together, these primary forest and vertebrate species datasuggest a general model of biodiversity loss from deforestationapplicable to other areas (Fig. 4). This model of biodiversity losspertains to any geographic region, such as a country or island,which contains primary forest and endemic species. The first ofthree phases begins with the arrival of humans and onset ofdeforestation and ends with loss of primary forest in the first areaof endemism, leading to extinction of endemic species. Until thatpoint, considerable loss of forest occurs along with extirpation ofpopulations, and possibly extinctions from other factors (seebelow), but with relatively few extinctions directly linked to de-forestation. The second phase corresponds to a mass extinction,starting at that point and continuing until all primary forest islost from all areas of endemism. The shape of the mass extinc-tion curve is influenced by the amount of regional endemism andany correlation between areas of endemism and accessibility offorest. During the third and final phase, additional extinctionsare expected to occur as the environment declines in quality,
0
20
40
60
1 10 100 1000 10000
0
5
10
15
20
1 10 100 1000 10000
Num
ber o
f tot
al s
peci
esN
umbe
r of e
ndem
ic s
peci
es
Area of mountain (km2)
A
B
Area of mountain (km2)
Fig. 3. Effect of forest quality on species diversity and endemism. Graphsshow the number of species of amphibians and reptiles occurring on moun-tains with primary forest (blue, n = 9) and with no primary forest (red, n = 4).(A) Total species: primary forest, r = 0.744: P = 0.022, two-tailed, t = 2.95, df =7; no primary forest, r = n.s. (B) Endemic species: primary forest, r = 0.909: P =0.001, two-tailed, t = 5.77, df = 7; no primary forest, r = n.s. Symbols indicatemountains in Haiti (circles) and the Dominican Republic (squares).
I III
Variable Decades
Endemicspeciesrichness
(%)
Primaryforest
(%)
Phase
Timescale
Time
Humans arrive
Low regionalendemism
High regionalendemism
II
Decades
First AOE deforestedLast AOE deforested
Primary forest
Secondary growth
Fig. 4. Dynamics of species loss linked to deforestation. Model shows hypo-thetical landscape of mountains (areas of endemism, AOEs) with primary forestand secondary growth in a defined region (island, country, etc.). Phase I: primaryforest or any original habitat holds the greatest species richness, and this beginsto decline after humans arrive, initially causing regional species extirpations butfew extinctions. Timescale: hundreds to thousands of years. Phase II (mass ex-tinction): major species extinctions occur, beginning when primary forest is lostfrom the first AOE, increasing in rate as other AOEs are lost, and decreasing inrate as primary forest in the last AOE is lost. Regional endemism and patterns ofdeforestation affect shape of decline in richness. Phase III: only secondarygrowth or other degraded habitat remains, supporting a small fraction of theoriginal biodiversity. Other factors can cause species loss (see Discussion).
Hedges et al. PNAS | November 13, 2018 | vol. 115 | no. 46 | 11853
SUST
AINABILITY
SCIENCE
although some physiologically tolerant species will likely surviveand expand in poor-quality habitats (16).Our data for Haiti provide some parameters for this model. The
first humans were in Hispaniola 6,000 y ago, possibly numberingmore than one million by the time the Spanish arrived in 1492(17). They utilized trees and apparently caused extinctions of birdsand large mammals (18, 19). However, the greatest deforestationoccurred subsequent to European colonization, where we estimate(Fig. 2B, extrapolation of pre-2000 rate of mountain balding) thatprimary forest was completely lost on the first of the 50 mountainsby 1986 (CI, 1985.6–1986.7), defining the end of phase I. At thatpoint, primary forest was already down to 4.8%, by reverse ex-trapolation of the loss rate in the 1980s and 1990s (Fig. 1D). It islikely that some extinctions occurred in Haiti before 1986, espe-cially in lowland areas of endemism. However, the montane cloudforests probably harbor the majority of Haiti’s endemic bio-diversity and provide refuges for some species that once had agreater distribution in lowland areas.While our model (Fig. 4) concerns only species loss linked to
deforestation—the primary threat to species survival (3)—otherfactors such as disease, invasive species, hunting, and climate changemay cause additional extinctions. Forest fragments and lightly dis-turbed habitats, such as degraded primary forest, are transitionalbecause they contain high species richness in the short term (7) butlower richness in the long term (20). In Haiti, we observed thatdegraded primary forest is short-lived, converting quickly to un-forested areas. However, lightly disturbed habitats could providelifelines for some species if protected and allowed to recover.We project that all primary forest in Haiti will disappear by
∼2035 (CI, 2033.5–2035.4) at the current rate, defining phase II asa 49-y period from 1986 to 2035 during which the final 4.8% ofprimary forest in the country will be lost. Assuming that our es-timated loss of vertebrates is representative of the biodiversity ingeneral, then 66–83% of species will be lost in Haiti during 1986–2035 because of deforestation. Thus, Haiti is well into a massextinction, with only 8 of 50 mountains still holding primary forest.Unfortunately, Haiti’s neighbor, the Dominican Republic, is not amajor refuge for Haitian species because more than half of thespecies surveyed (51%, average) on mountains with primary forestare endemic to Haiti and 12% are endemic to an individualmountain in Haiti (SI Appendix). In addition, forest loss in theDominican Republic is a threat to that country’s biodiversity (21).It is common for deforestation to occur within protected areas
of tropical countries (22), and, during the course of our surveysin Haiti, we observed ongoing destruction of primary forest in-side all of the national parks. We also estimate that 60–75% ofprimary forest in the two original national parks, Pic Macaya andLa Visite (Fig. 1D), has disappeared since they were declared asprotected areas 35 y ago (SI Appendix, Fig. S3). In both cases, therates of primary forest loss (pre-2000 and post-2000) weregreater than the overall rates for all of Haiti, indicating thatprotection was minimal or nonexistent. This indicates that themass extinction of biodiversity in Haiti will continue unabatedunless greater protective measures are taken. More generally,this suggests that the phrase “protected area” be reserved onlyfor areas where protection has been confirmed.Scientific data often drive important conservation policy de-
cisions. Here, we show that distinguishing a small subset of forestmost relevant to biodiversity can raise awareness of an ongoingmass extinction that was not evident previously. Globally, time-series analysis of such primary forest can effectively test andmonitor the quality of areas designed for biodiversity protection.This will provide the data needed to address the greatest threatto terrestrial biodiversity.
Materials and MethodsAnalyses of Primary Forest Cover. We used Landsat time series from 1984 to2016 to characterize primary forest cover in Haiti. Because our analysis was
based on remote sensing, primary forest cover was defined by what we couldobserve from imagery during those 33 y. For 2016, if there had been continualclosed forest cover (≥70% tree cover) of an area since 1984, i.e., no de-forestation or significant degradation of cover percentage during that pe-riod, we assumed that area was covered by primary forest in 2016. Thisconceptual logic holds, walking back in time, annually to the beginning ofthe time series. Our approach used a 5-y window to allow for a single-yearclassification error in labeling of closed forest, yielding a trajectory of pri-mary forest cover from 1988 to 2016.
All available L1T Landsat TM, ETM+, and OLI data during 1984–2016 forHaiti were used in this analysis and converted to surface reflectance (23, 24).From this full collection, medoid annual composites were created (25), ex-cept for 1992–1995, for which no data were available. Some composite im-age pixels in certain years other than 1992–1995 had missing data becausethere were no cloud-free data available for the composites for those otheryears. All composite images contained the six reflectance bands commonlyassociated with Landsat data, but with slightly varying waveband widthsacross sensors. Due to significant differences in radiometric properties of OLIand ETM+ data, OLI reflectance data were radiometrically normalized toETM+ reflectance using coefficients from ref. 24. Negligible differencesbetween TM and ETM+ data were ignored (26).
Reference data from Google Earth (GE) were used to classify closed forestfor each annual medoid composite image. With visual interpretation of highspatial resolution images available in GE, we collected 360 polygon samplesfor three basic land cover classes: 132 nonforest (0–9% tree cover in agri-cultural, urban, and other nonforest environments), 168 open forest (10–69% tree cover in natural environments), and 60 closed forest (70–100% treecover in natural environments). Samples were distributed around the wholecountry to capture geographic variability for each class, and varied in sizefrom 1 to 22 ha (median 2 ha). Interpretations were made of imagery fromthe most recent available clear data (most from 2007–2011 and lesseramounts from 2002–2006 and 2012–2013). A Random Forest predictionmodel (with 500 trees) was constructed to relate the three interpreted ref-erence data cover classes to the six band medoid composite data (SI Ap-pendix, Table S1). The composite year most contemporaneous with the GEinterpretation date for each polygon was used. The model was applied to allpixels in each medoid composite, and the most probable class was chosen aslabel for each pixel in each year.
A simple time-series logic was used to label primary forest, starting with1988. Cover model prediction error was low, but significant; thus, to allow forclassification error, a given pixel was labeled primary forest in 1988 if four ofthe five annual cover labels (1984–1988) were closed forest (an 80%threshold). If this 80% threshold was not achieved, the pixel was maskedfrom the 1988 primary forest map and the primary forest maps for all sub-sequent years. For pixels labeled as primary forest in 1988, cover labels for1985–1989 were queried, and the same 80% threshold rule was applied toderive the primary forest map for 1989. For 1990 and later, the samemasking, 5-y moving window and threshold rules were applied such thatonly maintenance of primary forest was allowed, with no additions possible.When missing pixel-level reflectance data were encountered within the 5-ywindow (due to cloud/shadow in years other than 1992–1995), we used anall-but-one rule to determine whether the primary forest label should bemaintained for the relevant year. Three of 4, 2/3, or 1/2 of the cover labels(depending on how many years were missing data) had to be classified asclosed forest for the primary forest label to be maintained. In extremely rarecases, where only one or zero cover labels existed in a 5-y window, theprimary forest label was maintained. For the period from 1992 to 1995, forwhich there were no data, we ignored those dates and examined consecu-tive years; i.e., we used same 80% threshold and all-but-one rules across thedate window containing 1990–1991 and 1996–1998 data.
The individual primary forest maps were spatially filtered to remove allprimary forest patches <0.5 ha in size to accommodate the definition offorest used by the FAO. The maps were then summarized at the nationallevel to derive a temporal trajectory of Haiti’s primary forest during 1988–2016. Trajectories were also created for land below and above 1,000 m.
Analyses of Primary Forest Cover in 2010. Recent analyses based on satelliteimagery (13) indicate substantially more forest cover in Haiti than conven-tional wisdom and existing reports suggest. To provide more reliable dataon recent forest cover (combined primary and secondary), we took advan-tage of a high spatial resolution (0.65 m) true color digital aerial imagedataset acquired between 25 and 31 January 2010 just days after the Jan-uary 12 Haiti earthquake (27). Our approach was to photo-interpret thepercentage of tree cover within a random sample of 0.5-ha plots across theentire country. Because we used this FAO minimum patch size for forest, we
11854 | www.pnas.org/cgi/doi/10.1073/pnas.1809753115 Hedges et al.
could readily equate our percentage of tree cover interpretations to per-centage of forest cover after choosing a tree cover threshold to define forestand applying an appropriate estimation statistic.
We randomly selected 2,000 point locations from within Haiti and locatedan aerial image having each location close to its center. We created a 0.5-hasquare polygon with the plot at the polygon’s center. Each plot polygon wasgridded into 25 evenly sized cells (5 × 5) within which tree cover wasinterpreted. For each cell, at least 50% had to be covered by tree crowns tobe counted as tree cover for that cell; otherwise, the cell was not counted ascovered by trees. The number of cells containing at least 50% tree cover wascounted, and with 25 cells per plot, plot-level tree cover was calculated from0 to 100% in 4% increments. Trees included palms, plantations of fruit trees(e.g., mangoes, coconuts), and cacti >5 m, but not Musa spp. (bananas,plantains) or bamboo.
Using the plot data, forest cover was estimated using a range of thresholdsfrom 4 to 100% tree cover. Using a variable threshold of tree cover to defineforest cover allows for a more flexible definition of forest cover to suitdifferent applications and interpretations based on a host of considerationsabout ecosystem health, carbon storage, and biodiversity. Because oursample was random, at each tree cover threshold level the proportion ofinterpreted plots that met the given threshold was equal to the proportion ofHaiti covered by forest.
Defining, Measuring, and Projecting Decline of Primary Forest on 50 Mountains.First, we defined a mountain as being greater than 1,000 m in elevation andgreater than 1 km2 in area, resulting in exactly 50 mountains throughoutHaiti (Fig. 2 and SI Appendix, Fig. S2). The 1,000-m elevation thresholdcorresponds to the approximate low limit of cloud forest containing highmoisture and high species richness and endemism in Haiti (28). The 1-km2
area size threshold corresponds to the approximate low limit of mountainsize for presence of endemic species (Fig. 3). In most cases, mountain namesare from 1:50,000 scale topographic maps (29). The large mountain M7 in-cludes Chaîne de la Grande Colline and Chaîne de Macaya, but is less in-clusive than Massif de la Hotte, so we use the descriptor “Montagnes” inaccordance with usage elsewhere in Haiti, and hence Montagnes Macaya (SIAppendix).
We define the complete loss of primary forest using a near-zero thresholdof 0.5% rather than a zero threshold. This avoided cases where a fewmountains (e.g., M20) effectively reached zero but continued to show
nonzero amounts of primary forest over years (SI Appendix, Table S3). Usingthis threshold, 42 of the 50 mountains became bald (i.e., lost their primaryforest) before 2016 (SI Appendix, Table S2). For the eight mountains withprimary forest in 2016, we projected the year when each mountain willbecome bald, using the same threshold. To do this, we used the rate ofdecline from the preceding 5 y (SI Appendix, Table S3). It was not possible toproject forest-loss rates backward for the seven individual mountains thatwere already bald in the first year (1988). However, we extrapolated back-ward using the rate of balding (Fig. 2B), estimating that the first mountainbecame bald in 1986, and thus assign the dates of 1986–1988 for those sevenmountains.
Biodiversity Surveys and Analyses. Six mountains with primary forest (M1, M3,M6, M7, M8, andM47) and four mountains lacking primary forest (M14, M20,M32, and M46) were surveyed for amphibians and reptiles in Haiti from 2009to 2015 (Figs. 2A and 3 and SI Appendix, Table S2). All but two of thesemountains were newly surveyed. Because of limited access, we used a heli-copter, in most cases, to visit sites near the peaks of mountains. At each site,our team of four to six biologists searched in daylight and at night over 1–2d for amphibians and reptiles. Data on species encountered at each site arein SI Appendix. In the cases of M7 and M47, we include species found inearlier surveys and in the literature (30), which are indicated by “ES” (SIAppendix). For three mountains in the Dominican Republic, adjacent to Haitiand with primary forest still present, we used species lists based on existingdata (15, 30) (Fig. 3).
ACKNOWLEDGMENTS. We thank Philippe Bayard and Société AudubonHaiti for supporting field surveys; the government of Haiti (Lyonel Valbrun,Ministry of Agriculture) for granting permissions to conduct research inHaiti; Luis Angel, Tiffany Cloud, Claudio Contreras, Arnaud Dupuy, EladioFernández, Sarah Hanson, Jessie Haspil, Ingrid Henrys, Jurgen Hoppe, AndersonJean, Enold Louis, Miguel Landestoy, Jean-Mary Laurent, Allison Loveless,Einar Madsen, Carlos Martínez-Rivera, Jesús Méndez, Erwing Monsanto,Robin Moore, Jessica Preston, Elisabeth Rochel, Marcos Rodriguez, andRichard Thomas for assistance in the field; Angela Lu for assistance withfigures; Erik Haunreiter for assistance with forest cover analysis; and DavidSteadman for comments on the manuscript. This work was supported byNational Science Foundation Grant 0918891 (to S.B.H.) and by Critical Eco-systems Partnership Fund (CEPF) Grant 62132 (to S.B.H.). J.T. was supportedby CEPF Grant 63241.
1. Giam X (2017) Global biodiversity loss from tropical deforestation. Proc Natl Acad SciUSA 114:5775–5777.
2. Grosberg RK, Vermeij GJ, Wainwright PC (2012) Biodiversity in water and on land.Curr Biol 22:R900–R903.
3. Maxwell SL, Fuller RA, Brooks TM, Watson JE (2016) Biodiversity: The ravages of guns,nets and bulldozers. Nature 536:143–145.
4. Barlow J, et al. (2016) Anthropogenic disturbance in tropical forests can double bio-diversity loss from deforestation. Nature 535:144–147.
5. Newbold T, et al. (2015) Global effects of land use on local terrestrial biodiversity.Nature 520:45–50.
6. Gibson L, et al. (2011) Primary forests are irreplaceable for sustaining tropical bio-diversity. Nature 478:378–381.
7. Alroy J (2017) Effects of habitat disturbance on tropical forest biodiversity. Proc NatlAcad Sci USA 114:6056–6061.
8. Food and Agriculture Organization of the United Nations (2015) Forest resourceassessment working paper 180, terms and definitions (FAO, Rome).
9. Food and Agriculture Organization of the United Nations (2015) Global forest re-sources assessment 2015. Country report. Brazil (FAO, Rome).
10. Food and Agriculture Organization of the United Nations (2015) Global forest re-sources assessment 2015. Desk reference (FAO, Rome).
11. Cohen WB (1984) Environmental degradation in Haiti: An analysis of aerial photog-raphy (US Agency for International Development/Haiti, Port-au-Prince, Haiti).
12. Food and Agriculture Organization of the United Nations (2005) Global forest re-sources assessment 2005 (FAO, Rome).
13. Churches CE, Wampler PJ, Sun W, Smith AJ (2014) Evaluation of forest cover estimatesfor Haiti using supervised classification of Landsat data. Int J Appl Earth Obs Geoinf30:203–216.
14. Green GM, Sussman RW (1990) Deforestation history of the eastern rain forests ofMadagascar from satellite images. Science 248:212–215.
15. Hedges SB (2018) Caribherp: Amphibians and reptiles of Caribbean Islands (TempleUniversity, Philadelphia). Available at www.caribherp.org. Accessed April 20, 2018.
16. McKinney ML, Lockwood JL (1999) Biotic homogenization: A few winners replacingmany losers in the next mass extinction. Trends Ecol Evol 14:450–453.
17. Wilson SM (2001) The prehistory and early history of the Caribbean. Biogeography ofthe West Indies, eds Woods CA, Sergile FE (CRC Press, Boca Raton, FL), pp 519–527.
18. Steadman DW, et al. (2005) Asynchronous extinction of late Quaternary sloths oncontinents and islands. Proc Natl Acad Sci USA 102:11763–11768.
19. Steadman DW, Takano OM (2013) A late-holocene bird community from Hispaniola:Refining the chronology of vertebrate extinction in the West Indies. Holocene 23:936–944.
20. Haddad NM, et al. (2015) Habitat fragmentation and its lasting impact on Earth’secosystems. Sci Adv 1:e1500052.
21. Sangermano F, et al. (2015) Habitat suitability and protection status of four species ofamphibians in the Dominican Republic. Appl Geogr 63:55–65.
22. Leisher C, Touval J, Hess SM, Boucher TM, Reymondin L (2013) Land and forest deg-radation inside protected areas in Latin America. Divers Distrib 5:779–795.
23. United State Geological Survey (USGS) (2016) Product Guide: Landsat 4–7 ClimateData Record (CDR) Surface Reflectance. Available at https://landsat.usgs.gov/landsat-level-1-standard-data-products. Accessed May 24, 2017.
24. Roy DP, et al. (2016) Characterization of Landsat-7 to Landsat-8 reflective wavelengthand normalized difference vegetation index continuity. Remote Sens Environ 185:57–70.
25. Flood N (2013) Seasonal composite Landsat TM/ETM+ images using the medoid (amulti-dimensional median). Remote Sens 5:6481–6500.
26. Cohen WB, Maierpserger TK, Gower ST, Turner DP (2003) An improved strategy forregression of biophysical variables and Landsat ETM+ data. Remote Sens Environ 84:561–571.
27. United States Geological Survey (USGS) (2018) Hazards data distribution system(HDDS) Explorer (USGS, Reston, VA). Available at https://hddsexplorer.usgs.gov. Ac-cessed April 20, 2018.
28. Hedges SB (1999) Distribution patterns of amphibians in the West Indies. Patterns ofDistribution of Amphibians: A Global Perspective, ed Duellman WE (The Johns Hop-kins University Press, Baltimore), pp 211–254.
29. Hedges SB (2018) Caribmap: A Cartographic History of the West Indies (TempleUniversity, Philadelphia). Available at www.caribmap.org. Accessed April 20, 2018.
30. Schwartz A, Henderson R (1991) Amphibians and Reptiles of the West Indies:Descriptions, Distributions, and Natural History (Univ Florida Press, Gainesville, FL).
Hedges et al. PNAS | November 13, 2018 | vol. 115 | no. 46 | 11855
SUST
AINABILITY
SCIENCE