Embed Size (px)
Citation preview

Bossa Nova Technologies www.bossanovatech.com 11922 Jefferson Blvd. [email protected] Culver City, CA 90230 Tel: (310) 577-8113 USA Fax: (310) 943-3280
Pag
e1
Hair volume/surface measurement – fly-away/frizz analysis system
Technical Note - July 2016
1 – Introduction
BOLERO is a turnkey imaging system dedicated to hair swatch 3D volume reconstruction and fly-away/frizz
analysis. Based on the acquisition of a sequence of contour images of a swatch, the BOLERO delivers a 3D
model of the hair swatch. The system also simultaneously provides volume and surface measurements as
part of the 3D model, including frizz/fly-away analysis. Application of the BOLERO ranges from claim
substantiation and product efficacy testing for volumizing products, to basic analysis of hair swatch
volume and visual appearance.
2 – Bolero
Figure 1 shows BOLERO.
Figure 1: BOLERO with door open showing the hair tress and the LED background
BOLERO is composed of a digital camera, an LED illumination background for back light illumination and a
hair swatch mount placed on a rotation stage. To achieve an accurate measurement, the hair swatch must
be isolated from any air displacing variables (A/C or other sources) which may distort shape and therefore
3D volume reconstruction. To this end, the swatch is clipped to a holder (Figure 2), and the whole system
is incased in an enclosure. A magnetic door allows the user to easily close the enclosure and open it when
the hair swatch needs to be changed.
Bossa Nova Technologies www.bossanovatech.com 11922 Jefferson Blvd. [email protected] Culver City, CA 90230 Tel: (310) 577-8113 USA Fax: (310) 943-3280
Pag
e2
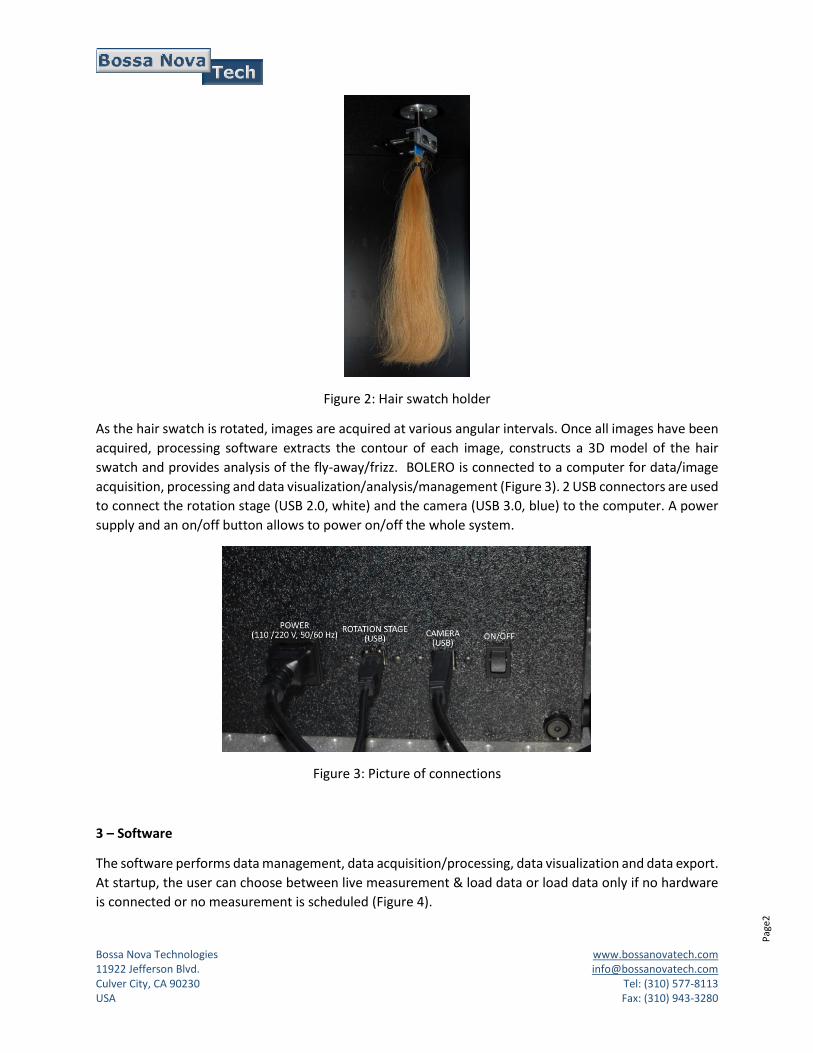
Figure 2: Hair swatch holder
As the hair swatch is rotated, images are acquired at various angular intervals. Once all images have been
acquired, processing software extracts the contour of each image, constructs a 3D model of the hair
swatch and provides analysis of the fly-away/frizz. BOLERO is connected to a computer for data/image
acquisition, processing and data visualization/analysis/management (Figure 3). 2 USB connectors are used
to connect the rotation stage (USB 2.0, white) and the camera (USB 3.0, blue) to the computer. A power
supply and an on/off button allows to power on/off the whole system.
Figure 3: Picture of connections
3 – Software
The software performs data management, data acquisition/processing, data visualization and data export.
At startup, the user can choose between live measurement & load data or load data only if no hardware
is connected or no measurement is scheduled (Figure 4).

Bossa Nova Technologies www.bossanovatech.com 11922 Jefferson Blvd. [email protected] Culver City, CA 90230 Tel: (310) 577-8113 USA Fax: (310) 943-3280
Pag
e3
Figure 4: Start-up window
Choosing live acquisition leads to an automated test procedure that insures all hardware components
(camera, rotation and LED panel) are working properly to the factory specifications (Figure 5). In case of a
problem with the hardware, various error message will appear. If the system is not turned on, the user
will only be able to upload, visualize and analyze former data.
Figure 5: Hardware self-test and calibration
Figure 6 shows the DATA MANAGEMENT window (Live measurement is on as Add new measurement
button is present).
Bossa Nova Technologies www.bossanovatech.com 11922 Jefferson Blvd. [email protected] Culver City, CA 90230 Tel: (310) 577-8113 USA Fax: (310) 943-3280
Pag
e4
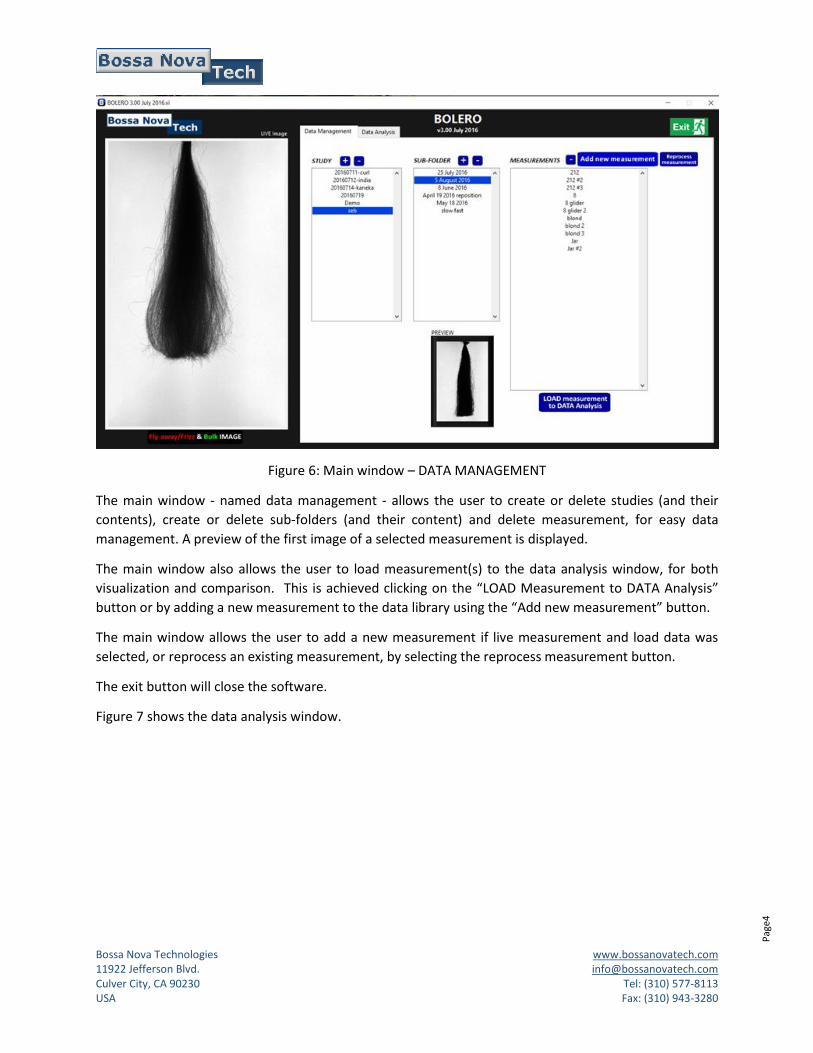
Figure 6: Main window – DATA MANAGEMENT
The main window - named data management - allows the user to create or delete studies (and their
contents), create or delete sub-folders (and their content) and delete measurement, for easy data
management. A preview of the first image of a selected measurement is displayed.
The main window also allows the user to load measurement(s) to the data analysis window, for both
visualization and comparison. This is achieved clicking on the “LOAD Measurement to DATA Analysis”
button or by adding a new measurement to the data library using the “Add new measurement” button.
The main window allows the user to add a new measurement if live measurement and load data was
selected, or reprocess an existing measurement, by selecting the reprocess measurement button.
The exit button will close the software.
Figure 7 shows the data analysis window.

Bossa Nova Technologies www.bossanovatech.com 11922 Jefferson Blvd. [email protected] Culver City, CA 90230 Tel: (310) 577-8113 USA Fax: (310) 943-3280
Pag
e5
Figure 7: Data analysis window
On the left of the window, the Loaded or Uploaded MEASUREMENTS box lists all loaded data. The easy to
use, large blue arrow shifts measurements from the Loaded MEASUREMENTS list to the MEASUREMENTS
Displayed list, for up to 9 measurements. Data from MEASUREMENTS Displayed will appear in both visual
and list format.
Figure 8: Displayed measurements

Bossa Nova Technologies www.bossanovatech.com 11922 Jefferson Blvd. [email protected] Culver City, CA 90230 Tel: (310) 577-8113 USA Fax: (310) 943-3280
Pag
e6
The RESULTS TABLE lists the volume (in mm3), surface (in mm2) and frizz/fly-away percentage (%) for each
measurement (Figure 9).
Figure 9: Results table
It is possible to select a measurement as a reference by clicking the “SELECT measurement as REFERENCE”
button, the user can then update the RESULTS table in order to easily compare different measurements
relative to the selected reference (Figure 10).
Figure 10: Results table with REFERENCE measurement (Blond 3 is the reference)
The user can display the images by using the 7 tabs at the top of the visual rendering window (Figure 11).
Figure 11: Images
By selecting the image viewed (raw or FAF), the user can change the visualized images (Figure 12).
Bossa Nova Technologies www.bossanovatech.com 11922 Jefferson Blvd. [email protected] Culver City, CA 90230 Tel: (310) 577-8113 USA Fax: (310) 943-3280
Pag
e7
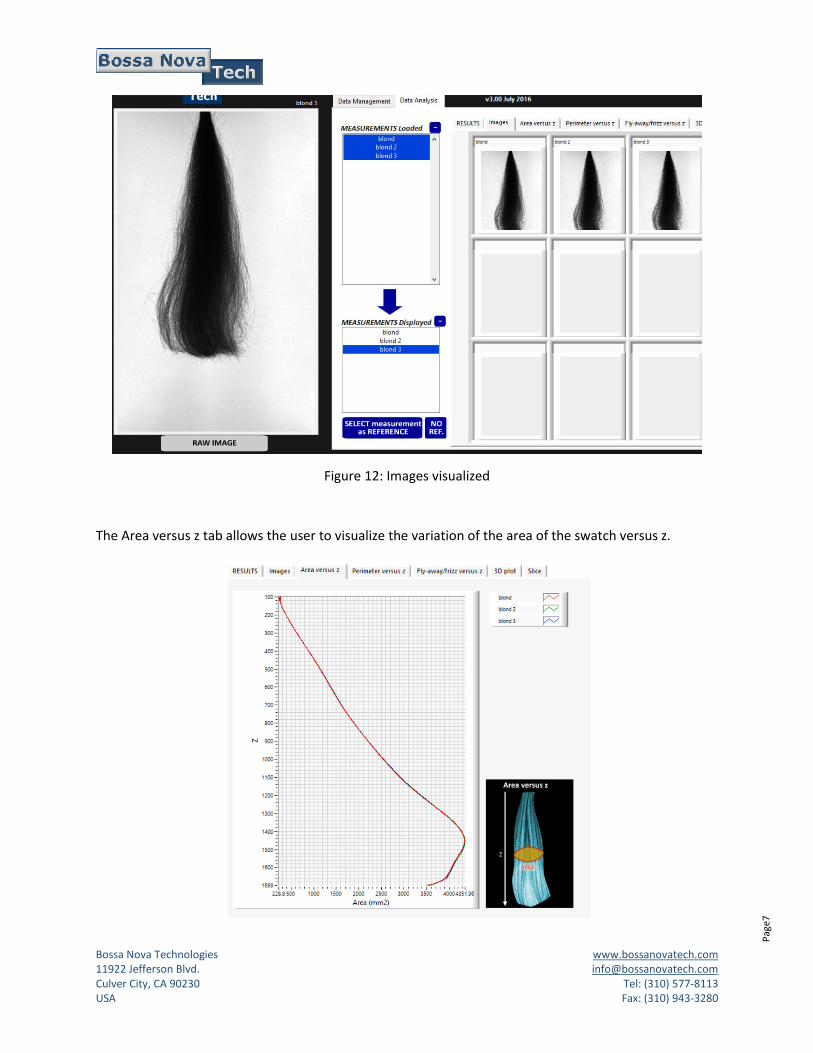
Figure 12: Images visualized
The Area versus z tab allows the user to visualize the variation of the area of the swatch versus z.
Bossa Nova Technologies www.bossanovatech.com 11922 Jefferson Blvd. [email protected] Culver City, CA 90230 Tel: (310) 577-8113 USA Fax: (310) 943-3280
Pag
e8
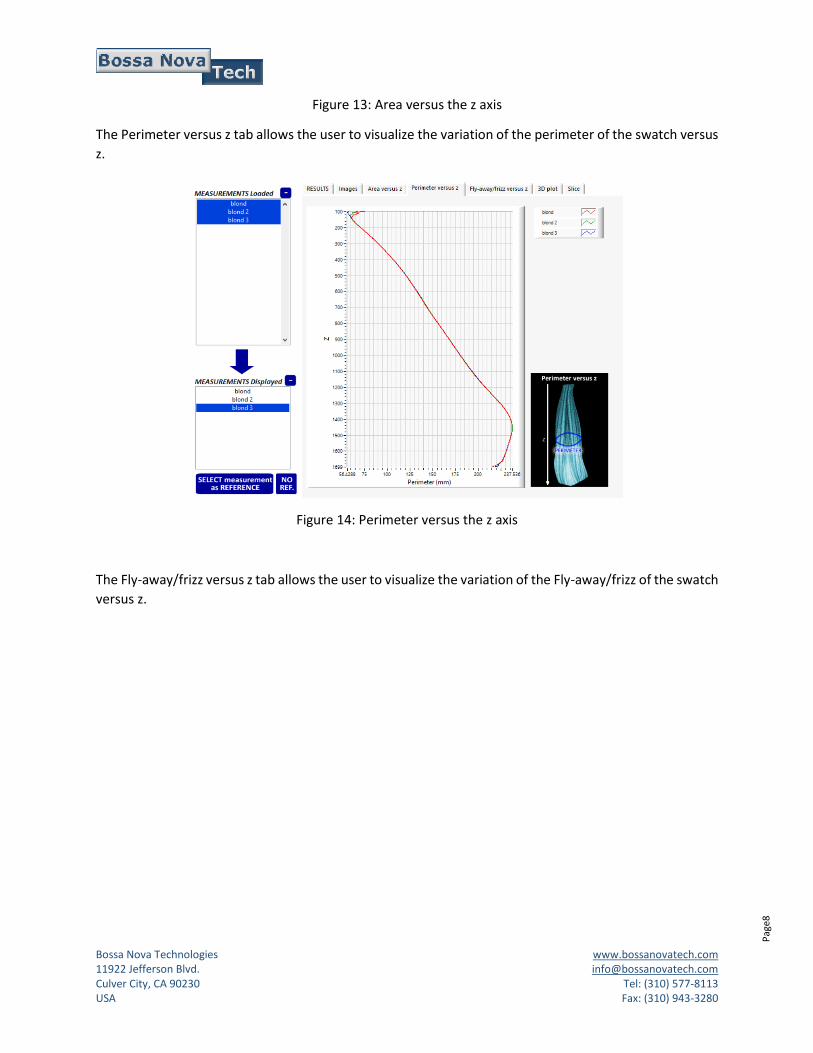
Figure 13: Area versus the z axis
The Perimeter versus z tab allows the user to visualize the variation of the perimeter of the swatch versus
z.
Figure 14: Perimeter versus the z axis
The Fly-away/frizz versus z tab allows the user to visualize the variation of the Fly-away/frizz of the swatch
versus z.
Bossa Nova Technologies www.bossanovatech.com 11922 Jefferson Blvd. [email protected] Culver City, CA 90230 Tel: (310) 577-8113 USA Fax: (310) 943-3280
Pag
e9
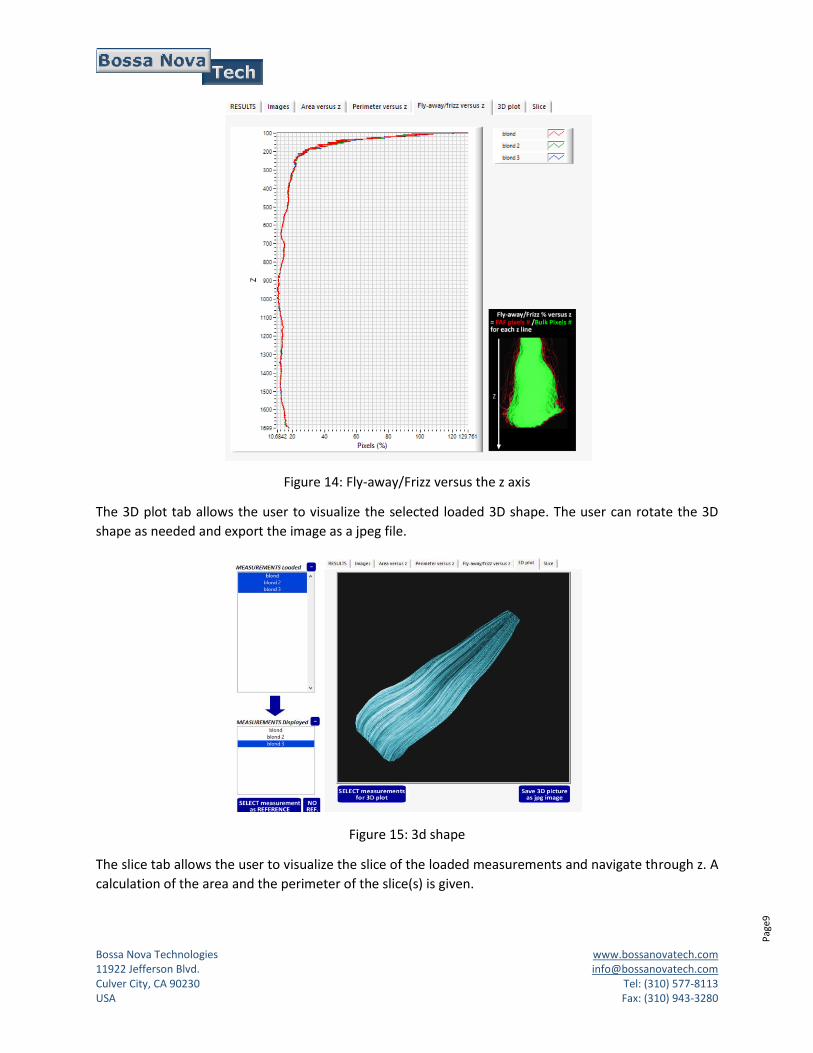
Figure 14: Fly-away/Frizz versus the z axis
The 3D plot tab allows the user to visualize the selected loaded 3D shape. The user can rotate the 3D
shape as needed and export the image as a jpeg file.
Figure 15: 3d shape
The slice tab allows the user to visualize the slice of the loaded measurements and navigate through z. A
calculation of the area and the perimeter of the slice(s) is given.

Bossa Nova Technologies www.bossanovatech.com 11922 Jefferson Blvd. [email protected] Culver City, CA 90230 Tel: (310) 577-8113 USA Fax: (310) 943-3280
Pag
e10
Figure 16: Slice
Displayed data can be exported using the “EXPORT Results” button. A pop-up windows appears, asking
the user to create a new folder where various images and data will be saved.
v
Figure 17: Exporting results
Bossa Nova Technologies www.bossanovatech.com 11922 Jefferson Blvd. [email protected] Culver City, CA 90230 Tel: (310) 577-8113 USA Fax: (310) 943-3280
Pag
e11
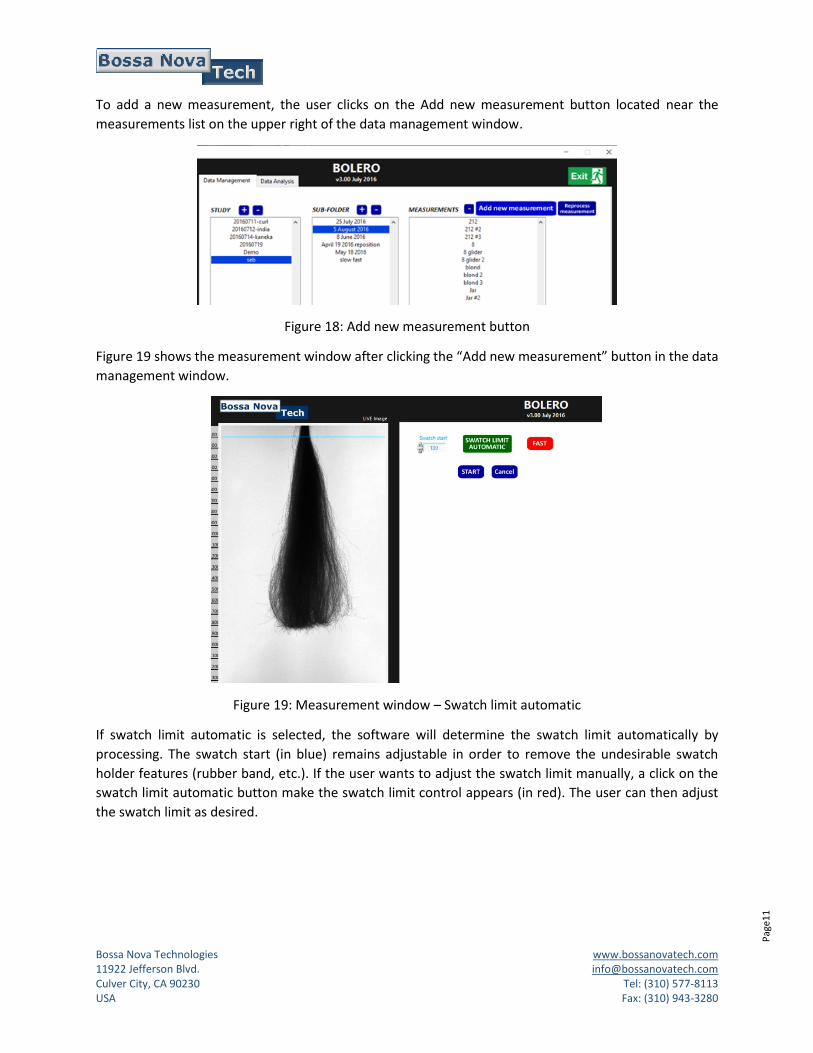
To add a new measurement, the user clicks on the Add new measurement button located near the
measurements list on the upper right of the data management window.
Figure 18: Add new measurement button
Figure 19 shows the measurement window after clicking the “Add new measurement” button in the data
management window.
Figure 19: Measurement window – Swatch limit automatic
If swatch limit automatic is selected, the software will determine the swatch limit automatically by
processing. The swatch start (in blue) remains adjustable in order to remove the undesirable swatch
holder features (rubber band, etc.). If the user wants to adjust the swatch limit manually, a click on the
swatch limit automatic button make the swatch limit control appears (in red). The user can then adjust
the swatch limit as desired.
Bossa Nova Technologies www.bossanovatech.com 11922 Jefferson Blvd. [email protected] Culver City, CA 90230 Tel: (310) 577-8113 USA Fax: (310) 943-3280
Pag
e12
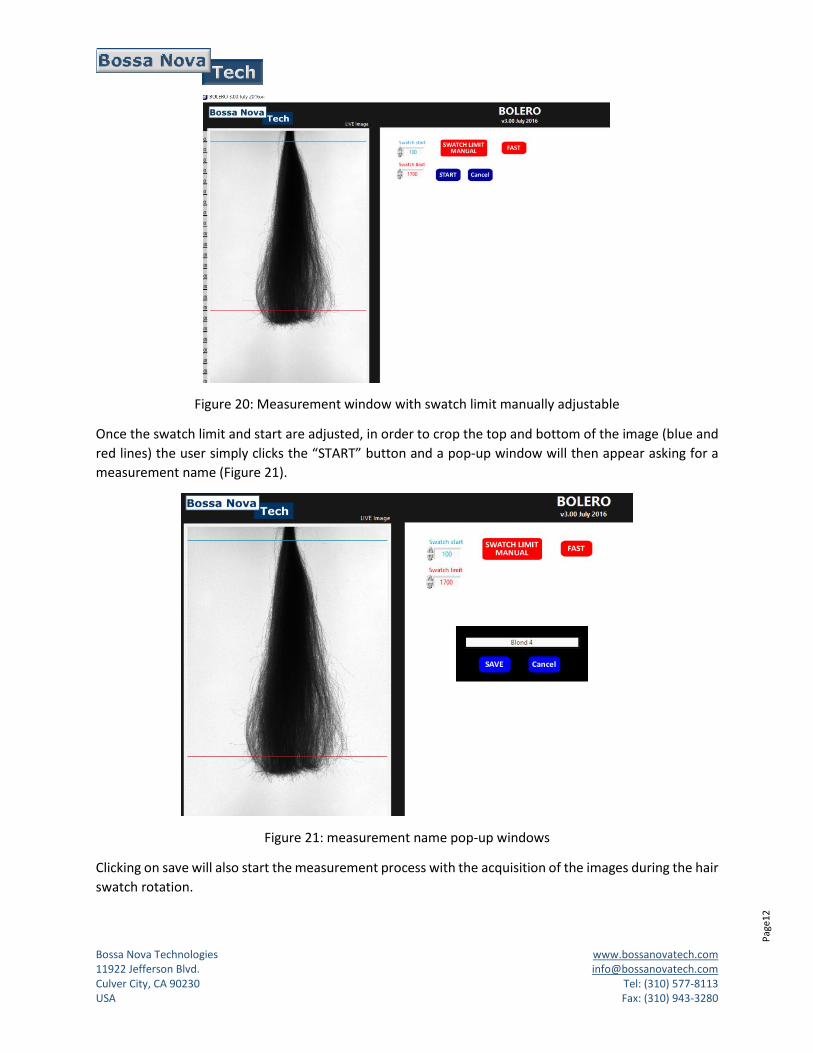
Figure 20: Measurement window with swatch limit manually adjustable
Once the swatch limit and start are adjusted, in order to crop the top and bottom of the image (blue and
red lines) the user simply clicks the “START” button and a pop-up window will then appear asking for a
measurement name (Figure 21).
Figure 21: measurement name pop-up windows
Clicking on save will also start the measurement process with the acquisition of the images during the hair
swatch rotation.
Bossa Nova Technologies www.bossanovatech.com 11922 Jefferson Blvd. [email protected] Culver City, CA 90230 Tel: (310) 577-8113 USA Fax: (310) 943-3280
Pag
e13
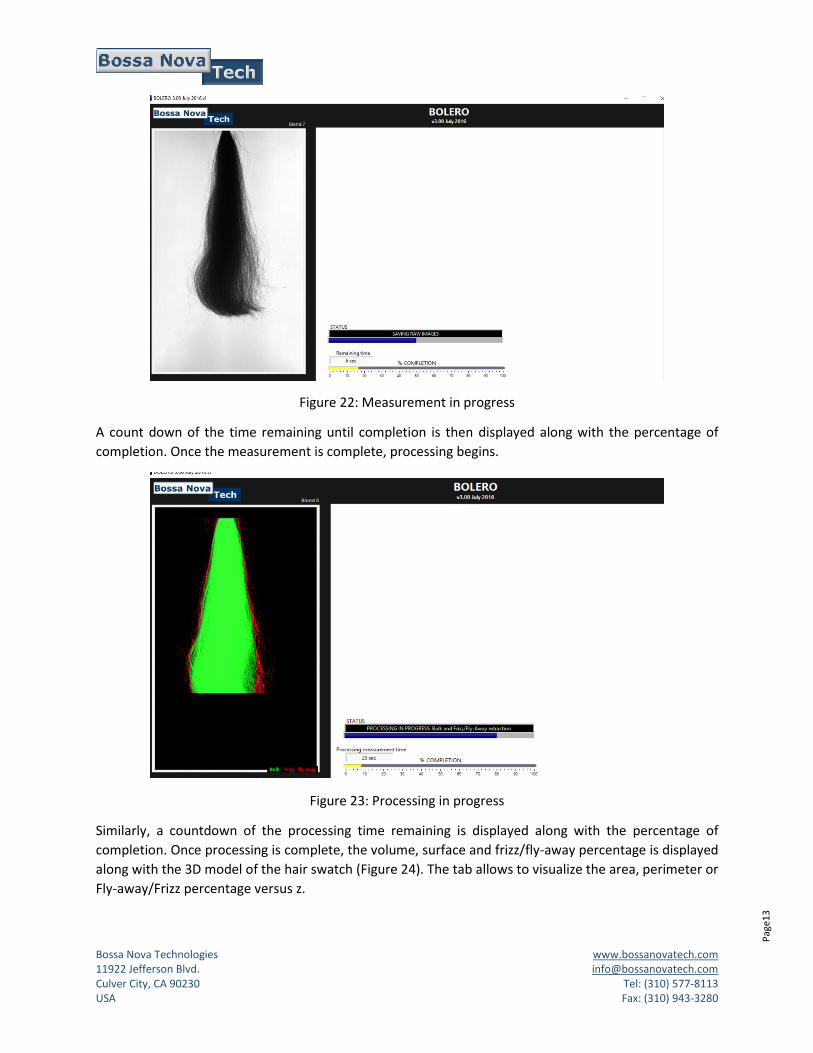
Figure 22: Measurement in progress
A count down of the time remaining until completion is then displayed along with the percentage of
completion. Once the measurement is complete, processing begins.
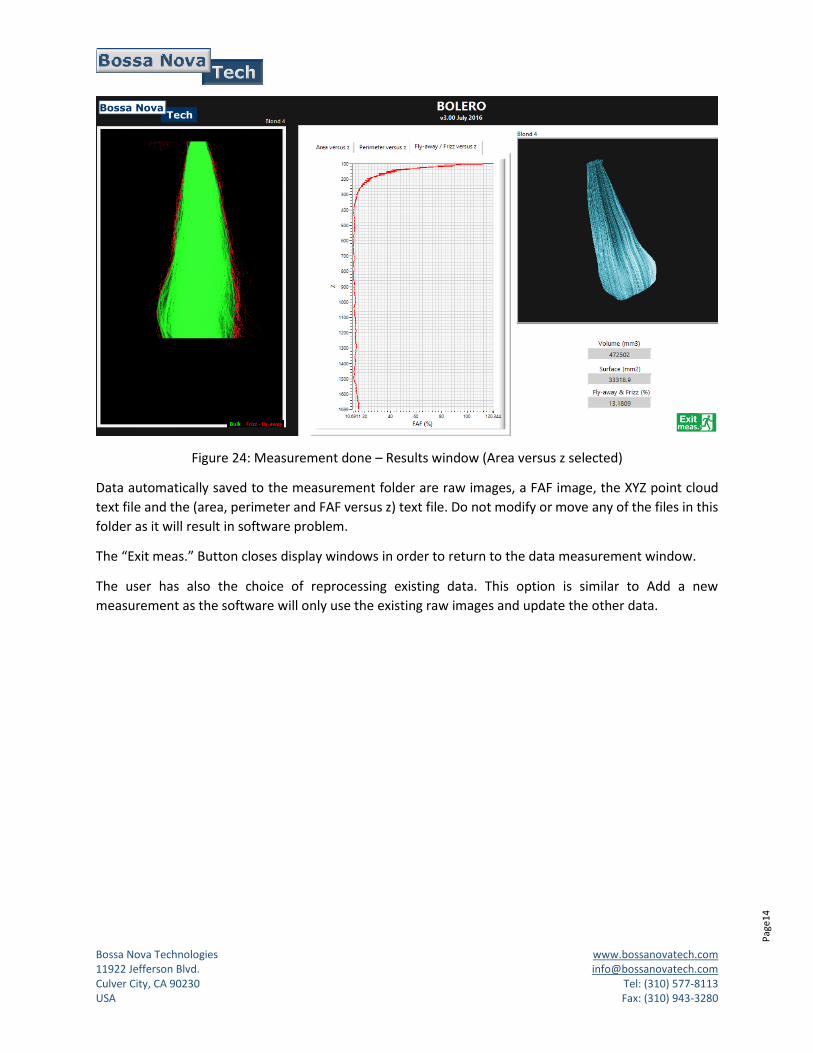
Figure 23: Processing in progress
Similarly, a countdown of the processing time remaining is displayed along with the percentage of
completion. Once processing is complete, the volume, surface and frizz/fly-away percentage is displayed
along with the 3D model of the hair swatch (Figure 24). The tab allows to visualize the area, perimeter or
Fly-away/Frizz percentage versus z.
Bossa Nova Technologies www.bossanovatech.com 11922 Jefferson Blvd. [email protected] Culver City, CA 90230 Tel: (310) 577-8113 USA Fax: (310) 943-3280
Pag
e14
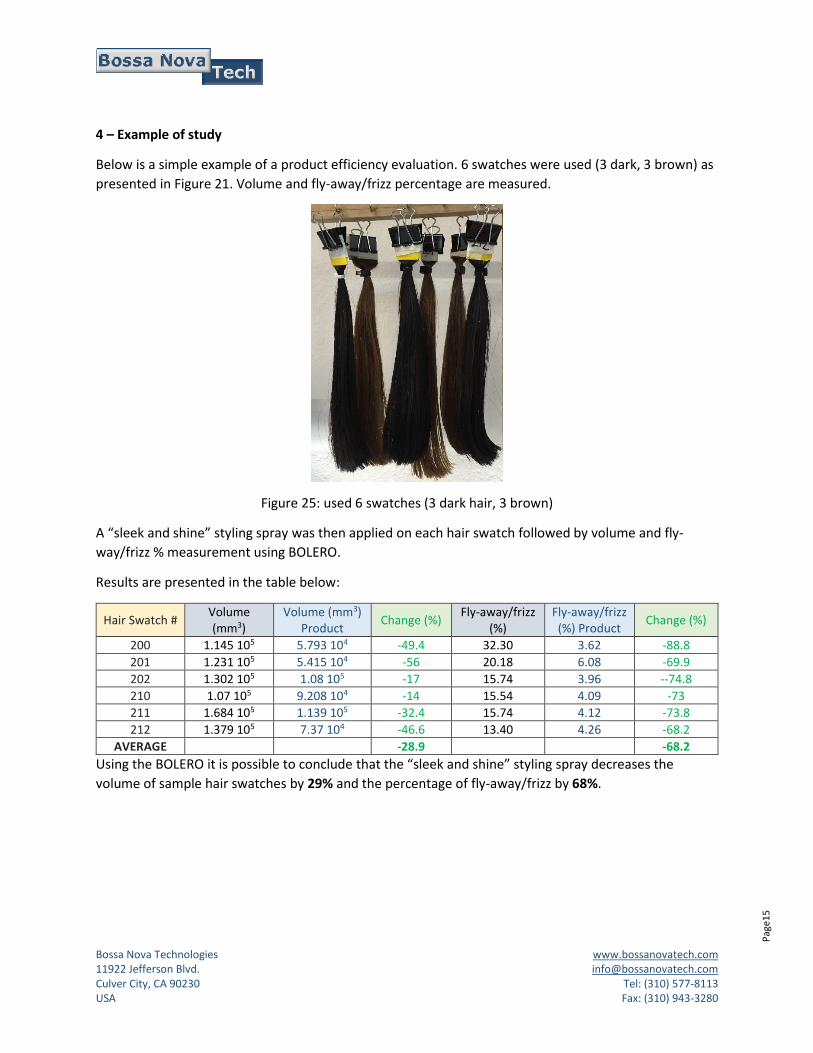
Figure 24: Measurement done – Results window (Area versus z selected)
Data automatically saved to the measurement folder are raw images, a FAF image, the XYZ point cloud
text file and the (area, perimeter and FAF versus z) text file. Do not modify or move any of the files in this
folder as it will result in software problem.
The “Exit meas.” Button closes display windows in order to return to the data measurement window.
The user has also the choice of reprocessing existing data. This option is similar to Add a new
measurement as the software will only use the existing raw images and update the other data.
Bossa Nova Technologies www.bossanovatech.com 11922 Jefferson Blvd. [email protected] Culver City, CA 90230 Tel: (310) 577-8113 USA Fax: (310) 943-3280
Pag
e15
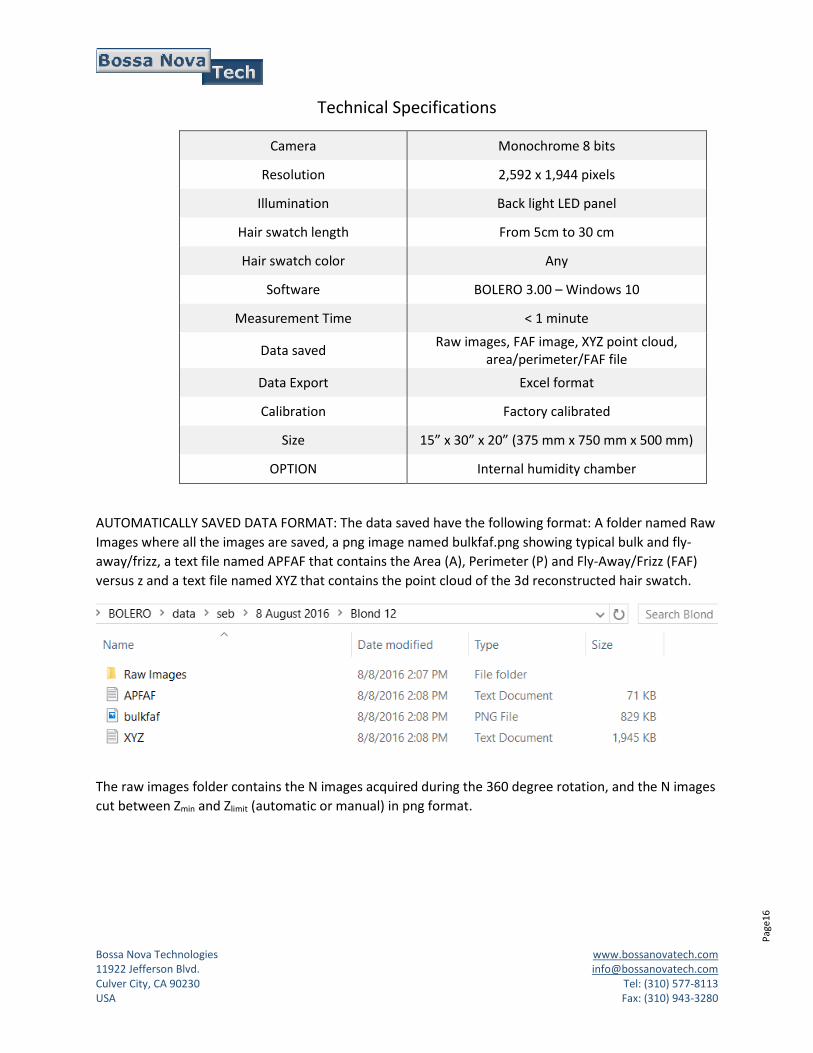
4 – Example of study
Below is a simple example of a product efficiency evaluation. 6 swatches were used (3 dark, 3 brown) as
presented in Figure 21. Volume and fly-away/frizz percentage are measured.
Figure 25: used 6 swatches (3 dark hair, 3 brown)
A “sleek and shine” styling spray was then applied on each hair swatch followed by volume and fly-
way/frizz % measurement using BOLERO.
Results are presented in the table below:
Hair Swatch # Volume (mm3)
Volume (mm3) Product
Change (%) Fly-away/frizz
(%) Fly-away/frizz (%) Product
Change (%)
200 1.145 105 5.793 104 -49.4 32.30 3.62 -88.8
201 1.231 105 5.415 104 -56 20.18 6.08 -69.9
202 1.302 105 1.08 105 -17 15.74 3.96 --74.8
210 1.07 105 9.208 104 -14 15.54 4.09 -73
211 1.684 105 1.139 105 -32.4 15.74 4.12 -73.8
212 1.379 105 7.37 104 -46.6 13.40 4.26 -68.2
AVERAGE -28.9 -68.2
Using the BOLERO it is possible to conclude that the “sleek and shine” styling spray decreases the
volume of sample hair swatches by 29% and the percentage of fly-away/frizz by 68%.
Bossa Nova Technologies www.bossanovatech.com 11922 Jefferson Blvd. [email protected] Culver City, CA 90230 Tel: (310) 577-8113 USA Fax: (310) 943-3280
Pag
e16
Technical Specifications
Camera Monochrome 8 bits
Resolution 2,592 x 1,944 pixels
Illumination Back light LED panel
Hair swatch length From 5cm to 30 cm
Hair swatch color Any
Software BOLERO 3.00 – Windows 10
Measurement Time < 1 minute
Data saved Raw images, FAF image, XYZ point cloud,
area/perimeter/FAF file
Data Export Excel format
Calibration Factory calibrated
Size 15” x 30” x 20” (375 mm x 750 mm x 500 mm)
OPTION Internal humidity chamber
AUTOMATICALLY SAVED DATA FORMAT: The data saved have the following format: A folder named Raw
Images where all the images are saved, a png image named bulkfaf.png showing typical bulk and fly-
away/frizz, a text file named APFAF that contains the Area (A), Perimeter (P) and Fly-Away/Frizz (FAF)
versus z and a text file named XYZ that contains the point cloud of the 3d reconstructed hair swatch.
The raw images folder contains the N images acquired during the 360 degree rotation, and the N images
cut between Zmin and Zlimit (automatic or manual) in png format.

Bossa Nova Technologies www.bossanovatech.com 11922 Jefferson Blvd. [email protected] Culver City, CA 90230 Tel: (310) 577-8113 USA Fax: (310) 943-3280
Pag
e17
We do not recommend to proceed to any change in these folders and files as it can lead to error in Bolero
software.
EXPORT FORMAT: The exported measurement folder content is shown below. 2 folders respectively
contain images and point clouds, and an Excel file presents the different results and graphs.
The Pictures folder contains one raw image and one fly-away/frizz image for each measurement exported.
The Point Clouds folder contains the point cloud in text file format (.txt) of each measurement exported.

Bossa Nova Technologies www.bossanovatech.com 11922 Jefferson Blvd. [email protected] Culver City, CA 90230 Tel: (310) 577-8113 USA Fax: (310) 943-3280
Pag
e18
Finally, an Excel file is generated. It contains the table comparing the volume, area and fly-away/Frizz
(%) of each exported element.
It also contains the various data and graph (Area, Perimeter and Fly-away/Frizz (%) versus z.
For best results, we recommend to use “round” swatches and no “flat” swatches as shown on the picture
below.
Bossa Nova Technologies www.bossanovatech.com 11922 Jefferson Blvd. [email protected] Culver City, CA 90230 Tel: (310) 577-8113 USA Fax: (310) 943-3280
Pag
e19
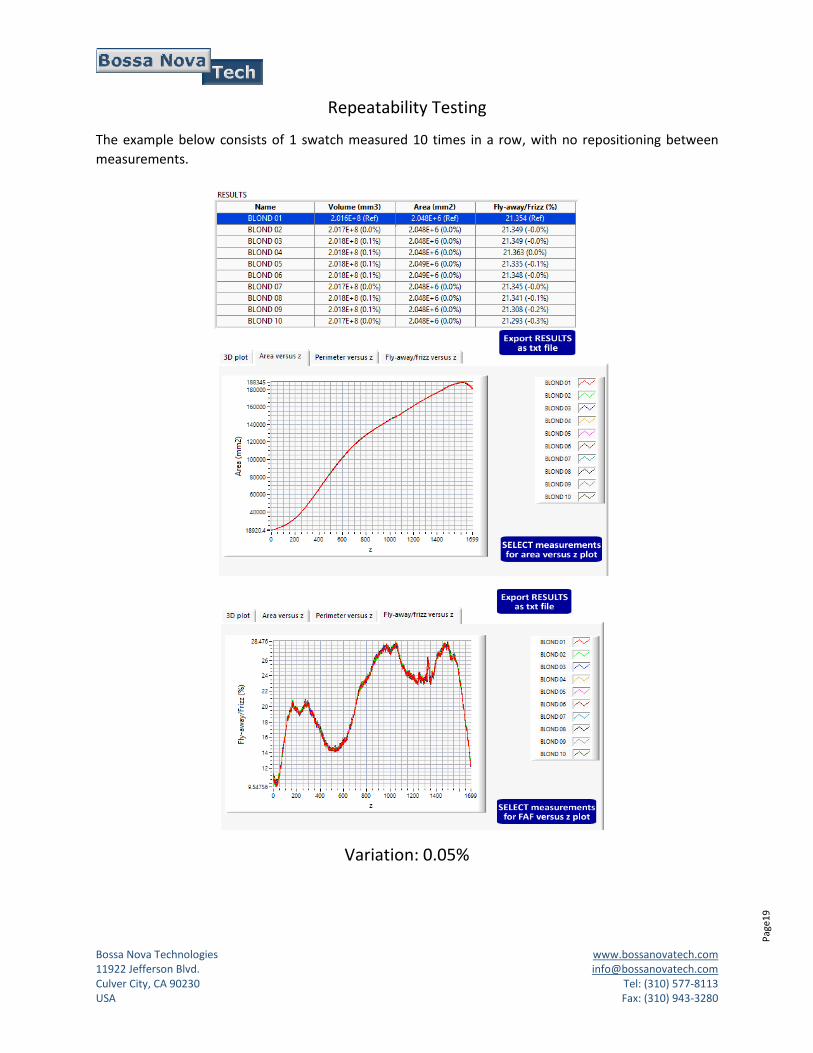
Repeatability Testing
The example below consists of 1 swatch measured 10 times in a row, with no repositioning between
measurements.
Variation: 0.05%
Bossa Nova Technologies www.bossanovatech.com 11922 Jefferson Blvd. [email protected] Culver City, CA 90230 Tel: (310) 577-8113 USA Fax: (310) 943-3280
Pag
e20
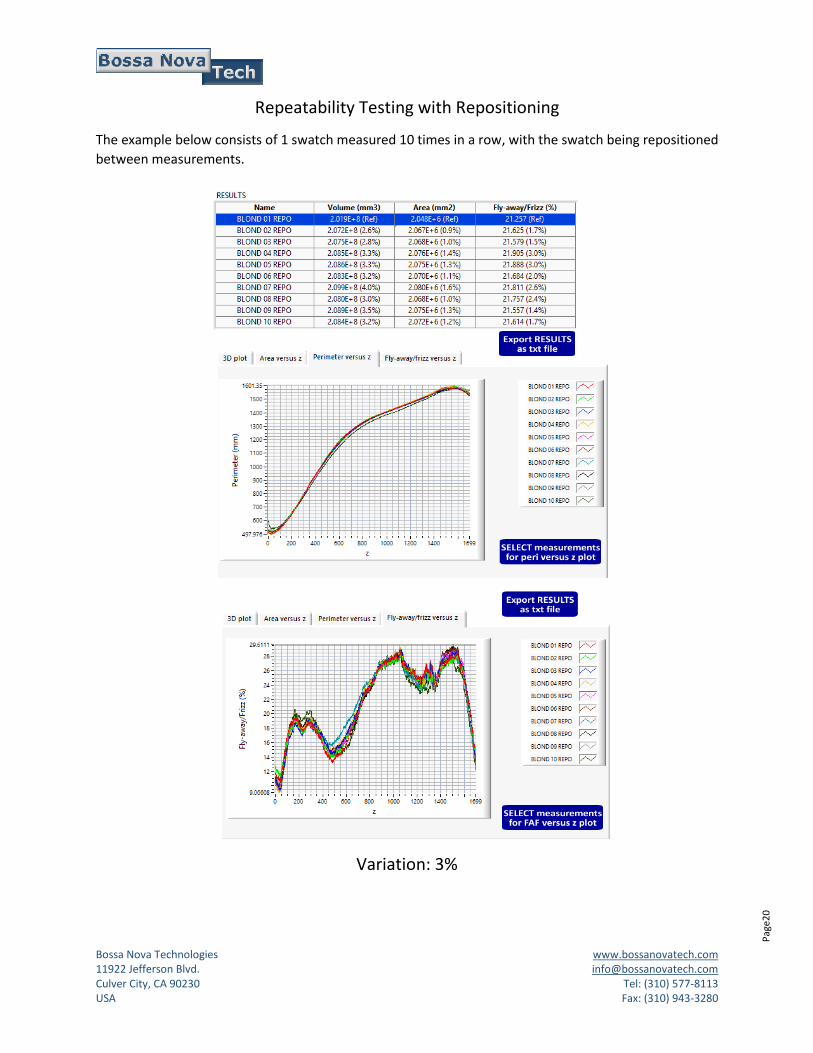
Repeatability Testing with Repositioning
The example below consists of 1 swatch measured 10 times in a row, with the swatch being repositioned
between measurements.
Variation: 3%
Bossa Nova Technologies www.bossanovatech.com 11922 Jefferson Blvd. [email protected] Culver City, CA 90230 Tel: (310) 577-8113 USA Fax: (310) 943-3280
Pag
e21
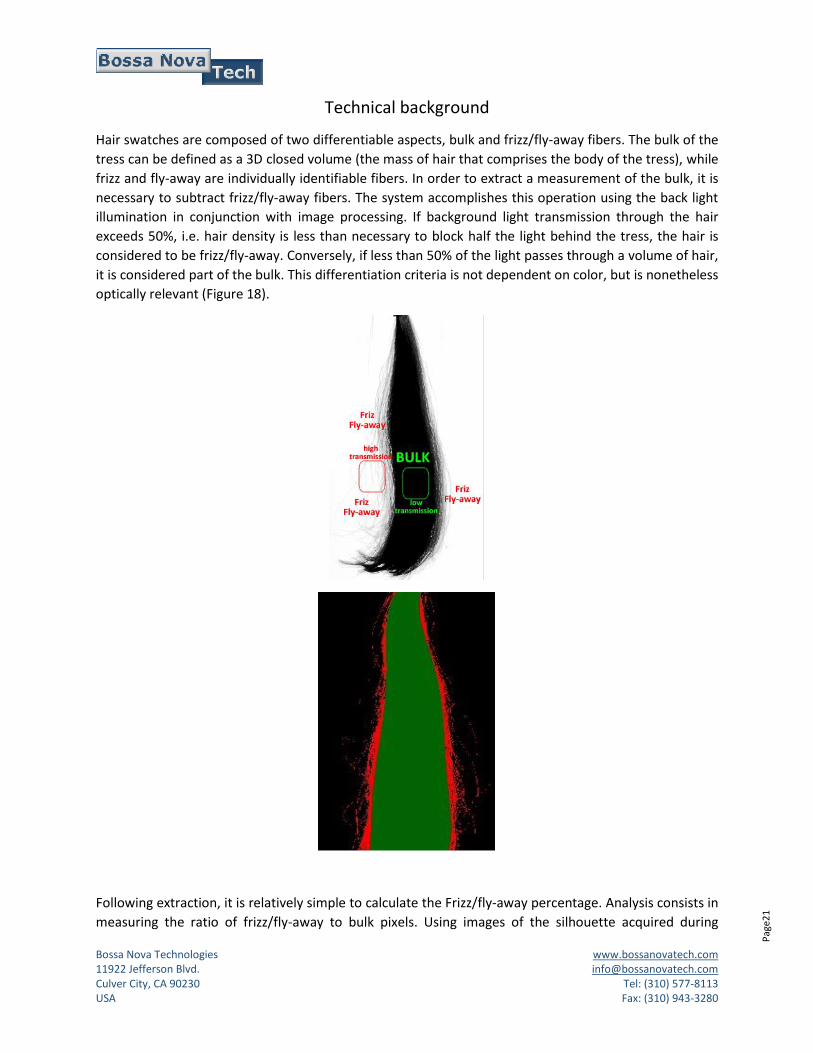
Technical background
Hair swatches are composed of two differentiable aspects, bulk and frizz/fly-away fibers. The bulk of the
tress can be defined as a 3D closed volume (the mass of hair that comprises the body of the tress), while
frizz and fly-away are individually identifiable fibers. In order to extract a measurement of the bulk, it is
necessary to subtract frizz/fly-away fibers. The system accomplishes this operation using the back light
illumination in conjunction with image processing. If background light transmission through the hair
exceeds 50%, i.e. hair density is less than necessary to block half the light behind the tress, the hair is
considered to be frizz/fly-away. Conversely, if less than 50% of the light passes through a volume of hair,
it is considered part of the bulk. This differentiation criteria is not dependent on color, but is nonetheless
optically relevant (Figure 18).
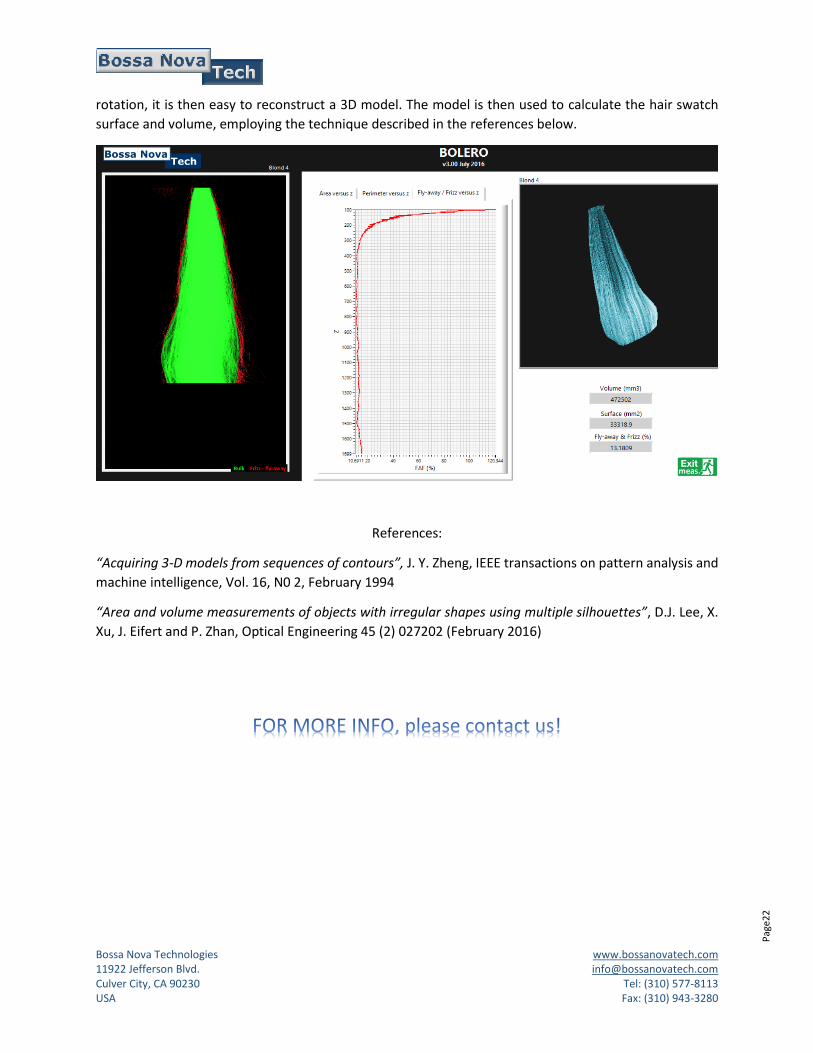
Following extraction, it is relatively simple to calculate the Frizz/fly-away percentage. Analysis consists in
measuring the ratio of frizz/fly-away to bulk pixels. Using images of the silhouette acquired during
Bossa Nova Technologies www.bossanovatech.com 11922 Jefferson Blvd. [email protected] Culver City, CA 90230 Tel: (310) 577-8113 USA Fax: (310) 943-3280
Pag
e22
rotation, it is then easy to reconstruct a 3D model. The model is then used to calculate the hair swatch
surface and volume, employing the technique described in the references below.
References:
“Acquiring 3-D models from sequences of contours”, J. Y. Zheng, IEEE transactions on pattern analysis and
machine intelligence, Vol. 16, N0 2, February 1994
“Area and volume measurements of objects with irregular shapes using multiple silhouettes”, D.J. Lee, X.
Xu, J. Eifert and P. Zhan, Optical Engineering 45 (2) 027202 (February 2016)