Embed Size (px)
Citation preview
20 1 January 1966 Arterial Occlusion in Lower Leg-Watt MEDICALJURNAI
Occlusion of the posterior tibial artery is the commonestLsion and isolated anterior tibial and combined anterior andposterior tibial occlusions are also common. The peronealartery is rarely occluded as the sole lower-leg lesion.The incidence of lower-leg occlusion is high (45.6%) and
rises steeply with increasing age.
I wish to express my grateful thanks to my colleagues, Mr. W.Reid and Mr. T. G. Gray, for permission to include their patientsin this survey, and to Dr. D. Raeside for the skill that made it
possible to obtain the excellent arteriograms on which this articleis based.
REFERENCESDible, J. H. (1956). In Peripheral Vascular Disorders, edited by P.
Martin, R. B. Lynn, J. H. Dible, and I. Aird. Livingstone, Edin-burgh and London.
Henry, A. K. (1945). Extensile Exposure Applied to Limb Surgery.Livingstone, Edinburgh.
Lindbom, A. (1950). Acta radiol. (Stockh.), suppL No. 80.Linton, R. R., and Darling, R. C. (1962). Surgery, 51, 62.Taylor, G. W. (1962). Ann. roy. Coll. Surg. Engl., 31, 168.- and Calo, A. R. (1962). Brit. med. 7., 1, 507.
Watt, J. Kennedy (1965). Ibid., 2, 1455.
Haemoglobin Estimation: a Comparison of Different Techniques
P. C. ELWOOD,* M.D., D.P.H., D.C.H.; A. JACOBS,t M.D., M.C.PATH.
Brt. med. J., 1966, 1, 20-24
This trial was undertaken to try to assess the relative usefulnessof different types of apparatus recommended for haemoglobinestimation. With the exception of the E.E.L. colorimeter allthe equipment used was specifically designed for haemo-globinometry. The errors of four observers of varied experiencewere examined by means of seven different techniques, and theconsistency of their errors was assessed at different haemoglobinlevels. In addition, 'the general convenience and acceptabilityof each method was noted.
Recent statements (Brit. med. 7., 1965), made with nosupporting evidence, have condemned the use of whole-bloodmethods of haemoglobinometry and instruments employingvisual matching. The present trial shows that such generalstatements are not fully justified and that a method in whichwhole blood is used may be fully adequate for some purposesand compare well with a method using a photoelectric colori-meter. The Tallqvist method was included in this investiga-tion only because it is known to be still used by some doctors.The results it gave were too erratic for analysis.
Types of Apparatus Used in the Trial
E.E.L. Haemoglobin Meter (made and distributed by EvansElectroselenium Ltd.).-Diluted blood in a matched calorimetertube is place in the instrument. Transmitted green light froma mains-lit bulb is measured photoelectrically. The haemoglobinconcentration is indicated by the deflection of a galvanometeras g./100 ml. of blood or as percentage haemoglobin (basedon 100%=14.6 g. Hb). Oxyhaemoglobin or cyanmethaemo-globin can be estimated. For either estimation two standardsare required-one high (18 g./100 ml.) and one low (3 g./100 ml.)-and, while these can be obtained ready for use withthe cyanmethaemoglobin method, they have to be freshlyprepared each day for the oxyhaemoglobin method. Forpreparation of the oxyhaemoglobin standards lysed whole-bloodstandards are available with a table giving the required dilutions(stated to the nearest 0.05 ml.). The instrument is slow tostabilize when switched on (15 minutes is recommended) butappears to be very stable thereafter. Standardization is tediousfor the oxyhaemoglobin method, and during the preparationof the standards considerable errors may occur. The instru-ment is very convenient to use, particularly as it is direct-
reading. It is not readily portable, and diluting fluid, pipettes,and standards are required for its use.
E.E.L. Colorimeter (made and distributed by Evans Electro-selenium Ltd.).-Diluted blood is placed in a matched colori-meter tube. Transmitted green light from a mains-lit bulb ismeasured photoelectrically and read on a galvanometer inarbitrary units. The zero is set on a tube filled with diluent,and any haemoglobin derivative (oxyhaemoglobin, cyanmeth-aemoglobin, etc.) can be estimated, provided a calibration curveis prepared with serial dilution of a standard blood of knownhaemoglobin level. The initial calibration is tedious, but other-wise the instrument is easy to use. It requires very frequentreadjustments of the zero, but this is very simply done. It alsorequires regular checking of the calibration curve with a bloodof known haemoglobin level. Occasional recalibration may benecessary. It is not easily portable, and diluting fluid andpipettes are required for its use.
Keeler Haemoscope (made and distributed by C. DavisKeeler Ltd.).-This instrument is a development of the M.R.C.grey-wedge photometer and it was tested in prototype form.A diluted sample of blood is placed in a square cell. Theintensity of transmitted green light from a battery-lit bulb isviewed through an eyepiece and compared on a split screenwith that of a variable standard. Haemoglobin levels are givenin g./100 ml. of blood. There are separate scales for oxyhaemo-globin and cyanmethaemoglobin. A neutral glass standard issupplied with the instrument, and any difference between itsnominal and estimated value can be used to correct subsequentreadings. This instrument is quick and simple to use, butmatching of the sample and standard is not easy. The useof the neutral glass standard to correct readings seems to beof doubtful value. It is robustly made and well finished, andis easily portable, but diluting fluid and pipettes are required.
Zeiss Himometer (this instrument was made by Zeiss butis no longer available).-Blood is diluted with O.1N hydro-chloric acid in a special mixing pipette and placed in a squarecolorimeter tube. Five minutes after mixing the colour densityof the sample in reflected daylight is viewed through an eye-piece and matched with that of a variable standard seen ona split screen. The colour intensity of the standard is varied,and when matched with the sample indicates haemoglobinconcentration in g./100 ml. of blood. This instrument is quiteconvenient to use; but it is slow, and matching of the sampleand standard is difficult. No method of standardization issupplied. It is easily portable, but diluting fluid is required.* M.R.C. Epidemiological Research Unit, Cardiff.
t Department of Pathology, Welsh National School of Medicine, Cardiff.
Dare Haemoglobinometer (made and distributed by Hawksley& Sons Ltd.).-A small glass chamber is filled by capillaryattraction with a drop of whole blood. The colour densityof the blood, seen in the light of a battery-lit bulb, is matchedwith that of a variable standard viewed through an eyepiece.Haemoglobin concentration is given as g./100 ml. of blood.This instrument is very quick and convenient in use, and iseasily portable. Matching the sample with the standard is noteasy. No method of standardization is supplied.
A. 0. Spencer Haemoglobin Meter (made by the AmericanOptical Co. and supplied by A. R. Horwell Ltd.).-A dropof whole blood is placed on one-half of a glass chamber andagitated with a small stick coated with saponin. The chamberis completed by a cover-glass held firmly by a clip and insertedinto a slot in the instrument. Transmitted green light froma battery-lit bulb is compared with a variable standard on asplit screen. Haemoglobin level is read as g./100 ml. of blood.This instrument is very quick and convenient in use, andmatching of the sample and standard is relatively easy. Nomethod of standardization is supplied. It is easily portable.Hawksley Haemoglobin Scale (Tallqvist) (supplied by
Hawksley & Sons Ltd.).-A drop of unmodified whole bloodis placed on a strip of blotting-paper, and the colour of thedrop when dry is compared with a range of standards graduatedin % Hb in intervals of 10%. This method is very quickand is easy to use, but matching of the sample and standardsis extremely difficult. A pocket-size book contains enoughpaper for at least 150 tests.
BRITISHMEDICAL JOURNAL 21
During the first series of observations the time taken byeach observer to make each estimation was measured. Oncompletion of the trial each observer was asked to rank themethods in order of preference, taking into account generalconvenience and acceptability, but without regard to accuracy.In this assessment the standardization of the instruments usedin certain methods was ignored.
Results
In the investigation estimations were made by four observerson each of the four blood samples by each of the seven methods.Table I shows the means of these estimations. The Himometergave results which were on average about 1 g./100 ml. higherthan any other method, though some of this difference isundoubtedly due to the difference between the total haemo-globin (estimated as acid haematin by this method) andoxyhaemoglobin estimated by the other six methods (Ammund-sen, 1941). The Haemoscope gave results which were onaverage about 0.7 g./100 ml. lower than any other method, andthe use of the correction factors in this method increased thisdifference. (This is stated by the manufacturers to have beendue to an incorrectly marked standard.) The means of theestimates obtained by the Tallqvist method differed so greatlyfrom all other methods, and inspection of the original resultsshowed that the individual observers were so inconsistent intheir estimations, that these data were omitted from the furtheranalysis.
Method
Four observers-two with considerable recent experience inhaemoglobinometry (01 and 02), one with some experienceseveral years prior to the trial but no recent experience (03),and one with no previous experience (04)-were asked tobecome familiar with each of the methods investigated duringthe few days before the trial began.Four 20-ml. samples of heparinized blood with haemoglobin
concentrations between 6 and 14 g./100 ml. of blood wereobtained, and unknown to the observers each sample wasdivided into two. The resulting eight samples were letteredat random. Each observer in turn made one estimation of thehaemoglobin level of each sample by each method, the orderof the samples and methods being random. Five days laterthis complete series of observations was repeated.Haemoglobin concentration was estimated as oxyhaemoglobin
in all instances except the Himometer, in which only acidhaematin can be measured. Estimations were made on eachinstrument as recommended by the makers, and the instructionsgiven were followed as closely as possible. For the Hamometerspecial mixing pipettes are used, and these are rinsed in 0.1 NHC1 between estimations, but were not dried as recommended,as this proved to be very slow and tedious. Colorimeter tubeswere emptied, shaken, and all excess fluid was removed witha clean tissue after each estimation. Two instruments requiredstandardization, and this was done according to the makers'instructions by one of the most experienced observers on eachmorning of the trial. The standards prepared for this were
used to check these two instruments again before use byeach observer. A neutral glass standard is supplied with theHaemoscope to enable a correction factor to be derived. A largenumber of tests with different observers showed that a widevariety of correction factors could be derived by a singleobserver, and these varied from day to day. It was thereforedecided not to use correction factors for this instrument inthe analysis, but to show overall means of all estimations ofeach blood sample, with and without correction, by a factorbased on 10 separate observations of the standard by eachobserver.
TABLE I.-Mean Haemoglobin Levels (as g./100 ml.) of Four Samples olBlood Estimated on the Seven Instruments (Each Based on 16Estimations)
Instrument
E.E.L. Hb meterE.E.L. ColorimeterHaemoscope (1)*..Haemoscope (2)*HAmometert * -DareA. 0. Hb meter ..Tallqvist*
A
13-1513-9812-6512-7215-0113-2912-9010-07
Blood Sample
B
9 5610-179-069-1310-959-719-658-98
IC D
9-80 6-1910-42 6-259-18 5-449-26 5-5111*08 6-769.43 5-769-65 6-367-96 8-67
All
9-6810-209-089-15
10-959.559-648-92
* (1) With correction factors; (2) Without correction factors.t Estimates total haemoglobin.* Assuming that 100% = 14-6 g.
Comparisons of overall means are of limited interest as theyignore inconsistencies. The main sources of variation examinedin this trial are due to the four samples of blood, the sevenmethods, the four observers, and the two series of observations.The consistency of the variation from these four main factorscan be examined by their six first-order and four second-orderinteractions, and as each blood sample was replicated through-out the one third-order interaction can be examined.
After omission of the results obtained by the Tallqvist methodthere are 384 estimations for analysis, 64 by each of the sixmethods. An overall analysis of variance showed that manyof the interactions of the main factors are significant (atP<0.05, the criterion of significance used throughout), inparticular those involving the methods and those involving theobservers. In view of these inconsistencies, separate analysesof variance were done at each level of the main factors ofgreatest interest (instruments and observers) as indicated inwhat follows, and the tests of the significance of differencesbetween means have been based on the appropriate residualvariances in these analyses.
Difference Between Methods
Table II summarizes the analysis of variance of the 64estimations by each method. The basic " errors " of the variousmethods can be estimated by the residual variances, as thesemeasure the variation in each method, which is independent
1 January 1966 Haemoglobin Estimation-Elwood and 7acobs
22 1 January 1966 Haemoglobin Estimation-Elwood and Jacobs
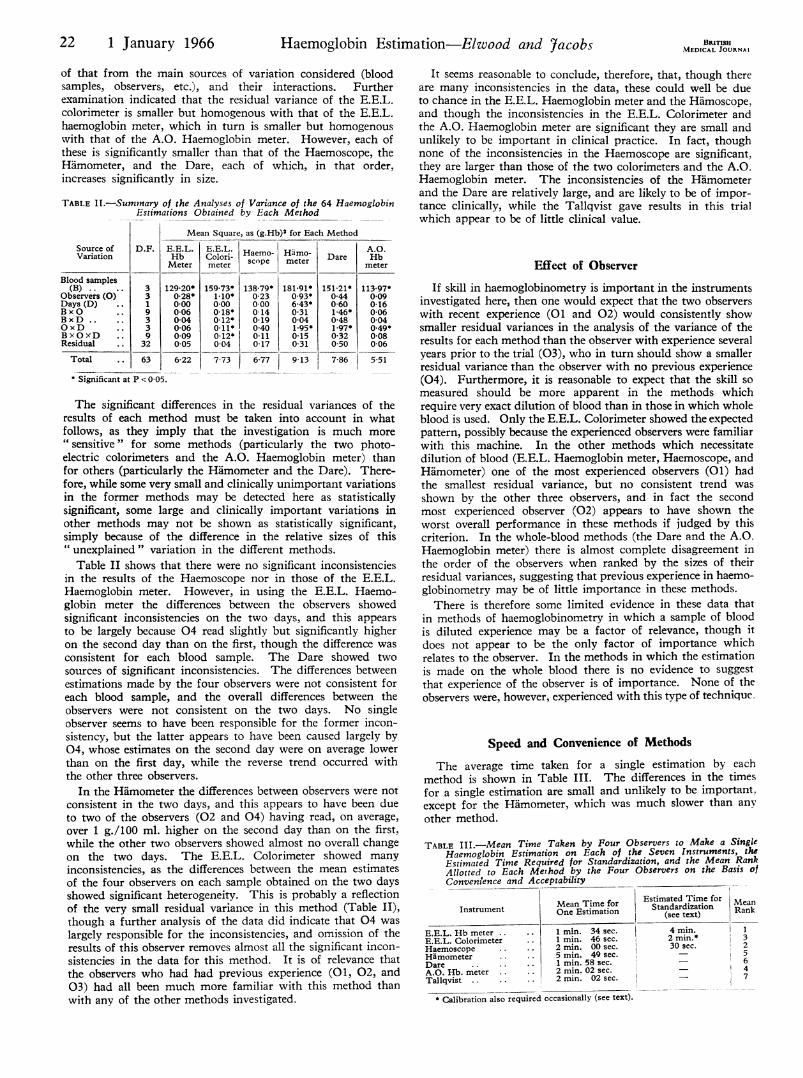
of that from the main sources of variation considered (bloodsamples, observers, etc.), and their interactions. Furtherexamination indicated that the residual variance of the E.E.L.calorimeter is smaller but homogenous with that of the E.E.L.haemoglobin meter, which in turn is smaller but homogenouswith that of the A.0. Haemoglobin meter. However, each ofthese is significantly smaller than that of the Haemoscope, theHimometer, and the Dare, each of which, in that order,increases significantly in size.
TABLE II.-Summary of the Analyses of Variance of the 64 HaemoglobinEstimations Obtained by Each Method
Source ofVariation
Blood samples(B) ..
Observers (0)Days (D)BxOBxD ..
OxDBxOxDResidual
Total
D.F.
3
1933932
63
E.E.HbMet
129-20-20.c
0.1
O-CO-CO-CO-C6,
* Significant at P < 0 05.
Mean Square, as (g.Hb)2 for Each Method
.L. E.EL. Haemo- Hamo- A.0.Coloni- scp ee ae Hb
Ler meter meter
ZO* 159-73* 138-79* 181-91* 151-21* 113-97*Z8* 1.10* 0 23 0.93* 0 44 0 09)0 0 00 0 00 6-43* 060 0-16)6 0-18* 0-14 0-31 1-46* 0 06
4 0 12* 0.19 0 04 0 48 0 04D6 0O11* 0 40 1-95* 1-97* 0 49*D9 0-12* 0-11 0-15 0 32 0 08D5 0-04 0-17 0 31 0 50 0 06
22 7 73 6-77 9 13 7-86 5-51
The significant differences in the residual variances of theresults of each method must be taken into account in whatfollows, as they imply that the investigation is much more
" sensitive" for some methods (particularly the two photo-electric colorimeters and the A.0. Haemoglobin meter) thanfor others (particularly the Himometer and the Dare). There-fore, while some very small and clinically unimportant variationsin the former methods may be detected here as statisticallysignificant, some large and clinically important variations inother methods may not be shown as statistically significant,simply because of the difference in the relative sizes of this"unexplained " variation in the different methods.
Table II shows that there were no significant inconsistenciesin the results of the Haemoscope nor in those of the E.E.L.Haemoglobin meter. However, in using the E.E.L. Haemo-globin meter the differences between the observers showedsignificant inconsistencies on the two days, and this appears
to be largely because 04 read slightly but significantly higheron the second day than on the first, though the difference was
consistent for each blood sample. The Dare showed twosources of significant inconsistencies. The differences betweenestimations made by the four observers were not consistent foreach blood sample, and the overall differences between theobservers were not consistent on the two days. No singleobserver seems to have been responsible for the former incon-sistency, but the latter appears to have been caused largely by04, whose estimates on the second day were on average lowerthan on the first day, while the reverse trend occurred withthe other three observers.
In the Himometer the differences between observers were notconsistent in the two days, and this appears to have been dueto two of the observers (02 and 04) having read, on average,over 1 g./100 ml. higher on the second day than on the first,while the other two observers showed almost no overall changeon the two days. The E.E.L. Colorimeter showed manyinconsistencies, as the differences between the mean estimatesof the four observers on each sample obtained on the two daysshowed significant heterogeneity. This is probably a reflectionof the very small residual variance in this method (Table II),though a further analysis of the data did indicate that 04 was
largely responsible for the inconsistencies, and omission of theresults of this observer removes almost all the significant incon-sistencies in the data for this method. It is of relevance thatthe observers who had had previous experience (01, 02, and03) had all been much more familiar with this method thanwith any of the other methods investigated.
It seems reasonable to conclude, therefore, that, though thereare many inconsistencies in the data, these could well be due
to chance in the E.E.L. Haemoglobin meter and the Himoscope.and though the inconsistencies in the E.E.L. Colorimeter and
the A.0. Haemoglobin meter are significant they are small andunlikely to be important in clinical practice. In fact, thoughnone of the inconsistencies in the Haemoscope are significant,they are larger than those of the two colorimeters and the A.0.Haemoglobin meter. The inconsistencies of the Hdmometerand the Dare are relatively large, and are likely to be of impor-tance clinically, while the Tallqvist gave results in this trialwhich appear to be of little clinical value.
Effect of Observer
If skill in haemoglobinometry is important in the instrumentsinvestigated here, then one would expect that the two observerswith recent experience (01 and 02) would consistently showsmaller residual variances in the analysis of the variance of theresults for each method than the observer with experience severalyears prior to the trial (03), who in turn should show a smallerresidual variance than the observer with no previous experience(04). Furthermore, it is reasonable to expect that the skill so
measured should be more apparent in the methods whichrequire very exact dilution of blood than in those in which wholeblood is used. Only the E.E.L. Colorimeter showed the expectedpattern, possibly because the experienced observers were familiarwith this machine. In the other methods which necessitatedilution of blood (E.E.L. Haemoglobin meter, Haemoscope, andHdmometer) one of the most experienced observers (01) hadthe smallest residual variance, but no consistent trend was
shown by the other three observers, and in fact the secondmost experienced observer (02) appears to have shown theworst overall performance in these methods if judged by thiscriterion. In the whole-blood methods (the Dare and the A.0.Haemoglobin meter) there is almost complete disagreement inthe order of the observers when ranked by the sizes of theirresidual variances, suggesting that previous experience in haemo-globinometry may be of little importance in these methods.
There is therefore some limited evidence in these data thatin methods of haemoglobinometry in which a sample of bloodis diluted experience may be a factor of relevance, though it
does not appear to be the only factor of importance whichrelates to the observer. In the methods in which the estimationis made on the whole blood there is no evidence to suggestthat experience of the observer is of importance. None of the
observers were, however, experienced with this type of technique.
Speed and Convenience of Methods
The average time taken for a single estimation by each
method is shown in Table III. The differences in the times
for a single estimation are small and unlikely to be important,except for the Hiimometer, which was much slower than anyother method.
TABLE III.-Mean Time Taken by Four Observers to Make a SingleHaemoglobin Estimation on Each of the Seven Instruments, the
Estimated Time Required for Standardization, and the Mean Rank
Allotted to Each Method by the Four Observers on the Basis ofConvenfence and Acceptability
mean Time for Estimated Time for MeanInstrument one Estimation (Seenariztext) an
E.E.L. Hb meter .. .. 1 min. 34 sec. 4 mi.E.E.L. Colorimeter .. 1 min. 46 sec. 2 min.* 3
Haemoscope .. 2 min. 00 sec. 30 sec. 2
Himometer .. .. 5 min. 49 sec. - 5
Dare .. .. .. 1min. 58 sec. - 6
A.O. Hb. meter .. .. 2 min. 02 sec. - 4
Tallqvist .. .. .. 2 min. 02 sec. 7
* Calibration also required occasionally (see text).
REITLSHMEDICAL JOURNAI
1~l
1~l
1 January 1966 Haemoglobin Estimation-Elwood and jacobs BRITISHMEDICAL JOURNAL 23
There was significant concordance between the orders of themethods when ranked by each observer (P<0.001), so thesehave been pooled to obtain a mean ranking (Table III). Judgedby convenience and general acceptability, and with no regardto accuracy, the E.E.L. Haemoglobin meter and the Himoscopewere superior to the E.E.L. Colorimeter and the A.O. Haemo-globin meter; H5imometer, Dare, and Tallqvist were judgedleast acceptable. In these assessments no account has beentaken of the necessary frequent standardization of the colori-meters and the occasional calibration of the E.E.L. Haemoglobinmeter, and it must be remembered that these times and judg-ments relate to four laboratory technicians, three of whomwere well practised in pipetting fluids.
Further Test of the E.E.L. Colorimeter andA.O. Haemoglobin Meter
In the trial the A.O. Haemoglobin meter gave results which,though not as good as those of the two photoelectric instru-ments, were better than obtained by any other method investi-gated. As this instrument appears to us to be particularly wellsuited for use in survey work and in general practice, it wasdecided to investigate it further.Over a period of about three months two A.O. Haemoglobin
meters were used in a hospital laboratory and compared with
G.Hb
150-
30
F- 13-0-£
z
0J1,02 90
o 7-0
5 0
.0
* of
* 0 *
9-f*-
00@r 09
*~~~~~~~~~S. --
**
.0-0-
0~~~~ r 0-9
5-0 7-0 9-0 11-0 13-0 IS0 G.HbE.E.L. COLORIMETER
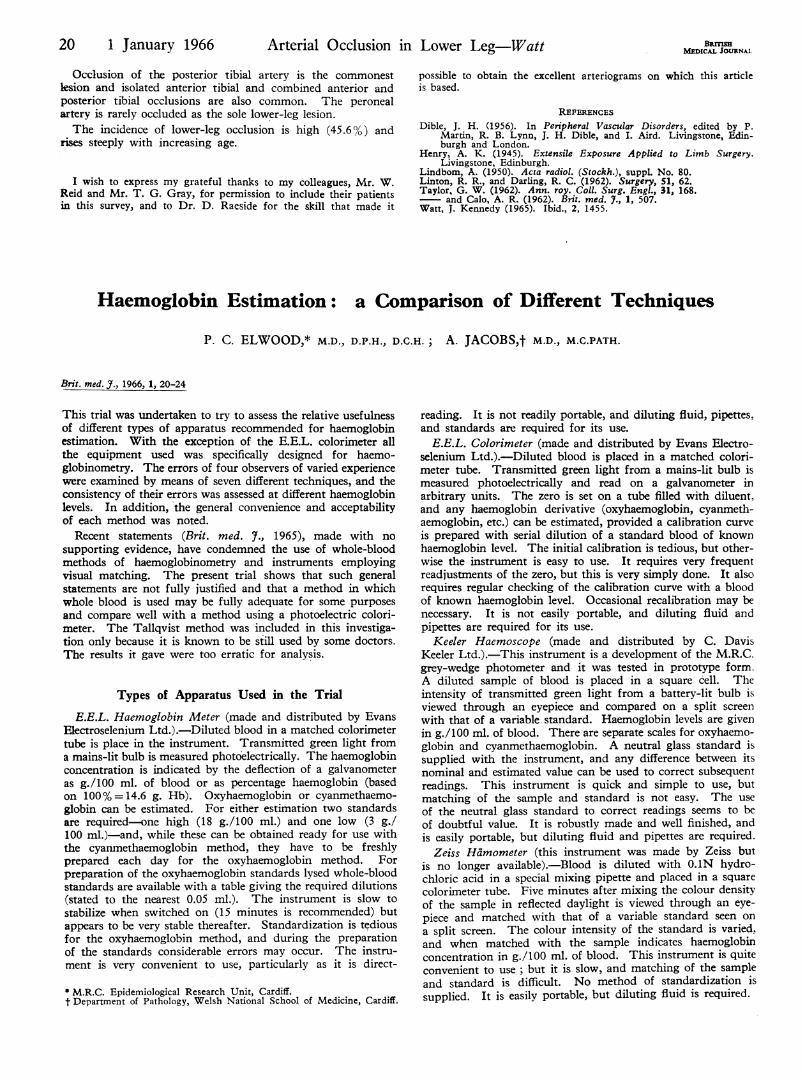
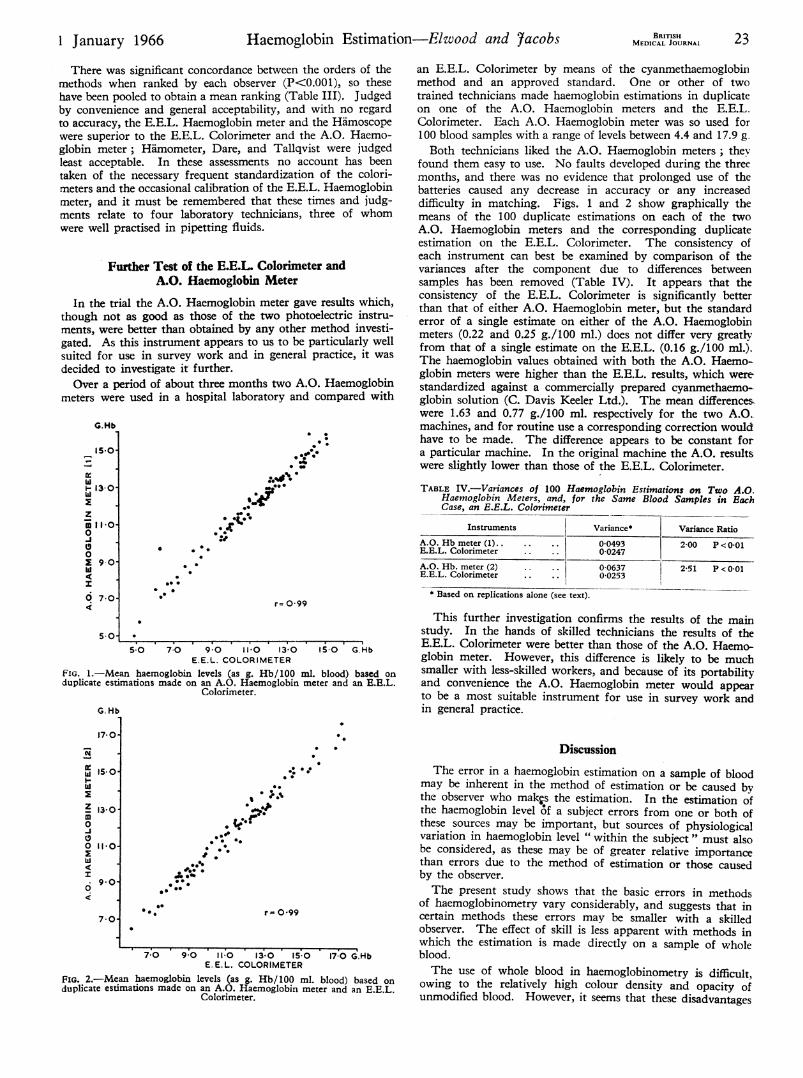
FIG. 1.-Mean haemoglobin levels (as g. Hb/100 ml. blood) based onduplicate estimations made on an A.O. Haemoglobin meter and an E.E.L.
Colorimeter.
G.Hb
an E.E.L. Colorimeter by means of the cyanmethaemoglobinmethod and an approved standard. One or other of twotrained technicians made haemoglobin estimations in duplicateon one of the A.O. Haemoglobin meters and the E.E.L.Colorimeter. Each A.O. Haemoglobin meter was so used for100 blood samples with a range of levels between 4.4 and 17.9 g.Both technicians liked the A.O. Haemoglobin meters; they
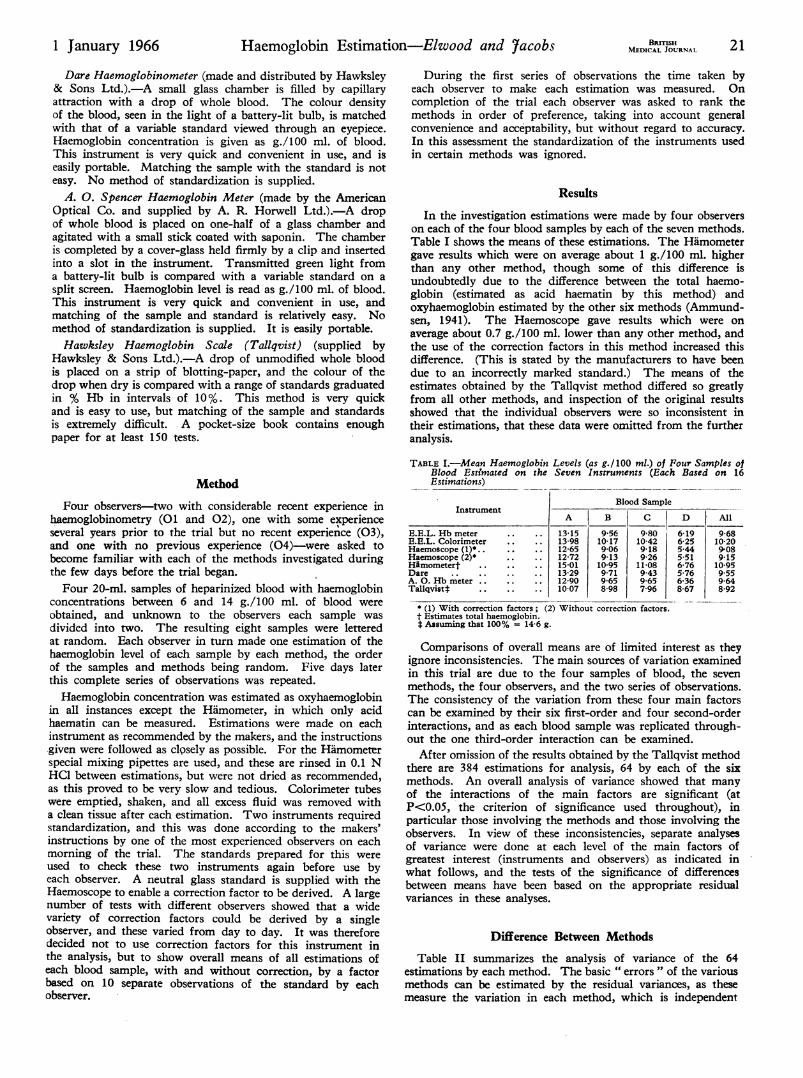
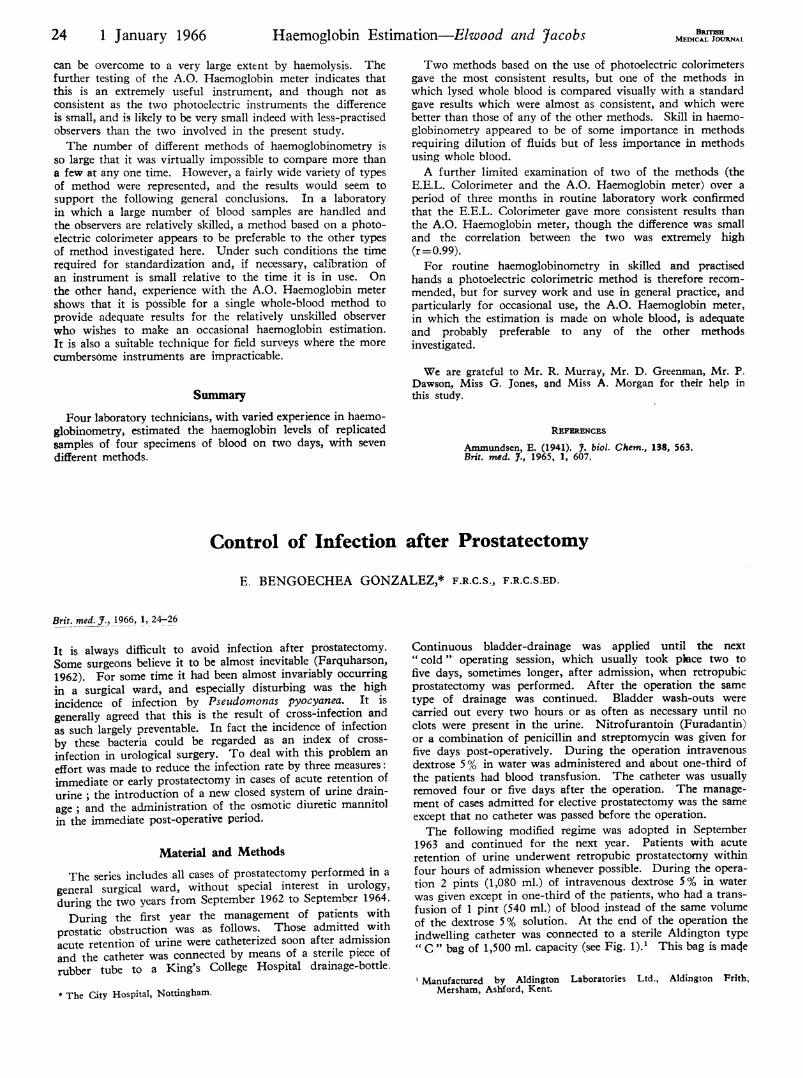
found them easy to use. No faults developed during the threemonths, and there was no evidence that prolonged use of thebatteries caused any decrease in accuracy or any increaseddifficulty in matching. Figs. 1 and 2 show graphically themeans of the 100 duplicate estimations on each of the twoA.O. Haemoglobin meters and the corresponding duplicateestimation on the E.E.L. Colorimeter. The consistency ofeach instrument can best be examined by comparison of thevariances after the component due to differences betweensamples has been removed (Table IV). It appears that theconsistency of the E.E.L. Colorimeter is significantly betterthan that of either A.O. Haemoglobin meter, but the standarderror of a single estimate on either of the A.O. Haemoglobinmeters (0.22 and 0.25 g./100 ml.) does not differ very greatlyfrom that of a single estimate on the E.E.L. (0.16 g./100 ml.).The haemoglobin values obtained with both the A.O. Haemo-globin meters were higher than the E.E.L. results, which were-standardized against a commercially prepared cyanmethaemo-globin solution (C. Davis Keeler Ltd.). The mean differences,were 1.63 and 0.77 g./100 ml. respectively for the two A.O.machines, and for routine use a corresponding correction wouldhave to be made. The difference appears to be constant fora particular machine. In the original machine the A.O. resultswere slightly lower than those of the E.E.L. Colorimeter.
TABLE IV.-Variances of 100 Haemoglobin Estimations on Two A.O.Haemoglobin Meters, and, for the Same Blood Samples in EachCase, an E.E.L. Colorimeter
Instruments Variance* Variance Ratio
A.0. Hb meter (1). .. 00493 2-00 P < 0-01E.E.L. Colorimeter 0-0247A.O. Hb. meter (2) .. .. 0-0637 2-51 P < 0 01la T I-o _InH.E.L. Colorimeter . .I
* Based on replications alone (see text).
0-0253
This further investigation confirms the results of the mainstudy. In the hands of skilled technicians the results of theE.E.L. Colorimeter were better than those of the A.O. Haemo-globin meter. However, this difference is likely to be muchsmaller with less-skilled workers, and because of its portabilityand convenience the A.O. Haemoglobin meter would appearto be a most suitable instrument for use in survey work andin general practice.
17-0
hi
-I
Z 15-0-
m
0
70
**.0
'0
1:1*9*A.~~~ *
000*00 0
* - *
0:
.00 0 r= 0-99
7 0 9 0 11-0 13-0 15-0 17-0 G.HbE. E.L. COLORIMETER
FIG. 2.-Mean haemoglobin levels (as g. Hb/100 ml. blood) based onduplicate estimations made on an A.O. Haemoglobin meter and an E.E.L.
Colorimeter.
Discussion
The error in a haemoglobin estimation on a sample of bloodmay be inherent in the method of estimation or be caused bythe observer who makps the estimation. In the estimation ofthe haemoglobin level 6f a subject errors from one or both ofthese sources may be important, but sources of physiologicalvariation in haemoglobin level " within the subject " must alsobe considered, as these may be of greater relative importancethan errors due to the method of estimation or those causedby the observer.The present study shows that the basic errors in methods
of haemoglobinometry vary considerably, and suggests that incertain methods these errors may be smaller with a skilledobserver. The effect of skill is less apparent with methods inwhich the estimation is made directly on a sample of wholeblood.The use of whole blood in haemoglobinometry is difficult,
owing to the relatively high colour density and opacity ofunmodified blood. However, it seems that these disadvantages
* 0
.
.
24 1 January 1966 Haemoglobin Estimation-Elwood and jacobs MEDICAL JOURNAL
can be overcome to a very large extent by haemolysis. Thefurther testing of the A.O. Haemoglobin meter indicates thatthis is an extremely useful instrument, and though not asconsistent as the two photoelectric instruments the differenceis small, and is likely to be very small indeed with less-practisedobservers than the two involved in the present study.The number of different methods of haemoglobinometry is
so large that it was virtually impossible to compare more thana few at any one time. However, a fairly wide variety of typesof method were represented, and the results would seem tosupport the following general conclusions. In a laboratoryin which a large number of blood samples are handled andthe observers are relatively skilled, a method based on a photo-electric calorimeter appears to be preferable to the other typesof method investigated here. Under such conditions the timerequired for standardization and, if necessary, calibration ofan instrument is small relative to the time it is in use. Onthe other hand, experience with the A.O. Haemoglobin metershows that it is possible for a single whole-blood method toprovide adequate results for the relatively unskilled observerwho wishes to make an occasional haemoglobin estimation.It is also a suitable technique for field surveys where the morecumbersome instruments are impracticable.
Summary
Four laboratory technicians, with varied experience in haemo-globinometry, estimated the haemoglobin levels of replicatedsamples of four specimens of blood on two days, with sevendifferent methods.
Two methods based on the use of photoelectric calorimetersgave the most consistent results, but one of the methods inwhich lysed whole blood is compared visually with a standardgave results which were almost as consistent, and which werebetter than those of any of the other methods. Skill in haemo-globinometry appeared to be of some importance in methodsrequiring dilution of fluids but of less importance in methodsusing whole blood.A further limited examination of two of the methods (the
E.E.L. Colorimeter and the A.O. Haemoglobin meter) over aperiod of three months in routine laboratory work confirmedthat the E.E.L. Colorimeter gave more consistent results thanthe A.O. Haemoglobin meter, though the difference was smalland the correlation between the two was extremely high(r= 0.99).For routine haemoglobinometry in skilled and practised
hands a photoelectric colorimetric method is therefore recom-mended, but for survey work and use in general practice, andparticularly for occasional use, the A.O. Haemoglobin meter,in which the estimation is made on whole blood, is adequateand probably preferable to any of the other methodsinvestigated.
We are grateful to Mr. R. Murray, Mr. D. Greenman, Mr. P.Dawson, Miss G. Jones, and Miss A. Morgan for their help inthis study.
REFERENCES
Ammundsen, E. (1941). 7. biol. Chem., 138, 563.Brit. med. 7., 1965, 1, 607.
Control of Infection after Prostatectomy
E. BENGOECHEA GONZALEZ,* F.R.C.S., F.R.C.S.ED.
Brit. med. J._1966, 1, 24-26
It is always difficult to avoid infection after prostatectomy.Some surgeons believe it to be almost inevitable (Farquharson,1962). For some time it had been almost invariably occurringin a surgical ward, and especially disturbing was the highincidence of infection by Pseudomonas pyocyanea. It isgenerally agreed that this is the result of cross-infection andas such largely preventable. In fact the incidence of infectionby these bacteria could be regarded as an index of cross-infection in urological surgery. To deal with this problem aneffort was made to reduce the infection rate by three measures:immediate or early prostatectomy in cases of acute retention ofurine ; the introduction of a new closed system of urine drain-age; and the administration of the osmotic diuretic mannitolin the immediate post-operative period.
Material and Methods
The series includes all cases of prostatectomy performed in a
general surgical ward, without special interest in urology,during the two years from September 1962 to September 1964.
During the first year the management of patients withprostatic obstruction was as follows. Those admitted with
acute retention of urine were catheterized soon after admissionand the catheter was connected by means of a sterile piece of
rubber tube to a King's College Hospital drainage-bottle.
Continuous bladder-drainage was applied until the next"cold" operating session, which usually took place two tofive days, sometimes longer, after admission, when retropubicprostatectomy was performed. After the operation the sametype of drainage was continued. Bladder wash-outs werecarried out every two hours or as often as necessary until noclots were present in the urine. Nitrofurantoin (Furadantin)or a combination of penicillin and streptomycin was given forfive days post-operatively. During the operation intravenousdextrose 5 % in water was administered and about one-third ofthe patients had blood transfusion. The catheter was usuallyremoved four or five days after the operation. The manage-ment of cases admitted for elective prostatectomy was the sameexcept that no catheter was passed before the operation.The following modified regime was adopted in September
1963 and continued for the next year. Patients with acuteretention of urine underwent retropubic prostatectomy withinfour hours of admission whenever possible. During the opera-tion 2 pints (1,080 ml.) of intravenous dextrose 50% in waterwas given except in one-third of the patients, who had a trans-fusion of 1 pint (540 ml.) of blood instead of the same volumeof the dextrose 5% solution. At the end of the operation theindwelling catheter was connected to a sterile Aldington type" C " bag of 1,500 ml. capacity (see Fig. 1).1 This bag is made
* The City Hospital, Nottingham.' Manufactured by Aldington Laboratories Ltd., Aldington Frith,
Mersham, Ashford, Kent.
![arXiv:1607.02936v2 [cs.CV] 22 Jun 2017 · PDF fileonly spectral response calibration of each ... Inference of Haemoglobin Concentration From Stereo ... RGBsis to invert the spectral](https://img.pdfslide.us/doc/110x75/5ab755bf7f8b9a7c5b8eaf7b/arxiv160702936v2-cscv-22-jun-2017-spectral-response-calibration-of-each-.jpg)