Embed Size (px)
Citation preview
FWS/OBS·8211 0.34SEPTEMBER 1983
HABITAT SUITABILITY INDEX MODELS:BIGMOUTH BUFFALO
., and Wildlife ServiceSK36 1. U54no . 82 10 .34
Department of the Interior

Thi s model is designed to be used by the Division of Ecological Servi~es
i n conjunction with the Habitat Evaluation Procedures.
FWS/OBS-82/10.34September 1983
HABITAT SUITABILITY INDEX MODELS: BIGMOUTH BUFFALO
by
Elizabeth A. EdwardsHabitat Evaluation Procedures GroupWestern Energy and Land Use Team
U.S. Fish and Wildlife ServiceDrake Creekside Building One
2627 Redwing RoadFort Collins, CO 80526
Contract Number 14-16-0009-78-078
Project Officers
James W. Terrelland
Robert F. RaleighWestern Energy and Land Use Team
U.S. Fish and Wildlife ServiceDrake Creekside Building One
2627 Redwing RoadFort Collins, CO 80526
Western Energy and Land Use TeamDivision of Biological Service
Research and DevelopmentFish and Wildlife Service
U.S. Department of the InteriorWashington, DC 20240

This report should be cited as:
Edwards, E. A. 1983. Habitat suitability index models: Bigmouth buffalo.U.S. Dept. Int., Fish Wildl. Servo FWS/OBS-82/10.34. 23 pp.
PREFACE
The habitat use information and Habitat Suitability Index (HSI) modelspresented in this document are an aid for impact assessment and habitat management activities. Literature concerning a species' habitat requirements andpreferences is reviewed and then synthesized into subjective HSI models, whichare scaled to produce an index between 0 (unsuitable habitat) and 1 (optimalhabitat). Assumptions used to transform habitat use information into thesemathematical models are noted, and guidelines for model application aredescribed. Any models found in the literature which may also be used tocalculate an HSI are cited, and simplified HSI models, based on what theauthor believes to be the most important habitat characteristics for thisspecies, are presented. Preference curves for use with the Instream FlowIncremental Methodology (IFIM) are excluded from this publication. A summarydocument descri bi ng curves for use wi th I FIM for thi s speci es and precedi ngspecies publications in this series (82/10) is planned for early 1984.
Use of the models presented in this publication for impact assessmentrequires the setting of clear study objectives and may require modification ofthe models to meet those objectives. Methods for reducing model complexityand recommended measurement techni ques for mode1 vari ab 1es are presented inTerrell et al. (1982).1 A discussion of HSI model building techniques ispresented in U.S. Fish and Wildlife Service (1981).2
The HSI models presented herein are complex hypotheses of species-habitatrelationships, not statements of proven cause and effect relationships. Themodels have notbeen tested against field data. For this reason, the U.S.Fi sh and Wi 1dl i fe Servi ce encourages mode1 users to convey comments andsuggestions that may help us increase the utility and effectiveness of thishabitat-based approach to fish and wildlife planning. Please send commentsto:
Habitat Evaluation Procedures GroupWestern Energy and Land Use TeamU.S. Fish and Wildlife Service2627 Redwing RoadFt. Collins, CO 80526
lTerrell, J. W., T. E. McMahon, P. D. Inskip, R. F. Raleigh, and K. L.Williamson. 1982. Habitat suitability index models: Appendix A. Guidelinesfor riverine and lacustrine applications of fish HSI models with the HabitatEvaluation Procedures. U.S. Dept. Int., Fish Wildl. Servo FWS/OBS-82/l0.A.54 pp.
2U.S. Fish and Wildlife Service.habitat suitability index models.Serv., Div. Ecol. Servo n.p.
1981. Standards for the development of103 ESM. U.S. Dept. Int., Fish Wildl.
iii

iv
CONTENTS
Page
PREFACE iiiACKNOWLEDGMENTS vi
HABITAT USE INFORMATION 1Genera1 ...........................•........•........•..•.......••. 1Age, Growth, and Food 1Reproduction 2Specific Habitat Requirements ,... 2
HABITAT SUITABILITY INDEX (HSI) MODELS. 3Model Applicability............................................... 3Model Description - Riverine..... 4Model Description - Lacustrine '" 7Suitability Index (SI) Graphs for Model Variables 7
Riverine Habitat Suitability Index Equations 12Lacustrine Habitat Suitability Index Equations 13
Interpret i ng Model Outputs 14ADDITIONAL HABITAT MODELS 14
Modell. .. . . .. .. . .. .. . . 14Model 2 19Model 3 19Model 4 19
REFERENCES
v
19
ACKNOWLEDGMENTS
I would like to thank O. Willis, C. Walburg, and D. Jester for reviewingthe manuscr tp t . Their review contributions are gratefully acknowledged, butthe author accepts full responsibi 1ity for the contents of the document. Thelife history information presented in the text is derived from a report writtenby W. R. Persons and R. V. Bulkley, Utah State Cooperative Fishery ResearchUnit, under the terms of contract number 14-16-0009-79-041. C. Short providedthe editorial review, and word processing was provided by D. Ibarra andC. Gul lOW. The cover ill ustrat ion is from Freshwater Fi shes of Canada 1973,Bulletin 184, Fisheries Research Board of Canada, by W. B. Scott and E. J.Crossman.
vi
BIGMOUTH BUFFALO (Ictiobus cyprinellus)
HABITAT USE INFORMATION
General
The bigmouth buffalo (Ictiobus cyprinellus) occurs from the Lake Eriedrainage south through the Ohio and Mississippi River drainages to theTennessee River in northern Alabama; west to Arkansas; south to near the Gulfof Mexico in Louisiana; northwest through eastern Texas and Oklahoma; norththrough Iowa, South Dakota, and Minnesota; and in the Milk River into Manitobaand Saskatchewan. The species has been introduced into reservoirs in Arizona,the Los Angeles aqueduct system in southern California (Trautman 1957; Johnson1963; Scott and Crossman 1973; Hubbs and Lagler 1974; Moyle 1976; Lee et al.1980), and reservoi rs of the Mi ssouri Ri ver drainage in North Dakota andMontana (Lee et al. 1980).
Possible hybridization with the smallmouth buffalo (Ictiobus bubalus) hasbeen reported (Giudice 1964; Johnson and Minckley 1969, 1972). Crosses ofbigmouth and black buffalo (Ictiobus niger) exhibit hybrid vigor (Guidice1964) .
Age, Growth, and Food
Sexual maturity in the bigmouth buffalo depends on the size of the fish.Females mature at a length> 475 mm (Johnson 1963). Males begin to mature at305-328 mm, and most are mature at about 356-379 mm. These sizes correspondto age I for males and II for females in Arkansas (Swingle 1957; Walburg andNelson 1966). In Lewis and Clark Reservoir, South Dakota, where growth isslower, some males mature at age VII, and most are mature at age VIII (Walburgand Nelson 1966). Some females mature at age VIII, and most are mature atage IX.
An age of XX has been reported for the bigmouth buffalo (Johnson 1963;Lee et al. 1980). However, aging techniques for fishes older than about age Xare questionable. Maximum length is reported to be 889 mm (Lee et al. 1980),and the largest reported specimen weighed 36 kg (Harlan and Speaker 1969).
Larval bigmouth buffalo eat benthic copepods and cladocerans (McComish1964; Starostka and Applegate 1970; Tafanelli et al. 1970) and sometimesphytoplankton (Johnson 1963), chironomids (Starostka and Applegate 1970), and"ooze" (Whitaker 1974). Juveniles and adults occupy a food niche overlappingboth benthic and limnetic plankton feeders (Johnson 1963) and consume organisms
1
according to their availability (Moen 1954; McComish 1964; Minckley et al.1970; Starostka and Applegate 1970; Tafanelli et al. 1970). They also eatcladocera, copepods, algae, Chironomidae, ostracods, and other insect larvaeand invertebrates (Johnson 1963; Minckley et al. 1970; Starostka and Applegate1970; Tafanelli et al. 1970; Stanley and Jones 1976). Food supply is animportant limiting factor for growth (Canfield 1922; Walburg and Nelson 1966).
Reproduction
The addition of fresh water triggers spawning, and year class strength ispositively related to rising water levels and flooded terrestrial vegetation(Canfield 1922; Moen 1954; Johnson 1963; Gassaway 1970; Beckman and Elrod1971; Elrod and Hassler 1971; Benson 1973; Willis 1978; Willis and Owen 1978;Benson 1980). Bigmouth buffalo spawn from April to June (Canfield 1922;Swingle 1957; Johnson 1963; Walburg and Nelson 1966; Benson 1973), when thewater temperature reaches 14.4° C (Johnson 1963). Spawning is slow untilwater temperatures reach 15.6-16.7°C and is heaviest at temperatures of15.6-18.3° C (Canfield 1922; Johnson 1963). This species will spawn attemperatures up to 26.7° C (Swingle 1954). Bigmouth spawn in shallow waterover vegetation and scatter their adhesive eggs randomly (Johnson 1963).
Specific Habitat Requirements
Bigmouth buffalo typically inhabit larger rivers, utilizing overflowponds, lowland lakes and oxbows, and marshes along these rivers (Gerking 1945;Trautman 1957; Johnson 1963; Kozel and Schmulbach 1976). The species al solives in bayous and sloughs (Gerking 1945) of very low gradient (Johnson1963). Bigmouth buffalo seek out low velocity areas (0-70 em/sec) (Schmulbachet al. 1975), but can withstand strong current velocities for short periods(Kallemeyn and Novotny 1977). An adult can maintain its position in a streamvelocity of 102.5 em/sec for a short period, but the mean critical velocity(maximum current velocity at which a fish can maintain its position in thewater) is 64.9 em/sec (Zittel 1978).
Bigmouth buffalo are well adapted to reservoirs (Johnson 1963). Thespecies moves into warm, shallow, protected embayments in the upstream portionof reservoirs during summer and into deeper water in fall and winter(Huntington and Hill 1956; Beckman and Elrod 1971; Benson 1980). Degradationof littoral habitat in reservoirs, due to fluctuating water levels and resulting siltation and erosion, will reduce buffalo populations (Benson 1980). Thepresence of quiet water embayments and abundant vegetation is also critical.Bigmouth buffalo do well in the first several years of impoundment of areservoir, or when new land is inundated, but the number of adults decreasesin later years (Walburg and Nelson 1966; Elrod and Hassler 1971; Benson 1973;Willis and Owen 1978; Benson 1980).
The standing crop of bigmouth buffalo increases as the storage ratio (SR)(ratio of mean reservoir water volume to annual discharge volume) decreases(Jenkins 1976). Growth of bigmouth buffalo is positively correlated with foodsupply (Walburg and Nelson 1966) and TDS levels (Jenkins 1967, 1976). AdquateTDS levels in lakes and reservoirs (> 200 TOS) should ensure an adequate foodsupply to support high population levels.
2
Bigmouth buffalo can tolerate suspended solids and sediment and do wellin turbid waters or over mud bottoms (Trautman 1957; Johnson 1963; Muncyet al. 1979). The species will tolerate turbidity levels> 100 ppm (Walburgand Nelson 1966).
A pH range of 6.5-8.5 is considered essential for good production offreshwater fish (Stroud 1967), and a pH range of 5.0-6.5 or 8.5-9.0 can bedetrimental to fish populations (Doudoroff and Katz 1950; Committee on WaterQuality Criteria 1972). A pH of 6.5-8.5 is assumed to be optimum for bigmouthbuffalo.
The specific dissolved oxygen (D.O.) requirements of bigmouth buffalo arenot known, but 5.0 mg/l is considered the minimum level for maintaining goodfreshwater fish populations (U.S. Environmental Protection Agency 1976).
Successful spawning of bigmouth buffalo occurred in ponds in Louisianawhere salinity ranged from 1.4-2.0 ppt (Perry 1976). Life stages from fertilized eggs through yearlings tolerated salinities through 9 ppt in laboratorystudies, but water with salinity> 12 ppt is not suitable (Hollander 1974;Hollander and Avault 1975).
Adult. Adult bigmouth buffalo have been collected in warm water tem-peratures rang i ng from 22.5-38.0° C near a therma 1 effl uent. Temperaturepreferenda is 31-34° C (Gammon 1973).
Embryo. Optimum temperatures for incubation and hatching are 15-18° C(Canfield 1922), but eggs will develop at temperatures up to 26.7° C (SWingle1954). Vegetation is requi red for successful spawni ng (Benson 1980). Anydrop in water level after spawning will reduce reproductive success (Benson1973). Shallow backwaters and marshes are required in riverine habitats(Kallemeyn and Novotny 1977) and protected embayments are required fornurseries in lacustrine habitats (Benson 1980).
Even though bigmouth buffalo eggs tolerated salinities up to 15 ppt,newly hatched fry tolerated only 9 ppt (Hollander 1974). Thus, it is assumedthat 9 ppt would be the upper tolerance limit for the species.
Fry and Juvenile. Specific environmental information for fry and juvenilebigmouth buffalo is unknown.
HABITAT SUITABILITY INDEX (HSI) MODELS
Model Applicability
Geographic area. The model is applicable throughout the native andintroduced range of the bi gmouth buffa 10 in North America. The standard ofcomparison for each suitability index is the optimum value of the variablethat occurs anywhere within this region. Therefore, the model may neverprovide an HSI of 1.0 when applied to waters in the North where temperaturerelated variables may not reach the optimum values found in the South.
3
Season. The model provides a rating for a habitat based on its abilityto support a reproducing population of bigmouth buffalo through all seasons ofthe year. The model will provide an HSI of 0 if any reproduction-relatedvariable indicates that the species is not able to reproduce.
Cover types. The model is applicable in riverine and lacustrine habitatsas described by Cowardin et al. (1979).
Minimum habitat area. Minimum habitat area is defined as the minimumarea of contiguous suitable habitat that is required for a species to live andreproduce. No attempt has been made to establish a minimum habitat size forbigmouth buffalo, although this species prefers larger rivers and reservoirs.
Verification level. The acceptance level of the bigmouth buffalo modelis to produce an index between 0 and 1 that the model author believes has apositive relationship to spawning success of adults and carrying capacity forfry, juveniles, and adults. In order to verify that the model output wasacceptable, HSI's were calculated from sample data sets. These sample datasets and their relationship to model verification are discussed in greaterdeta il 1ater.
Model Description
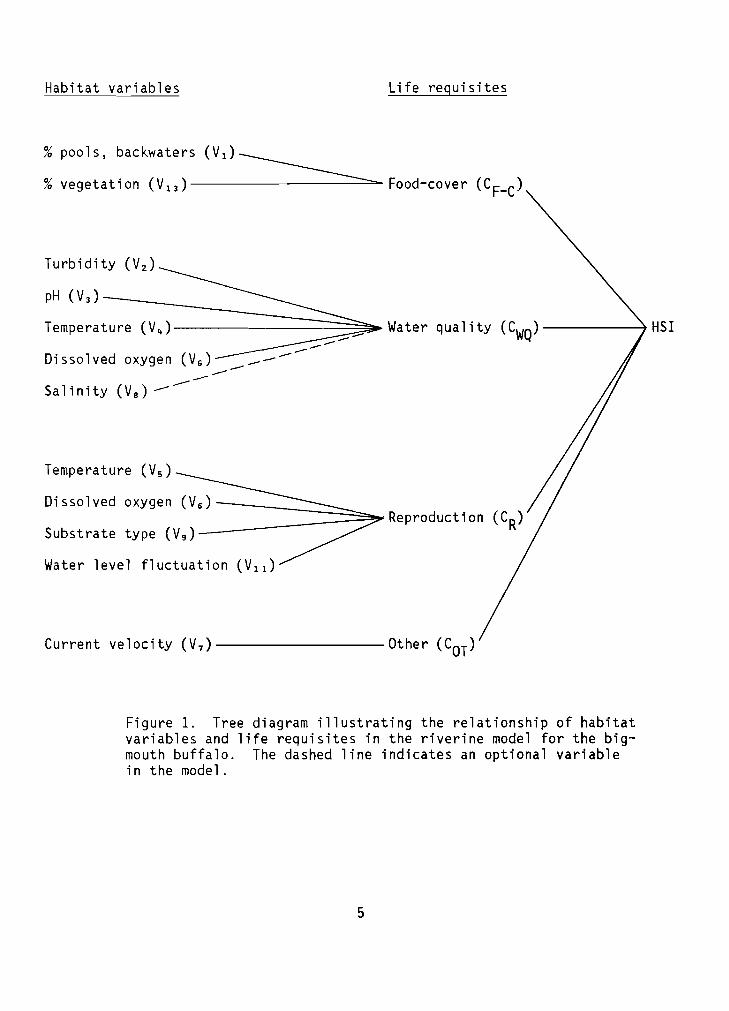
The analysis of habitat quality for bigmouth buffalo is based on basiccomponents consisting of food, cover, water quality, and reproduction requirements. Variables that have been shown to affect growth, survival, abundance,or other measures of well-being of bigmouth buffalo are placed in the appropriate component (Figs. 1 and 2).
Model Description - Riverine
Food-cover component. Food and cover have been aggregated into onecomponent because the same variables describe both food and cover suitability.Percent pools and off-channel areas (V 1 ) is included because this is where the
speci es spends most of its time and requi rements for food and cover must bemet in these areas. Percent vegetation (V 1 3 ) is important because success of
bigmouth buffalo populations has been correlated with the presence of vegetation, which is necessary for cover for fry and juveniles and for foodproduction.
Water quality component. Temperature (V..) is the most important water
quality variable because it restricts this warmwater species by its effects ongrowth and survival. Turbidity (V 2 ) , pH (V 3 ) , and dissolved oxygen (V,) also
affect growth and survival of the species. Bigmouth buffalo can tolerate highsalinity (VI). However, salinity is not usually a problem in areas where the
species is found and, thus, is an optional variable.
4
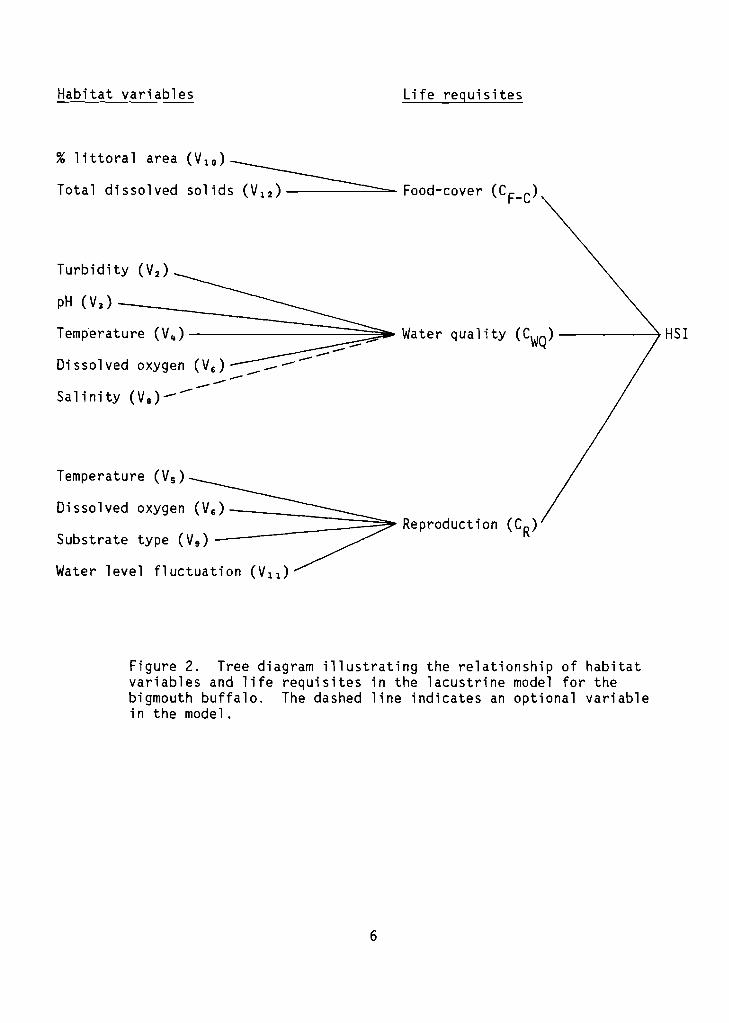
Habitat variables Life requisites
(V 1 ) _______________
Food-cover
pH (V3
) ::~======;;;~~~ Water qual ity (CWQ)----~ HSI
Current velocity (V 7 ) --------- Other (COT)
Dissolved oxygen
s ~========::::~. Reproduct ion (CR)Substrate type (V g ) -
Water level fluctuation (V 1 1 )
Temperature (V 4 )
Temperature (V s )
Turbi dity (V2)
Dissolved oxygen (V s ) __-----Sa1in ity (V 8) ---
% pools, backwaters
% vegetation (V 1 3 ) -------------------=-
Figure 1. Tree diagram illustrating the relationship of habitatvariables and life requisites in the riverine model for the bigmouth buffalo. The dashed line indicates an optional variablein the model.
5
Habitat variables Life requisites
% littoral area (V I O)
Total dissolved solids -------===- Food-cover (CF-C)
Temperature (V s )
Turbidity (V 2 )
pH (V3 )
Dissolved oxygen
;'~=========~~ Reproduction (CR)Substrate type (V g ) -
Water level fluctuation (VII)
Figure 2. Tree diagram illustrating the relationship of habitatvariables and life requisites in the lacustrine model for thebigmouth buffalo. The dashed line indicates an optional variablein the model.
6
Reproduct i on component. Temperature duri ng spawning (Vs ) and di sso 1ved
oxygen (V 6 ) are included because survival of the embryo depends on these
variables. Spawning substrate type (V 9 ) is a very important variable because
reproduct i ve success of bi gmouth buffalo is dependent on the presence ofvegetation during spawning. Water level fluctuation (V 1 1 ) is included because
flooding with fresh water in the spring "tr tqqer s" spawning, rising waterlevels inundate terrestrial vegetation for spawning substrate, and a drop inwater level reduces reproductive success.
Other component. The variable in the other component aids in describinghabitat suitability for bigmouth buffalo, but is not specifically related tothe life requisite components already presented. Current velocity (V7 ) is
included because the species actively seeks out areas of low velocity.
Model Description - Lacustrine
Food-cover component. Food and cover are aggregated into one componentfor the lacustrine model. Percent littoral area (V lD ) is included because
bigmouth buffalo forage in, and inhabit, littoral areas almost exclusively.Total dissolved solids (V12 ) is important because standing crop of bigmouth
buffalo is positively correlated with total dissolved solids, which, in turn,affect the food supply.
Water quality component. The water quality component is the same in boththe riverine and lacustrine models. This component is discussed in thedescription of the riverine model.
Reproduct i on component. The reproduct i on component is the same in boththe riverine and lacustrine models. This component is discussed in thedescription of the riverine model.
Suitability Index (SI) Graphs for Model Variables
This section contains suitability index graphs for the 13 variablesdescribed above and equations for combining selected variable indices into aspecies HSI using the component approach. Variables may pertain to either ariverine (R) habitat, a lacustrine (L) habitat, or both.
7
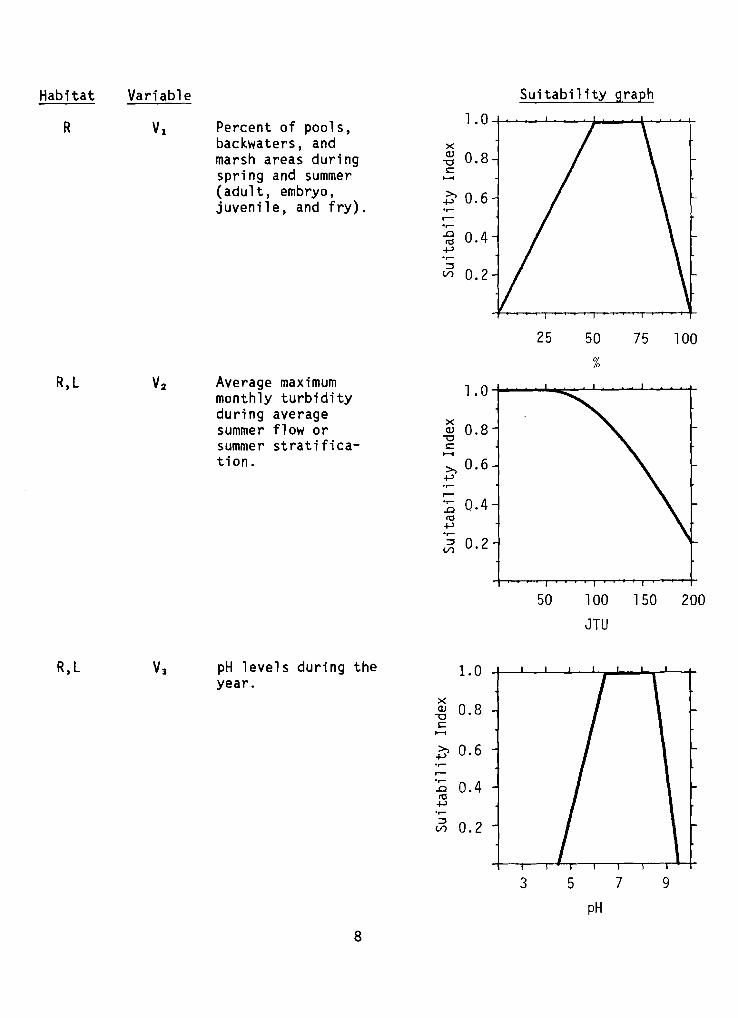
Habitat Variable Suitability graph
R VI Percent of pools,backwaters, andmarsh areas duringspring and summer(adult, embryo,juvenile, and fry).
1.0
xOJ 0.8"'0c......
~ 0.6.,.......-.,.....0 0.4~
~
:::::lV'l 0.2
25 50 75 100%
R,L V2 Average maximum 1.0monthly turbidityduring average xsummer flow or OJ 0.8summer stratifica- "'0
c
tion.......>, 0.6~
...-.,.... 0.4.0~
~.,....:::::l 0.2V'l
50 100 150 200
JTU
R,L V3 pH levels during the 1.0year.
xOJ 0.8
"'0c......>, 0.6~
.0 0.4-e~.,....:::::l 0.2V'l
3 5 7 9
pH
8
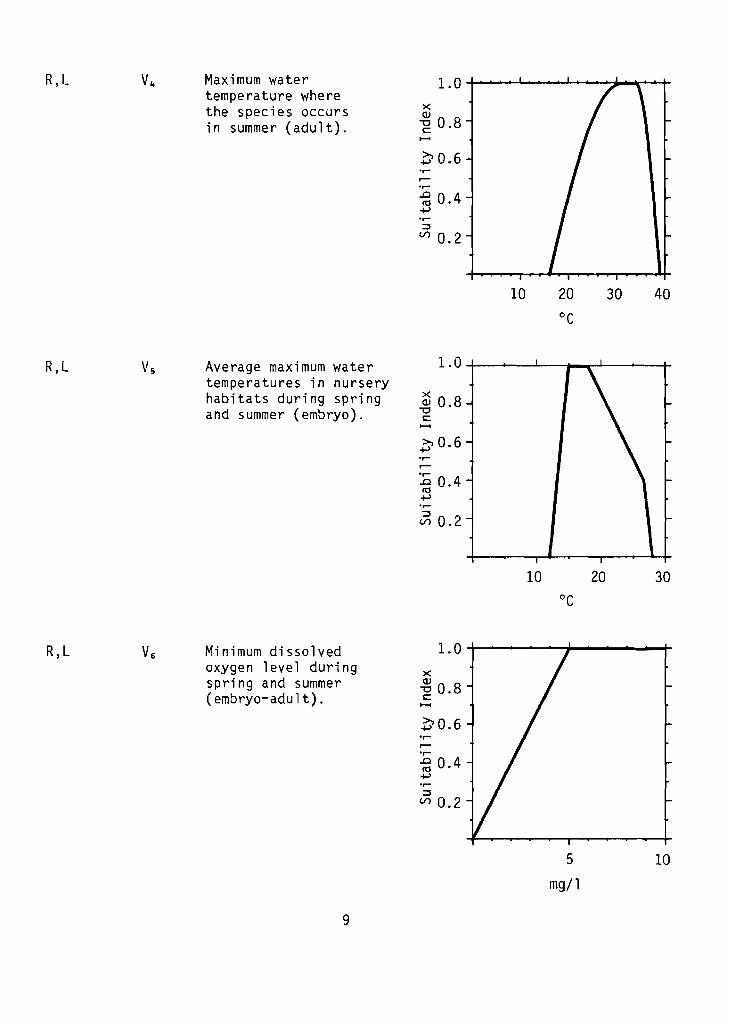
R,L Maximum watertemperature wherethe species occursin summer (adult).
xQ)
-g 0.8
~0.6......r-......~ 0.4+.>......::sU"l0.2
10 20 30 40
R,L Average maximum watertemperatures in nurseryhabitats during springand summer (embryo).
1. 0 +-----'------j~~----+-
xQ) 0.8-0c:......
~ 0.6......r--
:0 0.4co+"'~
::sU"l0.2
10 20 30
R,L Minimum dissolvedoxygen level duringspring and summer(embryo-adu 1t).
1. 0 +----......,~-......-.....rxQ)
-00.8c:......
~0.6.~
~ 0.4+.>.~
::sU"l 0.2
9
5
mg/l
10
R
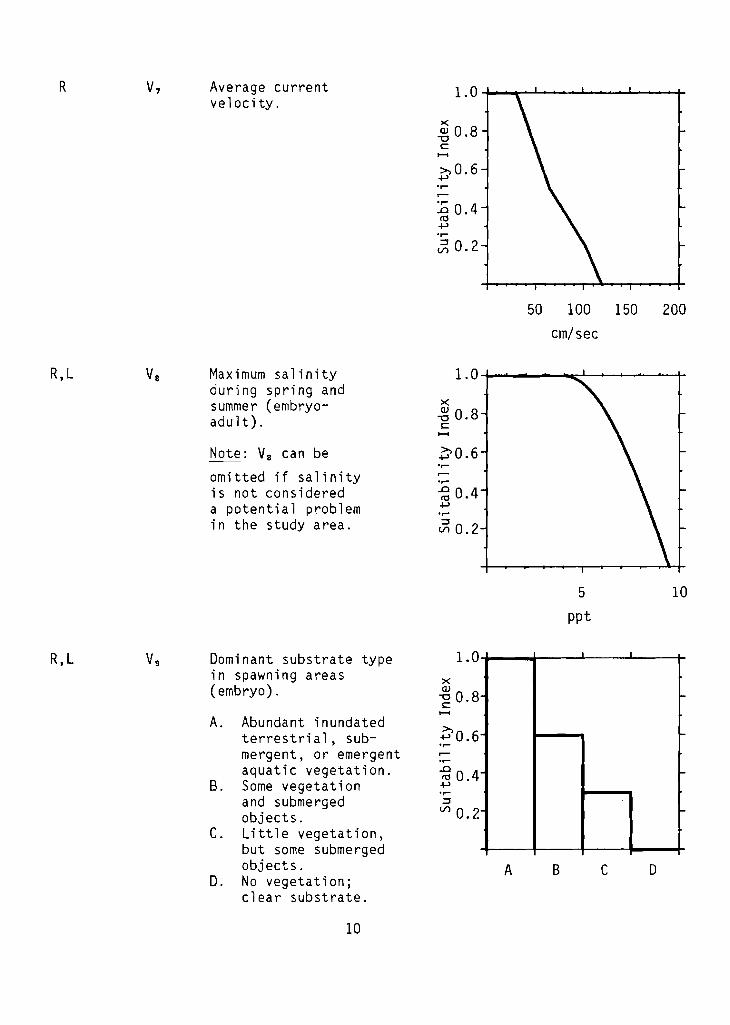
R,L
Average currentvelocity.
Maximum salinityduring spring andsummer (embryoadult).
Note: VB can be
omitted if salinityis not considereda potential problemin the study area.
1.0-+-............................................~...............................+
>(
~ 0.8c......~0.6
:0 0.4ttl+-'
~ 0.2
50 100 150 200
em/sec
x~ 0.8c
......
~0.6
......~ 0.4+-'......::lV'l0.2
l-
f-
R,L Vg Dominant substrate type 1.0in spawning areas x(embryo) . Q)
-00.8c......A. Abundant inundated >,
terrestrial, sub- +-' 0.6......mergent, or emergentaquatic vegetation. .0
ttl 0.4B. Some vegetation +-'.,....and submerged ::l
objects. V'l0.2C. Little vegetation,
but some submergedobjects.
D. No vegetation;clear substrate.
10
A B
5
ppt
c D
10
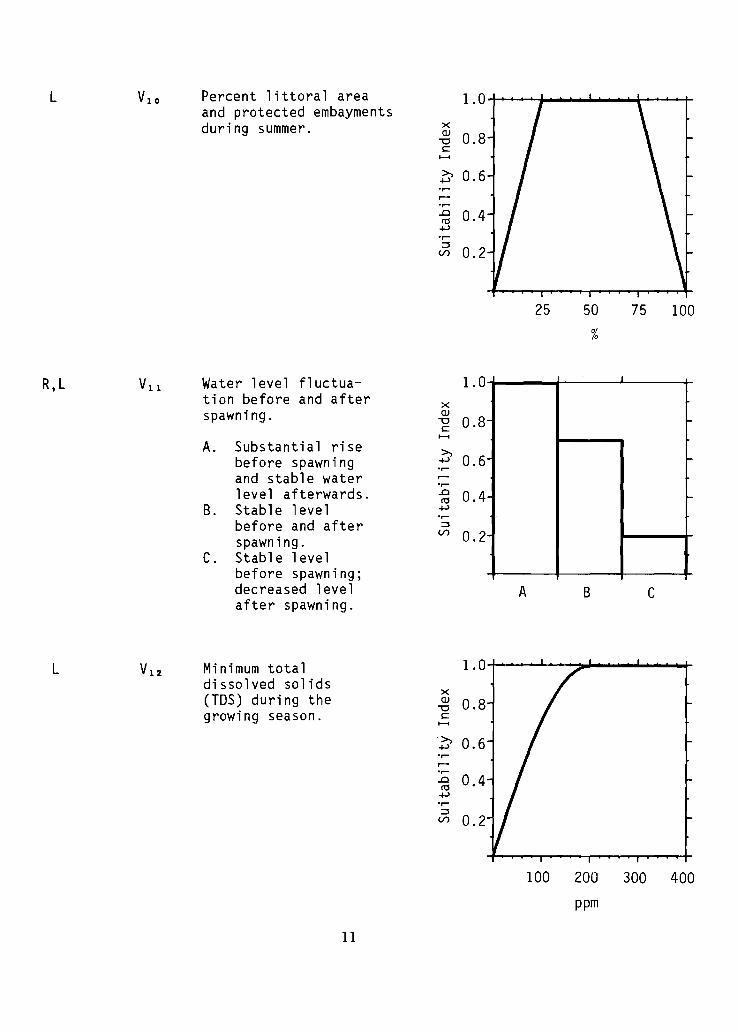
L VlO Percent littoral area 1.0and protected embaymentsduring summer. ><
OJ 0.8-0s::......
~ 0.6or-
or-..c 0.4ro+->.r-~
0.2Vl
l-
I-
I-
R,L Vll Water level fluctua- 1.0tion before and after ><spawning. OJ
-0 0.8s::......A. Substantial rise c-,
before spawning +-> 0.6.r-
and stable water .r-
level afterwards. ..c 0.4roB. Stable level +->
.r-
before and after ~
Vl 0.2spawning.C. Stable level
before spawning;decreased levelafter spawning.
A
25 50
%
B
75
c
100
L V12 Minimum total 1.0dissolved solids
><(TOS) during the OJ 0.8-0growi ng season. s::......
c-, 0.6+->.r-
.r-
0.4..cro+->.r-~
Vl 0.2
11
100 200
ppm
300 400
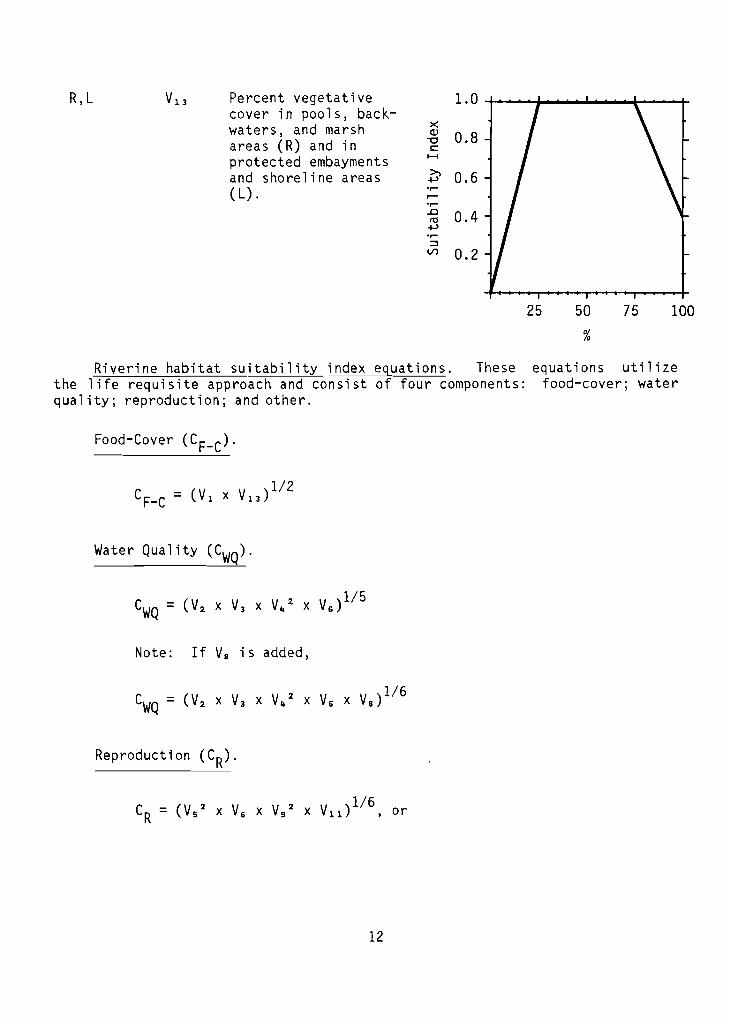
R,L V13 Percent vegetative 1.0cover in pools, back-waters, and marsh x
Q) 0.8areas (R) and in -0t:
protected embayments ......
and shoreline areas ~ 0.6(L) . .r-
r-.r-..0 0.4n::l......•r-~
Vl 0.2
25 50
%
75 100
Riverine habitat suitability index equations. Thesethe life requisite approach and consist of four components:quality; reproduction; and other.
Food-Cover (CF-C)'
Water Quality (CWQ)'
Note: If Va is added,
Reproduction (CR).
12
equations utilizefood-cover; water
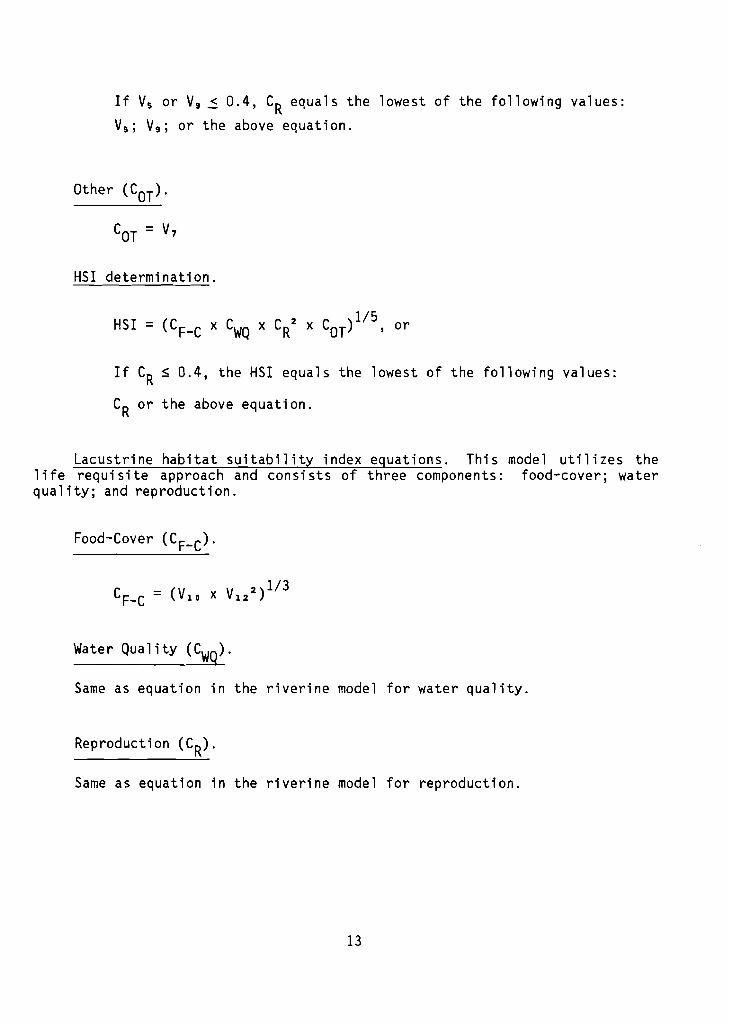
If Vs or Vg ~ 0.4, CR equals the lowest of the following values:
Vs ; Vg ; or the above equation.
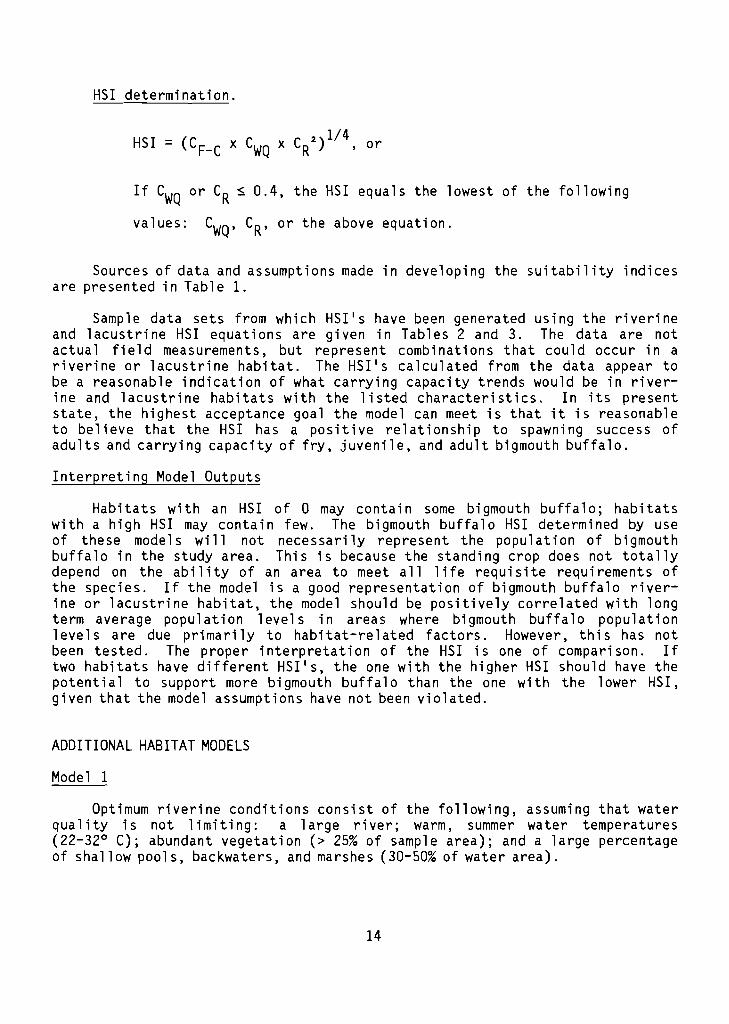
HSI determination.
If CR ~ 0.4, the HSI equals the lowest of the following values:
CR or the above equation.
Lacustrine habitat suitability index equations. This model utilizes thelife requisite approach and consists of three components: food-cover; waterquality; and reproduction.
Food-Cover (CF-C)'
Water Quality (CWQ)'
Same as equation in the riverine model for water quality.
Reproduction (CR).
Same as equation in the riverine model for reproduction.
13
HSI determination.
If CWQ or CR S 0.4, the HSI equals the lowest of the following
values: CWQ' CR, or the above equation.
Sources of data and assumptions made in developing the suitability indicesare presented in Table 1.
Sample data sets from which HSI's have been generated using the riverineand lacustrine HSI equations are given in Tables 2 and 3. The data are notactua 1 fi e1d measurements, but represent combi nat ions that coul d occur inariverine or lacustrine habitat. The HSI's calculated from the data appear tobe a reasonable indication of what carrying capacity trends would be in riverine and lacustrine habitats with the listed characteristics. In its presentstate, the highest acceptance goal the model can meet is that it is reasonableto believe that the HSI has a positive relationship to spawning success ofadults and carrying capacity of fry, juvenile, and adult bigmouth buffalo.
Interpreting Model Outputs
Habitats with an HSI of 0 may contain some bigmouth buffalo; habitatswith a hi gh HSI may contain few. The bi gmouth buffalo HSI determi ned by useof these models will not necessarily represent the population of bigmouthbuffalo in the study area. This is because the standing crop does not totallydepend on the abil i ty of an area to meet a11 1ife requi site requi rements ofthe species. If the model is a good representation of bigmouth buffalo riverine or lacustrine habitat, the model should be positively correlated with longterm average popul at ion 1eve1sin areas where bi gmouth buffalo popul at ionlevels are due primarily to habitat-related factors. However, this has notbeen tested. The proper i nterpretat i on of the HSI is one of compari son. Iftwo habitats have different HSI's, the one with the higher HSI should have thepotential to support more bigmouth buffalo than the one with the lower HSI,given that the model assumptions have not been violated.
ADDITIONAL HABITAT MODELS
Modell
Optimum riverine conditions consist of the following, assuming that waterquality is not limiting: a large river; warm, summer water temperatures(22-32° C); abundant vegetation (> 25% of sample area); and a large percentageof shallow pools, backwaters, and marshes (30-50% of water area).
14
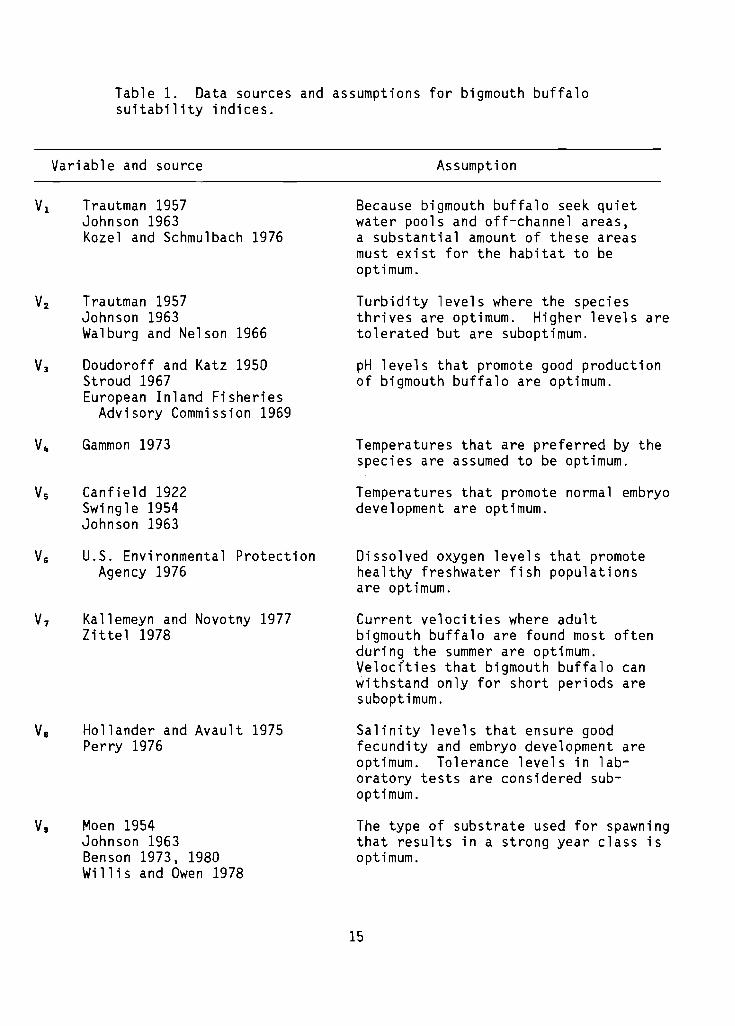
Table 1. Data sources and assumptions for bigmouth buffalosuitability indices.
Variable and source
Trautman 1957Johnson 1963Kozel and Schmulbach 1976
V2 Trautman 1957Johnson 1963Walburg and Nelson 1966
V3 Doudoroff and Katz 1950Stroud 1967European Inland Fisheries
Advisory Commission 1969
V4 Gammon 1973
Vs Canfield 1922Swingle 1954Johnson 1963
V, U.S. Environmental ProtectionAgency 1976
V7 Kallemeyn and Novotny 1977Zittel 1978
Assumption
Because bigmouth buffalo seek quietwater pools and off-channel areas,a substantial amount of these areasmust exist for the habitat to beoptimum.
Turbidity levels where the speciesthrives are optimum. Higher levels aretolerated but are suboptimum.
pH levels that promote good productionof bigmouth buffalo are optimum.
Temperatures that are preferred by thespecies are assumed to be optimum.
Temperatures that promote normal embryodevelopment are optimum.
Dissolved oxygen levels that promotehealthy freshwater fish populationsare optimum.
Current velocities where adultbigmouth buffalo are found most oftenduring the summer are optimum.Veloclties that bigmouth buffalo canwithstand only for short periods aresuboptimum.
V. Hollander and Avault 1975Perry 1976
Moen 1954Johnson 1963Benson 1973, 1980Willis and Owen 1978
Salinity levels that ensure goodfecundity and embryo development areoptimum. Tolerance levels in laboratory tests are considered suboptimum.
The type of substrate used for spawningthat results in a strong year class isoptimum.
15
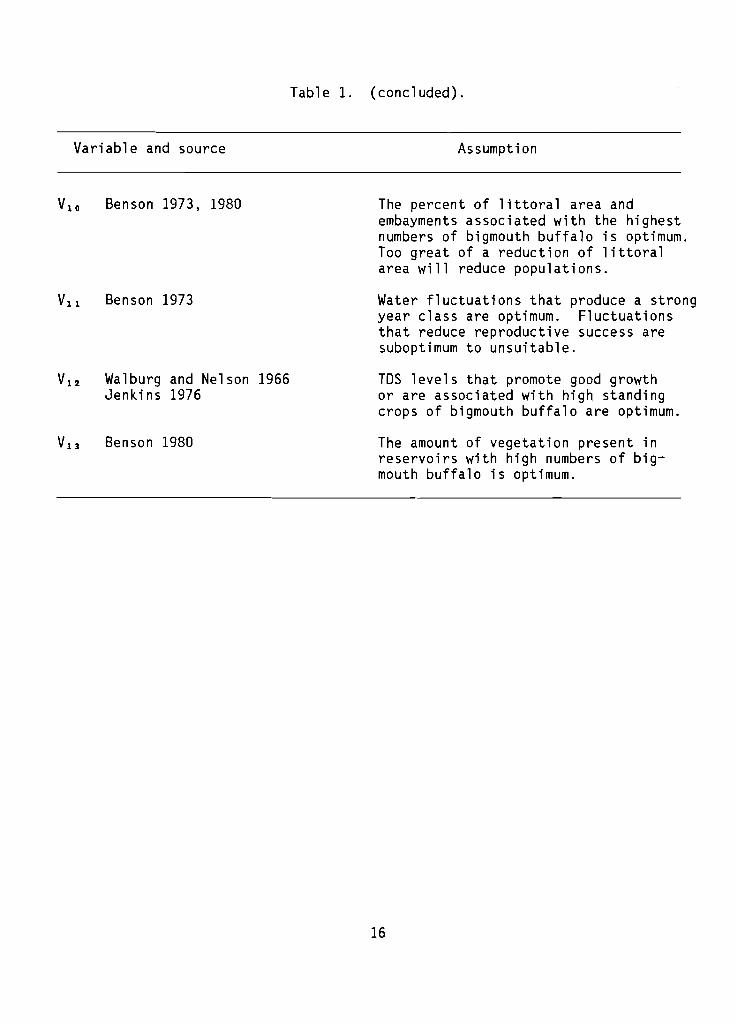
Table 1. (concluded).
Variable and source Assumption
Benson 1973, 1980
Benson 1973
Walburg and Nelson 1966Jenkins 1976
Benson 1980
The percent of littoral area andembayments associated with the highestnumbers of bigmouth buffalo is optimum.Too great of a reduction of littoralarea will reduce populations.
Water fluctuations that produce a strongyear class are optimum. Fluctuationsthat reduce reproductive success aresuboptimum to unsuitable.
TDS levels that promote good growthor are associated with high standingcrops of bigmouth buffalo are optimum.
The amount of vegetation present inreservoirs with high numbers of bigmouth buffalo is optimum.
16
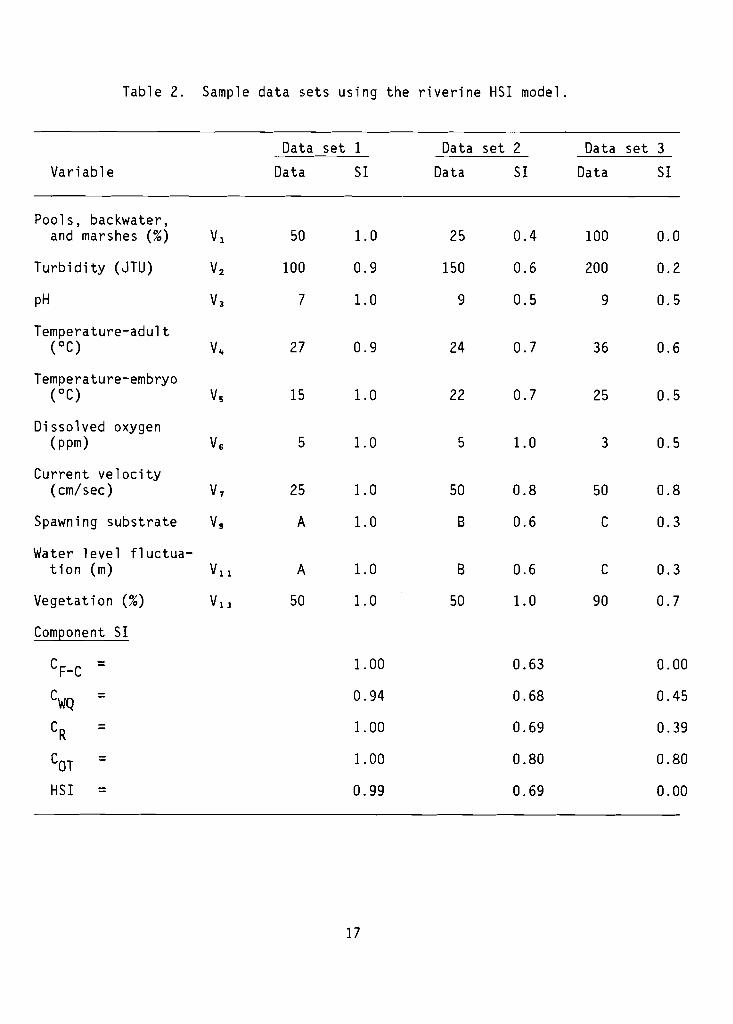
Table 2. Sample data sets using the riverine HS1 model.
Data set 1 Data set 2 Data set 3
Variable Data S1 Data S1 Data S1
Pools, backwater,and marshes (%) V1 50 1.0 25 0.4 100 0.0
Turbi dity (JTU) V2 100 0.9 150 0.6 200 0.2
pH V3 7 1.0 9 0.5 9 0.5
Temperature-adult(0C) V,. 27 0.9 24 0.7 36 0.6
Temperature-embryo(0C) Vs 15 1.0 22 0.7 25 0.5
Dissolved oxygen(ppm) V6 5 1.0 5 1.0 3 0.5
Current velocity(cm/sec) V7 25 1.0 50 0.8 50 0.8
Spawning substrate Vg A 1.0 B 0.6 C 0.3
Water level fluctua-tion (m) Vll A 1.0 B 0.6 C 0.3
Vegetation (%) V13 50 1.0 50 1.0 90 0.7
Component S1
CF-C = 1. 00 0.63 0.00
CWQ = 0.94 0.68 0.45
CR = 1. 00 0.69 0.39
COT = 1. 00 0.80 0.80
HSI = 0.99 0.69 0.00
17
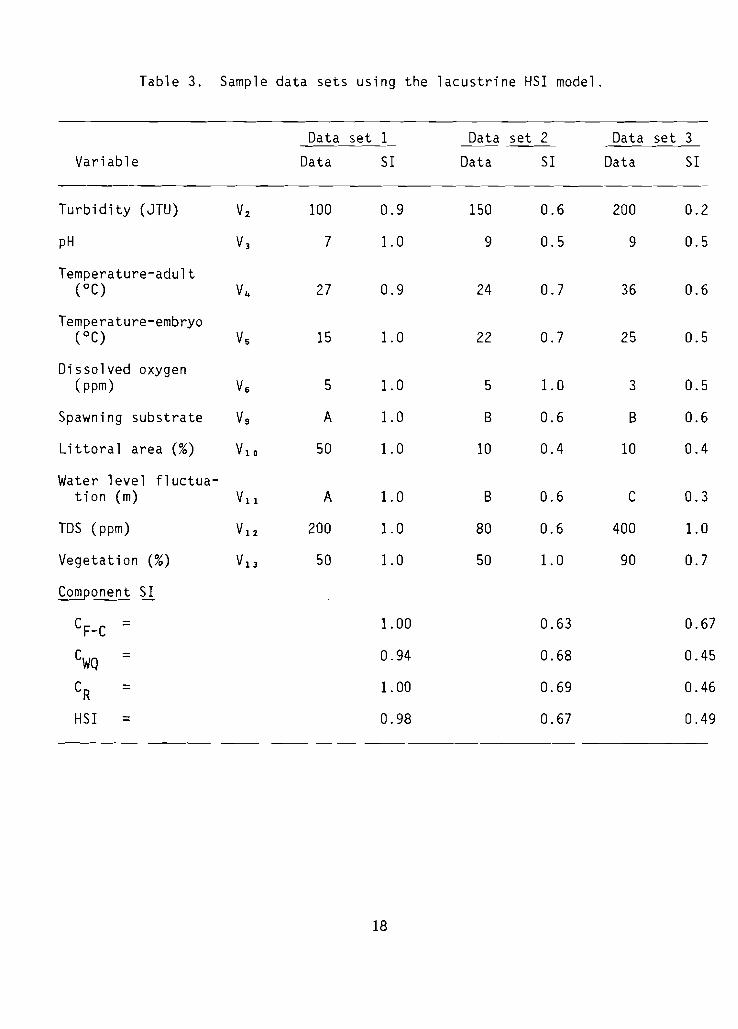
Table 3. Sample data sets using the lacustrine HS1 model.
Data set 1 Data set 2 Data set 3
Variable Data S1 Data S1 Data S1
Turbidity (JTU) Vz 100 0.9 150 0.6 200 0.2
pH V3 7 1.0 9 0.5 9 0.5
Temperature-adult(OC) V4 27 0.9 24 0.7 36 0.6
Temperature-embryo(OC) Vs 15 1.0 22 0.7 25 0.5
Dissolved oxygen(ppm) Vs 5 1.0 5 1.0 3 0.5
Spawning substrate V9 A 1.0 B 0.6 B 0.6
Littoral area (%) VlO 50 1.0 10 0.4 10 0.4
Water level fluctua-tion (m) Vll A 1.0 B 0.6 C 0.3
TDS (ppm) Va 200 1.0 80 0.6 400 1.0
Vegetation (%) V13 50 1.0 50 1.0 90 0.7
Component S1
CF-C = 1.00 0.63 0.67
CWQ = 0.94 0.68 0.45
CR = 1. 00 0.69 0.46
HS1 = 0.98 0.67 0.49
18
HSI number of above criteria met=.:..:....::.c..c:::....::....:.---=-...:.----'-c.:::....::.....:.....:..---:....~::....::....:.____'__'_..:.....;;.
4
If there is little or no vegetation present during spawning season, therewill probably be few fish present because vegetation is an important prerequisite for spawning success.
Model 2
Optimum lacustrine conditions consist of the following, assuming thatwater quality is not limiting: large reservoirs; warm, summer water temperatures (22-32° C); vegetated littoral zones; protected embayments; and optimumTDS levels.
Model 3
HSI number of above criteria met= .:..:....:-.:-"--'--'--c.:::....::..----'-~~--=--:.......:.....:..-"---'---:....:..:.-----'-~
5
Use the regression equation for predicting buffalo standing crops presented by Jenkins (1967). Convert estimates to an HSI by dividing by thehi ghest standi ng crop observed in the geographi ca 1 a rea where the model isapplied.
Model 4
Many factors can affect the carrying capacity of a given habitat includingthe variables presently in the HSI model and others not included (predation,competition, fishing mortality, barriers to migration, ice scour, or othercatastrophic events). If the model assumption that species population levelsare due primarily to habitat-related factors is violated, it can be inappropriate to use a HSI value as an index of carrying capacity of an area for thespecies and other model approaches should be considered. One approach thatcould be considered is to let the HSI value correspond to the lowest SI valuedetermined for anyone of the variables in the model (Inskip 1982). Thisapproach would avoid the use of equations.
REFERENCES
Beckman, L. G., and J. H. Elrod. 1971. Apparent abundance and distributionof young-of-the-year fi shes in Lake Oahe, 1965-69. Pages 333-347 inG. E. Hall (ed.). Reservoir fisheries and limnology. Am. Fish. So~Special Publ. 8.
19
Benson, N. G. 1973. Evaluating the effects of discharge rates, water levels,and peaking on fish populations in Missouri River main stem impoundments.Man-made lakes: Their problems and effects. Geophysical Monogr. Ser.17(683-689).
1980. Effects of post impoundment shore modifications on fishpopulations in Missouri River reservoirs. U.S. Dept. Int., Fish Wildl.Servo Res. Rep. 80. 32 pp.
Canfield, H. L. 1922. Care and feeding of buffalo fish in ponds. U.S. Bur.Fish., Econ. Circ. 56. 3 pp.
I
Committee on Water Quality Criteria. 1972. Water quality criteria, 1972. Areport of the Committee on Water Quality Criteria. Nat l . Acad. Sci.,Washington, DC. 594 pp.
Cowardin, L. M., V. Carter, F. C. Golet, and E. J. LaRoe. 1979. Classifica-tion of wetlands and deepwater habitats of the United States. U.S. Dept.Int., Fish. Wildl. Servo FWS/OBS-79/31. 103 pp.
Doudoroff, P., and M. Katz. 1950. Critical review of literature on thetoxicity of industrial wastes and their components to fish. I. Alkalies,acids, and inorganic gases. Sewage Industrial Wastes 22(11):1432-1458.
Elrod, J. H., and T. J. Hassler. 1971. Vital statistics of seven fish speciesin Lake Sharpe, South Dakota, 1964-1969. Am. Fish. Soc. Special Publ.8:27-40.
European Inland Fisheries Advisory Commission. 1969. Report on extreme pHvalues and inland fisheries. Water Res. 3(8):593-611.
Gammon, J. R. 1973. The effect of thermal input on the populations of fishand macroinvertebrates in the Wabash River. Purdue Univ. Water Resour.Res. Center, Lafayette, IN. Tech. Rep. 32. 106 pp.
Gassaway, R. 1970. Changes in the fish population in Lake Francis Case inSouth Dakota in the fi rst 16 years of impoundment. U. S. Bur. Sport Fi sh.Wildl., Tech. Pap. 56. Washington, DC.
Gerking, S. D. 1945. The distribution of the fishes of Indiana. Invest.Indiana Lakes and Streams 3:1-137.
Giudice, J. 1964. Production and comparative growth of three hybrids. Proc.Southeastern Assoc. Game and Fish Commissioners 18:512-517.
Harlan, J. R., and E. B. Speaker. 1969. Iowa fish and fishing. State ofIowa. Iowa Conserv. Comm. 366 pp.
Hollander, E. E. 1974. Effects of salinity on survival of buffalo fish,Ictiobus spp., eggs through yearlings. M.S. Thesis, Louisiana StateUni v., Baton Rouge. 22 pp.
20
Hollander, E. E., and J. W. Avault, Jr. 1975. Effects of salinity on survivalof buffalo fish eggs through yearlings. Prog. Fish-Cult. 39(1):47-51.
Hubbs, C. L., and K. F. Lagler. 1974. Fishes of the Great Lakes Region.Univ. Michigan Press, Ann Arbor. 213 pp.
Huntington, E. H., and A. W. Hill. 1956. Population study of fish in ElephantButte Lake, 1955. New Mexico Dept. Game Fish, Proj. F-ll-R-1 (Job B-1).60 pp.
Inskip, P. D. 1982. Habitat suitability index models: northern pike. U.S.Dept. Int., Fish Wildl. Servo FWS/OBS-82/10.17. 40 pp.
Jenkins, R. M.crop andReservoirGeorgia.
1967. The influence of some environmental factors on standingharvest of fishes in U.S. reservoirs. Pages 298-321 inFishery Resources Symposium, American Fisheries Society, Uni~
1976. Prediction of fish production in Oklahomareservoirs on the basis of environmental variables. Ann. Oklahoma Acad.Sci. 1976(5):11-20.
Johnson, D. W., and W. L. Minckley. 1969. Natural hybridization in buffalofishes, genus Ictiobus. Copeia 1969:198-200.
. 1972.---~1~97~2~(~1)~:12-17.
Variability in Arizona buffalofishes. Copeia
Johnson, R. P. 1963. Studies on the life history and e~ology of the bigmouthbuffalo, Ictiobus cyprinellus (Valenciennes). J. Fish. Res. Board Can.20(6):1397-1429.
Kallemeyn, L. W., and J. F. Novotny. 1977. Fish and fish food organisms invarious habitats of the Missouri River in South Dakota, Nebraska, andIowa. U.S. Fish Wildl. Serv., Office Biol. Serv., Columbia, MO.FWS/OBS-77/25. 100 pp.
Kozel, D. J., and J. C. Schmul bach , 1976. Utilization of marsh and sandbarhabitats by fishes in the unchannelized Missouri River. Proc. SouthDakota Acad. Sci. 55:177.
Lee, D. S., C. R. Gilbert, C. H. Hocutt, R. E. Jenkins, D. E. McAll ister, andJ. R. Stauffer, Jr. 1980. Atlas of North American freshwater fishes.North Carolina Biol. Survey Publ. 1980-12. 854 pp.
McComish, T. S. 1964. Food habits of bigmouth and smallmouth buffalo inLewis and Clark Lake and the Missouri River. M.S. Thesis, South DakotaState College, Brookings. 21 pp.
Minckley, W. L., J. E. Johnson, J. N. Rinne, and S. E. Willoughby. 1970.Foods of buffalofishes, genus Ictiobus, in central Arizona reservoirs.Trans. Am. Fish. Soc. 99(2):333-342.
21
Moen, T. E. 1954. Food of the bigmouth buffalo, Ictiobus cyprinellus(Valenciennes) in northwest Iowa lakes. Proc. Iowa Acad. Sci. 61:561-569.
Moyle, P. B. 1976. Inland fishes of California. Univ. California Press,Berkeley. 405 pp.
Muncy, R. J., G. J. Atchison, R. V. Bul kl ey , B. W. Menzel, L. G. Perry, and R.C. Summerfelt. 1979. Effects of suspended solids and sediment on reproduction and early life of warmwater fishes. U.S. Environmental ProtectionAgency 600/3-79-042. 110 pp.
Perry, W. G. 1976. Black and bigmouth buffalo spawn in brackish water ponds.Prog. Fish-Cult. 38(2):81.
Schmulbach, J. C., G. Gould, and C. L. Groen. 1975. Relative abundance anddistribution of fishes in the Missouri River, Gavins Point Dam to Rulo,Nebraska. Proc. South Dakota Acad. Sci. 54:194-222.
Scott, W. B., and E. J. Crossman. 1973. Freshwater fishes of Canada. Fish.Res. Board Can., Ottawa Bull. 184. 966 pp.
Stanley, J. G., and J. B. Jones. 1976. Feeding algae to fish. Aquaculture7(3):219-223.
Starostka, V. J., and R. L. Applegate. 1970. Food selectivity of bigmouthbuffalo, Ictiobus cyprinellus, in Lake Poinsett, South Dakota. Trans.Am. Fish. Soc. 99(3):571-576.
Stroud, R. H. 1967. Water quality criteria to protect aquatic life: Asummary. Am. Fish. Soc. Spec. Publ. 4:33-37.
Swingle, H. S. 1954. Experiments on commercial fish production in ponds.Proc. Annu. Conf. Southeastern Assoc. Game and Fish Commissioners. pp.69-74.
1957. Revised proceedings for commercial production of thebigmouth buffalo fish in ponds in the Southeast. Proc. Annu. Conf.Southeastern Assoc. Game and Fish Commissioners. pp. 162-165.
Tafanelli, R., P. E. Mauch, and G. Mensinger. 1970. Food habits of thebi gmouth and small mouth buffa 10 f r ojn four Oklahoma reservoi r s . Proc.Southeastern Assoc. Game and Fish Commissioners 24:649-658.
Trautman, M. D. 1957. The fishes of Ohio. Ohio State Univ. Press, Columbus.683 pp.
U.S. Environmental Protection Agency. 1976. Quality criteria for water.U.S. Environmental Protection Agency. 256 pp.
Walburg, C. H., and W. R. Nelson. 1966. Carp, river carpsucker, smallmouthbuffalo, and bigmouth buffalo in Lewis and Clark Lake, Missouri River.U.S. Dept. Int., Fish. Wildl. Servo Res. Rep. 69. 30 pp.
22

Whitaker, J. 0., Jr. 1974. Foods of some fishes from the White River atPetersburg, Indiana. Proc. Indiana Acad. Sci. 84:491-499.
Willis, D. W. 1978. Investigations of population structure and relativeabundance of buffalo fishes, Ictiobus spp., in Lake Sakakawea, NorthDakota. M.S. Thesis, Univ. of North Dakota, Grand Forks. 39 pp.
Willis, D. W., and J. B. Owen. 1978. Decline of year class strength ofbuffalo fishes in Lake Sakakawea, North Dakota. Prairie Nat. 10(3):89-91.
Zittel, A. E. 1978. An investigation of the swimming performance of eightspecies of fish endemic to the middle Missouri River. M.S. Thesis, Univ.South Dakota, Vermillion. 97 pp.
23
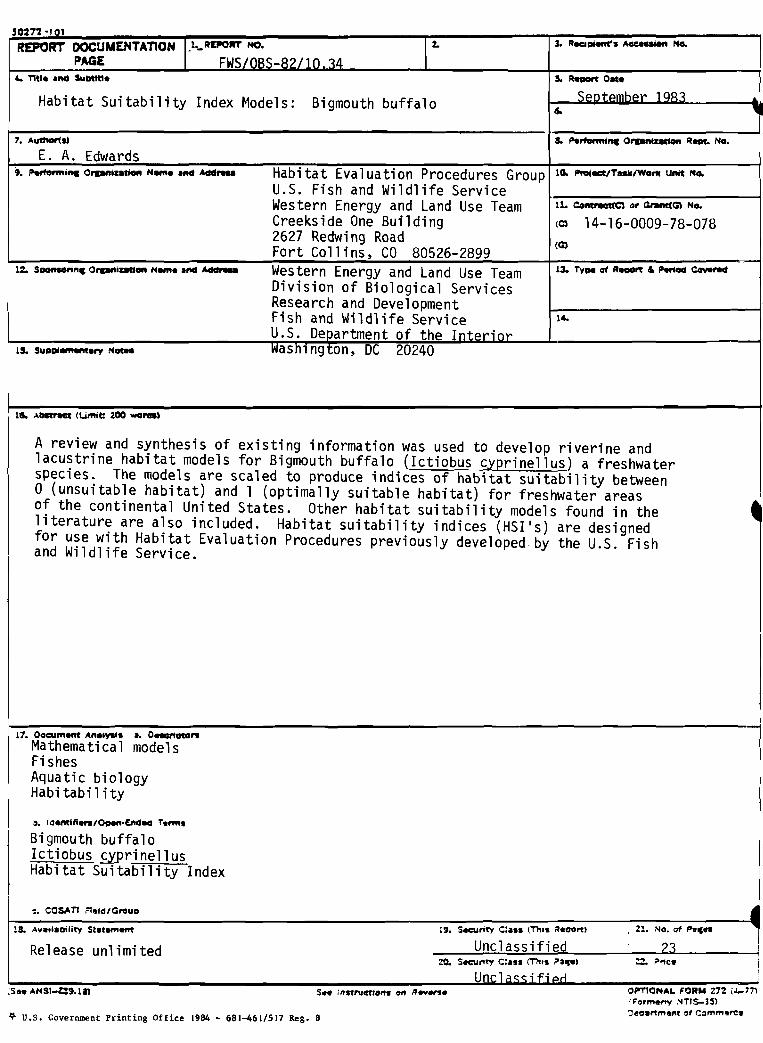
30272 -'0'ffEPORT DOCUMENTATION l.l._RIPO,", NO.
PAGE FWS/OBS-R?/10 14
Habitat Suitability Index Models: Bigmouth buffalo
7. A.,a,or(s)
E. A. EdwardsHabitat Evaluation Procedures GroupU.S. Fish and Wildlife ServiceWestern Energy and Land Use TeamCreekside One Building2627 Redwing RoadFort Collins t CO 80526-2899Western Energy and Land Use TeamDivision of Biological ServicesResearch and DevelopmentFish and Wildlife ServiceU.S. Deoartment of the Intpr;nrWashlngton t DC 20240
10. PfoajKt/T••II/Wor1l Unit No.
11. Conbwc:Uc) or ~t(G) No.
(C) 14-16-0009-78-078
A review and synthesis of existing information was used to develop riverine andlacustrine habitat models for Bigmouth buffalo (Ictiobus cyprinellus) a freshwaterspecies. The models are scaled to produce indices of habitat suitability betweeno (unsuitable habitat) and 1 (optimally suitable habitat) for freshwater areasof the continental United States. Other habitat suitability models found in theliterature are also included. Habitat suitability indices (HSI's) are designedfor use with Habitat Evaluation Procedures previously developed by the U.S. Fishand Wildlife Service.
17. OocumMt "nalysi. I. OftCnlmS"Mathematical modelsFishesAquatic biologyHabitability
e, Idemlflers/Ooen.£ftaao r......
Bigmouth buffaloIctiobus cyprinellusHabitat Suitability Index
e, COSAT1 Fleld/GtOuD
18. A"a.'.Diiity St.t....Mt
Release unlimited
~ U.S. Government Printing Office 1984 - 681-461/517 Reg. 8
Ii. Security C:us ('This ~.Dortl
Unclassified::g, SecurIty Clus (This "'tiel
Unr:l;,cci-fial'l
. %1. No. ot P8C"
23
OPTIONAL FORM %72 (.1,-17)i·For",.~ :-11'1$-35)
=e"artme"f 0' Commere.
•
••• ..__ ....J~.
' .'· 0 ,,-
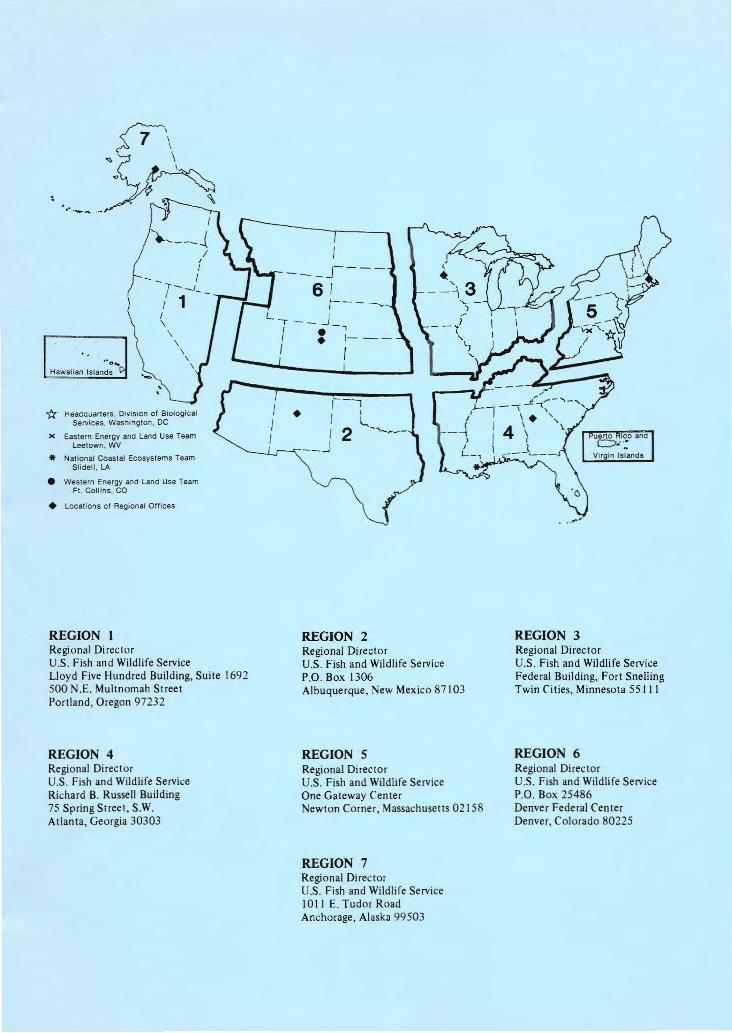
Hawaiian Islands (>
-(:( Headq uarters . Division of BiologicalServices, Wasnington, DC
x Eastern Energy anO Land Use TeamLeetown , WV
* Nationa l Coastal Ecosystems TeamSli dell , LA
• Western Energy and Land Use TeamFt. Coll ins . CO
• Locat ions of Regional Off ices
REGION 1Regional DirectorU,S. Fish and Wildlife ServiceLloyd Five Hundred Building, Suite 1692500 N.E. Multnomah StreetPortland , Oregon 97232
REGION 4Regional DirectorU.S. Fish and Wildlife ServiceRichard B. Russell Building75 Spring Street , S.W.Atlanta, Georgia 30303
IJ- - - ----
6 1r-- - -~-
L, JI : - ~- --I I
1- - -'I Il,_I 2 ,,-~--
-_.J
REGION 2Regional DirectorU.S. Fish and Wildlife ServiceP.O. Box 1306Albuquerque, New Mexico 87 103
REGION 5Regional DirectorU.S. Fish and Wildlife ServiceOne Gateway Cente rNewton Corner, Massachusetts 02158
REGION 7Regional DirectorU.S. Fish and Wildlife ServicelOll E. Tudor RoadAnchorage, Alaska 99503
- ..~,.
REGION 3Regional DirectorU.S. Fish and WildlifeServiceFederal Building, Fort SnellingTwin Cities, Minnesota 551 J I
REGION 6Regional DirectorU.S. Fish and Wildli fe ServiceP.O. Box 25486Denver Federal CenterDenver, Colorado 8022 5
u.s.FISH ..WILDLIFE
f>ERVICE
DEPARTMENT OF THE INTERIOR hi?]u.s.FISH ANDWILDLIFESERVICE ~
"'-r rw T " "
As the Nat ion's pri ncipal conservation agency, the Department of the Interior has responsibility for most of our ,nationally owned public lands and natural resources . This includesfostering the wisest use of our land and water resources, protecting our fish and wildlife,preserving th & environmental and cultural values of our national parks and historical places,and providing for the enjoyment of life through outdoor recreation. The Department assesses our energy and mineral resources and works to assure that t heir development is inthe best interests of all our people. The Department also has a major respons ibility forAmerican Indian reservation communit ies and for people who live in island territories underU.S. adm inist ration.