Embed Size (px)
Citation preview
.
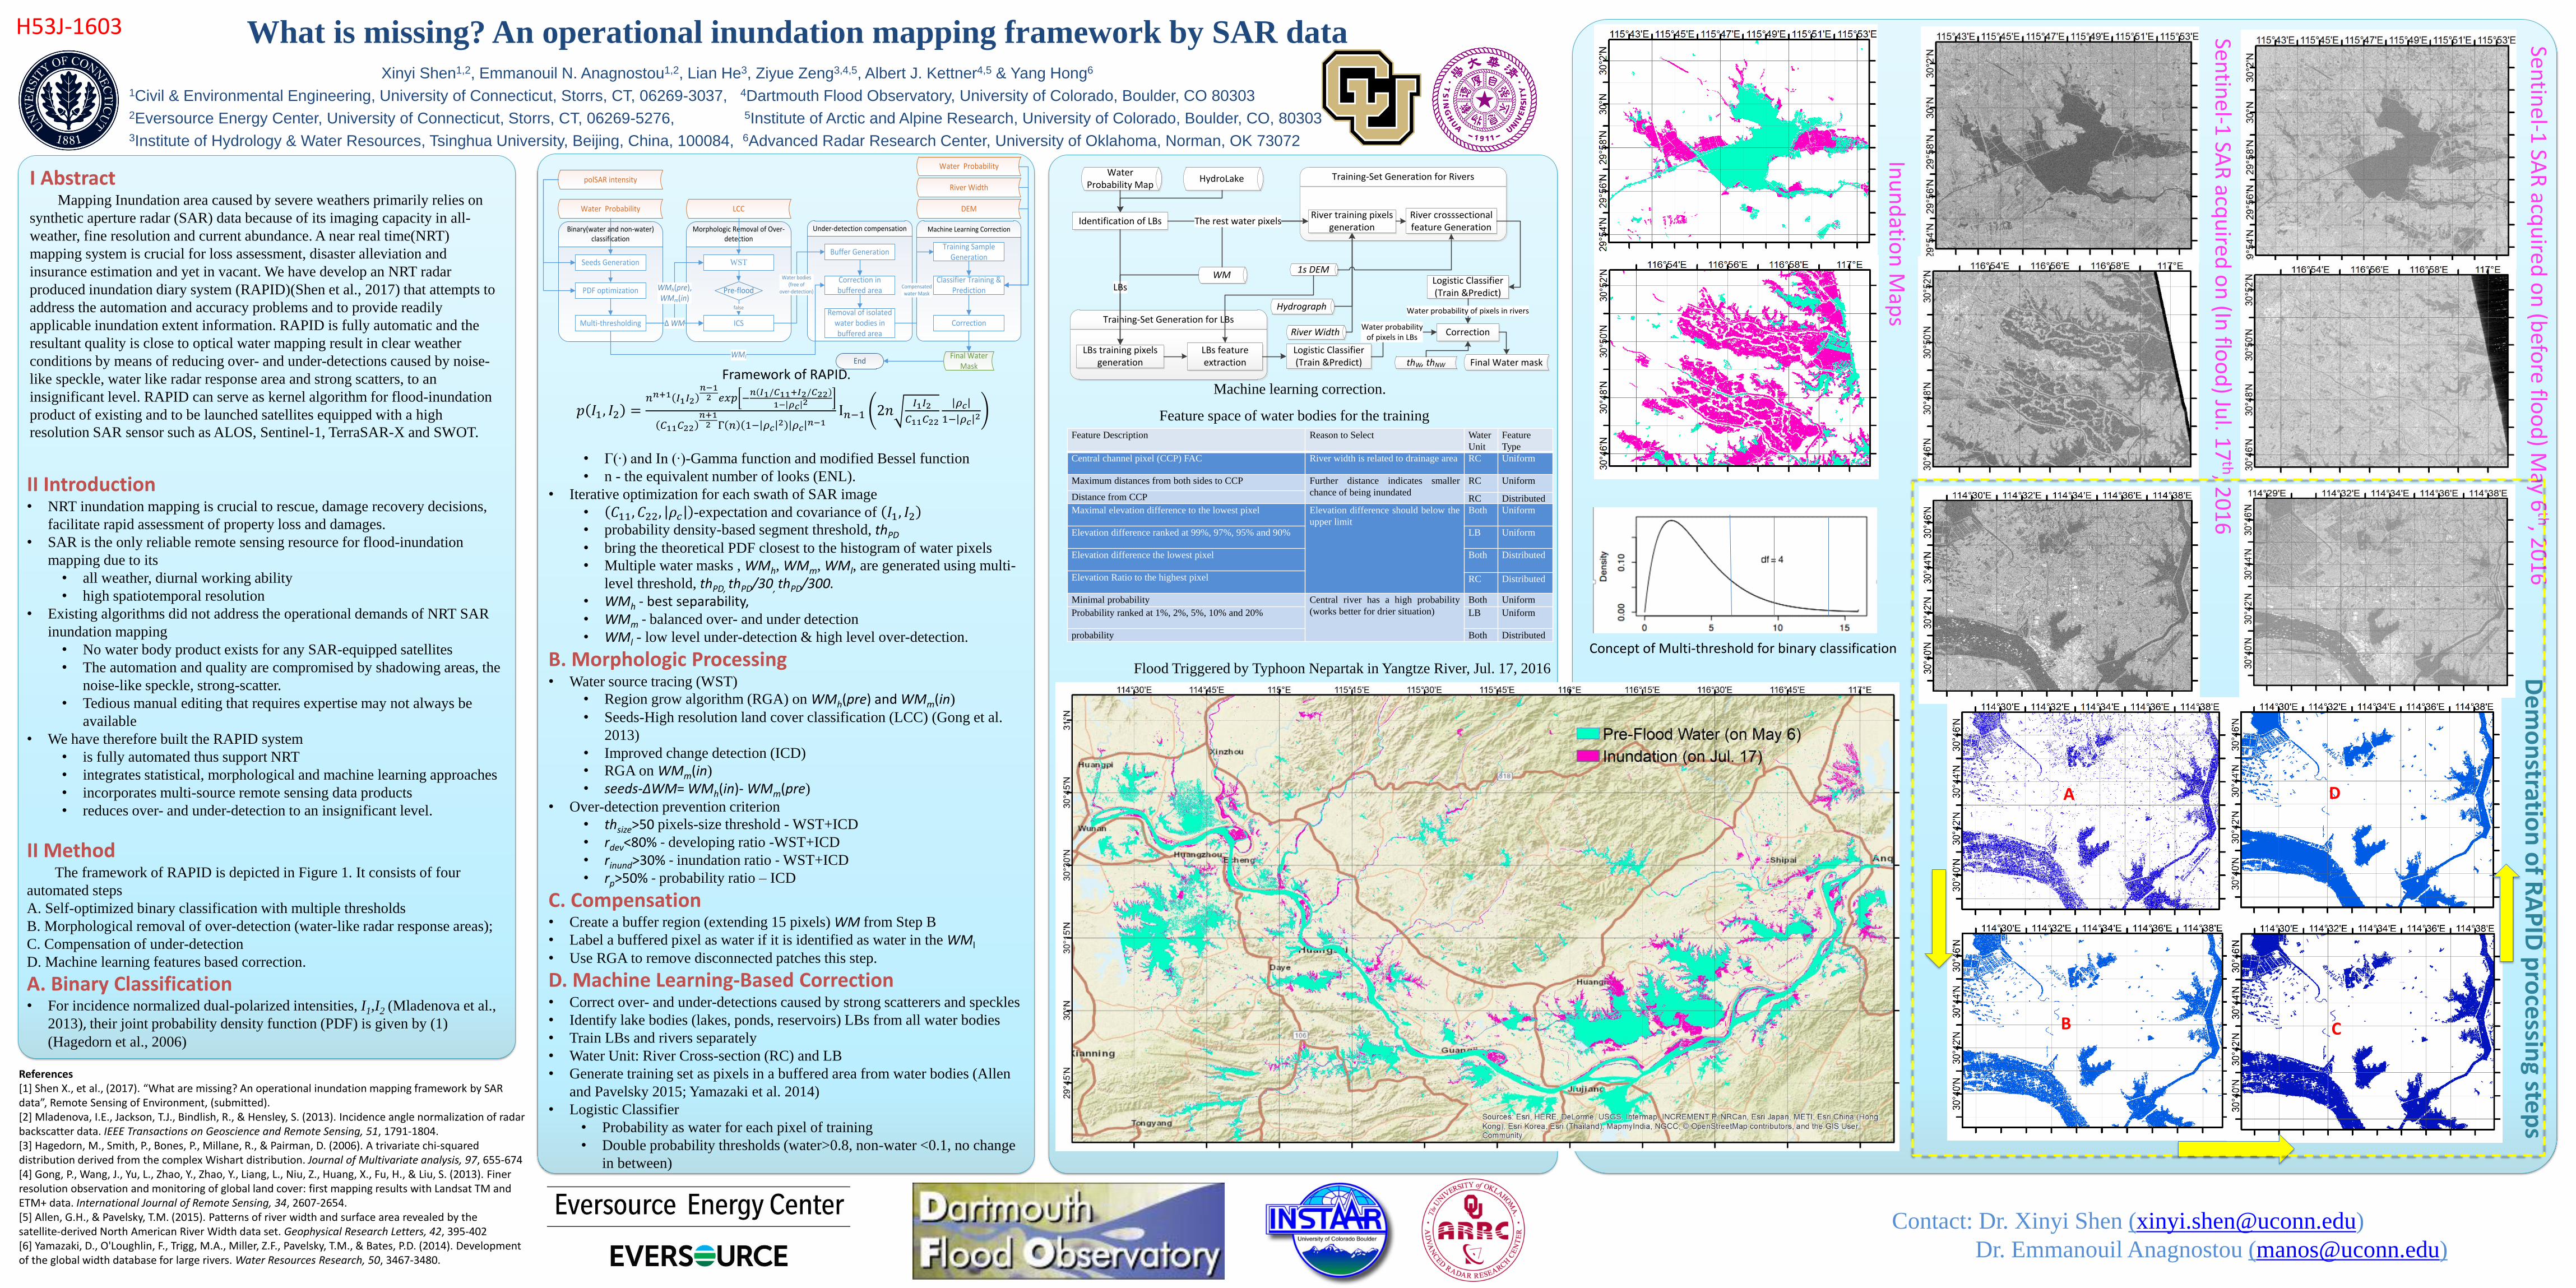
I AbstractMapping Inundation area caused by severe weathers primarily relies on
synthetic aperture radar (SAR) data because of its imaging capacity in all-
weather, fine resolution and current abundance. A near real time(NRT)
mapping system is crucial for loss assessment, disaster alleviation and
insurance estimation and yet in vacant. We have develop an NRT radar
produced inundation diary system (RAPID)(Shen et al., 2017) that attempts to
address the automation and accuracy problems and to provide readily
applicable inundation extent information. RAPID is fully automatic and the
resultant quality is close to optical water mapping result in clear weather
conditions by means of reducing over- and under-detections caused by noise-
like speckle, water like radar response area and strong scatters, to an
insignificant level. RAPID can serve as kernel algorithm for flood-inundation
product of existing and to be launched satellites equipped with a high
resolution SAR sensor such as ALOS, Sentinel-1, TerraSAR-X and SWOT.
What is missing? An operational inundation mapping framework by SAR dataXinyi Shen1,2, Emmanouil N. Anagnostou1,2, Lian He3, Ziyue Zeng3,4,5, Albert J. Kettner4,5 & Yang Hong6
1Civil & Environmental Engineering, University of Connecticut, Storrs, CT, 06269-3037, 4Dartmouth Flood Observatory, University of Colorado, Boulder, CO 803032Eversource Energy Center, University of Connecticut, Storrs, CT, 06269-5276, 5Institute of Arctic and Alpine Research, University of Colorado, Boulder, CO, 803033Institute of Hydrology & Water Resources, Tsinghua University, Beijing, China, 100084, 6Advanced Radar Research Center, University of Oklahoma, Norman, OK 73072
H53J-1603
References[1] Shen X., et al., (2017). “What are missing? An operational inundation mapping framework by SAR data”, Remote Sensing of Environment, (submitted).[2] Mladenova, I.E., Jackson, T.J., Bindlish, R., & Hensley, S. (2013). Incidence angle normalization of radar backscatter data. IEEE Transactions on Geoscience and Remote Sensing, 51, 1791-1804.[3] Hagedorn, M., Smith, P., Bones, P., Millane, R., & Pairman, D. (2006). A trivariate chi-squared distribution derived from the complex Wishart distribution. Journal of Multivariate analysis, 97, 655-674[4] Gong, P., Wang, J., Yu, L., Zhao, Y., Zhao, Y., Liang, L., Niu, Z., Huang, X., Fu, H., & Liu, S. (2013). Finer resolution observation and monitoring of global land cover: first mapping results with Landsat TM and ETM+ data. International Journal of Remote Sensing, 34, 2607-2654.[5] Allen, G.H., & Pavelsky, T.M. (2015). Patterns of river width and surface area revealed by the satellite‐derived North American River Width data set. Geophysical Research Letters, 42, 395-402[6] Yamazaki, D., O'Loughlin, F., Trigg, M.A., Miller, Z.F., Pavelsky, T.M., & Bates, P.D. (2014). Development of the global width database for large rivers. Water Resources Research, 50, 3467-3480.
Contact: Dr. Xinyi Shen ([email protected])
Dr. Emmanouil Anagnostou ([email protected])
II Introduction• NRT inundation mapping is crucial to rescue, damage recovery decisions,
facilitate rapid assessment of property loss and damages.
• SAR is the only reliable remote sensing resource for flood-inundation
mapping due to its
• all weather, diurnal working ability
• high spatiotemporal resolution
• Existing algorithms did not address the operational demands of NRT SAR
inundation mapping
• No water body product exists for any SAR-equipped satellites
• The automation and quality are compromised by shadowing areas, the
noise-like speckle, strong-scatter.
• Tedious manual editing that requires expertise may not always be
available
• We have therefore built the RAPID system
• is fully automated thus support NRT
• integrates statistical, morphological and machine learning approaches
• incorporates multi-source remote sensing data products
• reduces over- and under-detection to an insignificant level.
II MethodThe framework of RAPID is depicted in Figure 1. It consists of four
automated steps
A. Self-optimized binary classification with multiple thresholds
B. Morphological removal of over-detection (water-like radar response areas);
C. Compensation of under-detection
D. Machine learning features based correction.
A. Binary Classification• For incidence normalized dual-polarized intensities, I1,I2 (Mladenova et al.,
2013), their joint probability density function (PDF) is given by (1)
(Hagedorn et al., 2006)
Framework of RAPID.
𝑝 𝐼1, 𝐼2 =𝑛𝑛+1 𝐼1𝐼2
𝑛−12 𝑒𝑥𝑝 −
𝑛 𝐼1/𝐶11+𝐼2/𝐶221− 𝜌𝑐 2
𝐶11𝐶22𝑛+12 Γ 𝑛 1− 𝜌𝑐
2 𝜌𝑐𝑛−1
I𝑛−1 2𝑛𝐼1𝐼2
𝐶11𝐶22
𝜌𝑐
1− 𝜌𝑐2
• Γ(∙) and In (∙)-Gamma function and modified Bessel function
• n - the equivalent number of looks (ENL).
• Iterative optimization for each swath of SAR image
• 𝐶11, 𝐶22, 𝜌𝑐 -expectation and covariance of 𝐼1, 𝐼2• probability density-based segment threshold, thPD
• bring the theoretical PDF closest to the histogram of water pixels
• Multiple water masks , WMh, WMm, WMl, are generated using multi-
level threshold, thPD, thPD/30, thPD/300.• WMh - best separability, • WMm - balanced over- and under detection
• WMl - low level under-detection & high level over-detection.
B. Morphologic Processing• Water source tracing (WST)
• Region grow algorithm (RGA) on WMh(pre) and WMm(in)
• Seeds-High resolution land cover classification (LCC) (Gong et al.
2013)
• Improved change detection (ICD)
• RGA on WMm(in)
• seeds-ΔWM= WMh(in)- WMm(pre)
• Over-detection prevention criterion
• thsize>50 pixels-size threshold - WST+ICD
• rdev<80% - developing ratio -WST+ICD
• rinund>30% - inundation ratio - WST+ICD
• rp>50% - probability ratio – ICD
C. Compensation• Create a buffer region (extending 15 pixels) WM from Step B
• Label a buffered pixel as water if it is identified as water in the WMl
• Use RGA to remove disconnected patches this step.
D. Machine Learning-Based Correction• Correct over- and under-detections caused by strong scatterers and speckles
• Identify lake bodies (lakes, ponds, reservoirs) LBs from all water bodies
• Train LBs and rivers separately
• Water Unit: River Cross-section (RC) and LB
• Generate training set as pixels in a buffered area from water bodies (Allen
and Pavelsky 2015; Yamazaki et al. 2014)
• Logistic Classifier
• Probability as water for each pixel of training
• Double probability thresholds (water>0.8, non-water <0.1, no change
in between)
Under-detection compensationBinary(water and non-water) classification
Seeds Generation
polSAR intensity
Water Probability
PDF optimization
Morphologic Removal of Over-detection
LCC
WST
ICS
Machine Learning Correction
WMh(pre),WMm(in)
Training Sample Generation
Water bodies(free of
over-detection)
Classifier Training & Prediction
Correction
DEM
River Width
Final Water Mask
End
Buffer Generation
Correction in buffered area
Multi-thresholdingRemoval of isolated
water bodies in buffered area
WMl
Compensated water Mask
Water Probability
false
Pre-flood
Δ WM Training-Set Generation for LBs
Identification of LBs
Water Probability Map
WM
LBs training pixels generation
LBs feature extraction
Hydrograph
River Width
LBs
Training-Set Generation for Rivers
River training pixels generation
River crosssectional feature Generation
The rest water pixels
1s DEMLogistic Classifier(Train &Predict)
Logistic Classifier(Train &Predict)
Correction
thW, thNW
Water probability of pixels in LBs
Water probability of pixels in rivers
Final Water mask
HydroLake
Machine learning correction.
Feature Description Reason to Select Water
Unit
Feature
Type
Central channel pixel (CCP) FAC River width is related to drainage area RC Uniform
Maximum distances from both sides to CCP Further distance indicates smaller
chance of being inundated
RC Uniform
Distance from CCP RC Distributed
Maximal elevation difference to the lowest pixel Elevation difference should below the
upper limit
Both Uniform
Elevation difference ranked at 99%, 97%, 95% and 90% LB Uniform
Elevation difference the lowest pixel Both Distributed
Elevation Ratio to the highest pixel RC Distributed
Minimal probability Central river has a high probability
(works better for drier situation)
Both Uniform
Probability ranked at 1%, 2%, 5%, 10% and 20% LB Uniform
probability Both Distributed
Feature space of water bodies for the training
Sentin
el-1 SA
R acq
uired
on
(In flo
od
) Jul. 1
7th, 2
01
6
A
B C
D
Flood Triggered by Typhoon Nepartak in Yangtze River, Jul. 17, 2016
Sentin
el-1 SA
R acq
uired
on
(befo
re floo
d) M
ay 6th, 2
01
6
Inu
nd
ation
Map
s
De
mo
nstratio
n o
f RA
PID
pro
cessin
g step
s
Concept of Multi-threshold for binary classification