Embed Size (px)
Citation preview

March 6th , 2015 11:30 am-1:00 PM ET
H2S: Where Did It Come From, Where Should It Go?
Webinar on H2S Removal Technologies

Special Thanks

Quick Notes • Two Audio Options: Streaming Audio
and Dial-In.
1. Streaming Audio/Computer Speakers (Default)
2. Dial-In: Use the Audio Panel (right side of screen) to see dial-in instructions. Call-in separately from your telephone.
• Ask questions using the Questions Panel on the right side of your screen.
• The recording of the webinar and the slides will be available after the event. Registrants will be notified by email.

American Biogas Council: The Voice of the US Biogas Industry
The only U.S. organization representing the biogas and anaerobic digestion industry
Over 220 Organizations from the U.S., Germany, Italy, Canada, Sweden, Belgium and the UK
All Industry Sectors Represented:
project developers/owners
anaerobic digestion designers
equipment dealers
waste managers
waste water companies
farms
utilities
consultants and EPCs
financiers, accountants, lawyers and engineers
Non-profits, universities and government agencies
Join Us! www.AmericanBiogasCouncil.org OR [email protected] OR 202.640.6595
0
50
100
150
200
250
2010 2011 2012 2013
ABC Membership
Organizations
4
2014

239
on Farm (Dairy AND Swine)
1,241
Wastewater (860 using their biogas)
636
at Landfills
2,000+ Operational
Biogas
Systems
11,000+ Potential
Biogas
Systems
8,002
on Farm (Dairy AND Swine)
2,400
Wastewater (incl. 381 making biogas but not using it)
450
at Landfills
U.S. Biogas Market – Current and Potential

Presenters
Moderator: Sean Mezei, President, Dekany Consulting
Eugenio Giraldo, Chief Technology Officer, Natural Systems Utilities
Tom Jones, VP of Business Development, MV Technologies
Tim Robison, President, Clean Methane Systems

Agenda 1. Introduction
- Sean Mezei, Dekany Consulting
3. H2S Formation with AD Systems
- Eugenio Giraldo, Natural Systems Utilities
4. H2S Removal Technologies – Selection Criteria and Pros/Cons of Main Technology Types
- Tom Jones, MV Technologies
5. H2S Removal Economics
- Tim Robinson, Clean Methane Systems
6. Audience Q&A

Moderator: Sean Mezei President, Dekany Consulting Director, Business Development Carbotech (part of the Viessmann Group) Co-Chair, ABC RNG Working Group
Today’s Presentations:
1. H2S Formation Science
2. H2S Removal Systems
3. H2S Removal Economics
4. Questions and Answers

Agenda 1. Introduction
- Sean Mezei, Dekany Consulting
3. H2S Formation with AD Systems
- Eugenio Giraldo, Natural Systems Utilities
4. H2S Removal Technologies – Selection Criteria and Pros/Cons of Main Technology Types
- Tom Jones, MV Technologies
5. H2S Removal Economics
- Tim Robinson, Clean Methane Systems
6. Audience Q&A

Leader in Distributed Wastewater Systems
Hydrogen Sulfide in Anaerobic Digesters – An Introduction
Eugenio Giraldo, Ph.D. Chief Technology Officer
March 6, 2015

3/6/2015 Slide: 11
Contents
• Introduction • Sulfur Cycle
• Significance in AD
• Sulfate Reduction and Methanogenesis
• Sulfide effects • Toxicity
• Corrosion
• Odor
• Sulfur Chemistry and In-Digester Control • Acid Base
• Precipitation
• Stripping
• Oxidation
• SRB inhibition

3/6/2015 Slide: 12
Biogeochemical Sulfur Cycle

3/6/2015 Slide: 13
Sulfate Reduction and Methanogenesis
Organic Macromolecules
Monomers (Sugars, Aminoacids,
Long chain fatty Acids)
Fermentation Products ( Ethanol, Butyrate, Propionate)
H2 and CO2 Acetate
CH4 and CO2
Hydrolysis
Fermentation
Acetogenesis
Methanogenesis SO4
=
H2S
Sulfate Reduction
H2S
SO4=
Sulfate Reduction
SO4=
H2S
Sulfate Reduction
Sulfate Reduction:
• Reduces methane production
• Creates Hydrogen Sulfide instead
• SRB outcompete methanogens

3/6/2015 Slide: 14
Odorous Compounds In Organics Management
Compound Name
Recognition
Threshold
parts per
million Odor Description
Allyl mercaptan 0.0015 Disagreeable, garlic
Ammonia 37 Pungent, irritating
Amyl mercaptan ---- Unpleasant, putrid
Diisopropyl amine 0.38 Fishy
Dimethyl amine ---- Putrid, fishy
Ethyl amine 1.7 Ammonia like
Ethyl mercaptan 0.001 Decayed cabbage
Hydrogen sulfide 0.0047 Rotten eggs
Indole ---- Fecal, nauseating
Methyl amine ---- Putrid, fishy
Methyl mercaptan 0.001 Rotten cabbage
From Table 2.1, Odor Control in Wastewater Treatment Plants ,
1995, WEF & American Society of Civil Engineers
• Sulfur Based
– Hydrogen Sulfide
– Sulfur Volatile Organic
Compound -SVOC
• Mercaptans, MM
• Dimethyl Sulfide, DMS
• Dimethyl Disulfide, DMDS
• Nitrogen Based
– Ammonia
– Amines

3/6/2015 Slide: 15
Hydrogen Sulfide Toxicity and Exposure
• Regulated by OSHA and NIOSH
• 8 hour - Permissible Exposure
Limit (PEL-TWA = 10 ppm)
• PEL short term (PEL-STEL = 15
ppm)
• NIOSH: 300 ppm immediately
dangerous to life

3/6/2015 Slide: 16
Hydrogen Sulfide Induced Corrosion
• Concrete Corrosion
– Sulfuric Acid reacts with concrete
– Formation of Gypsum
• Metal Corrosion – Pitting, stress cracking, embrittlement
– Rebars, Electric Equipment, pumps, valves
Concrete Corrosion Metal Corrosion

3/6/2015 Slide: 17
Sulfur Transformations in an Anaerobic Digester
SO4 =
H2S
S =
Metal e.g. Fe
HS-
MeS (solid)
H2S
Acid e.g. VFA
Organic Matter
So or SO4
=
O2
SVOC e.g.
DMS, MM

3/6/2015 Slide: 18
More H2S at low pH and low temperature
H2S = HS- + Acid e.g VFA HS- = H2S + Base e.g Mg(OH)2

3/6/2015 Slide: 19
pH adjustment for H2S control
• Works well. See graph on
the left
• Increases soluble sulfide
– Odors in effluent
– COD of effluent
• Need to check for:
– High pH
– Hydrogen Sulfide toxicity
McFarland and Jewell – 1989 – Water Research

3/6/2015 Slide: 20
Hydrogen Sulfide Toxicity is pH dependent
• Methanogens are
affected (See Graph on
the left)
– Type of reactor makes a
difference
– Industrial Wastewater
Reactors e.g. UASB are
more resilient than slurry
digesters (e.g. sludge)
– Slurry digester are affected
at concentration higher
than 200 mg/L dissolved
Sulfide
– UASB type show slight
inhibition at that level Koster et al., 1986, Water Research

3/6/2015 Slide: 21
Sequestering Sulfides with Metal Salts
• Metal Sulfides have low solubility e.g. Iron Sulfide
• Iron Salt addition works well e.g FeCl2 10-100 lb/ton TS
• Iron has a complex chemistry with multiple competing reactions – Iron Carbonate
– Iron Phosphate –Vivianite – “Blue Scale” (Location of addition)

3/6/2015 Slide: 22
Example of Iron Salt Addition
• 90% removal using 2 lb
iron per lb S-SO4
• Higher dosages reduce
dissolved sulfides
McFarland and Jewell – 1989 – Water Research

3/6/2015 Slide: 23
SCOV generation
• Important for Dewatering and Storage Odor Generation and control
• Reactive Proteins
• Sulfur containing aminoacids: – Methionine
– Cysteine
• Methanogens can use methylated sulfur compounds
WERF - 2007
Du and Parker – 2012– Water Research

3/6/2015 Slide: 24
Sulfide Oxidation – Chemical - Biological
• Reverse of sulfate
reduction
• Sulfide oxidation to
sulfate or elemental sulfur
• Can be induced in the
headspace
– Risk of explosive
conditions 5-15% methane
in air
– Problems with N2 and
Oxygen for CNG

3/6/2015 Slide: 25
Summary
• Sulfur compounds are intimately linked to Anaerobic Digestion. Key species are Hydrogen Sulfide, Sulfate, Elemental Sulfur and SVOCs
• Reduced sulfur compounds in biogas are associated to Odor, Toxicity and Corrosion
• There is a complex set of reactions, biological, chemical and physical that control emissions and impacts. Understanding of the fundamentals is the basis of effective control.
• There are numerous alternatives to address sulfur compounds problems in AD

Leader in Distributed Wastewater Systems
Thank you for your attention! [email protected]
March 6, 2015

Agenda 1. Introduction
- Sean Mezei, Dekany Consulting
3. H2S Formation with AD Systems
- Eugenio Giraldo, Natural Systems Utilities
4. H2S Removal Technologies – Selection Criteria and Pros/Cons of Main Technology Types
- Tom Jones, MV Technologies
5. H2S Removal Economics
- Tim Robinson, Clean Methane Systems
6. Audience Q&A
H2S Management for Biogas
Presented By: Tom Jones
V.P. of Business Development

H2S Management Decision Process
Frame the Treatment Objective
Understand Available Options
Determine Which Options
Meet Your Objectives
Compare Total Cost of
Ownership
• It is important to understand clearly your primary objective in removing H2S from your biogas stream.• There are many ways to remove H2S from a gas stream. Fortunately (or not), only a handful really
apply to a typical biogas application.• Based on the end-use and site-specific conditions, determine which options will meet your objectives.• Once you have determined the technologies that suit your objectives, use a structured cost comparison
approach to evaluate available technologies and make your decision.

STEP 1: Frame the Treatment Objective
Typical Decision Drivers Include:
• General System Maintenance Cost Reduction – Engine or Direct Use• Engine/Process Equipment Warranty or Performance Limitations• Air Quality Control Limits on Emissions• Pipeline/CNG Processing Limitations
These clearly are not mutually exclusive goals, but the range of available technologies for H2S removal includes options that meet
some of these objectives “better” than others, or in some cases, not at all.
Pipeline/CNG
Specifications
Maintenance
Cost Reduction
Warranty/Performance
Limitations
Air Quality
Emissions Limits
Increasing Degree of Difficulty

STEP 1: Frame the Treatment Objective
The cost per pound of H2S removed is a critical metric so it is important to develop an understanding of the amount of H2S generated under certain “typical” biogas flow and concentration combinations.
Flow Rate(SCFM)
H2S Reduction (PPM)
Annual H2S Removed
(LBS)
100
1,000 5,050
2,000 10,100
3,000 15,150
200
1,000 10,100
2,000 20,200
3,000 30,300
400
1,000 20,200
2,000 40,400
3,000 60,600
* Linear interpolation/extrapolation can be used to extend this table
http://www.mvseer.com/index.php/solutions/h2s-plus-calculator/index.html
QUICK CALCULATION FOR ANNUAL POUNDS OF H2S

STEP 2: Understand Your Options
In this presentation, we discuss the following technologies, and how they do or do notsupport the H2S removal objectives shown earlier and offer suggestions on how to makeyour final selection:
• Air Injection into the Digester Headspace – Bacterial action converts H2S to H2O+S• Addition of Ferric/Ferrous Chloride into the digester – Iron sulfide forms directly in digester• Activated Carbon Filtration – Captures the H2S; impregnated versions: chemical reactions• BioScrubber/BioTrickling Filters – Bacteria digest H2S to produce SO4+S• Dry Scrubbers – expendable iron-oxide coated media reacts with/neutralizes H2S
NOTE: Those with very large quantity H2S removal requirements should at least look at the range ofchemical and redox offerings, as well as combinations of two technologies such as biological scrubberwith dry scrubber “polisher”.

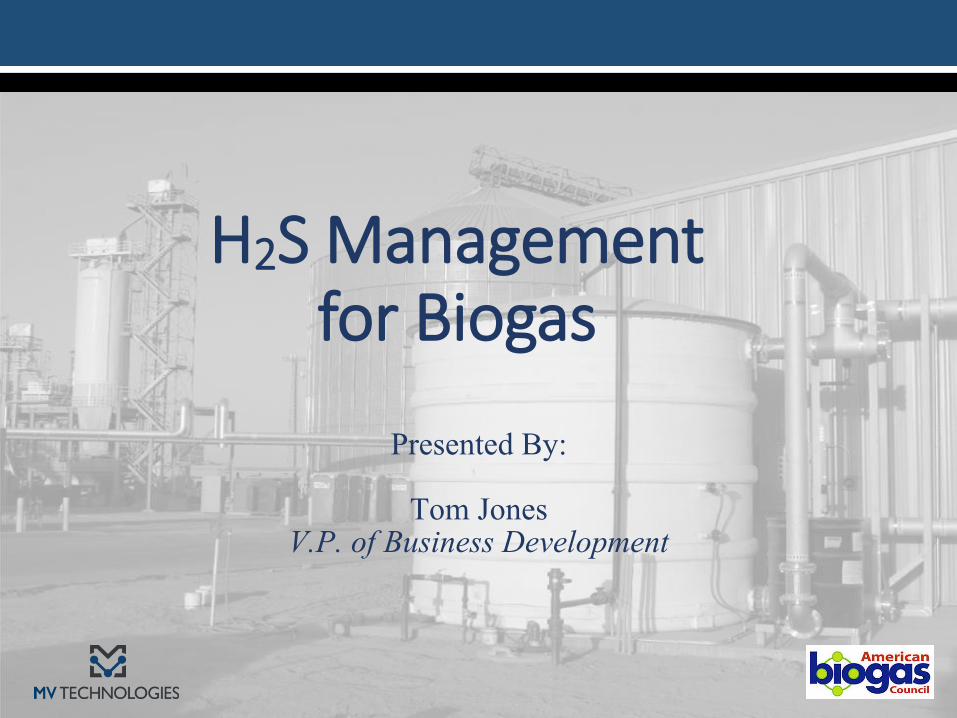
STEP 3: Consider the Options that Meet Your Objectives
General System Maintenance Cost Reduction– Engine or Direct Use
AIR INJECTION
Variable in removal effectiveness
“Control” to a target outlet objective is
challenging
Sulfur may end up in gas piping and create
clogging
May create engine fuel/air mix ratio
issues
FERRIC CHLORIDE
Varies in removal effectiveness but
works in this application
“Control” to a target outlet objective is
challenging
“Salt” buildup in digestate may have
impact on land-application
CAPEX varies from low-moderate. High OPEX per lb. of H2S removed. $13/#H2S
CARBON FILTRATION
Highly effective removal
Low CAPEX but high OPEX per lb. of H2S
removed – Carbon alone is $5-$13/# H2S
Even carbon people say avoid >200ppm
inlet
H2S is not converted, rather
captured/neutralized
BIOLOGICAL SCRUBBERS
Effective removal, but systems can be
intolerant to operating condition changes
Moderate-High CAPEX, low direct
OPEX
More operator attention required
Waste water disposal/treatment issues to address
DRY SCRUBBERS
Highly effective removal
Highly tolerant to operating condition
changes
Moderate CAPEX, moderate OPEX –consumable media
Little operator attention required

STEP 3: Consider the Options that Meet Your ObjectivesEngine or Process Equipment Warranty or Performance Limitations **Fewer available options
CARBON FILTRATION
Highly effective removal
Low CAPEX, but high OPEX
Can be used as a “polisher” behind other systems
Not really an option in this role unless biogas H2S concentrations
are low
BIOLOGICAL SCRUBBERS
Effective removal at these target levels
Moderate to high CAPEX, low to moderate direct OPEX per unit
of H2S removed
Systems “lag” in response to changes in incoming gas conditions. Operating
attention required – managing biology is non-trivial
Waste water disposal/treatment issues to address
DRY SCRUBBERS
Highly effective removal
Highly tolerant to operating condition changes.
No startup/shutdown lag (no lost revenue)
Low to moderate CAPEX, moderate OPEX – consumable
media
No waste water treatment issues. Low operator attention.

STEP 3: Consider the Options that Meet Your Objectives
Pipeline/CNG Processing Limitations or Strict Air Quality Control Limits on Emissions
CARBON FILTRATION
Highly effective removal, but not really an option in this role unless biogas H2S concentrations are low
Low CAPEX, high OPEX
Can be used as a “polisher” behind other systems
Enhanced ACs require oxygen for optimal removal efficiency
BIOLOGICAL SCRUBBERS
Effective H2S removal at these target levels
High CAPEX, low direct OPEX
Systems “lag” in response to changes in incoming gas conditions
Adds air to gas stream which may create out of limit conditions on CNG
or Pipeline use
DRY SCRUBBERS
Highly effective removal
Highly tolerant to operating condition changes. No startup/shutdown lag
(no lost revenue)
Low to moderate CAPEX, moderate OPEX – Media costs <$1.20 per # of
H2S removed
No air addition required for effective removal >> no effect on gas spec
limits

STEP 4: Compare Total Cost of Ownership (TCOs)
Once you have determined the technologies that may suit your objectives, apply a structured approach to compare the cost of available technologies and make your decision. The Baseline for Comparison of TCO is Cost per Pound/Kilogram of H2S Removed per Unit Time under your operating conditions.
Cost elements often overlooked during comparison:• Power costs – pressure drop matters, i.e. dry-scrubber vs. activated carbon• Lost Revenue due to system downtime – maintenance/media
changes/scrubber cleanouts• Replacement of proprietary nutrients and/or chemical/caustic • The costs of testing for warranty or regulatory requirements• Operator attention time – it is not “free”

STEP 4: Compare Total Cost of Ownership (TCOs)
Once you complete the cost analysis there are other factors to consider:
• Total System Footprint/Profile:wind loading on tall towers
• Ease of expansion to handle growth:how modular is the system?
• System flexibility to handle either increased or decreased demand and maintain performance
• Consistency of performance,regulatory issue

Dry Scrubber Systems: What Makes Them a Good Choice
• Capital Cost is Low100 SCFM unit is <$100,000300 SCFM unit is <$150,000600 SCFM unit is <$250,000
• “Set and Forget” - recommended operator attention is less than 3 hours per week
• Operate at lower TCO per pound of H2S• Completely scalable – add tanks in
parallel as your gas volume grows• Can deliver performance without adding
air (O2/N2) to gas stream

• Dry scrubbers deliver designed outlet conditions constantly without regard to changes in inlet conditions.
Dry Scrubber Systems: What Makes Them a Good Choice

MV Technologies Iron Sponge Scrubber Systems
Biogas and Landfill Gas User Installations
• Treatment Flows: 50 - 4,000 scfm
• H2S Concentrations: 150 - 10,000 ppm
• Operating Costs*- less than $1.75 per pound of H2S, including:• new media cost• old media disposal• replacement labor/equipment• parasitic loads
* Excludes capital cost amortization.

Thank YouPresented By:
Tom JonesV.P. of Business Development
Call or email us for more details and a free H2S solutions kit.

Agenda 1. Introduction
- Sean Mezei, Dekany Consulting
3. H2S Formation with AD Systems
- Eugenio Giraldo, Natural Systems Utilities
4. H2S Removal Technologies – Selection Criteria and Pros/Cons of Main Technology Types
- Tom Jones, MV Technologies
5. H2S Removal Economics
- Tim Robinson, Clean Methane Systems
6. Audience Q&A

H2S Removal Technologies
Timothy Robinson, President
www.methanesys.com

Clean Methane Systems LLC - www.methanesys.com
Concepts Covered
• What are the major technologies
• Key Selection Criteria • Use of the Gas
• Flow Rate
• Concentration Levels
• Site Conditions
• Technology
• What is the best way to deploy H2S removal technology to maximize the value of biogas

Clean Methane Systems LLC
CMS Services
Clean Methane Systems
Consumables
Gas Testing
Design/ Engineering
Service/ Support
Equipment
Carbon Monetization

Clean Methane Systems LLC - www.methanesys.com
Why Remove H2S
Major Drivers for Removal are:
1. Reduced Operating Costs
2. Air Permitting Regulations
3. Exhaust Catalyst

Clean Methane Systems LLC - www.methanesys.com
Why Remove H2S
Additional revenue and uptime when operating
with clean biogas.
Operating an engine with dirty gas requires approximately 30-
40% more frequent routine maintenance. This is time that the
engine is not operating and NOT GENERATING REVENUE.
A 350 kW engine with clean biogas will generate approximately
an additional 100,000 kWh electricity and 544 MMBTU heat per
year.
Clean biogas increases the overall life of the engine and
minimizes the risks of unscheduled maintenance.
Clean Methane Systems LLC - www.methanesys.com
Not All Sulfur Removal Technologies Are Equal!
CMS offers three primary hydrogen sulfide removal
technologies:
• Biological
• Chemical
• Fixed media

Clean Methane Systems LLC - www.methanesys.com
Sulfur Compound Removal Technology Selection Guide
The information contained in this chart is provided in good faith, and every reasonable effort has been made to ensure that it is accurate. This selection guide is to be
used as a reference point only. Please note there are several factors that must be considered when selecting a sulfur removal technology.
There are many factors that must be considered when selecting the type of technology to be used for the removal of sulfur compounds. It is
important to consider efficiencies, capital costs, operating costs and combined “life cycle” costs. Use this selection guide as a starting point
in your decision making process. Call Clean Methane Systems LLC for a free analytical model. It will show specific capital costs and
operating costs for the technology designed for your project.
ppmVH2S
100 250 500 750 1000 1500 2000 3000 4000 5000
SCFM
25 0.3 0.9 1.7 2.6 3.4 5.1 6.8 10.2 13.6 17.1
50 0.7 1.7 3.4 5.1 6.8 10.2 13.6 20.5 27.3 34.1
100 1.4 3.4 6.8 10.2 13.6 20.5 27.3 40.9 54.6 68.2
200 2.7 6.8 13.6 20.5 27.3 40.9 54.6 81.8 109.1 136.4
300 4.1 10.2 20.5 30.7 40.9 61.4 81.8 122.8 163.7 204.6
400 5.5 13.6 27.3 40.9 54.6 81.8 109.1 163.7 218.2 272.8
500 6.8 17.1 34.1 51.2 68.2 102.3 136.4 204.6 272.8 341.0
750 10.2 25.6 51.2 76.7 102.3 153.5 204.6 306.9 409.2 511.5
1000 13.6 34.1 68.2 102.3 136.4 204.6 272.8 409.2 545.6 682.0
1500 20.5 51.2 102.3 153.5 204.6 306.9 409.2 613.8 818.4 1023.0
2000 27.3 68.2 136.4 204.6 272.8 409.2 545.6 818.4 1091.2 1364.0
2500 34.1 85.3 170.5 255.8 341.0 511.5 682.0 1023.0 1364.0 1705.0
3000 40.9 102.3 204.6 306.9 409.2 613.8 818.4 1227.6 1636.8 2046.0
4000 54.6 136.4 272.8 409.2 545.6 818.4 1091.2 1636.8 2182.4 2728.0
5000 68.2 170.5 341.0 511.5 682.0 1023.0 1364.0 2046.0 2728.0 3410.0
Note: The numeric values equal the estimated pounds of H2S gas generated per day based on the air flow and the ppmV loadings.
Fixed Media Chemical Scrubber Bio-Filter

Clean Methane Systems LLC – www.methanesys.com
Sulfur Removal– Fixed Media
Most US based systems that treat the gas for hydrogen sulfide use fixed
media scavenger technology. The majority of sites use either SulfaTreat
or Iron Sponge media and although effective, may result in high
operational costs and frequent change-outs.
Due to the high concentration of hydrogen sulfide, CMS typically only
recommends fixed media removal for very small gas flow rates.

Clean Methane Systems LLC – www.methanesys.com
Sulfur Removal– Chemical
The Sulfurex System
This technology provides both moderate
capital and operational pricing.
Provides high equipment uptime.
The only operational expenses are a small
parasitic load and caustic.
The system automatically reacts to varying
levels of hydrogen sulfide in the raw gas
to ensure that the outlet gas always meets
spec.

Clean Methane Systems LLC – www.methanesys.com
Sulfur Removal– Biological
CMS offers the BioStrip, a sulfur removal
technology that provides significantly
reduced operating costs!
Makes past cost prohibitive projects
economically viable!
Utilizes the proven technology used in the
odor control industry.
For example, BioStrip reduces media costs
by over $200K/yr when compared to only
SulfaTreat technology with 200 scfm and
3,500 ppmv biogas. This value doesn’t
account for the additional costs of freight,
labor, and disposal.
Clean Methane Systems LLC – www.methanesys.com
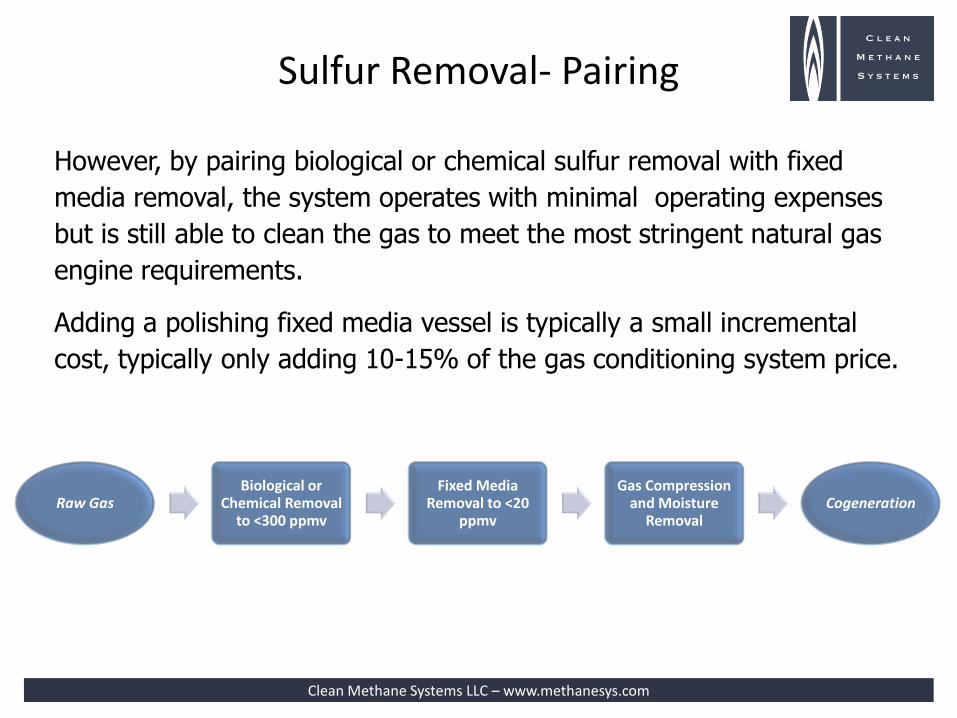
Sulfur Removal- Pairing
However, by pairing biological or chemical sulfur removal with fixed
media removal, the system operates with minimal operating expenses
but is still able to clean the gas to meet the most stringent natural gas
engine requirements.
Adding a polishing fixed media vessel is typically a small incremental
cost, typically only adding 10-15% of the gas conditioning system price.
Raw Gas Biological or
Chemical Removal to <300 ppmv
Fixed Media Removal to <20
ppmv
Gas Compression and Moisture
Removal Cogeneration

Clean Methane Systems LLC – www.methanesys.com
BioStrip and SulfrPack ST BioStrip and SulfrPack CIS SulfrPack ST SulfrPack CIS
Capex $464,138 $490,853 $316,051 $338,098
Yearly Opex $46,087 $42,404 $401,856 $280,735
10 Year Total Expenses $925,007 $914,893 $4,334,611 $3,145,448
$-
$500,000
$1,000,000
$1,500,000
$2,000,000
$2,500,000
$3,000,000
$3,500,000
$4,000,000
$4,500,000
Cost Savings of Pairing Sulfur Removal Technologies
SulfaTreat Only Biological & SulfaTreat Biological & Iron Sponge Iron Sponge Only

Clean Methane Systems LLC – www.methanesys.com
Thank You
Timothy D Robinson President
Clean Methane Systems LLC
Office: 425.420.1979 Mobile: 503.780.2143 Email: [email protected] Skype: Tim.D.Robinson Linkedin: linkedin.com/in/timrobinson73

Q&A Ask questions using the Questions Panel on the right side of your screen. All questions and comments will be recorded.
A recording of the webinar and slides will be available by Monday, March 9th to all ABC Members and all attendees of the webinar.

Upcoming Events
• Digestate Standard Workshop, April 13, 2015 Biocycle West Coast Conference Portland, Oregon | April 13-16, 2015
• BioCycle REFOR15: Official Conference of the American Biogas Council Boston, MA | October 19-22, 2015
For more information, visit https://www.americanbiogascouncil.org/media_events.asp
or call (202)640-6595
43

Thank you!
• Don’t forget to fill out our survey after the webinar!
• Consider Joining ABC --Receive regulatory and policy intelligence --Connect with other biogas and anaerobic
digestion leaders --Support the industry’s growth and outreach