Embed Size (px)
Citation preview

Research
H2 2012
WARSAW Office market report
Highlights• While growth has slowed, the Polish economy has remained relatively resilient
in the face of the Eurozone crisis which has been reflected in the level of leasing
activity. Indeed, 2012 was another record year for take-up, which reached
608,000 sq m.
• Pricing for prime stock has stabilised, although investor demand has remained
buoyant. An exceptionally strong H2 pushed full year transaction volumes
(including hotels) to €2.7bn – virtually unchanged on 2011.
• In Euro terms, prime rents remain in the €22-28 per sq m per month range,
but the tone of average asking rents softened over the year, in line with
a more cautious economic outlook.
• The capital also saw a marked increase in office stock, with 260,000 sq m of new
space delivered to the market – more than double the amount recorded in 2011.
H2 2012WarsawOffice market report
2
Table 1
Major leasing transactions signed in H2 2012
Property Submarket Tenant Size (sq m) Transaction type
Sector
Wilanów Office Park A Służewiec Przemysłowy Asseco 20,400 new professional services
Warsaw Spire CBD Frontex 14,580 new professional services
Domaniewska 37C Służewiec Przemysłowy Poczta Polska 12,600 new public
Green Corner CBD GDDKiA 11,700 new public
Feniks CBD BOŚ Bank 8,940 new financial/banking
Grzybowska 81 Wola Bank Polskiej Spółdzielczości
8,920 pre- let financial/banking
Marynarska Point Służewiec Przemysłowy Generali 7,700 renewal financial
Source: Knight Frank
0
100
200
300
400
500
600
0
4
8
12
16
20
2000
2001
2002
2003
2004
2005
2006
2007
2008
2009
2010
2011
2012
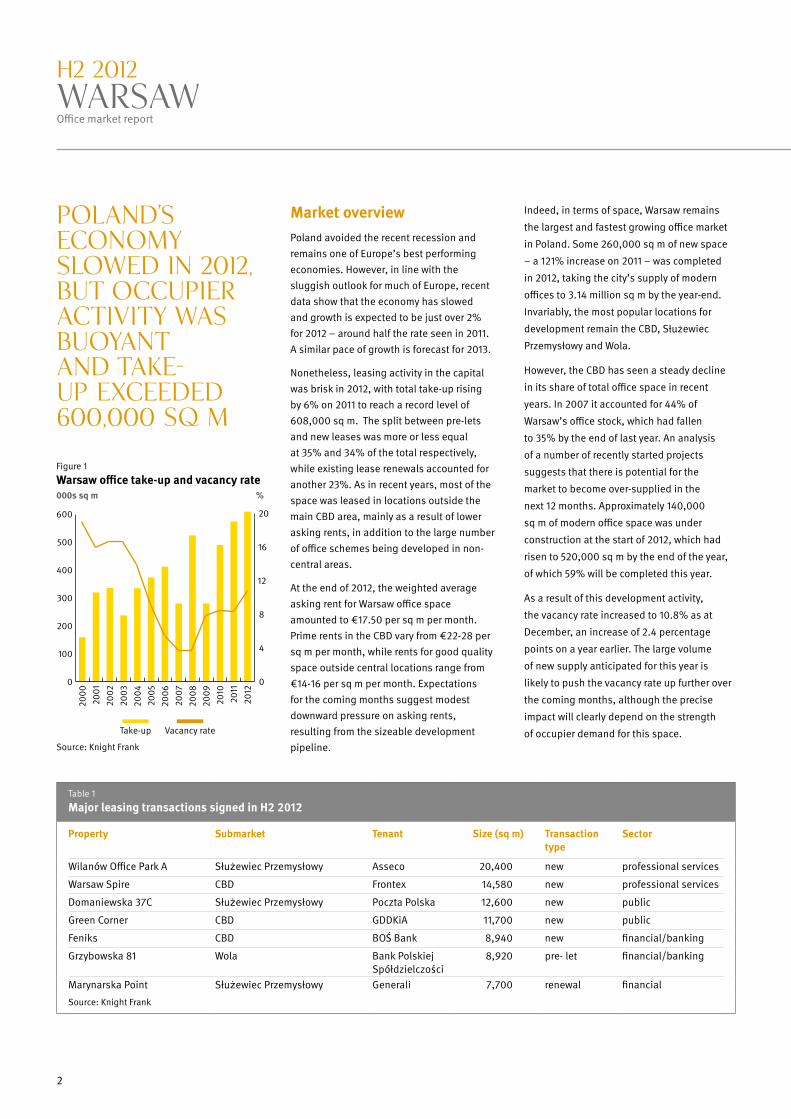
Figure 1
Warsaw office take-up and vacancy rate000s sq m %
Source: Knight Frank
Take-up Vacancy rate
Market overviewPoland avoided the recent recession and remains one of Europe’s best performing economies. However, in line with the sluggish outlook for much of Europe, recent data show that the economy has slowed and growth is expected to be just over 2% for 2012 – around half the rate seen in 2011. A similar pace of growth is forecast for 2013.
Nonetheless, leasing activity in the capital was brisk in 2012, with total take-up rising by 6% on 2011 to reach a record level of 608,000 sq m. The split between pre-lets and new leases was more or less equal at 35% and 34% of the total respectively, while existing lease renewals accounted for another 23%. As in recent years, most of the space was leased in locations outside the main CBD area, mainly as a result of lower asking rents, in addition to the large number of office schemes being developed in non-central areas.
At the end of 2012, the weighted average asking rent for Warsaw office space amounted to €17.50 per sq m per month. Prime rents in the CBD vary from €22-28 per sq m per month, while rents for good quality space outside central locations range from €14-16 per sq m per month. Expectations for the coming months suggest modest downward pressure on asking rents, resulting from the sizeable development pipeline.
Indeed, in terms of space, Warsaw remains
the largest and fastest growing office market
in Poland. Some 260,000 sq m of new space
– a 121% increase on 2011 – was completed
in 2012, taking the city’s supply of modern
offices to 3.14 million sq m by the year-end.
Invariably, the most popular locations for
development remain the CBD, Służewiec
Przemysłowy and Wola.
However, the CBD has seen a steady decline
in its share of total office space in recent
years. In 2007 it accounted for 44% of
Warsaw’s office stock, which had fallen
to 35% by the end of last year. An analysis
of a number of recently started projects
suggests that there is potential for the
market to become over-supplied in the
next 12 months. Approximately 140,000
sq m of modern office space was under
construction at the start of 2012, which had
risen to 520,000 sq m by the end of the year,
of which 59% will be completed this year.
As a result of this development activity,
the vacancy rate increased to 10.8% as at
December, an increase of 2.4 percentage
points on a year earlier. The large volume
of new supply anticipated for this year is
likely to push the vacancy rate up further over
the coming months, although the precise
impact will clearly depend on the strength
of occupier demand for this space.
POLAND’S ECONOMY SLOWED IN 2012, BUT OCCUPIER ACTIVITY WAS BUOYANT AND TAKE-UP EXCEEDED 600,000 SQ M
Łomianki
Bielany
Białołęka
Targówek
Praga PłBemowo
Mokotów
Śródmieście
Żoliborz
Ożarów
Pruszków
Janki
Piaseczno
Port LotniczyWarszawa Okęcie
Józefosław
Ursynów
Ursus
Włochy
Ochota
Wola
www.knightfrank.com
3
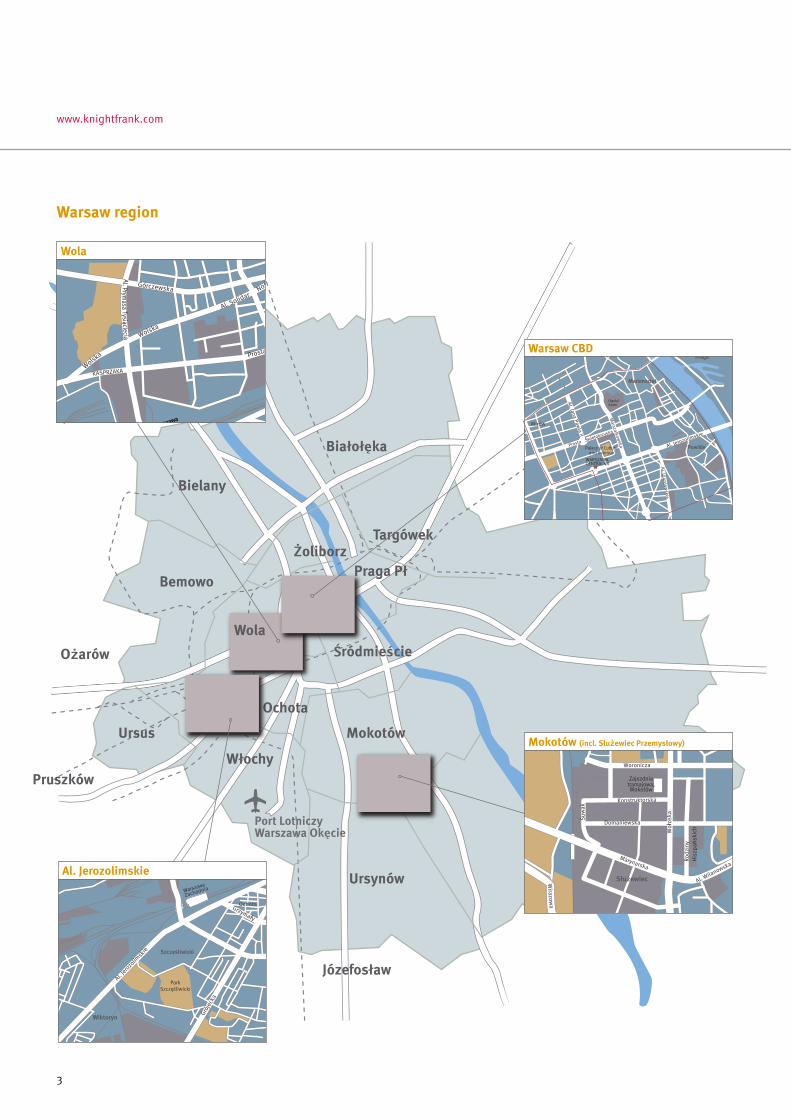
Mokotów (incl. Służewiec Przemysłowy)
Warsaw region
Zajezdniatramajowa,Mokotów
Marynarska
Woronicza
Rodz
iny
Wirazow
a
Al. Wilanowska
Konstruktorska
Domaniewska
Suw
ak
Woł
oska
Służewiec
His
zpań
skic
h
Warsaw CBD
Prosta
Ności
Wolska
Al. Prymasa Tysiącllecia
Górczewska
Al. Solidar
Wolska
Palace of Cultureand Science
OgródSaski
WARSZAWACENTRALNA
Praga
Mariensztat
Powisle
Mirów
Al. Jana Pawla II
Marszalkow
ska Al. Jerozolimskie
Prosta Świetokrzyska
Al. Ujazdow
skie
Wola
KASPRZAKA
Warszawa
ZachodniaWarszawa
Zachodnia
Prosta
Ności
Wolska
Al. Prymasa Tysiąclecia
Górczewska
Wolska
Al. Solidar
Al. Jerozolimskie
Prosta
Ności
Wolska
Al. Prymasa Tysiącllecia
Górczewska
Al. Solidar
Wolska
Wiktoryn
Warszawa
Zachodnia
ParkSzczesliwicki
Szczesliwicki
Ochota
Al. Jero
zolim
skie
Grój
ecka
Grzymały
4
0
200
400
600
800
1,000
1,200
1,400
CBD
Jero
zolim
skie Av
.
Mok
otów
(incl
. Służe
wie
c
Prze
msy
łow
y)
Wol
a
Oth
er
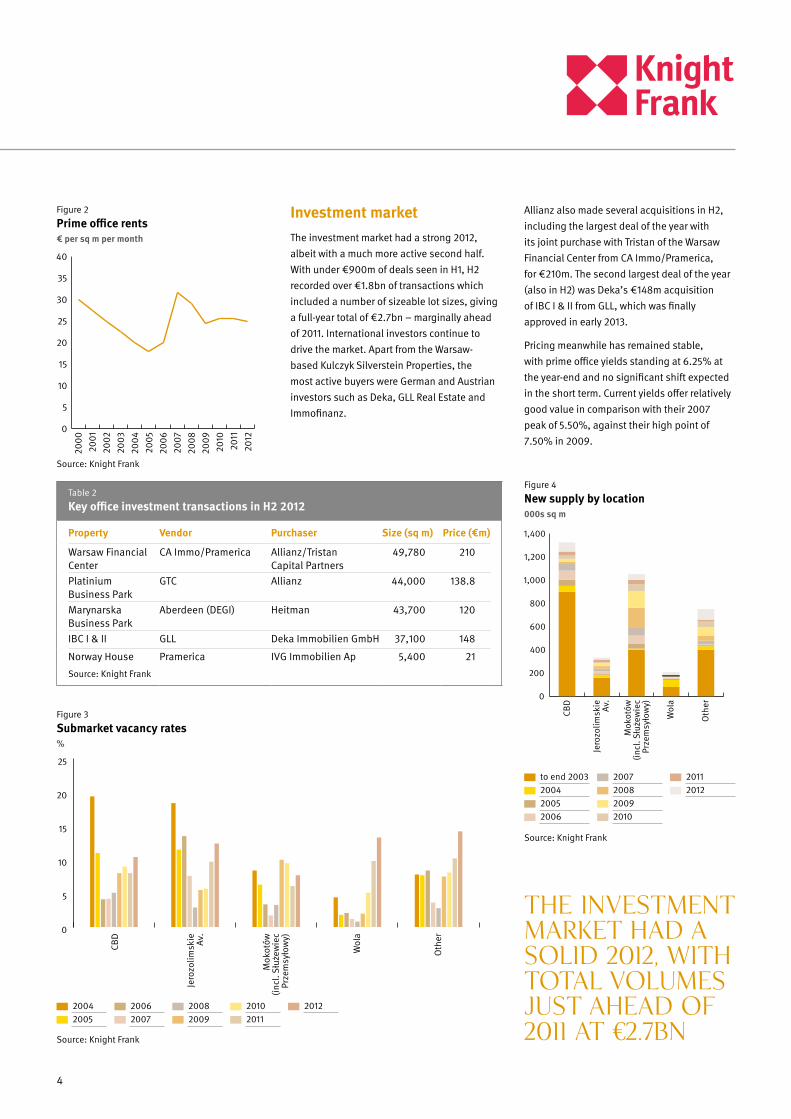
Figure 4
New supply by location000s sq m
Source: Knight Frank
0
5
10
15
20
25
30
35
40
2000
2001
2002
2003
2004
2005
2006
2007
2008
2009
2010
2011
2012
Figure 2
Prime office rents€ per sq m per month
Source: Knight Frank
Figure 3
Submarket vacancy rates%
0
5
10
15
20
25
to end 2003 2004 2005 2006
2007 2008 2009 2010
CBD
Jero
zolim
skie Av
.
Mok
otów
(incl
. Służe
wie
c
Prze
msy
łow
y)
Wol
a
Oth
er
Source: Knight Frank
THE INVESTMENT MARKET HAD A SOLID 2012, WITH TOTAL VOLUMES JUST AHEAD OF 2011 AT €2.7BN
Investment marketThe investment market had a strong 2012, albeit with a much more active second half. With under €900m of deals seen in H1, H2 recorded over €1.8bn of transactions which included a number of sizeable lot sizes, giving a full-year total of €2.7bn – marginally ahead of 2011. International investors continue to drive the market. Apart from the Warsaw-based Kulczyk Silverstein Properties, the most active buyers were German and Austrian investors such as Deka, GLL Real Estate and Immofinanz.
Allianz also made several acquisitions in H2, including the largest deal of the year with its joint purchase with Tristan of the Warsaw Financial Center from CA Immo/Pramerica, for €210m. The second largest deal of the year (also in H2) was Deka’s €148m acquisition of IBC I & II from GLL, which was finally approved in early 2013.
Pricing meanwhile has remained stable, with prime office yields standing at 6.25% at the year-end and no significant shift expected in the short term. Current yields offer relatively good value in comparison with their 2007 peak of 5.50%, against their high point of 7.50% in 2009.
Table 2
Key office investment transactions in H2 2012
Property Vendor Purchaser Size (sq m) Price (€m)
Warsaw Financial Center
CA Immo/Pramerica Allianz/Tristan Capital Partners
49,780 210
Platinium Business Park
GTC Allianz 44,000 138.8
Marynarska Business Park
Aberdeen (DEGI) Heitman 43,700 120
IBC I & II GLL Deka Immobilien GmbH 37,100 148
Norway House Pramerica IVG Immobilien Ap 5,400 21
Source: Knight Frank
to end 2003 2004 2005 2006
2007 2008 2009 2010
2011 2012
2004 2005
2006 2007
2008 2009
2010 2011
2012
H2 2012WarsawOffice market report
5
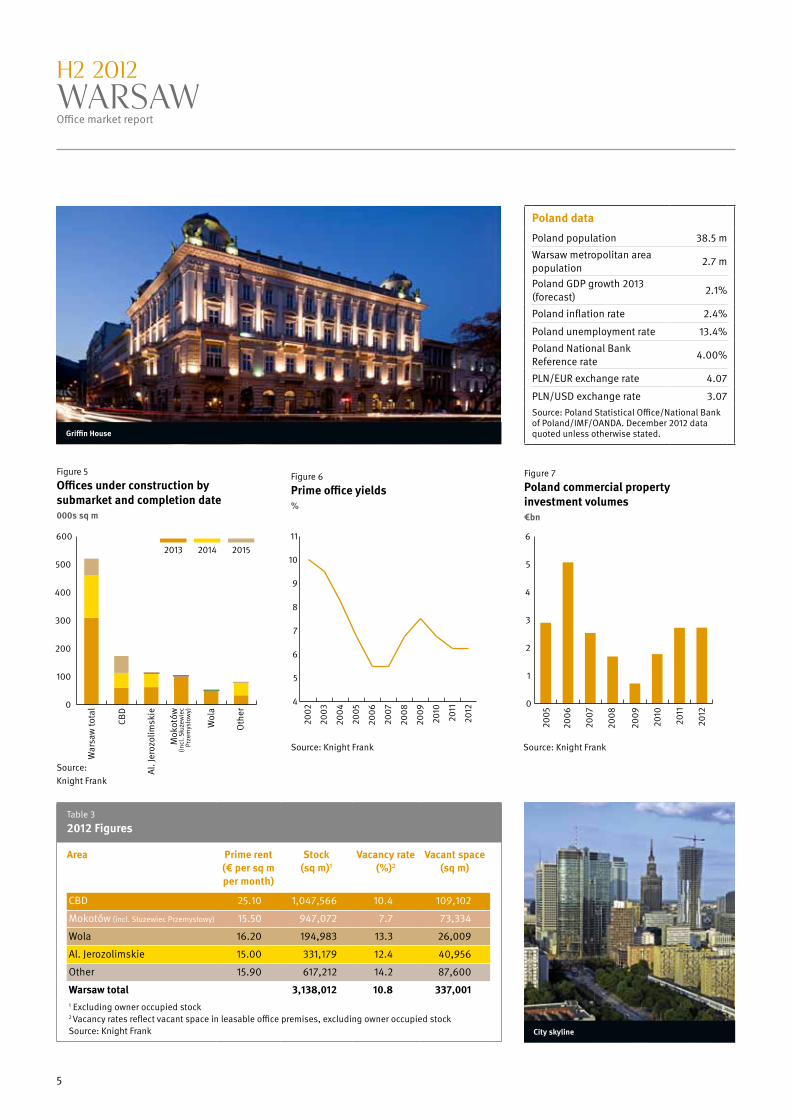
Table 3
2012 Figures
Area Prime rent (€ per sq m per month)
Stock (sq m)1
Vacancy rate (%)2
Vacant space (sq m)
CBD 25.10 1,047,566 10.4 109,102
Mokotów (incl. Służewiec Przemysłowy) 15.50 947,072 7.7 73,334
Wola 16.20 194,983 13.3 26,009
Al. Jerozolimskie 15.00 331,179 12.4 40,956
Other 15.90 617,212 14.2 87,600
Warsaw total 3,138,012 10.8 337,0011 Excluding owner occupied stock 2 Vacancy rates reflect vacant space in leasable office premises, excluding owner occupied stock Source: Knight Frank
Figure 5
Offices under construction by submarket and completion date000s sq m
4
5
6
7
8
9
10
11
2002
2003
2004
2005
2006
2007
2008
2009
2010
2011
2012
Figure 6
Prime office yields %
Source: Knight Frank
0
1
2
3
4
5
620
05
2006
2007
2008
2009
2010
2011
2012
Figure 7
Poland commercial property investment volumes €bn
Source: Knight Frank
Griffin House
City skyline
0
100
200
300
400
500
600
War
saw
tota
l
CBD
Al. J
eroz
olim
skie
Mok
otów
(inc
l. Sł
użew
iec
Prze
mys
łow
y)
Wol
a
Oth
er
Poland data
Poland population 38.5 m
Warsaw metropolitan area population
2.7 m
Poland GDP growth 2013 (forecast)
2.1%
Poland inflation rate 2.4%
Poland unemployment rate 13.4%
Poland National Bank Reference rate
4.00%
PLN/EUR exchange rate 4.07
PLN/USD exchange rate 3.07Source: Poland Statistical Office/National Bank of Poland/IMF/OANDA. December 2012 data quoted unless otherwise stated.
2013 2014 2015
Source: Knight Frank

RESEARCH
Warsaw Joseph BorowskiManaging Partner +48 (22) 596 50 50 [email protected]
Monika A. DebskaChairman of the Board +48 (22) 596 50 50 [email protected]
Magdalena CzempińskaResearch +48 (22) 596 50 50 [email protected]
LondonChris BellManaging Director, Europe+44 (0) 207 629 [email protected]
Darren YatesPartner, International Research+44 (0) 207 629 [email protected]
Matthew ColbourneAssociate, International Research+44 (0) 207 629 [email protected]
Carly TompsettAnalyst, International Research+44 (0) 207 629 [email protected]
Knight Frank Research provides strategic advice, consultancy services and forecasting to a wide range of clients worldwide including developers, investors, funding organisations, corporate institutions and the public sector. All our clients recognise the need for expert independent advice customised to their specific needs.
Knight Frank Reports are also available at www.knightfrank.com
© Knight Frank LLP 2013
This report is published for general information only. Although high standards have been used in the preparation of the information, analysis, views and projections presented in this report, no legal responsibility can be accepted by Knight Frank Research or Knight Frank LLP for any loss or damage resultant from the contents of this document. As a general report, this material does not necessarily represent the view of Knight Frank LLP in relation to particular properties or projects. Reproduction of this report in whole or in part is allowed with proper reference to Knight Frank Research.
Knight Frank LLP is a limited liability partnership registered in England with registered number OC305934. Our registered office is 55 Baker Street, London, W1U 8AN, where you may look at a list of members’ names.
NewmarkKnight FrankGlobal
NewmarkKnight FrankGlobal
NewmarkKnight FrankGlobal
AmericasUSACanadaCaribbean
AustralasiaAustraliaNew Zealand
EuropeUKAustriaBelgiumCzech RepublicFranceGermanyIrelandItalyMonacoPolandPortugalRomaniaRussiaSpainSwitzerlandThe NetherlandsUkraine
AfricaBotswanaKenyaMalawiNigeriaSouth AfricaTanzaniaUgandaZambiaZimbabwe
AsiaCambodiaChinaHong KongIndiaIndonesiaMacauMalaysiaSingaporeSouth KoreaThailandVietnam
The GulfBahrainQatar UAE