Embed Size (px)
Citation preview

H1 Results 2012
25 July 2012

Andrew WittyChief Executive Officer
Simon DingemansChief Financial Officer

Continued execution of our strategy in a difficult external environment
Growa diversifiedglobal business
Delivermore productsof value
Simplifythe operatingmodel
Businesses in innovation markets structured to launch new products
Continue to drive world leading Vaccines business
Consumer Healthcare business refocused around Global brands and Emerging Markets
Reshaped R&D delivers sustainable pipeline flow
Increased portfolio of affordable Pharma, Vaccines and Consumer brands in Emerging Markets
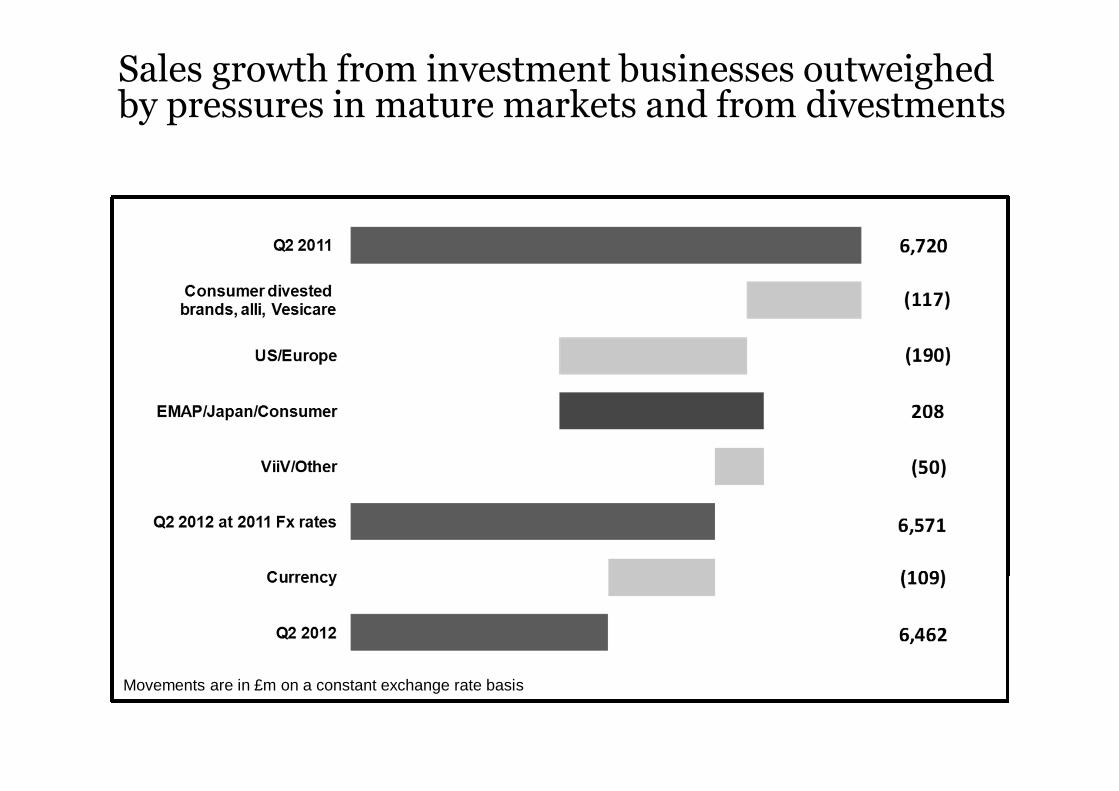
Sales growth from investment businesses outweighed by pressures in mature markets and from divestments
Movements are in £m on a constant exchange rate basis

Source: IMS Health data (number of packs); Peers represent: Abbott AstraZeneca Bayer GSK Johnson & Johnson Lilly Merck & Co Novartis Pfizer Roche Sanofi
European volume performance in line with peers
GSK growth excludes Avandia
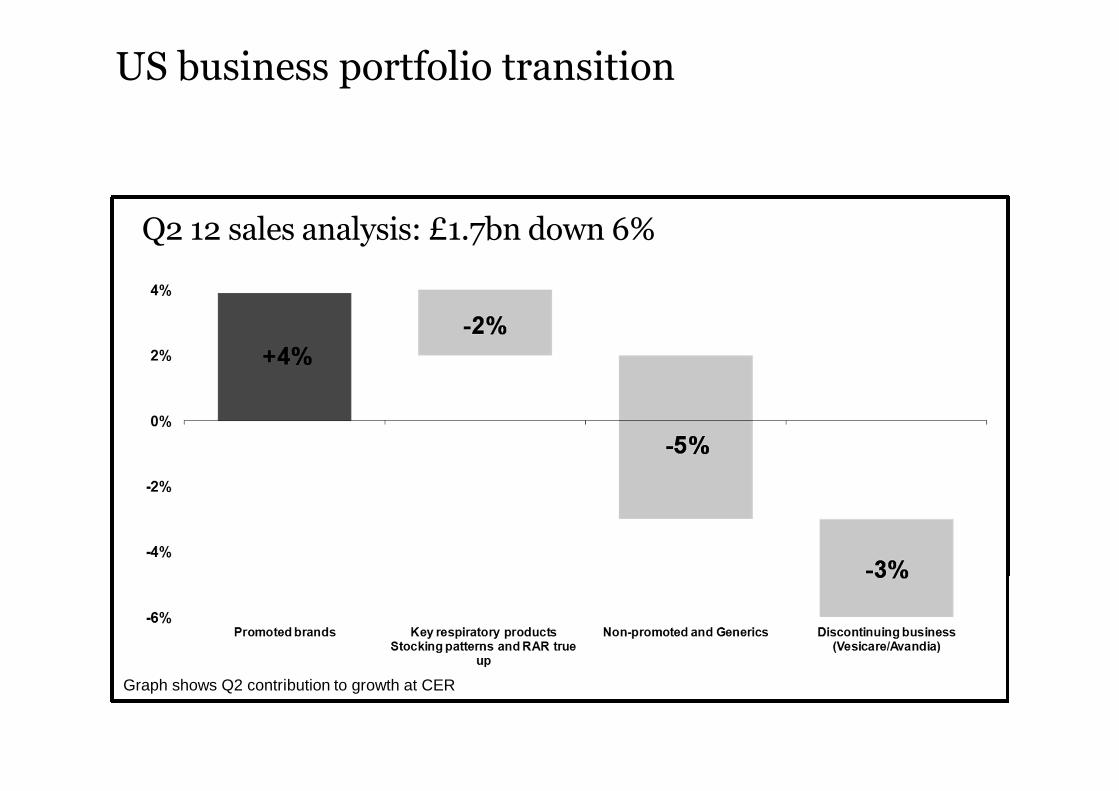
US business portfolio transition
Q2 12 sales analysis: £1.7bn down 6%
Graph shows Q2 contribution to growth at CER

GSK at the half year
Tough macro environment
Broadly flatsales• Growth in EMAP
Japan & ongoing Consumer
• Europe/US declines
Increasing cash generation & returns to shareholders• £3.2bn distributed to
shareholders
Significant pipeline delivery• Supports potential launch of 8 new drugs and vaccines in 24 months• Significant progress across major therapeutic areas (Respiratory, Oncology, HIV,
and Diabetes)
Continued focus on costs & margins• Direct further action on
cost base• Acceleration of
financial efficiencies

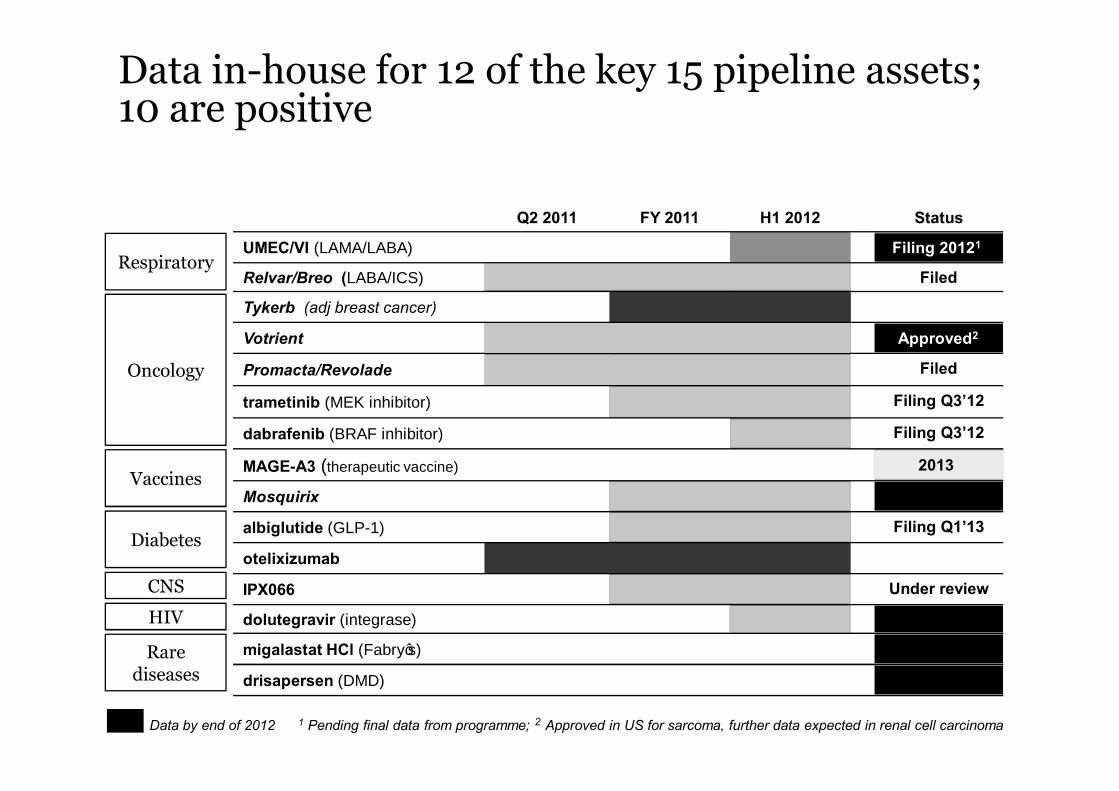
Data in-house for 12 of the key 15 pipeline assets;10 are positive
Q2 2011 FY 2011 H1 2012 Status
UMEC/VI (LAMA/LABA)
Relvar/Breo (LABA/ICS)
Tykerb (adj breast cancer)
Votrient
Promacta/Revolade
trametinib (MEK inhibitor)
dabrafenib (BRAF inhibitor)
MAGE-A3 (therapeutic vaccine)
Mosquirix
albiglutide (GLP-1)
otelixizumab
IPX066
dolutegravir (integrase)
migalastat HCl (Fabry’s)
drisapersen (DMD)
Data by end of 2012 1 Pending final data from programme; 2 Approved in US for sarcoma, further data expected in renal cell carcinoma
Respiratory
Oncology
Vaccines
Diabetes
CNS
HIV
Rarediseases

Data in-house for 12 of the key 15 pipeline assets;10 are positive
Q2 2011 FY 2011 H1 2012 Status
UMEC/VI (LAMA/LABA)
Relvar/Breo (LABA/ICS)
Tykerb (adj breast cancer)
Votrient
Promacta/Revolade
trametinib (MEK inhibitor)
dabrafenib (BRAF inhibitor)
MAGE-A3 (therapeutic vaccine)
Mosquirix
albiglutide (GLP-1)
otelixizumab
IPX066
dolutegravir (integrase)
migalastat HCl (Fabry’s)
drisapersen (DMD)
Respiratory
Oncology
Vaccines
Diabetes
CNS
HIV
Rarediseases
Data by end of 2012 1 Pending final data from programme; 2 Approved in US for sarcoma, further data expected in renal cell carcinoma
Data in-house for 12 of the key 15 pipeline assets;10 are positive
Q2 2011 FY 2011 H1 2012 Status
UMEC/VI (LAMA/LABA)
Relvar/Breo (LABA/ICS) Filed
Tykerb (adj breast cancer)
Votrient
Promacta/Revolade Filed
trametinib (MEK inhibitor) Filing Q3’12
dabrafenib (BRAF inhibitor) Filing Q3’12
MAGE-A3 (therapeutic vaccine)
Mosquirix
albiglutide (GLP-1) Filing Q1’13
otelixizumab
IPX066 Under review
dolutegravir (integrase)
migalastat HCl (Fabry’s)
drisapersen (DMD)
Respiratory
Oncology
Vaccines
Diabetes
CNS
HIV
Rarediseases
Data by end of 2012 1 Pending final data from programme; 2 Approved in US for sarcoma, further data expected in renal cell carcinoma
Filing 20121
Approved2
2013

Pipeline delivery builds on existing areas of strength
Respiratory
• £1.5bn (flat) in H1• 2 meningitis vaccines approved• Quadrivalent flu filed• MAGE A3 data in 2013• PhIII Zoster programme ongoing
• £3.7bn (+1%) in H1• Relvar/Breo filed • Positive UMEC/VI pivotal data• 7 additional late stage* assets
• £680m (-6%) in H1; impacted by generics
• Growth from Epzicom and Selzentry
• Positive dolutegravir pivotal data
• CV & Urology £1.3bn (+10%) in H1
• albiglutide data in house and filing in Q1 13
• darapladib data expected 2013/14
Vaccines CV/Urology/Metabolic
HIV
• £375m (+22%) in H1• Votrient Sarcoma approval• MEK & BRAF filings imminent• Promacta* filed; FDA priority review
Oncology
• Late stage is defined as Phase II b/Phase III; HIV business is run as “ViiV Healthcare”; dolutegravir is a Shionogii-ViiV Healthcare joint venture asset; Promacta file is for Hepatitis C thrombocytopenia; migalastat6-month Fabry’s data from 12-month studies
• £216m (-3%) in H1• Fabry’s data by end 2012• Duchenne data by end 2012
Rarediseases
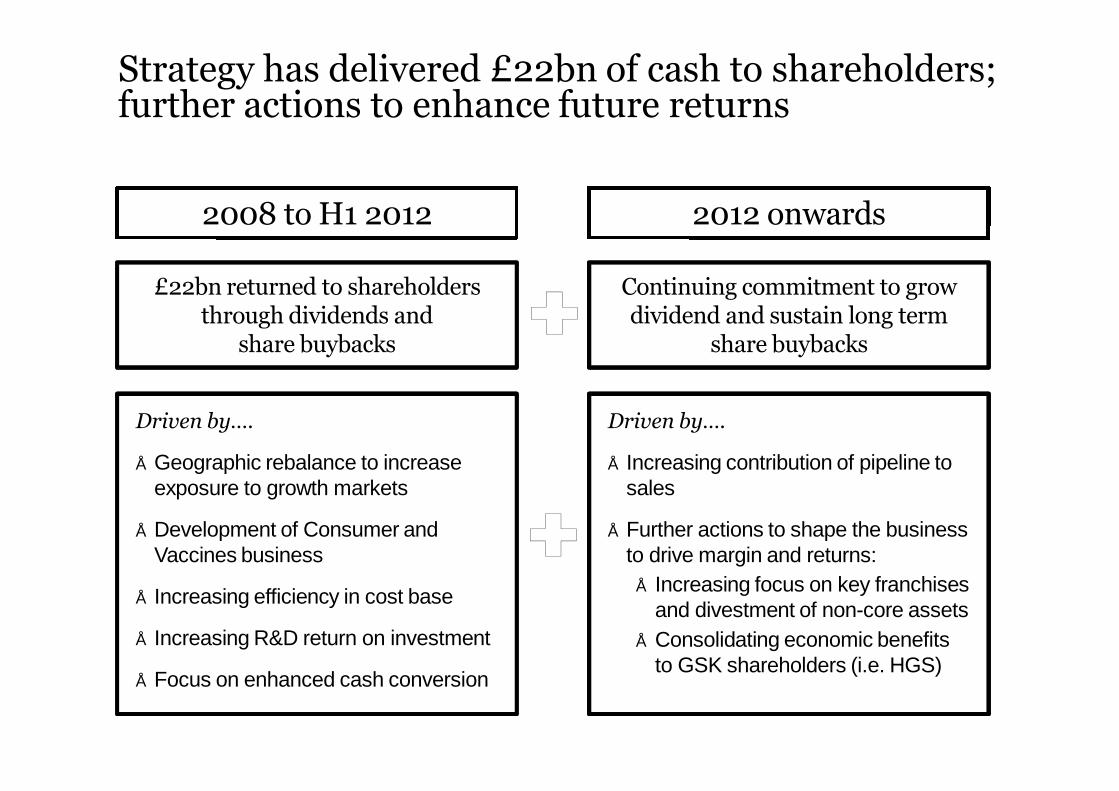
Strategy has delivered £22bn of cash to shareholders; further actions to enhance future returns
Continuing commitment to grow dividend and sustain long term
share buybacks
2008 to H1 2012 2012 onwards
£22bn returned to shareholders through dividends and
share buybacks
Driven by….
• Geographic rebalance to increase exposure to growth markets
• Development of Consumer and Vaccines business
• Increasing efficiency in cost base
• Increasing R&D return on investment
• Focus on enhanced cash conversion
Driven by….
• Increasing contribution of pipeline to sales
• Further actions to shape the business to drive margin and returns:
• Increasing focus on key franchises and divestment of non-core assets
• Consolidating economic benefits to GSK shareholders (i.e. HGS)
Simon DingemansChief Financial Officer

Strategy to deliver sustainable financial performance and returns to shareholders
Sales growthSales growth
Financial efficiencyFinancial efficiency
Cash flow growth
Cash flow growth
Returns toshareholders
Returns toshareholders
Operating leverage
Operating leverage

Headline results
Growth % Growth%
£m Q2 2012 CER £ H1 2012 CER £
Turnover 6,462 (2) (4) 13,102 - (2)
Core Operating profit 2,002 (7) (8) 4,073 (2) (3)
Core EPS 26.4p (5) (5) 53.7p 1 -
Adjusted FCF (FCF excl. legal)
1,315 39 2,062 4

Sales growth from investment businesses outweighed by pressures in mature markets and from divestments
Movements are in £m on a constant exchange rate basis

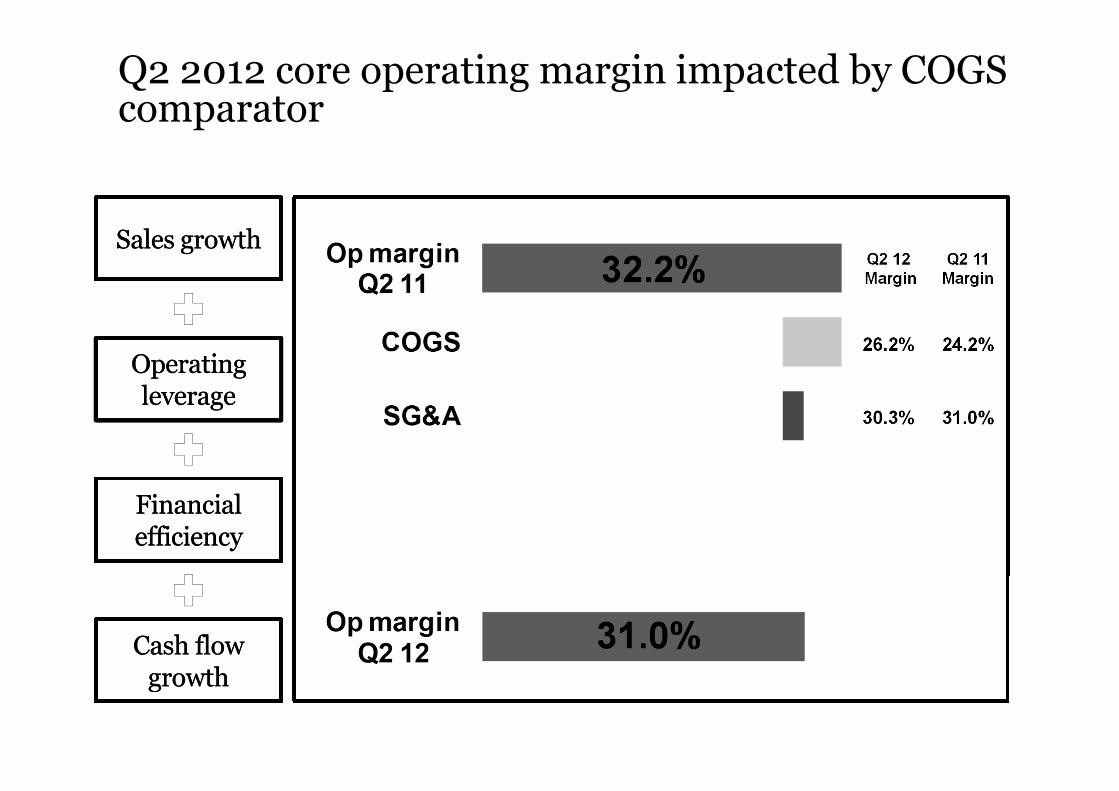
Q2 2012 core operating margin impacted by COGS comparator
Q2 12Margin
Q2 11Margin
Sales growthSales growth
Operating leverage
Operating leverage
Financial efficiencyFinancial efficiency
Cash flow growth
Cash flow growth

Q2 2012 core operating margin impacted by COGS comparator
Q2 12Margin
Q2 11Margin
26.2% 24.2%
Sales growthSales growth
Operating leverage
Operating leverage
Financial efficiencyFinancial efficiency
Cash flow growth
Cash flow growth
Q2 2012 core operating margin impacted by COGS comparator
Q2 12Margin
Q2 11Margin
26.2% 24.2%
30.3% 31.0%
Sales growthSales growth
Operating leverage
Operating leverage
Financial efficiencyFinancial efficiency
Cash flow growth
Cash flow growth

Q2 2012 core operating margin impacted by COGS comparator
Q2 12Margin
Q2 11Margin
26.2% 24.2%
30.3% 31.0%
13.6% 13.5%
1.1% 0.9%
Sales growthSales growth
Operating leverage
Operating leverage
Financial efficiencyFinancial efficiency
Cash flow growth
Cash flow growth

Continue to make progress on delivery of financial efficiencies
Sales growthSales growth
Financial efficiencyFinancial efficiency
Cash flow growth
Cash flow growth
Operating ProfitOperating Profit
EPSEPS
StatusStatus FutureFuture
Net debt to increase Continue to target A-1/P-1
short-term rating
Q2 effective interest rate ~7.5% following re-financing
Target 25.5% in 201225% in 2013
£2-2.5bn share buyback expected in 2012
Target ~6% by 2013
Net debt £9.6bn at H1
Core income tax rate reduced to 25.5% in Q2
Share buyback Q2 £0.9bn / H1 £1.1bn
Operating leverage
Operating leverage

Generated £2.1bn free cash flow (ex legal) in H1 12
Sales growthSales growth
Financial efficiencyFinancial efficiency
Cash flow growth
Cash flow growth H1 adjusted net cash flow from operating activities £3.1bn
Operating leverage
Operating leverage

Continued progress in reducing working capital
Sales growthSales growth
Financial efficiencyFinancial efficiency
Cash flow growth
Cash flow growth
Conversion cycle
Working capital as % of sales
Q2 11 Q3 11 Q4 11 Q1 12 Q2 12
DSO 64 63 61 62 60
DPO 34 33 43 40 41
DIO 206 197 192 193 193
Days 236 227 210 215 212
Q2 11 Q3 11 Q4 11 Q1 12 Q2 12
Operating leverage
Operating leverage

Liquidity in anticipation of legal and acquisition costs
Sales growthSales growth
Financial efficiencyFinancial efficiency
Cash flow growth
Cash flow growth
Operating leverage
Operating leverage

£3.2bn cash returned to shareholders in H1 2012; up 22% compared with H1 2011
Dividends £2.1bn* in H1 2012
Q1 +6%Q2 +6%
Buyback£1.1bn in H1 2012
* Comprises payment of 2011 third interim dividend (£847m), and 2011 fourth interim dividend (£1,043m) and the 2011 Supplemental dividend (£248m)

GSK is positioned for continued returns to shareholders
Sales growthSales growth
Financial efficiencyFinancial efficiency
Cash flow growth
Cash flow growth
Returns toshareholders
Returns toshareholders
Operating leverage
Operating leverage