Embed Size (px)
Citation preview

HardwoodSilvicultureCooperative
HSCAnnual Repor t 2010

2
Highlights of 2010
4 Three more HSC Type 2 installations had the 17th year measurement; bringing the total to 14 of the 26 installations.
4 Four HSC Type 2 installations had all treatments completed; bringing the total to 11 of the 26 installations.
4 The ORGANON modeling effort is well under way. All of the equa-tions necessary for modeling the control/untreated stands have been completed. Attention is now focused on the effects of thinning.
4 A collaborative effort between the WA Department of Natural Re-sources and the HSC will look at the effect of thinning natural red alder stands on volume and stem form.
3
Contents
Highlights of 2010 2
HSC Executive Summary 2010 4
History of the HSC 6
Red Alder Stand Management Study 9
Current HSC Activities 15
ORGANON Growth and Yield Modeling 15 Updates 15 Progress 15
Other Red Alder Research 25 Frankia Population Dynamics in Red Alder Stands 25 Red Alder and Climate Change 26 Thinned Natural Red Alder Stand Volume and Stem Form 26 Development of a Sustainable Woody Bioenergy Industry 27
Direction for 2011 29
Appendix 1 —Treatment Summaries 30
Appendix 2—HSC Management Committee Meeting Minutes 31
Appendix 3—Financial Support Received in 2009-2010 36
4
HSC Executive Summary 2010
Established in 1988 by a small and visionary group, the HSC is in the lead developing and providing information for foresters interested in red alder manage-ment. The progress in 20 years is quite amazing to contemplate
The HSC has established thirty-seven study installations spread from Coos Bay, Oregon to Vancouver Island, British Columbia. There are three study types:
4 4 thinning studies in natural red alder stands
4 7 replacement series studies of red alder/Douglas-fir mixtures
4 26 variable density red alder plantations with thinning and pruning treat-ments
Last year’s data collection schedule was less than average. Six installa-tions were measured including three Type 2 installations having their 17th year measurement. This brings the total number of installations with 17 year data to 14. Furthermore, of those 14 installations, 11 have had all the treatments completed.
The data collected (combined with data from Weyerhaeuser Co.) are cur-rently being used to develop a growth and yield model for red alder plantations (RAP-ORGANON), an essential tool for the management of red alder. This model will provide much needed information to estimate site productivity, growth responses following thinning, and the extrapolation of stand volume, rotation ages, log sizes, etc.
So far, in the process of building RAP-ORGANON, all of the equations necessary for the control/non-treated stands have been developed. These are: plantation-grown red alder dominant height growth (site index), height-diameter, maximum crown width, largest crown width, crown profile, height to crown base, diameter growth, height growth, crown recession rate, mortality rate, and size density equations.
Furthermore, the value of the HSC data and study design has been recog-nized by researchers who are interested in a number of forestry related topics.

5
These include:4 Peter Kennedy (Lewis and Clark College) used the HSC study sites to
study the effects of geographic location, stand origin, and tree density on nitrogen-fixing Frankia populations. Two peer-reviewed journal articles from this effort have now been published.
4 A Canadian project “Using red alder as an adaptation strategy to reduce environmental, social and economic risks of climate change in coastal BC” has gotten underway. To date, the HSC has provided geographic and tree growth information for all of the HSC installations and assisted in collect-ing soil samples from the Type 3 installation in the USA. This coming fall, the HSC will collect Douglas-fir foliage from the same installations.
4 The red alder stand containing the HSC Type 1 installation #4102 (Janicki) is scheduled for harvest. Because of this, the HSC and WA Department of Natural Resources are taking this opportunity to collect additional infor-mation on the effects of thinning on stem form and tree and stand volume. These results will assist WADNR in fine-tuning their red alder cruise esti-mates and help improve existing red alder volume/taper equations
4 A large, cooperative effort is underway to acquire funding to promote and develop a sustainable bioenergy industry in the Pacific Northwest. The HSC may play a role in this study by providing volume/biomass data from red alder stands (both natural and planted). The work is contingent upon funding.
Summaries and/or updates of these research projects are presented later in this report.
Managing red alder stands has finally gained wide acceptance in the region in part due to the efforts of the HSC and all of its members. The vision and dedication of this group has resulted in great improvements in the understanding and management of red alder. May it continue to do so.

6
History of the HSC
The Hardwood Silviculture Cooperative (HSC) is a multi-faceted research and education program focused on the silviculture of red alder (Alnus rubra) and mixes of red alder and Douglas-fir (Pseutotsuga menzeisii) in the Pacific Northwest. The goal of the HSC is improving the understanding, management, and production of red alder. The activities of the HSC have already resulted in significant gains in understanding of regeneration and stand management, and have highlighted the potential of red alder to contribute to both economic and ecological forest management objectives.
The HSC, begun in 1988, is a combination of industry and both federal and state agency members, each with their own reasons for pursuing red alder management. For instance, some want to grow red alder for high-quality saw logs, while others want to manage red alder as a component of bio-diversity. What members have in common is that they all want to grow red alder to meet their specific objectives.
Members invest in many ways to make the HSC a success. They provide direction and funds to administer the Cooperative. They provide the land for research sites and the field crews for planting, thinning, and taking growth measurements.
The HSC’s highest priority is to understand the response of red alder to intensive management. To accomplish this, the HSC has installed 26 variable-density plantations extending from Coos Bay, Oregon to Vancouver Island, British Columbia. The majority of plantations are located in the Coast Range, with a few in the Cascade Range. The plantation distribution covers a wide range of geographic conditions and site qualities. At each site, cooperators planted large blocks of red alder at densities of 100, 230, 525, and 1200 trees per acre. Each block is subdivided into several treatment plots covering a range of thinning and pruning options (twelve total treatments per site).
In addition to the 26 variable-density plantations, the HSC has related studies in naturally regenerated stands. Young stands (less than 15 years old) of

7
naturally regenerated red alder, 5 to 10 acres in size, were pursued as a means of short-cutting some of the lag time before meaningful thinning results could be obtained from the variable-density plantations. It came as a surprise to find only four naturally regenerated stands of the right age and size available in the entire Pacific Northwest.
The HSC has also established seven mixed species plantations of red alder and Douglas-fir. They are located on land designated as Douglas-fir site class III or below. Each plantation is planted with 300 trees per acre with five pro-portions of the two species. The site layout is designed to look at the interac-tions between the two species. We are finding that in low proportions and when soil nitrogen is limited, red alder may improve the growth of Douglas-fir. This improvement is due to the nitrogen fixing ability of red alder. The management challenge is to find the right proportion of the two species through time to maintain a beneficial relationship.
Since the HSC was established, we have learned a great deal about seed zone transfer, seedling propagation, stocking guidelines, identification of sites appropriate for red alder, and the effects of spacing on early tree growth (see the HSC web-page http://www.cof.orst.edu/coops/hsc for more informa-tion). Furthermore, the data set is now complete enough to begin analyzing the growth response of red alder after thinning and/or pruning. Our ultimate goal is a better understanding of the effects of stand density management on red alder growth and yield, and wood quality and to develop red alder growth models.
The HSC red alder stand management studies are well designed and rep-licated on a scale rarely attempted in forestry. Over the next 20 years, we will harvest much from our investment. Our data set on growth of managed stands will make red alder one of the better-understood forest trees of the Pacific Northwest.
8
BRITISH COLUMBIA
OREGON
VancouverIs.
Casc
ade R
ange
WASHINGTON
Seattle
Vancouver
Coos Bay
1202 4205
4203
42014202
12011203
2201
32063301
3202
52045205
4206
5203
3208 3209 3210
22022302
22052203
32042204
32073203
41024301
4103
4101
5301
2301
2101
2101
1201
Thinned naturalalder stand (Type 1)
2301
Alder variable densityplantation (Type 2)
Mixed alder/Douglas-firreplacement series(Type 3)
3205 2206
4303
4302
Portland
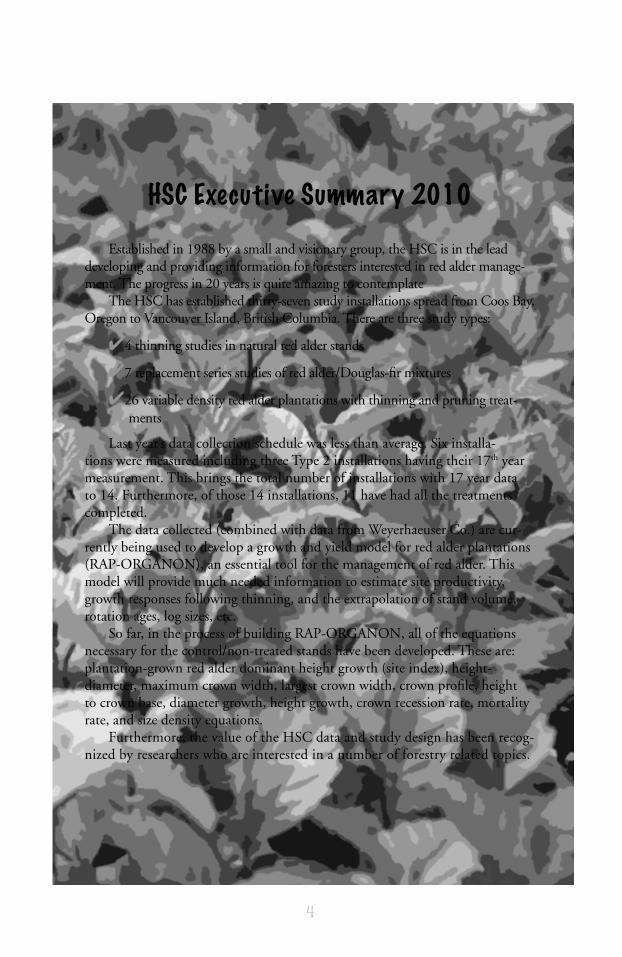
Location of installations for the Red Alder Stand Management Study.

9
Red Alder Stand Management Study
The Red Alder Stand Management Study is divided into three specific types of installations. Study installations are predominately located in the coastal mountain ranges of the Pacific Northwest from Coos Bay, Oregon to Vancou-ver Island, British Columbia (Figure 1). The three types of study installations are as follows:
4 Type 1 is a natural red alder stand thinned to 230 and 525 trees per acre. There are four Type 1 installations.
4 Type 2 is a variable-density red alder plantation. At each site, red alder is planted in large blocks at densities of 100, 230, 525, and 1200 trees per acre. Each block is subdivided into several thinning and pruning treatments. There are twenty-six Type 2 installations.
4 Type 3 is a mixed species plantation of red alder and Douglas-fir. Each site is planted to 300 trees per acre with five proportions of the two species. There are seven Type 3 installations.
The primary focus of the Red Alder Stand Management study continues to be the Type 2 variable-density plantations. Type 2 installations are distributed across a matrix of five ecological regions and three site quality classes (Table 1).
With each passing year, more and more treatments are applied and more data is collected. Tables 2, 3, and 4 describe the data collection schedules for the three installa-tion types. The shaded areas of the tables indicate the activities that have been com-pleted and illustrate the tremendous accomplishments of the HSC to date.
Winter 2009/10 was a relatively light field season. Measurements and various treat-ments were completed on 6 of the 37 installations (see Table 5). Last years work included:
4 One Type 1 installation was measured.
4 Janicki (4102, WADNR) had its 19th year measurement. This is the 3rd Type 1 installation with 19 year post-thinning data.
4 Five Type 2 installations had fieldwork.
4 Three sites- Blue Mtn. (3206, WHC), Campbell River (4203, BCMIN), and Hemlock Creek (5204, WHC) had their 17th year measurement. In addition, Campbell River and Scappoose (3209, BLM) had their 4th and final pruning lift and their last thinning treatment. Finally, John’s River (2201, WHC) had its 3rd pruning lift.
4 As of this year, 14 of the 26 Type 2 installations have had their 17th year mea-surement and 11 of these have all treatments completed.
4 No Type 3 installations had fieldwork.

10
Table 1. Matrix of Type 2 installations. Each installation identified by number, ownership, and year planted.
Site Quality Low Medium High
Region SI50 :23-27 M SI50 :28-32 M SI50 :33+ M SI20 :14-17 M SI20 :18-20 M SI20 :21+ M
1) Sitka Spruce North X 1201 DNR ‘91 1202 BCMin ‘94 1203 DNR ‘96
2) Sitka Spruce South 2202 SNF ‘91 2203 ANE ‘92 2201 WHC ‘90 2206 SNF ‘95 2204 SNF ‘94 2205 ANE ‘94
3) Coast Range 3202 WHC ‘90 3204 SNF ‘92 3205 ODF ‘92 3203 CAM ‘92 3209 BLM ‘95 3207 BLM ‘94 3206 WHC ‘93 3208 ODF ‘97 3210 OSU ‘97
4) North Cascades 4205 BCMin ‘94 4202 GYN ‘90 4203 BCMin ‘93 4201 GYN ‘89 4206 DNR ‘95
5) South Cascades 5205 GPNF ‘97 5203 BLM ‘92 X
5204 WHC ‘93
Definition of Acronyms
1. ANE-ANE Hardwoods 7. MBSNF-Mt. Baker Snoqualmie National Forest 2. BCMin-British Columbia Ministry of Forests. 8. CAM-Campbell Group 3. BLM-Bureau of Land Management. 9. ODF-Oregon Department of Forestry. 4. DNR-Washington Department of Natural Resources. 10. OSU-Oregon State University Forest Research Laboratory. 5. GYN-Goodyear-Nelson. 11. SNF-Siuslaw National Forest. 6. GPNF-Gifford Pinchot National Forest. 12. WHC-Washington Hardwood Commission.
This coming year’s fieldwork (Winter 2010/11) will have almost double the field-work as last year. A total of 11 installations need either a measurement or a treatment. See Table 6 for the list of activities. Work includes:
4 No Type 1 measurement:
4 Eight Type 2 installations:
4 Humphrey Hill (4201, GYN): 22nd year measurement
4 Lucky Creek (1202, BCMIN): 17th year measurement and 3rd pruning lift
4 Cape Mtn. (2204, SNF): 17th year measurement, 3rd pruning lift and possibly the 30ft HLC thin
4 Siletz (2205, ANE): 17th year measurement, 3rd pruning lift and possibly the 30ft HLC thin

11
Table
2a. D
ata C
ollec
tion S
ched
ule fo
r Typ
e 2 In
stalla
tions
. Sha
ded a
reas
indic
ate c
omple
ted a
ctivit
ies.
TYPE
2
GYN
WHC
W
HC
GYN
DNR
SNF
NWH
NWH
SNF
ODF
BLM
W
HC
BCm
inSit
e Num
ber
4201
22
01
3202
42
02
1201
22
02
2203
32
03
3204
32
05
5203
32
06
4203
Site N
ame
Hum
phre
y Jo
hn’s R
. Ry
derw
ood
Clear
Lake
La
Push
Po
llard
Pio
neer
Sit
kum
Ke
ller-G
rass
Sham
u Th
omps
on
Blue
Mtn
. M
ohun
Ck.
Year
Plan
ted
1989
19
90
1990
19
90
1991
19
91
1992
19
92
1992
19
92
1992
19
93
1993
1st y
r Reg
en
1990
19
91
1991
19
91
1992
19
92
1993
19
93
1993
19
93
1993
19
94
1994
2nd y
r Reg
en
1991
19
92
1992
19
92
1993
19
93
1994
19
94
1994
19
94
1994
19
95
1995
Plot I
nsta
llatio
n 19
92
1993
19
93
1993
19
94
1994
19
95
1995
19
95
1995
19
95
1996
19
963r
d yr M
easu
re
1992
19
93
1993
19
93
1994
19
94
1995
19
95
1995
19
95
1995
19
96
1996
3-5 y
r Thin
19
93
1996
19
96
1994
19
96
1996
19
97
1998
19
97
1997
19
96
1998
19
98Pr
une L
ift 1
6ft
1995
19
96
1996
19
96
1996
19
96
1997
19
98
1997
19
97
1996
19
98
1998
6th y
r Mea
sure
19
95
1996
19
96
1996
19
97
1997
19
98
1998
19
98
1998
19
98
1999
19
9915
-20’
HLC T
hin
1995
19
99/0
7 19
99
1996
19
99
1999
/02
2000
20
01
2001
20
00
2000
20
02
2001
/03
Prun
e Lift
2 12
ft 19
95
2002
19
99
1996
20
02
2000
20
00
2001
19
99
2000
20
00
2002
20
029t
h yr M
easu
re
1998
19
99
1999
19
99
2000
20
00
2001
20
01
2001
20
01
2001
20
02
2002
Prun
e Lift
3 18
ft 19
98
2010
20
02
1999
20
08
2003
20
04
2001
20
09
2004
20
04
2002
20
0712
th yr
Mea
sure
20
01
2002
20
02
2002
20
03
2003
20
04
2004
20
04
2004
20
04
2005
20
0530
-32’
HLC T
hin
2001
20
12?
NA
2002
20
11?
2008
20
09
2004
NA
20
07
2009
20
07
2010
Prun
e Lift
4 22
ft
2001
20
12?
2002
20
02
2013
? 20
08
2009
20
04
2014
20
07
2009
20
05
2010
17th
yr M
easu
re
2006
20
07
2007
20
07
2008
20
08
2009
20
09
2009
20
09
2009
20
10
2010
22nd
yr M
easu
re
2011
20
12
2012
20
12
2013
20
13
2014
20
14
2014
20
14
2014
20
15
2015

12
Table
2b. D
ata C
ollec
tion S
ched
ule fo
r Typ
e 2 In
stalla
tions
. Sha
ded a
reas
indic
ate c
omple
ted a
ctivit
ies.
TYPE
2
WHC
BC
min
SNF
NWH
BLM
BC
min
SNF
BLM
DN
R DN
R OD
F OS
U GP
NFSit
e Num
ber
5204
12
02
2204
22
05
3207
42
05
2206
32
09
4206
12
03
3208
32
10
5205
Site N
ame
Hem
lock C
k. Lu
cky C
k. Ca
pe M
tn.
Silet
z Do
ra
Frenc
h Ck.
Mt.
Gauld
y Sc
appo
ose
Darri
ngto
n M
axfie
ld W
eebe
W
rong
way
Tong
ue M
tn.
Year
Plan
ted
1993
19
94
1994
19
94
1994
19
94
1995
19
95
1995
19
96
1997
19
97
1997
1st y
r Reg
en
1994
19
95
1995
19
95
1995
19
95
1996
19
96
1996
19
97
1998
19
98
1998
2nd y
r Reg
en
1995
19
96
1996
19
96
1996
19
96
1997
19
97
1997
19
98
1999
19
99
1998
Plot I
nsta
llatio
n 19
96
1997
19
97
1997
19
96
1996
19
97
1998
19
97
1998
20
00
2000
20
003r
d yr M
easu
re
1996
19
97
1997
19
97
1997
19
97
1998
19
98
1998
19
99
2000
20
00
2000
3-5 y
r Thin
19
98
1999
19
99
1999
19
99
1999
20
01
2000
20
00/0
1 20
02
2003
20
03/0
6 20
03/0
7Pr
une L
ift 1
6ft
NA
1999
19
99
1999
NA
19
99
2001
20
00
2000
20
02
2003
20
03
NA6t
h yr M
easu
re
1999
20
00
2000
20
00
2000
20
00
2001
20
01
2001
20
02
2003
20
03
2003
15-2
0’ HL
C Thin
20
02
2006
/08
2006
20
03/0
6 20
03
2003
/11
2004
/07
2004
/07
2002
/07
2005
/08
2007
/12
2007
/09
2009
/12
Prun
e Lift
2 12
ft NA
20
06
2003
20
03
NA
2003
20
04
2004
20
02
2005
20
09
2006
NA
9th y
r Mea
sure
20
02
2003
20
03
2003
20
03
2003
20
04
2004
20
04
2005
20
06
2006
20
06Pr
une L
ift 3
18ft
NA
2011
20
11
2011
NA
20
06
2012
20
10
2004
20
11
2012
20
11
NA12
th yr
Mea
sure
20
05
2006
20
06
2006
20
06
2006
20
07
2007
20
07
2008
20
09
2009
20
0930
-32’
HLC T
hin
2007
?
2011
? 20
11?
? 20
11?
2012
? 20
10
2012
20
11?
? 20
11?
?Pr
une L
ift 4
22 ft
NA
?
? ?
NA
2011
20
12?
2010
20
07
2013
? ?
2014
? NA
17th
yr M
easu
re
2010
20
11
2011
20
11
2011
20
11
2012
20
12
2012
20
13
2014
20
14
2014
22nd
yr M
easu
re
2015
20
16
2016
20
16
2016
20
16
2017
20
17
2017
20
18
2019
20
19
2019
13
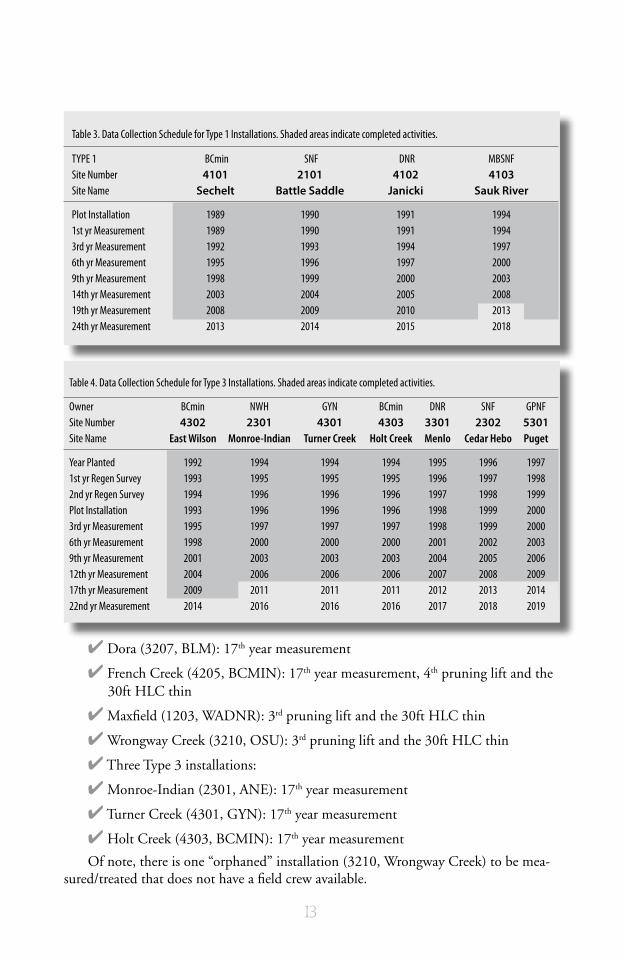
Table 3. Data Collection Schedule for Type 1 Installations. Shaded areas indicate completed activities.
TYPE 1 BCmin SNF DNR MBSNFSite Number 4101 2101 4102 4103Site Name Sechelt Battle Saddle Janicki Sauk River
Plot Installation 1989 1990 1991 19941st yr Measurement 1989 1990 1991 19943rd yr Measurement 1992 1993 1994 19976th yr Measurement 1995 1996 1997 20009th yr Measurement 1998 1999 2000 200314th yr Measurement 2003 2004 2005 200819th yr Measurement 2008 2009 2010 201324th yr Measurement 2013 2014 2015 2018
Table 4. Data Collection Schedule for Type 3 Installations. Shaded areas indicate completed activities.
Owner BCmin NWH GYN BCmin DNR SNF GPNFSite Number 4302 2301 4301 4303 3301 2302 5301Site Name East Wilson Monroe-Indian Turner Creek Holt Creek Menlo Cedar Hebo Puget
Year Planted 1992 1994 1994 1994 1995 1996 1997 1st yr Regen Survey 1993 1995 1995 1995 1996 1997 1998 2nd yr Regen Survey 1994 1996 1996 1996 1997 1998 1999 Plot Installation 1993 1996 1996 1996 1998 1999 2000 3rd yr Measurement 1995 1997 1997 1997 1998 1999 2000 6th yr Measurement 1998 2000 2000 2000 2001 2002 2003 9th yr Measurement 2001 2003 2003 2003 2004 2005 2006 12th yr Measurement 2004 2006 2006 2006 2007 2008 2009 17th yr Measurement 2009 2011 2011 2011 2012 2013 2014 22nd yr Measurement 2014 2016 2016 2016 2017 2018 2019
4 Dora (3207, BLM): 17th year measurement
4 French Creek (4205, BCMIN): 17th year measurement, 4th pruning lift and the 30ft HLC thin
4 Maxfield (1203, WADNR): 3rd pruning lift and the 30ft HLC thin
4 Wrongway Creek (3210, OSU): 3rd pruning lift and the 30ft HLC thin
4 Three Type 3 installations:
4 Monroe-Indian (2301, ANE): 17th year measurement
4 Turner Creek (4301, GYN): 17th year measurement
4 Holt Creek (4303, BCMIN): 17th year measurement
Of note, there is one “orphaned” installation (3210, Wrongway Creek) to be mea-sured/treated that does not have a field crew available.

14
Table 5. Hardwood Silviculture Cooperative Field Activities, Winter 2009/10
Type Activity Installation Cooperator
Type 1 19 yr measurement 4102 DNR- Janicki
Type 2 3rd Pruning Lift 2201 WHC- John’s River 3209 BLM- Scappoose
17yr Measurement 3206 WHC- Blue Mtn. 4203 BCMIN- Campbell River 5204 WHC- Hemlock Ck.
30ft HLC Thin 4203 BCMIN- Campbell River 3209 BLM- Scappoose
4th Pruning Lift 4203 BCMIN- Campbell River
Type 3 None
Table 6. Hardwood Silviculture Cooperative Field Activities, Winter 2010/11
Type Activity Installation Cooperator
Type 1 None
Type 2 3rd Pruning Lift 1202 BCMIN- Lucky Creek 2204 SNF- Cape Mtn. 2205 ANE- Siletz 1203 WADNR- Maxfield 3210 OSU- Wrongway Creek
17yr Measurement 1202 BCMIN- Lucky Creek 2204 SNF- Cape Mtn. 2205 ANE- Siletz 3207 BLM- Dora 4205 BCMIN- French Creek
30ft HLC Thin 2204 SNF- Cape Mtn.? 2205 ANE- Siletz? 4205 BCMIN- French Creek 1203 WADNR- Maxfield 3210 OSU- Wrongway Creek
4th Pruning Lift 4205 BCMIN- French Creek
22yr Measurement 4201 GYN- Humphrey Hill
Type 3 17yr Measurement 2301 ANE- Monroe Indian 4301 GYN- Turner Creek 4303 BCMIN- Holt Creek

15
Current HSC Activities
ORGANON GROwth ANd Yield MOdeliNG
Updates
As described in last year’s annual report, the HSC is developing a new version of ORGANON for red alder plantations (RAP-ORGANON). This version will be the first red alder growth and yield model that will specifically model the behavior of plantations. Described in last year’s report were the accom-plishments thus far. They were:
The data was cleaned and formatted, then “explored” (i.e. looking at the ranges and patterns of the data, identifying relationships, looking for “weird” behavior, etc.). In ad-dition, the effect of planting density on height growth was tested and dominant height growth equations were then developed to calculate site index.
The following equations were then developed:
4 Maximum crown width
4 Largest crown width
4 Crown profile
4 Height-diameter
4 Height-to-crown-base
However, during the development of additional equations, errors in the database were detected. These errors did not ignore existing equations but required reformatting the database for further analysis. It was then decided to take this opportunity to add ad-ditional data collected since the original database had been created. Although requiring additional effort, the updated database is much more robust with thousands of mea-surements added of (mostly) older trees. New parameter estimates were then calculated for the equations already completed.
progress
The following is a synopsis/summary of RAP-ORGANON equations developed last year. Full reports and final parameter estimates for all equations will be released after model testing.
Diameter Growth
The diameter growth rate (∆D) used in ORGANON is a function of tree (dbh [D], crown ratio [CR], and basal area per acre in larger trees [BAL]) and plot (site index

16
[RASI] and basal area per acre [BA]) attributes. The general model form used to predict the diameter growth rate of red alder growing in plantations is:
D
Xbi
ii
eD ∆
∑+=∆ = ε
6
0
Where,X
0 = 1.0
X1 = ln(D + 1.0)
X2 = D
X3 = ln[(CR + 0.2)/1.2]
X4 = ln(RASI – 4.5)
X5 = BAL/ln(D + 1.0)
X6 = BA1/2
The modeling dataset attributes used in developing the diameter growth rate equa-tion are shown in Table 7.
Three different approaches were used to estimate the parameters from the control plot data:
4 A weighted nonlinear regression fit to periodic annual increment data (central PAI).
4 An unweighted nonlinear regression fit to the periodic data (unweighted sum-mation).
4 A weighted nonlinear regression fit to the periodic data (weighted summation).
Using the three methods, the parameters and their standard errors were calculated and each set of parameters was evaluated for how well they characterized the modeling
Table 7. Descriptive statistics for the modeling dataset used in developing the diameter growth (∆D) equation of plantation grown red alder.
Attribute Mean Minimum Maximum Std. Deviation
Tree Level Attributes: N = 31,977
∆D (in.) 0.47 -0.43 2.13 0.26D (in.) 3.51 0.2 12.8 1.91CR 0.7539 0.0523 1.0000 0.1856BAL (ft.2/ac.) 21.54 0.00 130.31 21.20
Plot/Measurement Level Attribute: N = 600
BA (ft.2/ac.) 43.89 0.46 131.83 31.89
Plot Level Attribute: N = 196
RASI (ft.) 64.1 32.2 89.9 10.25

17
The final decision on which method to use in RAP-ORGANON must wait until the results from fitting the other dynamic equations have been ana-lyzed. The analysis does indicate that the weighted summation procedure often produced results that were a compromise between the other two procedures. Therefore, graphs of predictions from this equation are found in Figures 2 and 3. Figure 2 shows the maximum predicted ∆D
dataset and then validated by determining how well they characterized their respective validation datasets.
The weighted central PAI procedure had the best fit statistics (using the mean re-sidual [a measure of bias], the root mean square error [a measure of accuracy], and the adjusted coefficient of determination [R
a2]). This method also had the best fit statistics
using the validation dataset. Table 8 and Table 9 show the evaluation and validation fit statistics, respectively, for the three modeling approaches.
Table 8. Evaluation fit statistics for unweighted residuals (predicted minus actual) using the diameter growth (∆D) model form.
Estimation Procedure Bias RMSE Ra2
Weighted Central PAI +0.0000 0.1362 0.7308 Unweighted Summation -0.0098 0.1371 0.7271 Weighted Summation -0.0066 0.1368 0.7283
Table 9. Validation fit statistics for unweighted residuals (predicted minus actual) using the diameter growth (∆D) model form.
Estimation Procedure Bias RMSE Ra2
Weighted Central PAI -0.0276 0.1360 0.6100Unweighted Summation -0.0368 0.1373 0.6025Weighted Summation -0.0357 0.1371 0.6034
1.6
1.4
1.2
1.0
0.8
0.6
0.4
0.2
0 5 10 15 20 25
Max
imum
Ann
ual D
iam
eter
Gro
wth
Rat
e
DBH
SI406080
Predicted maximum annual diameter growth rate (∆D) for an open grown tree with a measured diameter (D) and site index (RASI). Parameters of the model were determined using the weighted summation method.
18
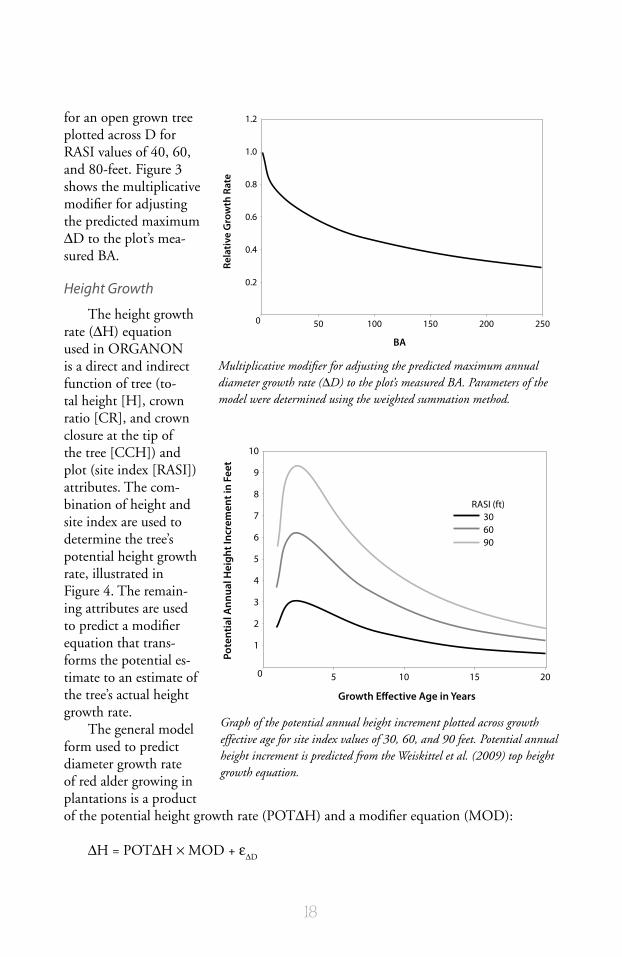
for an open grown tree plotted across D for RASI values of 40, 60, and 80-feet. Figure 3 shows the multiplicative modifier for adjusting the predicted maximum ∆D to the plot’s mea-sured BA.
Height Growth
The height growth rate (∆H) equation used in ORGANON is a direct and indirect function of tree (to-tal height [H], crown ratio [CR], and crown closure at the tip of the tree [CCH]) and plot (site index [RASI]) attributes. The com-bination of height and site index are used to determine the tree’s potential height growth rate, illustrated in Figure 4. The remain-ing attributes are used to predict a modifier equation that trans-forms the potential es-timate to an estimate of the tree’s actual height growth rate.
The general model form used to predict diameter growth rate of red alder growing in plantations is a product of the potential height growth rate (POT∆H) and a modifier equation (MOD):
∆H = POT∆H × MOD + ε∆D
1.2
1.0
0.8
0.6
0.4
0.2
0 50 100 150 200 250
Rela
tive
Gro
wth
Rat
e
BA
Multiplicative modifier for adjusting the predicted maximum annual diameter growth rate (∆D) to the plot’s measured BA. Parameters of the model were determined using the weighted summation method.
10
9
8
7
6
5
4
3
2
1
0 5 10 15 20
Pote
ntia
l Ann
ual H
eigh
t Inc
rem
ent i
n Fe
et
Growth E�ective Age in Years
RASI (ft)306090
Graph of the potential annual height increment plotted across growth effective age for site index values of 30, 60, and 90 feet. Potential annual height increment is predicted from the Weiskittel et al. (2009) top height growth equation.
19
Where,
5.04
215.0
321 )0.1(0 )((
CCHbeCRCCHbbCCHbCCHbb eeeebMOD −−++ −+=
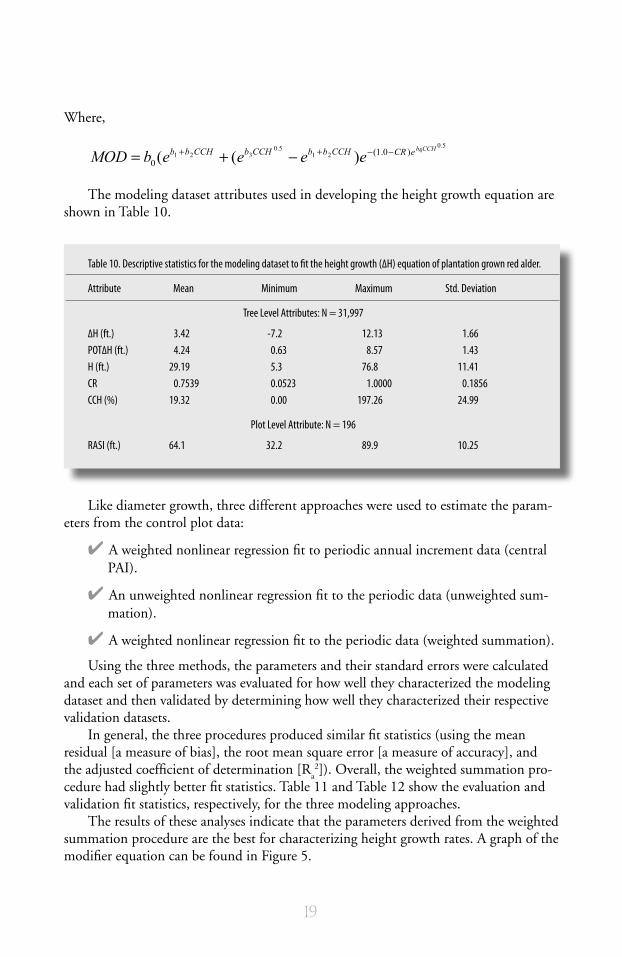
The modeling dataset attributes used in developing the height growth equation are shown in Table 10.
Table 10. Descriptive statistics for the modeling dataset to fit the height growth (∆H) equation of plantation grown red alder.
Attribute Mean Minimum Maximum Std. Deviation
Tree Level Attributes: N = 31,997
∆H (ft.) 3.42 -7.2 12.13 1.66POT∆H (ft.) 4.24 0.63 8.57 1.43H (ft.) 29.19 5.3 76.8 11.41CR 0.7539 0.0523 1.0000 0.1856CCH (%) 19.32 0.00 197.26 24.99
Plot Level Attribute: N = 196
RASI (ft.) 64.1 32.2 89.9 10.25
Like diameter growth, three different approaches were used to estimate the param-eters from the control plot data:
4 A weighted nonlinear regression fit to periodic annual increment data (central PAI).
4 An unweighted nonlinear regression fit to the periodic data (unweighted sum-mation).
4 A weighted nonlinear regression fit to the periodic data (weighted summation).
Using the three methods, the parameters and their standard errors were calculated and each set of parameters was evaluated for how well they characterized the modeling dataset and then validated by determining how well they characterized their respective validation datasets.
In general, the three procedures produced similar fit statistics (using the mean residual [a measure of bias], the root mean square error [a measure of accuracy], and the adjusted coefficient of determination [R
a2]). Overall, the weighted summation pro-
cedure had slightly better fit statistics. Table 11 and Table 12 show the evaluation and validation fit statistics, respectively, for the three modeling approaches.
The results of these analyses indicate that the parameters derived from the weighted summation procedure are the best for characterizing height growth rates. A graph of the modifier equation can be found in Figure 5.

20
Crown Recession
The crown recession rate (∆HCB) used in ORGANON is an indirect approach that uses a static HCB equation to predict HCB at the start and end of the growth period and then uses the difference as an estimate of ∆HCB (versus a dynamic equa-tion that directly predicts ∆HCB). The objective of this analysis is to develop a direct dynamic equation for ∆HCB that can then be compared to the traditional indirect approach when the equations are inserted into RAP-ORGANON. The direct ∆HCB function uses both tree (predicted height growth rate [P∆H], crown ratio [CR], crown length [CL], and, possibly, growth effective age [GEA] which can be computed without knowing the tree’s or stand’s actual age) and plot (crown competition factor [CCF] and, possibly, the total number of years since seed for the plantation [TAGE]) attributes.
Table 11. Evaluation fit statistics for unweighted residuals (predicted minus actual) using the height growth (∆H) model form.
Estimation Procedure Bias RMSE Ra2
Weighted Central PAI +0.0133 1.0567 0.5957Unweighted Summation -0.0196 1.0555 0.5966Weighted Summation +0.0130 1.0545 0.5974
Table 12. Validation fit statistics for unweighted residuals (predicted minus actual) using the height growth (∆H) model form.
Estimation Procedure Bias RMSE Ra2
Weighted Central PAI -0.1482 1.0484 0.5066Unweighted Summation -0.1586 1.0592 0.4963Weighted Summation -0.1351 1.0490 0.5060
1.2
1.0
0.8
0.6
0.4
0.2
0 0.5 0.60.1 0.2 0.3 0.4 0.90.7 0.8 1.0
Rela
tive
Gro
wth
Rat
e
Crown Ratio
CCH015
2050
100
Graph of the mul-tiplicative modifier equation on poten-tial height growth (POT∆H) for predict-ing height growth (∆H) plotted across crown ratio (CR) for crown closure at the tip of the tree (CCH) values of 0, 1, 5, 20, 50, and 100 percent. POT∆H is predicted from the Weiskittel et al. (2009) top height growth equation.

21
The following general model form used here for predicting ∆HCB of red alder growing in plantations is:
DXbXbXbXbb
b
b
e
HPCLHCB ∆++++
++
∆+=∆ ε4736
524132
1
0.1
)(
Where,X
1 = ln(CR)
X2 = CR
X3 = GEA or TAGE
X4 = ln(CCF + 1.0)
Because the definition of HCB differed between the HSC and the Weyerhaeuser Co. (WeyCo) datasets, separate equations were fit to each data set. A description of the two sets of control plots employed is found in Table 13 for the HSC dataset and Table 14 for the WeyCo dataset.
Table 13. Descriptive statistics for the HSC modeling data set to fit the crown recession (∆HCB) equations for plantation grown red alder.
Attribute Mean Minimum Maximum Std. Deviation
Tree Level Attributes: N = 11,230
∆HCB (ft.) 1.67 -5.00 10.80 1.72P∆H (ft.) 3.28 0.47 7.59 1.52CL (ft.) 19.97 0.63 51.7 8.76CR 0.7273 0.0523 0.9908 0.1790GEA (yr.) 7.02 1.83 22.80 3.48
Plot/Measurement Level Attribute: N = 321
CCF (%) 223.72 10.69 670.20 169.60TAGE (yr.) 9.1 4.5 15 3.3
Table 14. Descriptive statistics for the WeyCo modeling data set to fit the crown recession (∆HCB) equations for plantation grown red alder.
Attribute Mean Minimum Maximum Std. Deviation
Tree Level Attributes: N = 20,747
∆HCB (ft.) 2.63 -6.57 13.00 1.90P∆H (ft.) 3.54 0.39 6.37 1.20CL (ft.) 20.72 3.03 47.70 5.90CR 0.7684 0.1233 1.0000 0.1875GEA (yr.) 6.35 1.93 21.53 2.64 Plot/Measurement Level Attribute: N = 279
CCF (%) 285.41 31.36 708.36 142.80TAGE (yr.) 8.8 3 15 3.3

22
Like before, three different approaches were used to estimate the parameters from the control plot data. However, for each approach, two equations were developed. One using GEA and the other using TAGE :
4 A weighted nonlinear regression fit to periodic annual increment data (central PAI).
4 An unweighted nonlinear regression fit to the periodic data (unweighted sum-mation).
4 A weighted nonlinear regression fit to the periodic data (weighted summation).
Therefore, a total of 12 equations were developed, evaluated, and validated. For each equation, the parameters and their standard errors were calculated and each set of pa-rameters was evaluated for how well they characterized the modeling dataset and then validated by determining how well they characterized their respective valida-tion datasets.
Table 15 and Table 16 show the eval-uation fit statistics for the three modeling approaches, for the HSC and WeyCo datasets, respectively.
Table 17 and Table 18 show the eval-uation fit statistics for the three modeling approaches, for the HSC and WeyCo datasets, respectively.
The results indicate that the weighted central PAI estimation method produced parameters that were better fits to both the evaluation and validation datasets than the other two parameter estimation meth-ods. For the HSC dataset, the equations incorporating GEA were better than the equations incorporating TAGE. For the WeyCo dataset, the equations incorporat-ing TAGE were better than the equations incorporating GEA.
The maximum crown recession rate (∆HCB) using the central weighted PAI method, the HSC data/equation, and GEA is presented in Figure 6. The maximum crown recession rate (∆HCB) using the central weighted PAI method, the WeyCo data/equation, and TAGE is presented in Figure 7.
Table 15. Evaluation fit statistics for unweighted residuals (predicted minus actual) from the HSC dataset using the crown recession (∆HCB) model form and using a) TAGE and b) GEA.
a) TAGE
Estimation Procedure Bias (ft) RMSE (ft) Ra2
Weighted Central PAI -0.039 1.338 0.3968Unweighted Summation -0.0346 1.3375 0.3973Weighted Summation -0.0598 1.3511 0.385
b) GEA
Estimation Procedure Bias (ft) RMSE (ft) Ra2Weighted Central PAI -0.0239 1.3279 0.4058Unweighted Summation -0.0492 1.3381 0.3967Weighted Summation -0.0687 1.3468 0.3889
Table 16. Evaluation fit statistics for unweighted residuals (predicted minus actual) from the WeyCo dataset using the crown recession (∆HCB) model form and using a) TAGE and b) GEA.
a) TAGE
Estimation Procedure Bias (ft) RMSE (ft) Ra2
Weighted Central PAI +0.0062 1.3044 0.5281Unweighted Summation +0.1437 1.3580 0.4885Weighted Summation +0.0520 1.3605 0.4866
b) GEA
Estimation Procedure Bias (ft) RMSE (ft) Ra2
Weighted Central PAI +0.0013 1.3404 0.5017Unweighted Summation +0.1510 1.4006 0.4559Weighted Summation +0.0348 1.3938 0.4612

23
Table 17. Validation fit statistics for unweighted residuals (predicted minus actual) from the HSC dataset using the crown recession (∆HCB) model form and using a) TAGE and b) GEA.
a) TAGE
Estimation Procedure Bias (ft) RMSE (ft) Ra2Weighted Central PAI +0.2183 1.1042 0.4298Unweighted Summation +0.1150 1.1653 0.3649Weighted Summation +0.0956 1.0996 0.4345
b) GEA
Estimation Procedure Bias (ft) RMSE (ft) Ra2Weighted Central PAI +0.0976 1.0984 0.4357Unweighted Summation +0.0775 1.1602 0.3705Weighted Summation -0.0942 1.1209 0.4125
Table 18. Validation fit statistics for unweighted residuals (predicted minus actual) from the WeyCo dataset using the crown recession (∆HCB) model form and using a) TAGE and b) GEA.
a) TAGE
Estimation Procedure Bias (ft) RMSE (ft) Ra2Weighted Central PAI -0.0660 1.1839 0.5988Unweighted Summation +0.0592 1.2490 0.5535Weighted Summation -0.0081 1.2388 0.5607 b) GEA
Estimation Procedure Bias (ft) RMSE (ft) Ra2Weighted Central PAI -0.1597 1.2061 0.5836Unweighted Summation -0.0073 1.2962 0.5190Weighted Summation -0.1228 1.2889 0.5244
9
8
7
6
5
4
3
2
1
0 3010 20 5040 60
Max
ium
Cro
wn
Rece
ssio
n Ra
te
Crown Length Plus Predicted Height Growth Rate
16
14
12
10
8
6
4
2
0 3010 20 5040 60
Max
ium
Cro
wn
Rece
ssio
n Ra
te
Crown Length Plus Predicted Height Growth Rate
Maximum predicted crown recession rate (∆HCB) using the central weighted PAI method for the HSC equation with GEA.
Maximum predicted crown recession rate (∆HCB) using the central weighted PAI method for the WeyCo equation with TAGE.

24
Size Density
The maximum size-density trajectory is used as an option in the ORGANON model to restrict stand development in a manner that keeps the stand on or below the maximum size-density trajectory as it develops over time. The following is the maxi-mum size-density trajectory equation used in ORGANON:
ln(QMDi)=a
1−a
2∙ln(N
i)−(a
1∙a
4)∙(N
i/N
0)a3
The first step of the analysis was to ascertain whether the plots in the ORGANON dataset had developed enough so that their most recent measurements fell on the maxi-mum size-density line. Two methods were used to assess this situation.
The first involved calculating the stand density index (SDI) values for each mea-surement on each plot. This was done using both Reineke’s exponential parameter and Puettmann’s exponential parameter for red alder. It was expected that stands with measurements falling on the maximum size-density line would have near constant SDI values in the latter measurements. Examination of the data indicated that there were no plots in which the last two values of SDI were near the same.
The second method involved calculating the slope value using all consecutive pairs of measurements available on each plot. It was expected that stands with measurements falling on or near the maximum size-density line would have slope values between −0.5 and −1.0 for at least the last measurement. Only 15 of the 196 control plots had the last pair of measurements meet this criterion.
The 15 control plots were then used to estimate the parameters of the above equa-tion but the resulting values were not reasonable. The value of a
2 was then fixed first to
Reineke’s value of 0.62 and then to Puettmann’s value of 0.64. But again the remaining parameters were unreasonable. This led to the conclusion that the datasets had not de-veloped far enough for them to be useful in estimating the parameters of the maximum size-density trajectory of red alder plantations. Therefore, it was decided to use the Puettmann parameter for RAP-ORGANON.
Mortality
The mortality rate equation used in ORGANON is a generalized logistic model of the following form:
)],(exp[0.1
1
bXfPM
+=
Where,
PM = the probability of the tree dying in the next yearX = an array of independent variablesb = an array of additional regression parameters
)],([ bXf = a linear or nonlinear function of the values in parentheses

25
Although this general form has been quite similar in many studies, the particu-lar independent variables vary substantially. These variables can be classed into four groups: tree size, tree vigor, tree position in the stand, and stand density. Variables used in previous versions of ORGANON include dbh, crown ratio (CR), site index (SI), basal area in trees with dbh larger than the subject tree (BAL), and crown closure at the tip of the tree (CCH). Dozens of model forms were fit (along with various variable transformations). The evaluation, validation, and decision on the final model form are pending.
OtheR Red AldeR ReseARch
Frankia popUlation dynamics in red alder stands
The work by Dr. Peter Kennedy, Department of Biology, Lewis and Clark College, on the structure, diversity, and assemblages of nitrogen-fixing Frankia populations in red alder forests has been published.
The first article, “Frankia bacteria in Alnus rubra forests: genetic diversity and de-terminants of assemblage structure” has been published in Plant and Soil. The following is a copy of the abstract:
To quantify the genetic diversity of Frankia bacteria associated with Alnus rubra in natural settings and to examine the relative importance of site age, manage-ment, and geographic location in structuring Frankia assemblages in A. rubra forests, root nodules from four A. rubra sites in the Pacific Northwest, USA were sampled. Frankia genetic diversity at each site was compared using se-quencebased analyses of a 606 bp fragment of the nifH gene. At a 3% sequence similarity cutoff, a total of 5 Frankia genotypes were identified from 317 suc-cessfully sequenced nodules. Sites varied in the total number of genotypes pres-ent, but were typically dominated by only one or two genotypes. Phylogenetic analyses showed that all of the A. rubra-Frankia genotypes grouped with other Alnus-infective Frankia. Analysis of similarity (ANOSIM) and chi-square analy-ses indicated that Frankia assemblages were more strongly influenced by site age/management than geographic location. This study demonstrates that the Frankia assemblages in A. rubra forests have low genotype diversity, but that genotype abundance can differ significantly in forests of different age/manage-ment history.
The link to the full article is:
http://www.springerlink.com/content/j5g18w72m1432j59/fulltext.pdf
The second article “A molecular and phylogenetic analysis of the structure and specificity of Alnus rubra ectomycorrhizal assemblages” has been published in Fungal Ecology. The following is a copy of the abstract:
Ectomycorrhizal (EM) assemblages associated with Alnus spp. are often distinct in composition and richness from other host plants. To examine the EM assemblage associated with A. rubra, a common tree in western coastal North America, we sampled

26
four A. rubra forests varying in age, management history, and geographic location in Oregon, USA. From the 364 EM root tip rDNA TS sequences, we found a total of 14 EM taxa. The five most abundant taxa, Tomentella sp. 3, Alnicola escharoides, Tomentella sp. 1, Lactarius cf. obscuratus, and Alpova diplophloeus, represented 80 % of the samples and were present at all four sites. Assemblage structure differed significantly among young managed sites and older unmanaged sites but not by geographic location. The younger managed sites had higher tree density, Frankia frequency, and soil nitrogen than older unmanaged sites. Phylogenetic analyses revealed that Alnus-associated EM congeners were not closely related, indicating the distinct nature of Alnus EM assem-blages is not due to a unique co-evolutionary history.
The full article is not available online. Please contact Andrew Bluhm to obtain a copy.
red alder and climate change
As described in last year’s annual report, the HSC collaborated with multiple Canadian organizations on a project titled “Using red alder as an adaptation strategy to reduce environmental, social and economic risks of climate change in coastal BC”. The idea behind the project is that because the range of red alder is expected to increase with climate change, and it is a short rotation high value crop providing a diversity of wood products, and it improves long-term site productivity and ecosystem resiliency, the increased use of red alder is an adaptation strategy that could reduce environmental, social and economic risks of climate change in coastal B.C. The HSC is involved in the environmental (biological) component through its network of long-term research installations.
The HSC has provided geographic and tree growth information for all of the HSC installation types. The geographic information will be input into the ClimatePNW model to provide climatic information. Effects of climate (GDD, MAT, MAP, growing season precipitation, monthly precipitation, minimum temperature, etc.) on the growth of red alder and Douglas-fir will be examined.
To complement the growth data, the project also includes collection of soils data and foliage data to accurately characterize the installations. This last spring (May 2010), soil samples were collected from all of the replacement and additive installations in the US and BC. Samples will be analyzed for pH, total N, total C, available P, CEC and mineralizable N. This coming fall, Douglas-fir foliage from the same installations will be collected and analyzed for nutrient content. Analysis will proceed through the win-ter with the first results expected in mid- to late 2011.
thinned natUral red alder stand VolUme and stem Form
The WA Dept. of Natural Resources (WADNR) is planning a timber harvest in a hardwood stand that contains the HSC Type 1 installation #4102 (Janicki). The pre-sale layout process has been started; the stand will be cruised this summer/fall and sold/logged (most likely) in the spring of 2011.
Janicki, established in 1976, was thinned in 1990 and just had its 19th year

27
post-thinning measurement. But before the stand is logged, both the HSC and the WADNR decided to collaborate on a project to collect additional information. Although many of the details remain to be worked out, the project will likely contain two main objectives.
Objective 1- Comparison of cruise volume estimates with volume equation estimates
WADNR will provide individual and stand level merchantable volume estimates obtained from their pre-sale cruise. The HSC, using the most recent measurement data, will calculate individual and stand level merchantable volume estimates from existing volume and taper equations. This will allow for comparisons of the estimates. Results would enable WADNR to fine-tune their cruise estimates, to determine which existing volume/taper equation more closely “matches” actual volume, and to determine the ef-fects of thinning on stand volume.
Objective 2- Did thinning effect stem shape
To determine if thinning affected stem shape, upper stem measurements will be taken on a subsample of trees. Diameter outside bark and diameter inside bark will be measured at various locations along the tree bole. This data then can be used to cal-culate and compare Girard form class (17.3ft) and form factor between thinned and unthinned trees. Additional comparisons can be made regarding merchantable height, diameter at base of live crown, most common log lengths (i.e. every 20ft), etc.
Other possible objectives may include: calculating volume by log sort diameters, determine monetary value by applying current prices to log sort volumes, and compar-ing gross and net scale volumes with cruise estimates.
deVelopment oF a sUstainable Woody bioenergy indUstry
A cooperative effort is underway to garner funding to promote and develop a sustainable bioenergy industry in the Pacific Northwest. A proposal will be submitted to the AFRI Sustainable Bioenergy Program. Participants in the proposed effort include (but are not limited to) Oregon State University, Oregon Department of Energy, Washington State University, University of Washington, US Forest Service, Greenwood Resources, University of California.
The mission of the proposed effort is to:
Help to produce a robust, diverse, and environmentally sound bioenergy industry in the Pacific Northwest region based on diverse woody feedstock sources and energy products. Conduct applied research, education, and exten-sion programs to improve the operational efficiency of dedicated plantations, produce ethanol and non-ethanol biofuels and coproducts, initiate demonstra-tion-scale plantings and pilot-scale biofuels production, study partial harvests in coniferous stands, and examine social and environmental implications of production options. Focus feedstock studies on 1) poplars as best established

28
dedicated feedstock system in the Pacific Northwest, 2) alder as a second dedi-cated woody crop, and 3) conifer thinnings, restoration harvests, and woody residuals.
The role of the HSC in this study may be to use the existing data from the research installations (primarily the Type 2, high density treatments) to estimate/calculate po-tential productivity for biomass across a large geographic range using existing volume/biomass equations and the forthcoming RAP-ORGANON. In addition to plantations, biomass red alder may also come from naturally regenerated alder. The HSC could use the large natural stand alder data base that has already been collected to greatly improve the current red alder version of ORGANON.
The deadline for the proposal is September 15, 2010.
29
Direction for 2011
As always, the specific goals for 2011 are both continuations of our long-term objectives and new projects:
4 Continue HSC treatments, measurements and data tasks.
4 Keep the HSC website updated and current.
4 Continue efforts in outreach and education.
4 Continue efforts to recruit new members.
4 Continue working with and analyzing the HSC data.
4 Continue ORGANON modeling efforts in the creation of both a plantation model and a natural-stand model.

30
Appendix 1
suMMARY Of Red AldeR stANd MANAGeMeNt studY tReAtMeNts
type 1- thinned natUral red alder stands
1. Control- measure only, stand left at existing density2. 230 trees/acre (tpa) re-spacing density in year 3 to 53. 525 tpa re-spacing density in year 3 to 54. 230 tpa re-spacing density when height to live crown (HLC) is 15 to 20 feet5. 525 tpa re-spacing density when HLC is 15 to 20 feet6. Control- measure only, stand left at existing density7. 100 tpa re-spacing density when HLC is 30 feet8. 230 tpa re-spacing density when HLC is 30 feet9. Control- measure only, stand left at existing density
type 2- red alder Variable density plantations
1. 100 tpa control- measure only2. 230 tpa control-measure only3. 230 tpa pruned to 6 ft. lift, 12 ft lift, 18 ft lift, 24 ft lift4. 525 tpa control -measure only5. 525 tpa thin to 230 tpa in year 3 to 56. 525 tpa thin to 230 tpa when HLC is 15 to 20 feet7. 525 tpa thin to 230 tpa when HLC is 30 to 32 feet8. 1200 tpa control- measure only9. 1200 tpa thin to 230 tpa in year 3 to 510. 1200 tpa thin to 230 tpa when HLC is 15 to 20 feet12. 1200 tpa thin to 100 tpa when HLC is 15 to 20 feet13. 525 tpa thin to 100 tpa when HLC is 15 to 20 feet
type 3- mixed red alder doUglas-Fir plantations
1. 100% red alder planted at 300 tpa density2. 50% red alder and 50% Douglas-fir planted at 300 tpa density3. 25% red alder and 75% Douglas-fir planted at 300 tpa density4. 11% red alder and 89% Douglas-fir planted at 300 tpa density5. 100% Douglas-fir planted at 300 tpa density
31
Appendix 2
hsc MANAGeMeNt cOMMittee MeetiNG MiNutes
sUmmer management committee meeting minUtes
Tuesday July 7, 2009:
Attendees: Andrew Bluhm, David Hibbs- OSU; Scott McLeod, Chris Rasor, Florian Deisenhofer, Jared Larwick, Scott Hancock, Jacob Vaughn, Marcus Johns, Leanne Krein- WA DNR; Jerry Anderson, Walt Shields- Forest Capital; Jeanette Griese- BLM; Wayne patterson- Siuslaw National Forest; Paul Kriegal- Goodyear Nelson; Glenn Ah-rens- OSU Extension; Del Fisher- Washington Hardwood Commission
Please refer to the associated handouts (or the HSC 2009 annual report) for further information.
We started the meeting at 9:00 at the WA DNR Castle Rock office. After welcomes and introductions, Andrew began with a review of last years’ fieldwork, the coming years’ fieldwork and an overview of the data collection schedule for all three installation types.
4 Last year (Winter 08/09) had an extraordinary amount of fieldwork. Measure-ments and various treatments were done on 11 installations. Many thanks go out to all of the cooperators for providing crews and special thanks go out to the HSC Management Committee, for measuring the “orphaned” Type 2 installation outside of Sitkum, OR. Last years work included:
4 One Type 1 installation was measured.
4 Battle Saddle had its 19th year measurement. This is the 2nd of the 4 Type 1 installations with 19 year post-thinning data.
4 Eight Type 2 installations had fieldwork.
4 Three sites- Weebe’ Packin’, Wrongway Creek, and Tongue Mtn. had their 12th year measurement and either a pruning (Weebe’ Packin’) or the 2nd thinning treatment (Wrongway Creek and Tongue Mtn.).
4 Five sites had their 17th year measurement and appropriate treatment: Pioneer Mtn. (3rd thinning and 4th pruning lift), Keller-Grass (3rd pruning lift), Shamu, and Thompson Cat (4th pruning lift). All treatments are completed on 8 of the 11 sites with 17 year data.
4 Two Type 3 installations had fieldwork.
4 Puget had its 12th year measurement. This was the last Type 3 to have its 12 year measurement.
4 East Wilson had its 17th year measurement. This was the first Type 3 to have its 12 year measurement.

32
This coming year’s fieldwork (Winter 2009/10) is greatly reduced compared to last year. A total of 6 installations need either a measurement or a treatment. Work includes:
4 One Type 1 measurement:
• Janicki (19th year measurement).
4 Five Type 2 installations:
• John’s River (3rd pruning lift)
• Scappoose (3rd pruning lift and 3rd thin)
• Blue Mtn. (17th year measurement)
• Campbell River (17th year measurement, 4th pruning lift and 3rd thin)
• Hemlock Creek (17th year measurement)
4 No Type 3 measurements
Of note, there are three “orphaned” installations to be measured/treated that may not have field crews available.
As fall approaches, Andrew will contact each HSC member to provide specific on the activities and schedule the fieldwork.
Andrew then provided an overview of the data collection schedule for all three installation types.
All installation types have now “switched over” to a 5 year measurement cycle.Two (of the four) Type 1 installations have had their 19th year post-thinning mea-
surement.All Type 2 installations have had at least their 12th year measurements.Eleven (of the 26) Type 2 installations have had their 17th year measurement. Of
these eleven sites, eight have had all of their treatments completed.All Type 3 installations have had at least their 12th year measurements.Andrew then presented a summary on the dominant height growth equation work
recently completed. This work was just published as: Modeling Top Height Growth of Red Alder Plantations. 2009. Weiskittel, A.R., D.W. Hann, D.E. Hibbs, T.Y. Lam, and A.A. Bluhm. Forest Ecology and Management. 258:323-331.
Please refer to the reprint of the paper, the handout, and the HSC annual report.Andrew then informed the group about the start of a new project investigating any
possible effects of density on plantation tree size and growth.Handouts of various graphs illustrate the extent of the data being analyzed. An
overview of the project can be found in the HSC annual report.Andrew then updated the group on the ORGANON modeling effort. The effort
is proceeding as well as expected. In addition to the creation of the dominant height growth equations, the following equations have been developed:
4 Maximum/Largest crown width
4 Crown profile

33
4 Height-diameter
4 Height-to-crown-base
4 Diameter growth rate
4 Height growth rate
4 Mortality rate
4 Crown Recession
This years’ goals are to develop all of the required equations for both the control plots and the thinned plots and to assemble the growth model.
Chris Rasor, with WA DNR, then presented an overview of the DNR’s alder man-agement program. Key points included:DNR started planting alder in 2005
Since that time 750 total acres has been planted, with appx. ½ of that in the Pacific Cascades region.
Historically, about 5% of the total annual volume sold by DNR is alder (about 20 mmbf) all from natural stands.
At current rates of plantation establishment (160 acres/year) and estimated yield (20 mbf/acre) these plantations will provide only about 3.2mmbf/year or 15% of the total DNR alder volume.
Major concern identified by DNR and the group in attendance is how long will the natural alder supply last, the future of the market, and how to promote alder plantation establishment to sufficiently substitute for the natural supply.
Florian Deisenhofer, also with WA DNR, presented an overview of mapping tool he helped develop to identify sites most suitable for establishing alder plantations on the landscape.
This is an ARCGIS-based tool that uses physical criteria to estimate “site qual-ity”. It is mostly based on Harrington’s “A Method of Site Quality Evaluation for Red Alder”. Physical criteria include:
4 Elevation
4 Aspect
4 Slope
4 Topographic Position
4 Soil Type & Depth
4 Site Index
The model is an easy to use screening tool for foresters and produces four cat-egories of potential suitability: high, medium, low, and not suitable. Resolution is 10x10m- adequate on the landscape and harvest unit level. Evaluation of the model reveals:
4 Field verification necessary
4 Lumping is necessary (“medium” potential often very suitable when adjacent

34
to “high” potential and “low” potential from ridge top location may not be an issue
4 Frost pockets not accounted for
4 Model “conservative”
Please refer to the two handouts for specifics on the model.Next, the topic turned to the HSC budget. In regards to FY 2009, dues received
were less than expected. This allowed the HSC enough income to fund Andrew for only 6 months instead of 7 months. The balance of his time was made up for by exter-nal funding for the ORGANON project. All other expenses for FY 2009 were consis-tent with the projections except the buying of a new chainsaw and the hiring of field help to measure an “orphaned” site.
For FY 2010, the amount of dues expected will again be less than what was received in FY 2009. This trend is concerning and will result in Andrews time again being reduced to only 5 months. Once again, Andrew’s time will be made up with the ORGANON modeling project.
To help identify what Andrew has time for and conversely what he is not able to accomplish with his reduced time, Dave and Andrew assembled a list of deliverables- what’s being done, and what is not.
Please see the associated handouts for the specifics.After lunch on the grounds, we traveled to DNR west of Longview near Abernathy
Creek. Here we visited three stops and focused on three main topics:
4 Performance of, and potential improvements to, the ARCGIS mapping tool.
4 Precommercial thinning
4 Growth and yield
The three stops were:
4 Shakers Unit: 62 acres, 4th growing season of a medium quality site (SI20~65ft), the first DNR plantation, planted to 600tpa
4 Aldericious Unit- 100 acres, established by WeyCo, 15th growing season, low to high site quality (SI20~ 57-70ft), planted to appx. 680tpa, PCT’d four years ago to appx. 370tpa
4 Abernathy Creek- alder plantation spacing trial, 20th growing season
Discussion topics included:
4 Site preparation methods, plantation establishment techniques, factors effecting early growth of alder
4 Resolution of the site selection model and potential refinements (including localized effects of small-scale topographical features)
4 Usefulness of the new site index equation to validate the model
4 Frost pocket identification and strategies

35
4 Effect and placement of retention trees
4 Timing and intensity of both PCT and commercial thinning
4 Trade-offs between optimizing growth, volume, and wood quality
4 Projected yield and rotation ages
Many thanks go out to Chris Rasor and Florian Deisenhofer (WA DNR) for coor-dinating the field stops and providing the meeting location.
As a reminder, there will be no upcoming Winter 2009/10 winter meeting. But please mark your calendars for the next HSC Summer 2010 Meeting. Potential dates are July 6-7 or July 13-14, 2010. If you have any preference as to the dates, location, or topics please contact the HSC.

36
Appendix 3
fiNANciAl suppORt Received iN 2009-2010
cooperator sUpport
BC Ministry of Forests $2,500
Bureau of Land Management $9,000
Forest Capital $8,500
Goodyear-Nelson Hardwood Lumber Company $5,500
Oregon Department of Forestry $4,250
Siuslaw National Forest ------
Trillium Corporation ------
USDA Forest Service PNW Station In kind
Washington Department of Natural Resources $4,250
Washington Hardwood Commission ------
Subtotal $34,000
Forestry Research Laboratory $35,930
Total $69,930