Embed Size (px)
Citation preview

The geography of lean manufacturing:Recent evidence from theU.S. auto industry
Thomas H. Klier
Since lean manufacturing waspioneered by Toyota MotorCompany in the 1950s, it hasbecome the standard practiceof many Japanese manufactur-
ing companies. During the last decade Ameri-can manufacturers started to adopt it in order tocompete effectively at home and abroad, and itis fast becoming the standard in manufacturingplants across the country. Lean manufacturingis characterized by an emphasis on productquality, an integrated approach to the variousaspects of manufacturing, reliance on subcon-tractors to produce a greater proportion of thevalue added, and an emphasis on speed inorder processing, production, and delivery.One central feature of the system is the tieringof the supplier structure, which greatly reducesthe number of companies the assembler dealswith directly. Another feature is close relation-ships and frequent interactions between assem-blers and suppliers.'
It has been argued that efforts to reduceinventory stocks and arrange for "just-in-time"delivery function most effectively when thesupplying and receiving plants are in reason-ably close proximity.' The concomitant in-crease in the frequency of interaction and com-munication between assembler and suppliercompanies is expected to strengthen that effectfurther.' On the other hand, there is someevidence that spatial clustering is not a neces-sary condition for the successful operation oflean manufacturing. 4 The question to whatextent the arrival of lean manufacturing hasaltered the geography of supplier networks
has not been definitively answered.' Theanswer will have implications for regionaldevelopment efforts. Proponents of the spa-tial clustering hypothesis argue for a just-in-time-based local and regional developmentstrategy. 6 Such an approach was apparentduring Mercedes' recent search for an assem-bly plant site in North America. Alabamaoffered major tax breaks to the company,apparently on the assumption that the assem-bly plant would attract a fair number of itssupplier plants to locate nearby.'
This article attempts to shed new light onthe spatial effects of lean manufacturing byexamining the emerging geographical struc-ture of lean manufacturing supplier networksin the auto industry, often highlighted for itsbellwether role in the adoption of the newmanufacturing system. First, I present anoverview of previous studies. This is fol-lowed by a detailed analysis of the U.S. sup-plier networks of eight auto assemblers locat-ed in the United States. While some of thesenetworks have been the subject of previousresearch, this article goes beyond the existingliterature by investigating both domestic andtransplant suppliers and by identifying boththe tier and the age of individual supplierplants.' The evidence of emerging supplierlocation patterns is discussed both at the sam-ple and assembly plant level. Conclusionsfollow in the final section.
Thomas H. Klier is a senior economist at theFederal Reserve Bank of Chicago. The authorwould like to thank Jason Brown and ShinobuSuzuki for excellent research assistance.
2 ECONOMIC PERSPECTIVES

Review of previous evidence
As one of the most important and mostvisible manufacturing industries, the automo-bile industry has been of interest to economicgeographers for some time.' Since the arrivalof lean manufacturing by way of Japanesetransplant assembly and parts facilities inNorth America, questions have been raisedabout its impact on the existing spatial struc-ture of manufacturing. In Japan, auto assemblyand parts production are heavily concentratedin the core industrial regions of Tokyo-Yoko-hama, the Nagoya region, and to a lesser ex-tent, the Osaka area. Three factors are cited asan explanation for this concentration: "urban-industrial agglomeration factors stemmingfrom the dependence of the auto and otherassembly-type industries on a wide range ofparts, components, engineering processes andlabor skills; ready access to the largest domes-tic markets; and access to port facilities forinterregional and export shipment."'"
Evidence from other industries and othercountries indicates that the magnitude of theeffect of lean manufacturing on location variesby industry and by country." For example, arecent analysis of 71 auto parts plants in ninecountries suggests that the degree of dispersionof a country's supply base is partly a function ofthe country's size.'" Japan's auto industry ischaracterized by the most geographically con-centrated supply base, with 82 percent of thesuppliers located within a four-hour journey bytruck from the assembly plant. In contrast, thepercentages for the U.S., U.K., and Germany are35, 53, and 52, respectively. Sadler (1994)studied parts purchasing at several Japaneseassembly plants in Europe and found that Japa-nese transplants in Europe "placed far greateremphasis on working with an existing supplierbase in Europe than on encouraging rapid trans-nationalization of the Japanese componentsindustry." At the same time, they were imple-menting the familiar mix of lean manufactur-ing production and procurement practices."
Did the arrival of lean manufacturing inNorth America lead to a similarly compactspatial structure? To understand the existingstructure of the U.S. auto supplier industry, onemust first distinguish between so-called captiveand independent suppliers. Among the BigThree, the distribution of captive suppliers (thatis, suppliers that are Big Three subsidiaries ordivisions) varies by assembler. Even today,
however, these suppliers generally remain locat-ed in the upper Midwest.' For example, Fordhistorically operated within a highly centralizedmodel of production with clusters in Detroit andDearborn; today the company's parts operationsare mostly clustered in southeastern Michiganand northern Ohio. General Motors, on theother hand, started out with multiple centers ofoperation in Michigan (Detroit, Flint, Lansing,and Pontiac), and soon afterward expanded itsparts operations into other, predominantly mid-western states, mainly by acquiring independentsupplier companies. Before World War II, thecompany's captive suppliers were largely clus-tered in the southern Great Lakes region. Sincethen, GM has pursued a policy of spatial divi-sion of labor. Products requiring relativelyskilled workers, such as engine and drivetraincomponents, have remained concentrated in thesouthern Great Lakes region. Lower-skill tasks,such as much of the manufacturing of electricalcomponents, have been relocated to the south. 15
As lean manufacturing has increased thedegree of outsourcing, the more interestingquestion is how the location pattern of inde-pendent supplier plants has been evolving.Historically, parts suppliers have been clus-tered in southeastern Michigan and the adja-cent southern Great Lakes states.'" A signifi-cant change in the observed location of inde-pendent suppliers occurred during the 1970s,when a noticeable number of supplier plantsmoved southward into Kentucky, Tennessee,Alabama, Georgia, Virginia, and NorthCarolina. 17 These relocations were related to locationdecisions of auto assembly plants. For exam-ple, during the 1970s GM, in search of lower-cost nonunionized labor, built or planned four-teen plants in the south, primarily in rural areasof small towns."
The latest development influencing thelocation decisions of suppliers has been thearrival of lean manufacturing in North Ameri-ca, generally dated around 1980 when the firstJapanese transplant assembly facilities opened.Early evidence indicates the emergence of astructure in which supplier plants locate closerto their assembly plant customers than underthe previous system of mass production.'
A set of recent studies investigates theeffect of lean manufacturing on the spatialstructure of independent supplier plants in theUnited States. Rubenstein and Reid (1987) andRubenstein (1988) analyzed data for the state
FEDERAL RESERVE BANK OF CHICAGO

TABLE
Assembly plants in study
Location
Marysville, OH
East Liberty, OH
Smyrna, TN
Fremont, CA
Flat Rock, MI
Normal, IL
Georgetown, KY
Lafayette, IN
Spring Hill, TN
Start-up year
1982
1989
1983
1984
1987
1988
1988
1989
1990
Honda
Honda
Nissan
NUMMI(GM-Toyota)
AutoAlliance(Ford-Mazda)
Diamond-Star(Mitsub.-Chrysler)
Toyota
Subaru-Isuzu
Saturn
Source: Ward's Communications (various years).
of Ohio. They could not identify a clear-cuteffect of lean manufacturing on supplier plantlocation, yet they did find a change in the loca-tional pattern after 1970. New firms weremore likely to locate in the state's rural coun-ties and the central region, and less likely tolocate in northeastern Ohio.
Most of the existing analyses of the loca-tion effect of lean manufacturing, however,concern Japanese-owned suppliers within theUnited States. This is not surprising, as theseplants were generally set up to meet the de-mands of lean manufacturing assemblers. Inaddition, most of them are new plants estab-lished at so-called greenfield sites, whichmakes them a preferred object of study. 20
Studies of these plants consistently find a con-centration of Japanese suppliers in a regionencompassing Michigan, Indiana, Ohio, Ken-tucky, and Tennessee, commonly referred to asthe 1-75/1-65 auto corridor because it is definedby those two interstate highways. At the locallevel, suppliers are dispersed to avoid theirdrawing from the same labor market." Fromthe perspective of the southern Great Lakesstates, it seems that the arrival of lean manu-facturing reversed the trend toward regionaldecentralization that started in the early 1970s.However, the sites chosen by transplants werenot traditionally associated with motor vehicleassembly or parts production. Accordingly, acomplex pattern of industrial growth and de-cline emerged in the Midwest."
The data
"Mapping the spatial distribu-tion of parts suppliers at one pointin time, let alone changes, is a for-midable task."'" The Census ofManufactures can offer only incom-plete information, because it distin-guishes neither between originalequipment manufacturers and pro-ducers of replacement parts norbetween different tiers of suppliers.In addition, because of the largevariety of parts that make up anautomobile, suppliers are classifiedin 18 of the 20 two-digit SIC cate-gories. Finally, census data provideno information about linkages be-tween suppliers and their customers.
The data used in this studycome from the ELM GUIDE data-
base on the auto supplier industry, produced bya company in Michigan. 24 The data availablefor analysis represent the year 1993 and cover2,477 supplier plants located in the UnitedStates. As a first step I grouped the plants bytiers. Of the total, 1,383 plants were tier 1suppliers, that is, they ship their products ex-clusively to auto assembly plants and not toother suppliers or other customers; 373 were"mixed" plants, that is, they ship also to othersupplier plants and/or nonautomotive assem-blers; 721 plants had to be excluded from theanalysis as they did not provide information onwhich customer(s) they shipped to. 25
As the customer information in the ELMdatabase is provided at the company ratherthan plant level, I focused on the set of autoassemblers that operate only one plant, orplants at only one location, in the U.S. in orderto be able to establish linkages between assem-bly and supplier plants; 511 (37 percent) of the1,383 identifiable first-tier supplier plants shipto these 9 assembly plants (see table 1). 26 Ithen added several variables to the database.Information on start-up year of the supplierplants was obtained from various state manu-facturing directories; information on Japaneseownership was obtained from a publication ofthe Japan Economic Institute." The start-update for 41 plants in the sample could not beidentified from state industrial directories. Isent these plants a questionnaire to obtain themissing information. Of the 20 returned ques-tionnaires, 16 indicated plants that were stilloperational. Therefore, the number of observa-
4
ECIENONIIC PERSPECTIVES

TABLE 2
Top seven states for tier 1 supplier plants
% of total plants (1,383) % of sample plants (486)
Michigan 25.6 Michigan 20.4
Ohio 13.6 Ohio 15.8
Indiana 10.6 Top 3: 49 ..8% Indiana 10.7 Top 3: 46.9%
Illinois 6.8 Tennessee 10.3
Tennessee 5.9 Top 5: 62.5% Kentucky 8.2 Top 5: 65.4%
Kentucky 4.0 Illinois 6.0
North Carolina 3.5 North Carolina 3.3
Source: ELM International, Inc. (1993) and author's calculations.
tions for the following analysis is 486. Theresulting data allow for a comparison of morerecent location decisions with older ones thatwere presumably not influenced by lean manu-facturing. However, this is not equivalent to atime-series analysis since the sample onlycontains plants operating during 1993 and nonethat were shut down in earlier years.
Where do plants locate? The spatialpattern of the sample
It is interesting to relate the geographicdistribution of the sample to the population oftier 1 supplier plants. Table 2 shows that thesample plants were slightly more concentratedin five states and were located to the south ofthe population of identifiable tier 1 plants.Michigan, the most frequent location choiceamong the 486 plants in the sample, was lessdominating in the sample than in the identifi-able population of tier 1 supplier plants, while
Ohio, Tennessee, and Kentucky each attracteda higher share of sample plants. This pattern isnot surprising, as the assemblers for whichlinkages to supplier plants could be establishedwere located to the south of the traditionalassembly plant region. Nonetheless, on thewhole the sample was geographically distribut-ed quite similarly to the overall distribution oftotal identifiable tier 1 supplier plants.
Since the sample plants were identified bystart-up year and by affiliation with a Japanesecompany, it was possible to assess the locationpattern by age of plant and plant ownership.Because transplant assemblers started operat-ing in the U.S. as early as 1982, I chose 1980as the cutoff year to compare location patternsbefore and after the implementation of leanmanufacturing techniques. 28 Table 3 showsthat about 42 percent or 203 of the 486 supplierplants were established before 1980; the vastmajority of them (187) were domestic. The
TABLE 3
Location of sample plants
Established prior to 1980 (203) Established 1980 or later (283)
Domestic (187) Transplant (161 Domestic (118) Transplant (165)
Michigan 26.7% 25.0% 25.4% 9.1%
Ohio 15.5 6.3 9.3 21.8
Illinois 8.0 25.0 3.4 3.6
Indiana 7.0 6.3 13.6 13.3
Tennessee 5.9 6.3 12.7 13.9
Kentucky 4.3 0 4.2 16.4
California 0.5 6.3 2.5 4.2
Largest 3 50.2 56.3 51.7 52.1
Largest 5 63.1 68.9 65.2 74.5
Source: ELM International, Inc. (1993) and author's calculations.
FEDERAL RESERVE BANK OF CHICAGO
5

• 1 supplier plant
■ 2 supplier plants
• 3 or more supplier plants
• 1 supplier plant
■ 2 supplier plants
• 3 or more supplier plants
FIGURE 1
Tier 1 supplier plants established prior to 1980 (203)
location pattern of those 203 followed veryclosely the distribution shown in table 2 (seealso figure 1). Too few transplant supplierplants were established prior to 1980 to showany discernible pattern. Figure 2 shows aremarkably different location pattern for tier 1plants established since 1980. Most pro-nounced is the development of the so-calledauto corridor, a rather compact and densely
populated area stretching north-south along I-75 and I-65."To what extent does this auto corridor representlocational choices of transplant and domesticsupplier plants, respectively?
Dividing the sample by age of plant re-vealed two very interesting findings. First,compared with their older counterparts, post-1980 domestic plants were located more to the
FIGURE 2
Tier 1 supplier plants established 1980 or later (283)
6 El :I \ °RIC PERSPECTIVES

TABLE 4
Transplant auto supplier start-ups
Number of facilities
1981 11982 51983 61984 51985 131986 251987 501988 671989 401990 171991 2
Source: McAlinden and Smith (1993).
• 1 supplier plant
■ 2 supplier plants• 3 or more supplier plants
southeast. Ohio and Illinois lost considerableshare, while Indiana and Tennessee becamemore frequent location choices. However, theoverall concentration in the top three and topfive states hardly changed. 30 These findings aredisplayed in figures 3 and 4. The most strikingcontrast, however, is between recently estab-lished domestic and transplant suppliers (seefigures 4 and 5). First, the number of transplantsuppliers increased dramatically after 1980 (seetable 4). Furthermore, 75 percent of the 165transplant suppliers opened since 1980 locatedin only five states—Kentucky, Ohio, Tennessee,Indiana, and Michigan—a higher proportionthan any other subset of the sample. 31 The ag-gregate picture in table 3 and figures 1 through5 reveals the leading role played by the trans-plants in establishing a different location patternin the U.S. auto supplier industry. In addition,there is evidence, albeit to a smaller extent, for achanging location pattern among domestic sup-pliers since 1980. 32
Table 3 and figures 1 through 5 contain twoadditional interesting pieces of information.First, among the traditional auto states, Michi-gan stands out for remaining the preferred loca-tion of domestic supplier plants, even after1980. One possible explanation is a strongerorientation of domestic suppliers to the BigThree as customers.' In addition, the data sug-gest that certain characteristics of a plant's
output seem to influence its location decision.For example, the production of sensors (suchas airbag or temperature sensors), a lightweightelectronic part, is widely dispersed, with anoticeable number of plants in California andadjacent states. On the other hand, the produc-tion of seats—a part that involves variouslevels of subassembly including frames andupholstery, and is consistently quoted in theautomotive press as one of the parts deliveredto assembly lines by the hour—is concentratedwithin the automotive corridor, close to the
FIGURE 3
Domestic tier 1 supplier plants established prior to 1980 (187)
FEDERAL RESERVE BANK OF CHICAGO
7

• 1 supplier plant
■ 2 supplier plants
• 3 or more supplier plants
• 1 supplier plant
■ 2 supplier plants
• 3 or more supplier plants
FIGURE 4
Domestic tier 1 supplier plants established 1980 or later (118)
assembler customers.' The recently openeddomestic plants in Michigan tend to be concen-trated in the production of interior body systemparts and components as well as body compo-nents and trim (including parts such as instru-ment panels, dashboards, and relatively heavyitems such as hoods and doors). Comparingthe product classifications of older and young-er domestic plants in Michigan, one finds a
reduction in the start-up of plants producingengines and engine components since 1980,especially parts such as exhaust and intakemanifolds and crankshafts.
Second, several new plants located outsidethe 1-75/1-65 corridor after 1980. Since thedata set available for this study does not in-clude information on production level and/orcustomer-specific shipments, it was not possi-
FIGURE 5
Transplant tier 1 supplier plants established 1980 or later (165)
8
ECONOMIC PERSPECTIVES

FIGURE 6
Honda's tier 1 supplier plants established 1982 or later (122)
assemAlblY Plant SIP
Honda
M11111 NTelliblitoirr11E4-14T
‘ 111111:2811rw r• 1 supplier plant
■ 2 supplier plants
• 3 or more supplier plants
ble to test whether those plants rely moreheavily on nonautomotive business. 35
Who is closer? An analysis of foursupplier networks
A closer look at the tier 1 supplier net-works of specific assembly plants provides amore detailed picture of the changes in thelocation pattern of those suppliers during the
1980s. There is a striking difference betweenthe pre-1980 and post-1980 location patternssimilar to that observed among total sampleplants. However, the analysis in this sectionwill concentrate on suppliers that opened noearlier than the year during which their respec-tive assembly plants started operating. Thisfocus enables us to isolate the effect that leanmanufacturing assembly had on the location of
FIGURE 7
Nissan's tier 1 supplier plants established 1983 or later (106)
121rinall)alt
dooass,eNnt:otissan rie
401• 1 supplier plant
■ 2 supplier plantsA 3 or more supplier plants
FEDERAL RESERVE BANK OF CHICAGO
9

TABLE 5
Average distance between supplier and assembler(suppliers that opened after assemblers)
AssemblerNetworkaverage
Domesticsuppliers
Transplantsuppliers
miles
Honda 287 399* 244*
Nissan 317 360 287
AutoAlliance 359 371 353
Toyota 325 466** 237**
*Difference significant at the .10 level.**Difference significant at the .05 level.Sources: ELM International, Inc. (1993) and author's calculations.
suppliers." As one cannot directly comparethe pre- and post-1980 location patterns, thissection presents statistical evidence on a relat-ed question: For the four transplant assemblyplants analyzed, do both domestic and trans-plant tier 1 suppliers make similar locationdecisions?
First, the locations of these assemblers' tier1 suppliers produce very similar images (seefigures 6 through 8). While the networks in-clude more post-1980 plants the longer theassembly plant has been in operation, they areall focused on the 1-75/1-65 auto corridor,whether the assembly plant is located in thecenter (like Honda in Ohio), at the northern end(like AutoAlliance in Michigan), or the southernend (like Nissan in Tennessee) of that region.
Second, a comparison of domestic andtransplant suppliers shows that transplantsare typically somewhat closer to their assem-
blers than are domestic suppliers(see figures 9 through 12). How-ever, even the latter locate in anoticeable network pattern inrelation to the various assemblersin the sample. By calculating thedistance between each supplierplant and the assembly plant foreach of the four networks, I for-mally tested for differences in thelocation decisions of domesticand transplant suppliers." Table5 shows the average distancesbetween the individual suppliersand their respective assemblers inthe sample. A test of the similari-
ty of the location pattern showed a significantdifference between the average distances ofdomestic and transplant suppliers in two of thefour networks." Domestic suppliers thatopened after the start-up of their respectiveassemblers were consistently located fartheraway than the transplant suppliers of compara-ble vintage." This is a surprising result, as itindicates significant differences in the locationeffects of lean manufacturing on transplant anddomestic suppliers. It is conceivable that moreof the customers of domestic suppliers thantransplant suppliers are located in the tradition-al auto region, which would explain the largeraverage distances to the three transplant assem-blers located in the auto corridor. As the loca-tion of the Big Three assembly plants is notidentified in the database, only indirect ways oftesting that explanation remain. When oneexcludes AutoAlliance, the Mazda-Ford joint
TABLE 6
Supplier plants by distance to assembly plant(suppliers that opened after assembler)
Distance in miles
Honda Nissan AutoAlliance Toyota
T D T D T D T
0-50 5.9 19.3 2.2 1.6 17.4 6.4 5.5 6.9
51-100 8.8 17.0 13.6 8.0 21.7 10.6 0 20.7
101-200 29.4 27.3 4.5 38.7 17.4 10.6 11.1 37.9
201-400 26.5 21.6 40.9 33.9 4.3 29.8 66.7 20.7
401-800 20.6 10.2 36.4 12.9 26.1 36.2 5.5 10.3
> 800 8.8 4.5 2.2 4.8 13.0 6.4 11.1 3.4
Note: D = domestic; T = transplant.
Sources: ELM International, Inc. (1993) and author's calculations.
10
ECONONIIC PERSPECTR ES

FIGURE 8
AutoAlliance's tier 1 supplier plants established 1987 or later (70)
a==lt
1111111,11,11114rti I I I 1 I ki• 04 PAT‘111111able• 1 supplier plant■2 supplier plantsA 3 or more supplier plants
venture in Flat Rock, Michigan, and its suppli-ers, the percentage of tier 1 suppliers shippingonly to non-Big Three assembly plants is morethan twice as large for transplants as for do-mestic suppliers." However, when one focuseson the subset of suppliers not shipping to theBig Three, the average distances for both trans-plant and domestic suppliers are lower thanthose listed in table 5. 41
Table 6 presents more detailed informationon the distribution of supplier plants aroundspecific auto assembly plants. It suggests thatthe statistical differences in table 5 are drivenby differences in the number of suppliers thatlocate very close to the assembler. A some-what smaller share of domestic than transplantsuppliers locate very close to the assembler(see table 6).42 A large share of both Honda's
FIGURE 9
Honda's domestic tier 1 supplier plants established 1982 or later (34)
Apgar* ass:it
Honda
MMI 1411MliptiT111 111/ S, p‘111111alow
' 114• 1 supplier plant■2 supplier plants
FEDERAL RESERVE BANK OF CHICAGO 11
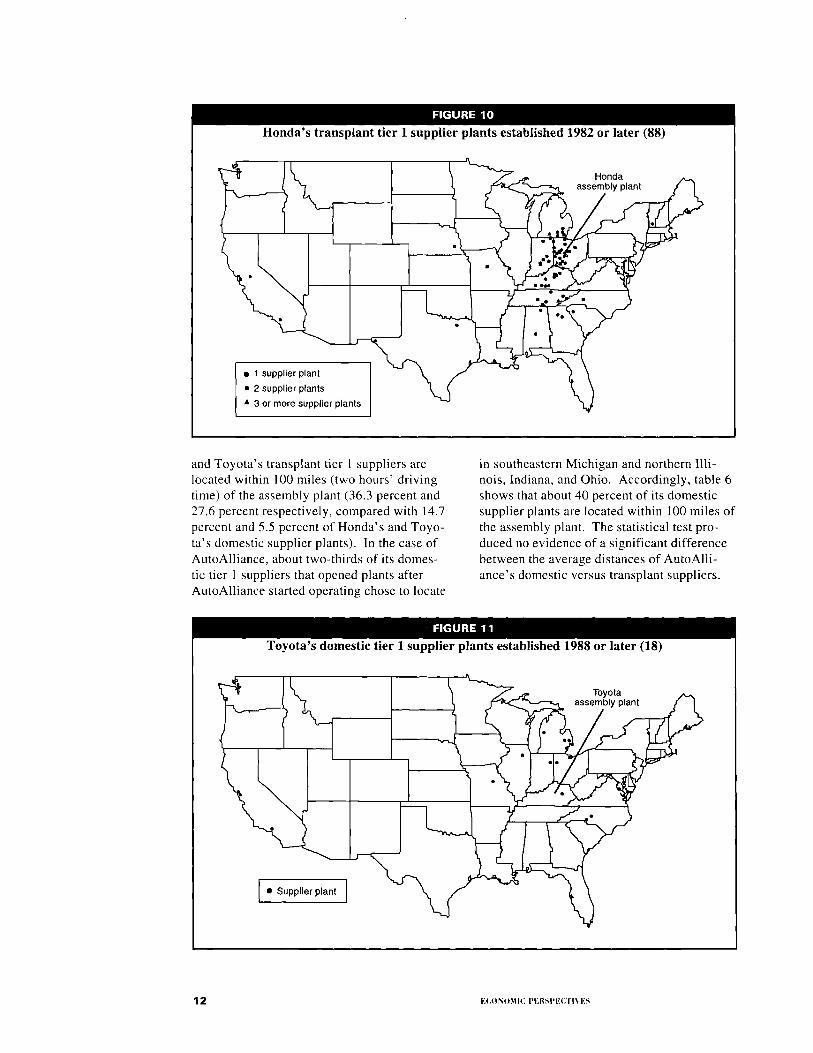
FIGURE 10
Honda's transplant tier 1 supplier plants established 1982 or later (88)
14111111114144 assififemblY Pla4nt
Honda
11111
11111111S1 -1 - ri.;'IIMApot
•1 supplier plant■2 supplier plants•3 or more supplier plants
and Toyota's transplant tier 1 suppliers arelocated within 100 miles (two hours' drivingtime) of the assembly plant (36.3 percent and27.6 percent respectively, compared with 14.7percent and 5.5 percent of Honda's and Toyo-ta's domestic supplier plants). In the case ofAutoAlliance, about two-thirds of its domes-tic tier 1 suppliers that opened plants afterAutoAlliance started operating chose to locate
in southeastern Michigan and northern Illi-nois, Indiana, and Ohio. Accordingly, table 6shows that about 40 percent of its domesticsupplier plants are located within 100 miles ofthe assembly plant. The statistical test pro-duced no evidence of a significant differencebetween the average distances of AutoAlli-ance's domestic versus transplant suppliers.
FIGURE 11
Toyota's domestic tier 1 supplier plants established 1988 or later (18)
11101111111111561, a a Thmrdpop
MIMI' Ma* atIgo fe,r4
-"4•Supplier plant
12 ECONOMIC PERSPECTIVES

FIGURE 12
Toyota's transplant tier 1 supplier plants established 1988 or later (29)
aillilL11191116. aeTX"Imant SIPriliTMONSVPSmoo implAieiimabour
• Supplier plant
Summary and conclusion
Lean manufacturing has been implementedin the American manufacturing sector for sometime now. While there is agreement that thishas raised productivity at the assembly plantlevel, it has not been clear what effect it hashad on the geographic distribution of the sup-plier base. By refining a commercially avail-able database, I was able to examine the sup-plier networks of some recently opened autoassembly plants located in the United States,focusing in particular on the spatial relation-ship between assemblers and their tier 1 suppli-ers. While I could not test changes in the spa-tial patterns of Big Three suppliers during thelast decade, I have presented some new infor-mation on a set of mostly transplant assemblyplants and their suppliers. This informationaffords a better understanding of the evolvinggeography of lean manufacturing.
Earlier findings about a movement ofsupplier plants toward the I-75/1-65 automotivecorridor were confirmed. In addition, by dis-tinguishing the age and ownership of the plantsin the sample, this study found that since 1980the majority of newly established tier 1 suppli-er plants that ship to at least one of the assem-blers in the sample chose to locate within theso-called automotive corridor. The data show
the establishment of transplant supplier plantsto be the main force in shaping a new geogra-phy in the supplier industry. While domesticsuppliers were found to have located in the1-75/1-65 corridor as well, their average dis-tance to the assembly plants in the sample issignificantly larger. In addition, the data indi-cate that there are agglomeration effects in theautomotive corridor and that the type of outputproduced also influences the location chosen.
The implications of these findings forregional development policy are neither clear-cut nor simple. While the evidence suggeststhe establishment of a new geography in theU.S. auto supplier industry, it is clear that thatindustry will not be nearly as geographicallyconcentrated as it is in Japan.' Thus a state'sability to attract an assembly plant does notnecessarily mean that a significant number ofsuppliers will set up shop nearby.
In further research on this topic, I willextend the analysis to the supplier networks ofBig Three assembly plants and will apply for-mal location models to the data on hand. Itwould also be very interesting to obtain addi-tional information for the sample plants, suchas the location of the plant of the primary as-sembly customer.
FEDERAL. RESERVE BANK OF CHICAGO 13

NOTES
The importance of supplier networks is featured in a recentstudy on lean manufacturing in the auto industry (Andersen1994) which suggests the management of the supply chain to beone of the key competitive factors. See also Bennet (1994) andKlier (1994). Rather than coordinating its entire supplier struc-ture, an assembler prefers to deal directly with only a smallnumber of supplier companies, referred to as tier I suppliers.
2 Estall (1985), Kenney and Florida (1992), Mair (1992), andDyer (1994).
'See Helper (1991) on the increased frequency of commu-nication.
'See, for example, Glasmeier and McCluskey (1987), Reid(1995), and the references cited therein.
`See, for example, Mair (1992) and Erickson (1994). Theissue is complicated by the fact that location patterns, onceestablished, tend not to change over a short period of time, asthey involve decisions with relatively long time horizons.See, for example, Ondrich and Wasylenko (1993) for a formaltreatment of the location decision and Krugman (1991) for anexplanation of the influence of history on the spatial patternof economic activity.
For example, Mair (1993).
'Cooper and Ruffenach (1993).
'Automobile assembly and component plants that are fully orpartly owned by foreign companies are generally referred toas transplants. For the purposes of this study, the definingcharacteristic distinguishing transplant from domestic suppli-ers is the ownership of the plant, not its customers.
'See Henrickson (1951), Boas (1961), and especially Ruben-stein (1992) for a historical overview of the geography of theU.S. automobile industry.
10 Sheard (1983).
"See, for example, Angel (1994), Jones and North (1991),and Schampp (1991).
12 Andersen (1994).
"Sadler (1994) suggests that the resulting smaller increase inspatial proximity is due to the relatively fragmented marketfor cars, supporting a range of independent automotivecompanies, prior to the arrival of Japanese transplants.
14 McAlinden and Smith (1993); Miller (1988).
'Rubenstein (1992).
'Rubenstein (1992); Henrickson (1951).
17 Glasmeier and McCluskey (1987).
'Four were built in Mississippi, three in Louisiana, two each inAlabama and Georgia, and one each in Oklahoma, Texas, andVirginia" (Rubenstein 1992, p. 238). According to Rubenstein(1992), the proliferation of different models since 1960 led to afragmentation of the market for passenger cars and reduced theneed for branch assembly plants, that is, plants producingidentical models at centers of demand for regional distribution.That resulted in a fair amount of restructuring at the assemblyplant and, consequently, at the supplier plant level.
19 In his study on the North American auto industry, Miller(1988) finds that the introduction of new supply philosophieshas shifted suppliers slightly closer to assemblers.
20 See Glassmeier and McCluskey (1987), Mair et al. (1988),Rubenstein (1992), Woodward (1992), and Mair (1994).
21 See Mair et al. (1988).
"'Rubenstein (1992); Klier (1993).
"Rubenstein (1992).
"ELM (1993), the ELM GUIDE supplier database. Thisdatabase includes, among other things, the addresses of thesupplier plants, a listing of each plant's customers, and a verydetailed classification of products produced and materials used.
nit is difficult to accurately assess the coverage of this data-base, since the size of the true population is unknown. How-ever, anecdotal evidence on Honda (Mair 1994) and Nissan(Bennet 1994) indicates reasonably good coverage of the tierI supplier plants. Furthermore, the information obtained fromthe ELM database is qualitatively consistent with previouslypublished accounts (see Mair et al. 1988, Kenney and Florida1992. Rubenstein 1992, and Muir 1994). Therefore I do notexpect the results to be biased.
''The nine assembly plants were all opened after 1980 and weremostly transplants. Ideally one would like to investigate thesupplier networks of all U.S. assembly plants opened after 1980and compare them to pre-lean manufacturing patterns. Howev-er, geographic linkages between assemblers and suppliers at theplant level were available only for the eight assemblers listed intable I. In addition, I could find no comparable information onpre-1980 supplier networks. As Honda's two Ohio assemblyplants are only about 15 miles apart, I treated them as one site.
Eight Big Three assembly plants have been opened since1980: GM's plants in Orion Township, MI; Bowling Green,KY; Fort Wayne, IN; Wentzville, MO; and Hamtramck, MI;and Chrysler's plants in Detroit, MI (Mack Ave. and JeffersonAve.), and in Sterling Heights, MI. Almost all of these are inthe traditional assembly region of the lower Great Lakesstates (see Boas 1961). Also excluded from the study werethe 20 pre-1980 U.S. car assembly plants of the Big Threethat were in operation during 1993. (See Ward's AutomotiveYearbook, various years.)
Because of the weak coverage of "mixed" plants, I exclud-ed that segment from further analysis.
"Japan Economic Institute (1992).
28 Glassmeier and McCluskey (1987) compared "recentlybuilt" facilities with the overall pattern of auto parts produc-tion. However, in their study they do not indicate the timeframe used to define these plants. Moreover, from the 17observations they had in the "recently built" category, theauthors can only speculate as to possible implications.
'See Mair et a!. (1988).
30 As recently as 1988, Miller found no evidence of a notice-able shift in parts-making activities (Miller 1988).
''Ohio experienced both a very significant decrease in thepercentage of domestic plant openings and a dramatic in-crease in the percentage of transplant plant openings since1980. This makes Ohio a very interesting case study (seeRubenstein and Reid 1987).
"Given the nature of the sample, I could obtain no evidenceon possible changes in the location patterns of the networks ofBig Three assembly plants. In addition, the smaller effect oflocation changes among domestic tier 1 suppliers might wellbe related to the extent that transplant assembler plantsresemble secondary customers of these supplier plants.However, information to support this claim is currently notavailable. See the following section for evidence of spatialpatterns of domestic supplier plants at the network level.
330f the 118 domestic supplier plants opened since 1980, only13.6 percent had no Big Three companies listed as customers.That compares to 36 percent of the 165 transplant supplierplants that opened during the same time period (see ELM
14 ECOOMIC 'FIRSTECTIN ES

1993). However, the lack of information on the relativeimportance of a supplier plant's customers prevents a moredetailed look at that issue.
"Of the 1.383 tier I plants identified in the database, 38 listsensors as one of their products. Only 39 percent of theseplants are located in the five automotive corridor states,Michigan, Indiana. Ohio, Kentucky, and Tennessee. Bycomparison. 10 of the 13 seat plants are located in the auto-motive corridor.
"In terms of the type of parts produced, no particular groupdominates the recently established non-auto-corridor plants.However, the parts tend to be relatively lightweight. Plantslocated in the Northeast tend to produce electronic andelectrical parts.
"As only nine suppliers to Saturn opened plants since 1990,the start-up year for the Tennessee assembly plant, its net-work is not discussed in detail. In addition, no further analy-sis is undertaken for the networks of NUMMI, Subaru-Isuzu,and Diamond-Star. The fact that neither could attract anoticeable number of supplier plants close to the assemblyplant is probably an indication of agglomeration effects in theautomotive corridor.
"The distances were calculated by means of the mappingsoftware MAPINFO at the county resolution.
3"15 the case of Nissan, the difference is significant just abovethe .10 level.
"Dyer (1994) reports that the average distance betweenToyota's assembly plants and its independent suppliers inJapan is only 87 miles. In contrast, he reports that the averagedistance between GM's assembly plants and its independentsuppliers in the U.S. is 427 miles.
In a study done over 40 years ago, Henrickson (1951) listssources of metal automobile parts to the Buick assembly plantcomplex in Flint. The average distance between independentsupplier plants pre-1950 (58 plants) to the Buick plant can becalculated as 294 miles; information reported for the year1950 (39 plants) results in an average distance of 309 miles.
'Saturn was not included in the definition of Big Three. Theactual percentages are as follows: 45.5 percent of Honda'stransplant suppliers do not list Big Three customers, versus14.7 percent of its domestic suppliers; Nissan, 27.4 percentversus 11.4 percent; AutoAlliance, 19.1 percent versus 13.0percent; and Toyota, 48.3 percent versus 22.2 percent.
-"The number of observations in the "domestic" suppliercategory is too small for meaningful tests of statistical differ-ence in the average distances within that subsample.
42A closer look at the parts produced by supplier plantslocated within very close range of the assembly plant revealsan emphasis on interior body systems and components (suchas dashboards, seats, door panels, and instrument panels) andbody glass and components (such as windshields and rear andside windows).
'Andersen (1994) and Dyer (1994).
REFERENCES
Andersen Consulting, "Worldwide manufacturingcompetitiveness study-The second lean enterprisereport," 1994.
Angel, David P., "Tighter bonds? Customer-supplierlinkages in semi-conductors," Regional Studies, Vol. 28,No. 2, April 1994, pp. 187-200.
Bennet, James, "Detroit struggles to learn anotherlesson from Japan," The New York Times, June 19,1994, section F, p. 5.
Boas, Charles W., "Locational patterns of Americanautomobile assembly plants, 1895-1958," EconomicGeography, Vol. 31,1961, pp. 218-230.
Commerce Register Inc., Maine, in Directory ofManufacturers, 1993a.
, Massachusetts, in Directory ofManufacturers, 1993b.
, New Hampshire, in Directory ofManufacturers, 1993c.
, Vermont, in Directory of Manufac-turers, I 993d.
Cooper, Helene, and Glenn Ruffenach, "Alabama'swinning of Mercedes plant will be costly, with majortax breaks," Wall Street Journal, September 30,1993,p. A2.
Database Publishing Co., Arizona, in ManufacturersRegister, 1994a.
, California, in ManufacturersRegister, 1994b.
Dyer, Jeffrey H., "Dedicated assets: Japan's manufac-turing edge," Harvard Business Review, November/December 1994, pp. 174-178.
ELM International, Inc., "The ELM GUIDE supplierdatabase," East Lansing, MI, database file, 1993.
Erickson, Rodney A., "Technology, industrial re-structuring, and regional development," Growth andChange, Vol. 25, Summer 1994, pp. 353-379.
Estall, R.C., "Stock control in manufacturing: Thejust-in-time system and its locational implications,"Area, Vol. 17,1985, pp. 129-132.
Glasmeier, Amy, and Richard McCluskey, "U.S.auto parts production: An analysis of the organizationand location of a changing industry," Economic Geog-raphy, Vol. 63, No. 2,1987, pp. 142-159.
Harris Publishing Co., Harris Illinois IndustrialDirectory, 1994.
Helper, Susan, "How much has really changed be-tween automakers and their suppliers?" Sloan Manage-ment Review, Summer 1991, pp. 15-28.
Henrickson, G. Rex, Trends in the Geographic Distri-bution of Suppliers of Some Basically Important Mate-rials Used at the Buick Motor Division, Flint, Michi-gan, Ann Arbor, MI: University of Michigan, Institutefor Human Adjustment, 1951.
Japan Economic Institute, Japan's Expanding U.S.Manufacturing Presence: 1990 Update, 1992.
Jones, Philip N., and John North, "Japanese motorindustry transplants: The West European dimen-sion," Economic Geography, Vol. 67, No. 2,1991,pp. 105-123.
FEDERAL. RESERVE BANK OF CHICAGO
15

Kenney, Martin, and Richard Florida, "The Japa-nese transplants—production organization and region-al development," Journal of the American PlanningAssociation. Vol. 58, No. I, 1992, pp. 21-38.
Klier, Thomas, "How lean manufacturing changes theway we understand the manufacturing sector," Eco-nomic Perspectives, Vol. 17, No. 3, May/June 1993,pp. 2-10.
, "The impact of lean manufacturingon sourcing relationships," Federal Reserve Bank ofChicago, Economic Perspectives, Vol. 18, No. 4, July/August 1994, pp. 8-17.
Krafcik, John F., "Triumph of the lean productionsystem," Sloan Management Review, Fall 1988,pp. 41-52.
Krugman, Paul, Geography and Trade, GastonEyskens Lecture Series, London: Leuven UniversityPress, 1991.
Mair, Andrew, "Just-in-time manufacturing and thespatial structure of the automobile industry: Lessonsfrom Japan," Tijdschrift voor Econ. en Soc. Geografie,Vol. 82, No. 2,1992, pp. 82-92.
, "New growth poles? Just-in-timemanufacturing and local economic development strate-gy," Regional Studies, Vol. 27, No. 3,1993, pp. 207-221.
, Honda's Global Local Corpora-tion, New York: St. Martin's Press, 1994.
Mair, Andrew, Richard Florida, and Martin Ken-ney, "The new geography of automobile production:Japanese transplants in North America," EconomicGeography, Vol. 20, October 1988, pp. 352-373.
Manufacturers' News Inc., Alabama, in Manufactur-ers Register, 1994a.
, Florida, in ManufacturersRegister, 1994b.
, Indiana, in ManufacturersRegister, 1994c.
, Kentucky, in ManufacturersRegister, 1994d.
Nebraska, in ManufacturersRegister, 1994e.
, North Carolina, in Manufactur-ers Register, 1994f.
, Ohio, in ManufacturersRegister, 1994g.
, Oklahoma, in ManufacturersRegister, 1994h.
, Texas, in ManufacturersRegister, 1994i.
, Virginia, in ManufacturersRegister, 1994j.
, Georgia, in ManufacturersRegister, 1995a.
, Iowa, in ManufacturersRegister, 1995b.
Missouri, in ManufacturersRegister, I995c.
, Pennsylvania, in ManufacturersRegister, 1995d.
Wisconsin, in ManufacturersRegister, 1995e.
McAlinden, Sean, and Brett Smith, "The changingstructure of the U.S. automotive parts industry," AnnArbor, MI: University of Michigan TransportationResearch Institute, report no. UMTRI 93-6,1993.
Miller, Roger, New Locational Factors in the Auto-mobile Industry, Montreal, Canada: Universite duQuebec, 1988.
Ondrich, Jan, and Michael Wasylenko, ForeignDirect Investment in the United States: Issues, Magni-tudes, and Location Choice of New ManufacturingPlants, Kalamazoo, MI: Upjohn Institute, 1993.
Pick Publications, 1994 Michigan ManufacturersDirectory, 1994.
Reid, Neil, "Just-in-time inventory control and theeconomic integration of Japanese-owned manufactur-ing plants with the county, state and national econo-mies of the United States," Regional Studies, Vol. 29,No. 4,1995, pp. 345-355.
Rubenstein, James M., "Changing distribution ofAmerican motor-vehicle-parts suppliers," Geographi-cal Review, Vol. 18, No. 3,1988, pp. 288-298.
, The Changing U.S. Auto Indus-try—Geographical Analysis, London: Routledge, 1992.
Rubenstein, James M., and Neil Reid, "Ohio's motorvehicle industry—industrial change and geographicalimplications," Miami University, geographical researchpaper no. 1,1987.
Sadler, David, "The geographies of just-in-time:Japanese investment and the automotive componentsindustry in Western Europe," Economic Geography,Vol. 70, No. 1,1994, pp. 41-59.
Schampp, Eike, "Towards a spatial organization ofthe German car industry? The implications of newproduction concepts," in Industrial Change and Re-gional Development: The Transformation of NewIndustrial Spaces, George Benko and Mick Dunford(eds.), London: Belhaven Press, 1991, chapter 8.
Sheard, Paul, "Auto-production systems in Japan:Organisational and locational features," AustralianGeographical Studies, Vol. 21, April 1983, pp. 49-68.
Smith Publishers & Printers, 1992 Directory ofTennessee Manufacturers, 1992.
South Carolina Department of Commerce, 1994South Carolina Industrial Directory, 1994.
Ward's Communications, Ward's Automotive Year-book, Detroit, MI, various years.
Woodward, Douglas P., "Locational determinants ofJapanese manufacturing start-ups in the UnitedStates," Southern Economic Journal, Vol. 58, No. 3,1992, pp. 690-708.
16 ECONOMIC PERSPECTIVES

ECONOMIC PERSPECTIVES—INDEX FOR 1995
Article
Issue
Pages
BANKING, CREDIT, AND FINANCE
A current look at foreign banking in the U.S. and Seventh DistrictLinda M. Aguilar
Internal organization and economic performance:The case of large U.S. commercial banksWilliam C. Hunter
Jan/Feb
Sep/Oct
20-28
10-20
ECONOMIC CONDITIONS
The temporary labor forceLewis M. Segal and Daniel G. Sullivan
Does business development raise taxes?William H. Oakland and William A. Testa
Big emerging markets and U.S. tradeLinda M. Aguilar and Mike A. Singer
Mar/Apr 2-19
Mar/Apr 22-32
Jul/Aug 2-14
MONEY AND MONETARY POLICY
Temporal instability of the unemployment-inflation relationshipRobert G. King, James H. Stock, and Mark W. Watson
Sectoral wage growth and inflationEllen R. Rissman
May/Jun
Jul/Aug
2-12
16-28
REGIONAL ECONOMICS
Midwest approaches to school reformRichard H. Mattoon and William A. Testa Jan/Feb 2-19
An analysis of the effect of Chicago school reformon student performanceThomas A. Downes and Jacquelyn L. Horowitz May/Jun 13-35
Chicago's economic transformation: Past and futureGraham Schindler, Philip Israilevich, and Geoffrey Hewings Sep/Oct 2-9
The geography of lean manufacturing: Recent evidence fromthe U.S. auto industryThomas H. Klier Nov/Dec 2-17
Can alternative forms of governance help metropolitan areas?Richard H. Mattoon
Nov/Dec
20-32
To order copies of any of these issues, or to receive a list of other publications,telephone 312-322-5111 or write to
Public Information CenterFederal Reserve Bank of ChicagoP.O. Box 834Chicago, IL 60690-0834
FEDERAL RESERVE BANK OF CHICAGO
17


![ACCESSORIOS Magnum Pistolas semiautomáticas...Lincoln Electric ® Serie LN-7, LN-8, LN-9, LN-25 [Alambre de hasta .052 pulg. (1.4 mm)] K489-1 Serie LN-8, LN-9, LN-25 [Alambre de 1/16](https://img.pdfslide.us/doc/110x75/5f37ed334803986d4a61858a/accessorios-magnum-pistolas-semiautomticas-lincoln-electric-serie-ln-7.jpg)


![Samsung Ln-s3292d Ln-s4092d Ln-s4692d Bn94-01037a Schematic Diagram [Sch]](https://img.pdfslide.us/doc/110x75/563db88d550346aa9a94b946/samsung-ln-s3292d-ln-s4092d-ln-s4692d-bn94-01037a-schematic-diagram-sch.jpg)