Embed Size (px)
Citation preview

H-GAC Regional Goods Movement Plan
The Cambridge Systematics Team ES-1
Executive Summary
The Houston-Galveston area freight transportation system – seaports, airports, intermodal facilities, and the waterways, highways, and rail corridors that connect them– is a key element of the national and international supply and distribution chain, providing gateways for domestic and international freight shipments and connecting those gateways with major markets in the United States and throughout the World. However, this vital transportation network is being stressed by continued growth in freight volumes, driven by increasing domestic and international trade and the growing populations and economies of Texas, in general, and Houston-Galveston region, in particular. This stress increasingly manifests itself in the form of capacity and congestion problems at key regional gateways, at important intermodal transfer facilities, and along critical highway and rail corridors. In addition, population growth is adding to the pressure on this already constrained infrastructure; it is becoming increasingly difficult to balance freight mobility needs with environmental, social, and financial concerns; there are rising infrastructure maintenance costs across all modes; and there is an increasing awareness that neither the public nor private sectors – acting independently – have the necessary resources to fully address rising transportation demands. Individually or collectively, these issues may erode the efficiency and productivity of the region’s transportation system, leading to economic implications that will reverberate locally, regionally, nationally, and internationally.
The vision for the goods movement system in the Houston-Galveston Area Council (H-GAC) region is to be a connected, multimodal, world-class system that enhances the region’s economic vitality while supporting the mobility and livability needs of its citizens. This Regional Goods Movement Plan, the final product of a multi-year effort, helps the region to realize this vision by identifying improvements and strategies that accommodate and enhance mobility of both people and goods while mitigating the associated negative community impacts related to congestion, safety, the environment, and quality of life. The key findings of this Plan should be used by the H-GAC and its partners to inform a regional approach to planning for and investing in the region’s trade and transportation system that will help regional stakeholders work collaboratively to ensure its continued efficiency, reliability, and sustainability.
H-GAC Regional Goods Movement Plan
ES-2 The Cambridge Systematics Team
Key Findings
The H-GAC Region Incorporates a System of Gateways and Transportation Corridors of Regional, Statewide, and National Significance.
The H-GAC freight transportation system uniquely combines:
• A major international trade gateway (sea and air) consisting of four deepwater ports (Port of Houston, Port Freeport, the Port of Galveston, and the Port of Texas City ) and two major air cargo facilities at George Bush Intercontinental Airport. These gateways support large and growing international trade lanes for both imports and exports and provide connections to the rest of the U.S. via major highway, rail, and air corridors.
• More than 24,000 lane-miles of roadways that carry more than 465 million tons of goods annually. This system includes 21 Federally-designated intermodal connectors and 38 designated hazardous material routes that carry more than 150 million tons of hazardous materials each year.
• Three Class I railroads – Union Pacific (UP), BNSF Railway (BNSF), and Kansas City Southern (KCS) – who operate nearly 1,000 miles of track in the region, and carry more than 150 million tons of local freight annually.
• Approximately 21,500 miles of pipelines that carry more than 445 million tons of freight per year. Even the region’s modest-sized pipelines transport 150,000 barrels per day (approximately 7.3 million tons per year) and replacing one would require 750 tanker truck loads delivered every two minutes around the clock or a 225-car train to arrive and be unloaded every day.1
This system is critical to both domestic and international trade. The H-GAC region a key center within two emerging domestic megaregions – the Gulf Coast and Texas Triangle, which are shown in Figure ES.1.2 These megaregions – along with their national and global counterparts – are expected to be the economic engines of this century, generating hundreds of billions of dollars in economic output, accumulating the majority of the nation’s and world’s wealth, attracting a highly educated
1 Association of Oil Pipe Lines, http://www.aopl.org/. 2 Unlike megacities, which are described simply by the size of their
populations, megaregions are by definition places with large markets, significant economic capacity, substantial innovation, and highly skilled talent, as well as large overall populations ranging in size from 10 to 50 million people and producing hundreds of billions of dollars in economic output.
FREIGHT IN THE H-GAC REGION
• 1st in U.S. pipeline volumes
• 2nd in U.S. port volumes
• 4th in U.S. truck volumes
• Freight-dependent industries account for nearly 1 million jobs
H-GAC Regional Goods Movement Plan
The Cambridge Systematics Team ES-3
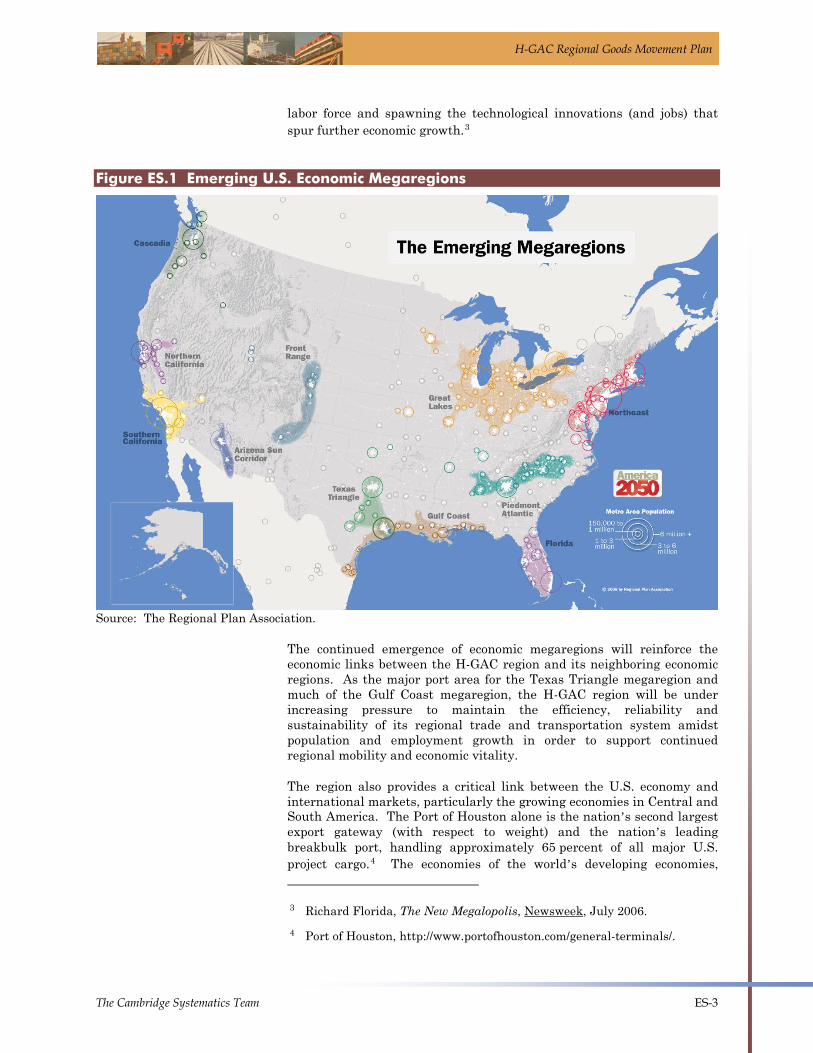
labor force and spawning the technological innovations (and jobs) that spur further economic growth.3
Figure ES.1 Emerging U.S. Economic Megaregions
Source: The Regional Plan Association.
The continued emergence of economic megaregions will reinforce the economic links between the H-GAC region and its neighboring economic regions. As the major port area for the Texas Triangle megaregion and much of the Gulf Coast megaregion, the H-GAC region will be under increasing pressure to maintain the efficiency, reliability and sustainability of its regional trade and transportation system amidst population and employment growth in order to support continued regional mobility and economic vitality.
The region also provides a critical link between the U.S. economy and international markets, particularly the growing economies in Central and South America. The Port of Houston alone is the nation’s second largest export gateway (with respect to weight) and the nation’s leading breakbulk port, handling approximately 65 percent of all major U.S. project cargo.4 The economies of the world’s developing economies, 3 Richard Florida, The New Megalopolis, Newsweek, July 2006. 4 Port of Houston, http://www.portofhouston.com/general-terminals/.
H-GAC Regional Goods Movement Plan
ES-4 The Cambridge Systematics Team
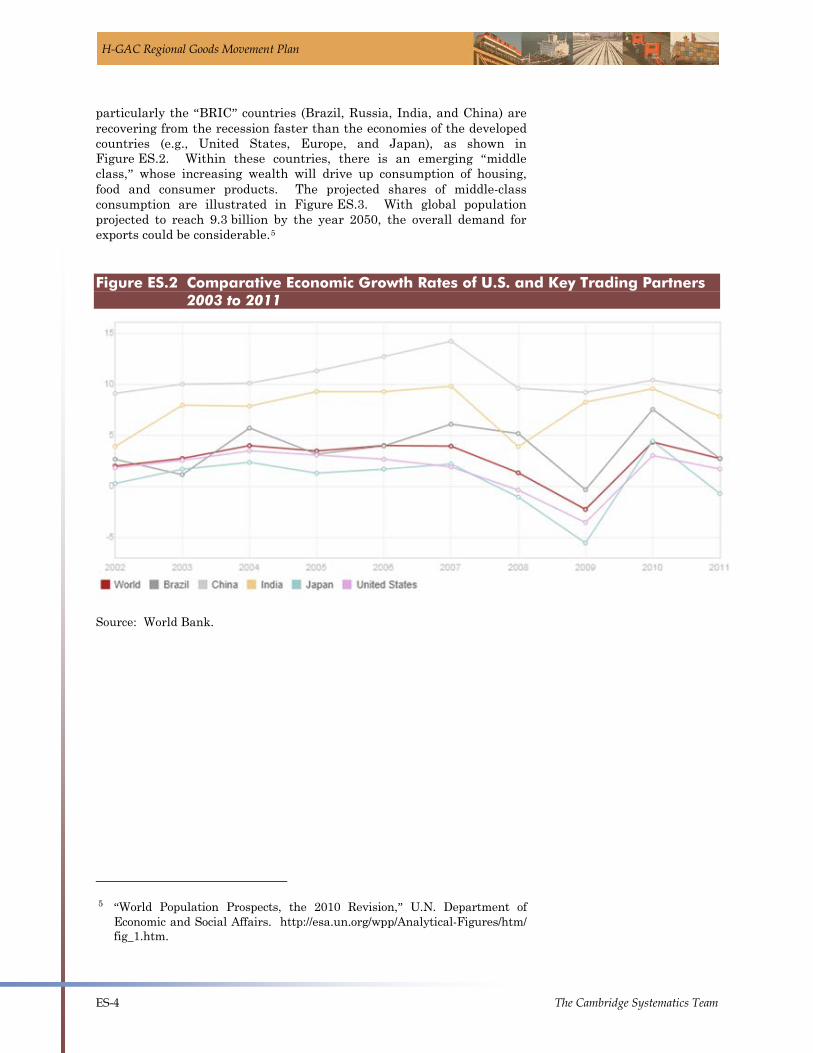
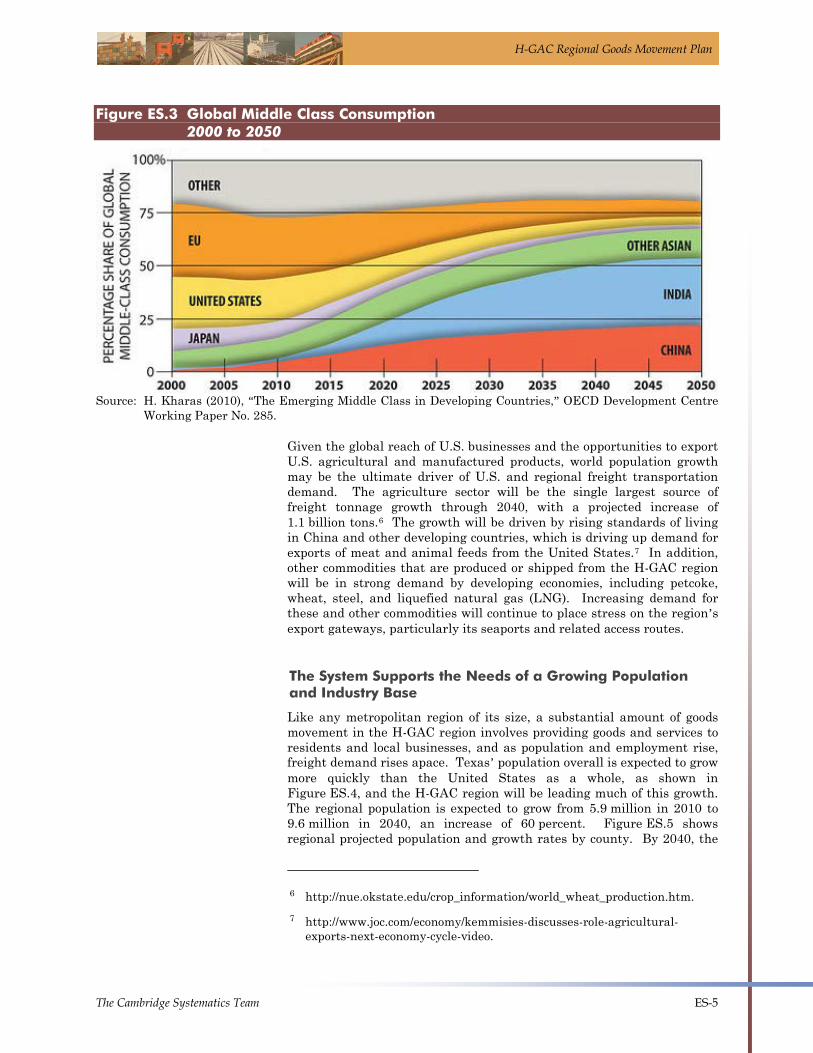
particularly the “BRIC” countries (Brazil, Russia, India, and China) are recovering from the recession faster than the economies of the developed countries (e.g., United States, Europe, and Japan), as shown in Figure ES.2. Within these countries, there is an emerging “middle class,” whose increasing wealth will drive up consumption of housing, food and consumer products. The projected shares of middle-class consumption are illustrated in Figure ES.3. With global population projected to reach 9.3 billion by the year 2050, the overall demand for exports could be considerable.5
Figure ES.2 Comparative Economic Growth Rates of U.S. and Key Trading Partners 2003 to 2011
Source: World Bank.
5 “World Population Prospects, the 2010 Revision,” U.N. Department of
Economic and Social Affairs. http://esa.un.org/wpp/Analytical-Figures/htm/fig_1.htm.
H-GAC Regional Goods Movement Plan
The Cambridge Systematics Team ES-5
Figure ES.3 Global Middle Class Consumption 2000 to 2050
Source: H. Kharas (2010), “The Emerging Middle Class in Developing Countries,” OECD Development Centre
Working Paper No. 285.
Given the global reach of U.S. businesses and the opportunities to export U.S. agricultural and manufactured products, world population growth may be the ultimate driver of U.S. and regional freight transportation demand. The agriculture sector will be the single largest source of freight tonnage growth through 2040, with a projected increase of 1.1 billion tons.6 The growth will be driven by rising standards of living in China and other developing countries, which is driving up demand for exports of meat and animal feeds from the United States.7 In addition, other commodities that are produced or shipped from the H-GAC region will be in strong demand by developing economies, including petcoke, wheat, steel, and liquefied natural gas (LNG). Increasing demand for these and other commodities will continue to place stress on the region’s export gateways, particularly its seaports and related access routes.
The System Supports the Needs of a Growing Population and Industry Base
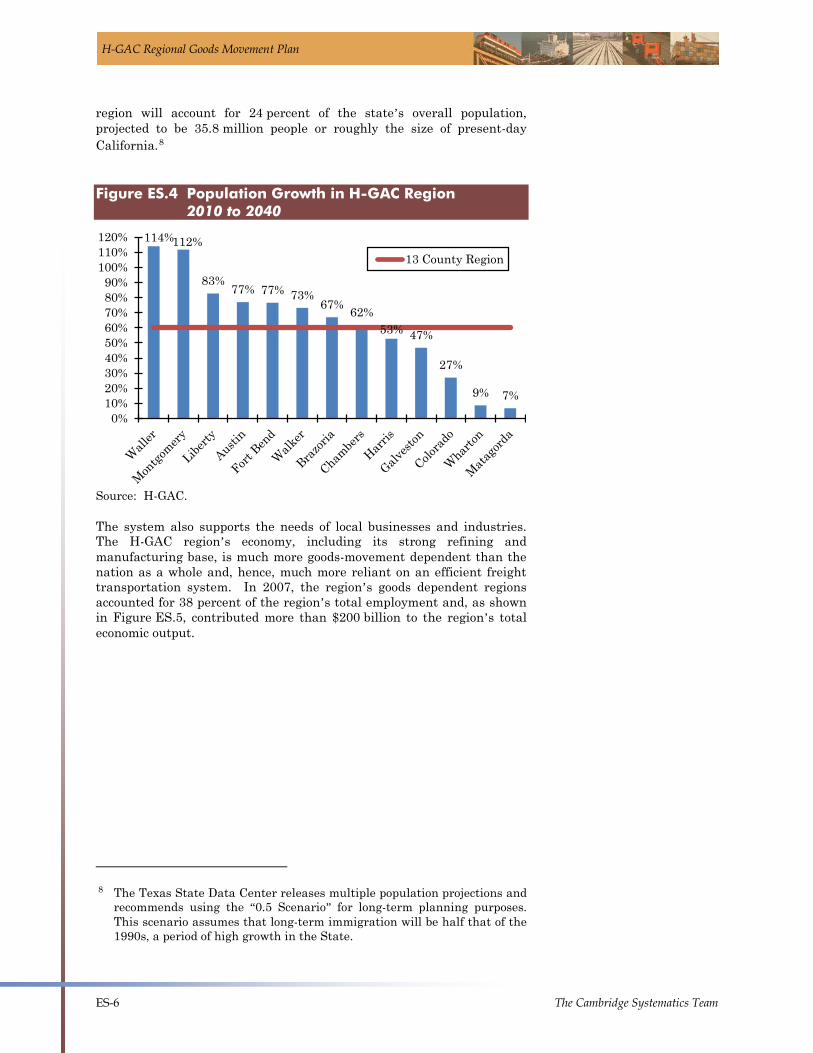
Like any metropolitan region of its size, a substantial amount of goods movement in the H-GAC region involves providing goods and services to residents and local businesses, and as population and employment rise, freight demand rises apace. Texas’ population overall is expected to grow more quickly than the United States as a whole, as shown in Figure ES.4, and the H-GAC region will be leading much of this growth. The regional population is expected to grow from 5.9 million in 2010 to 9.6 million in 2040, an increase of 60 percent. Figure ES.5 shows regional projected population and growth rates by county. By 2040, the
6 http://nue.okstate.edu/crop_information/world_wheat_production.htm. 7 http://www.joc.com/economy/kemmisies-discusses-role-agricultural-
exports-next-economy-cycle-video.
H-GAC Regional Goods Movement Plan
ES-6 The Cambridge Systematics Team
region will account for 24 percent of the state’s overall population, projected to be 35.8 million people or roughly the size of present-day California.8
Figure ES.4 Population Growth in H-GAC Region 2010 to 2040
Source: H-GAC.
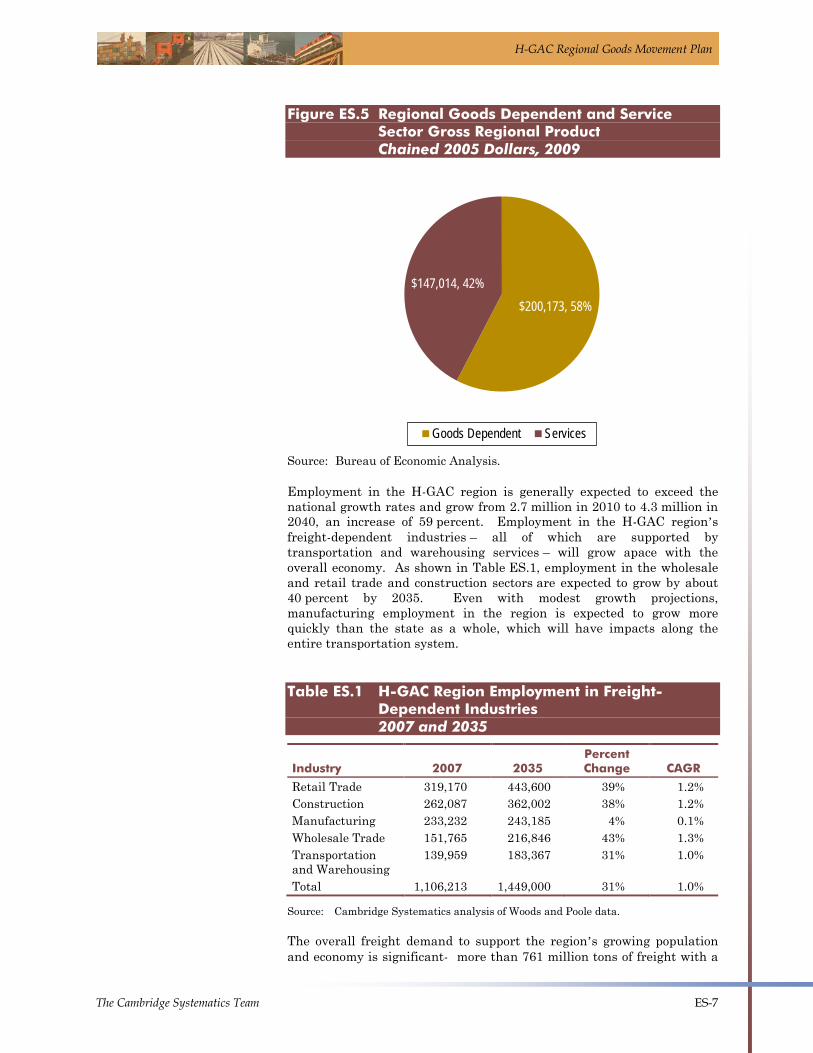
The system also supports the needs of local businesses and industries. The H-GAC region’s economy, including its strong refining and manufacturing base, is much more goods-movement dependent than the nation as a whole and, hence, much more reliant on an efficient freight transportation system. In 2007, the region’s goods dependent regions accounted for 38 percent of the region’s total employment and, as shown in Figure ES.5, contributed more than $200 billion to the region’s total economic output.
8 The Texas State Data Center releases multiple population projections and
recommends using the “0.5 Scenario” for long-term planning purposes. This scenario assumes that long-term immigration will be half that of the 1990s, a period of high growth in the State.
114% 112%
83% 77% 77% 73%
67% 62% 53% 47%
27%
9% 7%
0%10%20%30%40%50%60%70%80%90%
100%110%120%
13 County Region
H-GAC Regional Goods Movement Plan
The Cambridge Systematics Team ES-7
Figure ES.5 Regional Goods Dependent and Service Sector Gross Regional Product Chained 2005 Dollars, 2009
Source: Bureau of Economic Analysis.
Employment in the H-GAC region is generally expected to exceed the national growth rates and grow from 2.7 million in 2010 to 4.3 million in 2040, an increase of 59 percent. Employment in the H-GAC region’s freight-dependent industries – all of which are supported by transportation and warehousing services – will grow apace with the overall economy. As shown in Table ES.1, employment in the wholesale and retail trade and construction sectors are expected to grow by about 40 percent by 2035. Even with modest growth projections, manufacturing employment in the region is expected to grow more quickly than the state as a whole, which will have impacts along the entire transportation system.
Table ES.1 H-GAC Region Employment in Freight-Dependent Industries 2007 and 2035
Industry 2007 2035 Percent Change CAGR
Retail Trade 319,170 443,600 39% 1.2% Construction 262,087 362,002 38% 1.2% Manufacturing 233,232 243,185 4% 0.1% Wholesale Trade 151,765 216,846 43% 1.3% Transportation and Warehousing
139,959 183,367 31% 1.0%
Total 1,106,213 1,449,000 31% 1.0%
Source: Cambridge Systematics analysis of Woods and Poole data.
The overall freight demand to support the region’s growing population and economy is significant- more than 761 million tons of freight with a
$200,173, 58% $147,014, 42%
Goods Dependent Services
H-GAC Regional Goods Movement Plan
ES-8 The Cambridge Systematics Team
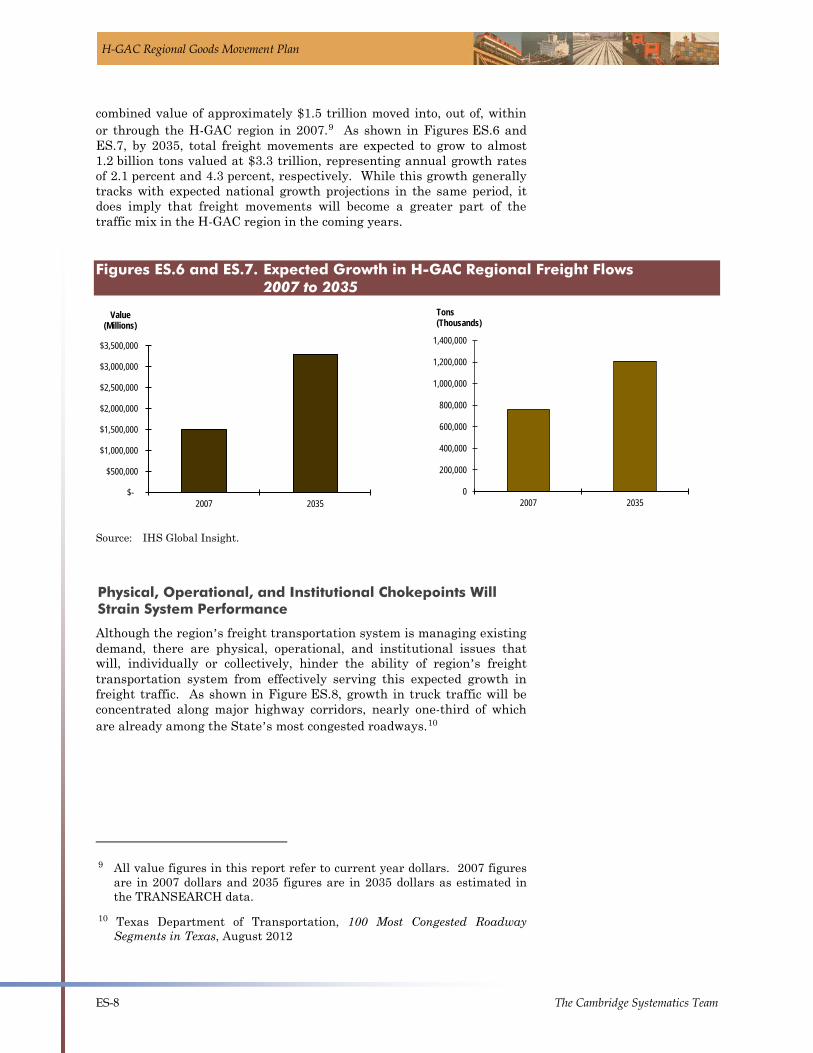
combined value of approximately $1.5 trillion moved into, out of, within or through the H-GAC region in 2007.9 As shown in Figures ES.6 and ES.7, by 2035, total freight movements are expected to grow to almost 1.2 billion tons valued at $3.3 trillion, representing annual growth rates of 2.1 percent and 4.3 percent, respectively. While this growth generally tracks with expected national growth projections in the same period, it does imply that freight movements will become a greater part of the traffic mix in the H-GAC region in the coming years.
Figures ES.6 and ES.7. Expected Growth in H-GAC Regional Freight Flows 2007 to 2035
Source: IHS Global Insight.
Physical, Operational, and Institutional Chokepoints Will Strain System Performance
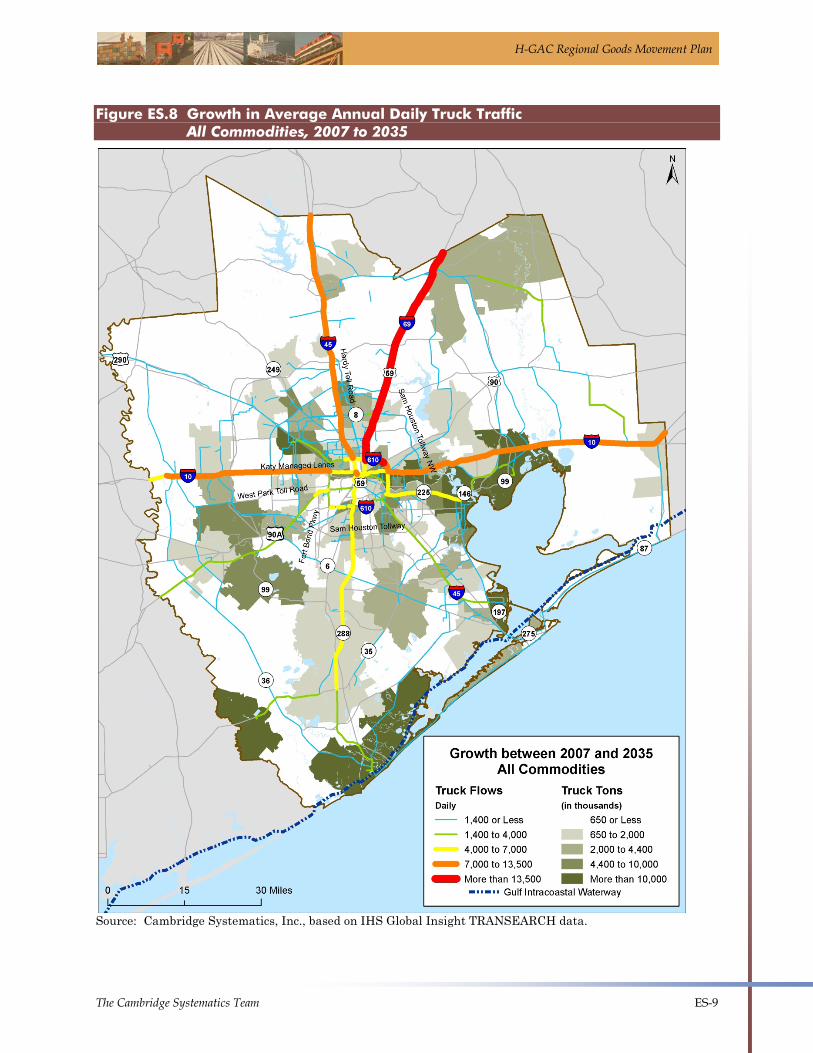
Although the region’s freight transportation system is managing existing demand, there are physical, operational, and institutional issues that will, individually or collectively, hinder the ability of region’s freight transportation system from effectively serving this expected growth in freight traffic. As shown in Figure ES.8, growth in truck traffic will be concentrated along major highway corridors, nearly one-third of which are already among the State’s most congested roadways.10
9 All value figures in this report refer to current year dollars. 2007 figures
are in 2007 dollars and 2035 figures are in 2035 dollars as estimated in the TRANSEARCH data.
10 Texas Department of Transportation, 100 Most Congested Roadway Segments in Texas, August 2012
$-
$500,000
$1,000,000
$1,500,000
$2,000,000
$2,500,000
$3,000,000
$3,500,000
2007 2035
Value (Millions)
0
200,000
400,000
600,000
800,000
1,000,000
1,200,000
1,400,000
2007 2035
Tons (Thousands)
H-GAC Regional Goods Movement Plan
The Cambridge Systematics Team ES-9
Figure ES.8 Growth in Average Annual Daily Truck Traffic All Commodities, 2007 to 2035
Source: Cambridge Systematics, Inc., based on IHS Global Insight TRANSEARCH data.
H-GAC Regional Goods Movement Plan
ES-10 The Cambridge Systematics Team
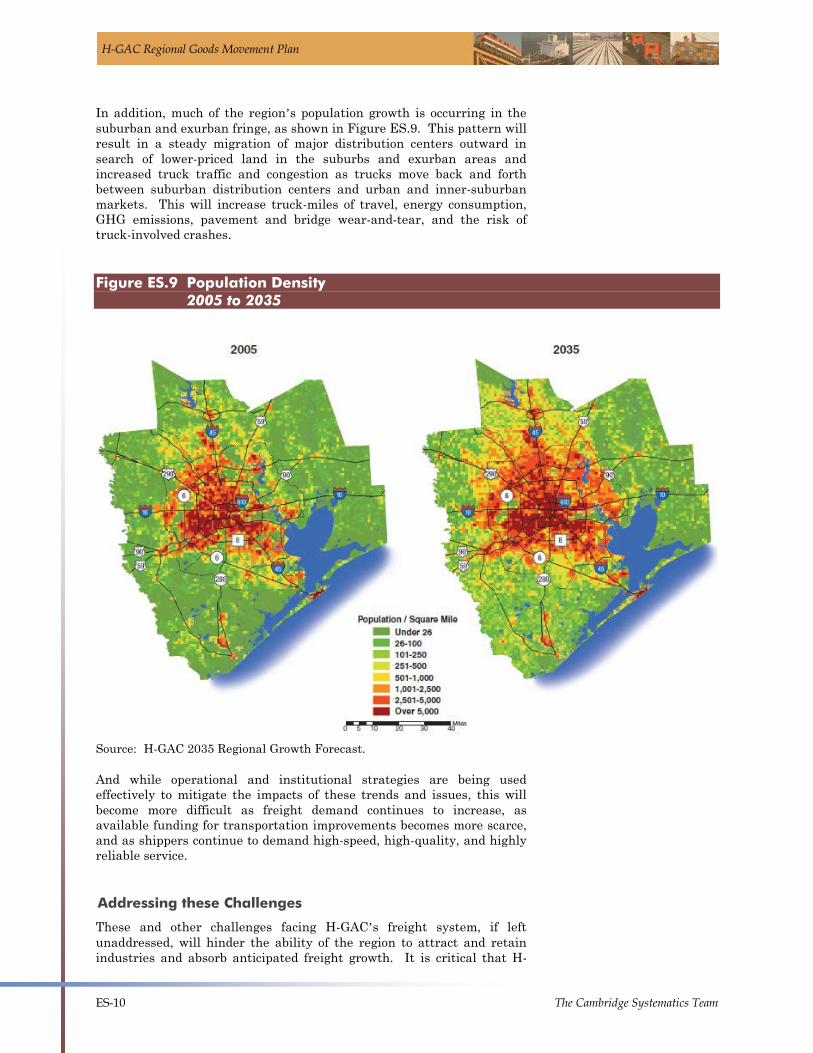
In addition, much of the region’s population growth is occurring in the suburban and exurban fringe, as shown in Figure ES.9. This pattern will result in a steady migration of major distribution centers outward in search of lower-priced land in the suburbs and exurban areas and increased truck traffic and congestion as trucks move back and forth between suburban distribution centers and urban and inner-suburban markets. This will increase truck-miles of travel, energy consumption, GHG emissions, pavement and bridge wear-and-tear, and the risk of truck-involved crashes.
Figure ES.9 Population Density 2005 to 2035
Source: H-GAC 2035 Regional Growth Forecast.
And while operational and institutional strategies are being used effectively to mitigate the impacts of these trends and issues, this will become more difficult as freight demand continues to increase, as available funding for transportation improvements becomes more scarce, and as shippers continue to demand high-speed, high-quality, and highly reliable service.
Addressing these Challenges
These and other challenges facing H-GAC’s freight system, if left unaddressed, will hinder the ability of the region to attract and retain industries and absorb anticipated freight growth. It is critical that H-
H-GAC Regional Goods Movement Plan
The Cambridge Systematics Team ES-11
GAC, together with its partners, develop and implement project and policy solutions to address both short-term and long-term physical, operational, and institutional deficiencies while:
• Enhancing the mobility, reliability and safety of the region’s freight-significant corridors and facilities;
• Providing access to new growth areas;
• Promoting multimodal goods movement;
• Enhancing the region’s economic competitiveness; and
• Mitigating community impacts related to congestion, safety, the environment and quality of life.
Short-Term Program
• Formally Define and Designate the Freight-Significant Network. Formally designating the collection of highway corridors, intermodal facilities, and intermodal connectors in the region that are deemed “freight-significant” will allow H-GAC to focus investments and system performance evaluations on the most critical portions of the regional freight system while helping H-GAC member governments better understand which portions of their systems are most critical to regional freight mobility and economic competiveness.
• Work with Partners to Mitigate Short-Term Deficiencies on the Freight-Significant Network. Focusing investments on short-term deficiencies, such as intermodal connectors that provide the link between intermodal facilities and the Freight Significant Network, often leads to improvements to freight mobility and reductions in community impacts at relatively low costs.
• Develop a Concept of Operations for a Freight Intelligent Transportation Systems (ITS) Program. The H-GAC and its partners should lay the groundwork for a freight-focused traveler information system for trucking company drivers, dispatchers, and operations managers, leveraging both public and private sector data sources. Such a system would improve freight operations by providing tailored information freight system users and focusing on freight-intensive corridors.
• Create a Regional Goods Movement Subcommittee. H-GAC’s Technical Advisory Committee should seek approval from the Transportation Policy Council (TPC) to create a new subcommittee focused on addressing regional goods movement issues as part of the regional planning process.
• Incorporate Freight-Specific Measures into Project Evaluation Processes. Although H-GAC’s current project evaluation criteria and methodology do describe a handful of freight-related measures in its planning factors (e.g., “connects to intermodal connectors” and “multimodal impacts”), freight-specific information is
Focusing investments on the most critical
elements of the freight system will help
maximize regional benefits.
H-GAC Regional Goods Movement Plan
ES-12 The Cambridge Systematics Team
missing from the benefit-cost methodology, which accounts for 50 percent of the project score.
• Designate and Publicize a Freight Point-of-Contact/Technical Lead. H-GAC should specifically identify a freight lead to serve as a liaison to the private sector freight community, TxDOT, City and County agencies and leadership, the Port of Houston and Port Freeport, local Chambers of Commerce and economic development agencies, shipper/carrier organizations, and others.
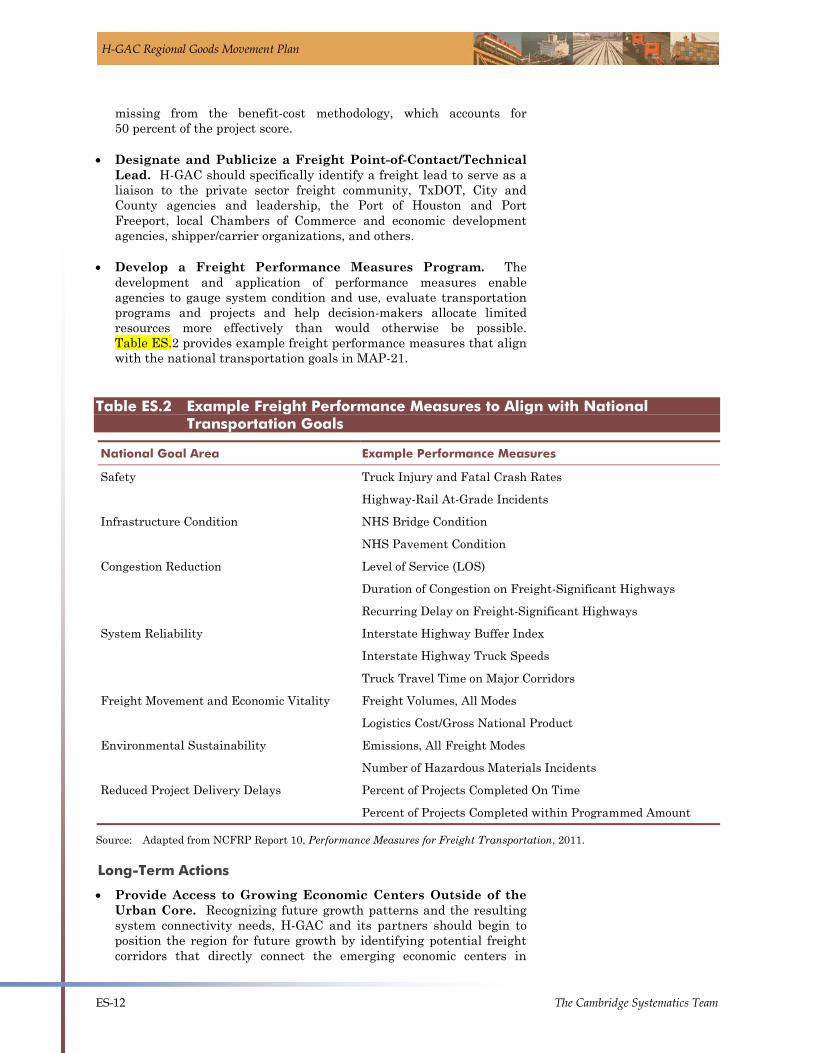
• Develop a Freight Performance Measures Program. The development and application of performance measures enable agencies to gauge system condition and use, evaluate transportation programs and projects and help decision-makers allocate limited resources more effectively than would otherwise be possible. Table ES.2 provides example freight performance measures that align with the national transportation goals in MAP-21.
Table ES.2 Example Freight Performance Measures to Align with National Transportation Goals
National Goal Area Example Performance Measures
Safety Truck Injury and Fatal Crash Rates
Highway-Rail At-Grade Incidents
Infrastructure Condition NHS Bridge Condition
NHS Pavement Condition
Congestion Reduction Level of Service (LOS)
Duration of Congestion on Freight-Significant Highways
Recurring Delay on Freight-Significant Highways
System Reliability Interstate Highway Buffer Index
Interstate Highway Truck Speeds
Truck Travel Time on Major Corridors
Freight Movement and Economic Vitality Freight Volumes, All Modes
Logistics Cost/Gross National Product
Environmental Sustainability Emissions, All Freight Modes
Number of Hazardous Materials Incidents
Reduced Project Delivery Delays Percent of Projects Completed On Time
Percent of Projects Completed within Programmed Amount
Source: Adapted from NCFRP Report 10, Performance Measures for Freight Transportation, 2011.
Long-Term Actions
• Provide Access to Growing Economic Centers Outside of the Urban Core. Recognizing future growth patterns and the resulting system connectivity needs, H-GAC and its partners should begin to position the region for future growth by identifying potential freight corridors that directly connect the emerging economic centers in
H-GAC Regional Goods Movement Plan
The Cambridge Systematics Team ES-13
surrounding counties while diverting truck and rail volume away from the urban core.
• Update Freight-Significant Network with Each Long-Range Plan Update. With each plan update every five years, staff should refresh the Freight-Significant Network to account for any changes to the system’s intermodal connectors, designated hazmat routes and other freight-significant roadway elements.
• Develop Climate Change Adaptation Strategies. A better understanding of the risks and vulnerabilities of the region’s freight infrastructure – and an adaptation plan to address these challenges – will help H-GAC prioritize future transportation investments.
By integrating infrastructure, operational, and institutional strategies, these recommendations will allow the H-GAC region to address existing deficiencies in its freight system, make improvements to improve the operational efficiency of freight movements, and more effectively engage the private sector freight community in the transportation planning, programming, and project development process. In the longer term, these recommendations will also position the region for future growth, allowing it to attract and retain key goods movement-dependent industries and the jobs, tax revenues, and other economic impacts that follow.