Embed Size (px)
Citation preview
TIME1 hour.
INSTRUCTIONS TO CANDIDATESWrite your Centre Number and Candidate Number in the spaces provided at the top of this page.Write your answers in the spaces provided in this question paper.Answer all nine questions.
INFORMATION FOR CANDIDATESThe total mark for this paper is 70.Figures in brackets printed down the right-hand side of pages indicate the marks awarded to each question or part question.Quality of written communication will be assessed in Question 3(b).
11298.05R
For Examiner’suse only
Question Number Marks
1 2 3 4 5 6 7 8 9
TotalMarks
Double Award Science: Biology
Unit B1 Higher Tier
[GSD12]WEDNESDAY 8 NOVEMBER 2017, MORNING
Centre Number
Candidate Number
General Certificate of Secondary Education2017–2018
GSD12
Examiner OnlyMarks Remark
11298.05R 2
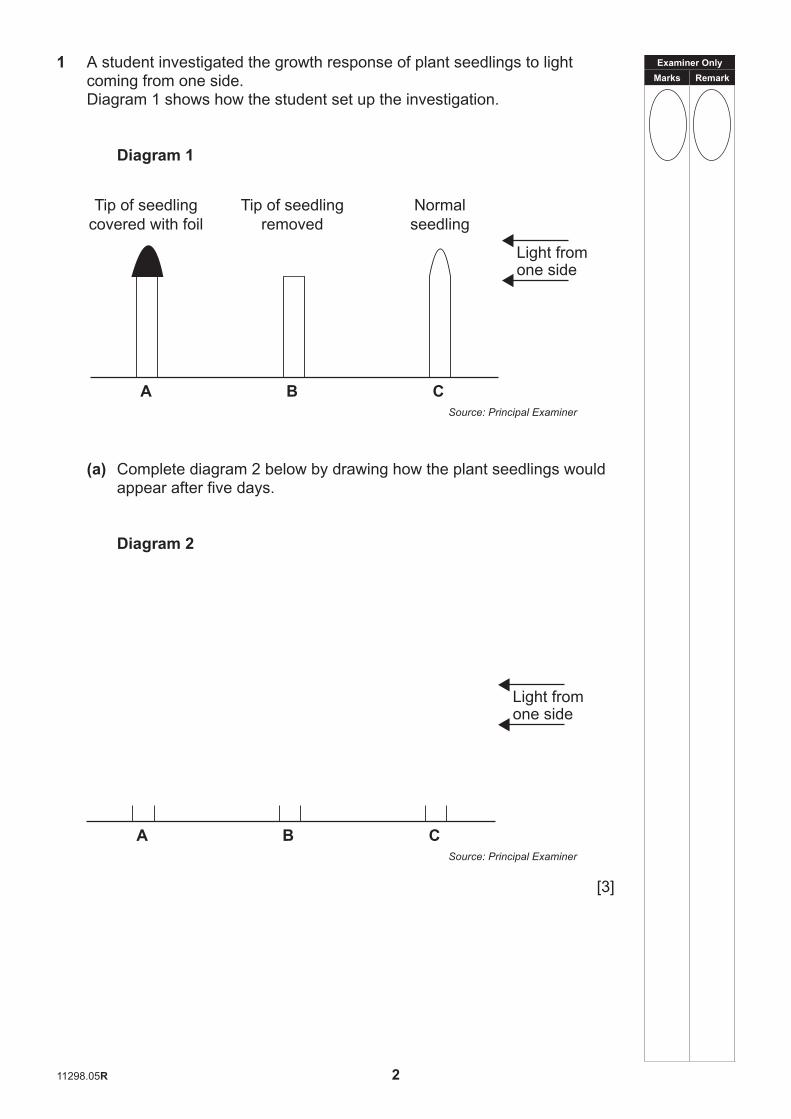
1 A student investigated the growth response of plant seedlings to light coming from one side.Diagram 1 shows how the student set up the investigation.
Diagram 1
Tip of seedling covered with foil
A
Tip of seedling removed
B
Normalseedling
C
Light fromone side
Source: Principal Examiner
(a) Complete diagram 2 below by drawing how the plant seedlings wouldappear after five days.
Diagram 2
A B C
Light fromone side
Source: Principal Examiner
[3]

Examiner OnlyMarks Remark
11298.05R 3 [Turn over
(b) Explain how a normal plant seedling responds to light coming from one side.
[3]
(c) Name this growth response.
[1]
Examiner OnlyMarks Remark
11298.05R 4
2 (a) Protease is an enzyme which breaks down protein.
(i) Complete the sentence below.
Protease breaks down protein into . [1]
(ii) Where is protein broken down in the digestive system?
1.
2. [2]
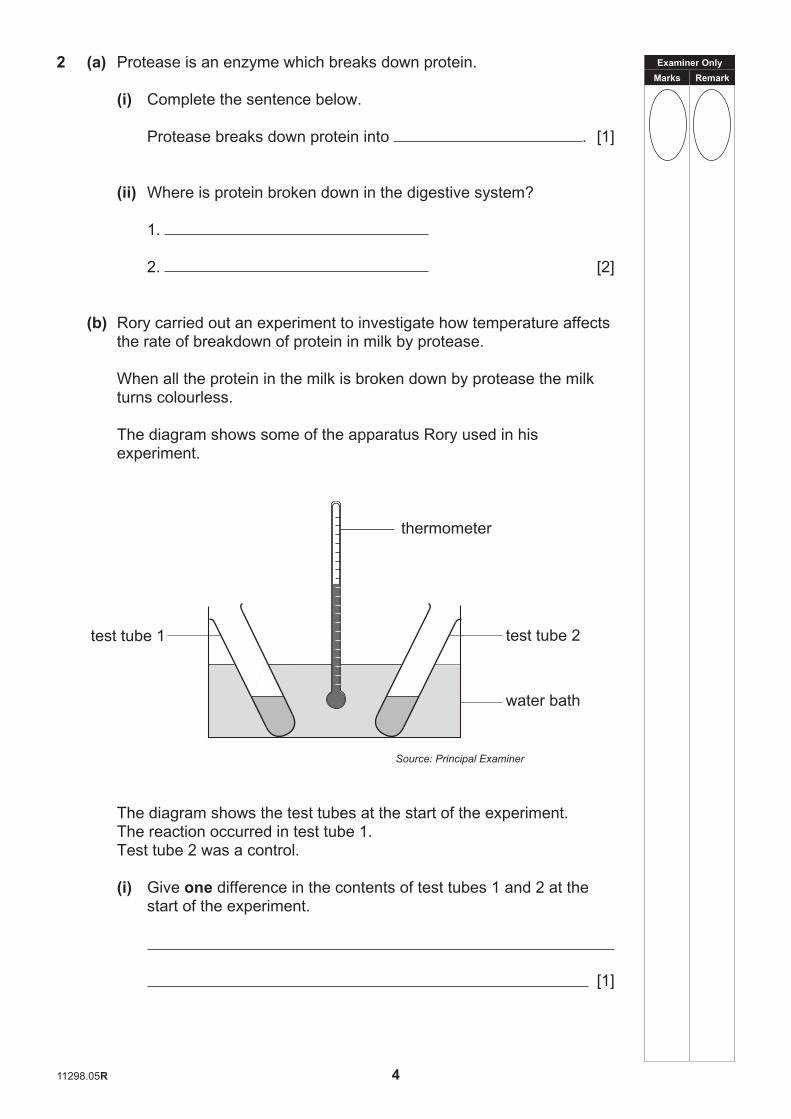
(b) Rory carried out an experiment to investigate how temperature affects the rate of breakdown of protein in milk by protease.
When all the protein in the milk is broken down by protease the milk turns colourless.
The diagram shows some of the apparatus Rory used in his experiment.
thermometer
water bath
test tube 1 test tube 2
Source: Principal Examiner
The diagram shows the test tubes at the start of the experiment. The reaction occurred in test tube 1. Test tube 2 was a control.
(i) Give one difference in the contents of test tubes 1 and 2 at the start of the experiment.
[1]
Examiner OnlyMarks Remark
11298.05R 5 [Turn over
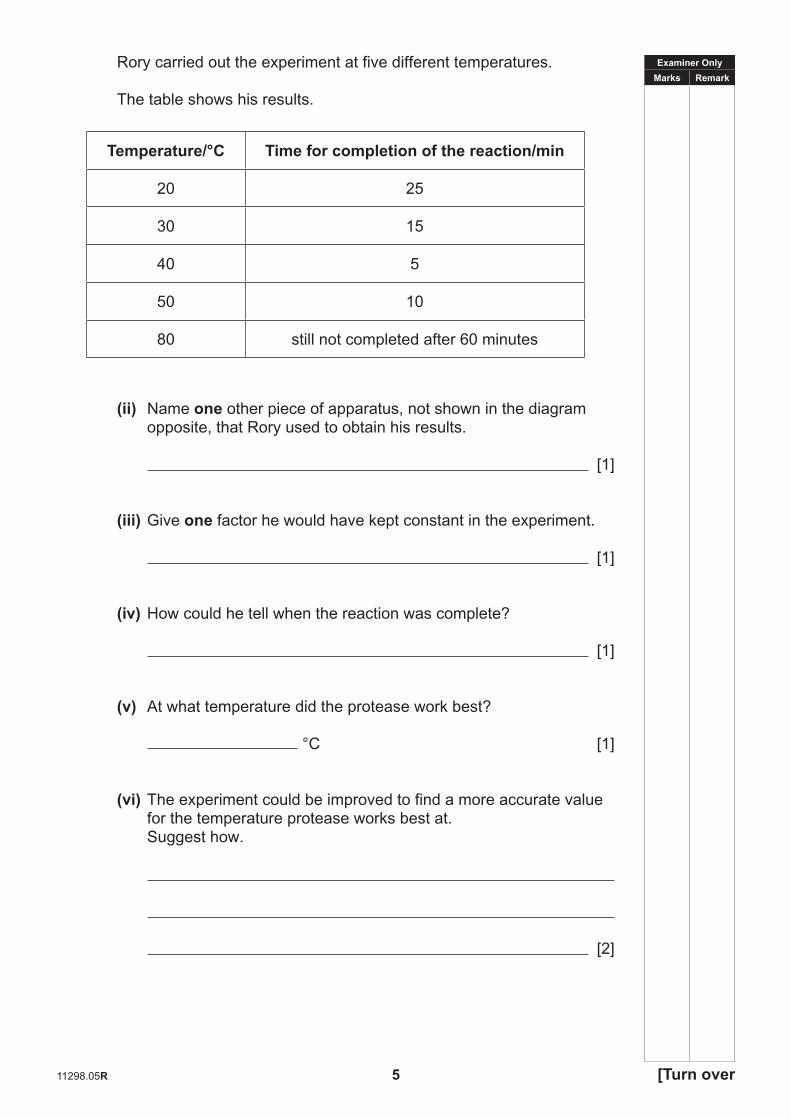
Rory carried out the experiment at five different temperatures.
The table shows his results.
Temperature/°C Time for completion of the reaction/min
20 25
30 15
40 5
50 10
80 still not completed after 60 minutes
(ii) Name one other piece of apparatus, not shown in the diagram opposite, that Rory used to obtain his results.
[1]
(iii) Give one factor he would have kept constant in the experiment.
[1]
(iv) How could he tell when the reaction was complete?
[1]
(v) At what temperature did the protease work best?
°C [1]
(vi) The experiment could be improved to find a more accurate value for the temperature protease works best at.
Suggest how.
[2]

Examiner OnlyMarks Remark
11298.05R 6
(c) Use your knowledge of enzymes to explain the result at 80 °C.
[3]

BLANK PAGE
(Questions continue overleaf)
11298.05R 7 [Turn over
Examiner OnlyMarks Remark
11298.05R 8
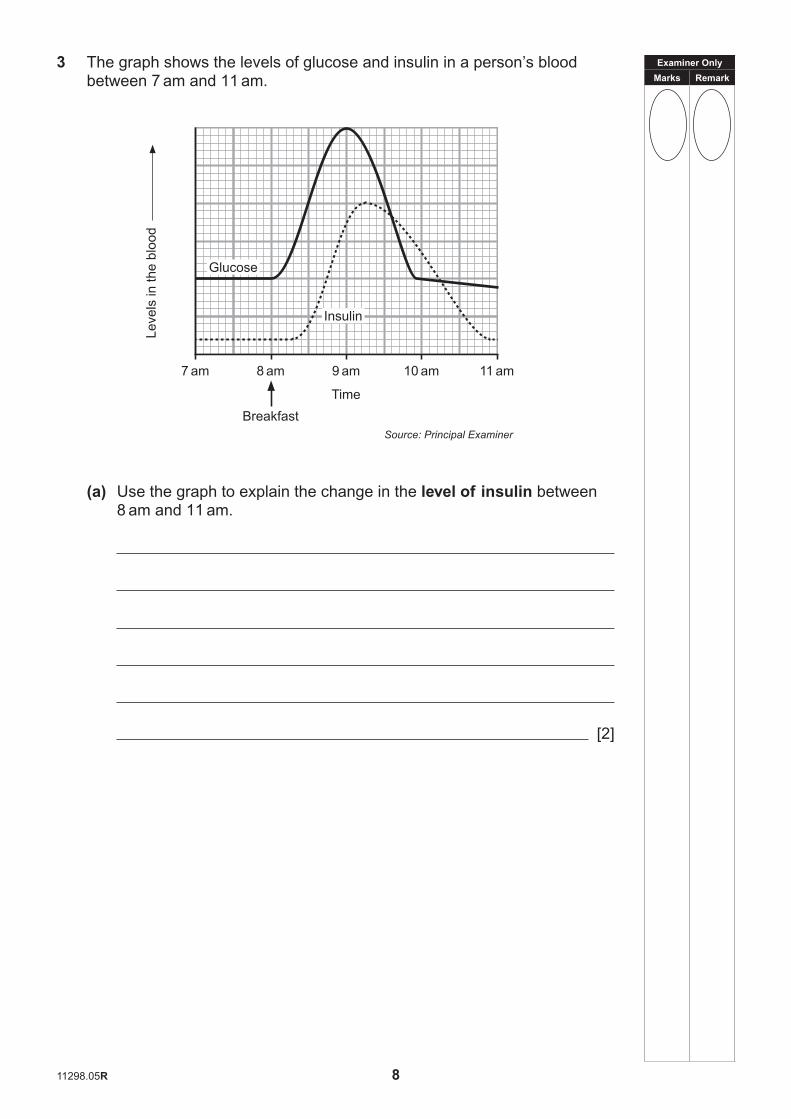
3 The graph shows the levels of glucose and insulin in a person’s blood between 7 am and 11 am.
7 am
Leve
ls in
the
bloo
d
8 am 9 am 10 am 11 am
Glucose
Insulin
BreakfastTime
Source: Principal Examiner
(a) Use the graph to explain the change in the level of insulin between8 am and 11 am.
[2]

Examiner OnlyMarks Remark
11298.05R 9 [Turn over
(b) Describe how insulin controls the level of glucose in the blood.
In this question you will be assessed on your written communication skills, including the use of specialist scientific terms.
[6]
Examiner OnlyMarks Remark
11298.05R 10
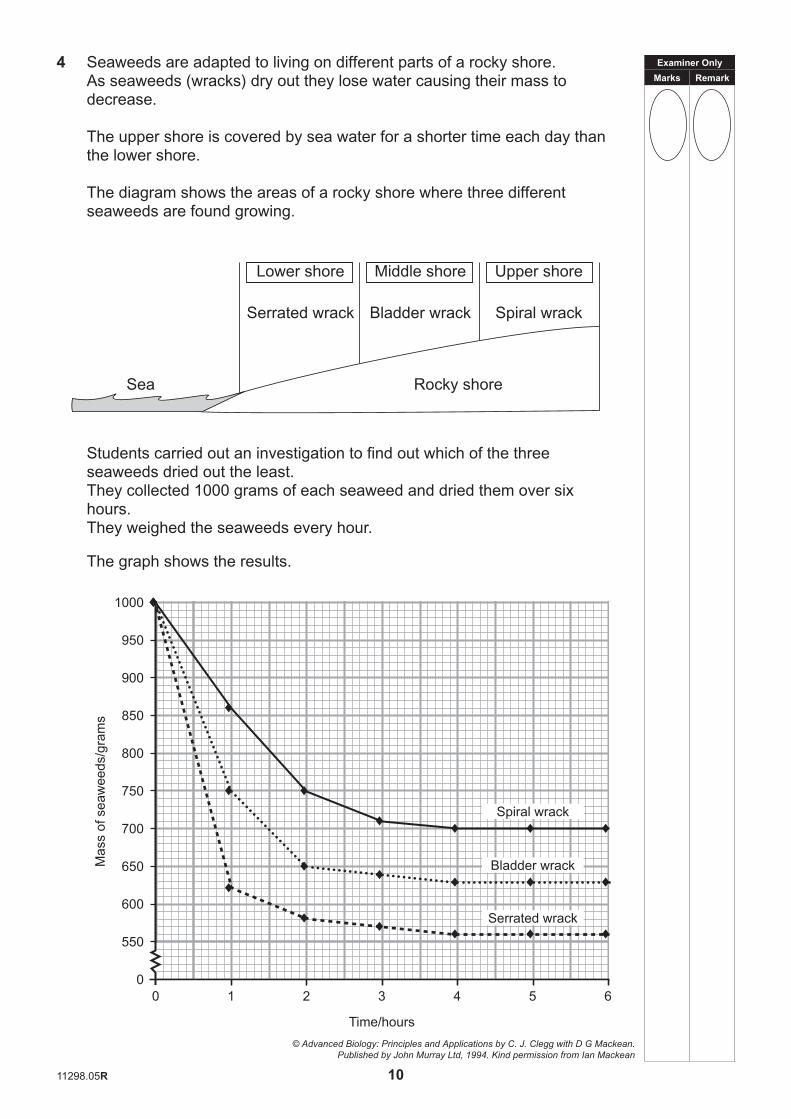
4 Seaweeds are adapted to living on different parts of a rocky shore.As seaweeds (wracks) dry out they lose water causing their mass to decrease.
The upper shore is covered by sea water for a shorter time each day than the lower shore.
The diagram shows the areas of a rocky shore where three different seaweeds are found growing.
Sea Rocky shore
Lower shore
Serrated wrack
Middle shore
Bladder wrack
Upper shore
Spiral wrack
Students carried out an investigation to find out which of the three seaweeds dried out the least.They collected 1000 grams of each seaweed and dried them over six hours.They weighed the seaweeds every hour.
The graph shows the results.
0
550
600
650
700
750
800
850
900
950
1000
0
Mas
s of
sea
wee
ds/g
ram
s
1 2 3 4 5 6
Spiral wrack
Time/hours
♦
♦
♦
♦ ♦ ♦ ♦
♦
♦
♦ ♦ ♦ ♦ ♦
♦
♦
♦ ♦ ♦ ♦ ♦
Bladder wrack
Serrated wrack
© Advanced Biology: Principles and Applications by C. J. Clegg with D G Mackean. Published by John Murray Ltd, 1994. Kind permission from Ian Mackean

Examiner OnlyMarks Remark
11298.05R 11 [Turn over
(a) Use the information given and the graph opposite to answer thefollowing questions.
(i) Name the seaweed which has dried out the least after six hours.
[1]
(ii) Use data to support your answer.
[2]
(iii) Suggest two reasons why the seaweed needs to be adapted sothat it dries out the least of the three seaweeds.
1.
2.
[2]
Seaweeds produce a substance called mucus. This covers their surface and helps prevent the seaweeds drying out when not covered with sea water.Serrated wrack produces the least amount of mucus.
(b) Use the diagram and the information on the rocky shore opposite tosuggest why.
[2]
Examiner OnlyMarks Remark
11298.05R 12
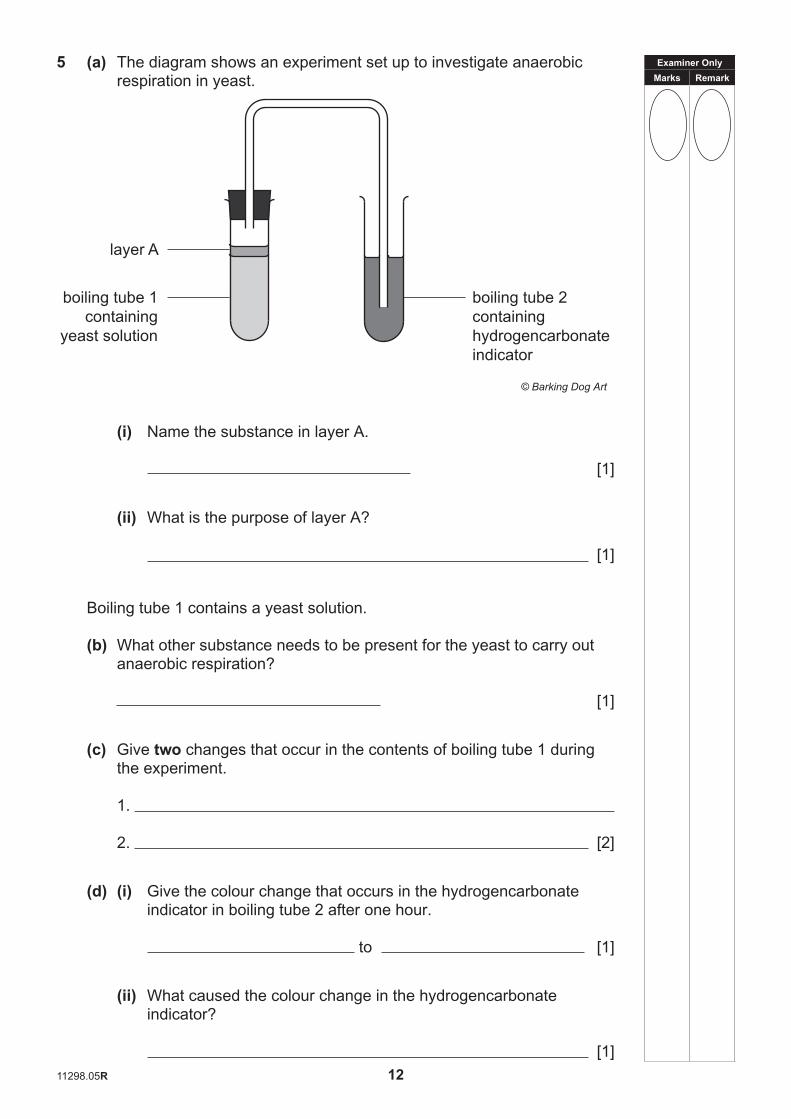
5 (a) The diagram shows an experiment set up to investigate anaerobic respiration in yeast.
boiling tube 2containinghydrogencarbonateindicator
boiling tube 1containing
yeast solution
layer A
© Barking Dog Art
(i) Name the substance in layer A.
[1]
(ii) What is the purpose of layer A?
[1]
Boiling tube 1 contains a yeast solution.
(b) What other substance needs to be present for the yeast to carry outanaerobic respiration?
[1]
(c) Give two changes that occur in the contents of boiling tube 1 duringthe experiment.
1.
2. [2]
(d) (i) Give the colour change that occurs in the hydrogencarbonateindicator in boiling tube 2 after one hour.
to [1]
(ii) What caused the colour change in the hydrogencarbonateindicator?
[1]
Examiner OnlyMarks Remark
11298.05R 13 [Turn over
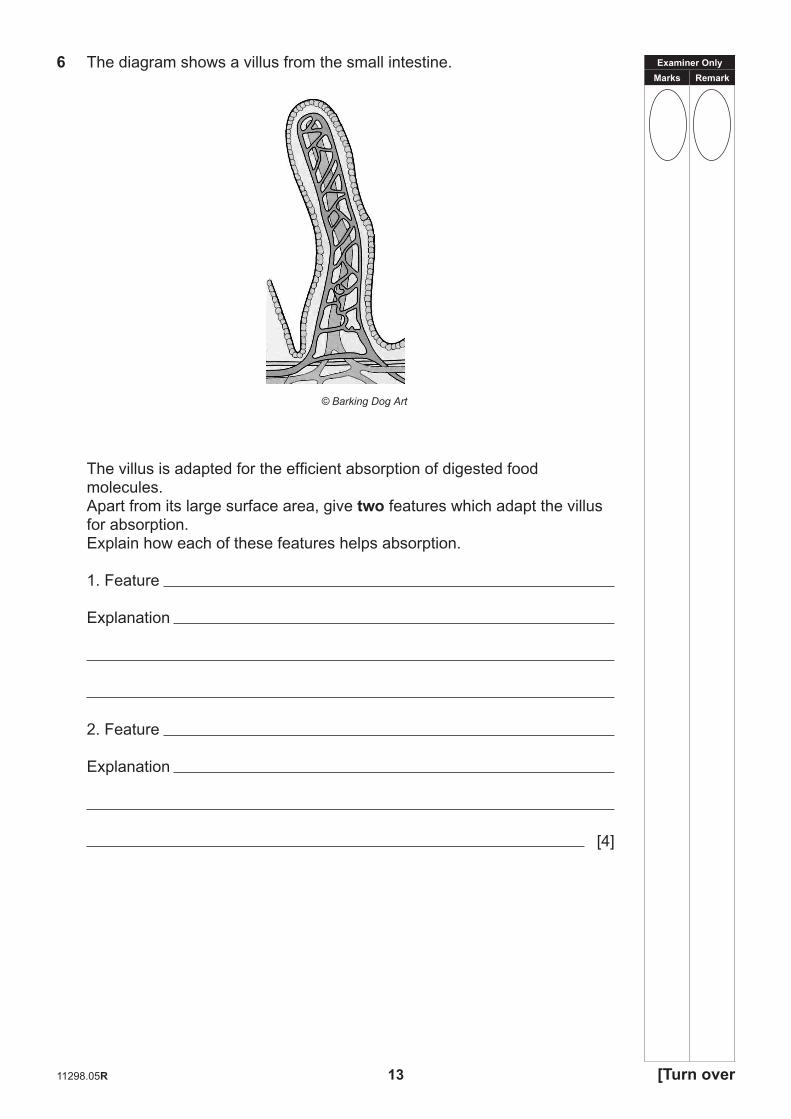
6 The diagram shows a villus from the small intestine.
© Barking Dog Art
The villus is adapted for the efficient absorption of digested food molecules.Apart from its large surface area, give two features which adapt the villus for absorption.Explain how each of these features helps absorption.
1. Feature
Explanation
2. Feature
Explanation
[4]
Examiner OnlyMarks Remark
11298.05R 14
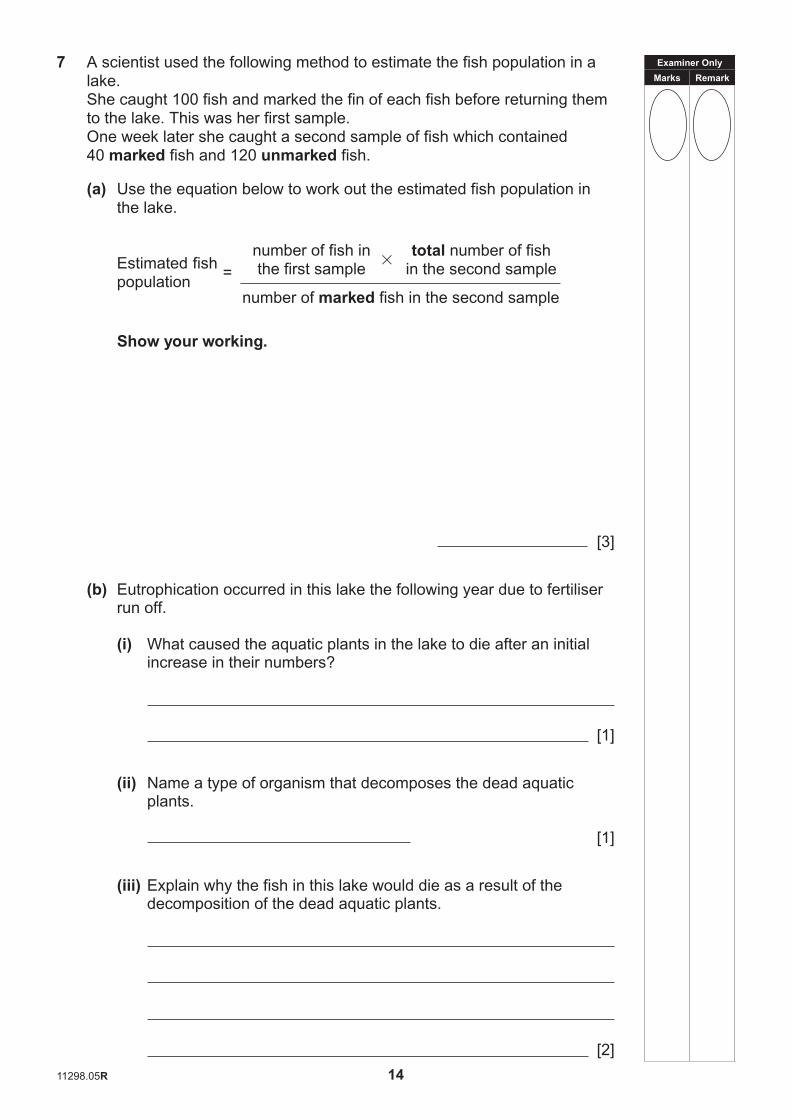
7 A scientist used the following method to estimate the fish population in a lake.She caught 100 fish and marked the fin of each fish before returning them to the lake. This was her first sample.One week later she caught a second sample of fish which contained 40 marked fish and 120 unmarked fish.
(a) Use the equation below to work out the estimated fish population inthe lake.
number of fish inthe first sample
total number of fish in the second sample
number of marked fish in the second sample
Estimated fish population
=
Show your working.
[3]
(b) Eutrophication occurred in this lake the following year due to fertiliserrun off.
(i) What caused the aquatic plants in the lake to die after an initialincrease in their numbers?
[1]
(ii) Name a type of organism that decomposes the dead aquaticplants.
[1]
(iii) Explain why the fish in this lake would die as a result of thedecomposition of the dead aquatic plants.
[2]

Examiner OnlyMarks Remark
11298.05R 15 [Turn over
(c) Suggest two reasons, other than pollution, for the death of fish in alake.
1.
2. [2]
Examiner OnlyMarks Remark
11298.05R 16
8 A peat bog is a wetland habitat.
In a peat bog there is little decomposition of dead animals and plants in the soil.
(a) Use your knowledge of the nitrogen cycle to explain why this lack ofdecomposition would lead to less nitrates in the soil.
[2]
(b) (i) The soil in a peat bog is waterlogged and contains little oxygen.Name the type of nitrogen bacteria that would increase in the soil in these conditions.
[1]
(ii) Explain how an increase in these bacteria reduces the nitratecontent of the soil.
[1]
(c) Name the substance formed from nitrates that plants need for healthygrowth.
[1]
Examiner OnlyMarks Remark
11298.05R 17 [Turn over
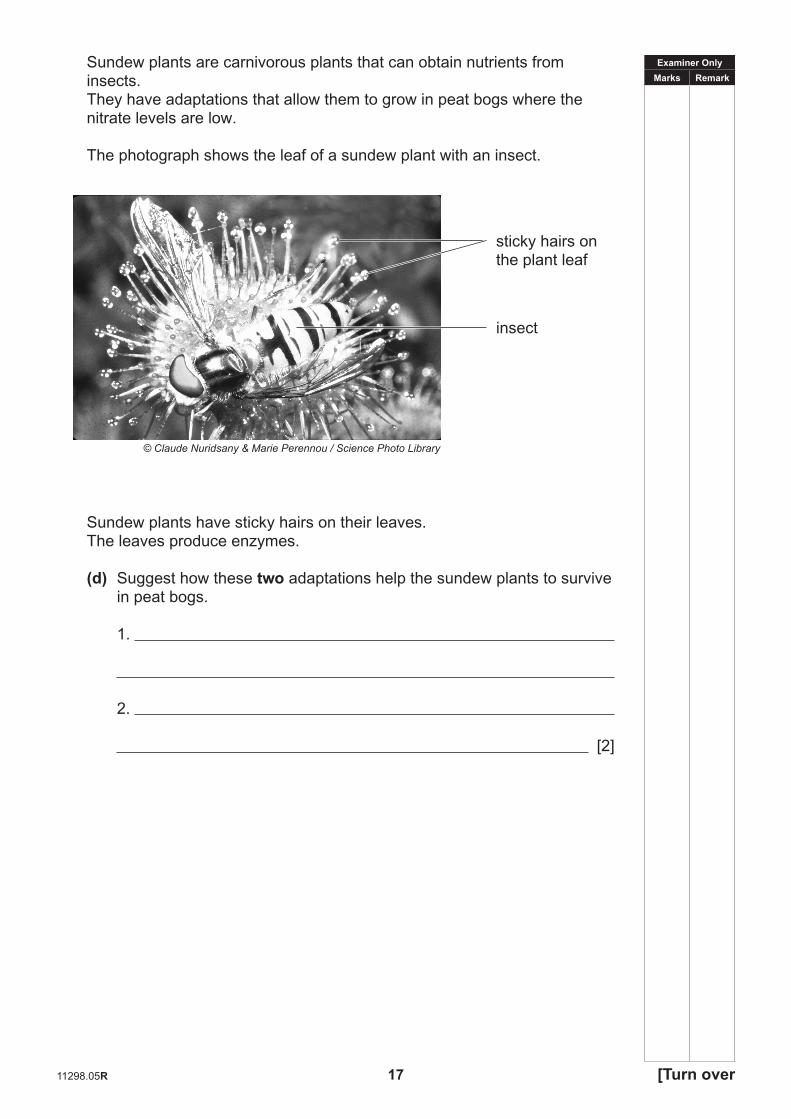
Sundew plants are carnivorous plants that can obtain nutrients from insects.They have adaptations that allow them to grow in peat bogs where the nitrate levels are low.
The photograph shows the leaf of a sundew plant with an insect.
sticky hairs on the plant leaf
insect
© Claude Nuridsany & Marie Perennou / Science Photo Library
Sundew plants have sticky hairs on their leaves. The leaves produce enzymes.
(d) Suggest how these two adaptations help the sundew plants to survivein peat bogs.
1.
2.
[2]
Examiner OnlyMarks Remark
11298.05R 18 11298 18
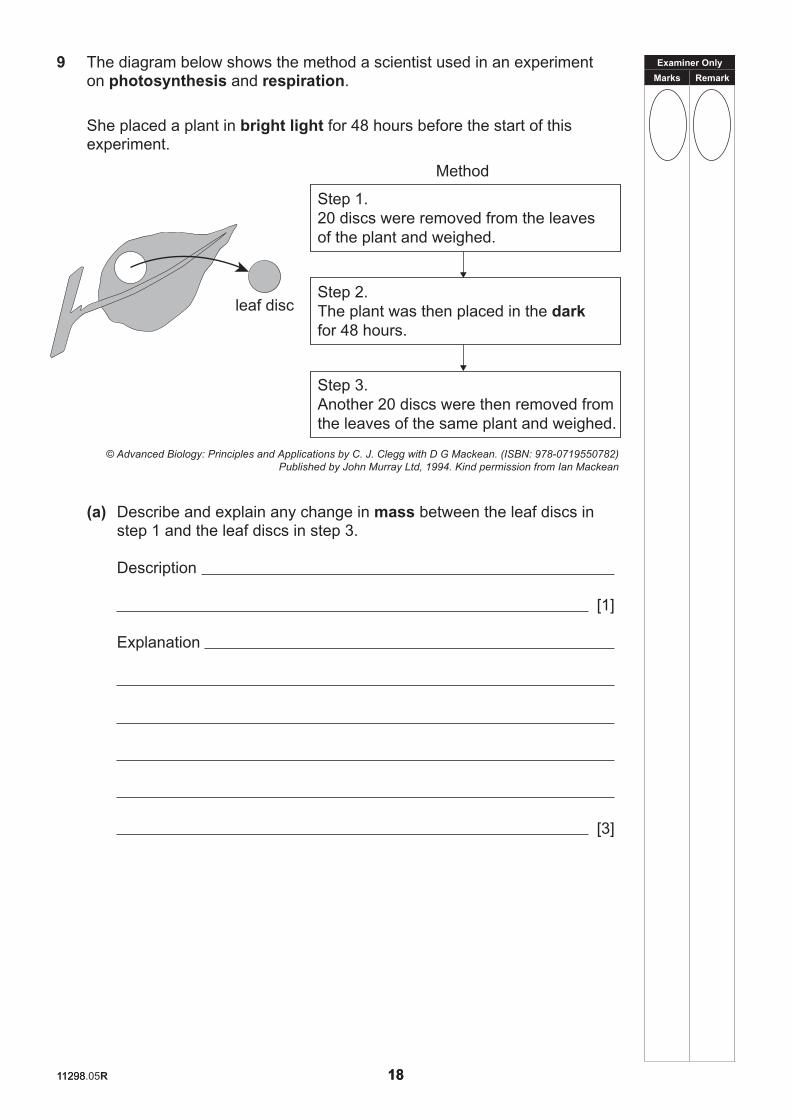
9 The diagram below shows the method a scientist used in an experiment on photosynthesis and respiration.
She placed a plant in bright light for 48 hours before the start of this experiment.
Step 1.20 discs were removed from the leaves of the plant and weighed.
Step 2.The plant was then placed in the dark for 48 hours.
Step 3.Another 20 discs were then removed from the leaves of the same plant and weighed.
leaf disc
Method
© Advanced Biology: Principles and Applications by C. J. Clegg with D G Mackean. (ISBN: 978-0719550782) Published by John Murray Ltd, 1994. Kind permission from Ian Mackean
(a) Describe and explain any change in mass between the leaf discs instep 1 and the leaf discs in step 3.
Description
[1]
Explanation
[3]
Examiner OnlyMarks Remark
11298.05R 19
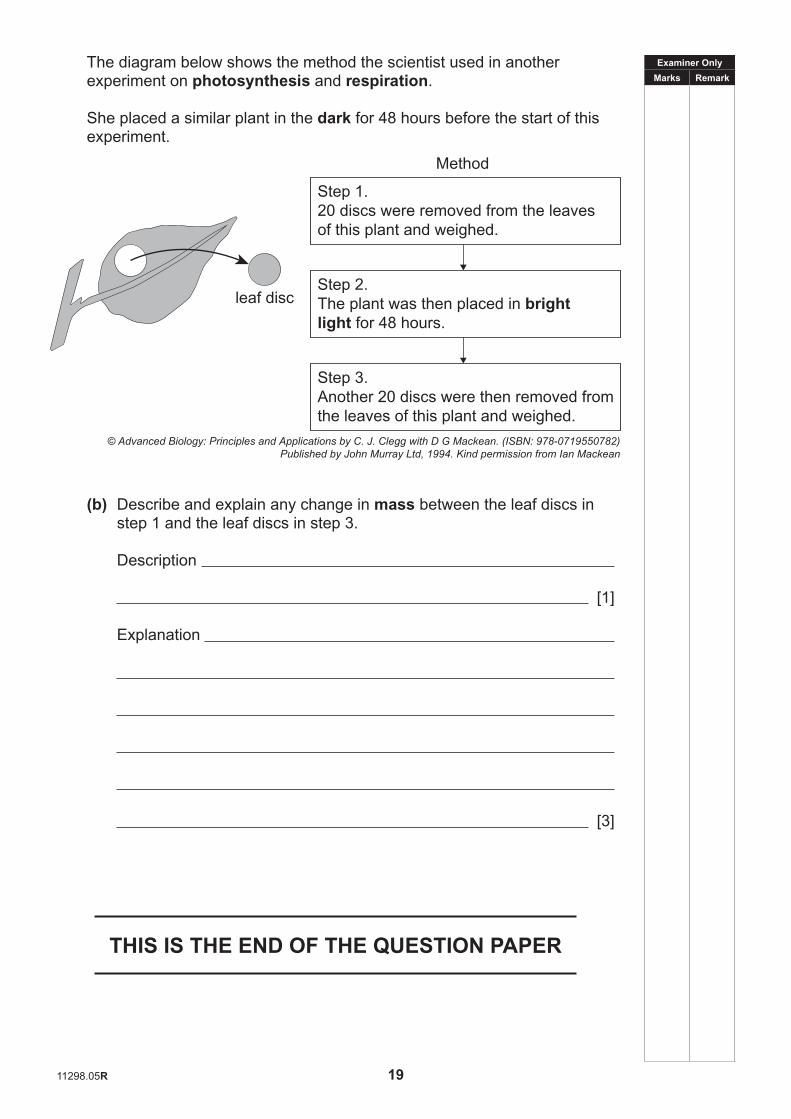
The diagram below shows the method the scientist used in another experiment on photosynthesis and respiration.
She placed a similar plant in the dark for 48 hours before the start of this experiment.
Step 1.20 discs were removed from the leaves of this plant and weighed.
Step 2.The plant was then placed in bright light for 48 hours.
Step 3.Another 20 discs were then removed from the leaves of this plant and weighed.
leaf disc
Method
© Advanced Biology: Principles and Applications by C. J. Clegg with D G Mackean. (ISBN: 978-0719550782) Published by John Murray Ltd, 1994. Kind permission from Ian Mackean
(b) Describe and explain any change in mass between the leaf discs instep 1 and the leaf discs in step 3.
Description
[1]
Explanation
[3]
THIS IS THE END OF THE QUESTION PAPER

113166
Permission to reproduce all copyright material has been applied for.In some cases, efforts to contact copyright holders may have been unsuccessful and CCEAwill be happy to rectify any omissions of acknowledgement in future if notified.