Embed Size (px)
Citation preview

GVC Modules and Applications
Seminar on Accounting for Global Value ChainsWednesday, June 7, 2017
Stacey FrederickUNSD Consultant
Duke University, CGGC
1

Outline
I. What are value chains? How are they different?II. Definitions and data sourcesIII. Example of GVC mapping/analysis in Costa Rica
2

Introduction to GVCs• Proliferation of the term “GVC” over the last 5-10 years to
describe anything pertaining to trade, firms, and countries.• All related to production fragmentation and coordination, but
different motives, approaches and definitions of GVCs• Three groups
• Social science & geography academics (1990s; GCC, GVC, GPN)• International NGOs and national governments
(funders/implementers); 2000s• Economists & national statistics offices (~2007; multi-country I-O
tables, TiVA; however also original firm-level VC approach 1980s).
• Benefits from combining (a) theoretical insights and industry experience from ‘traditional’ GVC research and (b) data and analysis from economists and statistics agencies.
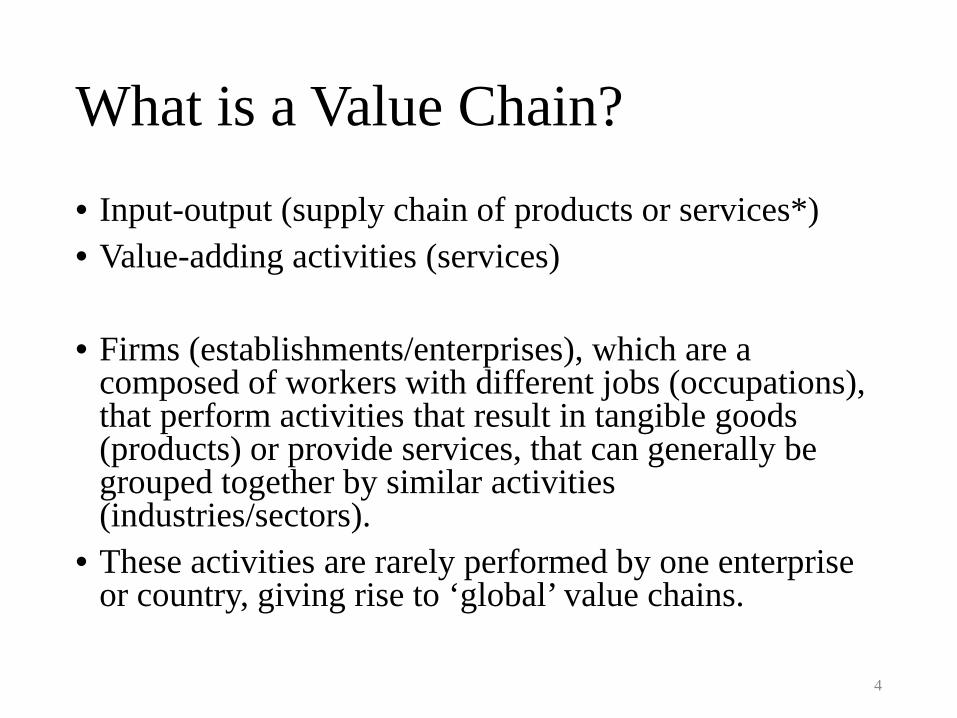
What is a Value Chain?• Input-output (supply chain of products or services*)• Value-adding activities (services)
• Firms (establishments/enterprises), which are a composed of workers with different jobs (occupations), that perform activities that result in tangible goods (products) or provide services, that can generally be grouped together by similar activities (industries/sectors).
• These activities are rarely performed by one enterprise or country, giving rise to ‘global’ value chains.
4

Global Value Chain Framework: Theory• Maximizing factors of
production doesn’t fully explain why some countries and firms are successful.
• Where does power and control come from in this interrelated set of activities? What determines who makes things, where they are made, and at what price?
• Governance (firms)• Institutions
(government/policy)
• As global trade increased, researchers looking for a way to explain why things happen. Found that industries operate in similar ways.
5

What is GVC Analysis?
• Define an industry using the four variables
• Input-output of products and services
• Geography• Important firms• Institutions (policies)
• Determine opportunities for upgrading (and identify bottlenecks and policy recommendations)
• Process• Product• Backward linkages• End market• Chain• Functional
6

GVC Key Point #1:A GVC is industry or sector-specific• The types of jobs, technologies, standards,
regulations, products, and processes are all unique. So are the ways in which buyers and suppliers interact. The importance of each element varies by stage within the chain.
• Policymakers need to understand how specific industries operate. This is particularly important when selecting industries to target and developing policies that will enhance competitiveness, ideally in a way that provides economic, as well as social and environmental benefits.
7
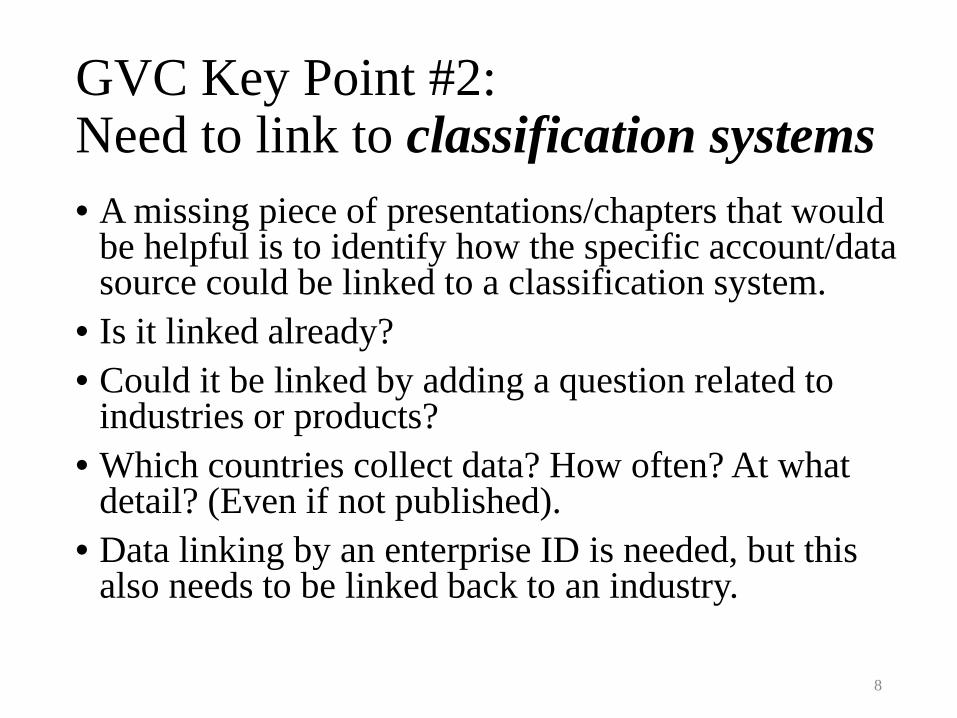
GVC Key Point #2:Need to link to classification systems• A missing piece of presentations/chapters that would
be helpful is to identify how the specific account/data source could be linked to a classification system.
• Is it linked already?• Could it be linked by adding a question related to
industries or products?• Which countries collect data? How often? At what
detail? (Even if not published).• Data linking by an enterprise ID is needed, but this
also needs to be linked back to an industry.
8

GVC Key Point #3:Reconfiguration of data• A value chain spans the entire range of products, services and firms
involved in this process, which crosses the traditional boundaries of how sectors or industries are defined in national accounts. A value chain includes service activities such as sourcing or back office accounting that are considered industries themselves.
• For example, the apparel manufacturing industry is just the cutting and sewing of fabric to make clothes. The apparel value chain begins with the production of fibers (part of the agriculture or chemical industry), which are transformed into yarn and then fabric by the textile industry, are assembled by apparel manufacturers, are distributed by intermediaries in the wholesale sector, and are sold to consumers by the retail industry.
• GVCs emphasizes the importance of the relationships among firms in the chain. This distinction is important because the firms responsible for the higher-value, service-related activities are often performed by different firms based in different countries than those engaged in producing the final product and its components.
9

Definitions and Data SourcesHow to Construct a GVC
10

Levels of Data Collection & Primary Classification Systems• Enterprises/establishments/business
units• ISIC, basis of national accounts?
• Products/services• CPC, HS, EBOPS
• People/workers• ISCO
• Business functions• Usefulness will depend on ability to
associate with other classification systems.
• All other accounts and surveys• How can we minimize burden by adding
questions on industries or products?
Need to be able to compare data across classification systems and countries

Manufacturing (C) MARKET
MARKET
Final ProductsComponentsRaw Materials Distribution & Sales Markets
Universities & Education (P) Utilities (D, E)
Information and
communication (J)
Professional, scientific and
technical activities (M)
Financial and insurance
activities (K)
MARKET
MARKET
Manufacturing (C)
Wholesale & Retail
Trade (G)Agriculture Forestry & Fishing (A)
Describe by type of market or industry; use ISIC divisions
Source: Frederick, S. (2014). Represents ISIC 4 sections
Mining & Quarrying
(B)
Transport & Storage
(H)
Admin & support service
activities (N)
Research & Development
Design & Development
Production/ Operations
Distribution & Logistics
Sales & Marketing
SUPPLY CHAIN STAGES
Four Parts of Value Chain Model
END MARKETS/ BUYERS &
SUPPORTING INDUSTRIES
KEY VALUE-ADDING ACTIVITIES
Business Functions
Top row: Non-manufacturing activities that account for most “value-added”

ISIC and National Account Limitations• Codes represent a mix of GVC concepts (business
functions, supply chain position, markets)• Codes do not provide adequate level of industry-
specific detail beyond sections A, B & C• Why? Because ISIC was developed before
enterprises ‘unbundled’ manufacturing and services, and the span of ‘services’ that add value to a product was relatively nascent.
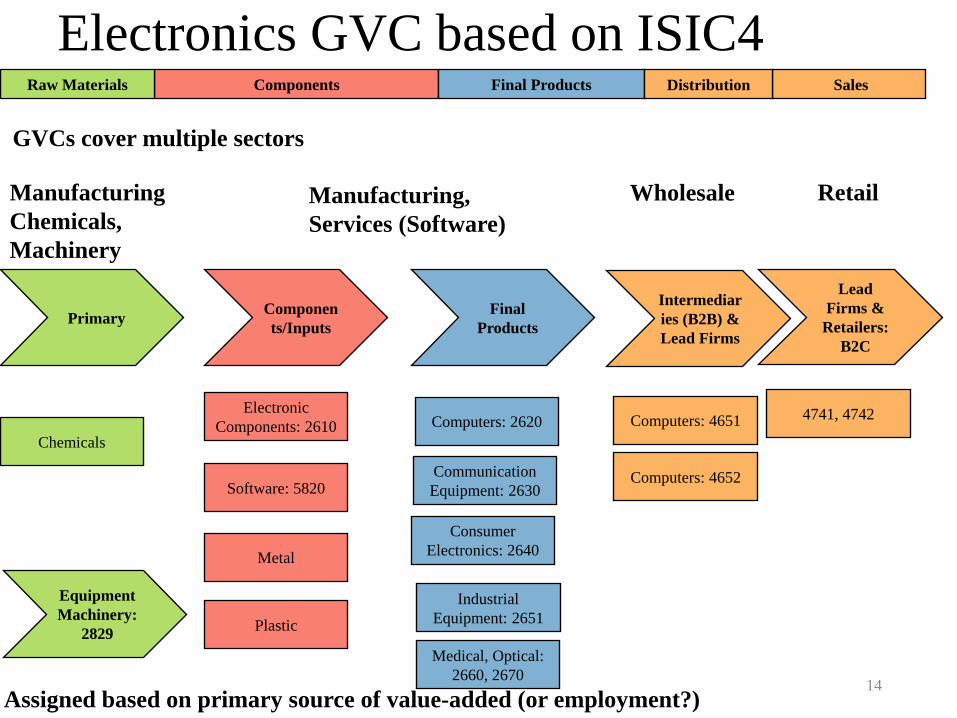
Primary Components/Inputs
Final Products
Intermediaries (B2B) & Lead Firms
Chemicals
Electronic Components: 2610
Communication Equipment: 2630
Computers: 2620
Consumer Electronics: 2640
Lead Firms &
Retailers: B2C
ComponentsRaw Materials Final Products Sales
4741, 4742
Equipment Machinery:
2829
Electronics GVC based on ISIC4
Manufacturing,Services (Software)
Manufacturing Chemicals, Machinery
Distribution
Wholesale Retail
GVCs cover multiple sectors
Assigned based on primary source of value-added (or employment?)
Industrial Equipment: 2651
Medical, Optical: 2660, 2670
Computers: 4651
Computers: 4652Software: 5820
Metal
Plastic
14

FiberYarn & Thread:
1311Fabric
Home Furnishings
& Industrial
Apparel: 14
Intermediaries (B2B) &
Lead Firms: 4641
Natural: 0116
MMF: 2030
Woven: 1312
Knit: 1391
Finishing: 1313
Carpet/Rugs: 1393
Made-up: 1392
Other: 1399
Cord/Rope: 1394
Lead Firms &
Retailers: B2C
Components (Textiles)Raw Materials Final Products Sales
Mass Merchants
Specialty Stores: 4771
Equipment Machinery:
2826
Apparel GVC based on ISIC4
ManufacturingAgriculture andManufacturing (Chemicals,Machinery)
Distribution
Wholesale Retail
GVCs cover multiple sectors
In buyer-driven chains, this segment is very important. Several layers just here can be involved. 15

Data/Process to Construct GVC
• Define the industry/value chain by market research and firms• Define template GVCs using classification systems of codes
(ISIC, CPC, HS, ISCO); • Start with ISIC C (manufacturing); 24 total and narrow down; case
studies so far: Apparel (or textiles/apparel): 14, automotive (29), electronics (26), medical (other mfg. 325)
• Use definitions to build a global and country-level picture• National level industrial data• Trade data• Linking data by enterprise• Interviews/review secondary data to validate
16

Key Points• Most of the accounts discussed are not useful for doing GVC
studies because not industry-specific, or connected to a classification system, BUT
• The ‘raw data’ collected as part of the annual surveys, trade data; and linking these together at the firm-level are more useful for GVC studies than national accounts.
• SUTs and input-output tables, but primarily for mapping the industry-specific flow of goods and services.
• To make it a GVC based on data, must define codes in each classification system and use this to benchmark.
• More detailed data and codes are needed for wholesale, management, transportation, R&D OR, if determined that all firms labeled in manufacturing, the business function survey will help.
• Occupation data at the firm-level is the main piece of information not collected that would be helpful.
17

Costa Rica ExampleMedical Devices: Examples on how trade, industrial statistics and SUTs can be layered inElectronics and Services: Classification Issues in Practice
18

Medical Devices Global Value ChainComponents
Manufacturing
Plastics Extrusion &
Molding
Precision Metal Works
Electronics/Electrical Components
Software Development
Weaving/Knitting Textiles
Assembly
Packaging
Sterilization
Assembly
Wholesale distributors
Individual Patients
Doctors & Nurses
Hospitals(Public/Private)
Cardiovascular
Orthopedics
Infusion Systems
Others
Marketing & Sales
Resin Metals
Chemicals Textiles
Input Suppliers
Disposables
Surgical & Medical
instruments
Capital Medical Equipment
Therapeutic Devices
Final Products
Distribution
Market Segments
Post-Sales Services
Consulting
Maintenance, Repair
Training
Buyers
Research & Product
Development
Regulatory Approval
Process Development
Sustaining Engineering
Prototype
Process Development
Source: Bamber & Gereffi (2013). Costa Rica in the Medical Devices GVC. Fig. 1, p. 9. Duke CGGC Report for COMEX.

Medical Device Dynamics
• Lead firms are in the U.S. and Europe• Ultimate buyers are institutions/B2B (not consumer
market)• Outsourcing and offshoring relatively uncommon• Why? High level of risk; standards/certifications
required; limited capabilities in the supply base• When the lead firm is the ‘brand’ or manufacturer in
the home country, it makes mapping easier.
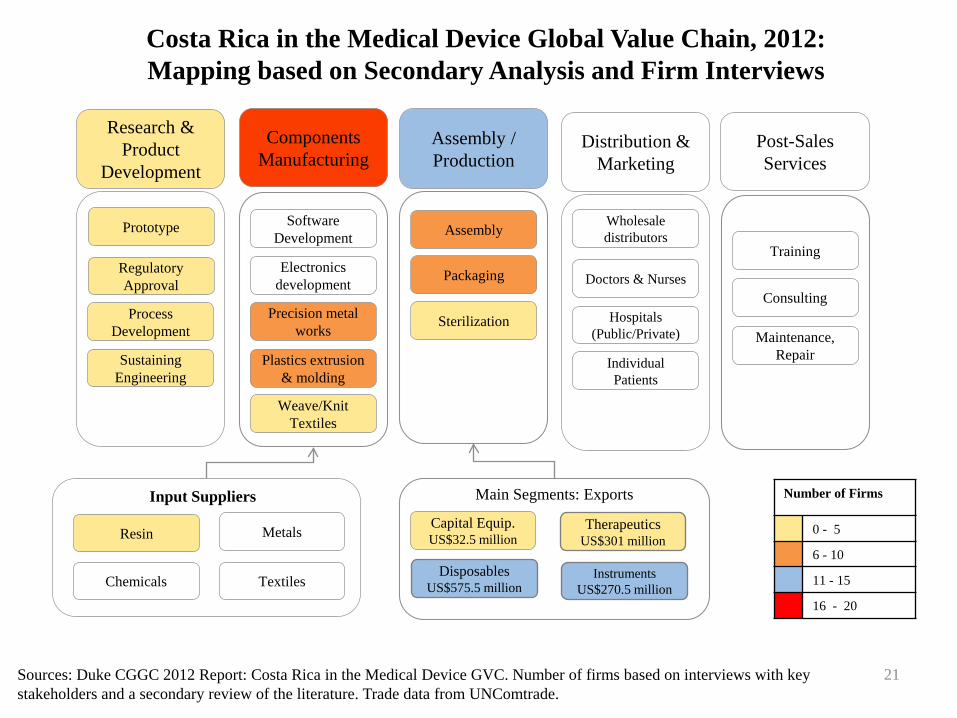
Components Manufacturing
Plastics extrusion & molding
Precision metal works
Electronics development
Software Development
Weave/Knit Textiles
Assembly
Packaging
Sterilization
Assembly / Production
Distribution & Marketing
Resin Metals
Chemicals Textiles
Input Suppliers
DisposablesUS$575.5 million
InstrumentsUS$270.5 million
Capital Equip.US$32.5 million
TherapeuticsUS$301 million
Main Segments: Exports
Post-Sales Services
Consulting
Maintenance, Repair
Training
Research & Product
Development
Regulatory Approval
Process Development
Sustaining Engineering
Prototype
Number of Firms
0 - 5
6 - 10
11 - 15
16 - 20
Wholesale distributors
Individual Patients
Doctors & Nurses
Hospitals(Public/Private)
21Sources: Duke CGGC 2012 Report: Costa Rica in the Medical Device GVC. Number of firms based on interviews with key stakeholders and a secondary review of the literature. Trade data from UNComtrade.
Costa Rica in the Medical Device Global Value Chain, 2012:Mapping based on Secondary Analysis and Firm Interviews

Assembly / Production
Medical Devices (AE080/
ISIC 3250): 28
establishments
Costa Rica in the Medical Device Global Value Chain, 2014/15:Number of Firms
22Data Sources: BCCR, Costa Rica
Define in terms of an ISIC code
# of firms: 28Employment: 1,400TurnoverOutputTaxes paidValue-added
Data used in national accounts, but also other data points.

Define by ISIC and Link to HS/CPCProduct Sector HS Codes CPCv2 Incl. based on
ISIC4 (325) Comments
Other 9019, 9020 48160 YesDisposables 9018.3, 50, 90 48150 Yes Would consider 901850, 90 to be with instruments.Instruments 9018.41, 49 48130 YesTherapeutics 9021.10 - 39 48171 YesTherapeutics 90214, 5, 9 No Electronic medical devices
Capital Equip.
90181901829022
No Electronic medical devices
Sterilizers 841920 48140 Yes
Glasses9004 48312 Yes Only 900490
900410 (sunglasses, not typically a medical device)9003.11, 19 48313 Yes Not entirely for medical devices (sunglasses)
9003.90 48352 Yes Not entirely for medical devices (sunglasses)Lenses 900130, 40, 50 NoFurniture 9402 48180 Yes Do not agree, but needs further evaluation
• ISIC category 3250 which covers "manufacturing of medical and dental instruments and supplies".
• ISIC and HS code definitions of industries will not always line up. In Costa Rica they did, but is a small country without intermediaries. In China, only half of apparel trade was by apparel manufacturers. Alignment in ‘producer-driven’ chains better than ‘buyer-driven.’

Assembly / Production
Disposables-44%US$934 million
Instruments-32%US$680 million
Capital Equip.4%US$81 million
Therapeutics-20%US$423 million
Costa Rica in the Medical Device Global Value Chain, 2015:Share of Medical Exports: UNComtrade
24Data Sources: Trade data: UNComtrade.
Other. < 1%US$1 million
Exports, $US Mil. (2015)
In GVC terms, can be used to show product upgrading or diversification

Ability to Compare/Benchmark to Other Countries

Assembly / Production
Disposables-6, 44%US$934 million
Instruments-8, 32%US$680 million
Capital Equip.0, 4%US$81 million
Therapeutics-7, 20%US$423 million
Exports, $US Mil./# of Exporters
Number of Firms w/ ≥ 50% of exports in product category
0 - 2
3 - 5
6 – 8
Costa Rica in the Medical Device Global Value Chain, 2015:Share of Medical Exports and Number of Exporters: UNComtrade and
Establishment-Level Export Data of ISIC-based Firms
26Data Sources: Trade data: UNComtradeNumber of assembly companies: based on my analysis of companies in AE080 and product sectors based on HS codes.
Of the 28 firms, able to put 22 into a more specific sector using export data. Two were not primarily exporters of correlated HS codes, and four exported similar shares in multiple sectors.
Other. 0, < 1%US$1 million

Finishing
Components Manufacturing
Plastics/Rubber: 42%
Metal: 22%
Electronics & Electrical: 14%
Machinery/ Furniture: 3%
Textiles: 1% Packaging (Paper/ Labels): 4%
Assembly / Production
Chemicals: 1%
Costa Rica in the Medical Device Global Value Chain, 2014/15:SUT for Medical Devices to Identify Intermediates Consumed
27
Medical-SpecificComponents: 13%
Share of Intermediate Products Consumed (2014)
Manufactured inputs account for 64% of intermediate purchases.
We can also do this for services (which account for the remainder of purchases), but these are the segments where we can compare with the trade data by HS codes.
Data Sources: 2014 SUT for AE080Table 1: Cuadro de Oferta y Utilizaction Detallado, Oferta de Productos a Precios Basicos y su Utilizacion a Precios de Comprador Number of assembly companies: based on my analysis of companies in AE080 and product categories based on HS codes.Number of establishments in medical devices: BCCR, Costa Rica
Medical Devices (AE080/
ISIC 3250): 28
establishments

Processed/Products: 32%
Processed/Product: 11%
Electronics & Electrical: 14%
Machinery/ Furniture: 3%
Textiles: 1%
Chemicals: 1%
Raw Materials/Inputs
28
Medical-SpecificComponents: 13%
Can further divide this into primary and processed.
Components Manufacturing
Assembly / Production
Share of Intermediate Products Consumed (2014)
Primary: 10%
Primary: 11%
Plastic
Metal
Data Sources: 2014 SUT for AE080Table 1: Cuadro de Oferta y Utilizaction Detallado, Oferta de Productos a Precios Basicos y su Utilizacion a Precios de Comprador
Costa Rica in the Medical Device Global Value Chain, 2014/15:SUT for Medical Devices to Identify Intermediates Consumed
Medical Devices (AE080/
ISIC 3250): 28
establishments
Finishing
Packaging (Paper/ Labels): 4%

Finishing
Components Manufacturing
Plastics/Rubber: 14
Metal: 16
Electronics & Electrical: 31
Machinery/ Furniture: 7
Textiles: 5
Packaging (Paper/Labels): 1
Chemicals: 2
29
Medical-SpecificComponents: 28
Number of companies in the free zones in 2014 within each category (an ‘upper bound’). This can be redone with # of companies outside the special regime, however MOST export-oriented firms make very few purchases outside the zones. Knowing the number would provide economic developers with a target of companies that could upgrade capabilities to become suppliers.
# Firms in Special Regime (2014)
Data Sources: Number of component companies in the Special Regime, 2014, from BCCR. Trade data: UNComtradeNumber of assembly companies: based on Stacey’s analysis of companies in AE080 and product categories based on HS codes.
Costa Rica in the Medical Device Global Value Chain, 2014/15:Identify Number of Potential Suppliers/Linking (Backward Linkages)
Assembly / Production
Medical Devices (AE080/
ISIC 3250): 28
establishments

Finishing
Components Manufacturing
Plastics/Rubber
Metal
Electronics & Electrical
Machinery/ Furniture
Textiles Packaging (Paper/
Labels)
Assembly / Production
Chemicals
Disposables-6, 44%US$934 million
Instruments-8, 32%US$680 million
Capital Equip.-0, 4%US$81 million
Therapeutics-7, 20%US$423 million
Number of Firms w/ ≥ 50% of exports in product category
0 - 2
3 - 5
6 – 8
30
Medical-SpecificComponents
Exports, $US Mil. (2015)
Upgrading potential backward linkages
Different products require different intermediate products
Could also be done with underlying data to create SUT
Can be further used to make proxy for technology-intensity
Data Sources: Import data (2014) of medical device (AE080) companies primarily exporting medical devices (26/28)
Costa Rica in the Medical Device Global Value Chain, 2014/15:Establishment-Level Import Data of Exporters
Can also be used to track domestic vs. imported inputs over time.
Based on aggregate data, 9% in 2014 vs. 6% in 2012.
An import matrix and TiVAindicators make similar higher-level estimations

Costa Rica in the Medical Device Global Value Chain, 2014/15
• Use the SUT data to also map purchases of services (about 36% in 2014), of which:
• Royalties (AE118): 20%• Admin/office support activities (AE123): 4.5%• Public services: 3%• Other: 8%
Data Sources: 2014 SUT for AE080Table 1: Cuadro de Oferta y Utilizaction Detallado, Oferta de Productos a Precios Basicos y su Utilizacion a Precios de Comprador

Costa Rica in the Medical Device Global Value Chain, 2014/15:Layering in Employment and Wages
• Disposables account for largest share of employment (and exports), but avg. wages/worker are lower.
• Within a GVC, ideally want to be able to move into sectors that offer higher-paying jobs or more skill-intensity (but difficult to do with available data)
• Occupation data would be better

What Else?Other Points• Trade and investment is
with the United States (branch plants of MNEs).
• Costa Rica has continued to increase exports, employment, backward linkages and value-added in medical devices, and acquire FDI in presumably more skill-intensive sectors.
What GVC Theory Tells Us• However facilities are
still branch plants of MNEs.
• The ability to take on the tasks the MNEs do in the U.S. is limited.
• The first activities outsourced tend to be sourcing and logistics-related.

What’s Not Available• What the workers do; the ability for a company or a
country to improve largely relates to skills and occupations.
• This type of data is not collected at the enterprise level (if collected, often in household surveys)
• Recommendations and benefits to policymakers were mostly in this area
• ISIC code of establishments that import products from Costa Rica (where linking country data would be useful).

Example: Costa Rica and Electronics• Provides an example of how reporting under one code and
accounting practices miss the ability to separate service and manufacturing activities.
• Manufacturing company initially set up an assembly plant in the country. However, over time shifted back office services (captive) and R&D/testing to the country as well. Workers in these positions accounted for one-third of the overall workforce, but no indicator of this in statistics. Observable in wages/worker only.
• Wages increased as a larger share of workers were in services instead of manufacturing.
• When manufacturing ceased, reclassified into a service code with no connection to electronics. However half of the firm’s operations were doing the same thing as in the past.
• Question: based on existing systems, how would this be recorded? If the service activities were treated a secondary activity and entity from an accounting standpoint, they would have no connection to the electronics industry (which is the case now).
35