Embed Size (px)
Citation preview

GUYANA
Education Sector Plan 2014-2018
3 Year Implementation Action Plan
This action plan outlines the key activities to be undertaken and major outputs to be achieved during first three years of the plan period.
The Program Objective Activities in Support of
Objective
Outputs1 Unit
cost
(US$)
Total
Cost
(US$
)
Source of
Funding
Output Indicator
Year 1
2014
Year 2
2015
Year 3
2016
Total
Performance of
Education
departments
responsible for ESP
priorities is
improved
Conduct organizational audit
of central and regional MoE
departments
Process of
department
audit started
Selected
department
audit
conducted
Audits of
departments
completed
1,481
Governme
nt of
Guyana
(GOG)
# of Departments
audited.
Build capacities for
departments selected for
capacity building via
organizational audit.
Action plan
based on
findings of the
audit
developed for
at least four (4)
departments.
All
departments/
units have a
results
framework
in place that
demonstrates
the use of
data in
meeting and
reporting
annual
targets
Staff of
audited
departments,
qualification
& competence
matches their
TOR.
GOG Percent of department
audited, where staff
qualification matches
their TOR.
Percent of audited
department with action
plan.
1 Specific/Quantified where feasible
USD, 000
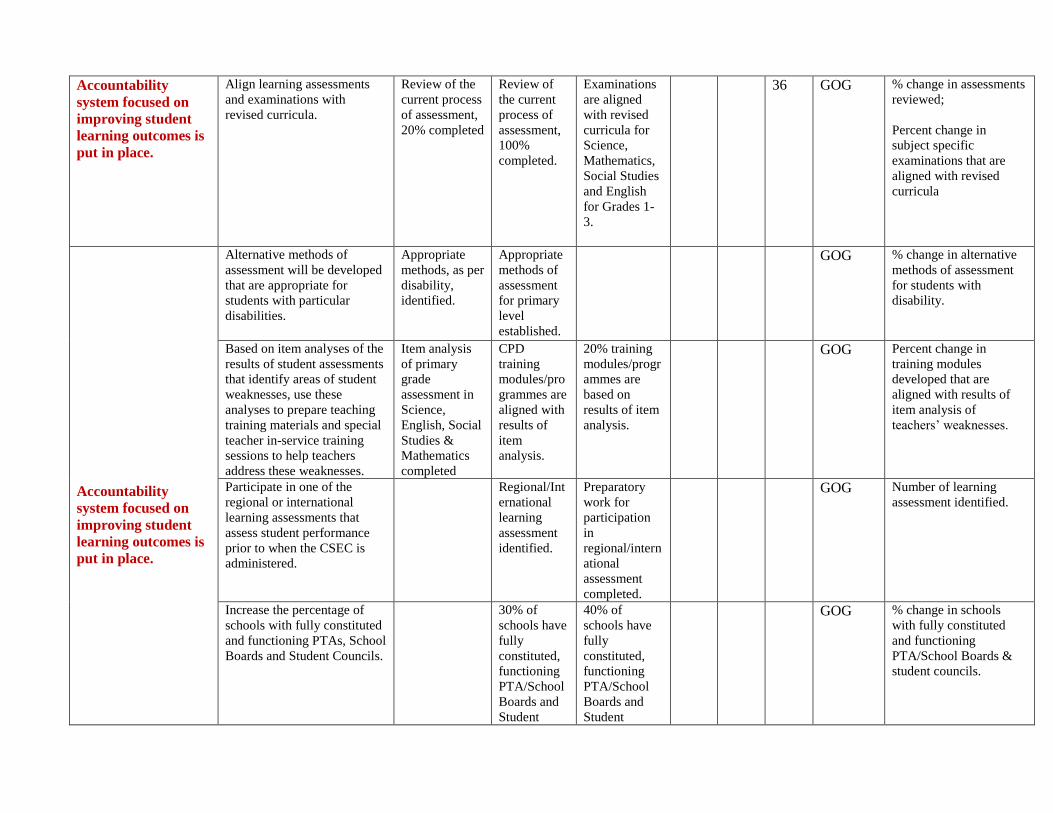
Accountability
system focused on
improving student
learning outcomes is
put in place.
Align learning assessments
and examinations with
revised curricula.
Review of the
current process
of assessment,
20% completed
Review of
the current
process of
assessment,
100%
completed.
Examinations
are aligned
with revised
curricula for
Science,
Mathematics,
Social Studies
and English
for Grades 1-
3.
36 GOG % change in assessments
reviewed;
Percent change in
subject specific
examinations that are
aligned with revised
curricula
Accountability
system focused on
improving student
learning outcomes is
put in place.
Alternative methods of
assessment will be developed
that are appropriate for
students with particular
disabilities.
Appropriate
methods, as per
disability,
identified.
Appropriate
methods of
assessment
for primary
level
established.
GOG % change in alternative
methods of assessment
for students with
disability.
Based on item analyses of the
results of student assessments
that identify areas of student
weaknesses, use these
analyses to prepare teaching
training materials and special
teacher in-service training
sessions to help teachers
address these weaknesses.
Item analysis
of primary
grade
assessment in
Science,
English, Social
Studies &
Mathematics
completed
CPD
training
modules/pro
grammes are
aligned with
results of
item
analysis.
20% training
modules/progr
ammes are
based on
results of item
analysis.
GOG Percent change in
training modules
developed that are
aligned with results of
item analysis of
teachers’ weaknesses.
Participate in one of the
regional or international
learning assessments that
assess student performance
prior to when the CSEC is
administered.
Regional/Int
ernational
learning
assessment
identified.
Preparatory
work for
participation
in
regional/intern
ational
assessment
completed.
GOG Number of learning
assessment identified.
Increase the percentage of
schools with fully constituted
and functioning PTAs, School
Boards and Student Councils.
30% of
schools have
fully
constituted,
functioning
PTA/School
Boards and
Student
40% of
schools have
fully
constituted,
functioning
PTA/School
Boards and
Student
GOG % change in schools
with fully constituted
and functioning
PTA/School Boards &
student councils.
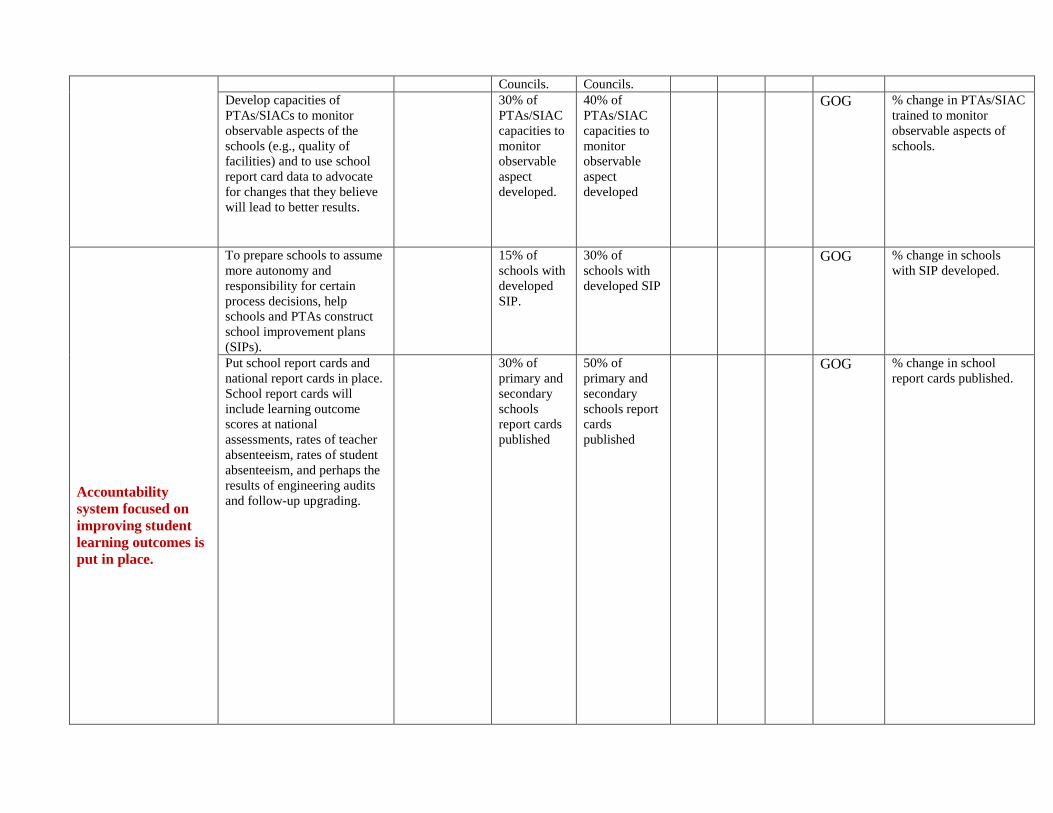
Councils. Councils. Develop capacities of
PTAs/SIACs to monitor
observable aspects of the
schools (e.g., quality of
facilities) and to use school
report card data to advocate
for changes that they believe
will lead to better results.
30% of
PTAs/SIAC
capacities to
monitor
observable
aspect
developed.
40% of
PTAs/SIAC
capacities to
monitor
observable
aspect
developed
GOG % change in PTAs/SIAC
trained to monitor
observable aspects of
schools.
Accountability
system focused on
improving student
learning outcomes is
put in place.
To prepare schools to assume
more autonomy and
responsibility for certain
process decisions, help
schools and PTAs construct
school improvement plans
(SIPs).
15% of
schools with
developed
SIP.
30% of
schools with
developed SIP
GOG % change in schools
with SIP developed.
Put school report cards and
national report cards in place.
School report cards will
include learning outcome
scores at national
assessments, rates of teacher
absenteeism, rates of student
absenteeism, and perhaps the
results of engineering audits
and follow-up upgrading.
30% of
primary and
secondary
schools
report cards
published
50% of
primary and
secondary
schools report
cards
published
GOG % change in school
report cards published.
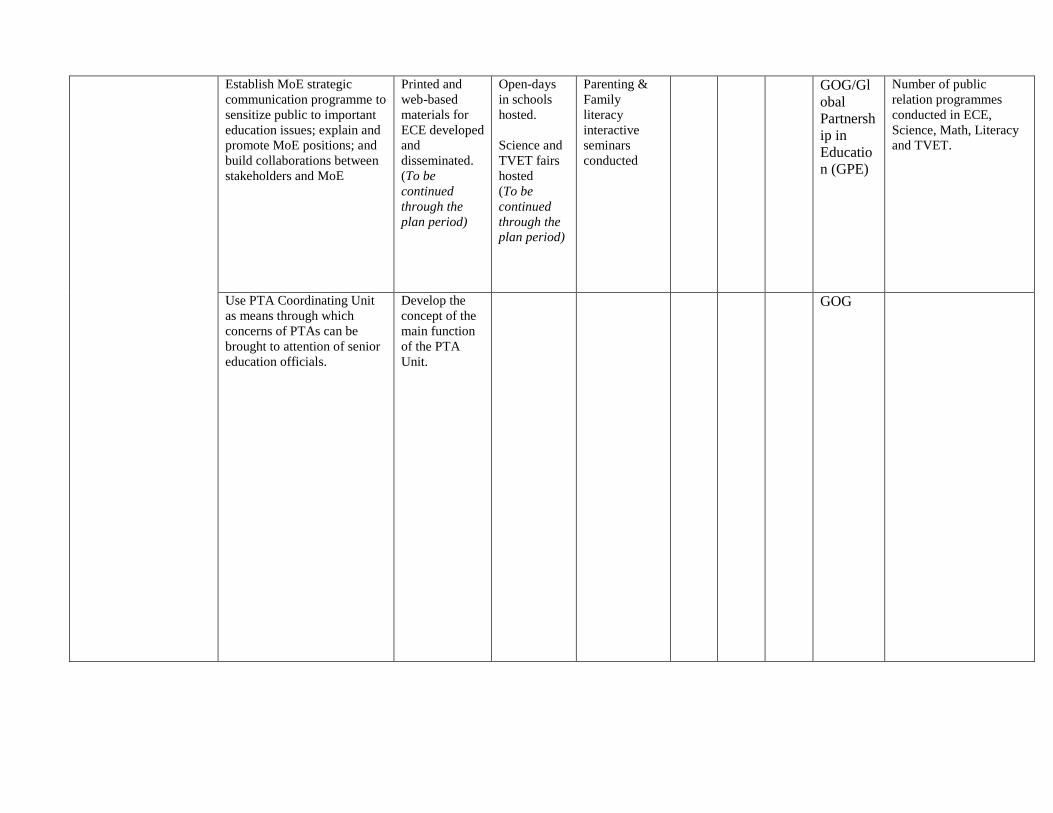
Establish MoE strategic
communication programme to
sensitize public to important
education issues; explain and
promote MoE positions; and
build collaborations between
stakeholders and MoE
Printed and
web-based
materials for
ECE developed
and
disseminated.
(To be
continued
through the
plan period)
Open-days
in schools
hosted.
Science and
TVET fairs
hosted
(To be
continued
through the
plan period)
Parenting &
Family
literacy
interactive
seminars
conducted
GOG/Gl
obal
Partnersh
ip in
Educatio
n (GPE)
Number of public
relation programmes
conducted in ECE,
Science, Math, Literacy
and TVET.
Use PTA Coordinating Unit
as means through which
concerns of PTAs can be
brought to attention of senior
education officials.
Develop the
concept of the
main function
of the PTA
Unit.
GOG
The Program
Objective
Activities in Support of Objective Outputs2 Uni
t
cost
(US
$)
Total
Cost
(US$)
Source
of
Fundin
g
Output Indicator
Year 1
2014
Year 2
2015
Year 3 2016 T
ot
al
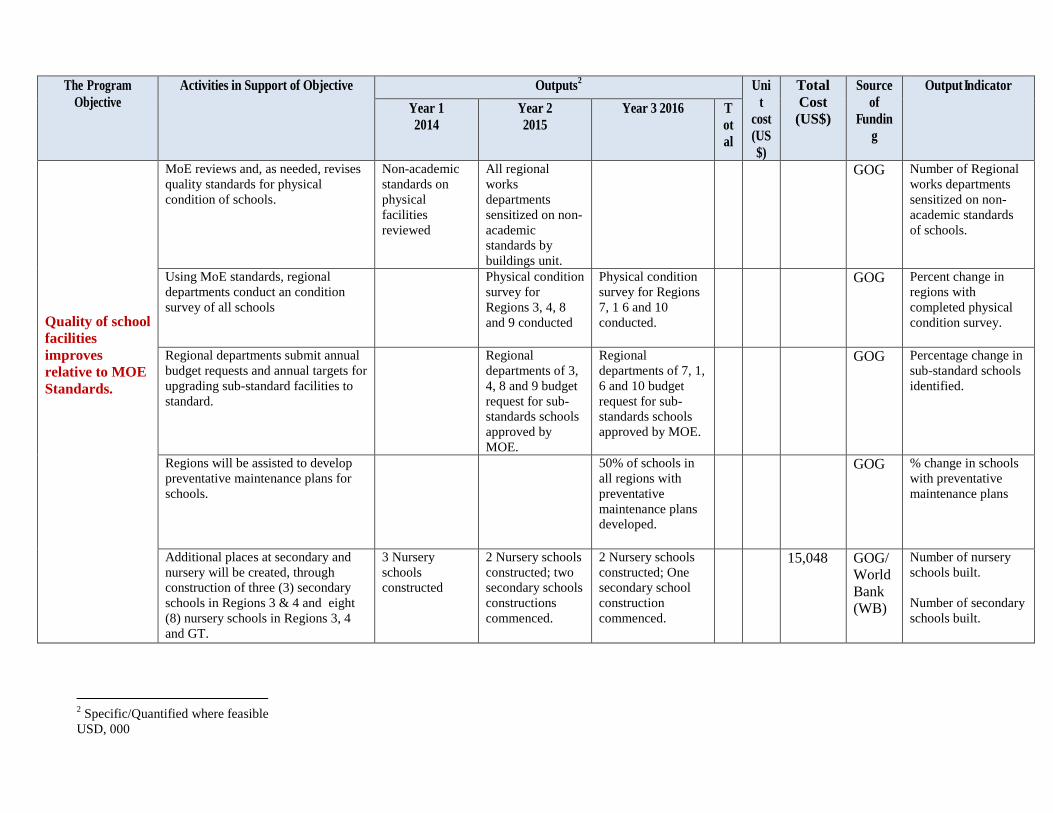
Quality of school
facilities
improves
relative to MOE
Standards.
MoE reviews and, as needed, revises
quality standards for physical
condition of schools.
Non-academic
standards on
physical
facilities
reviewed
All regional
works
departments
sensitized on non-
academic
standards by
buildings unit.
GOG Number of Regional
works departments
sensitized on non-
academic standards
of schools.
Using MoE standards, regional
departments conduct an condition
survey of all schools
Physical condition
survey for
Regions 3, 4, 8
and 9 conducted
Physical condition
survey for Regions
7, 1 6 and 10
conducted.
GOG Percent change in
regions with
completed physical
condition survey.
Regional departments submit annual
budget requests and annual targets for
upgrading sub-standard facilities to
standard.
Regional
departments of 3,
4, 8 and 9 budget
request for sub-
standards schools
approved by
MOE.
Regional
departments of 7, 1,
6 and 10 budget
request for sub-
standards schools
approved by MOE.
GOG Percentage change in
sub-standard schools
identified.
Regions will be assisted to develop
preventative maintenance plans for
schools.
50% of schools in
all regions with
preventative
maintenance plans
developed.
GOG % change in schools
with preventative
maintenance plans
Additional places at secondary and
nursery will be created, through
construction of three (3) secondary
schools in Regions 3 & 4 and eight
(8) nursery schools in Regions 3, 4
and GT.
3 Nursery
schools
constructed
2 Nursery schools
constructed; two
secondary schools
constructions
commenced.
2 Nursery schools
constructed; One
secondary school
construction
commenced.
15,048 GOG/
World
Bank
(WB)
Number of nursery
schools built.
Number of secondary
schools built.
2 Specific/Quantified where feasible
USD, 000
The Program Objective Activities in Support of
Objective
Outputs3 Uni
t
cost
(US
$)
Total
Cost
(US$)
Source of
Funding
Output Indicator
Year 1
2014
Year 2
2015
Year 3
2016
T
o
t
a
l
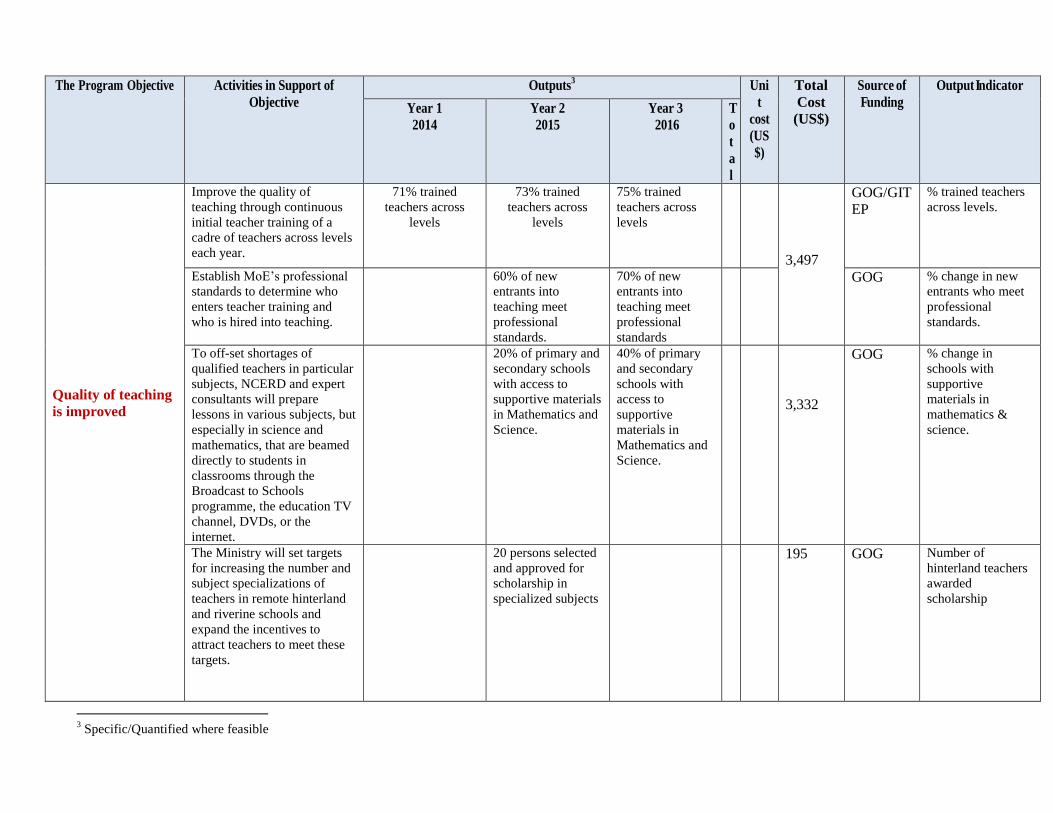
Quality of teaching
is improved
Improve the quality of
teaching through continuous
initial teacher training of a
cadre of teachers across levels
each year.
71% trained
teachers across
levels
73% trained
teachers across
levels
75% trained
teachers across
levels
3,497
GOG/GIT
EP
% trained teachers
across levels.
Establish MoE’s professional
standards to determine who
enters teacher training and
who is hired into teaching.
60% of new
entrants into
teaching meet
professional
standards.
70% of new
entrants into
teaching meet
professional
standards
GOG % change in new
entrants who meet
professional
standards.
To off-set shortages of
qualified teachers in particular
subjects, NCERD and expert
consultants will prepare
lessons in various subjects, but
especially in science and
mathematics, that are beamed
directly to students in
classrooms through the
Broadcast to Schools
programme, the education TV
channel, DVDs, or the
internet.
20% of primary and
secondary schools
with access to
supportive materials
in Mathematics and
Science.
40% of primary
and secondary
schools with
access to
supportive
materials in
Mathematics and
Science.
3,332
GOG % change in
schools with
supportive
materials in
mathematics &
science.
The Ministry will set targets
for increasing the number and
subject specializations of
teachers in remote hinterland
and riverine schools and
expand the incentives to
attract teachers to meet these
targets.
20 persons selected
and approved for
scholarship in
specialized subjects
195 GOG Number of
hinterland teachers
awarded
scholarship
3 Specific/Quantified where feasible
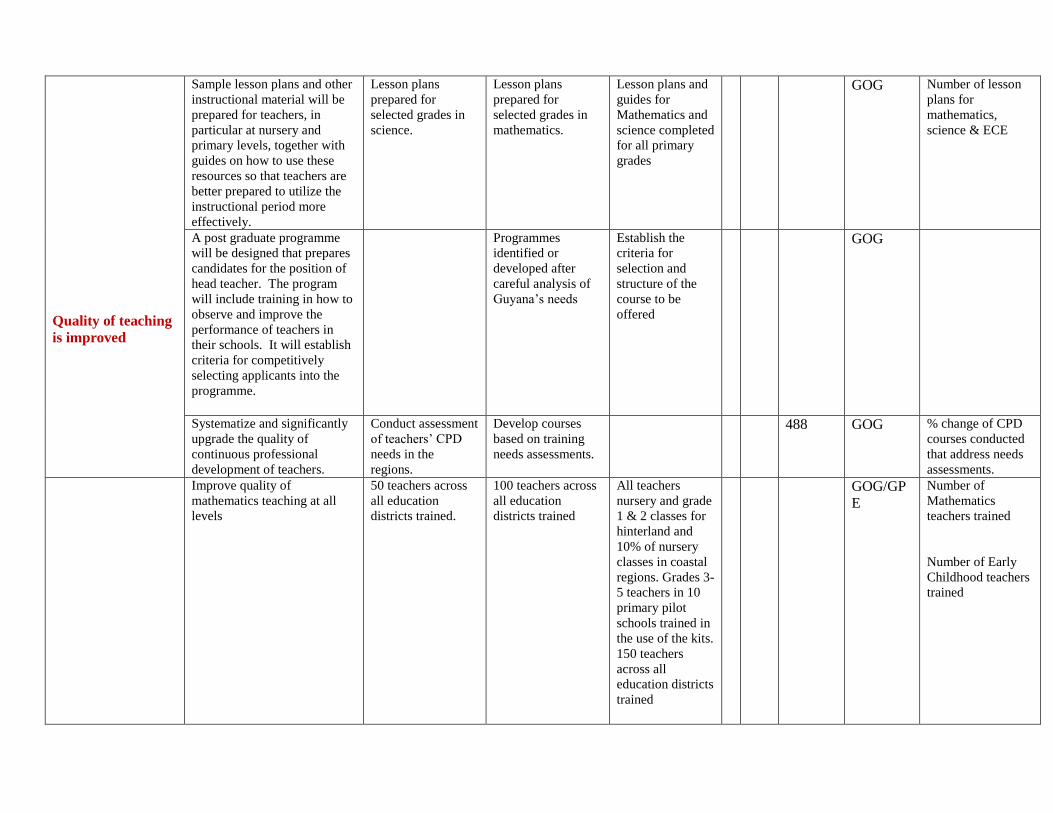
Quality of teaching
is improved
Sample lesson plans and other
instructional material will be
prepared for teachers, in
particular at nursery and
primary levels, together with
guides on how to use these
resources so that teachers are
better prepared to utilize the
instructional period more
effectively.
Lesson plans
prepared for
selected grades in
science.
Lesson plans
prepared for
selected grades in
mathematics.
Lesson plans and
guides for
Mathematics and
science completed
for all primary
grades
GOG Number of lesson
plans for
mathematics,
science & ECE
A post graduate programme
will be designed that prepares
candidates for the position of
head teacher. The program
will include training in how to
observe and improve the
performance of teachers in
their schools. It will establish
criteria for competitively
selecting applicants into the
programme.
Programmes
identified or
developed after
careful analysis of
Guyana’s needs
Establish the
criteria for
selection and
structure of the
course to be
offered
GOG
Systematize and significantly
upgrade the quality of
continuous professional
development of teachers.
Conduct assessment
of teachers’ CPD
needs in the
regions.
Develop courses
based on training
needs assessments.
488 GOG % change of CPD
courses conducted
that address needs
assessments.
Improve quality of
mathematics teaching at all
levels
50 teachers across
all education
districts trained.
100 teachers across
all education
districts trained
All teachers
nursery and grade
1 & 2 classes for
hinterland and
10% of nursery
classes in coastal
regions. Grades 3-
5 teachers in 10
primary pilot
schools trained in
the use of the kits.
150 teachers
across all
education districts
trained
GOG/GP
E
Number of
Mathematics
teachers trained
Number of Early
Childhood teachers
trained
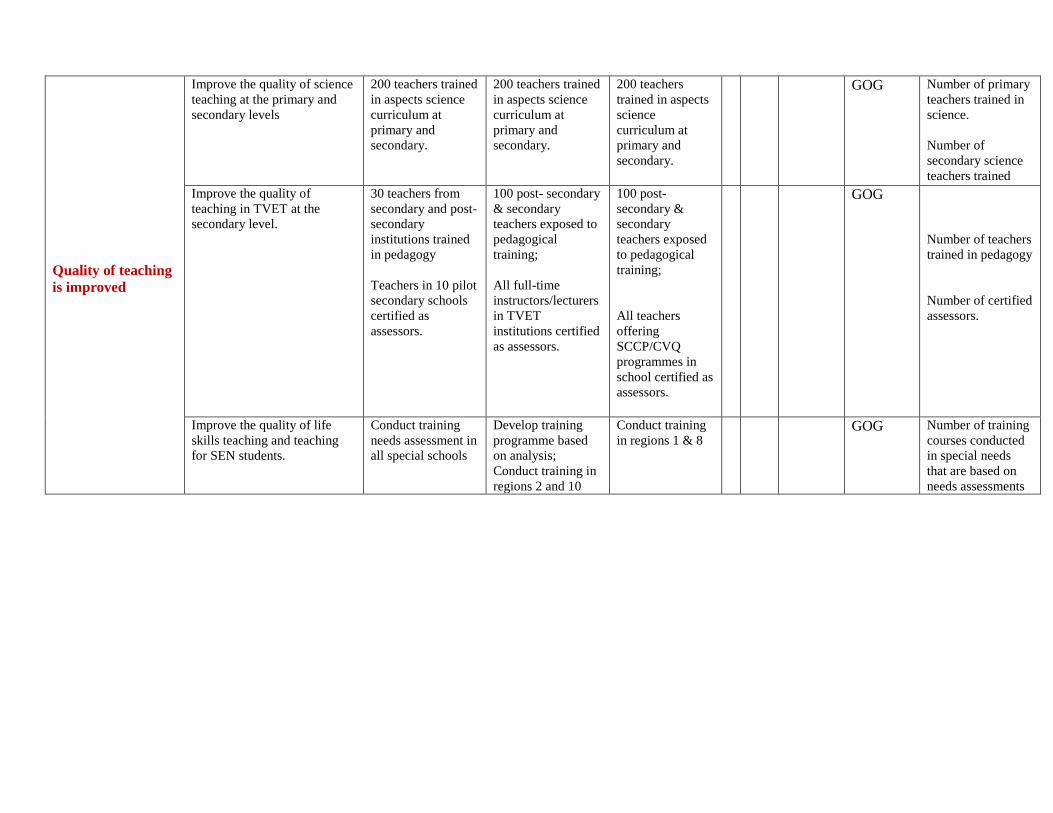
Quality of teaching
is improved
Improve the quality of science
teaching at the primary and
secondary levels
200 teachers trained
in aspects science
curriculum at
primary and
secondary.
200 teachers trained
in aspects science
curriculum at
primary and
secondary.
200 teachers
trained in aspects
science
curriculum at
primary and
secondary.
GOG Number of primary
teachers trained in
science.
Number of
secondary science
teachers trained
Improve the quality of
teaching in TVET at the
secondary level.
30 teachers from
secondary and post-
secondary
institutions trained
in pedagogy
Teachers in 10 pilot
secondary schools
certified as
assessors.
100 post- secondary
& secondary
teachers exposed to
pedagogical
training;
All full-time
instructors/lecturers
in TVET
institutions certified
as assessors.
100 post-
secondary &
secondary
teachers exposed
to pedagogical
training;
All teachers
offering
SCCP/CVQ
programmes in
school certified as
assessors.
GOG
Number of teachers
trained in pedagogy
Number of certified
assessors.
Improve the quality of life
skills teaching and teaching
for SEN students.
Conduct training
needs assessment in
all special schools
Develop training
programme based
on analysis;
Conduct training in
regions 2 and 10
Conduct training
in regions 1 & 8 GOG Number of training
courses conducted
in special needs
that are based on
needs assessments
The Program Objective Activities in Support of Objective Outputs4 Unit
cost
(US$
)
Total
Cost
(US$)
Source
of
Funding
Output Indicator
Year 1
2014
Year 2
2015
Year 3
2016
T
o
t
a
l
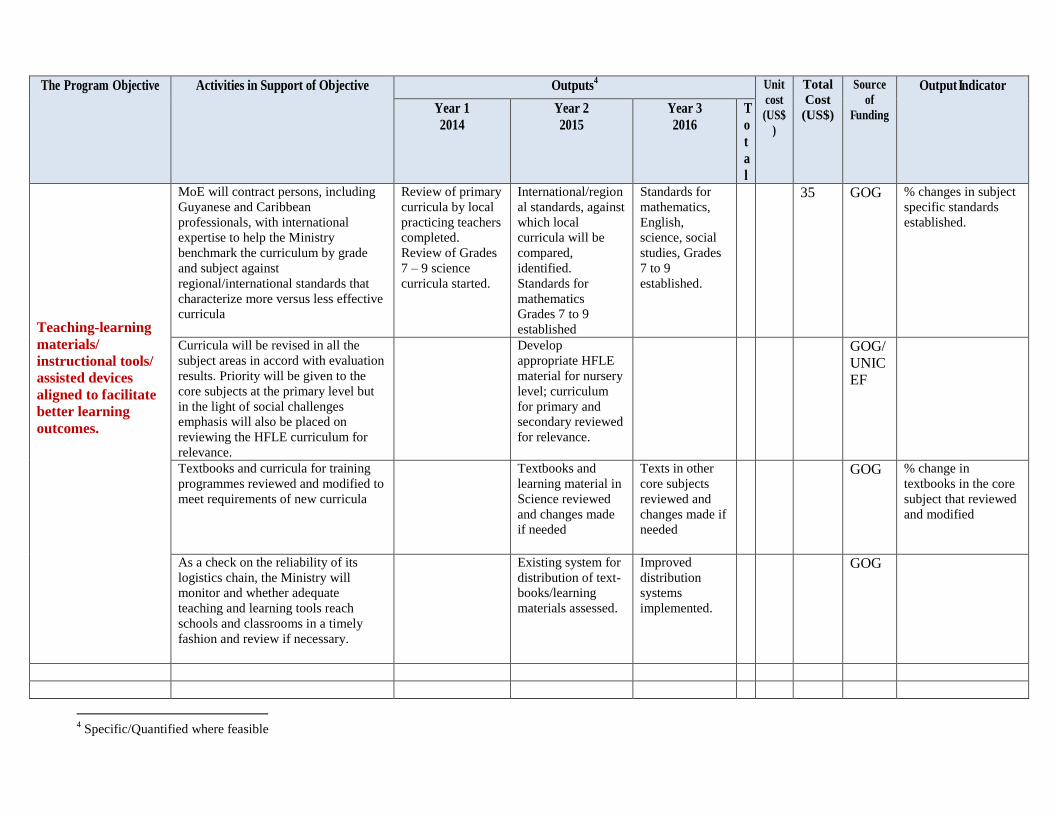
Teaching-learning
materials/
instructional tools/
assisted devices
aligned to facilitate
better learning
outcomes.
MoE will contract persons, including
Guyanese and Caribbean
professionals, with international
expertise to help the Ministry
benchmark the curriculum by grade
and subject against
regional/international standards that
characterize more versus less effective
curricula
Review of primary
curricula by local
practicing teachers
completed.
Review of Grades
7 – 9 science
curricula started.
International/region
al standards, against
which local
curricula will be
compared,
identified.
Standards for
mathematics
Grades 7 to 9
established
Standards for
mathematics,
English,
science, social
studies, Grades
7 to 9
established.
35 GOG % changes in subject
specific standards
established.
Curricula will be revised in all the
subject areas in accord with evaluation
results. Priority will be given to the
core subjects at the primary level but
in the light of social challenges
emphasis will also be placed on
reviewing the HFLE curriculum for
relevance.
Develop
appropriate HFLE
material for nursery
level; curriculum
for primary and
secondary reviewed
for relevance.
GOG/
UNIC
EF
Textbooks and curricula for training
programmes reviewed and modified to
meet requirements of new curricula
Textbooks and
learning material in
Science reviewed
and changes made
if needed
Texts in other
core subjects
reviewed and
changes made if
needed
GOG % change in
textbooks in the core
subject that reviewed
and modified
As a check on the reliability of its
logistics chain, the Ministry will
monitor and whether adequate
teaching and learning tools reach
schools and classrooms in a timely
fashion and review if necessary.
Existing system for
distribution of text-
books/learning
materials assessed.
Improved
distribution
systems
implemented.
GOG
4 Specific/Quantified where feasible
The Program Objective Activities in Support of Objective Outputs5 Uni
t
cost
(US
$)
Total
Cost
(US$
)
Source
of
Fundin
g
Output Indicator
Year 1
2014
Year 2
2015
Year 3 2016 T
o
t
a
l
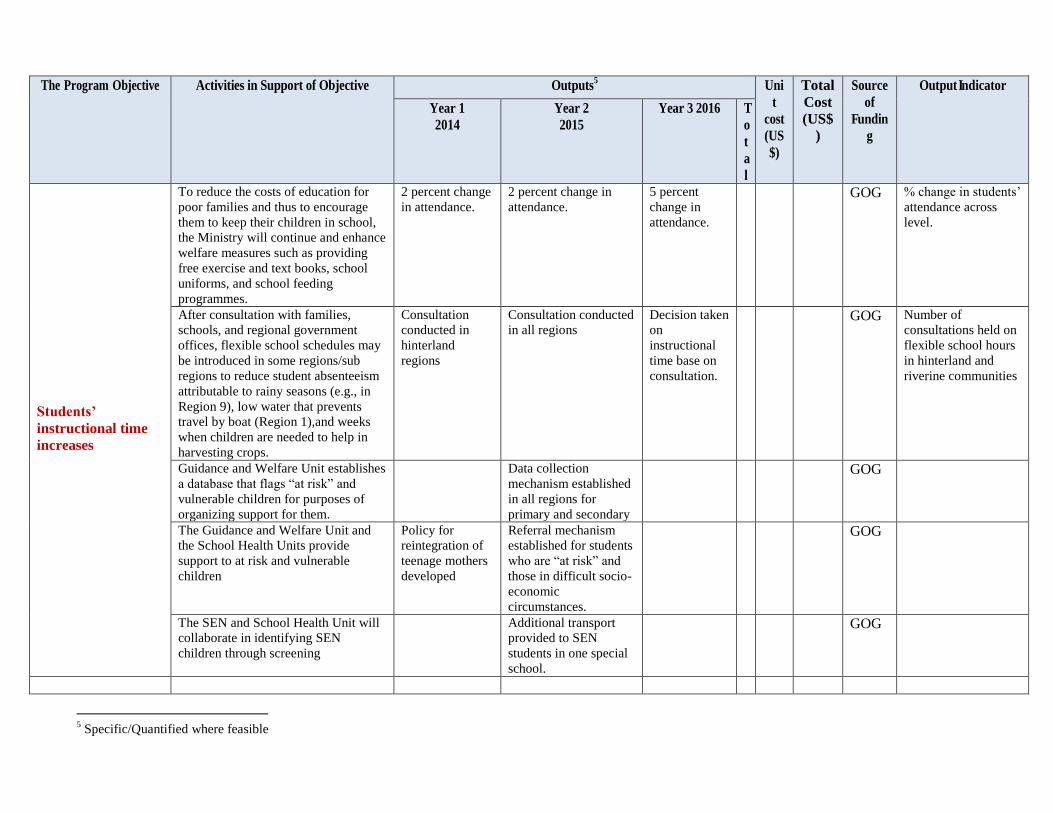
Students’
instructional time
increases
To reduce the costs of education for
poor families and thus to encourage
them to keep their children in school,
the Ministry will continue and enhance
welfare measures such as providing
free exercise and text books, school
uniforms, and school feeding
programmes.
2 percent change
in attendance. 2 percent change in
attendance. 5 percent
change in
attendance.
GOG % change in students’
attendance across
level.
After consultation with families,
schools, and regional government
offices, flexible school schedules may
be introduced in some regions/sub
regions to reduce student absenteeism
attributable to rainy seasons (e.g., in
Region 9), low water that prevents
travel by boat (Region 1),and weeks
when children are needed to help in
harvesting crops.
Consultation
conducted in
hinterland
regions
Consultation conducted
in all regions Decision taken
on
instructional
time base on
consultation.
GOG Number of
consultations held on
flexible school hours
in hinterland and
riverine communities
Guidance and Welfare Unit establishes
a database that flags “at risk” and
vulnerable children for purposes of
organizing support for them.
Data collection
mechanism established
in all regions for
primary and secondary
GOG
The Guidance and Welfare Unit and
the School Health Units provide
support to at risk and vulnerable
children
Policy for
reintegration of
teenage mothers
developed
Referral mechanism
established for students
who are “at risk” and
those in difficult socio-
economic
circumstances.
GOG
The SEN and School Health Unit will
collaborate in identifying SEN
children through screening
Additional transport
provided to SEN
students in one special
school.
GOG
5 Specific/Quantified where feasible


Institutional Arrangement for Implementation
The design and implementation responsibility for each initiative pursued under the ESP has to be assigned by designating those departments primarily
and secondarily responsible for each. Table VI.1 defines these responsibilities and is based on consultations with the various central and regional
departments.
Table VI.1. Lead and support agencies for each intervention Initiative Lead department Support departments
Monitoring the results framework for the ESP, including progress
towards its primary goals
Planning Unit Office of the PS, DCEOs (A) and (D)
Organizational audit External organizational audit team , Personnel
Division and MoE Planning Department
NCERD, DCEO(A)
Build capacities for departments selected via organizational audit
for capacity building.
External organizational audit team, PS,
Personnel Division
DCEO(A),
Align learning assessments and examinations with revised
curricula
NCERD Examination Unit, Office of the CEO, ACEO (P) and (S)
Develop alternative methods of assessment for students who have
particular disabilities.
NCERD (SEN) CEO, ACEOs, DCEO, Region Education Office(s)
Based on item analyses of the results of student assessments that
identify areas of student weaknesses, use these analyses to
prepare teaching training materials and special teacher in-service
training sessions to help teachers address these weaknesses.
NCERD
Region Education Office(s), relevant ACEOs
Extend Guyana’s participation in regional CSEC to participation
in one of the international learning assessments such as PISA.
NCERD, Examination Division, ACEO (S) DCEO(A)/CEO, CPCE, UG
Increase the percent of schools with fully constituted and
functioning PTAs.
Office of the PTA Unit DCEO(A), Depts of Education
Develop capacities of PTAs to monitor observable aspects of the
schools and to use school report card data to improve teacher
attendance and student attendance.
PTA Coordinating Unit, ACEO (N,P,S,) Region Education Office(s), CEO/DCEO (A) Building Engineer
To prepare schools to assume more autonomy and responsibility
for certain process decisions, help schools and PTAs construct
school improvement plans (SIPs). Consider rewarding schools
with good SIPs with a grant that they can spend on any activity in
their approved SIP.
Office of the CEO, DCEO (A), PTA Unit Region Education Office(s), SIACs

Initiative Lead department Support departments
Put school report cards and national report cards in place.
Establish a MoE strategic communication program to sensitize
public to important education issues, explain and promote MoE
positions, and build collaborations with stakeholders.
Office of the CEO, PRO DCEO (D) and (A), Region Education Office(s),
Communication Specialist
Office of the PS, NCERD
Use the PTA Coordinating Unit as a means through which the
concerns of PTAs can be brought to the attention of senior
education officials.
PTA Coordinating Unit Region Education Office(s), DCEO (A), Welfare Unit.
MoE reviews and, as needed, revises quality standards for
engineering audit of school facilities
Buildings Unit, Office of the PS Departments of Education and Regional Public Works
Section
An engineering audit of all school facilities is completed, and the
schedule for bringing sub-standard schools up to standard is in
place.
Buildings Department Departments of Education, Public Works Section.
Regional departments submit annual budget requests and annual
targets for upgrading sub-standard facilities to standard.
PS Office, Buildings Department, Departments of
Education
Regional Executive Officers.; Regional Education
Officers
Regions will be assisted to develop preventive maintenance plans
for schools.
PS Office, Buildings Department, Departments of
Education
Regional Executive Officers. Regional Education
Officers
Additional places at secondary and nursery will be created. PS Office, Buildings Department, Departments of
Education
Departments of Education and Regional Public Works
Section, ACEOs
Improve the quality of teaching through continuous initial teacher
training of a cadre of teachers across levels each year.
CPCE and UG Region Education Office(s)
Establish MoE’s subject matter and pedagogic standards and
measures of these standards to determine who enters teacher
training and who is hired into teaching.
NCERD, CPCE, CEO, DCEO(D) DCEO (A)
To off-set shortages of qualified teachers in particular subjects,
prepare lessons in various subjects, but especially in science and
mathematics, that are beamed directly to students in classrooms
through the Broadcast to Schools programme, the education TV
channel, DVDs, or the internet.
NCERD CEO, DCEO Region Education Officer(s)
MoE sets targets for increasing number and subject specialization
of teachers in remote hinterland and riverine schools and expands
incentives to meet targets.
CEO, DCEO (A) and Office of the Minister Region Education Office(s)
Prepare sample lesson plans and other instructional material for
teachers, in particular at nursery and primary levels, together with
guides on how to use these resources so that teachers are better
prepared to utilize the instructional period more effectively.
NCERD ACEOs.

Initiative Lead department Support departments
Design a post graduate programme to train head teachers, establish
criteria for competitively selecting applicants into the programme,
and establish criteria for competitively selecting graduates into
vacant head teacher posts.
CPCE, UG, MOE Senior Policy Team NCERD
Systematize and significantly upgrade the quality of continuous
professional development of teachers.
NCERD Region Education Officers.
Improve quality of mathematics teaching at all levels NCERD, ACEO(S) & (P) CPCE
Improve the quality of literacy teaching at all levels NCERD, ACEO (N, P, & S) CPCE
Improve the quality of science teaching at the primary and secondary
levels
NCERD, ACEO(P & S) CPCE
Improve the quality of teaching in TVET at the secondary level. NCERD, ACEO(S) SSCP unit CPCE ACEO (T)
Improve the quality of life skills teaching and teaching for SEN
students
NCERD (SEN) CPCE
Benchmark the curriculum by grade and subject against international
standards that characterize more versus less effective curricula:
content standards, performance expectations for students, coherence,
and efficiency.
External Consultants, NCERD (Curriculum Unit and
Measurement & Evaluation Unit)
CEO/DCEO (A & D), ACEOs
Revise curricula for relevant grades, starting with primary level, and
subjects in accordance with evaluation results.
External Consultant, NCERD (Curriculum Unit and
Measurement & Evaluation Unit)
ACEO (N, P & S)
As an integral part of the curricula reform, the Ministry will ensure
that curricula are adapted for children with Special education needs.
NCERD CEO
Textbooks and curricula of training programmes reviewed and
modified to meet the requirements of the revised curricula.
External Consultant, NCERD (Curriculum Unit and
Measurement & Evaluation Unit)
ACEO (N, P & S)
As a check on the reliability of the logistics chain, audit whether
teaching and learning tools reach schools and classrooms in timely
fashion.
Book Distribution Unit, Office of the PS and NCERD. Regional Education Offices, ACEO (P), (N)
and (S)
Continue the provision of support to reduce the costs of education to
families, especially poor families.
Welfare Unit, Office of the PS DPS (G) an d Finance Department, Region
Education Offices
Flexibly re-arrange school schedule to circumvent adverse weather
and weeks when parents need students in the fields.
Office of the CEO/ ACEO (N, P & S) Region Education Offices
Establish a database that flags “at risk” and vulnerable children for
purposes of organizing support for them.
Welfare and Guidance Unit ACEO (N, P & S), Region Education Offices
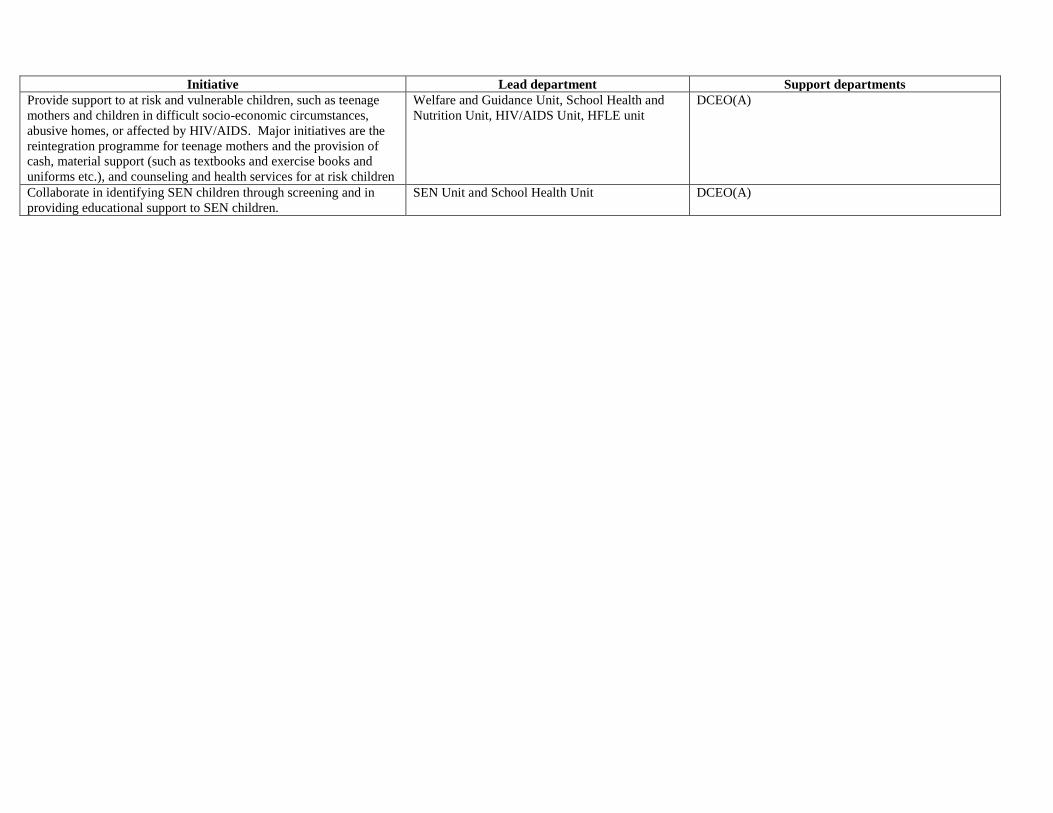
Initiative Lead department Support departments
Provide support to at risk and vulnerable children, such as teenage
mothers and children in difficult socio-economic circumstances,
abusive homes, or affected by HIV/AIDS. Major initiatives are the
reintegration programme for teenage mothers and the provision of
cash, material support (such as textbooks and exercise books and
uniforms etc.), and counseling and health services for at risk children
Welfare and Guidance Unit, School Health and
Nutrition Unit, HIV/AIDS Unit, HFLE unit
DCEO(A)
Collaborate in identifying SEN children through screening and in
providing educational support to SEN children.
SEN Unit and School Health Unit DCEO(A)
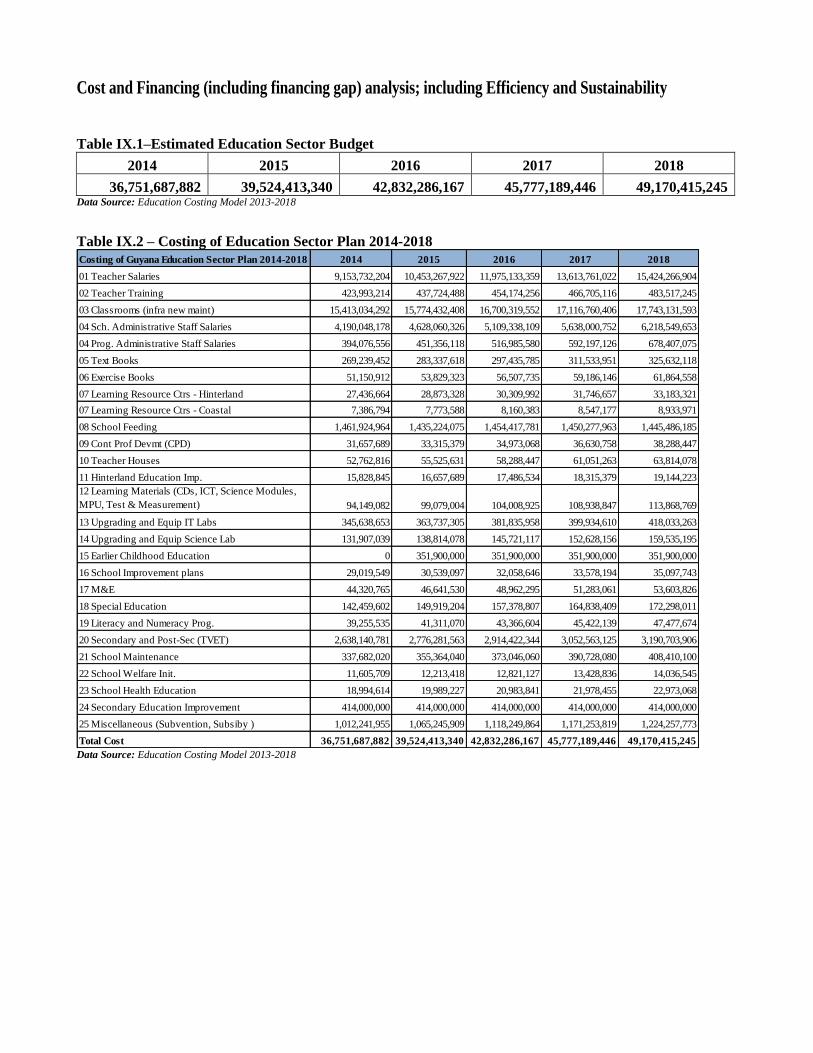
Cost and Financing (including financing gap) analysis; including Efficiency and Sustainability
Table IX.1–Estimated Education Sector Budget
2014 2015 2016 2017 2018
36,751,687,882 39,524,413,340 42,832,286,167 45,777,189,446 49,170,415,245 Data Source: Education Costing Model 2013-2018
Table IX.2 – Costing of Education Sector Plan 2014-2018
Data Source: Education Costing Model 2013-2018
Costing of Guyana Education Sector Plan 2014-2018 2014 2015 2016 2017 2018
01 Teacher Salaries 9,153,732,204 10,453,267,922 11,975,133,359 13,613,761,022 15,424,266,904
02 Teacher Training 423,993,214 437,724,488 454,174,256 466,705,116 483,517,245
03 Classrooms (infra new maint) 15,413,034,292 15,774,432,408 16,700,319,552 17,116,760,406 17,743,131,593
04 Sch. Administrative Staff Salaries 4,190,048,178 4,628,060,326 5,109,338,109 5,638,000,752 6,218,549,653
04 Prog. Administrative Staff Salaries 394,076,556 451,356,118 516,985,580 592,197,126 678,407,075
05 Text Books 269,239,452 283,337,618 297,435,785 311,533,951 325,632,118
06 Exercise Books 51,150,912 53,829,323 56,507,735 59,186,146 61,864,558
07 Learning Resource Ctrs - Hinterland 27,436,664 28,873,328 30,309,992 31,746,657 33,183,321
07 Learning Resource Ctrs - Coastal 7,386,794 7,773,588 8,160,383 8,547,177 8,933,971
08 School Feeding 1,461,924,964 1,435,224,075 1,454,417,781 1,450,277,963 1,445,486,185
09 Cont Prof Devmt (CPD) 31,657,689 33,315,379 34,973,068 36,630,758 38,288,447
10 Teacher Houses 52,762,816 55,525,631 58,288,447 61,051,263 63,814,078
11 Hinterland Education Imp. 15,828,845 16,657,689 17,486,534 18,315,379 19,144,223
12 Learning Materials (CDs, ICT, Science Modules,
MPU, Test & Measurement) 94,149,082 99,079,004 104,008,925 108,938,847 113,868,769
13 Upgrading and Equip IT Labs 345,638,653 363,737,305 381,835,958 399,934,610 418,033,263
14 Upgrading and Equip Science Lab 131,907,039 138,814,078 145,721,117 152,628,156 159,535,195
15 Earlier Childhood Education 0 351,900,000 351,900,000 351,900,000 351,900,000
16 School Improvement plans 29,019,549 30,539,097 32,058,646 33,578,194 35,097,743
17 M&E 44,320,765 46,641,530 48,962,295 51,283,061 53,603,826
18 Special Education 142,459,602 149,919,204 157,378,807 164,838,409 172,298,011
19 Literacy and Numeracy Prog. 39,255,535 41,311,070 43,366,604 45,422,139 47,477,674
20 Secondary and Post-Sec (TVET) 2,638,140,781 2,776,281,563 2,914,422,344 3,052,563,125 3,190,703,906
21 School Maintenance 337,682,020 355,364,040 373,046,060 390,728,080 408,410,100
22 School Welfare Init. 11,605,709 12,213,418 12,821,127 13,428,836 14,036,545
23 School Health Education 18,994,614 19,989,227 20,983,841 21,978,455 22,973,068
24 Secondary Education Improvement 414,000,000 414,000,000 414,000,000 414,000,000 414,000,000
25 Miscellaneous (Subvention, Subsiby ) 1,012,241,955 1,065,245,909 1,118,249,864 1,171,253,819 1,224,257,773
Total Cost 36,751,687,882 39,524,413,340 42,832,286,167 45,777,189,446 49,170,415,245
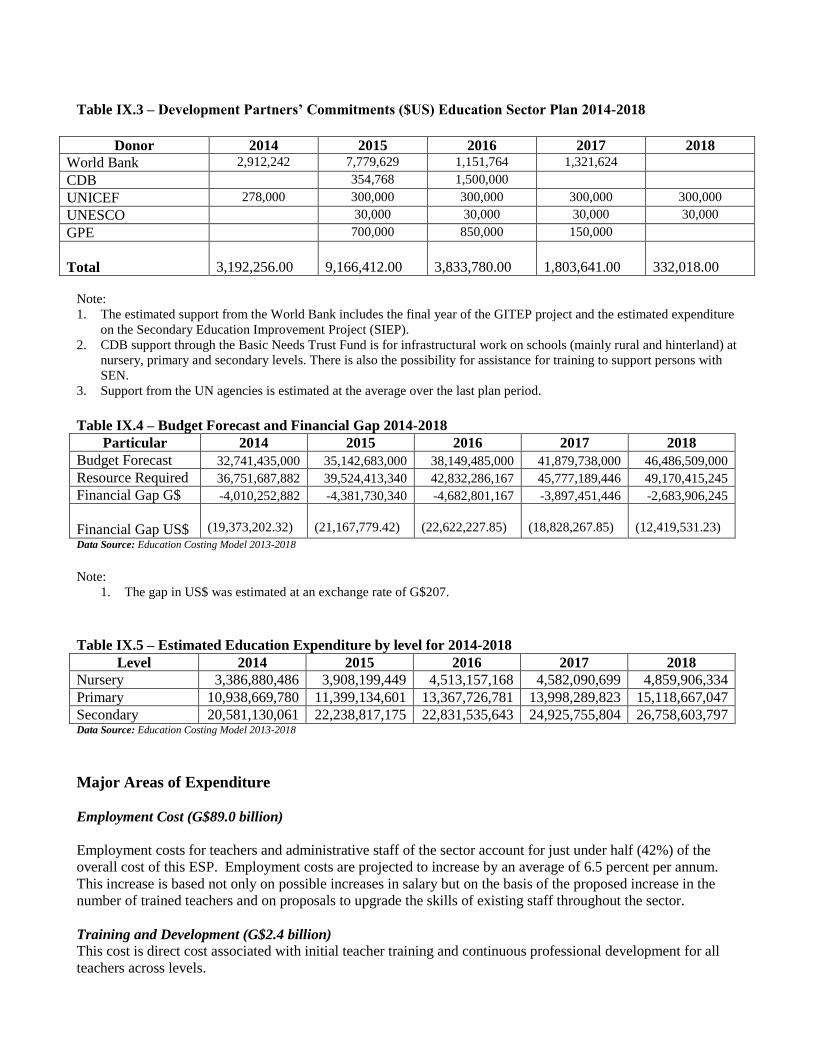
Table IX.3 – Development Partners’ Commitments ($US) Education Sector Plan 2014-2018
Donor 2014 2015 2016 2017 2018
World Bank 2,912,242 7,779,629 1,151,764 1,321,624
CDB 354,768 1,500,000
UNICEF 278,000 300,000 300,000 300,000 300,000
UNESCO 30,000 30,000 30,000 30,000
GPE 700,000 850,000 150,000
Total
3,192,256.00
9,166,412.00
3,833,780.00
1,803,641.00
332,018.00
Note:
1. The estimated support from the World Bank includes the final year of the GITEP project and the estimated expenditure
on the Secondary Education Improvement Project (SIEP).
2. CDB support through the Basic Needs Trust Fund is for infrastructural work on schools (mainly rural and hinterland) at
nursery, primary and secondary levels. There is also the possibility for assistance for training to support persons with
SEN.
3. Support from the UN agencies is estimated at the average over the last plan period.
Table IX.4 – Budget Forecast and Financial Gap 2014-2018
Particular 2014 2015 2016 2017 2018
Budget Forecast 32,741,435,000 35,142,683,000 38,149,485,000 41,879,738,000 46,486,509,000
Resource Required 36,751,687,882 39,524,413,340 42,832,286,167 45,777,189,446 49,170,415,245
Financial Gap G$ -4,010,252,882 -4,381,730,340 -4,682,801,167 -3,897,451,446 -2,683,906,245
Financial Gap US$
(19,373,202.32)
(21,167,779.42)
(22,622,227.85)
(18,828,267.85)
(12,419,531.23)
Data Source: Education Costing Model 2013-2018
Note:
1. The gap in US$ was estimated at an exchange rate of G$207.
Table IX.5 – Estimated Education Expenditure by level for 2014-2018
Level 2014 2015 2016 2017 2018
Nursery 3,386,880,486 3,908,199,449 4,513,157,168 4,582,090,699 4,859,906,334
Primary 10,938,669,780 11,399,134,601 13,367,726,781 13,998,289,823 15,118,667,047
Secondary 20,581,130,061 22,238,817,175 22,831,535,643 24,925,755,804 26,758,603,797 Data Source: Education Costing Model 2013-2018
Major Areas of Expenditure
Employment Cost (G$89.0 billion)
Employment costs for teachers and administrative staff of the sector account for just under half (42%) of the
overall cost of this ESP. Employment costs are projected to increase by an average of 6.5 percent per annum.
This increase is based not only on possible increases in salary but on the basis of the proposed increase in the
number of trained teachers and on proposals to upgrade the skills of existing staff throughout the sector.
Training and Development (G$2.4 billion)
This cost is direct cost associated with initial teacher training and continuous professional development for all
teachers across levels.

Construction/rehabilitation of education buildings (G$83.0 billion)
The major expense under this item is associated with construction/rehabilitation of schools and teachers houses
almost one third of this cost will be committed to rehabilitation/maintenance of schools, reinforcing the
Ministry’s commitment to its maintenance plan of maintaining 20% of hinterland schools and 15% of coastal
schools per annum.
School Feeding (G$7 billion)
This continues funding of the community-based hot meal programme in the hinterland regions started under the
EFA-FTI programme and the national snack programmes which cover all other nursery school students and
Grades 1 and 2 students at the primary level.
Equipment and Learning Materials (G$5.1billion)
The emphasis is on improving the teaching-learning process, through the provision of textbooks, expanding the
integration of ICT, promoting Inquiry Based Science Education (IBSE); the distribution of literacy tool kits into
schools etc.
Funding of the Plan
The Ministry of Education feels that this plan is financially feasible based on the budgetary trend for education
in Guyana over the last five years. As seen in Table 1.2 in Part 1 of this document the budgetary allocation to
education was maintained at 15 percent of the national budget and approximately 5 percent of GDP. The
budgetary allocation to education from national funds is estimated to increase by approximately 2 percent
annually. This is shown in Table IX.4. This data when compared with estimated cost of the plan does show
funding gaps and the need for support by Development partners. It is felt that the emphasis on quality and
improving student outcomes is being supported by many of these partners so there is an expectation that the plan
will garner some support.
Monitoring and Evaluation Arrangements
Organisation of Monitoring and Evaluation in the sector
The Planning Unit of the Ministry of Education would be responsible for overseeing monitoring and evaluation,
of the implementation and results of the sector’s strategic plan. The unit will be supported by an M&E
committee that will review progress. This committee will be convened by the Minister of Education/Permanent
Secretary and will be comprised of the Chief Education Officer, Deputy Chief Education Officers and Other
Senior Education Officials. On a national level, the National Advisory Committee that will be revitalized by
way of the Education Act will be another committee to which progress reports are made.
Routine Monitoring: This will vary with the particular activity or programme and according to the schedule in
the specific action plan, but there will be at least two reporting sessions per year.
Annual reviews: The annual review will consolidate information from the biannual reporting sessions. This
information will be used to identify critical initiatives that need to be undertaken in the next year and to make
decisions about changing the implementation of activities and initiatives.
Mid-term reviews: This will occur midway in the plan period. It will allow the Ministry to assess the
likelihood of achieving some of the strategic objectives and, as necessary, modify the designs of interventions,
their implementation arrangements, or their objectives.

Risks and Mitigation Measures
Any five year plan in any sector and in any country is potentially vulnerable to events beyond the sector’s
control. These include:
Political instability in the country.
Changes in the Government priorities on which the plan depends. These can occur when the party in
power changes or under the same party.
Economic disruptions that undermine the Government’s funding base for the plan.
Changes in donor priorities that undermine the funding of the plan.
Any of these events could happen in Guyana over the next five years, but their probabilities are judged to be
moderately low or low. The education sector has always been regarded as a major priority across the
political divide and civil society, with this Administration evidencing stable support for the sector. To
reinforce the political and civic consensus, the formulation of this plan was based on an extensive
consultative process with senior and technical officers within the sector and civil society. Initiatives of the
ESP, such as school-level and national report cards and arrangements for monitoring and evaluating the
ESP ensure that the nation and communities are kept informed of progress and problems with achieving the
ESP’s objectives. Communities will also be kept informed of the plan through their participatory roles in
devising the Regional Action Plans.
Regional and international/Donor agencies supported the 2008-2013 ESP, helping to bridge gaps that could have
negatively impacted implementation. It is hoped and expected that this level of support will continue. In an
effort to ensure sustainability, the Ministry of Education continues to strengthen its collaboration and
coordination of supportive organizations, such as the World Bank, IDB, UNICEF and the Global Partnership in
Education through the conceptualization of on-going and future programmes/project initiatives.
Human and organizational capacity constraints in some units and departments of the Ministry of Education pose
a much greater risk to the implementation of the ESP and to the achievement of its objectives. This risk is rated
moderately high to substantial. This risk is exacerbated by problems with retaining good performers within the
MoE.
The Ministry of Education recognizes these risk factors and is undertaking several mitigation measures. The
organizational audit, a first activity to be conducted under the new ESP, will assess whether units that have
responsibilities for implementing aspects of the ESP have the individual and organizational resources and
incentives to deliver on these responsibilities effectively. The audit will focus on the MoE’s central and regional
departments, but might also include a sample of PTAs and schools. The framework for the audit will be
organized around the three factors that seem to determine organizational performance: human capacity,
organizational characteristics, and the formal and informal incentives that shape individuals’ choices.
The audit for each unit will identify capacity building needs for that unit that can include human capital
shortfalls, relative to responsibilities; organizational problems that need to be resolved, or perverse incentives
that need to be addressed. For example, the auditors may find that improving the incentives, such as
remuneration packages, is the only way to reduce the loss of good performers from key units.
Given the audit results and ESP priorities, the auditors will recommend where the MoE should focus its capacity
building. The auditors will also recommend to the MoE whether to delay the implementation of an intervention
pending better capacities of the implementing units. If an intervention cannot be well-designed and capably
implemented, it is better either to delay its implementation, pending the development of the key unit’s
capacities, or to include it in the next ESP. A poorly designed or implemented intervention wastes money,

damages the credibility of the implementers, and distracts them from focusing on interventions that they can
implement well.
Another risk, which is rated substantial, is the complexity of this ESP. The 2014-2018 ESP takes a systems
perspective in terms of improving students’ learning outcomes, addressing the conditions that international
experience and research find to be necessary and sufficient for increasing student learning. However, these
conditions cumulate to a complex agenda, no matter how capable the implementing units of the Ministry are.
The initiatives intended to realize these conditions may combine to overwhelm certain units within the MoE,
regardless of that unit’s capacities relative to normal loads.
To mitigate this very real risk, the MoE will not pursue the ESP mechanically. It will sequence tasks on the
basis of the recommendations of the organizational auditors and so as to even out the loads on individual units
as much as possible. It may add consultants to provide temporary help for regular staff of a unit. Wherever
appropriate, it will use pilots to help implementing units “ease into” implementing initiatives. It may even defer
the implementation of initiatives until the ESP of 2019-2023.
Process of Preparing the Action Plan
The action plan was derived from consultations with Senior Technical Officers within the Ministry of education, who collaborated with the
regional administration on identifying the areas of focus for the next five years. These key areas were presented to a senior policy group
within the Ministry that ratified the areas, as consistent with the focus of the sector. Following these sessions, the technical officers developed
their action plans, which were reviewed by the Planning Unit to ensure that all areas of focus are linked to the Sector Plan immediate
outcomes/strategic objectives.