Embed Size (px)
Citation preview
CardiorespiratoryFitness in Children andAdolescentsAssessment, ReferenceStandards and Associationswith Metabolic Risk andPhysical Activity
Gustavo Marçal Gonçalves da SilvaPorto, 2012
Gustavo M
arçal Gonçalves da Silva
Cardiorespiratory Fitness in C
hildren and Adolescents
Cardiorespiratory Fitness in Children and Adolescents
Assessment, Reference Standards and Associations with Metabolic
Risk and Physical Activity
Gustavo Marçal Gonçalves da Silva
Porto, 2012

Cardiorespiratory Fitness in Children and Adolescents
Assessment, Reference Standards and Associations with Metabolic
Risk and Physical Activity
Gustavo Marçal Gonçalves da Silva
Academic dissertation submitted pursuing
the PhD degree under the Doctoral Course in
Physical Activity and Health, organized by
the Research Centre in Physical Activity,
Health and Leisure (CIAFEL), from the
Faculty of Sport – University of Porto,
according to the Decree-Law 74 / 2006 of
March 24th.
Dissertação académica apresentada com
vista à obtenção do grau de Doutor no
âmbito do Curso de Doutoramento em
Atividade Física e Saúde, organizado pelo
Centro de Investigação em Actividade Física,
Saúde e Lazer (CIAFEL) da Faculdade de
Desporto da Universidade do Porto, nos
termos do Decreto-lei 74/2006 de 24 de
Março.
Supervisors:
José Oliveira, PhD
José Carlos Ribeiro, PhD
Porto, 2012

Silva, G. (2012). Cardiorespiratory Fitness in Children and Adolescents –
Assessment, Reference Standards and Associations with Metabolic Risk and
Physical Activity. Porto: G. Silva. Dissertação de Doutoramento em Atividade
Física e Saúde apresentada à Faculdade do Desporto da Universidade do Porto.
Keywords: AEROBIC ENDURANCE, CARDIOVASCULAR RISK FACTORS,
METABOLIC SYNDROME, PHYSICAL ACTIVITY, YOUTHS.
Founding Sources
The candidate was supported by the Foundation for Science and Technology
(FCT) with the PhD grant reference SFRH/BD/45090/2008. The data collection
was also supported by FCT with the research project reference
PTDC/DES/72424/2006 (FCOMP-01-0124-FEDER-007183).
This research was carried out in the Research Centre in Physical Activity, Health
and Leisure (CIAFEL), research unit supported by FCT, under the net of R&D Units.


“Where is the Life we have lost in living? Where is the
wisdom we have lost in knowledge? !Where is the
knowledge we have lost in information?”
– T.S. Eliot, Choruses from “The Rock”


This work is dedicated to my parents, Carlos Alberto
and Tânia, and to my partner Luísa. Having you as
references and inspiration in my life is a blessing.
Thank you for pushing me on the right track …


XI
ACKNOWLEDGMENTS
Although a doctorate thesis is a one-author essay, the journey and research involved
certainly compromise the assistance and commitment of many colleagues and friends.
Therefore, I would like to acknowledge some of the people that made a decisive
contribution so that this thesis could get into an end.
To Professor José Carlos Ribeiro, my supervisor, which made a huge contribution to my
personal and academic development. I still remember the phone conversation that we
had back in the beginning of September 2007, which sealed our interest of working
together. I am really thankful for that first year in Portugal as research fellow, which gave
me the opportunity to settle and adapt, to learn and contribute with ongoing projects at
that time. I should express all my gratitude and respect, for the opportunities and
knowledge that you shared with me.
To Professor José Oliveira, my co-supervisor, my great friend and professor, I should
express my gratitude for all the great learning and for the lessons of dedication,
hardworking, humanity and companionship. I am proud of having you as a supervisor and
as a friend. Without you nothing of this would be possible.
To Professor Jorge Mota, a great contributor of this work, I am thankful for your support
all over these years, for your constant encouragement, care and awareness, and for
making things easier when most of us thought it would be harder. Please, have all my
respect and gratitude.
To Professor Lars Bo Andersen, who encourage and inspired this final and crucial year of
this work. Thank you for having me in Odense. I am grateful for your contribution. I have
been learning a lot with you, both personally and professionally. Thank you for sharing
with me your views of Science and your understanding of the “business”. Certainly, those
are new references for me.
To Professor Adroaldo Gaya, my previous supervisor, my dear and long time friend, I am
grateful for everything that I learned from you. The passion you have for your job will
always be a reference to me. This achievement is also dedicated to you.
To Professor Jorge Bento, director of our Faculty, who I am personally grateful for the
warm reception and for all the kindness that he always dedicated to me during these
years in Porto.

XII
To Professors José Alberto Duarte, Maria Paula Santos and Maria Joana Carvalho, I am
thankful for your friendship and constant support.
To my friends and colleagues from the Research Centre in Physical Activity, Health and
Leisure, especially to Anelise, Clarice, Nórton, Andreia, Mere and Susana, who I am
grateful for all the help and contribution during collection and acquisition of data. To
Nórton, Alberto, Elisa, Fernando, Daniel and Hélder, thank you all for your friendship,
great discussions and companionship.
To teachers and students from the Secondary School of Valongo, thank you for taking
part in this study.
To the Faculty of Sport from the University of Porto, I am grateful for making this research
possible.
To the Centre of Research in Childhood Health, from the University of Southern Denmark,
especially to Professor Karsten Froberg, Mathias Ried-Larsen and Jan Brønd, I am
thankful for the hospitality and the great discussions.
To Lars, Birgitte, Mauro, Simone, Gabriel and Rafaela, I must say that I will always have in
my good memories that autumn that we spend together in Denmark. Having a familiar
environment during that challenging time was wonderful. Thank you very much for your
kindness, hospitality and support.
To my friends and colleagues back in Brazil, Ricardo Petersen, Antonio Carlos Guimarães
(in memorian), Álvaro Oliveira, Marcelo Silva, Marcelo Cardoso, Lisiane Torres, Alexandre
Marques, Alexandre Lazzarotto, Daniel Garlipp, Thiago Lorenzi, Gabriel Bergmann, Eraldo
Pinheiro, Orlando Laitano e others, during this long academic walk, all of you were
important, in your own way. I am grateful for your friendship.
To my family, Carlos Alberto, Tânia, Gabriela, Giovani, Vanilda and Joaquina (in
memorian), thank you for accepting my absence during the good and difficult moments in
the past years. I am grateful for your love and unconditional support. You will always be
my “home sweet home”. Your values and principles will always be with me.
To Luísa, my colleague, my friend and my love, thank you for sharing your life with me.
This work is also yours in so many ways. I could not make it without you. Daily, you have
been my inspiration, my passion and my strength.
XIII
CONTENTS
ACKNOWLEDGMENTS .................................................................................................. XI!List of Tables ................................................................................................................. XV!List of Figures .............................................................................................................. XVII!ABSTRACT ................................................................................................................... XIX!RESUMO ...................................................................................................................... XXI!List of Abbreviations .................................................................................................... XXIII!
General Introduction ...................................................................... 27!
Introduction and Background ........................................................ 29!
Purposes and Structure ................................................................ 43!
Original Research .......................................................................... 45!
Study I .......................................................................................... 47!
Study II ......................................................................................... 57!
Study III ......................................................................................... 73!
Study IV ........................................................................................ 91!
Overall Discussion ....................................................................... 117!
Conclusions ................................................................................. 127!
References ................................................................................... 131!

!
XV
List of Tables
General Introduction
Introduction and Background
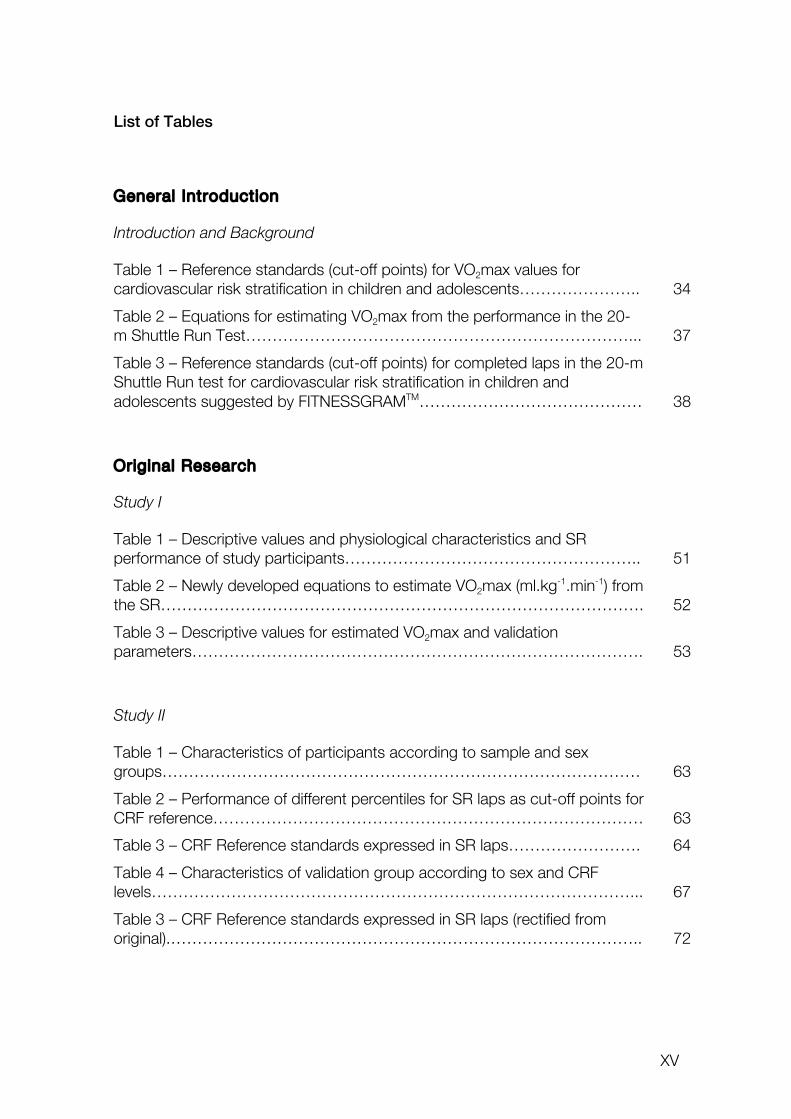
Table 1 – Reference standards (cut-off points) for VO2max values for cardiovascular risk stratification in children and adolescents………………….. 34
Table 2 – Equations for estimating VO2max from the performance in the 20-m Shuttle Run Test………………………………………………………………... 37
Table 3 – Reference standards (cut-off points) for completed laps in the 20-m Shuttle Run test for cardiovascular risk stratification in children and adolescents suggested by FITNESSGRAMTM…………………………………… 38
Original Research
Study I
Table 1 – Descriptive values and physiological characteristics and SR performance of study participants……………………………………………….. 51
Table 2 – Newly developed equations to estimate VO2max (ml.kg-1.min-1) from the SR………………………………………………………………………………. 52
Table 3 – Descriptive values for estimated VO2max and validation parameters…………………………………………………………………………. 53
Study II
Table 1 – Characteristics of participants according to sample and sex groups……………………………………………………………………………… 63
Table 2 – Performance of different percentiles for SR laps as cut-off points for CRF reference……………………………………………………………………… 63
Table 3 – CRF Reference standards expressed in SR laps……………………. 64
Table 4 – Characteristics of validation group according to sex and CRF levels………………………………………………………………………………... 67
Table 3 – CRF Reference standards expressed in SR laps (rectified from original).…………………………………………………………………………….. 72
XVI
Study III
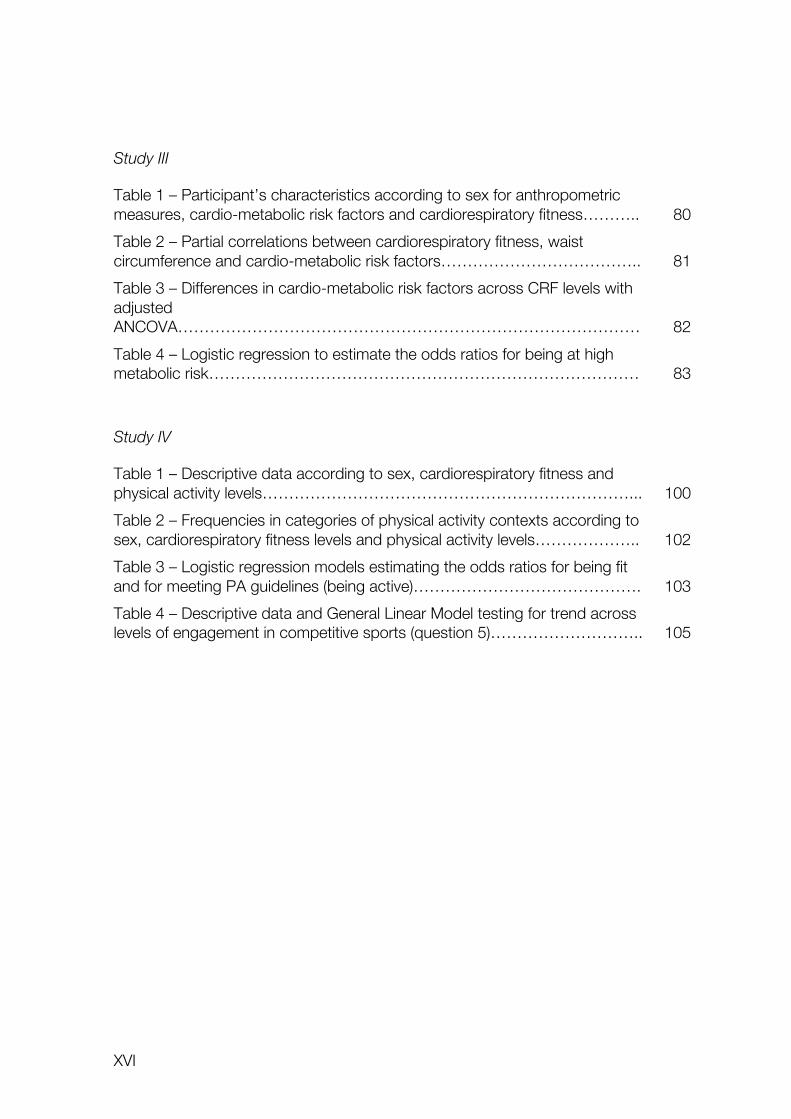
Table 1 – Participant’s characteristics according to sex for anthropometric measures, cardio-metabolic risk factors and cardiorespiratory fitness……….. 80
Table 2 – Partial correlations between cardiorespiratory fitness, waist circumference and cardio-metabolic risk factors……………………………….. 81
Table 3 – Differences in cardio-metabolic risk factors across CRF levels with adjusted ANCOVA…………………………………………………………………………… 82
Table 4 – Logistic regression to estimate the odds ratios for being at high metabolic risk……………………………………………………………………… 83
Study IV
Table 1 – Descriptive data according to sex, cardiorespiratory fitness and physical activity levels……………………………………………………………... 100
Table 2 – Frequencies in categories of physical activity contexts according to sex, cardiorespiratory fitness levels and physical activity levels……………….. 102
Table 3 – Logistic regression models estimating the odds ratios for being fit and for meeting PA guidelines (being active)……………………………………. 103
Table 4 – Descriptive data and General Linear Model testing for trend across levels of engagement in competitive sports (question 5)……………………….. 105
XVII
List of Figures
Original Research
Study I
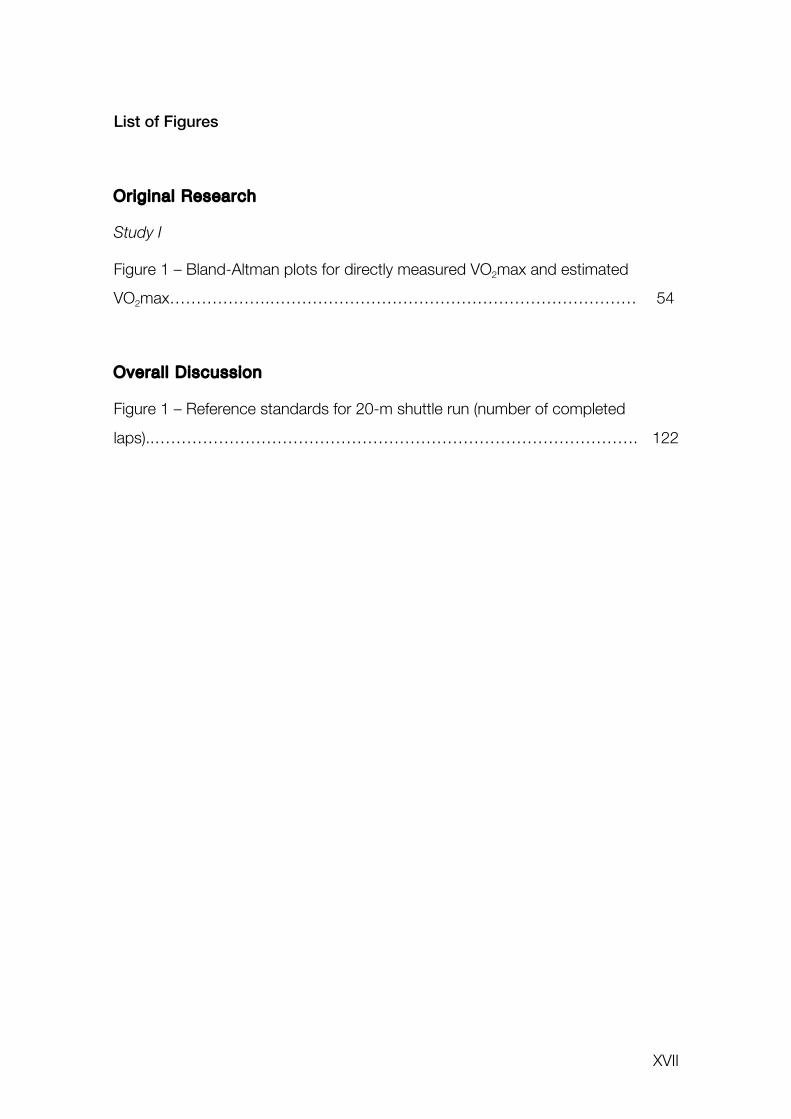
Figure 1 – Bland-Altman plots for directly measured VO2max and estimated
VO2max……………….…………………………………………………………… 54
Overal l Discussion
Figure 1 – Reference standards for 20-m shuttle run (number of completed
laps)..……………………………………………………………………………….
122

!
XIX
ABSTRACT
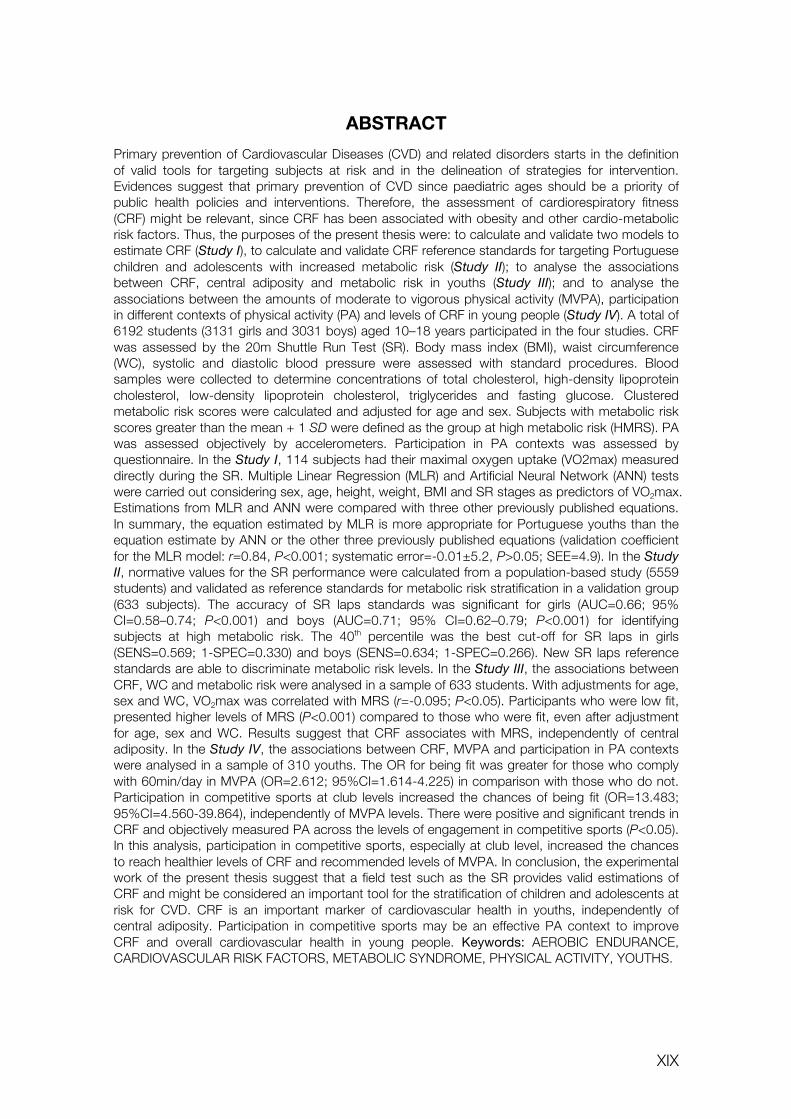
Primary prevention of Cardiovascular Diseases (CVD) and related disorders starts in the definition of valid tools for targeting subjects at risk and in the delineation of strategies for intervention. Evidences suggest that primary prevention of CVD since paediatric ages should be a priority of public health policies and interventions. Therefore, the assessment of cardiorespiratory fitness (CRF) might be relevant, since CRF has been associated with obesity and other cardio-metabolic risk factors. Thus, the purposes of the present thesis were: to calculate and validate two models to estimate CRF (Study I), to calculate and validate CRF reference standards for targeting Portuguese children and adolescents with increased metabolic risk (Study II); to analyse the associations between CRF, central adiposity and metabolic risk in youths (Study III); and to analyse the associations between the amounts of moderate to vigorous physical activity (MVPA), participation in different contexts of physical activity (PA) and levels of CRF in young people (Study IV). A total of 6192 students (3131 girls and 3031 boys) aged 10–18 years participated in the four studies. CRF was assessed by the 20m Shuttle Run Test (SR). Body mass index (BMI), waist circumference (WC), systolic and diastolic blood pressure were assessed with standard procedures. Blood samples were collected to determine concentrations of total cholesterol, high-density lipoprotein cholesterol, low-density lipoprotein cholesterol, triglycerides and fasting glucose. Clustered metabolic risk scores were calculated and adjusted for age and sex. Subjects with metabolic risk scores greater than the mean + 1 SD were defined as the group at high metabolic risk (HMRS). PA was assessed objectively by accelerometers. Participation in PA contexts was assessed by questionnaire. In the Study I, 114 subjects had their maximal oxygen uptake (VO2max) measured directly during the SR. Multiple Linear Regression (MLR) and Artificial Neural Network (ANN) tests were carried out considering sex, age, height, weight, BMI and SR stages as predictors of VO2max. Estimations from MLR and ANN were compared with three other previously published equations. In summary, the equation estimated by MLR is more appropriate for Portuguese youths than the equation estimate by ANN or the other three previously published equations (validation coefficient for the MLR model: r=0.84, P<0.001; systematic error=-0.01±5.2, P>0.05; SEE=4.9). In the Study II, normative values for the SR performance were calculated from a population-based study (5559 students) and validated as reference standards for metabolic risk stratification in a validation group (633 subjects). The accuracy of SR laps standards was significant for girls (AUC=0.66; 95% CI=0.58–0.74; P<0.001) and boys (AUC=0.71; 95% CI=0.62–0.79; P<0.001) for identifying subjects at high metabolic risk. The 40th percentile was the best cut-off for SR laps in girls (SENS=0.569; 1-SPEC=0.330) and boys (SENS=0.634; 1-SPEC=0.266). New SR laps reference standards are able to discriminate metabolic risk levels. In the Study III, the associations between CRF, WC and metabolic risk were analysed in a sample of 633 students. With adjustments for age, sex and WC, VO2max was correlated with MRS (r=-0.095; P<0.05). Participants who were low fit, presented higher levels of MRS (P<0.001) compared to those who were fit, even after adjustment for age, sex and WC. Results suggest that CRF associates with MRS, independently of central adiposity. In the Study IV, the associations between CRF, MVPA and participation in PA contexts were analysed in a sample of 310 youths. The OR for being fit was greater for those who comply with 60min/day in MVPA (OR=2.612; 95%CI=1.614-4.225) in comparison with those who do not. Participation in competitive sports at club levels increased the chances of being fit (OR=13.483; 95%CI=4.560-39.864), independently of MVPA levels. There were positive and significant trends in CRF and objectively measured PA across the levels of engagement in competitive sports (P<0.05). In this analysis, participation in competitive sports, especially at club level, increased the chances to reach healthier levels of CRF and recommended levels of MVPA. In conclusion, the experimental work of the present thesis suggest that a field test such as the SR provides valid estimations of CRF and might be considered an important tool for the stratification of children and adolescents at risk for CVD. CRF is an important marker of cardiovascular health in youths, independently of central adiposity. Participation in competitive sports may be an effective PA context to improve CRF and overall cardiovascular health in young people. Keywords: AEROBIC ENDURANCE, CARDIOVASCULAR RISK FACTORS, METABOLIC SYNDROME, PHYSICAL ACTIVITY, YOUTHS.

XX
XXI
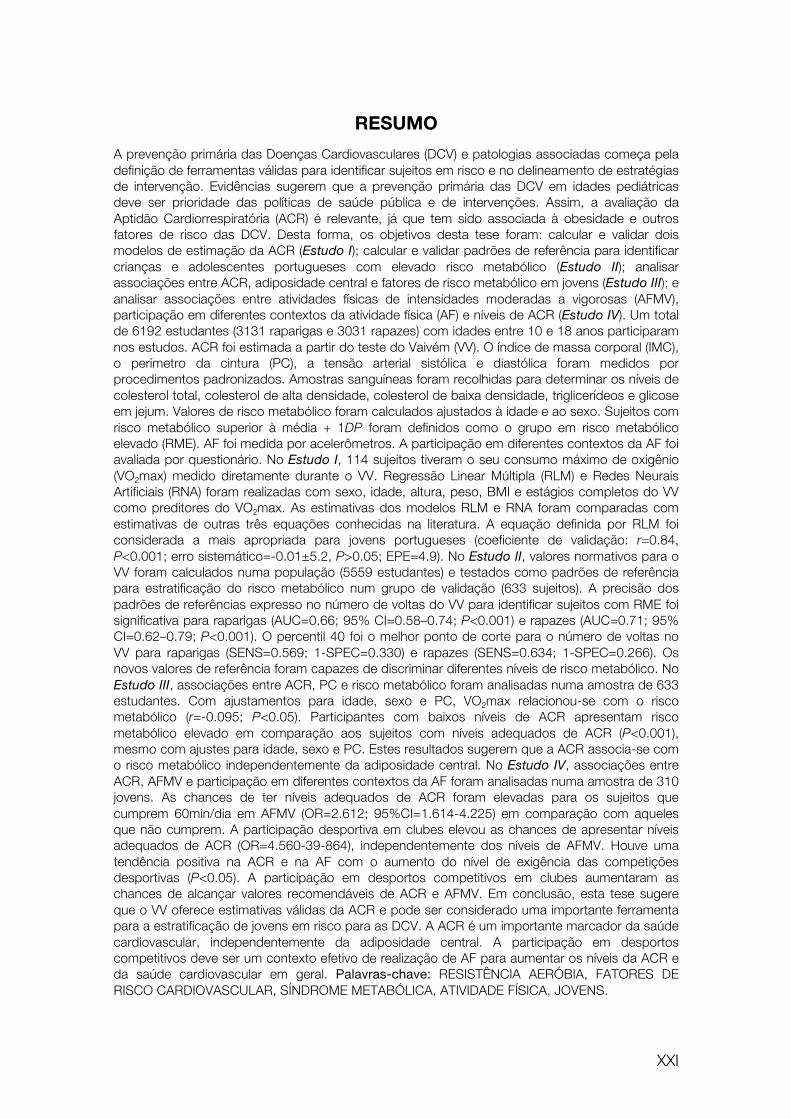
RESUMO
A prevenção primária das Doenças Cardiovasculares (DCV) e patologias associadas começa pela definição de ferramentas válidas para identificar sujeitos em risco e no delineamento de estratégias de intervenção. Evidências sugerem que a prevenção primária das DCV em idades pediátricas deve ser prioridade das políticas de saúde pública e de intervenções. Assim, a avaliação da Aptidão Cardiorrespiratória (ACR) é relevante, já que tem sido associada à obesidade e outros fatores de risco das DCV. Desta forma, os objetivos desta tese foram: calcular e validar dois modelos de estimação da ACR (Estudo I); calcular e validar padrões de referência para identificar crianças e adolescentes portugueses com elevado risco metabólico (Estudo II); analisar associações entre ACR, adiposidade central e fatores de risco metabólico em jovens (Estudo III); e analisar associações entre atividades físicas de intensidades moderadas a vigorosas (AFMV), participação em diferentes contextos da atividade física (AF) e níveis de ACR (Estudo IV). Um total de 6192 estudantes (3131 raparigas e 3031 rapazes) com idades entre 10 e 18 anos participaram nos estudos. ACR foi estimada a partir do teste do Vaivém (VV). O índice de massa corporal (IMC), o perímetro da cintura (PC), a tensão arterial sistólica e diastólica foram medidos por procedimentos padronizados. Amostras sanguíneas foram recolhidas para determinar os níveis de colesterol total, colesterol de alta densidade, colesterol de baixa densidade, triglicerídeos e glicose em jejum. Valores de risco metabólico foram calculados ajustados à idade e ao sexo. Sujeitos com risco metabólico superior à média + 1DP foram definidos como o grupo em risco metabólico elevado (RME). AF foi medida por acelerômetros. A participação em diferentes contextos da AF foi avaliada por questionário. No Estudo I, 114 sujeitos tiveram o seu consumo máximo de oxigênio (VO2max) medido diretamente durante o VV. Regressão Linear Múltipla (RLM) e Redes Neurais Artificiais (RNA) foram realizadas com sexo, idade, altura, peso, BMI e estágios completos do VV como preditores do VO2max. As estimativas dos modelos RLM e RNA foram comparadas com estimativas de outras três equações conhecidas na literatura. A equação definida por RLM foi considerada a mais apropriada para jovens portugueses (coeficiente de validação: r=0.84, P<0.001; erro sistemático=-0.01±5.2, P>0.05; EPE=4.9). No Estudo II, valores normativos para o VV foram calculados numa população (5559 estudantes) e testados como padrões de referência para estratificação do risco metabólico num grupo de validação (633 sujeitos). A precisão dos padrões de referências expresso no número de voltas do VV para identificar sujeitos com RME foi significativa para raparigas (AUC=0.66; 95% CI=0.58–0.74; P<0.001) e rapazes (AUC=0.71; 95% CI=0.62–0.79; P<0.001). O percentil 40 foi o melhor ponto de corte para o número de voltas no VV para raparigas (SENS=0.569; 1-SPEC=0.330) e rapazes (SENS=0.634; 1-SPEC=0.266). Os novos valores de referência foram capazes de discriminar diferentes níveis de risco metabólico. No Estudo III, associações entre ACR, PC e risco metabólico foram analisadas numa amostra de 633 estudantes. Com ajustamentos para idade, sexo e PC, VO2max relacionou-se com o risco metabólico (r=-0.095; P<0.05). Participantes com baixos níveis de ACR apresentam risco metabólico elevado em comparação aos sujeitos com níveis adequados de ACR (P<0.001), mesmo com ajustes para idade, sexo e PC. Estes resultados sugerem que a ACR associa-se com o risco metabólico independentemente da adiposidade central. No Estudo IV, associações entre ACR, AFMV e participação em diferentes contextos da AF foram analisadas numa amostra de 310 jovens. As chances de ter níveis adequados de ACR foram elevadas para os sujeitos que cumprem 60min/dia em AFMV (OR=2.612; 95%CI=1.614-4.225) em comparação com aqueles que não cumprem. A participação desportiva em clubes elevou as chances de apresentar níveis adequados de ACR (OR=4.560-39-864), independentemente dos níveis de AFMV. Houve uma tendência positiva na ACR e na AF com o aumento do nível de exigência das competições desportivas (P<0.05). A participação em desportos competitivos em clubes aumentaram as chances de alcançar valores recomendáveis de ACR e AFMV. Em conclusão, esta tese sugere que o VV oferece estimativas válidas da ACR e pode ser considerado uma importante ferramenta para a estratificação de jovens em risco para as DCV. A ACR é um importante marcador da saúde cardiovascular, independentemente da adiposidade central. A participação em desportos competitivos deve ser um contexto efetivo de realização de AF para aumentar os níveis da ACR e da saúde cardiovascular em geral. Palavras-chave: RESISTÊNCIA AERÓBIA, FATORES DE RISCO CARDIOVASCULAR, SÍNDROME METABÓLICA, ATIVIDADE FÍSICA, JOVENS.

XXII
XXIII
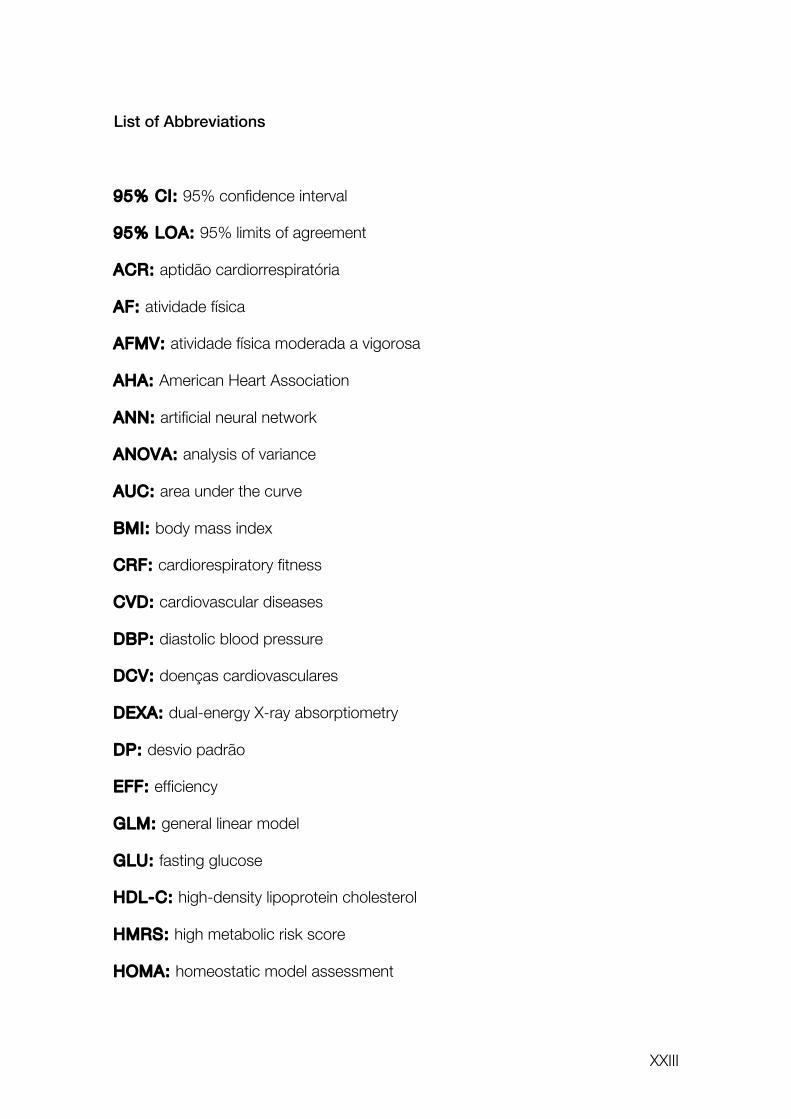
List of Abbreviations
95% CI: 95% confidence interval
95% LOA: 95% limits of agreement
ACR: aptidão cardiorrespiratória
AF: atividade física
AFMV: atividade física moderada a vigorosa
AHA: American Heart Association
ANN: artificial neural network
ANOVA: analysis of variance
AUC: area under the curve
BMI: body mass index
CRF: cardiorespiratory fitness
CVD: cardiovascular diseases
DBP: diastolic blood pressure
DCV: doenças cardiovasculares
DEXA: dual-energy X-ray absorptiometry
DP: desvio padrão
EFF: efficiency
GLM: general linear model
GLU: fasting glucose
HDL-C: high-density lipoprotein cholesterol
HMRS: high metabolic risk score
HOMA: homeostatic model assessment
XXIV
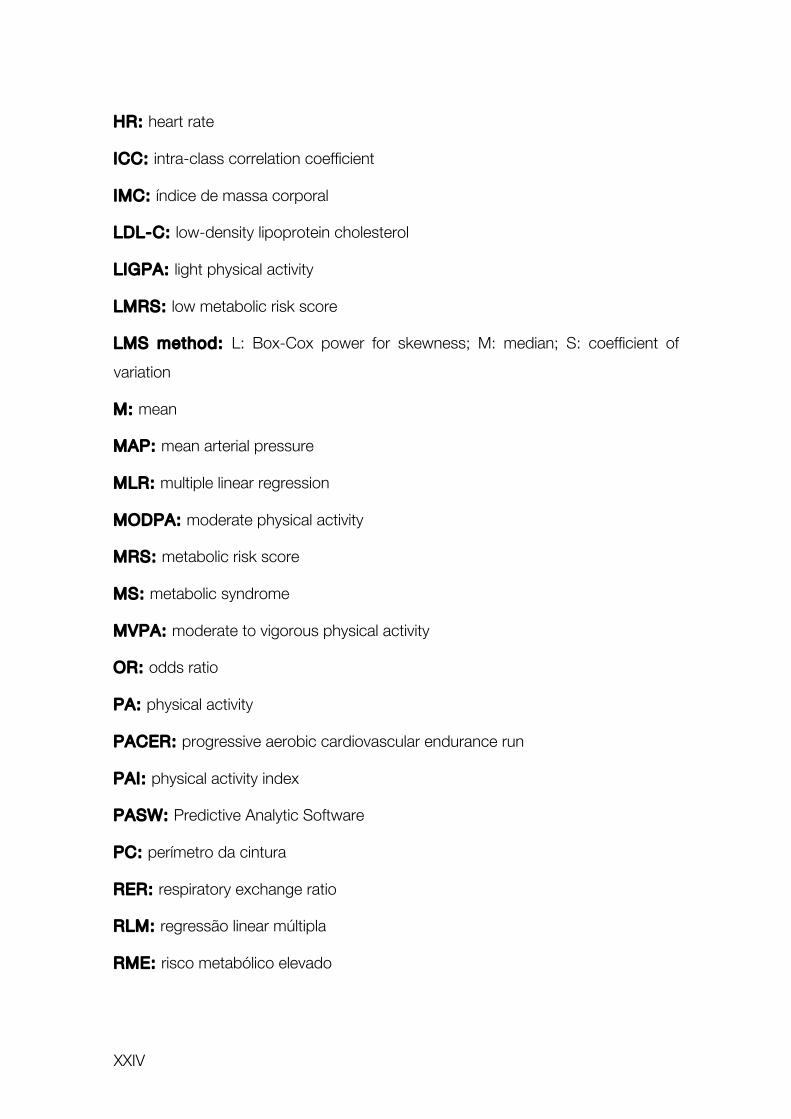
HR: heart rate
ICC: intra-class correlation coefficient
IMC: índice de massa corporal
LDL-C: low-density lipoprotein cholesterol
LIGPA: light physical activity
LMRS: low metabolic risk score
LMS method: L: Box-Cox power for skewness; M: median; S: coefficient of
variation
M: mean
MAP: mean arterial pressure
MLR: multiple linear regression
MODPA: moderate physical activity
MRS: metabolic risk score
MS: metabolic syndrome
MVPA: moderate to vigorous physical activity
OR: odds ratio
PA: physical activity
PACER: progressive aerobic cardiovascular endurance run
PAI: physical activity index
PASW: Predictive Analytic Software
PC: perímetro da cintura
RER: respiratory exchange ratio
RLM: regressão linear múltipla
RME: risco metabólico elevado
XXV
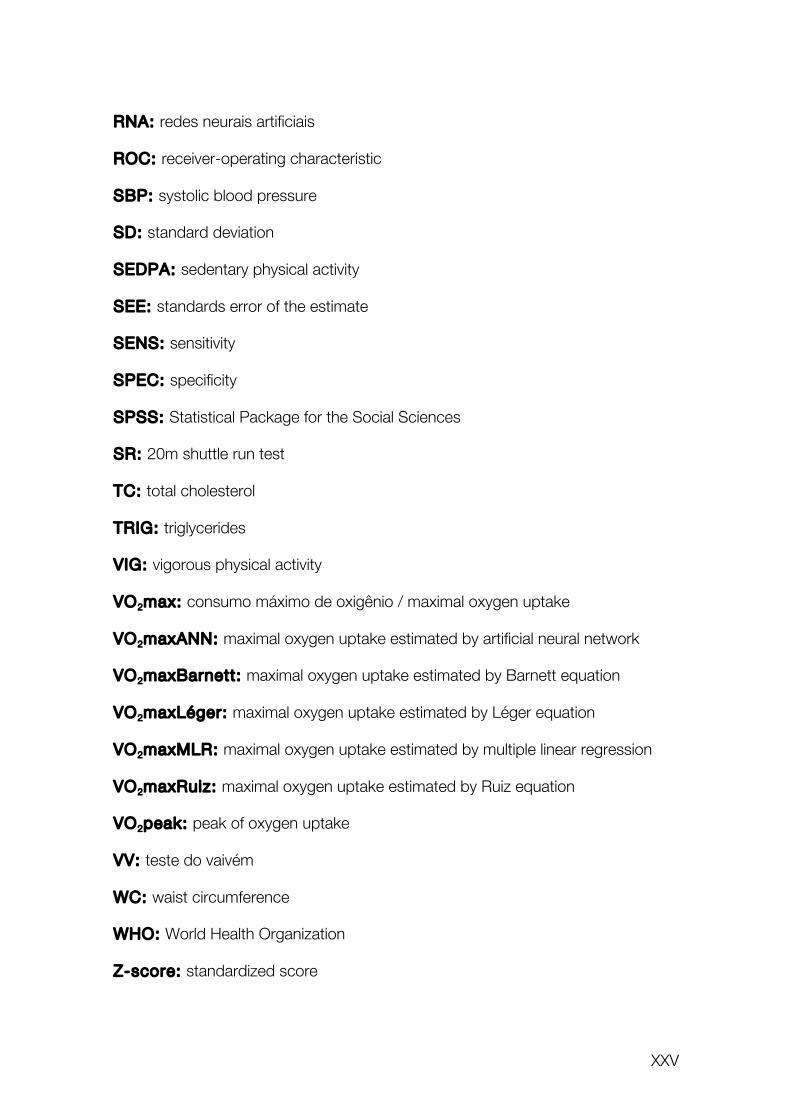
RNA: redes neurais artificiais
ROC: receiver-operating characteristic
SBP: systolic blood pressure
SD: standard deviation
SEDPA: sedentary physical activity
SEE: standards error of the estimate
SENS: sensitivity
SPEC: specificity
SPSS: Statistical Package for the Social Sciences
SR: 20m shuttle run test
TC: total cholesterol
TRIG: triglycerides
VIG: vigorous physical activity
VO2max: consumo máximo de oxigênio / maximal oxygen uptake
VO2maxANN: maximal oxygen uptake estimated by artificial neural network
VO2maxBarnett: maximal oxygen uptake estimated by Barnett equation
VO2maxLéger: maximal oxygen uptake estimated by Léger equation
VO2maxMLR: maximal oxygen uptake estimated by multiple linear regression
VO2maxRuiz: maximal oxygen uptake estimated by Ruiz equation
VO2peak: peak of oxygen uptake
VV: teste do vaivém
WC: waist circumference
WHO: World Health Organization
Z-score: standardized score

XXVI

27
GENERAL INTRODUCTION

28
29
I n t r oduc t i on and Backg round
It is established that cardiovascular diseases (CVD) represents the greatest
burden in terms of public health, with massive social and economical implications,
both for developed and developing societies. According to the World Health
Organization (WHO), 17.3 million people died from CVD in 2008, which represents
30% of all deaths. In Portugal, the mortality due to CVD is approximately 40% of
all deaths. The American Heart Association (AHA) suggests that 75%-90% of the
CVD epidemic is related to risk factors such as dyslipidaemia, hypertension,
diabetes mellitus and obesity. These disorders and risk factors are mostly
explained by sedentary lifestyles, unhealthy diet, tobacco use and other risk
behaviours (Daviglus et al., 2004; Gidding et al., 2006; Kavey et al., 2003; Stamler
et al., 1999).
In the In the recent years, CVD risk factors are recognized as a health
paediatric concern, since the incidence of risk factors like obesity, hypertension
and dyslipidaemias have increased in children and adolescents (Kavey et al.,
2003). It is established that there is a tendency of cardiovascular risk factors to
cluster in young people (Andersen et al., 2006; Andersen, Wedderkopp, Hansen,
Cooper, & Froberg, 2003; Brage et al., 2004; Ribeiro et al., 2004). A well
documented metabolic disorder resulting from risk factors clustering is the
Metabolic Syndrome (MS), characterized by central obesity, dyslipidaemia,
hypertension, glucose intolerance and insulin resistance (Alberti, Zimmet, & Shaw,
2006; IDF, 2007), which affects 30% of young obese and 2.4% of the general
paediatric population (Cook, Auinger, Li, & Ford, 2008; Cook, Weitzman, Auinger,
Nguyen, & Dietz, 2003). Studies reported a trend in clustered risk factors to track
from childhood to adulthood, which is stronger than the trends for a single risk
factor (Andersen & Haraldsdottir, 1993; Andersen, Hasselstrøm, Grønfeldt,
Hansen, & Karsten, 2004). Furthermore, it is well documented that long-term
exposure to cardiovascular risk factors (such as obesity, hypertension,
30
dyslipidaemias, insulin resistance and metabolic syndrome) is associated to
increased cardiovascular morbidity and mortality risk (Freedman, Serdula,
Srinivasan, & Berenson, 1999; Lauer, Lee, & Clarke, 1988; Li et al., 2003;
Mahoney et al., 1996; Nicklas, Von Duvillard, & Berenson, 2002; Srinivasan &
Berenson, 1995; Webber, Srinivasan, Wattigney, & Berenson, 1991).
Together with the evidence reporting the occurrence and clustering of
cardiovascular risk factors in youths, there are signs that the development of
atherosclerosis, the pathology underlying the majority of CVD, starts in childhood,
progressing silently until the clinical manifestation (angina and myocardial
infarction) and the occurrence of cardiovascular events later in adulthood. Indeed,
post-mortem studies demonstrated that advanced atherosclerotic lesions are
present in children and adolescents, through autopsy after unexpected death of
other causes (Berenson et al., 1998; Berenson et al., 1992). Arterial stiffness,
which is considered a marker of the atherosclerotic process and related CVD, has
been investigated in children and adolescents. Actually, in young people,
increased levels of arterial stiffness were already reported and associated with
obesity (Sakuragi et al., 2009; Urbina, Kimball, Khoury, Daniels, & Dolan, 2010)
elevated blood pressure (Lydakis et al., 2012), metabolic syndrome (Ferreira et al.,
2005; Jae et al., 2010), insulin resistance and other traditional cardiovascular risk
factors (Urbina, Gao, Khoury, Martin, & Dolan, 2012).
The body of evidence aforementioned is an indicative that the primary
prevention of CVD should begin in childhood. Therefore, the recognition of non-
invasive methods for detection and targeting interventions for young people at risk
is imperative. The assessment of physical fitness and its measures allow
describing the general condition of health (Ortega, Ruiz, Castillo, & Sjöström,
2008). Especially cardiorespiratory fitness (CRF), which is representative of the
physiological status and general capacity of cardiovascular and respiratory
systems and describes the ability to carry out prolonged exercise (Taylor, Buskirk,
& Henschel, 1955). The standard indicator of CRF is the maximal oxygen uptake
(VO2max). Usually, VO2max is measured directly by ergospirometry in laboratory
31
setting with a progressive exercise test on treadmill or cycle ergometers.
Conventionally, VO2max is described in millilitres consumed in one minute for each
unit of body mass [ml.kg-1.min-1] or, alternatively in terms of metabolic equivalents
[MET (1 MET= 3.5 ml.kg-1.min-1)] (Taylor et al., 1955). By analysing the relationship
between cardiorespiratory fitness and single cardiovascular risk factors in children
and adolescents, evidence from previous investigation indicated that CRF is
inversely associated with body mass index (Aires et al., 2008; Aires, Silva, et al.,
2010), skinfold thickness (Brage et al., 2004; Ekelund et al., 2007), waist
circumference (Ekelund et al., 2007), total cholesterol (Boreham et al., 2001;
Eisenmann et al., 2005; Gutin, Yin, Humphries, Bassali, et al., 2005), triglycerides
(Brage et al., 2004; Eisenmann et al., 2005; Ruiz et al., 2006), fasting glucose
(Eisenmann et al., 2005; Ekelund et al., 2007) and blood pressure (Boreham et al.,
2001; Eisenmann et al., 2005; Ekelund et al., 2007). Furthermore, reduced CRF
has been more strongly associated with clustered metabolic risk (Andersen et al.,
2008; Anderssen et al., 2007; Brage et al., 2004; Ekelund et al., 2007; Lobelo,
Pate, Dowda, Liese, & Ruiz, 2009; Ruiz et al., 2006; Ruiz et al., 2007). More
recently, reduced CRF was also associated with increased arterial stiffness in
young people (Sakuragi et al., 2009). Additionally, longitudinal studies reported
that reduced CRF during youth is associated with increased arterial stiffness and
metabolic risk later in adulthood (Boreham et al., 2004; Ferreira et al., 2005).
Although many findings suggest that CRF is correlated with single and clustered
risk factors, few studies analysed whether these relationships are independent of
obesity (Andersen et al., 2008; Ekelund et al., 2007). Indeed, obesity seems to be
a crucial element to the development of metabolic syndrome (Alberti et al., 2006).
Although CRF and obesity are associated, there are evidences supporting the idea
that CRF may be considered an independent risk factor for MS and it might be
related to metabolic risk through different mechanisms (Andersen et al., 2008;
McMurray & Andersen, 2010)
Cardiorespiratory fitness was already reported to be a powerful predictor of
cardiovascular morbidity and mortality and all-cause risk of death in adults (Blair et
32
al., 1989). Indeed, CRF is a more powerful predictor of mortality among adults
than other established cardiovascular risk factors (Myers et al., 2002).
Consequently, for both adults and young people, evidences suggest that CRF is
considered a valuable tool for risk stratification and should be inserted in
surveillance system for primary prevention of cardiovascular diseases (Ortega et
al., 2008).
The definition of reference standard values for cardiovascular risk
stratification is an important step for primary prevention of CVD. In adults, the
study from Blair et al. (1989) suggests that men and women with CRF values
lower than 10 MET (35 ml.kg-1.min-1) and 9 MET (31.5 ml.kg-1.min-1), respectively,
have an increased relative risk of all-cause mortality. On the other hand, a similar
approach to define reference values for CRF in children and adolescents is not
possible, since the exposure to risk factors was not prolonged enough to trigger
cardiovascular events, or even death from CVD, which might just occur later in
adulthood. Therefore, the clinical reference of cardiovascular health for
establishing reference standards for CRF in young people should be different, and
clustered metabolic risk scores have been pointed as a stable marker of
cardiovascular health with increased tracking coefficients form childhood to
adulthood in comparison with single risk factors (Andersen et al., 2004).
Cardiorespiratory Fitness reference standards for targeting children and
adolescents with elevated cardiovascular risk were calculated and validated,
taking into consideration the inverse relationship between CRF and the clustering
of cardio-metabolic risk factors (Adegboye et al., 2010; Bell, Macek, Rutenfranz, &
Saris, 1986; Cureton & Plowman, 2008; Cureton & Warren, 1990; Lobelo et al.,
2009; Ruiz et al., 2007; The Cooper Institute, 2007; Welk, Laurson, Eisenmann, &
Cureton, 2011). These reference standards were described in units of VO2max
(ml.kg-1.min-1) and defined in the basis of different principles: (a) arbitrary, when
defined by a group of experts in the research field; (b) statistical, defined from
values in the bottom of the distribution for a population, first quintile or first
33
quartiles, for example; and (c) biological, determined from the non-linear
relationship between CRF levels and an increased clustered metabolic risk score.
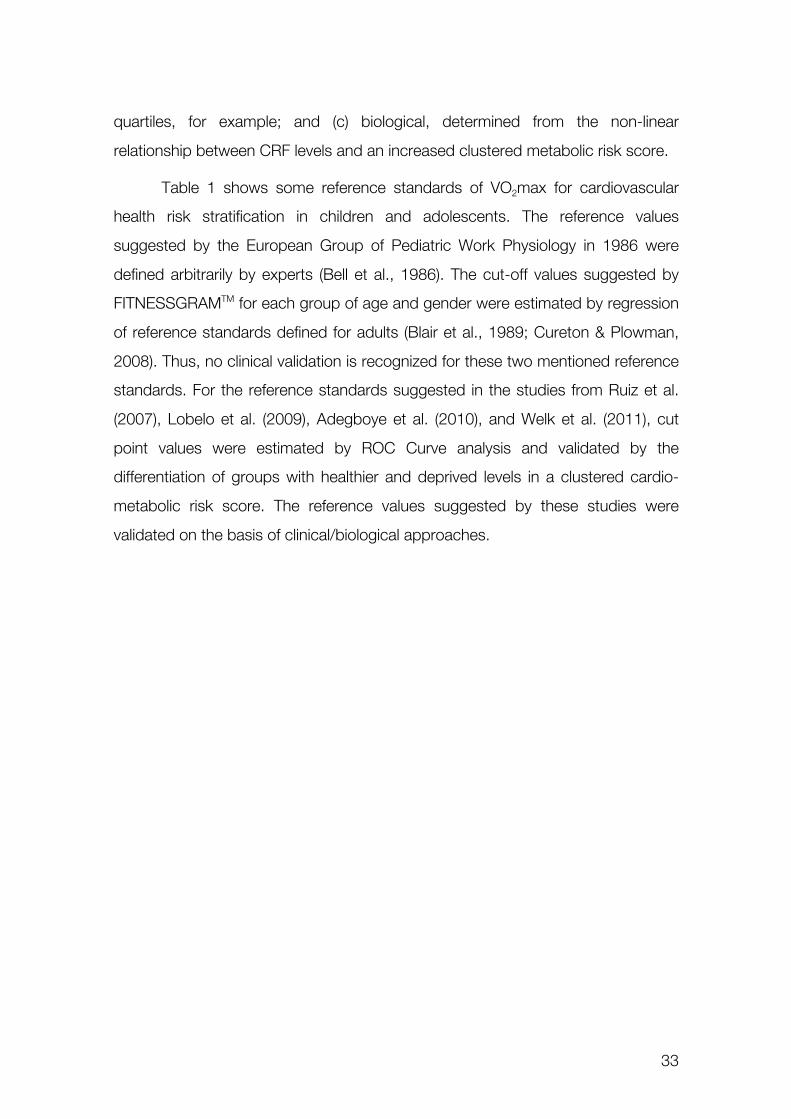
Table 1 shows some reference standards of VO2max for cardiovascular
health risk stratification in children and adolescents. The reference values
suggested by the European Group of Pediatric Work Physiology in 1986 were
defined arbitrarily by experts (Bell et al., 1986). The cut-off values suggested by
FITNESSGRAMTM for each group of age and gender were estimated by regression
of reference standards defined for adults (Blair et al., 1989; Cureton & Plowman,
2008). Thus, no clinical validation is recognized for these two mentioned reference
standards. For the reference standards suggested in the studies from Ruiz et al.
(2007), Lobelo et al. (2009), Adegboye et al. (2010), and Welk et al. (2011), cut
point values were estimated by ROC Curve analysis and validated by the
differentiation of groups with healthier and deprived levels in a clustered cardio-
metabolic risk score. The reference values suggested by these studies were
validated on the basis of clinical/biological approaches.
34
Table 1 – Reference standards (cut-off points) for VO2max values for cardiovascular risk stratification in children and adolescents Gender Age EGPWP
(1986) FITNESSGRAM (2007)
Ruiz et al. (2007)
Lobelo et al. (2009)
Adegboye et al. (2010)
Welk et al. (2011)
at risk at risk at risk at risk at risk at high risk at risk Girls 8 - - - - <37.4 - - 9 - - <37.0 - <37.4 - - 10 <35.0 <39.0 <37.0 - <37.4 <37.3 <40.2 11 <35.0 <38.0 - - <37.4 <37.3 <40.2 12 <35.0 <37.0 - <36 - <37.0 <40.1 13 <35.0 <36.0 - <36 - <36.6 <39.7 14 <35.0 <35.0 - <36 <33.0 <36.3 <39.4 15 <35.0 <35.0 - <36 <33.0 <36.0 <39.1 16 <35.0 <35.0 - <35.5 <33.0 <35.8 <38.9 17 <35.0 <35.0 - <35.5 <33.0 <35.7 <38.8 18 <35.0 <35.0 - <35.5 - <35.3 <38.6 19 - - - <35.5 - - - Boys 8 - - - - <43.6 - - 9 - - <42.1 - <43.6 - - 10 <40.0 <42.0 <42.1 - <43.6 <37.3 <40.2 11 <40.0 <42.0 - - <43.6 <37.3 <40.2 12 <40.0 <42.0 - <44.1 - <37.6 <40.3 13 <40.0 <42.0 - <44.1 - <38.6 <41.4 14 <40.0 <42.0 - <44.1 <46.0 <39.6 <42.5 15 <40.0 <42.0 - <44.1 <46.0 <40.6 <43.6 16 <40.0 <42.0 - <40.3 <46.0 <41.1 <44.1 17 <40.0 <42.0 - <40.3 <46.0 <41.2 <44.2 18 <40.0 <42.0 - <40.3 - <41.2 <44.3 19 - - - <40.3 - - - Notes: VO
2max values expressed in ml.kg-1.min-1; subjects with values under the above-mentioned values are considered “at risk” of later development of cardiovascular
diseases. EGPWP= European Group of Pediatric Work Physiology; FITNESSGRAMTM= health related physical fitness test battery suggested by the Cooper Institute.
35
Although directly measured VO2max is considered to be the standard
indicator of CRF, it is accepted that the methods for assessing this indicator have
some limitations. Usually, the objective measurement of VO2max requires a
laboratory with sophisticated equipment, specialized technicians, which may
elevate costs for population assessment (Ruiz et al., 2009). Alternatively, several
field tests were validated to assess CRF, and several equations were calculated
and validated to estimate VO2max based on the achieved performance in these
tests. Field tests such as One-mile Run, 12-minutes Run, 9-minutes Run, 6-
minutes Run and the 20-meter Shuttle Run (SR) are several examples of tests
included in popular fitness tests batteries like FITNESSGRAM (The Cooper
Institute, 2007; The Cooper Institute for Aerobics Research, 1999), EUROFIT
(Council of Europe committee for the development of sport, 1988) and PROESP-
BR (Gaya & Silva, 2007). The 20m Shuttle Run test (SR), originally designed and
validated by Léger and colleagues (Léger, Lambert, Goulet, Rowan, & Dinelle,
1984; Leger & Lambert, 1982; Léger, Mercier, Gadoury, & Lambert, 1988) is one
of the most widely used field tests for estimating CRF in youths (Tomkinson, Leger,
Olds, & Cazorla, 2003). The SR simulates a progressive workload test until the
exhaustion. Summarizing, the test consists in running back and forth between two
lines 20 meters apart according to sound signals pacing the running speed, with a
gradual increase in the speed for each 1-min stage.
The use of equations to estimate VO2max from the performance in field
tests might be valuable in many ways: it provides known values that are
comparable to valid reference standards and it permits the comparisons between
studies and populations, even when the subjects were evaluated with different
tests and protocols. Especially for the original SR, or other modified versions,
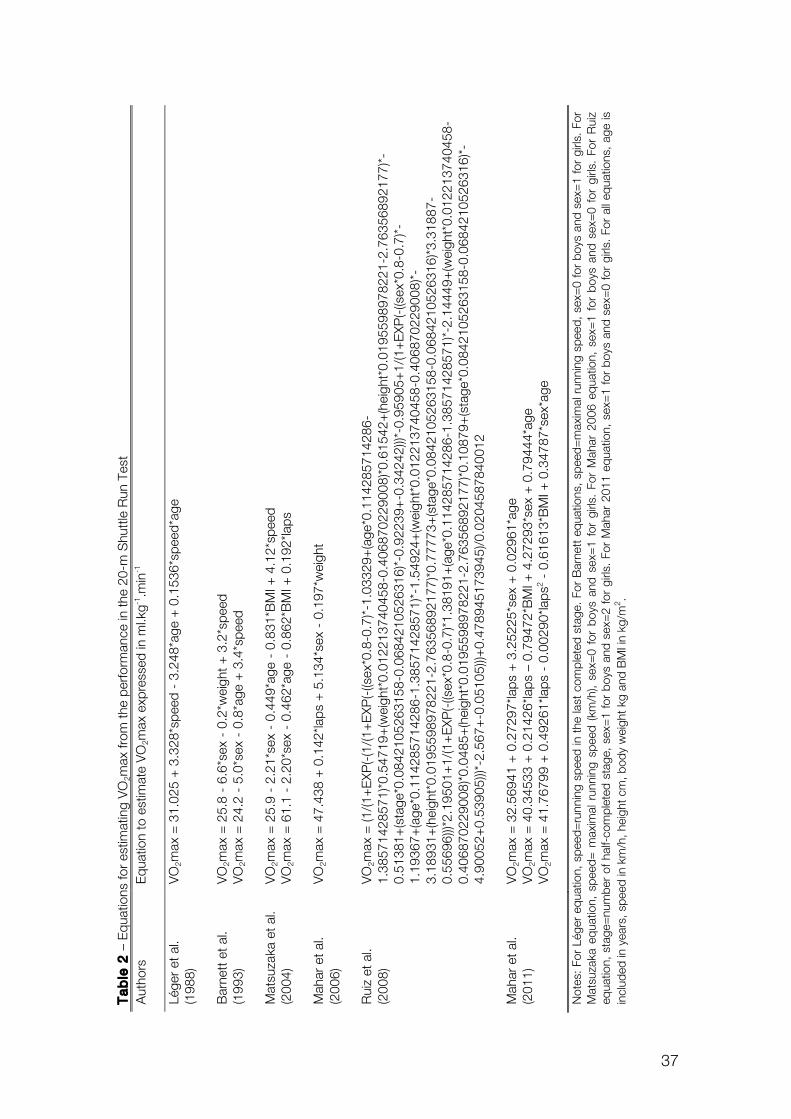
several equations were previously calculated for estimating VO2max (Table 2) from
indicators of the individuals’ performance achieved in the test (number of
completed shuttle/laps, number of completed 1-min stages, time to exhaustion or
maximal running speed attained in the test). As it can be observed in Table 2, the
equations mainly differ on independent variables assumed as predictors and also
36
in the type of function assumed to express the relationships between the
predictors and the outcome (VO2max). This variety of equations and
methodological assumptions accounted in the different studies result from an
extensive number of attempts for improving the validation of SR as an indicator of
CRF and also to improve the accuracy of the VO2max estimations in different
populations.
It is important to refer one study carried out in Portuguese youths, which
aimed to analyse the validation of the SR for the Portuguese population and to
assess the agreement between directly measured VO2max and estimated VO2max
from five different equations in youths aged 13-19 years (Ruiz et al., 2009). The
findings of this study were that the equations developed by Léger et al. (1988),
Barnett et al. (1993), Matsuzaka et al. (2004), and Ruiz et al. (2008) significantly
underestimate the directly measured VO2max in Portuguese youths. Another
important finding was that the equation originally suggested by Léger et al. (1988)
presented the worst validation results when compared to the other equations.
These findings are of concern, since the equation from Léger et al. (1988) is
probably the most used one in studies that appeal to SR for assessing CRF.
It should be recognized that there are no equations universally accepted
and valid for all populations, age and gender groups. Thus, it is necessary to know
the levels of validation for the equations in each population that is object of
research, in order to have proper estimations of VO2max (Ruiz et al., 2009). It is
known that most of the equations for estimating VO2max fail to provide valid
estimations for populations that are different than that one which gives origin to
the equation.
37
Ta
ble
2 –
Equ
atio
ns fo
r es
timat
ing
VO
2max
from
the
perfo
rman
ce in
the
20-m
Shu
ttle
Run
Tes
t A
utho
rs
Equ
atio
n to
est
imat
e V
O2m
ax e
xpre
ssed
in m
l.kg-1
.min
-1
Lége
r et
al.
(1
988)
VO
2max
= 3
1.02
5 +
3.3
28*s
peed
- 3
.248
*age
+ 0
.153
6*sp
eed*
age
Bar
nett
et a
l.
(199
3)
VO
2max
= 2
5.8
- 6.
6*se
x -
0.2*
wei
ght +
3.2
*spe
ed
VO
2max
= 2
4.2
- 5.
0*se
x -
0.8*
age
+ 3
.4*s
peed
Mat
suza
ka e
t al.
(2
004)
VO
2max
= 2
5.9
- 2.
21*s
ex -
0.4
49*a
ge -
0.8
31*B
MI +
4.1
2*sp
eed
V
O2m
ax =
61.
1 -
2.20
*sex
- 0
.462
*age
- 0
.862
*BM
I + 0
.192
*laps
Mah
ar e
t al.
(2
006)
VO
2max
= 4
7.43
8 +
0.1
42*la
ps +
5.1
34*s
ex -
0.1
97*w
eigh
t
Rui
z et
al.
(2
008)
V
O2m
ax =
(1/(1
+E
XP(-
(1/(1
+E
XP(-
((sex
*0.8
-0.7
)*-1
.033
29+
(age
*0.1
1428
5714
286-
1.38
5714
2857
1)*0
.547
19+
(wei
ght*
0.01
2213
7404
58-0
.406
8702
2900
8)*0
.615
42+
(hei
ght*
0.01
9559
8978
221-
2.76
3568
9217
7)*-
0.51
381+
(sta
ge*0
.084
2105
2631
58-0
.068
4210
5263
16)*
-0.9
2239
+-0
.342
42)))
*-0.
9590
5+1/
(1+
EXP
(-((s
ex*0
.8-0
.7)*
-1.
1936
7+(a
ge*0
.114
2857
1428
6-1.
3857
1428
571)
*-1.
5492
4+(w
eigh
t*0.
0122
1374
0458
-0.4
0687
0229
008)
*-3.
1893
1+(h
eigh
t*0.
0195
5989
7822
1-2.
7635
6892
177)
*0.7
7773
+(s
tage
*0.0
8421
0526
3158
-0.0
6842
1052
6316
)*3.
3188
7-0.
5569
6)))*
2.19
501+
1/(1
+E
XP(-
((sex
*0.8
-0.7
)*1.
3819
1+(a
ge*0
.114
2857
1428
6-1.
3857
1428
571)
*-2.
1444
9+(w
eigh
t*0.
0122
1374
0458
-0.
4068
7022
9008
)*0.
0485
+(h
eigh
t*0.
0195
5989
7822
1-2.
7635
6892
177)
*0.1
0879
+(s
tage
*0.0
8421
0526
3158
-0.0
6842
1052
6316
)*-
4.90
052+
0.53
905)
))*-2
.567
+-0
.051
05)))
+0.
4789
4517
3945
)/0.0
2045
8784
0012
Mah
ar e
t al.
(2
011)
VO
2max
= 3
2.56
941
+ 0
.272
97*la
ps +
3.2
5225
*sex
+ 0
.029
61*a
ge
VO
2max
= 4
0.34
533
+ 0
.214
26*la
ps
– 0.
7947
2*B
MI +
4.2
7293
*sex
+ 0
.794
44*a
ge
VO
2max
= 4
1.76
799
+ 0
.492
61*la
ps -
0.0
0290
*laps
2 - 0
.616
13*B
MI +
0.3
4787
*sex
*age
Not
es: F
or L
éger
equ
atio
n, s
peed
=ru
nnin
g sp
eed
in t
he la
st c
ompl
eted
sta
ge. F
or B
arne
tt e
quat
ions
, spe
ed=
max
imal
run
ning
spe
ed, s
ex=
0 fo
r bo
ys a
nd s
ex=
1 fo
r gi
rls. F
or
Mat
suza
ka e
quat
ion,
spe
ed=
max
imal
run
ning
spe
ed (
km/h
), se
x=0
for
boys
and
sex
=1
for
girls
. Fo
r M
ahar
200
6 eq
uatio
n, s
ex=
1 fo
r bo
ys a
nd s
ex=
0 fo
r gi
rls.
For
Rui
z eq
uatio
n, s
tage
=nu
mbe
r of
hal
f-co
mpl
eted
sta
ge,
sex=
1 fo
r bo
ys a
nd s
ex=
2 fo
r gi
rls.
For
Mah
ar 2
011
equa
tion,
sex
=1
for
boys
and
sex
=0
for
girls
. Fo
r al
l equ
atio
ns,
age
is
incl
uded
in y
ears
, spe
ed in
km
/h, h
eigh
t cm
, bod
y w
eigh
t kg
and
BM
I in
kg/m
2 .
38
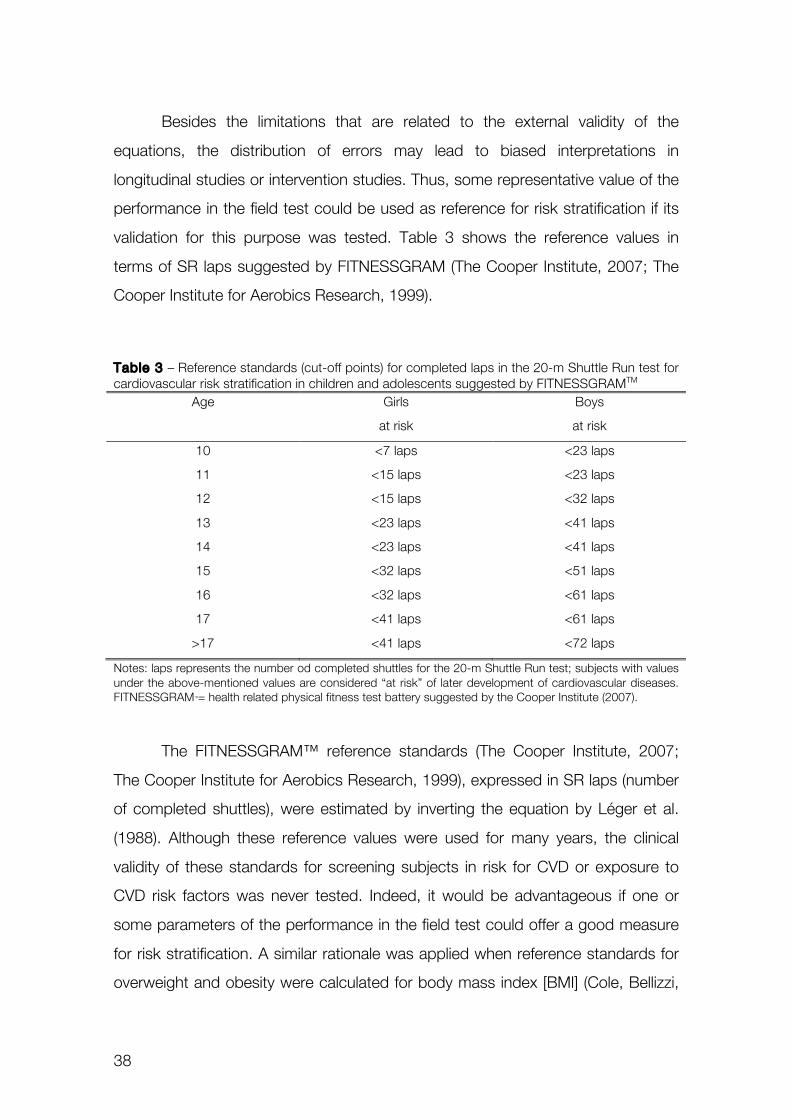
Besides the limitations that are related to the external validity of the
equations, the distribution of errors may lead to biased interpretations in
longitudinal studies or intervention studies. Thus, some representative value of the
performance in the field test could be used as reference for risk stratification if its
validation for this purpose was tested. Table 3 shows the reference values in
terms of SR laps suggested by FITNESSGRAM (The Cooper Institute, 2007; The
Cooper Institute for Aerobics Research, 1999).
Table 3 – Reference standards (cut-off points) for completed laps in the 20-m Shuttle Run test for cardiovascular risk stratification in children and adolescents suggested by FITNESSGRAMTM
Age Girls Boys
at risk at risk
10 <7 laps <23 laps
11 <15 laps <23 laps
12 <15 laps <32 laps
13 <23 laps <41 laps
14 <23 laps <41 laps
15 <32 laps <51 laps
16 <32 laps <61 laps
17 <41 laps <61 laps
>17 <41 laps <72 laps
Notes: laps represents the number od completed shuttles for the 20-m Shuttle Run test; subjects with values under the above-mentioned values are considered “at risk” of later development of cardiovascular diseases. FITNESSGRAMTM= health related physical fitness test battery suggested by the Cooper Institute (2007).
The FITNESSGRAM™ reference standards (The Cooper Institute, 2007;
The Cooper Institute for Aerobics Research, 1999), expressed in SR laps (number
of completed shuttles), were estimated by inverting the equation by Léger et al.
(1988). Although these reference values were used for many years, the clinical
validity of these standards for screening subjects in risk for CVD or exposure to
CVD risk factors was never tested. Indeed, it would be advantageous if one or
some parameters of the performance in the field test could offer a good measure
for risk stratification. A similar rationale was applied when reference standards for
overweight and obesity were calculated for body mass index [BMI] (Cole, Bellizzi,
39
Flegal, & Dietz, 2000) and waist circumference [WC] (Taylor, Jones, Williams, &
Goulding, 2000). Although it is known that these measurements are not feasible
as the gold standard measurements of body composition, it is assumed that both
BMI and WC are valid for screening subjects with increased body fatness (Taylor
et al., 2000).
Summarizing, studies that presented reference standards clinically valid for
VO2max (Adegboye et al., 2010; Lobelo et al., 2009; Ruiz et al., 2007; Welk et al.,
2011) support the idea that might exist a critical value for CRF which is associated
with a significant increase in the risk of occurrence and clustering of
cardiovascular risk factors in children and adolescents. From the epidemiological
point of view, it is important to refer that this association was observed both with
directly measured and estimated VO2max. Therefore, it seems reasonable that
CRF may be considered a valuable tool for risk stratification since the early ages.
Not just the stratification of young subjects at risk, but also the identification
of strategies for increasing CRF levels and optimize cardiovascular health might be
relevant for the prevention of later CVD manifestation. Therefore, it seems logical
that regular physical exercise and habitual physical activity should promote several
favourable changes in general health. Regarding cardiovascular health, reduced
levels of habitual PA have been associated with reduced cardiorespiratory fitness
(Dencker et al., 2006), increased overweight and obesity, dyslipidaemias,
increased glucose, insulin resistance, elevated triglycerides, hypertension and
increased metabolic risk (Andersen et al., 2006; Brage et al., 2004).
Regarding obesity, it makes sense that the total volume of PA has an
important role in the regulation of energy balance, i.e. in the equilibrium of energy
intake and energy expenditure (Gutin, Yin, Humphries, & Barbeau, 2005).
Evidences pointed that not only total PA but also moderate to vigorous PA (MVPA)
may be associated with the general cardiovascular health (Andersen et al., 2006;
Gutin et al., 2002; Gutin, Yin, Humphries, & Barbeau, 2005).
International recommendations of PA for young people in school ages
suggest that children and adolescents should accumulate 60 minutes per day of
40
MVPA in order to improve physical fitness, cardiovascular, metabolic and bone
health and to reduce symptoms of anxiety and depression (Janssen, 2007; Strong
et al., 2005; WHO, 2010). It is considered that these PA guidelines are based in
solid evidence (Andersen, Riddoch, Kriemler, & Hills, 2011), although, the studies
that support these recommendations differ in many methodological aspects such
as: studies designs (observational, cross-sectional, longitudinal, experimental,
training and/or intervention studies) and assessment of physical activity (self-
reported by questionnaires or objectively measured by pedometers or
accelerometers). Studies from Brage et al. (2004), Gutin et al. (2005) and
Andersen et al. (2006), reported significant associations between total PA, the
amount of MVPA and CRF, indicators of obesity and metabolic syndrome.
However, the compliance with the recommendation of 60 min per day in MVPA
may be attained in different contexts of PA. Active commuting to school,
participation in physical education classes, recreational and leisure physical activity,
supervised or spontaneous activities, participations in recreational or competitive
sports are some of the PA contexts that may contribute to the compliance with
PA guidelines. However, little is known about which PA contexts are more
effective in promoting the compliance with PA recommendations, increasing CRF
and improving cardiovascular health. Some evidence suggest that sports
participation is associated with increased levels of physical fitness, lower levels of
body fatness, blood pressure and reduced risk of clustering CVD risk factors (Ara
et al., 2004; Boreham, Twisk, Savage, Cran, & Strain, 1997). Therefore, it would
be expected that children and adolescents engaging in higher levels of
competitive sports would reach greater amounts and superior intensities of
habitual PA as a result of their participation in exercise training programs. Data
from cross-sectional studies indicate that trained young athletes have higher
values of VO2max when compared to their untrained peers (Armstrong,
Tomkinson, & Ekelund, 2011; Rowland, Wehnert, & Miller, 2000). Experimental
studies based in dose-response analysis of moderate to vigorous physical
exercise (>60% of VO2max) report significant increases in CRF in young people
submitted to training programs (Armstrong et al., 2011; Stoedefalke, Armstrong,
41
Kirby, & Welsman, 2000; Tolfrey, Jones, & Campbell, 2004). However, the dose-
response relationship between habitual physical activity and CRF is not clearly
established in the contexts where regular supervised exercise training within a
particular sport is absent (Armstrong et al., 2011). The evidence from cross-
sectional analyses report low to moderate correlations (r=0.1 to r=0.4) between
indicators of habitual physical activity and CRF (Dencker & Andersen, 2008).

42
43
Pu rposes and S t ruc tu re
Cardiorespiratory fitness, assessed directly by measuring maximal oxygen
uptake, has been proven to be an important marker of cardiovascular health in
people of all ages. Evidences suggest that the process leading to cardiovascular
diseases starts in childhood and primary prevention should begin since the early
ages. Consequently, the systematic assessment of cardiorespiratory fitness with
simple measurements, such as field fitness testing, could be considered a
paramount extent for surveillance strategies.
Therefore, with public health concerns, especially for the Portuguese
youths, the original research carried out in this thesis had the following purposes
that were structured in four different studies:
[Study I ] To calculate and validate two models to estimate maximal oxygen
uptake (VO2max) in Portuguese youths, aged 10-18 years, using the 20-meter
Shuttle Run Test.
[Study I ] To calculate and validate reference standards for the 20-m Shuttle
Run Test in youths aged 10-18 years for screening children and adolescents with
increased metabolic risk.
[Study I I I ] To analyse the associations between cardiorespiratory fitness,
central adiposity and metabolic risk in youths.
[Study IV] To analyse the associations between the levels of participation in
different contexts of physical activity, levels of moderate to vigorous physical
activity and cardiorespiratory fitness!

44

45
ORIGINAL RESEARCH

46
47
Study I
PUBLISHED
Silva, G., Oliveira, N.L., Aires, L., Mota, J., Oliveira, J., Ribeiro, J.C.
Calculat ion and val idat ion of models for est imating VO2max
from the 20-m shutt le run test in chi ldren and adolescents
Archives of Exercise in Health and Disease
Volume 3, Issue 1-2, Pages 145-152, (2012)

48
49
PRO
OFR
EA
DIN
G
http://ciafel.fade.up.pt/ojs/index.php/AEHD/index 145
Copyright ©2012 CIAFEL. This is an Open Access article distributed under the terms of the Creative Commons Attribution License (http://creativecommons.org/licenses/by-nc-nd/3.0/deed.en). You are free: to share, to copy, distribute and transmit the work, provided the original author and source are credited.
Corresponding author: Gustavo Silva: Faculty of Sport, University of Porto, Rua Dr. Plácido Costa, 91, 4200-450 Porto, Portugal • Tel: 00351225074785 • Fax: 00351225500689 • Email: [email protected]
DOI: 10.5628/aehd.v3i1-2.20
!"#$#%&'()*+*&",-(.&%/+,"#01(
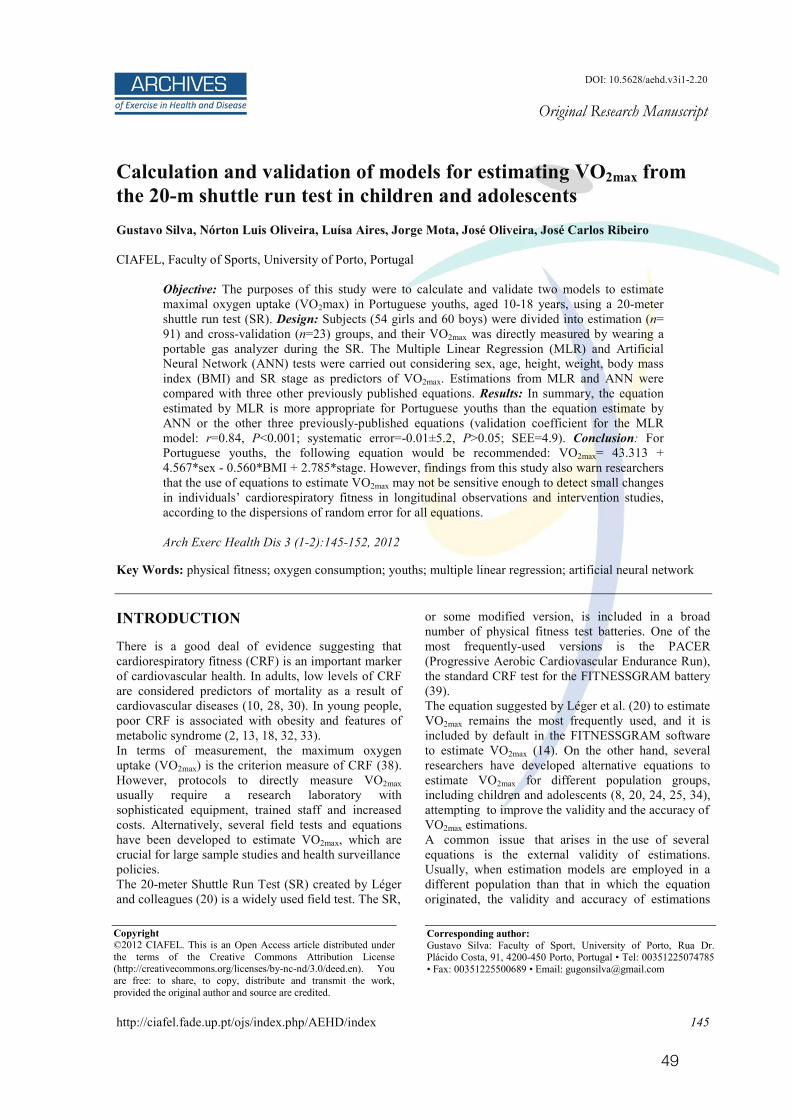
Calculation and validation of models for estimating VO2max from the 20-m shuttle run test in children and adolescents Gustavo Silva, Nórton Luis Oliveira, Luísa Aires, Jorge Mota, José Oliveira, José Carlos Ribeiro CIAFEL, Faculty of Sports, University of Porto, Portugal
Objective: The purposes of this study were to calculate and validate two models to estimate maximal oxygen uptake (VO2max) in Portuguese youths, aged 10-18 years, using a 20-meter shuttle run test (SR). Design: Subjects (54 girls and 60 boys) were divided into estimation (n= 91) and cross-validation (n=23) groups, and their VO2max was directly measured by wearing a portable gas analyzer during the SR. The Multiple Linear Regression (MLR) and Artificial Neural Network (ANN) tests were carried out considering sex, age, height, weight, body mass index (BMI) and SR stage as predictors of VO2max. Estimations from MLR and ANN were compared with three other previously published equations. Results: In summary, the equation estimated by MLR is more appropriate for Portuguese youths than the equation estimate by ANN or the other three previously-published equations (validation coefficient for the MLR model: r=0.84, P<0.001; systematic error=-0.01±5.2, P>0.05; SEE=4.9). Conclusion: For Portuguese youths, the following equation would be recommended: VO2max= 43.313 + 4.567*sex - 0.560*BMI + 2.785*stage. However, findings from this study also warn researchers that the use of equations to estimate VO2max may not be sensitive enough to detect small changes in individuals’ cardiorespiratory fitness in longitudinal observations and intervention studies, according to the dispersions of random error for all equations. Arch Exerc Health Dis 3 (1-2):145-152, 2012
Key Words: physical fitness; oxygen consumption; youths; multiple linear regression; artificial neural network INTRODUCTION There is a good deal of evidence suggesting that cardiorespiratory fitness (CRF) is an important marker of cardiovascular health. In adults, low levels of CRF are considered predictors of mortality as a result of cardiovascular diseases (10, 28, 30). In young people, poor CRF is associated with obesity and features of metabolic syndrome (2, 13, 18, 32, 33). In terms of measurement, the maximum oxygen uptake (VO2max) is the criterion measure of CRF (38). However, protocols to directly measure VO2max usually require a research laboratory with sophisticated equipment, trained staff and increased costs. Alternatively, several field tests and equations have been developed to estimate VO2max, which are crucial for large sample studies and health surveillance policies. The 20-meter Shuttle Run Test (SR) created by Léger and colleagues (20) is a widely used field test. The SR,
or some modified version, is included in a broad number of physical fitness test batteries. One of the most frequently-used versions is the PACER (Progressive Aerobic Cardiovascular Endurance Run), the standard CRF test for the FITNESSGRAM battery (39). The equation suggested by Léger et al. (20) to estimate VO2max remains the most frequently used, and it is included by default in the FITNESSGRAM software to estimate VO2max (14). On the other hand, several researchers have developed alternative equations to estimate VO2max for different population groups, including children and adolescents (8, 20, 24, 25, 34), attempting to improve the validity and the accuracy of VO2max estimations. A common issue that arises in the use of several equations is the external validity of estimations. Usually, when estimation models are employed in a different population than that in which the equation originated, the validity and accuracy of estimations
50
Validation of VO2max estimation models for children and adolescents
Arch Exerc Health Dis 3 (1-2):145-152, 2012 146
decrease (35). These limitations could be related to the variety of methodological options available to estimate and validate equations, including statistical procedures, error analysis and presence/absence of a cross-validation group. In a previous study, the validity and accuracy of five different equations were tested in Portuguese youths (35), including equations estimated by Multiple Linear Regression (8, 20, 25) and Artificial Neural Networks (34). Findings from that study suggested that more research is needed to calculate a valid and precise indicator of CRF, one that is determined from the SR in Portuguese children and adolescents. Therefore, this study aimed to estimate and validate two different models (MLR and ANN) to predict VO2max in Portuguese youths aged 10-18 years. MATERIAL AND METHODS Participants For this study, a total of 122 healthy young individuals (57 girls and 65 boys) from three schools in the District of Porto, Portugal, volunteered to participate in the study. The study was carried out following the Declaration of Helsinki guidelines for human research. The study’s purpose, nature, benefits and risks were explained to participants, parents/guardians and teachers. Informed written consent was obtained from the participants’ parents/guardians. The experimental protocol was approved by the Review Committee of the Institutional Scientific Board, as well as by the Foundation of Science and Technology from Portugal. Anthropometric Measures Height and weight were measured before testing, with participants wearing shorts and t-shirts only. Height was measured using a Holtain stadiometer (Holtain Ltd., Crymmych, UK) and recorded in centimetres to the nearest millimetre. Weight was measured to the nearest 0.1 kg with a Seca weight scale. Body mass index (BMI) was calculated by the ratio between weight and squared height (kg.m-2).
Cardiorespiratory Fitness and Physiological Measurements Participants performed the SR according to the described by FITNESSGRAM [PACER;(39)]. Briefly, the test consists in running back and forth between two lines 20 meters apart, with running speed determined by audio signals from a pre-recorded music CD. The running speed increases at the end of each one-minute stage. The running speed is 8.0 km.h-1 for the first
stage, 9.0 km.h-1 for the second stage, and thereafter increases by 0.5 km.h-1 each minute. The test ends when the subjects twice fail to reach the lines at the time indicated by the audio signals, demonstrating an inability to keep the required pace. All participants were familiar with the test, since the FITNESSGRAM test battery is included in the Portuguese Physical Education curriculum. As a result, most of the students perform the 20m Shuttle Run Test at least three or four times a year. The total number of completed laps was recorded and then transformed into stages. The last completed stage was considering the SR variable and entering it into the equations estimated by this study. All subjects underwent the SR wearing a portable gas analyser (K4b2, Cosmed, Rome, Italy) and a heart rate monitor (Polar Electro Oy, Kempele, Finland) to directly measure oxygen consumption (VO2) and heart rate (HR), respectively. The weight of the Cosmed K4b2 was 1.5 kg, including the battery and a specially designed harness. McLaughlin and colleagues (26) reported that it is a valid device when compared with the Douglas bag method. Wearing the portable gas analyser during the 20-m shuttle run test does not significantly alter participants’ energy demands (16). Respiratory variables were recorded breath-by-breath, which in turn were averaged over a 10-second period, yielding a “fair” representation of the change in VO2 during incremental exercise (6). Before each individual test, oxygen and carbon dioxide analysers were calibrated according to the manufacturer’s instructions. Directly measured VO2max or VO2peak were the main variables determined using the open-circuit method. Directly measured VO2max was considered when a plateau in the VO2 curve was detected, defined as an increase in a VO2 of less than 2 ml.kg-1.min-1 with a concomitant increase in speed stage. If a VO2 plateau was absent (15), the VO2peak was taken and defined as the highest oxygen uptake achieved during the SR at exhaustion (3). For practical reasons, from now on, this paper will refer to the highest VO2 values achieved in the SR as VO2max. Exhaustion was confirmed when: (1) subjects desired to stop or demonstrated an inability to maintain the required running pace despite strong verbal encouragement; (2) maximal heart rate was greater than 85% of age-predicted maximal heart rate (220-age); (3) the respiratory exchange ratio (RER) was greater than 1.0 at the end of the test; (4) the participants showed symptoms of discomfort and/or signs of high sweating, facial flushing and grimacing (15). Careful control was taken concerning technical and environmental variables that might have had some influence on the results, so that highly reliable metabolic measures could be obtained. The protocol for the SR was carried out in groups of 11 students at time and, for each group of 11 subjects, one student
51
Validation of VO2max estimation models for children and adolescents
147 Arch Exerc Health Dis 3 (1-2): 145-152, 2012
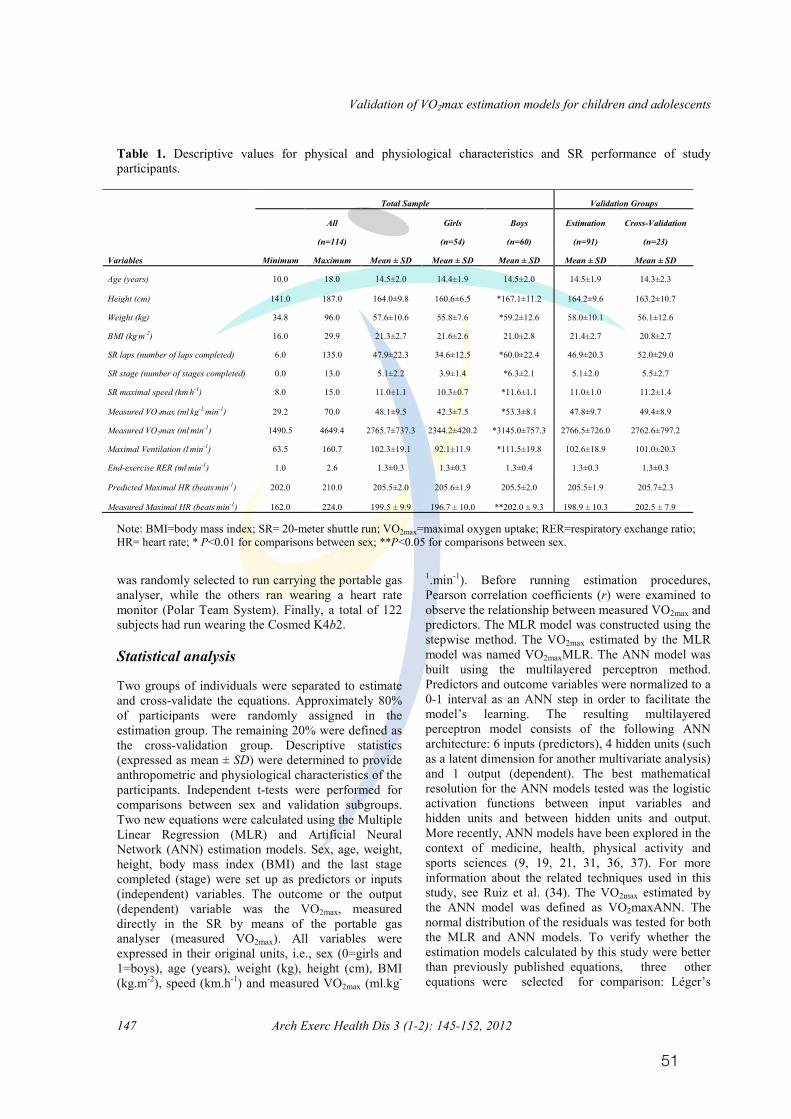
Table 1. Descriptive values for physical and physiological characteristics and SR performance of study participants.
Note: BMI=body mass index; SR= 20-meter shuttle run; VO2max=maximal oxygen uptake; RER=respiratory exchange ratio; HR= heart rate; * P<0.01 for comparisons between sex; **P<0.05 for comparisons between sex.
was randomly selected to run carrying the portable gas analyser, while the others ran wearing a heart rate monitor (Polar Team System). Finally, a total of 122 subjects had run wearing the Cosmed K4b2. Statistical analysis
Two groups of individuals were separated to estimate
and cross-validate the equations. Approximately 80% of participants were randomly assigned in the estimation group. The remaining 20% were defined as the cross-validation group. Descriptive statistics (expressed as mean ± SD) were determined to provide anthropometric and physiological characteristics of the participants. Independent t-tests were performed for comparisons between sex and validation subgroups. Two new equations were calculated using the Multiple Linear Regression (MLR) and Artificial Neural Network (ANN) estimation models. Sex, age, weight, height, body mass index (BMI) and the last stage completed (stage) were set up as predictors or inputs (independent) variables. The outcome or the output (dependent) variable was the VO2max, measured directly in the SR by means of the portable gas analyser (measured VO2max). All variables were expressed in their original units, i.e., sex (0=girls and 1=boys), age (years), weight (kg), height (cm), BMI (kg.m-2), speed (km.h-1) and measured VO2max (ml.kg-
1.min-1). Before running estimation procedures, Pearson correlation coefficients (r) were examined to observe the relationship between measured VO2max and predictors. The MLR model was constructed using the stepwise method. The VO2max estimated by the MLR model was named VO2maxMLR. The ANN model was built using the multilayered perceptron method. Predictors and outcome variables were normalized to a 0-1 interval as an ANN step in order to facilitate the model’s learning. The resulting multilayered perceptron model consists of the following ANN architecture: 6 inputs (predictors), 4 hidden units (such as a latent dimension for another multivariate analysis) and 1 output (dependent). The best mathematical resolution for the ANN models tested was the logistic activation functions between input variables and hidden units and between hidden units and output. More recently, ANN models have been explored in the context of medicine, health, physical activity and sports sciences (9, 19, 21, 31, 36, 37). For more information about the related techniques used in this study, see Ruiz et al. (34). The VO2max estimated by the ANN model was defined as VO2maxANN. The normal distribution of the residuals was tested for both the MLR and ANN models. To verify whether the estimation models calculated by this study were better than previously published equations, three other equations were selected for comparison: Léger’s
Validation of VO2max estimation models for children and adolescents
Arch Exerc Health Dis 3 (1-2):146-153, 2012 148
Table 1. Descriptive values for physical and physiological characteristics and SR performance of study participants.
Note: BMI=body mass index; SR= 20-meter shuttle run; VO2max=maximal oxygen uptake; RER=respiratory exchange ratio; HR= heart rate; * P<0.01 for comparisons between sex; **P<0.05 for comparisons between sex.
was randomly selected to run carrying the portable gas analyser, while the others ran wearing a heart rate monitor (Polar Team System). Finally, a total of 122 subjects had run wearing the Cosmed K4b2. Statistical analysis
Two groups of individuals were separated to estimate
and cross-validate the equations. Approximately 80% of participants were randomly assigned in the estimation group. The remaining 20% were defined as the cross-validation group. Descriptive statistics (expressed as mean ± SD) were determined to provide anthropometric and physiological characteristics of the participants. Independent t-tests were performed for comparisons between sex and validation subgroups. Two new equations were calculated using the Multiple Linear Regression (MLR) and Artificial Neural Network (ANN) estimation models. Sex, age, weight, height, body mass index (BMI) and the last stage completed (stage) were set up as predictors or inputs (independent) variables. The outcome or the output (dependent) variable was the VO2max, measured directly in the SR by means of the portable gas analyser (measured VO2max). All variables were expressed in their original units, i.e., sex (0=girls and 1=boys), age (years), weight (kg), height (cm), BMI (kg.m-2), speed (km.h-1) and measured VO2max
(ml.kg-1.min-1). Before running estimation procedures, Pearson correlation coefficients (r) were examined to observe the relationship between measured VO2max and predictors. The MLR model was constructed using the stepwise method. The VO2max estimated by the MLR model was named VO2maxMLR. The ANN model was built using the multilayered perceptron method. Predictors and outcome variables were normalized to a 0-1 interval as an ANN step in order to facilitate the model’s learning. The resulting multilayered perceptron model consists of the following ANN architecture: 6 inputs (predictors), 4 hidden units (such as a latent dimension for another multivariate analysis) and 1 output (dependent). The best mathematical resolution for the ANN models tested was the logistic activation functions between input variables and hidden units and between hidden units and output. More recently, ANN models have been explored in the context of medicine, health, physical activity and sports sciences (9, 19, 21, 31, 36, 37). For more information about the related techniques used in this study, see Ruiz et al. (34). The VO2max estimated by the ANN model was defined as VO2maxANN. The normal distribution of the residuals was tested for both the MLR and ANN models. To verify whether the estimation models calculated by this study were better than previously published equations, three other equations were selected for
Total Sample Validation Groups
All Girls Boys Estimation Cross-Validation
(n=114) (n=54) (n=60) (n=91) (n=23)
Variables Minimum Maximum Mean ± SD Mean ± SD Mean ± SD Mean ± SD Mean ± SD
Age (years) 10.0 18.0 14.5±2.0 14.4±1.9 14.5±2.0 14.5±1.9 14.3±2.3
Height (cm) 141.0 187.0 164.0±9.8 160.6±6.5 *167.1±11.2 164.2±9.6 163.2±10.7
Weight (kg) 34.8 96.0 57.6±10.6 55.8±7.6 *59.2±12.6 58.0±10.1 56.1±12.6
BMI (kg.m-2) 16.0 29.9 21.3±2.7 21.6±2.6 21.0±2.8 21.4±2.7 20.8±2.7
SR laps (number of laps completed) 6.0 135.0 47.9±22.3 34.6±12.5 *60.0±22.4 46.9±20.3 52.0±29.0
SR stage (number of stages completed) 0.0 13.0 5.1±2.2 3.9±1.4 *6.3±2.1 5.1±2.0 5.5±2.7
SR maximal speed (km.h-1) 8.0 15.0 11.0±1.1 10.3±0.7 *11.6±1.1 11.0±1.0 11.2±1.4
Measured VO2max (ml.kg-1.min-1) 29.2 70.0 48.1±9.5 42.3±7.5 *53.3±8.1 47.8±9.7 49.4±8.9
Measured VO2max (ml.min-1) 1490.5 4649.4 2765.7±737.3 2344.2±420.2 *3145.0±757.3 2766.5±726.0 2762.6±797.2
Maximal Ventilation (l.min-1) 63.5 160.7 102.3±19.1 92.1±11.9 *111.5±19.8 102.6±18.9 101.0±20.3
End-exercise RER (ml.min-1) 1.0 2.6 1.3±0.3 1.3±0.3 1.3±0.4 1.3±0.3 1.3±0.3
Predicted Maximal HR (beats.min-1) 202.0 210.0 205.5±2.0 205.6±1.9 205.5±2.0 205.5±1.9 205.7±2.3
Measured Maximal HR (beats.min-1) 162.0 224.0 199.5 ± 9.9 196.7 ± 10.0 **202.0 ± 9.3 198.9 ± 10.3 202.5 ± 7.9 !
52
Validation of VO2max estimation models for children and adolescents
Arch Exerc Health Dis 3 (1-2):145-152, 2012 148
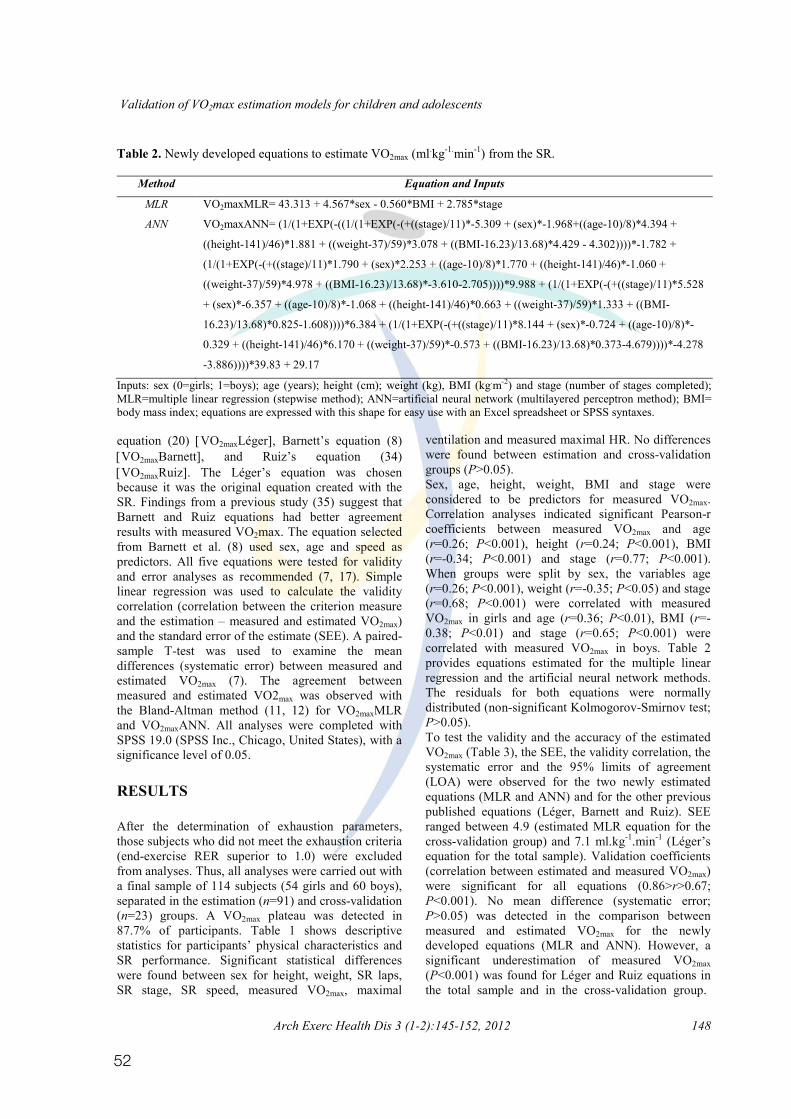
Table 2. Newly developed equations to estimate VO2max (ml.kg-1.min-1) from the SR.
Method Equation and Inputs
MLR VO2maxMLR= 43.313 + 4.567*sex - 0.560*BMI + 2.785*stage
ANN VO2maxANN= (1/(1+EXP(-((1/(1+EXP(-(+((stage)/11)*-5.309 + (sex)*-1.968+((age-10)/8)*4.394 +
((height-141)/46)*1.881 + ((weight-37)/59)*3.078 + ((BMI-16.23)/13.68)*4.429 - 4.302))))*-1.782 +
(1/(1+EXP(-(+((stage)/11)*1.790 + (sex)*2.253 + ((age-10)/8)*1.770 + ((height-141)/46)*-1.060 +
((weight-37)/59)*4.978 + ((BMI-16.23)/13.68)*-3.610-2.705))))*9.988 + (1/(1+EXP(-(+((stage)/11)*5.528
+ (sex)*-6.357 + ((age-10)/8)*-1.068 + ((height-141)/46)*0.663 + ((weight-37)/59)*1.333 + ((BMI-
16.23)/13.68)*0.825-1.608))))*6.384 + (1/(1+EXP(-(+((stage)/11)*8.144 + (sex)*-0.724 + ((age-10)/8)*-
0.329 + ((height-141)/46)*6.170 + ((weight-37)/59)*-0.573 + ((BMI-16.23)/13.68)*0.373-4.679))))*-4.278
-3.886))))*39.83 + 29.17
Inputs: sex (0=girls; 1=boys); age (years); height (cm); weight (kg), BMI (kg.m-2) and stage (number of stages completed); MLR=multiple linear regression (stepwise method); ANN=artificial neural network (multilayered perceptron method); BMI= body mass index; equations are expressed with this shape for easy use with an Excel spreadsheet or SPSS syntaxes. equation (20) �VO2maxLéger�, Barnett’s equation (8) �VO2maxBarnett�, and Ruiz’s equation (34) �VO2maxRuiz�. The Léger’s equation was chosen because it was the original equation created with the SR. Findings from a previous study (35) suggest that Barnett and Ruiz equations had better agreement results with measured VO2max. The equation selected from Barnett et al. (8) used sex, age and speed as predictors. All five equations were tested for validity and error analyses as recommended (7, 17). Simple linear regression was used to calculate the validity correlation (correlation between the criterion measure and the estimation – measured and estimated VO2max) and the standard error of the estimate (SEE). A paired-sample T-test was used to examine the mean differences (systematic error) between measured and estimated VO2max (7). The agreement between measured and estimated VO2max was observed with the Bland-Altman method (11, 12) for VO2maxMLR and VO2maxANN. All analyses were completed with SPSS 19.0 (SPSS Inc., Chicago, United States), with a significance level of 0.05.
RESULTS
After the determination of exhaustion parameters, those subjects who did not meet the exhaustion criteria (end-exercise RER superior to 1.0) were excluded from analyses. Thus, all analyses were carried out with a final sample of 114 subjects (54 girls and 60 boys), separated in the estimation (n=91) and cross-validation (n=23) groups. A VO2max plateau was detected in 87.7% of participants. Table 1 shows descriptive statistics for participants’ physical characteristics and SR performance. Significant statistical differences were found between sex for height, weight, SR laps, SR stage, SR speed, measured VO2max, maximal
ventilation and measured maximal HR. No differences were found between estimation and cross-validation groups (P>0.05).
Sex, age, height, weight, BMI and stage were considered to be predictors for measured VO2max. Correlation analyses indicated significant Pearson-r coefficients between measured VO2max and age (r=0.26; P<0.001), height (r=0.24; P<0.001), BMI (r=-0.34; P<0.001) and stage (r=0.77; P<0.001). When groups were split by sex, the variables age (r=0.26; P<0.001), weight (r=-0.35; P<0.05) and stage (r=0.68; P<0.001) were correlated with measured VO2max in girls and age (r=0.36; P<0.01), BMI (r=-0.38; P<0.01) and stage (r=0.65; P<0.001) were correlated with measured VO2max in boys. Table 2 provides equations estimated for the multiple linear regression and the artificial neural network methods. The residuals for both equations were normally distributed (non-significant Kolmogorov-Smirnov test; P>0.05).
To test the validity and the accuracy of the estimated VO2max (Table 3), the SEE, the validity correlation, the systematic error and the 95% limits of agreement (LOA) were observed for the two newly estimated equations (MLR and ANN) and for the other previous published equations (Léger, Barnett and Ruiz). SEE ranged between 4.9 (estimated MLR equation for the cross-validation group) and 7.1 ml.kg-1.min-1 (Léger’s equation for the total sample). Validation coefficients (correlation between estimated and measured VO2max) were significant for all equations (0.86>r>0.67; P<0.001). No mean difference (systematic error; P>0.05) was detected in the comparison between measured and estimated VO2max for the newly developed equations (MLR and ANN). However, a significant underestimation of measured VO2max (P<0.001) was found for Léger and Ruiz equations in the total sample and in the cross-validation group.
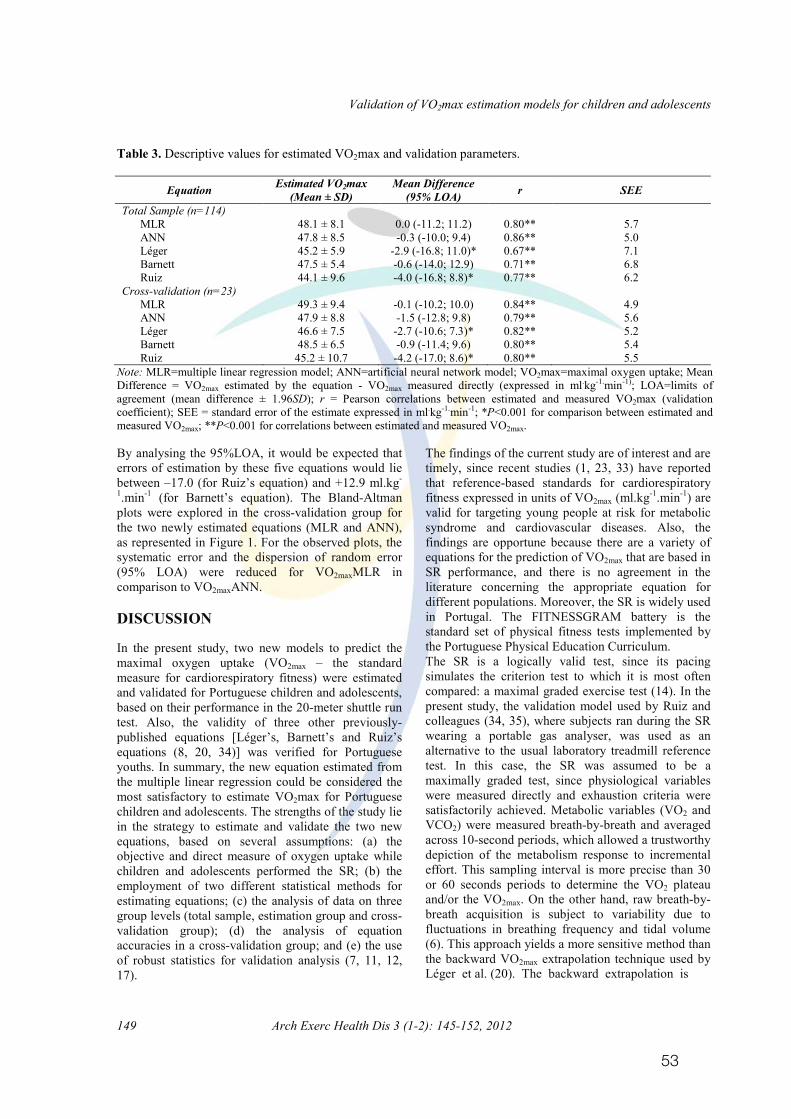
53
Validation of VO2max estimation models for children and adolescents
149 Arch Exerc Health Dis 3 (1-2): 145-152, 2012
Table 3. Descriptive values for estimated VO2max and validation parameters.
Equation Estimated VO2max (Mean ± SD)
Mean Difference (95% LOA) r SEE
Total Sample (n=114) MLR 48.1 ± 8.1 0.0 (-11.2; 11.2) 0.80** 5.7 ANN 47.8 ± 8.5 -0.3 (-10.0; 9.4) 0.86** 5.0 Léger 45.2 ± 5.9 -2.9 (-16.8; 11.0)* 0.67** 7.1 Barnett 47.5 ± 5.4 -0.6 (-14.0; 12.9) 0.71** 6.8 Ruiz 44.1 ± 9.6 -4.0 (-16.8; 8.8)* 0.77** 6.2
Cross-validation (n=23) MLR 49.3 ± 9.4 -0.1 (-10.2; 10.0) 0.84** 4.9 ANN 47.9 ± 8.8 -1.5 (-12.8; 9.8) 0.79** 5.6 Léger 46.6 ± 7.5 -2.7 (-10.6; 7.3)* 0.82** 5.2 Barnett 48.5 ± 6.5 -0.9 (-11.4; 9.6) 0.80** 5.4 Ruiz 45.2 ± 10.7 -4.2 (-17.0; 8.6)* 0.80** 5.5
Note: MLR=multiple linear regression model; ANN=artificial neural network model; VO2max=maximal oxygen uptake; Mean Difference = VO2max estimated by the equation - VO2max measured directly (expressed in ml.kg-1.min-1); LOA=limits of agreement (mean difference ± 1.96SD); r = Pearson correlations between estimated and measured VO2max (validation coefficient); SEE = standard error of the estimate expressed in ml.kg-1.min-1; *P<0.001 for comparison between estimated and measured VO2max; **P<0.001 for correlations between estimated and measured VO2max.
By analysing the 95%LOA, it would be expected that errors of estimation by these five equations would lie between –17.0 (for Ruiz’s equation) and +12.9 ml.kg-
1.min-1 (for Barnett’s equation). The Bland-Altman plots were explored in the cross-validation group for the two newly estimated equations (MLR and ANN), as represented in Figure 1. For the observed plots, the systematic error and the dispersion of random error (95% LOA) were reduced for VO2maxMLR in comparison to VO2maxANN. DISCUSSION In the present study, two new models to predict the maximal oxygen uptake (VO2max – the standard measure for cardiorespiratory fitness) were estimated and validated for Portuguese children and adolescents, based on their performance in the 20-meter shuttle run test. Also, the validity of three other previously-published equations [Léger’s, Barnett’s and Ruiz’s equations (8, 20, 34)] was verified for Portuguese youths. In summary, the new equation estimated from the multiple linear regression could be considered the most satisfactory to estimate VO2max for Portuguese children and adolescents. The strengths of the study lie in the strategy to estimate and validate the two new equations, based on several assumptions: (a) the objective and direct measure of oxygen uptake while children and adolescents performed the SR; (b) the employment of two different statistical methods for estimating equations; (c) the analysis of data on three group levels (total sample, estimation group and cross-validation group); (d) the analysis of equation accuracies in a cross-validation group; and (e) the use of robust statistics for validation analysis (7, 11, 12, 17).
The findings of the current study are of interest and are timely, since recent studies (1, 23, 33) have reported that reference-based standards for cardiorespiratory fitness expressed in units of VO2max (ml.kg-1.min-1) are valid for targeting young people at risk for metabolic syndrome and cardiovascular diseases. Also, the findings are opportune because there are a variety of equations for the prediction of VO2max that are based in SR performance, and there is no agreement in the literature concerning the appropriate equation for different populations. Moreover, the SR is widely used in Portugal. The FITNESSGRAM battery is the standard set of physical fitness tests implemented by the Portuguese Physical Education Curriculum.
The SR is a logically valid test, since its pacing simulates the criterion test to which it is most often compared: a maximal graded exercise test (14). In the present study, the validation model used by Ruiz and colleagues (34, 35), where subjects ran during the SR wearing a portable gas analyser, was used as an alternative to the usual laboratory treadmill reference test. In this case, the SR was assumed to be a maximally graded test, since physiological variables were measured directly and exhaustion criteria were satisfactorily achieved. Metabolic variables (VO2 and VCO2) were measured breath-by-breath and averaged across 10-second periods, which allowed a trustworthy depiction of the metabolism response to incremental effort. This sampling interval is more precise than 30 or 60 seconds periods to determine the VO2 plateau and/or the VO2max. On the other hand, raw breath-by-breath acquisition is subject to variability due to fluctuations in breathing frequency and tidal volume (6). This approach yields a more sensitive method than the backward VO2max extrapolation technique used by Léger et al. (20). The backward extrapolation is
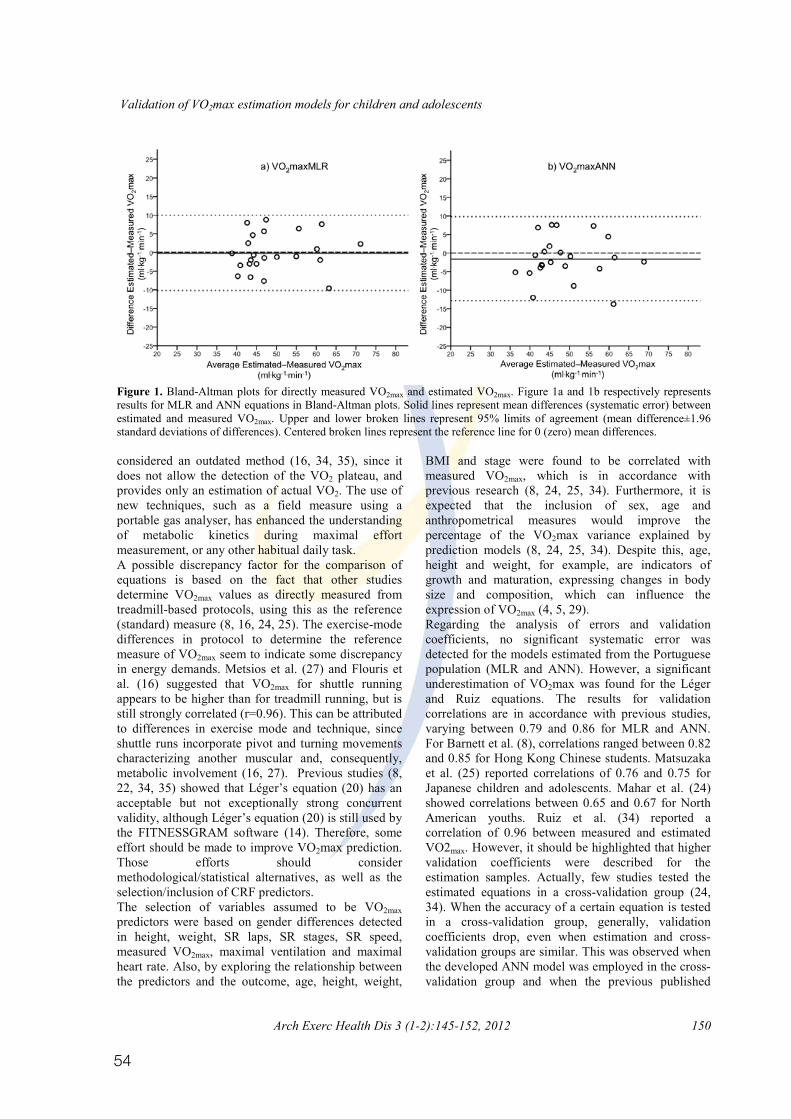
54
Validation of VO2max estimation models for children and adolescents
Arch Exerc Health Dis 3 (1-2):145-152, 2012 150
Figure 1. Bland-Altman plots for directly measured VO2max and estimated VO2max. Figure 1a and 1b respectively represents results for MLR and ANN equations in Bland-Altman plots. Solid lines represent mean differences (systematic error) between estimated and measured VO2max. Upper and lower broken lines represent 95% limits of agreement (mean difference±1.96 standard deviations of differences). Centered broken lines represent the reference line for 0 (zero) mean differences.
considered an outdated method (16, 34, 35), since it does not allow the detection of the VO2 plateau, and provides only an estimation of actual VO2. The use of new techniques, such as a field measure using a portable gas analyser, has enhanced the understanding of metabolic kinetics during maximal effort measurement, or any other habitual daily task.
A possible discrepancy factor for the comparison of equations is based on the fact that other studies determine VO2max values as directly measured from treadmill-based protocols, using this as the reference (standard) measure (8, 16, 24, 25). The exercise-mode differences in protocol to determine the reference measure of VO2max seem to indicate some discrepancy in energy demands. Metsios et al. (27) and Flouris et al. (16) suggested that VO2max for shuttle running appears to be higher than for treadmill running, but is still strongly correlated (r=0.96). This can be attributed to differences in exercise mode and technique, since shuttle runs incorporate pivot and turning movements characterizing another muscular and, consequently, metabolic involvement (16, 27). Previous studies (8, 22, 34, 35) showed that Léger’s equation (20) has an acceptable but not exceptionally strong concurrent validity, although Léger’s equation (20) is still used by the FITNESSGRAM software (14). Therefore, some effort should be made to improve VO2max prediction. Those efforts should consider methodological/statistical alternatives, as well as the selection/inclusion of CRF predictors. The selection of variables assumed to be VO2max predictors were based on gender differences detected in height, weight, SR laps, SR stages, SR speed, measured VO2max, maximal ventilation and maximal heart rate. Also, by exploring the relationship between the predictors and the outcome, age, height, weight,
BMI and stage were found to be correlated with measured VO2max, which is in accordance with previous research (8, 24, 25, 34). Furthermore, it is expected that the inclusion of sex, age and anthropometrical measures would improve the percentage of the VO2max variance explained by prediction models (8, 24, 25, 34). Despite this, age, height and weight, for example, are indicators of growth and maturation, expressing changes in body size and composition, which can influence the expression of VO2max (4, 5, 29). Regarding the analysis of errors and validation coefficients, no significant systematic error was detected for the models estimated from the Portuguese population (MLR and ANN). However, a significant underestimation of VO2max was found for the Léger and Ruiz equations. The results for validation correlations are in accordance with previous studies, varying between 0.79 and 0.86 for MLR and ANN. For Barnett et al. (8), correlations ranged between 0.82 and 0.85 for Hong Kong Chinese students. Matsuzaka et al. (25) reported correlations of 0.76 and 0.75 for Japanese children and adolescents. Mahar et al. (24) showed correlations between 0.65 and 0.67 for North American youths. Ruiz et al. (34) reported a correlation of 0.96 between measured and estimated VO2max. However, it should be highlighted that higher validation coefficients were described for the estimation samples. Actually, few studies tested the estimated equations in a cross-validation group (24, 34). When the accuracy of a certain equation is tested in a cross-validation group, generally, validation coefficients drop, even when estimation and cross-validation groups are similar. This was observed when the developed ANN model was employed in the cross-validation group and when the previous published
55
Validation of VO2max estimation models for children and adolescents
151 Arch Exerc Health Dis 3 (1-2): 145-152, 2012
equations were tested in the total sample of the present study, corroborating with findings from a previous study (35). The only exception for this behaviour was observed in the present findings for the developed MLR equation, which obtained improved validation values in the cross-validation group. In the search for an estimation model that better predicts VO2max for Portuguese youths, MLR and ANN were calculated. While MLR models are common and easier to understand, ANN models are more complex and characterized by a “black box” nature (34). By this complexity, it would be expected that the explained variance and the SEE for ANN models would be more satisfactory. Indeed, this is only for the estimation group. When ANN models are utilized in a different group of individuals, like the cross-validation sample, validation parameters are more favourable to the use of the MLR model, as suggested by these results. Also, the stepwise method used in the MLR model reduces the presence of some co-linearity between predictors, which is not an option for ANN models. Based on the mathematical law of parsimony, since the more complex model achieves no substantial improvement, it is more appropriate to choose the simplest one. When comparing the estimations between MLR and ANN models, no statistical differences were detected.
The findings from the present study should be considered together with some limitations. The equations estimated by this study were calculated and validated for the Portuguese population. Further research should be done to explore the accuracy of these equations in other populations. Moreover, it should be considered that other variables could be included and analysed as potential predictors. The maturation status, for example, could eventually contribute to the understanding of the variation of VO2max, as well as the predictors, over the growth and development process. Eventually, physical activity levels could also be included in the analyses. Unfortunately, the lack of this information does not allow exploration of whether the estimation models would behave in a different way if maturation status and physical activity levels were accounted for. The results also point to a substantial dispersion of random error (95%LOA), existing in all equations. Researchers should consider the possibility of biased results when the analysis requires more sensitive differential data, as required in longitudinal and intervention studies, for example, where SR assessed CRF. If that was the case, maybe a raw result from the SR, such as the number of completed laps or stages, could be more sensitive for detecting small but significant changes in CRF. However, for prospective studies, the clinical value of reference standards for of VO2max standards for the discrimination of children SR laps is not known. On the other hand, the accuracy
and adolescents at high and low cardio-metabolic risk had already been described (1, 23, 33). Also, FITNESSGRAM Reference Standards for the number of laps were arbitrarily determined by inverting the equation from Léger for VO2max reference standards (14). From the perspective of future research, it would be useful to verify whether the raw value of the SR performance could determine a cut-off that could indicate subjects with a poor cardio-metabolic profile. In conclusion, the model estimated from the multiple linear regression in the current study would be recommended for estimating the maximal oxygen uptake in Portuguese children and adolescents, as suggested by analyses of systematic error, validation coefficients and the standard error of the estimates, especially in the cross-validation group. However, users should be aware that the equations to estimate VO2max could not be sensitive enough to detect small changes in individuals’ CRF in longitudinal observations and intervention studies, according to the dispersions of random error. ACKNOWLEDGEMENTS The Foundation of Science and Technology (FCT) supported this study with a PhD grant (SFRH/BD/45090/2008) and a research project (PTDC/DES/72424/2006). REFERENCES 1. Adegboye AR, Anderssen SA, Froberg K, Sardinha LB,
Heitmann BL, Steene-Johannessen J, Kolle E, and Andersen LB. Recommended aerobic fitness level for metabolic health in children and adolescents: a study of diagnostic accuracy. Br J Sports Med 2010;45:722-728.
2. Andersen LB, Hasselstrøm H, Grønfeldt V, Hansen SE, and Karsten F. The relationship between physical fitness and clustered risk, and tracking of clustered risk from adolescence to young adulthood: eight years follow-up in the Danish Youth and Sport Study. Int J Behav Nutr Phys Act 2004;1: 6.
3. Armstrong N and Welsman J. Aerobic fitness: What are we measuring? Med Sports Sci 2007;50: 5-25.
4. Armstrong N and Welsman JR. Development of aerobic fitness during childhood and adolescence. Pediatr Exerc Sci 2000;12: 128-149.
5. Armstrong N and Welsman JR. Peak oxygen uptake in relation to growth and maturation in 11- to 17-year-old humans. Eur J Appl Physiol 2001;85: 546-551.
6. Astorino TA. Alterations in VO2max and the VO2 plateau with manipulation of sampling interval. Clin Physiol Funct Imaging 2009;29:60-67.
7. Atkinson G and Nevill AM. Statistical methods for assessing measurement error (reliability) in variables relevant to sports medicine. Sports Med 1998;26:217-238.
8. Barnett A, Chan LYS, and Bruce IC. A preliminary study of the 20-m multistage shuttle run as a predictor of peak VO2 in Hong Kong Chinese students. Pediatr Exerc Sci 1993;5: 42-50.
9. Baxt WG. Application of artificial neural networks to clinical medicine. Lancet 1995;346:1135-1138.
10. Blair SN, Kohl HW, 3rd, Paffenbarger RS, Jr., Clark DG, Cooper KH, and Gibbons LW. Physical fitness and all-cause mortality. A prospective study of healthy men and women. JAMA 1989;262:2395-2401.
11. Bland JM and Altman DG. Comparing methods of measurement: Why plotting difference against standard method is misleading. Lancet 1995;346:1085-1087.
56
Validation of VO2max estimation models for children and adolescents
Arch Exerc Health Dis 3 (1-2):145-152, 2012 152
12. Bland JM and Altman DG. Statistical methods for assessing agreement between two methods of clinical measurement. Lancet 1986;1:307-310.
13. Brage S, Wedderkopp N, Ekelund U, Franks PW, Wareham NJ, Andersen LB, and Froberg K. Features of the metabolic syndrome are associated with objectively measured physical activity and fitness in Danish children: The European Youth Heart Study (EYHS). Diabetes Care 2004;27:2141-2148.
14. Cureton KJ and Plowman SA. Aerobic capacity assessments. In: FITNESSGRAM Reference Guide (3rd ed.), edited by Welk GJ and Meredith MD. Dallas, TX: The Cooper Institute, 2008, p. 96-120.
15. Docherty D. Measurement in pediatric exercise science. Champaign, IL: Human Kinetics, 1996.
16. Flouris AD, Metsios GS, and Koutedakis Y. Enhancing the efficacy of the 20 m multistage shuttle run test. Br J Sports Med 2005;39: 66-170.
17. Hopkins WG, Marshall SW, Batterham AM, and Hanin J. Progressive statistics for studies in sports medicine and exercise science. Med Sci Sports Exerc 2009;41:3-13.
18. Hürtig-Wennlöf A, Ruiz JR, Harro M, and Sjöström M. Cardiorespiratory fitness relates more strongly than physical activity to cardiovascular disease risk factors in healthy children and adolescents: The European Youth Heart Study. Eur J Cardiovasc Prev Rehabil 2007;14:575-581.
19. Itchhaporia D, Snow PB, Almassy RJ, and Oetgen WJ. Artificial neural networks: Current status in cardiovascular medicine. J Am Coll Cardiol 1996;28: 515-521.
20. Léger LA, Mercier D, Gadoury C, and Lambert J. The multistage 20 metre shuttle run test for aerobic fitness. J Sports Sci 1988;6:93-101.
21. Linder R, Mohamed EI, De Lorenzo A, and Pöppl SJ. The capabilities of artificial neural networks in body composition research. Acta Diabetologica 2003;40: S9-S14.
22. Liu NY, Plowman SA, and Looney MA. The reliability and validity of the 20-meter shuttle test in American students 12 to 15 years old. Res Q Exerc Sport 1992;63:360-365.
23. Lobelo F, Pate RR, Dowda M, Liese AD, and Ruiz JR. Validity of cardiorespiratory fitness criterion-referenced standards for adolescents. Med Sci Sports Exerc 2009;41: 1222-1229.
24. Mahar MT, Welk GJ, Rowe DA, Crotts DJ, and McIver KL. Development and Validation of a Regression Model to Estimate VO2peak From PACER 20-m Shuttle Run Performance. J Phys Act Health 2006; S34-S46.
25. Matsuzaka A, Takahashi Y, Yamazoe M, Kumakura N, Ikeda A, Wilk B, and Bar-Or O. Validity of the multistage 20-m shuttle-run test for Japanese children, adolescents, and adults. Pediatr Exerc Sci 2004;16:113-125.
26. McLaughlin JE, King GA, Howley ET, Bassett Jr DR, and Ainsworth BE. Validation of the COSMED K4 b2 portable metabolic system. Int J Sports Med 2001;22:280-284.
27. Metsios GS, Flouris AD, Koutedakis Y, and Nevill A. Criterion-related validity and test-retest reliability of the 20m square shuttle test. J Sci Med Sport 2008;11:214-217.
28. Mora S, Redberg RF, Cui Y, Whiteman MK, Flaws JA, Sharrett AR, and Blumenthal RS. Ability of exercise testing to predict cardiovascular and all-cause death in asymptomatic women: a 20-year follow-up of the lipid research clinics prevalence study. JAMA 2003;290:1600-1607.
29. Mota J, Guerra S, Leandro C, Pinto A, Ribeiro JC, and Duarte JA. Association of maturation, sex, and body fat in cardiorespiratory fitness. Am J Hum Biol 2002;14: 707-712.
30. Myers J, Prakash M, Froelicher V, Do D, Partington S, and Atwood JE. Exercise capacity and mortality among men referred for exercise testing. N Engl J Med 2002;346:793-801.
31. Ravé JMG and Prieto JAA. Potential challenges in physical education through the knowledge of Artificial Neural Networks. Journal of Human Movement Studies 2003;45:81-96.
32. Ribeiro JC, Guerra S, Oliveira J, Teixeira-Pinto A, Twisk JWR, Duarte JA, and Mota J. Physical activity and biological risk factors clustering in pediatric population. Prev Med 2004;39:596-60.
33. Ruiz JR, Ortega FB, Rizzo NS, Villa I, Hürtig-Wennlöf A, Oja L, and Sjöström M. High cardiovascular fitness is associated with low metabolic risk score in children: The European Youth Heart Study. Pediatr Res 2007;61:350-355.
34. Ruiz JR, Ramirez-Lechuga J, Ortega F, Castro-Pinero J, Benitez JM, Arauzo-Azofra A, Sanchez C, Sjöström M, Castillo M, Gutierrez A, and Zabala M. Artificial neural network-based equation for estimating VO2max from the 20 m shuttle run test in adolescents. Artif Intell Med 2008;44:233-245.
35. Ruiz JR, Silva G, Oliveira N, Ribeiro J, Oliveira J, and Mota J. Criterion-related validity of the 20-m shuttle run test in youths aged 13-19 years. J Sports Sci 2009;27:899-906.
36. ������� ������������� ������ ����� �� ��� �� ����� ������������training loads. Annual International Conference of the IEEE Engineering in Medicine and Biology - Proceedings, Shanghai, 2005, p. 2985-2988.
37. Staudenmayer J, Pober D, Crouter S, Bassett D, and Freedson P. An artificial neural network to estimate physical activity energy expenditure and identify physical activity type from an accelerometer. J Appl Physiol 2009;107:1300-1307.
38. Taylor HL, Buskirk E, and Henschel A. Maximal oxygen intake as an objective measure of cardiorespiratory performance. J Appl Physiol 1955;8:73-80.
39. The Cooper Institute for Aerobics Research. Fitnessgram & Activitygram Test Administration Manual. Champaign, Illinois, USA: Human Kinetics, 2010.
57
Study I I
PUBLISHED
Silva, G., Aires, L., Mota, J., Oliveira, J., Ribeiro, J.C.
Normative and criter ion-related standards for shutt le run
performance in youth
Pediatric Exercise Science
Volume 3, Issue 1-2, Pages 145-152, (2012)

58
59
157
Pediatric Exercise Science, 2012, 24, 157-169 © 2012 Human Kinetics, Inc.
ORIGINAL RESEARCH
Silva et al. are with the Research Centre in Physical Activity, Health and Leisure, Faculty of Sport, University of Porto, Porto, Portugal.
Normative and Criterion-Related Standards for Shuttle Run Performance
in Youth
Gustavo Silva, Luísa Aires, Jorge Mota, José Oliveira, and José Carlos Ribeiro
University of Porto
The purpose of this study was to calculate and validate reference standards for the 20-m shuttle run test (SR) in youths aged 10–18 years. Reference standards based on the number of completed SR laps were calculated by LMS method in a reference group of 5559 students. Cut-off values for SR laps were determined and tested by ROC curve analysis in a validation group (633 students), from which waist circumference, HDL-cholesterol, triglycerides, fasting glucose and mean arterial pressure were assessed to calculate a metabolic risk score, later dichotomized in low and high metabolic risk (HMRS). The accuracy of SR laps standards was significant for girls (AUC = 0.66; 95% CI = 0.58–0.74; p < .001) and boys (AUC = 0.71; 95% CI = 0.62–0.79; p < .001) for identifying subjects at HMRS. The 40th percentile was the best cut-off for SR laps in girls (SENS = 0.569; 1-SPEC = 0.330) and boys (SENS = 0.634; 1-SPEC = 0.266). New SR laps reference standards are able to discriminate metabolic risk levels, and may provide a valuable tool for early prevention of cardiovascular risk factors.
It is well established that lower cardiorespiratory fitness (CRF) relates to poor cardio-metabolic conditions, being also a predictor of mortality and morbidity by cardiovascular diseases (CVD) and diabetes mellitus in adults (7,39). In youth, CRF might have a health protective effect since it has been inversely associated with body fat (4), features of the metabolic syndrome (8), and arterial compliance (27). Therefore, CRF evaluation is paramount to identify subjects at risk or monitoring adverse health outcomes (28–30).
The best indicator for CRF is the maximal oxygen uptake (VO2max; 34). By establishing VO2max values to discriminate young people at high and low of cardio-metabolic risk, CRF reference standards were validated (1,23,30). However, the methods for direct assessment of VO2max usually require a laboratory with sophis-ticated equipment, trained staff and increased costs (33). Alternatively, VO2max can be estimated from the performance achieved in laboratory or field tests by using validated equations (17,20,21,31). On the other hand, those equations showed bias
60
158 Silva et al.
and increased random error (33), especially for subjects in extreme (low) perfor-mance values, potentially leading to misclassification of the CRF and metabolic risk levels. Thus, when using submaximal or field tests it would be interesting that the raw data of the performance objectively measured (i.e., power output, stage, number of shuttles or achieved distance) could be used as a reference standard to classify the CRF levels and to identify the individual’s clinical metabolic risk status.
The 20-m Shuttle Run Test (SR) created by Léger et al. (21) is a widely used field test. The SR, or some adapted version of it, is part of several fitness tests bat-teries, like FITNESSGRAM (35). However, reference standards for CRF expressed in SR laps developed by FITNESSGRAM were calculated by regressing VO2max values associated to the risk of CVD or all-cause mortality in adults (7,13). Thus, the clinical validity of SR laps reference standards for discriminating youths with poor cardio-metabolic profiles is not known. Therefore, the purpose of the current study was to calculate population-based reference standards for SR laps in children and adolescents, and validate their clinical value in the screening of subjects with high metabolic risk.
Methods
SubjectsA total of 6192 students (3131 girls and 3031 boys) aged 10–18 years from two districts from the North of Portugal participated in this study. Participants were further divided into two groups, reference group [5559 students (2789 girls and 2770 boys)] and validation group [633 students (372 girls and 261 boys)], to calculate and validate new CRF reference standards. The study was carried out following the guidelines for Human research from the Declaration of Helsinki. The study’s purpose, nature, benefits, risks and discomforts were explained to participants, parents/guardians and teachers before running the study. Informed written consent was obtained from all participants’ parents/guardians. The institutional research review board approved the study.
Anthropometric MeasurementsBody mass and height were measured following standard procedures (24). Body height was measured to the nearest mm in bare or stocking feet with adolescents’ standing upright against a stadiometer (Holtain Ltd.—Crymmych, Pembrokeshire, UK). Weight was measured to the nearest 0.10kg, with students lightly dressed, using an electronic weight scale (Tanita Inner Scan BC 532; Tanita Corporation—Tokyo, Japan). Body mass index (BMI) was calculated from the ratio of body weight (kg)/body height (m2). Waist circumference (WC) was measured to the nearest mm with a metallic tape at the superior border of the iliac crest, according to a previously described protocol (36).
Cardiovascular Disease Risk FactorsSystolic (SBP) and diastolic (DBP) blood pressures were measured using the Colin Press Mate Non-Invasive Blood Pressure Monitor (model BP 8800p; Colin Medi-
61
Shuttle Run Performance Standards in Youth 159
cal Instruments Corporation—San Antonio, TX, USA). A trained technician took measurements. Two measurements were taken from children in seating position after five and ten minutes rest. The mean of these two measurements was used for further data analysis. Mean arterial pressure (MAP) was calculated as: MAP = [(SBP-DBP)/3]+DBP.
After 12–14 hr of fasting, capillary whole blood samples were collected from the earlobe using a 35-μl lithium heparin-coated capillary tube and immediately assayed using the Cholestech LDX Analyzer (Cholestech Corporation—Hayward, CA, USA) for determination of serum total cholesterol (TC), high-density lipopro-tein cholesterol (HDL-C), triglycerides (TRIG) and fasting glucose (GLU) levels. Low-density lipoprotein cholesterol (LDL-C) was estimated by the equation: LDL-C = TC—HDL-C—(0.20 x TRIG) (15).
A continuous metabolic risk score (MRS) was calculated from WC, HDL-C, TRIG, GLU and MAP. For each variable, standardized scores (Z-scores) were cal-culated according to age and sex. HDL-C Z-score was multiplied by -1 to indicate higher metabolic risk with increasing value. MRS was calculated as the average of the five standardized variables. A lower MRS was indicative of a better overall metabolic profile. MRS was later dichotomized, whereas values above mean plus 1 standard deviation for MRS were classified at high metabolic risk (HMRS). Values under this cut-off were considered at low metabolic risk (LMRS).
Cardiorespiratory FitnessParticipants performed the SR according to protocol describe by FITNESSGRAM [the adapted version of SR: the Progressive Aerobic Cardiovascular Endurance Run—PACER] (35). Briefly, the test consists in running back and forth between two lines 20 m apart, with running speed determined by audio signals from a prere-corded music CD. The running speed increases in the end of each one-minute stage. The running speed is 8.0 km·h-1 for the first stage, 9.0 km·h-1 for the second stage and thereafter increases by 0.5 km·h-1 each minute. The test ends when subjects fails twice the audio signals to reach the lines, demonstrating inability to keep the required pace. All participants were familiar with the test, since the FITNESS-GRAM test battery is included in the Portuguese Physical Education curriculum. Total number of completed shuttles (SR laps) was recorded and considered as the main representative parameter of CRF level.
Data AnalysisDescriptive data are presented as mean and standard deviation (M± SD) and One-Way ANOVA was used to identify differences between groups.
Normative data were calculated for the reference group using the LMS method in a similar approach to that used for establishing nutritional standards for BMI (10). The LMS method basically calculates smoothed developmental curves for parameters M (median), S (coefficient of variation) and L (Box-Cox power for skewness), for a common age units X-axis. Using penalized likelihood, each one of L, M and S curves can be fitted by polynomials as cubic splines by nonlinear regression. Having these three parameters in each age point, it is possible to calcu-late the number of SR laps equivalent to any percentile (9,11,12). Based on these
62
160 Silva et al.
previously described procedures, normative data for SR laps by age and sex were calculated for the following percentiles: 10th, 20th, 30th, 40th, 50th, 60th, 70th, 80th and 90th. Subjects from the validation group were classified from 0 to 9 according to the corresponding percentile in SR laps (SRrank) for age and sex references.
To determine which SR laps decile could be the best cut-off value to dis-criminate subjects at HMRS and LMRS, ROC curve analysis was done considering SRrank, the test variable, and HMRS/LMRS, the state variable. The area under curves (AUC) and its respective 95% confidence interval (95% CI) were observed indicating the overall ability of using SR laps deciles for targeting HMRS. For each decile, sensitivity (SENS), specificity (SPEC), 1-SPEC and efficiency (EFF) were observed to examine the accuracy of the cut-off value as a diagnostic parameter. SENS is the proportion of subjects at HMRS with less SR laps than the decile used to discriminate HMRS/LMRS (true-positives). SPEC represents the proportion of LMRS with SR laps equal or greater than the decile used to discriminate HMRS/LMRS (true-negatives), and 1-SPEC is the proportion of LMRS smaller than the decile used to discriminate HMRS/LMRS (false-positives). EFF, calculated as EFF=(SENS+SPEC)/2, represents the overall performance of a particular cut-off value and higher values indicates higher EFF for the cut-off. The SR decile for each sex and age group with the highest EFF was established as the best cut-off.
Furthermore, logistic regression was used to describe the risk of being at HMRS for those subjects classified as low fit (under the best cut-off value) in comparison with those classified as fit (equal or above the cut-off). Results are shown in odds ratio (OR) and respective 95% confidence intervals.
All analyses were completed with LMS Chart Maker Light, version 2.3, Microsoft Excel 2007 and PASW version 18.0, with a significance level of 0.05.
ResultsCharacteristics of subjects separated by sex and group are presented in Table 1. Differences were found between reference and validation groups for height, weight, BMI and WC, with higher values for the validation group in girls. For boys, validation group had higher values for height and SR laps. Differences between sexes were found in height, weight, WC and SR laps in the reference group, with higher values for boys. In the validation group, boys had higher values than girls for height, weight, BMI and SR laps.
Validation group was classified for SR laps according to deciles calculated in the reference group. In the validation group 85.3% of subjects were classified as being in LMRS, whereas 14.7% in HMRS. ROC curve analyses indicate significant accuracy for SR laps deciles in the discrimination of subjects in LMRS and HMRS. The accuracy was significant for both girls (AUC = 0.66; 95% CI = 0.58–0.74; p < .001) and boys (AUC = 0.71; 95% CI = 0.62–0.79; p < .001).
Table 2 shows the performances of different percentiles as cut-off points for SR laps for targeting HMRS. The overall rates of true-positives (SENS), true-negatives (SPEC) and false-positives (1-SPEC) were greater to the 40th percentile of SR laps, comparatively to the others, and consequently leading to a higher efficiency in both sexes. Thus, SR laps corresponding to the 40th percentile are considered the best cut-off to discriminate subjects at HMRS/LMRS. Table 3 shows the corresponding reference values (40th percentile) determined by this study and the reference values for SR laps suggested by FITNESSGRAM (35).
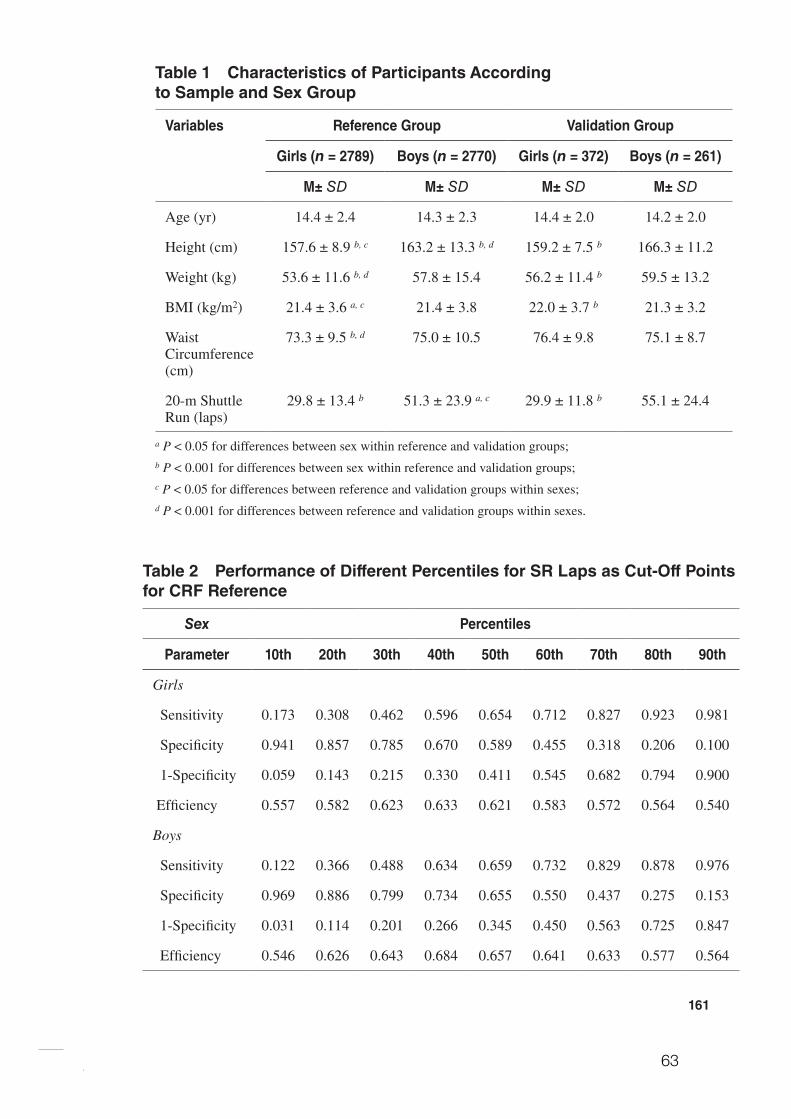
63
161
Table 1 Characteristics of Participants According to Sample and Sex Group
Variables Reference Group Validation Group
Girls (n = 2789) Boys (n = 2770) Girls (n = 372) Boys (n = 261)
M± SD M± SD M± SD M± SD
Age (yr) 14.4 ± 2.4 14.3 ± 2.3 14.4 ± 2.0 14.2 ± 2.0
Height (cm) 157.6 ± 8.9 b, c 163.2 ± 13.3 b, d 159.2 ± 7.5 b 166.3 ± 11.2
Weight (kg) 53.6 ± 11.6 b, d 57.8 ± 15.4 56.2 ± 11.4 b 59.5 ± 13.2
BMI (kg/m2) 21.4 ± 3.6 a, c 21.4 ± 3.8 22.0 ± 3.7 b 21.3 ± 3.2
Waist Circumference (cm)
73.3 ± 9.5 b, d 75.0 ± 10.5 76.4 ± 9.8 75.1 ± 8.7
20-m Shuttle Run (laps)
29.8 ± 13.4 b 51.3 ± 23.9 a, c 29.9 ± 11.8 b 55.1 ± 24.4
a P < 0.05 for differences between sex within reference and validation groups;b P < 0.001 for differences between sex within reference and validation groups;c P < 0.05 for differences between reference and validation groups within sexes;d P < 0.001 for differences between reference and validation groups within sexes.
Table 2 Performance of Different Percentiles for SR Laps as Cut-Off Points for CRF Reference
Sex Percentiles
Parameter 10th 20th 30th 40th 50th 60th 70th 80th 90th
Girls
Sensitivity 0.173 0.308 0.462 0.596 0.654 0.712 0.827 0.923 0.981
Specificity 0.941 0.857 0.785 0.670 0.589 0.455 0.318 0.206 0.100
1-Specificity 0.059 0.143 0.215 0.330 0.411 0.545 0.682 0.794 0.900
Efficiency 0.557 0.582 0.623 0.633 0.621 0.583 0.572 0.564 0.540
Boys
Sensitivity 0.122 0.366 0.488 0.634 0.659 0.732 0.829 0.878 0.976
Specificity 0.969 0.886 0.799 0.734 0.655 0.550 0.437 0.275 0.153
1-Specificity 0.031 0.114 0.201 0.266 0.345 0.450 0.563 0.725 0.847
Efficiency 0.546 0.626 0.643 0.684 0.657 0.641 0.633 0.577 0.564
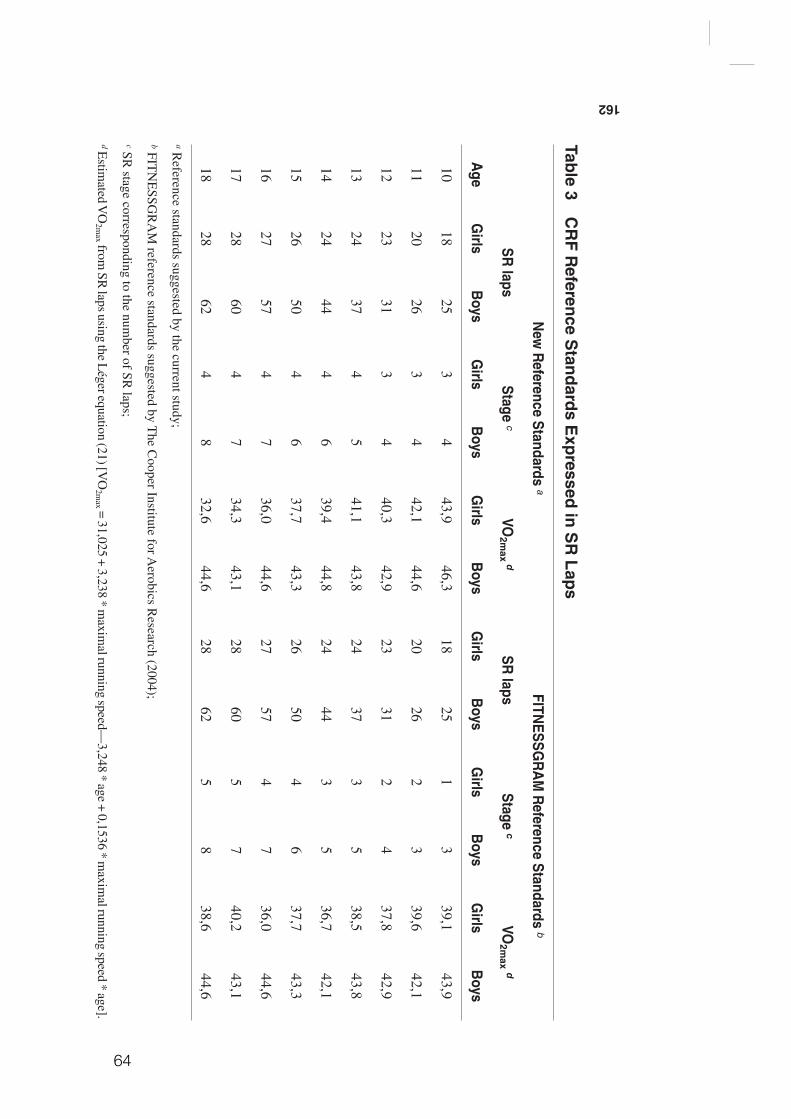
64
162
Table 3 C
RF R
eference Standards E
xpressed in SR
Laps
Age
New
Reference Standards a
FITNESSG
RA
M R
eference Standards b
SR laps
Stage cVO
2max d
SR laps
Stage cVO
2max d
Girls
Boys
Girls
Boys
Girls
Boys
Girls
Boys
Girls
Boys
Girls
Boys
1018
253
443,9
46,318
251
339,1
43,9
1120
263
442,1
44,620
262
339,6
42,1
1223
313
440,3
42,923
312
437,8
42,9
1324
374
541,1
43,824
373
538,5
43,8
1424
444
639,4
44,824
443
536,7
42,1
1526
504
637,7
43,326
504
637,7
43,3
1627
574
736,0
44,627
574
736,0
44,6
1728
604
734,3
43,128
605
740,2
43,1
1828
624
832,6
44,628
625
838,6
44,6
a Reference standards suggested by the current study;
b FITN
ESSG
RA
M reference standards suggested by T
he Cooper Institute for A
erobics Research (2004);
c SR stage corresponding to the num
ber of SR laps;
d Estim
ated VO
2max from
SR laps using the L
éger equation (21) [VO
2max = 31,025 + 3,238 * m
aximal running speed—
3,248 * age + 0,1536 * maxim
al running speed * age].
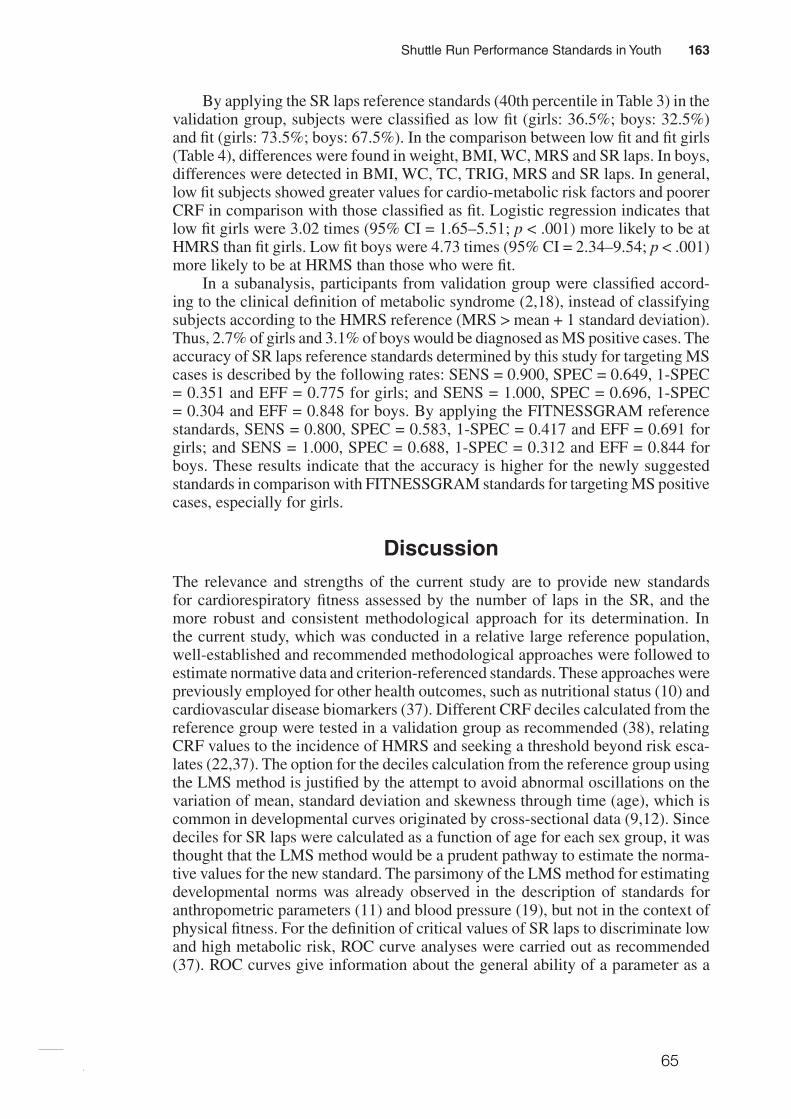
65
Shuttle Run Performance Standards in Youth 163
By applying the SR laps reference standards (40th percentile in Table 3) in the validation group, subjects were classified as low fit (girls: 36.5%; boys: 32.5%) and fit (girls: 73.5%; boys: 67.5%). In the comparison between low fit and fit girls (Table 4), differences were found in weight, BMI, WC, MRS and SR laps. In boys, differences were detected in BMI, WC, TC, TRIG, MRS and SR laps. In general, low fit subjects showed greater values for cardio-metabolic risk factors and poorer CRF in comparison with those classified as fit. Logistic regression indicates that low fit girls were 3.02 times (95% CI = 1.65–5.51; p < .001) more likely to be at HMRS than fit girls. Low fit boys were 4.73 times (95% CI = 2.34–9.54; p < .001) more likely to be at HRMS than those who were fit.
In a subanalysis, participants from validation group were classified accord-ing to the clinical definition of metabolic syndrome (2,18), instead of classifying subjects according to the HMRS reference (MRS > mean + 1 standard deviation). Thus, 2.7% of girls and 3.1% of boys would be diagnosed as MS positive cases. The accuracy of SR laps reference standards determined by this study for targeting MS cases is described by the following rates: SENS = 0.900, SPEC = 0.649, 1-SPEC = 0.351 and EFF = 0.775 for girls; and SENS = 1.000, SPEC = 0.696, 1-SPEC = 0.304 and EFF = 0.848 for boys. By applying the FITNESSGRAM reference standards, SENS = 0.800, SPEC = 0.583, 1-SPEC = 0.417 and EFF = 0.691 for girls; and SENS = 1.000, SPEC = 0.688, 1-SPEC = 0.312 and EFF = 0.844 for boys. These results indicate that the accuracy is higher for the newly suggested standards in comparison with FITNESSGRAM standards for targeting MS positive cases, especially for girls.
DiscussionThe relevance and strengths of the current study are to provide new standards for cardiorespiratory fitness assessed by the number of laps in the SR, and the more robust and consistent methodological approach for its determination. In the current study, which was conducted in a relative large reference population, well-established and recommended methodological approaches were followed to estimate normative data and criterion-referenced standards. These approaches were previously employed for other health outcomes, such as nutritional status (10) and cardiovascular disease biomarkers (37). Different CRF deciles calculated from the reference group were tested in a validation group as recommended (38), relating CRF values to the incidence of HMRS and seeking a threshold beyond risk esca-lates (22,37). The option for the deciles calculation from the reference group using the LMS method is justified by the attempt to avoid abnormal oscillations on the variation of mean, standard deviation and skewness through time (age), which is common in developmental curves originated by cross-sectional data (9,12). Since deciles for SR laps were calculated as a function of age for each sex group, it was thought that the LMS method would be a prudent pathway to estimate the norma-tive values for the new standard. The parsimony of the LMS method for estimating developmental norms was already observed in the description of standards for anthropometric parameters (11) and blood pressure (19), but not in the context of physical fitness. For the definition of critical values of SR laps to discriminate low and high metabolic risk, ROC curve analyses were carried out as recommended (37). ROC curves give information about the general ability of a parameter as a
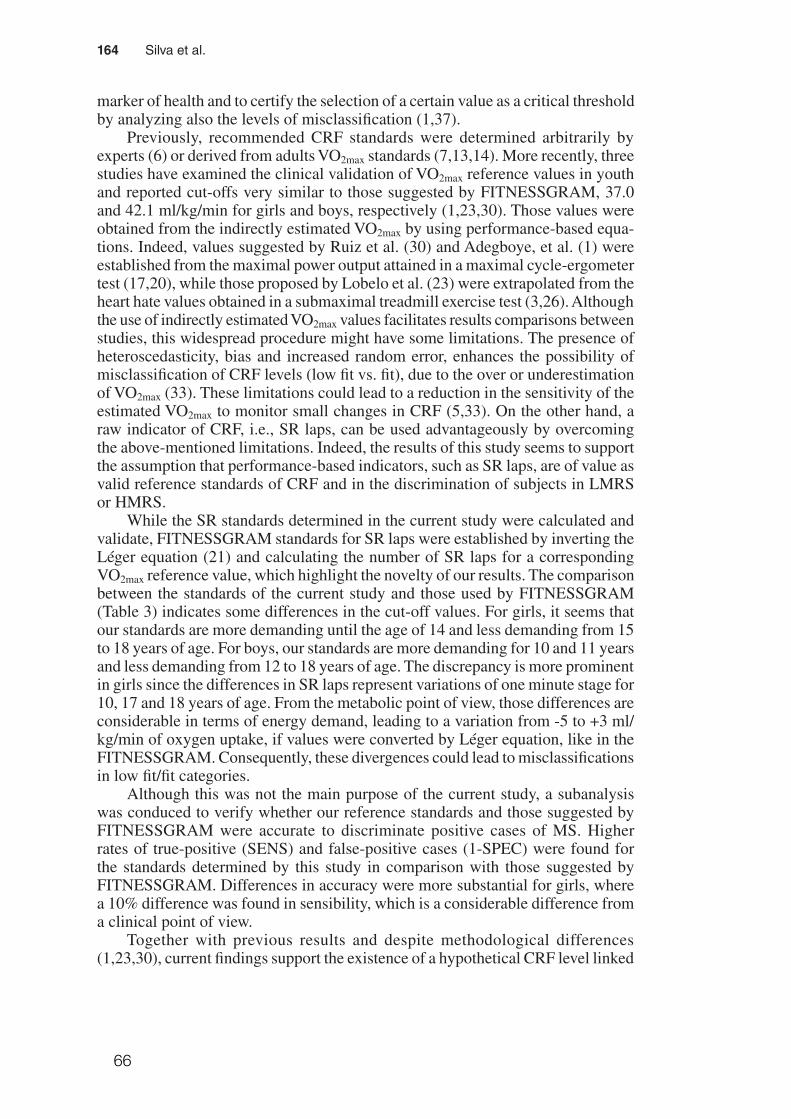
66
164 Silva et al.
marker of health and to certify the selection of a certain value as a critical threshold by analyzing also the levels of misclassification (1,37).
Previously, recommended CRF standards were determined arbitrarily by experts (6) or derived from adults VO2max standards (7,13,14). More recently, three studies have examined the clinical validation of VO2max reference values in youth and reported cut-offs very similar to those suggested by FITNESSGRAM, 37.0 and 42.1 ml/kg/min for girls and boys, respectively (1,23,30). Those values were obtained from the indirectly estimated VO2max by using performance-based equa-tions. Indeed, values suggested by Ruiz et al. (30) and Adegboye, et al. (1) were established from the maximal power output attained in a maximal cycle-ergometer test (17,20), while those proposed by Lobelo et al. (23) were extrapolated from the heart hate values obtained in a submaximal treadmill exercise test (3,26). Although the use of indirectly estimated VO2max values facilitates results comparisons between studies, this widespread procedure might have some limitations. The presence of heteroscedasticity, bias and increased random error, enhances the possibility of misclassification of CRF levels (low fit vs. fit), due to the over or underestimation of VO2max (33). These limitations could lead to a reduction in the sensitivity of the estimated VO2max to monitor small changes in CRF (5,33). On the other hand, a raw indicator of CRF, i.e., SR laps, can be used advantageously by overcoming the above-mentioned limitations. Indeed, the results of this study seems to support the assumption that performance-based indicators, such as SR laps, are of value as valid reference standards of CRF and in the discrimination of subjects in LMRS or HMRS.
While the SR standards determined in the current study were calculated and validate, FITNESSGRAM standards for SR laps were established by inverting the Léger equation (21) and calculating the number of SR laps for a corresponding VO2max reference value, which highlight the novelty of our results. The comparison between the standards of the current study and those used by FITNESSGRAM (Table 3) indicates some differences in the cut-off values. For girls, it seems that our standards are more demanding until the age of 14 and less demanding from 15 to 18 years of age. For boys, our standards are more demanding for 10 and 11 years and less demanding from 12 to 18 years of age. The discrepancy is more prominent in girls since the differences in SR laps represent variations of one minute stage for 10, 17 and 18 years of age. From the metabolic point of view, those differences are considerable in terms of energy demand, leading to a variation from -5 to +3 ml/kg/min of oxygen uptake, if values were converted by Léger equation, like in the FITNESSGRAM. Consequently, these divergences could lead to misclassifications in low fit/fit categories.
Although this was not the main purpose of the current study, a subanalysis was conduced to verify whether our reference standards and those suggested by FITNESSGRAM were accurate to discriminate positive cases of MS. Higher rates of true-positive (SENS) and false-positive cases (1-SPEC) were found for the standards determined by this study in comparison with those suggested by FITNESSGRAM. Differences in accuracy were more substantial for girls, where a 10% difference was found in sensibility, which is a considerable difference from a clinical point of view.
Together with previous results and despite methodological differences (1,23,30), current findings support the existence of a hypothetical CRF level linked
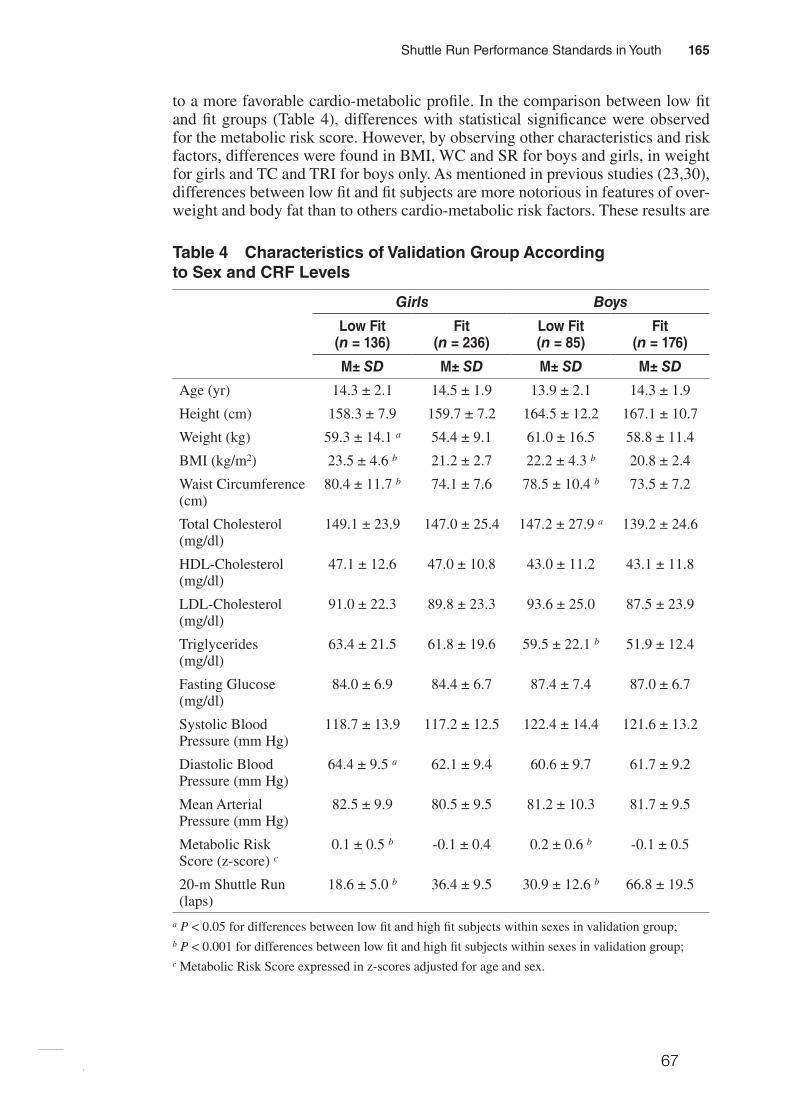
67
Shuttle Run Performance Standards in Youth 165
to a more favorable cardio-metabolic profile. In the comparison between low fit and fit groups (Table 4), differences with statistical significance were observed for the metabolic risk score. However, by observing other characteristics and risk factors, differences were found in BMI, WC and SR for boys and girls, in weight for girls and TC and TRI for boys only. As mentioned in previous studies (23,30), differences between low fit and fit subjects are more notorious in features of over-weight and body fat than to others cardio-metabolic risk factors. These results are
Table 4 Characteristics of Validation Group According to Sex and CRF Levels
Girls Boys
Low Fit (n = 136)
Fit (n = 236)
Low Fit (n = 85)
Fit (n = 176)
M± SD M± SD M± SD M± SD
Age (yr) 14.3 ± 2.1 14.5 ± 1.9 13.9 ± 2.1 14.3 ± 1.9
Height (cm) 158.3 ± 7.9 159.7 ± 7.2 164.5 ± 12.2 167.1 ± 10.7
Weight (kg) 59.3 ± 14.1 a 54.4 ± 9.1 61.0 ± 16.5 58.8 ± 11.4
BMI (kg/m2) 23.5 ± 4.6 b 21.2 ± 2.7 22.2 ± 4.3 b 20.8 ± 2.4
Waist Circumference (cm)
80.4 ± 11.7 b 74.1 ± 7.6 78.5 ± 10.4 b 73.5 ± 7.2
Total Cholesterol (mg/dl)
149.1 ± 23.9 147.0 ± 25.4 147.2 ± 27.9 a 139.2 ± 24.6
HDL-Cholesterol (mg/dl)
47.1 ± 12.6 47.0 ± 10.8 43.0 ± 11.2 43.1 ± 11.8
LDL-Cholesterol (mg/dl)
91.0 ± 22.3 89.8 ± 23.3 93.6 ± 25.0 87.5 ± 23.9
Triglycerides (mg/dl)
63.4 ± 21.5 61.8 ± 19.6 59.5 ± 22.1 b 51.9 ± 12.4
Fasting Glucose (mg/dl)
84.0 ± 6.9 84.4 ± 6.7 87.4 ± 7.4 87.0 ± 6.7
Systolic Blood Pressure (mm Hg)
118.7 ± 13.9 117.2 ± 12.5 122.4 ± 14.4 121.6 ± 13.2
Diastolic Blood Pressure (mm Hg)
64.4 ± 9.5 a 62.1 ± 9.4 60.6 ± 9.7 61.7 ± 9.2
Mean Arterial Pressure (mm Hg)
82.5 ± 9.9 80.5 ± 9.5 81.2 ± 10.3 81.7 ± 9.5
Metabolic Risk Score (z-score) c
0.1 ± 0.5 b -0.1 ± 0.4 0.2 ± 0.6 b -0.1 ± 0.5
20-m Shuttle Run (laps)
18.6 ± 5.0 b 36.4 ± 9.5 30.9 ± 12.6 b 66.8 ± 19.5
a P < 0.05 for differences between low fit and high fit subjects within sexes in validation group;b P < 0.001 for differences between low fit and high fit subjects within sexes in validation group;c Metabolic Risk Score expressed in z-scores adjusted for age and sex.
68
166 Silva et al.
in agreement with previous findings showing that WC is the strongest marker of metabolic syndrome (25).
The prevalence of low fit students (35%) in the validation group is preoc-cupying, and similar to those found in other populations (23,30). In addition, low CRF levels are associated with increased risk for HMRS (23,30). Therefore, there is enough evidence to promote intervention programs to improve physical activity levels to enhance CRF and metabolic profiles. Although CRF variation is broadly explained by genetic factors (40), there is a theoretical framework with substantial evidence pointing that physical activity and regular exercise also play an important role in the regulation of CRF levels (16,32), features of metabolic syndrome (8) and obesity (16).
The findings from the current study should be considered together with some limitations. The sample of participants was selected by convenience and the distri-butions on reference and validation groups were determined by students/parents’ acceptance for blood analysis, which is crucial for the description of cardio-metabolic risk factors. Moreover, these findings just offer a valid indication of the current metabolic condition, being impossible to confirm future development of metabolic syndrome or cardiovascular diseases.
In terms of public health, schools have a crucial position in health surveillance policies. It guarantees the access to a majority of children and adolescents and con-figures a powerful setting for primary prevention for several diseases. Concerning the cardiovascular health, the procedures to access some risk factors are invasive and not suitable for screening subjects at risk among large populations. However, performance in the 20-m shuttle run test seems to be a valid tool for targeting chil-dren and adolescents at risk for obesity and metabolic syndrome. Current findings encourage the assessment of physical fitness in schools as a key component for health monitoring systems. Physical fitness field tests like the 20-m shuttle run are suitable for school environments. It allows evaluating a large number of subjects with little equipment and reduced costs in an optimized time. In addition, schools can provide opportunities to improve healthier behaviors like physical activity and adequate diet, so that obesity and cardiovascular health could be controlled.
Conclusion
The new criterion-referenced standards for SR laps are valid and seem to discrimi-nate children and adolescents with high metabolic risk from those with healthier cardio-metabolic profiles. In addition, this study supports the clinical significance of having a high CRF from early ages. In practice, the SR together with the new reference standards constitute valid tools for monitoring cardiovascular health in youths and for targeting groups for future intervention.
Acknowledgments
The Foundation of Science and Technology (FCT) supported GS with the PhD grant refer-ence SFRH/BD/45090/2008. The study was also supported by FCT with the research project reference PTDC/DES/72424/2006. Authors declare no conflict of interest.
69
Shuttle Run Performance Standards in Youth 167
References 1. Adegboye, A.R., S.A. Anderssen, K. Froberg, et al. Recommended aerobic fitness level
for metabolic health in children and adolescents: a study of diagnostic accuracy. Br. J. Sports Med. 45:722–728, 2010.
2. Alberti, K.G., P. Zimmet, and J. Shaw. Metabolic syndrome - a new world-wide defini-tion. A Consensus Statement from the International Diabetes Federation. Diabet. Med. 23:469–480, 2006.
3. American College of Sports Medicine. ACSM’s Guidelines for Exercise Testing and Prescription, 7th ed. Philadelphia, PA: Lippincott Williams & Wilkins, 2005.
4. Andersen, L.B., L. Sardinha, K. Froberg, C.J. Riddoch, A.S. Page, and S.A. Anderssen. Fitness, fatness and clustering of cardiovascular risk factors in children from Denmark, Estonia and Portugal: The European Youth Heart Study. Int. J. Pediatr. Obes. 3:58–66, 2008.
5. Atkinson, G., and A.M. Nevill. Statistical methods for assessing measurement error (reliability) in variables relevant to sports medicine. Sports Med. 26:217–238, 1998.
6. Bell, R.D., M. Macek, J. Rutenfranz, and W.H.M. Saris. Health indicators and risk factors of cardiovascular diseases during childhood and adolescence. In: Children and Exercise XII, J. Rutenfranz, R. Mocellin, and F. Klimt (Eds.). Champaign, Illinois: Human Kinetics, 1986, pp. 19–27.
7. Blair, S.N., H.W. Kohl, 3rd, R.S. Paffenbarger, Jr., D.G. Clark, K.H. Cooper, and L.W. Gibbons. Physical fitness and all-cause mortality. A prospective study of healthy men and women. JAMA. 262:2395–2401, 1989.
8. Brage, S., N. Wedderkopp, U. Ekelund, et al. Features of the metabolic syndrome are associated with objectively measured physical activity and fitness in Danish children: The European Youth Heart Study (EYHS). Diabetes Care. 27:2141–2148, 2004.
9. Cole, T.J. The LMS method for constructing normalized growth standards. Eur. J. Clin. Nutr. 44:45–60, 1990.
10. Cole, T.J., M.C. Bellizzi, K.M. Flegal, and W.H. Dietz. Establishing a standard definition for child overweight and obesity worldwide: international survey. BMJ. 320:1240–1243, 2000.
11. Cole, T.J., J.V. Freeman, and M.A. Preece. British 1990 growth reference centiles for weight, height, body mass index and head circumference fitted by maximum penalized likelihood. Stat. Med. 17:407–429, 1998.
12. Cole, T.J., and P.J. Green. Smoothing reference centile curves: The LMS method and penalized likelihood. Stat. Med. 11:1305–1319, 1992.
13. Cureton, K.J., and S.A. Plowman. Aerobic capacity assessments. In: FITNESSGRAM Reference Guide, 3rd ed., G.J. Welk and M.D. Meredith (Eds.). Dallas, TX: The Cooper Institute, 2008, pp. 96–120.
14. Cureton, K.J., and G.L. Warren. Criterion-referenced standards for youth health-related fitness tests: a tutorial. Res. Q. Exerc. Sport. 61:7–19, 1990.
15. Friedewald, T., R.I. Levy, and D.S. Frederickson. Estimation of the concentration of low-density lipoprotein cholesterol in plasma, without use of the preparative ultracen-trifuge. Clin. Chem. 18:499–502, 1972.
16. Gutin, B., P. Barbeau, S. Owens, et al. Effects of exercise intensity on cardiovascular fitness, total body composition, and visceral adiposity of obese adolescents. Am. J. Clin. Nutr. 75:818–826, 2002.
17. Hansen, H.S., K. Froberg, J.R. Nielsen, and N. Hyldebrandt. A new approach to assess-ing maximal aerobic power in children: The Odense School Child Study. Eur. J. Appl. Physiol. 58:618–624, 1989.
18. IDF. The IDF consensus definition of the metabolic syndrome in children and adoles-cents. International Diabetes Federation Communications, 2007.
70
168 Silva et al.
19. Jackson, L.V., N.K. Thalange, and T.J. Cole. Blood pressure centiles for Great Britain. Arch. Dis. Child. 92:298–303, 2007.
20. Kolle, E., J. Steene-Johannessen, L.B. Andersen, and S.A. Anderssen. Objectively assessed physical activity and aerobic fitness in a population-based sample of Norwegian 9- and 15-year-olds. Scand J Med Sci Sports. 20:e41–e47, 2010.
21. Léger, L.A., D. Mercier, C. Gadoury, and J. Lambert. The multistage 20 metre shuttle run test for aerobic fitness. J Sports Sci. 6:93–101, 1988.
22. Lewington, S., R. Clarke, N. Qizilbash, R. Peto, and R. Collins. Age-specific relevance of usual blood pressure to vascular mortality: a meta-analysis of individual data for one million adults in 61 prospective studies. Lancet. 360:1903–1913, 2002.
23. Lobelo, F., R.R. Pate, M. Dowda, A.D. Liese, and J.R. Ruiz. Validity of cardiorespi-ratory fitness criterion-referenced standards for adolescents. Med. Sci. Sports Exerc. 41:1222–1229, 2009.
24. Lohman, T.G., A.F. Roche, and R. Martorell. Anthropometric Standardization Reference Manual. Champaign, IL: Human Kinetics, 1988.
25. Moreno, L.A., I. Pineda, G. Rodriguez, J. Fleta, A. Sarria, and M. Bueno. Waist cir-cumference for the screening of the metabolic syndrome in children. Acta Paediatr. 91:1307–1312, 2002.
26. Pate, R.R., C.Y. Wang, M. Dowda, S.W. Farrell, and J.R. O’Neill. Cardiorespiratory fitness levels among US youth 12 to 19 years of age: findings from the 1999-2002 National Health and Nutrition Examination Survey. Arch. Pediatr. Adolesc. Med. 160:1005–1012, 2006.
27. Reed, K.E., D.E.R. Warburton, R.Z. Lewanczuk, et al. Arterial compliance in young children: The role of aerobic fitness. Eur. J. Cardiovasc. Prev. Rehabil. 12:492–497, 2005.
28. Ruiz, J.R., F.B. Ortega, D. Meusel, M. Harro, P. Oja, and M. Sjöström. Cardiorespira-tory fitness is associated with features of metabolic risk factors in children. Should cardiorespiratory fitness be assessed in a European health monitoring system? The European Youth Heart Study. J Public Health. 14:94–102, 2006.
29. Ruiz, J.R., F.B. Ortega, D. Meusel, and M. Sjöström. Traditional and novel cardiovas-cular risk factors in school-aged children: A call for the further development of public health strategies with emphasis on fitness. J Public Health. 15:171–177, 2007.
30. Ruiz, J.R., F.B. Ortega, N.S. Rizzo, et al. High cardiovascular fitness is associated with low metabolic risk score in children: The European Youth Heart Study. Pediatr. Res. 61:350–355, 2007.
31. Ruiz, J.R., J. Ramirez-Lechuga, F. Ortega, et al. Artificial neural network-based equa-tion for estimating VO2max from the 20 m shuttle run test in adolescents. Artif. Intell. Med. 44:233–245, 2008.
32. Ruiz, J.R., N.S. Rizzo, A. Hürtig-Wennlöf, F.B. Ortega, J. Warnberg, and M. Sjöström. Relations of total physical activity and intensity to fitness and fatness in children: The European Youth Heart Study. Am. J. Clin. Nutr. 84:299–303, 2006.
33. Ruiz, J.R., G. Silva, N. Oliveira, J. Ribeiro, J. Oliveira, and J. Mota. Criterion-related validity of the 20-m shuttle run test in youths aged 13-19 years. J Sports Sci. 27:899–906, 2009.
34. Taylor, H.L., E. Buskirk, and A. Henschel. Maximal oxygen intake as an objective measure of cardiorespiratory performance. J. Appl. Physiol. 8:73–80, 1955.
35. The Cooper Institute for Aerobics Research. FITNESSGRAM test administration manual, 3rd ed. Champaign, Illinois: Human Kinetics, 2004.
36. The Third National Health and Nutrition Examination Survey. The Third National Health and Nutrition Examination Survey (NHANES III 1988-94) Reference Manuals and Reports. 1996.
37. Vasan, R.S. Biomarkers of cardiovascular disease: molecular basis and practical con-siderations. Circulation. 113:2335–2362, 2006.
71
Shuttle Run Performance Standards in Youth 169
38. Wade, A. Derivation versus validation. Arch. Dis. Child. 83:459–460, 2000. 39. Wei, M., L.W. Gibbons, J.B. Kampert, M.Z. Nichaman, and S.N. Blair. Low cardiore-
spiratory fitness and physical inactivity as predictors of mortality in men with type 2 diabetes. Ann. Intern. Med. 132:605–611, 2000.
40. Wolfarth, B., M.S. Bray, J.M. Hagberg, et al. The human gene map for performance and health-related fitness phenotypes: the 2004 update. Med. Sci. Sports Exerc. 37:881–903, 2005.
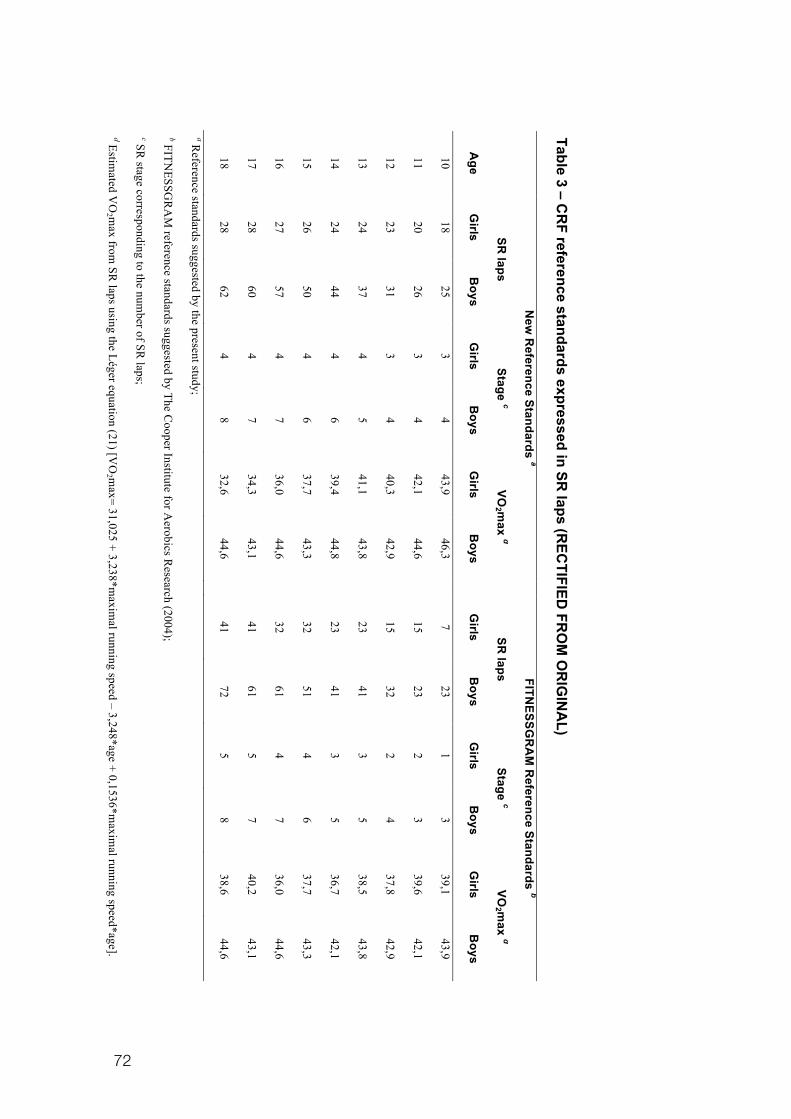
72
Table 3 – CR
F reference standards expressed in SR laps (R
ECTIFIED
FRO
M O
RIG
INA
L)
N
ew R
eference Standards a
FITNESSG
RA
M R
eference Standards b
SR
laps Stage c
VO2 m
ax d
SR laps
Stage c VO
2 max d
Age
Girls
Boys
Girls
Boys
Girls
Boys
G
irls B
oys G
irls B
oys G
irls B
oys
10 18
25 3
4 43,9
46,3
7 23
1 3
39,1 43,9
11 20
26 3
4 42,1
44,6
15 23
2 3
39,6 42,1
12 23
31 3
4 40,3
42,9
15 32
2 4
37,8 42,9
13 24
37 4
5 41,1
43,8
23 41
3 5
38,5 43,8
14 24
44 4
6 39,4
44,8
23 41
3 5
36,7 42,1
15 26
50 4
6 37,7
43,3
32 51
4 6
37,7 43,3
16 27
57 4
7 36,0
44,6
32 61
4 7
36,0 44,6
17 28
60 4
7 34,3
43,1
41 61
5 7
40,2 43,1
18 28
62 4
8 32,6
44,6
41 72
5 8
38,6 44,6
a Reference standards suggested by the present study;
b FITNESSG
RA
M reference standards suggested by The C
ooper Institute for Aerobics R
esearch (2004);
c SR stage corresponding to the num
ber of SR laps;
d Estimated V
O2 m
ax from SR
laps using the Léger equation (21) [VO
2 max= 31,025 + 3,238*m
aximal running speed – 3,248*age + 0,1536*m
aximal running speed*age].
73
Study I I I
SUBMITED
Silva, G., Aires, L., Martins, C., Mota, J., Oliveira, J., Ribeiro, J.C.
Cardiorespiratory f i tness associates with metabol ic r isk
independently of central adiposity

74
75
Cardiorespiratory f i tness associates with metabol ic r isk
independently of central adiposity
Gustavo Silva, Luísa Aires, Clarice Martins, Jorge Mota, José Oliveira and José
Carlos Ribeiro
Abstract
This study aimed to analyze the associations between cardiorespiratory fitness
(CRF), waist circumference (WC) and metabolic risk in children and adolescents.
Participants were 633 subjects (58.7% girls) aged 10-18 years. Metabolic risk
score (MRS) was calculated from HDL-cholesterol, triglycerides, fasting glucose
and mean arterial pressure. MRS was dichotomized into low and high metabolic
risk (HMRS). Maximal oxygen uptake (VO2max) was estimated from the 20m
Shuttle Run Test. The first quartile of CRF was set as the low fit group. The fourth
quartile of WC was defined as high central adiposity. With adjustments for age,
sex and WC, VO2max was correlated with MRS (r=-0.095; P<0.05). WC was
correlated with MRS (r=0.150; P<0.001) after adjustments for age, sex and
VO2max. Participants who were low fit, presented higher levels of MRS (P<0.001)
compared to those who were fit, even after adjustment for age, sex and WC. In
comparison with subjects who were fit with normal central adiposity, an increased
risk for being at HMRS was found for participants who were low fit with high
central adiposity (OR=2.934; 95%CI= 1.690-5.092) and for those who were low fit
with normal central adiposity (OR=2.234; 95%CI=1.116-4.279). Results suggest
that CRF associates with MRS, independently of central adiposity.
Keywords: Aerobic Capacity; Waist Circumference; Obesity; Metabolic Syndrome;
Cardiovascular Risk Factors; Youths.
76
Introduction
Cardiorespiratory fitness (CRF) is recognized as a great marker of
cardiovascular health. In adults, lower levels of CRF are associated with an
increased risk of all-cause and CVD mortality [5, 17]. In youths, reduced CRF is
associated with obesity and features of metabolic syndrome [3, 7], a condition of
clustered cardiovascular risk factors. Indeed, the definitions of reference standards
for CRF were established from the risk of mortality in adults [5, 17]. However, the
same strategy to define cardiovascular risk for young people is unreasonable,
since the time of exposure to cardiovascular risk factors was reduced and
insufficient to trigger cardiovascular events. Alternatively, a clustered metabolic
risk score has been used as a reference of cardiovascular health in youths for the
determination of CRF standards [1, 16, 20, 21, 26]. On the other hand, obesity is
a key characteristic of metabolic syndrome and it has been included in the
metabolic risk score calculated for the validation of CRF reference standards in
youths.
Current definitions of metabolic syndrome [2, 15] have included waist
circumference (WC) as an indicator of central adiposity, i.e. intra-abdominal and
visceral fat, which regulates some physiological mechanisms underlying the
progress of insulin resistance, dyslipidemia, and atherogenesis [2]. Consequently,
it would be informative to understand whether central adiposity mediates the
relationship between CRF and other cardio-metabolic features in children and
adolescents.
Therefore, the purpose of the present study was to analyze the
associations between CRF, abdominal fatness and metabolic risk factors.
77
Methods
Subjects
A total of 633 students (372 girls and 261 boys) aged 10-18 years from
two districts from the North of Portugal participated in this study. The
experimental protocol was approved by the Review Committee of the Scientific
Board of the Faculty of Sport of the University of Porto as well as by the
Foundation of Science and Technology and performed in accordance with the
ethical standards required by the International Journal of Sports Medicine [14].
Anthropometric Measurements
Height was measured to the nearest mm using a Holtain stadiometer. Body
mass was measured to the nearest 0.10kg, with students lightly dressed, using an
electronic weight scale (Tanita Inner Scan BC 532). Body mass index (BMI) was
calculated from the ratio of body weight (kg)/body height (m2). Waist
circumference (WC) was measured to the nearest mm with a metallic tape at the
superior border of the iliac crest, according to a previously described protocol [25].
Cardiovascular Disease Risk Factors
Systolic (SBP) and diastolic (DBP) blood pressures were measured using
the Colin Press Mate Non-Invasive Blood Pressure Monitor (model BP 8800p).
Two measurements were taken from children in seating position after five and ten
minutes rest. The mean of these two measurements was used for further data
78
analysis. Mean arterial pressure (MAP) was calculated as: MAP = [(SBP-
DBP)/3]+DBP.
After 12-14 hours of fasting, capillary whole blood samples were collected
from the earlobe using a 35-!l lithium heparin-coated capillary tube and
immediately assayed using the Cholestech LDX® Analyzer for determination of
serum total cholesterol (TC), high-density lipoprotein cholesterol (HDL-C),
triglycerides (TRIG) and fasting glucose (GLU) levels. Low-density lipoprotein
cholesterol (LDL-C) was estimated by the equation [12]: LDL-C = TC – HDL-C –
(0.20 x TRIG).
A continuous metabolic risk score (MRS) was calculated from standardized
scores (Z-scores) for HDL-C, TRIG, GLU and MAP. For each variable included in
MRS, Z-scores were calculated according to age and sex. HDL-C Z-score was
multiplied by -1 to indicate higher metabolic risk with increasing value. MRS was
calculated as the average of the four standardized variables. A lower MRS was
indicative of a better overall metabolic profile. MRS was later dichotomized,
whereas values above mean plus 1 standard deviation for MRS were classified at
high metabolic risk (HMRS). Values under this cut-off were considered at low
metabolic risk (LMRS).
Cardiorespiratory Fitness
Participants performed the 20m Shuttle Run Test according to the protocol
suggested by FITNESSGRAM [24]. All participants were familiar with the test,
since the FITNESSGRAM test battery is included in the physical education
curriculum in a National Program. Total number of completed shuttles (SR laps)
was recorded and converted in completed stages (speed level). The maximal
oxygen uptake (VO2max) was estimated with the following equation [22]: VO2max=
43.313 + 4.567*sex - 0.560*BMI + 2.785*stages.
79
Statistics
Descriptive data are presented as mean and standard deviation (Mean ±
SD) and One-Way ANOVA was used to identify differences between gender and
CRF groups. Partial correlation analysis was used to analyse the relationships
between WC, VO2max and metabolic risk factors, with adjustments for
confounders (age, sex and WC). Standardized Z-scores adjusted for age and sex
were calculated for WC and CRF (VO2max). Quartiles for the adjusted z-scores of
WC and VO2max were computed. The fourth quartile of WC was established as
“high central adiposity”, while the remaining quartiles were grouped as “normal
central adiposity”. The first quartile of VO2max was established as “low fit”, while
the remaining quartiles were set as “fit”. General Linear Model (Analysis of
Covariance) was used to analyse differences between CRF groups with
adjustments for age, sex and WC. Logistic regression was used to describe the
risk of being at the group with the high metabolic risk (HMRS) according to groups
of CRF and central adiposity. Results for logistic regressions are shown as odds
ratio (OR) and respective 95% confidence intervals. All analyses were completed
with SPSS 19.0 (SPSS Inc., Chicago, United States), with a significance level of
0.05.
Results
Descriptive characteristics of participants are shown in Table 1. In the
comparisons between genders, boys were taller, heavier and presented greater
values of GLU, SBP and CRF, while girls had higher values of BMI, TC, HDL-C,
TRIG and DBP.
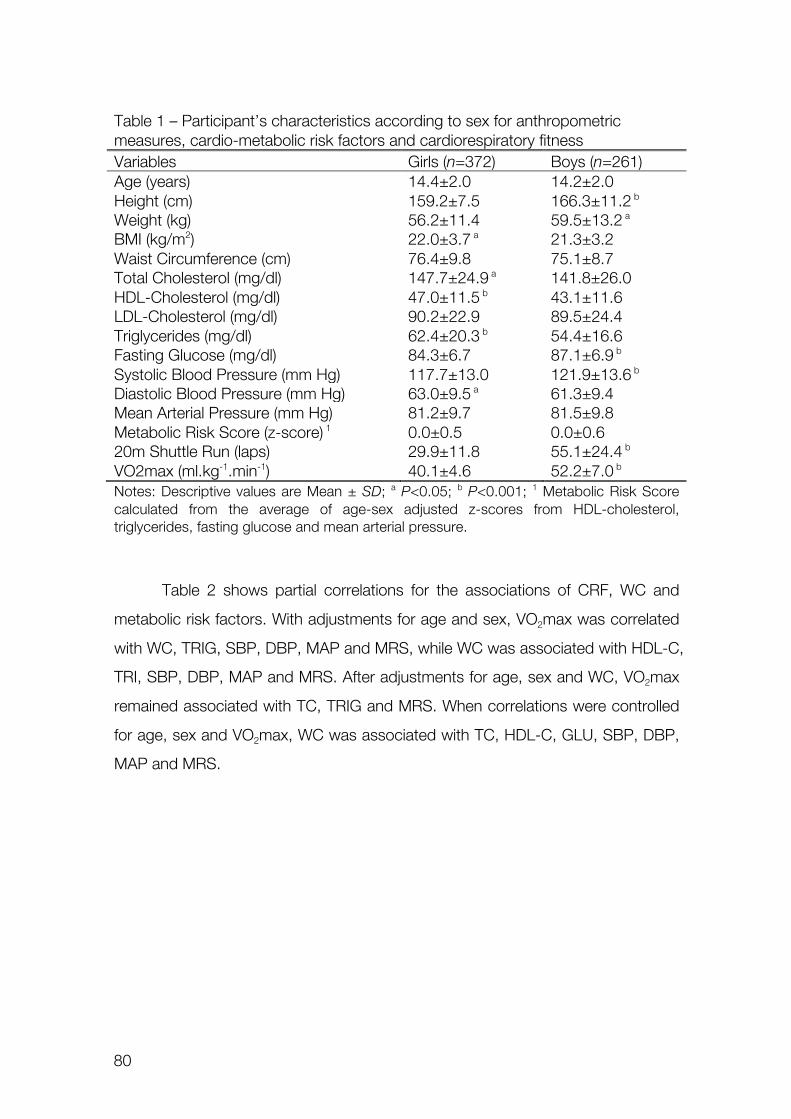
80
Table 1 – Participant’s characteristics according to sex for anthropometric measures, cardio-metabolic risk factors and cardiorespiratory fitness Variables Girls (n=372) Boys (n=261) Age (years) 14.4±2.0 14.2±2.0 Height (cm) 159.2±7.5 166.3±11.2 b Weight (kg) 56.2±11.4 59.5±13.2 a BMI (kg/m2) 22.0±3.7 a 21.3±3.2 Waist Circumference (cm) 76.4±9.8 75.1±8.7 Total Cholesterol (mg/dl) 147.7±24.9 a 141.8±26.0 HDL-Cholesterol (mg/dl) 47.0±11.5 b 43.1±11.6 LDL-Cholesterol (mg/dl) 90.2±22.9 89.5±24.4 Triglycerides (mg/dl) 62.4±20.3 b 54.4±16.6 Fasting Glucose (mg/dl) 84.3±6.7 87.1±6.9 b Systolic Blood Pressure (mm Hg) 117.7±13.0 121.9±13.6 b Diastolic Blood Pressure (mm Hg) 63.0±9.5 a 61.3±9.4 Mean Arterial Pressure (mm Hg) 81.2±9.7 81.5±9.8 Metabolic Risk Score (z-score) 1 0.0±0.5 0.0±0.6 20m Shuttle Run (laps) 29.9±11.8 55.1±24.4 b VO2max (ml.kg-1.min-1) 40.1±4.6 52.2±7.0 b Notes: Descriptive values are Mean ± SD; a P<0.05; b P<0.001; 1 Metabolic Risk Score calculated from the average of age-sex adjusted z-scores from HDL-cholesterol, triglycerides, fasting glucose and mean arterial pressure.
Table 2 shows partial correlations for the associations of CRF, WC and
metabolic risk factors. With adjustments for age and sex, VO2max was correlated
with WC, TRIG, SBP, DBP, MAP and MRS, while WC was associated with HDL-C,
TRI, SBP, DBP, MAP and MRS. After adjustments for age, sex and WC, VO2max
remained associated with TC, TRIG and MRS. When correlations were controlled
for age, sex and VO2max, WC was associated with TC, HDL-C, GLU, SBP, DBP,
MAP and MRS.
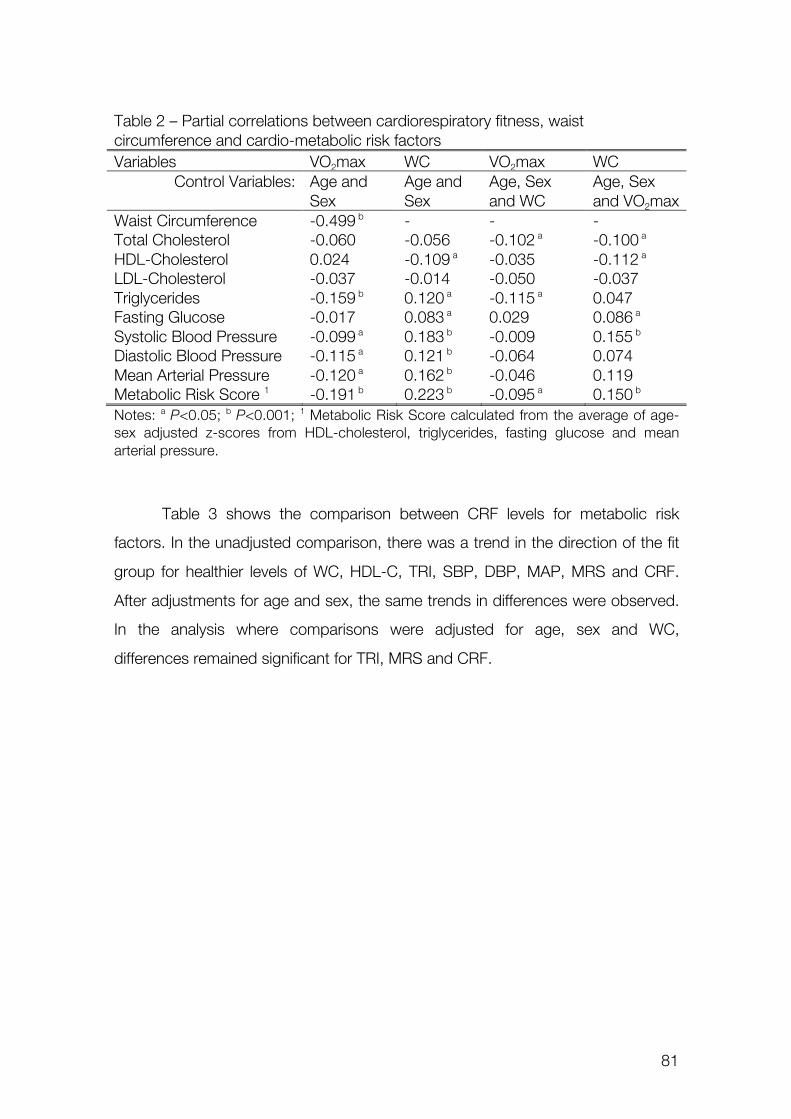
81
Table 2 – Partial correlations between cardiorespiratory fitness, waist circumference and cardio-metabolic risk factors Variables VO2max WC VO2max WC
Control Variables: Age and Sex
Age and Sex
Age, Sex and WC
Age, Sex and VO2max
Waist Circumference -0.499 b - - - Total Cholesterol -0.060 -0.056 -0.102 a -0.100 a HDL-Cholesterol 0.024 -0.109 a -0.035 -0.112 a LDL-Cholesterol -0.037 -0.014 -0.050 -0.037 Triglycerides -0.159 b 0.120 a -0.115 a 0.047 Fasting Glucose -0.017 0.083 a 0.029 0.086 a Systolic Blood Pressure -0.099 a 0.183 b -0.009 0.155 b Diastolic Blood Pressure -0.115 a 0.121 b -0.064 0.074 Mean Arterial Pressure -0.120 a 0.162 b -0.046 0.119 Metabolic Risk Score 1 -0.191 b 0.223 b -0.095 a 0.150 b Notes: a P<0.05; b P<0.001; 1 Metabolic Risk Score calculated from the average of age-sex adjusted z-scores from HDL-cholesterol, triglycerides, fasting glucose and mean arterial pressure.
Table 3 shows the comparison between CRF levels for metabolic risk
factors. In the unadjusted comparison, there was a trend in the direction of the fit
group for healthier levels of WC, HDL-C, TRI, SBP, DBP, MAP, MRS and CRF.
After adjustments for age and sex, the same trends in differences were observed.
In the analysis where comparisons were adjusted for age, sex and WC,
differences remained significant for TRI, MRS and CRF.
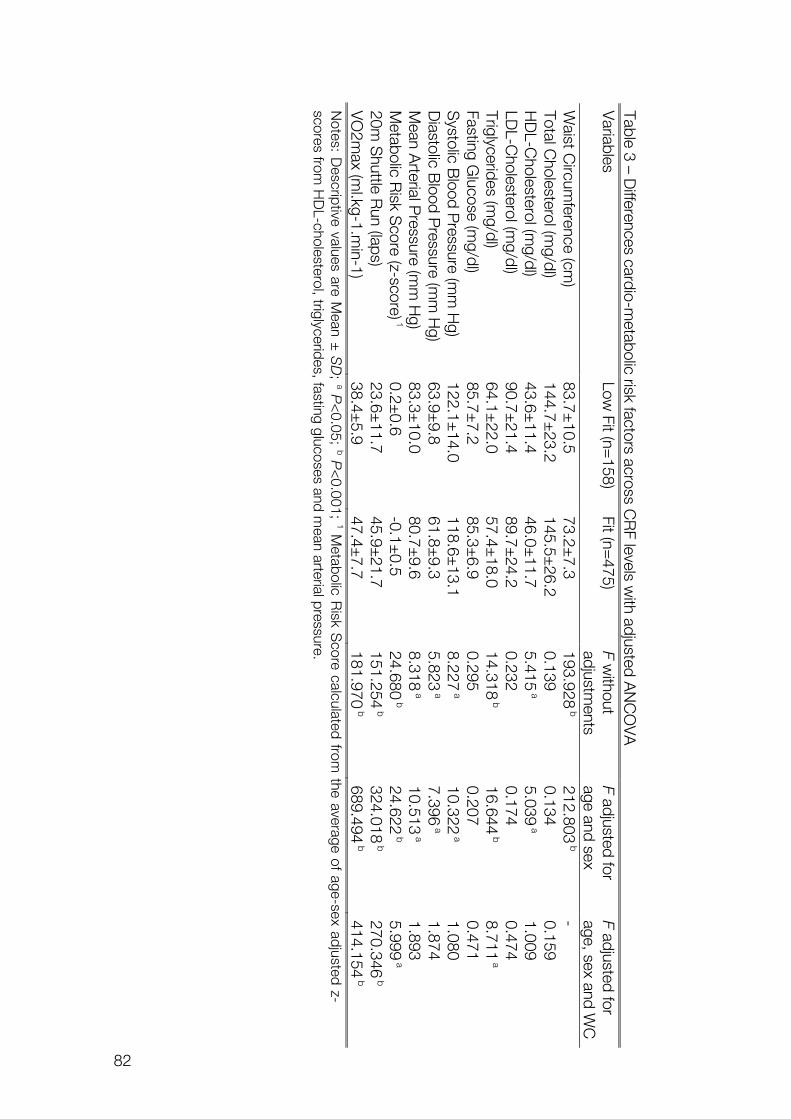
82
Table 3 – Differences cardio-m
etabolic risk factors across CR
F levels with adjusted A
NC
OV
A
Variables
Low Fit (n=
158) Fit (n=
475) F w
ithout adjustm
ents F adjusted for age and sex
F adjusted for age, sex and W
C
Waist C
ircumference (cm
) 83.7±
10.5 73.2±
7.3 193.928
b 212.803
b -
Total Cholesterol (m
g/dl) 144.7±
23.2 145.5±
26.2 0.139
0.134 0.159
HD
L-Cholesterol (m
g/dl) 43.6±
11.4 46.0±
11.7 5.415
a 5.039
a 1.009
LDL-C
holesterol (mg/dl)
90.7±21.4
89.7±24.2
0.232 0.174
0.474 Triglycerides (m
g/dl) 64.1±
22.0 57.4±
18.0 14.318
b 16.644
b 8.711
a Fasting G
lucose (mg/dl)
85.7±7.2
85.3±6.9
0.295 0.207
0.471 S
ystolic Blood P
ressure (mm
Hg)
122.1±14.0
118.6±13.1
8.227 a
10.322 a
1.080 D
iastolic Blood P
ressure (mm
Hg)
63.9±9.8
61.8±9.3
5.823 a
7.396 a
1.874 M
ean Arterial P
ressure (mm
Hg)
83.3±10.0
80.7±9.6
8.318 a
10.513 a
1.893 M
etabolic Risk S
core (z-score) 1 0.2±
0.6 -0.1±
0.5 24.680
b 24.622
b 5.999
a 20m
Shuttle R
un (laps) 23.6±
11.7 45.9±
21.7 151.254
b 324.018
b 270.346
b V
O2m
ax (ml.kg-1.m
in-1) 38.4±
5.9 47.4±
7.7 181.970
b 689.494
b 414.154
b N
otes: Descriptive values are M
ean ± S
D;
a P<
0.05; b P
<0.001;
1 Metabolic R
isk Score calculated from
the average of age-sex adjusted z-scores from
HD
L-cholesterol, triglycerides, fasting glucoses and mean arterial pressure.
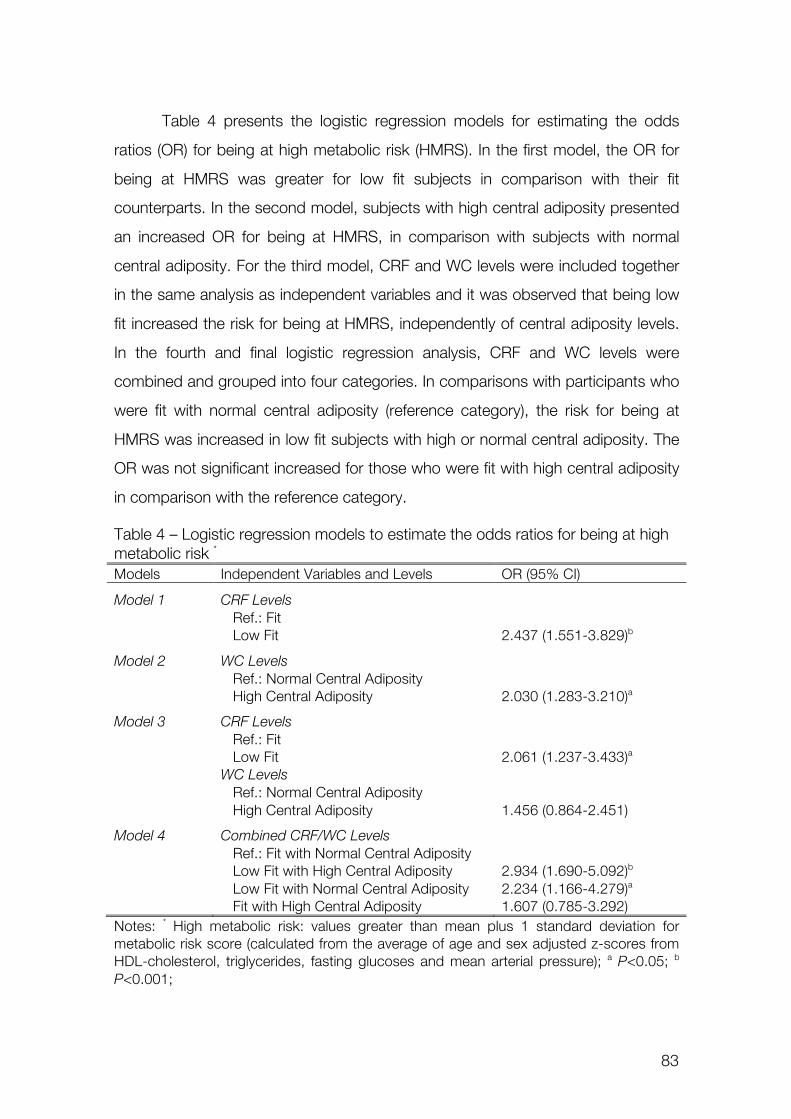
83
Table 4 presents the logistic regression models for estimating the odds
ratios (OR) for being at high metabolic risk (HMRS). In the first model, the OR for
being at HMRS was greater for low fit subjects in comparison with their fit
counterparts. In the second model, subjects with high central adiposity presented
an increased OR for being at HMRS, in comparison with subjects with normal
central adiposity. For the third model, CRF and WC levels were included together
in the same analysis as independent variables and it was observed that being low
fit increased the risk for being at HMRS, independently of central adiposity levels.
In the fourth and final logistic regression analysis, CRF and WC levels were
combined and grouped into four categories. In comparisons with participants who
were fit with normal central adiposity (reference category), the risk for being at
HMRS was increased in low fit subjects with high or normal central adiposity. The
OR was not significant increased for those who were fit with high central adiposity
in comparison with the reference category.
Table 4 – Logistic regression models to estimate the odds ratios for being at high metabolic risk *
Models Independent Variables and Levels OR (95% CI)
Model 1 CRF Levels Ref.: Fit Low Fit 2.437 (1.551-3.829)b
Model 2 WC Levels Ref.: Normal Central Adiposity High Central Adiposity 2.030 (1.283-3.210)a
Model 3 CRF Levels Ref.: Fit Low Fit 2.061 (1.237-3.433)a
WC Levels Ref.: Normal Central Adiposity High Central Adiposity 1.456 (0.864-2.451)
Model 4 Combined CRF/WC Levels Ref.: Fit with Normal Central Adiposity Low Fit with High Central Adiposity 2.934 (1.690-5.092)b
Low Fit with Normal Central Adiposity 2.234 (1.166-4.279)a
Fit with High Central Adiposity 1.607 (0.785-3.292) Notes: * High metabolic risk: values greater than mean plus 1 standard deviation for metabolic risk score (calculated from the average of age and sex adjusted z-scores from HDL-cholesterol, triglycerides, fasting glucoses and mean arterial pressure); a P<0.05; b P<0.001;
84
Discussion
Main findings from the present study showed that CRF and central
adiposity are independently associated with single or clustered cardiovascular risk
factors in children and adolescents. Also, differences between CRF levels in a
metabolic risk score are independent of central adiposity levels. Although both low
CRF and higher central adiposity increased the risk of being at high metabolic risk,
it seems that being fit may attenuate this risk for those youths with elevated
central adiposity.
These results highlight the relevance of CRF as a marker of metabolic and
cardiovascular health in youths. Results from previous research indicated that CRF
is inversely associated with TC [6, 10, 13], TRIG [7, 10, 18], GLU [10, 11], blood
pressure [6, 10, 11], WC [11] and clustered metabolic risk [3, 4, 7, 11, 16, 18, 20,
21]. In the present study, after adjustments for age and sex, CRF was associated
with WC, TRIG, blood pressure and MRS. When analyses were controlled for age,
sex and WC, CRF was still associated with MRS, although the relationship was
attenuated. Similar trends were reported in previous investigations. Ekelund et al.
[11] also described that CRF and clustered metabolic risk were associated and
the correlation was attenuated when the analysis was adjusted for WC as a
confounder. Andersen et al. [3] analyzed the odds ratios for being at high
metabolic risk over the quartiles of CRF and concluded that the lower quartiles of
fitness had an increased risk even after adjustments for fatness. In the comparison
between two fitness groups in the present study, there were differences in most of
the cardiovascular risk factors with healthier levels for the fit group. After
adjustments for WC, differences in TRIG and MRS remained significant,
supporting the notion that the differences between fitness levels were independent
of central adiposity. Indeed, when the risk for being at high metabolic risk was
estimated, the low fit group showed an increased odds ratio in comparison with
the fit group and this association was also independent of central adiposity levels.
Finally, when fitness and central adiposity levels were combined, the risk for
85
having an increased metabolic score was greater for low fit subjects with normal
or high central adiposity. It should be highlighted that there was a meaningful
reduction in the risk of being at high metabolic risk for subjects who had high
central adiposity and were fit, in comparison with those who were low fit and had
high central adiposity too. These associations suggest that being “fat but fit” might
reduce the consequences of obesity over some markers of cardiovascular health,
which is consistent with previous findings [2, 8-10, 15].
Findings from the present study should be pondered with the consideration
of some limitations. Maximal oxygen uptake, the standard measure of
cardiorespiratory fitness, was estimated from the performance in a field test (20m
Shuttle Run). However, previous evidences suggest that these estimations are
valid and accurate indicators of aerobic capacity [19, 22]. Additionally, it should be
pointed that the strength of the relationships described in the present results
should be taken with regardless to the measures of exposures and outcomes. The
lack of a standard measurement for central fat distribution was also a limitation,
given high costs and restricted use in large-scale studies. On the other hand,
waist circumference seems to provide simple and yet effective measures of central
adiposity in children and adolescents, as an alternative to dual-energy X-ray
absorptiometry (DEXA) and others standard measures of body composition [23].
Although the current international standards for the definition of metabolic
syndrome in youths [2, 15] take into account waist circumference, HDL-C,
triglycerides, fasting glucose and blood pressure, the absence of fasting insulin
and homeostatic model assessment (HOMA) did not allowed inferences regarding
the dependent and independent associations between cardiorespiratory fitness,
abdominal obesity and insulin resistance metabolism. Finally, inferences in the
direction of causal effects were limited due to the cross-sectional nature of the
data.
Concluding, evidences from the present analysis support the idea that CRF
is a powerful independent indicator of metabolic and cardiovascular health in
young ages. In terms of primary prevention of cardiovascular diseases, the
86
assessment of CRF is an important tool for targeting candidates for future
intervention. Furthermore, data from the present study suggests that interventions
should promote physical activity with sufficient intensities to induce changes in
CRF with the scope of reducing metabolic risk instead of focusing only in changes
in body composition and weight loss. Current results suggest that even
overweight children could benefit of healthier metabolic conditions after
improvements in CRF.
Acknowledgements
The Foundation of Science and Technology (FCT) supported GS with the PhD
grant reference SFRH/BD/45090/2008. The study was also supported by FCT
with the research project reference PTDC/DES/72424/2006 (FCOMP-01-0124-
FEDER-007183). Authors declare no conflict of interest.
References
1. Adegboye AR, Anderssen SA, Froberg K, Sardinha LB, Heitmann BL,
Steene-Johannessen J, Kolle E, Andersen LB. Recommended aerobic fitness level
for metabolic health in children and adolescents: a study of diagnostic accuracy.
Br J Sports Med 2010; 45: 722-728
2. Alberti KG, Zimmet P, Shaw J. Metabolic syndrome - a new world-wide
definition. A Consensus Statement from the International Diabetes Federation.
Diabet Med 2006; 23: 469-480
3. Andersen LB, Sardinha L, Froberg K, Riddoch CJ, Page AS, Anderssen SA.
Fitness, fatness and clustering of cardiovascular risk factors in children from
Denmark, Estonia and Portugal: The European Youth Heart Study. Int J Pediatr
Obes 2008; 3: 58-66
87
4. Anderssen SA, Cooper AR, Riddoch C, Sardinha LB, Harro M, Brage S,
Andersen LB. Low cardiorespiratory fitness is a strong predictor for clustering of
cardiovascular disease risk factors in children independent of country, age and
sex. Eur J Cardiovasc Prev Rehabil 2007; 14: 526-531
5. Blair SN, Kohl HW, 3rd, Paffenbarger RS, Jr., Clark DG, Cooper KH,
Gibbons LW. Physical fitness and all-cause mortality. A prospective study of
healthy men and women. JAMA 1989; 262: 2395-2401
6. Boreham C, Twisk J, Murray L, Savage M, Strain JJ, Cran G. Fitness,
fatness, and coronary heart disease risk in adolescents: The Northern Ireland
Young Hearts Project. Med Sci Sports Exerc 2001; 33: 270-274
7. Brage S, Wedderkopp N, Ekelund U, Franks PW, Wareham NJ, Andersen
LB, Froberg K. Features of the metabolic syndrome are associated with
objectively measured physical activity and fitness in Danish children: The European
Youth Heart Study (EYHS). Diabetes Care 2004; 27: 2141-2148
8. Eisenmann JC, Welk GJ, Wickel EE, Blair SN. Combined influence of
cardiorespiratory fitness and body mass index on cardiovascular disease risk
factors among 8-18 year old youth: The Aerobics Center Longitudinal Study. Int J
Pediatr Obes 2007; 2: 66-72
9. Eisenmann JC, Welk GJ, Ihmels M, Dollman J. Fatness, fitness, and
cardiovascular disease risk factors in children and adolescents. Med Sci Sports
Exerc 2007; 39: 1251-1256
10. Eisenmann JC, Katzmarzyk PT, Perusse L, Tremblay A, Despres JP,
Bouchard C. Aerobic fitness, body mass index, and CVD risk factors among
adolescents: The Quebec family study. Int J Obes 2005; 29: 1077-1083
11. Ekelund U, Anderssen SA, Froberg K, Sardinha LB, Andersen LB, Brage S.
Independent associations of physical activity and cardiorespiratory fitness with
metabolic risk factors in children: The European youth heart study. Diabetologia
2007; 50: 1832-1840
88
12. Friedewald T, Levy RI, Frederickson DS. Estimation of the concentration of
low-density lipoprotein cholesterol in plasma, without use of the preparative
ultracentrifuge. Clin Chem 1972; 18: 499-502
13. Gutin B, Yin Z, Humphries MC, Bassali R, Le NA, Daniels S, Barbeau P.
Relations of body fatness and cardiovascular fitness to lipid profile in black and
white adolescents. Pediatr Res 2005; 58: 78-82
14. Harriss DJ, Atkinson G. Update--Ethical standards in sport and exercise
science research. Int J Sports Med 2011; 32: 819-821
15. IDF. The IDF consensus definition of the metabolic syndrome in children
and adolescents. In: International Diabetes Federation Communications; 2007
16. Lobelo F, Pate RR, Dowda M, Liese AD, Ruiz JR. Validity of
cardiorespiratory fitness criterion-referenced standards for adolescents. Med Sci
Sports Exerc 2009; 41: 1222-1229
17. Myers J, Prakash M, Froelicher V, Do D, Partington S, Atwood JE. Exercise
capacity and mortality among men referred for exercise testing. N Engl J Med
2002; 346: 793-801
18. Ruiz JR, Ortega FB, Meusel D, Harro M, Oja P, Sjöström M.
Cardiorespiratory fitness is associated with features of metabolic risk factors in
children. Should cardiorespiratory fitness be assessed in a European health
monitoring system? The European Youth Heart Study. J Public Health 2006; 14:
94-102
19. Ruiz JR, Silva G, Oliveira N, Ribeiro J, Oliveira J, Mota J. Criterion-related
validity of the 20-m shuttle run test in youths aged 13-19 years. J Sports Sci
2009; 27: 899-906
20. Ruiz JR, Ortega FB, Rizzo NS, Villa I, Hürtig-Wennlöf A, Oja L, Sjöström M.
High cardiovascular fitness is associated with low metabolic risk score in children:
The European Youth Heart Study. Pediatr Res 2007; 61: 350-355
89
21. Silva G, Aires L, Mota J, Oliveira J, Ribeiro JC. Normative and criterion-
related standards for shuttle run performance in youth. Pediatr Exerc Sci 2012;
24: 157-169
22. Silva G, Oliveira NL, Aires L, Mota J, Oliveira J, Ribeiro JC. Calculation and
validation of models for estimating VO2max from the 20-m shuttle run test in
children and adolescents. Arch Exerc Health Dis 2012; 3: 145-152
23. Taylor RW, Jones IE, Williams SM, Goulding A. Evaluation of waist
circumference, waist-to-hip ratio, and the conicity index as screening tools for
high trunk fat mass, as measured by dual-energy X-ray absorptiometry, in children
aged 3-19 y. Am J Clin Nutr 2000; 72: 490-495
24. The Cooper Institute for Aerobics Research. FITNESSGRAM Test
Administration Manual. 3rd ed. Champaign, Illinois, USA: Human Kinetics; 2004
25. The Third National Health and Nutrition Examination Survey. The Third
National Health and Nutrition Examination Survey (NHANES III 1988-94) Reference
Manuals and Reports; 1996
26. Welk GJ, Laurson KR, Eisenmann JC, Cureton KJ. Development of youth
aerobic-capacity standards using receiver operating characteristic curves. Am J
Prev Med 2011; 41: S111-116

90
91
Study IV
SUBMITED
Silva, G., Andersen, L.B., Aires, L., Mota, J., Oliveira, J., Ribeiro, J.C.
Associat ions between the contexts of practice of physical
act iv ity, levels of moderate to vigorous physical act iv ity
and cardiorespiratory f i tness in chi ldren and adolescents

92
93
!
!
Associat ions between the contexts of practice of physical activity,
levels of moderate to vigorous physical activity and cardiorespiratory
f i tness in chi ldren and adolescents
Gustavo Silva, Lars Bo Andersen, Luísa Aires, Jorge Mota, José Oliveira and José
Carlos Ribeiro
Abstract
The purpose of this study was to analyse the associations between the levels of
participation in different contexts of physical activity (PA), moderate to vigorous
physical activity (MVPA) and cardiorespiratory fitness (CRF) levels. The study
comprised 310 subjects (183 girls and 127 boys) aged 11-18 years. Participation
levels in PA contexts were assessed by questionnaire and habitual PA was
measured objectively with accelerometers. Twenty meters Shuttle Run Test was
used to estimate CRF. Logistic regression analyses were carried out with CRF as
the outcome. The OR for being fit was greater for those who comply with
60min/day in MVPA (OR=2.612; 95%CI=1.614-4.225) in comparison with those
who not. Participation in competitive sports at club levels increased the chances
of being fit (OR=13.483; 95%CI=4.560-39.864), independently of MVPA levels.
There were positive and significant trends in CRF and objectively measured PA
across the levels of engagement in competitive sports (P<0.05). Concluding,
participation in competitive sports at club level is more effective than other
contexts of PA to reach healthier levels of CRF and recommend levels of MVPA.
Keywords: accelerometers, questionnaires, sports participation, aerobic capacity,
youth.
94
!
!
Introduction
Cardiorespiratory fitness (CRF) has been considered an independent and
additive marker of cardiovascular health. In adults, low CRF is associated with
increased risk of cardiovascular morbidity, and all cause and cardiovascular
mortality (Blair et al., 1989; Wei, Gibbons, Kampert, Nichaman, & Blair, 2000). In
youth, the evidence from epidemiological studies suggest that CRF is associated
with the clustering of CVD risk factors (Anderssen et al., 2007), which tends to
track from adolescence through adulthood (Andersen, Hasselstrøm, Grønfeldt,
Hansen, & Karsten, 2004). CRF might have a health protective effect since it has
been inversely associated with body fat (Andersen et al., 2008), features of the
metabolic syndrome (Andersen et al., 2008; Brage et al., 2004) and arterial
stiffness (Reed et al., 2005). More recently, it was suggested that CRF could be
considered an independent risk factor for metabolic disorders in youths (Andersen
et al., 2008). Therefore, CRF evaluation is paramount to identify subjects at risk or
monitoring adverse health outcomes (Ruiz et al., 2006; Ruiz, Ortega, Meusel, &
Sjöström, 2007; J.R. Ruiz et al., 2007).
There is a plausible framework suggesting that physical activity (PA) and
exercise of moderate to vigorous intensities could promote favourable changes in
CRF and cardiovascular risk factors. Higher levels of moderate to vigorous
physical activity (MVPA) are associated with improved CRF (Gutin, Yin, Humphries,
& Barbeau, 2005), reduced fatness (Gutin et al., 2002), favourable lipid profile
(Tolfrey, Jones, & Campbell, 2004) and reduced metabolic risk (Andersen et al.,
2006; Brage et al., 2004). Although PA and CRF are correlated, they are
independently associated with metabolic risk factors (Andersen et al., 2008;
Ekelund et al., 2007), which means that they may affect cardiovascular health
through different ways.
Physical activity is usually described in relation to intensity, duration and
frequency, which together constitute the volume of activity (Caspersen, Powell, &
Christenson, 1985; Corder, Ekelund, Steele, Wareham, & Brage, 2008). In these
95
!
!
terms and based on the compilation of previous evidences (Janssen, 2007;
Strong et al., 2005), the World Health Organization recommend that school aged
people should accumulate at least 60 minutes in MVPA daily (WHO, 2010). The
accomplishment of PA guidelines could be ensured in different contexts. However,
data is still restricted about how youngsters’ PA varies across types and contexts
and how these relationships extend for other parameters of health. A better
understanding of these variables might contribute to enhance the effectiveness of
interventions and public health policies (Koorts et al., 2011). Therefore, the
purpose of this study was to analyse the associations between the engagement in
different contexts of PA, levels of MVPA and CRF levels.
Methods
Participants
Anthropometric measures, cardiorespiratory fitness and physical activity
were assessed in 397 girls and 292 boys from public schools in the District of
Porto, Portugal. From this group, 310 subjects (183 girls and 127 boys aged 11-
18 years old) with complete data and valid accelerometers measurements
constituted the final sample of the study. Excluded participants (379 individuals)
had no valid data for objectively measured physical activity by accelerometers. In
the comparison between subjects with complete and incomplete data, no
differences (P>0.05) were found for age, height, weight, BMI, SR laps, VO2max
and PAI. The proportion of girls (46.1%) and boys (43.5%) with complete data was
similar (!2=0.460; P=0.497). The study was carried out following the Declaration of
Helsinki guidelines for human research. The study’s purpose, nature, benefits and
risks were explained to participants, parents/guardians and teachers. Informed
written consent was obtained from the participants’ parents/guardians. The study
protocol was approved by the Review Committee of the Scientific Board of the
96
!
!
Faculty of Sport of the University of Porto as well as by the Foundation of Science
and Technology from Portugal.
Anthropometric Measurements
Body mass and height were measured following standard procedures
(Lohman, Roche, & Martorell, 1988). Body height was measured to the nearest
mm in bare or stocking feet with adolescents’ standing upright against a
stadiometer (Holtain Ltd. – Crymmych, Pembrokeshire, UK). Weight was
measured to the nearest 0.1 kg, with scholars lightly dressed, using an electronic
weight scale (Tanita Inner Scan BC 532; Tanita Corporation – Tokyo, Japan).
Body mass index (BMI) was calculated from the ratio of body weight (kg)/body
height (m2).
Cardiorespiratory Fitness
Participants performed the 20m Shuttle Run Test according to the
FITNESSGRAM™ protocol (The Cooper Institute for Aerobics Research, 2004). All
participants were familiar with the test, since the FITNESSGRAM™ test battery is
included in the physical education curriculum in a National Program. Total number
of completed shuttles (SR laps) was recorded. Based on the performance
achieved in shuttle-run test, maximal oxygen uptake (VO2max), which is
considered as the main representative parameter of CRF level, was estimated
according the following equation (Silva et al., 2012): VO2max= 43.313 + 4.567*sex
- 0.560*BMI + 2.785*stages. FITNESSGRAM™ reference standards for VO2max
(Welk, Laurson, Eisenmann, & Cureton, 2011) were used to classify participants
as low fit (below health fitness zone) and fit (health fitness zone).
97
!
!
Context of Practice of Physical Activity
The physical activity contexts of practice were assessed by a questionnaire
(Ledent, Cloes, & Piéron, 1997), which have been previously determined to have
good reliability with strong intra-class correlation coefficients (ICC: 0.92–0.96)
(Mota & Esculcas, 2002; Raitakari et al., 1994). The questionnaire consists of five
questions, each one with four answer choices (four-point ordinal scale): Question
1 - Do you take part in organized sport outside school? Never (1); Less than once
a week (2); At least once a week (3); Almost every day (4); Question 2 - Do you
take part in non-organized sport outside school? Never (1); Less than once a
week (2); At least once a week (3); Almost every day (4); Question 3 - How many
times per week do you take part in sport or PA for at least 20 minutes outside
school? Never (1); Less than once a week (2); Between once a week and once a
month (3); Twice or more times a week (4); Question 4 - How many hours per
week do you usually take part in physical activity outside school, which causes
you to get out of breath or sweat? Never (1); 30 min to 1 hour (2); 2 to 3 hours (3);
4 hours or more (4); Question 5 - Do you take part in a competitive sport? Never
(1); No, but I participated (2); Yes, at school (3); Yes, in a club (4). A physical
activity index (PAI) was obtained according to the total sum of the points
(maximum 20) with increasing ranks from the sedentary to physically active levels.
Objectively Measured Physical Activity
PA was objectively assessed by accelerometers (GTM1, Actigraph, Florida)
during 7 consecutive days and data was recorded in 15 seconds sampling
periods (epochs). The standard software PROPERO (developed by the Centre of
Research in Childhood Health of the University of Southern Denmark, 2011) was
used to reduce the raw activity data from the accelerometers into daily physical
activity. Time periods with at least 10 consecutive minutes of zero counts
98
!
!
recorded were excluded from analysis assuming that the monitor was not worn. A
minimum recording of 10-hours/day was the criteria to accept daily PA data as
valid. Individual’s data were only accepted for analysis if at least two-week days
and one weekend day were successfully assessed. For each outcome from
accelerometer-reduced data, values were adjusted for the average wearing time
(734.3±59.8 min/day) and for differences between weekdays and weekend days.
The main outcomes of reduced data were: total physical activity [total PA
(counts/min/day)], time in sedentary physical activity [SEDPA (min/day)], light
physical activity [LIGPA (min/day)], moderate physical activity [MODPA (min/day)],
vigorous physical activity [VIGPA (min/day)] and moderate to vigorous physical
activity [MVPA (min/day)]. To determine the time spent in PA of different intensities,
the following counts intervals were considered: 0-499 for SEDPA, 500-1999 for
LIGPA, 2000-3999 for MODPA, !4000 for VIGPA (Ekelund et al., 2007) and !
2000 for MVPA (Andersen et al., 2006). An average of 60 minutes/day spent in
MVPA for accepted valid days was set as an operational definition of compliance
with PA guidelines (Janssen, 2007; Strong et al., 2005). Accordingly, subjects with
an average of less than 60min/day of MVPA were classified as low active, and
those with 60min/day or more of MVPA were considered active.
Statistics
For the descriptive analysis, data from continuous variables were
expressed as mean and standard deviation (M±SD). Age, height, SR laps,
VO2max, PAI and SEDPA were normally distributed. Total PA, LIGPA, MODPA,
VIGPA and MVPA were positively skewed and thus transformed to their natural
logarithm for comparisons tests. Independent T-test was employed to test mean
differences between gender and CRF levels. Nominal and ordinal variables were
described as absolute and relative frequencies. Chi-square statistic was used to
test for frequencies differences between sexes and CRF groups across the levels
of engagement in each PA context. Pearson correlation coefficients (r) were used
99
!
!
to examine how age was correlated with VO2max, total PA, MVPA and PAI.
Logistic regression was employed with CRF levels (0=low fit and 1=fit) as the
dependent variable and PA contexts and MVPA levels set as independent
variables. For each independent variable, the unadjusted (crude) association with
the outcome was explored. Finally, a multiple logistic regression (adjusted analysis)
was carried out with all independent variables and potential confounders (age, sex
and age*sex interaction) included in the model. Stepwise method with backward
selection was employed retaining the independent variables with P value <0.05 in
the final model. The same approach preceded assuming MVPA levels (0=low
active and 1=active) as the outcome and PA contexts as predictors. General
Linear Models (GLM) adjusted for age and sex were conducted to test trends and
differences across the levels of participation in competitive sports. Analyses were
carried out with the definitive sample of 310 participants with complete data. All
analyses were carried out in SPSS 19.0 with significance level set at 0.05.
Results
Participant’s characteristics (n=310) separated by sex, cardiorespiratory
fitness and physical activity levels are presented in Table 1. Compared to girls,
boys were significantly taller and heavier. Moreover, boys and those classified as
fit, compared to girls and those classified as low fit, showed higher values for CRF,
PAI, total PA, time spent in MODPA, VIGPA, and MVPA. Girls, and the low fit
participants, had higher values of time spent in SEDPA. BMI was higher for low fit
participants. Participants classified as active, compared to the low active group,
showed higher values in height, weight, SR laps, VO2max, PAI, total physical
activity, LIGPA, MODPA, VIGPA and MVPA. Time spent in SEDPA was higher for
low active subjects.
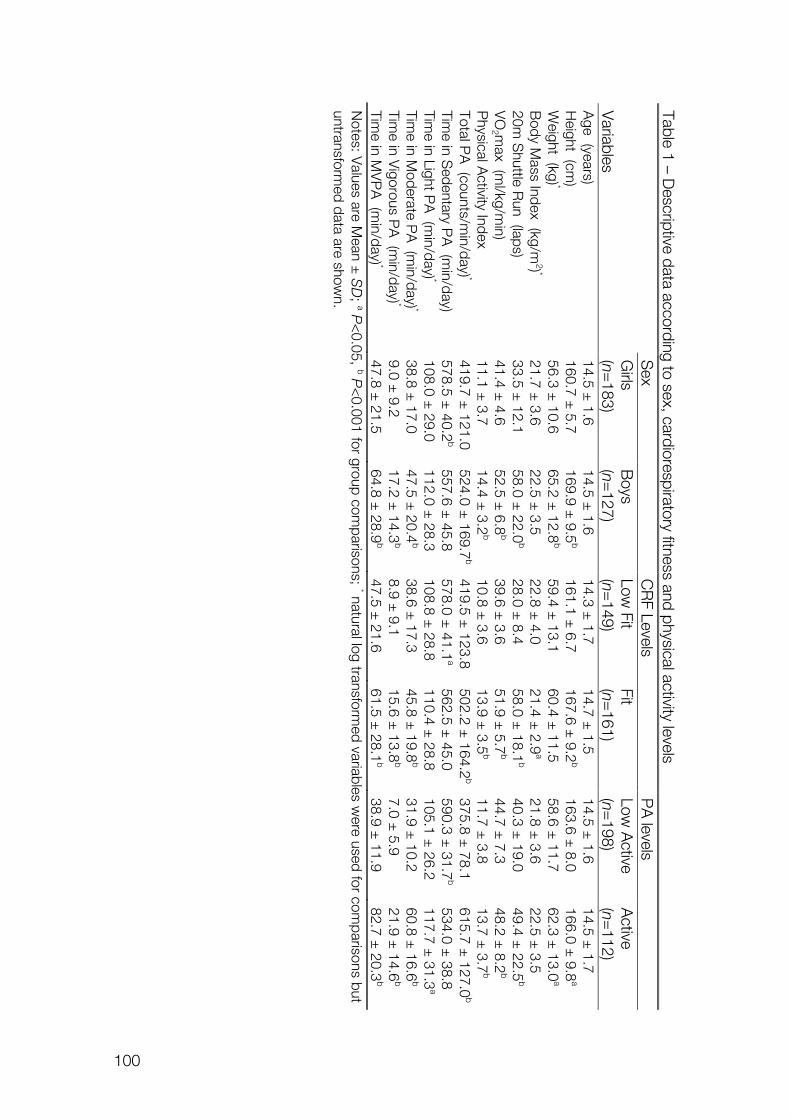
100
!
! Table 1 – Descriptive data according to sex, cardiorespiratory fitness and physical activity levels
S
ex C
RF Levels
PA
levels
Variables
Girls
(n=183)
Boys
(n=127)
Low Fit
(n=149)
Fit (n=
161) Low
Active
(n=198)
Active
(n=112)
Age (years)
14.5 ± 1.6
14.5 ± 1.6
14.3 ± 1.7
14.7 ± 1.5
14.5 ± 1.6
14.5 ± 1.7
Height (cm
) 160.7 ±
5.7 169.9 ±
9.5b
161.1 ± 6.7
167.6 ± 9.2
b 163.6 ±
8.0 166.0 ±
9.8a
Weight (kg) *
56.3 ± 10.6
65.2 ± 12.8
b 59.4 ±
13.1 60.4 ±
11.5 58.6 ±
11.7 62.3 ±
13.0a
Body M
ass Index (kg/m2) *
21.7 ± 3.6
22.5 ± 3.5
22.8 ± 4.0
21.4 ± 2.9
a 21.8 ±
3.6 22.5 ±
3.5 20m
Shuttle R
un (laps) 33.5 ±
12.1 58.0 ±
22.0b
28.0 ± 8.4
58.0 ± 18.1
b 40.3 ±
19.0 49.4 ±
22.5b
VO
2 max (m
l/kg/min)
41.4 ± 4.6
52.5 ± 6.8
b 39.6 ±
3.6 51.9 ±
5.7b
44.7 ± 7.3
48.2 ± 8.2
b P
hysical Activity Index
11.1 ± 3.7
14.4 ± 3.2
b 10.8 ±
3.6 13.9 ±
3.5b
11.7 ± 3.8
13.7 ± 3.7
b Total P
A (counts/m
in/day) * 419.7 ±
121.0 524.0 ±
169.7b
419.5 ± 123.8
502.2 ± 164.2
b 375.8 ±
78.1 615.7 ±
127.0b
Time in S
edentary PA
(min/day)
578.5 ± 40.2
b 557.6 ±
45.8 578.0 ±
41.1a
562.5 ± 45.0
590.3 ± 31.7
b 534.0 ±
38.8 Tim
e in Light PA
(min/day) *
108.0 ± 29.0
112.0 ± 28.3
108.8 ± 28.8
110.4 ± 28.8
105.1 ± 26.2
117.7 ± 31.3
a Tim
e in Moderate P
A (m
in/day) * 38.8 ±
17.0 47.5 ±
20.4b
38.6 ± 17.3
45.8 ± 19.8
b 31.9 ±
10.2 60.8 ±
16.6b
Time in V
igorous PA
(min/day) *
9.0 ± 9.2
17.2 ± 14.3
b 8.9 ±
9.1 15.6 ±
13.8b
7.0 ± 5.9
21.9 ± 14.6
b Tim
e in MV
PA
(min/day) *
47.8 ± 21.5
64.8 ± 28.9
b 47.5 ±
21.6 61.5 ±
28.1b
38.9 ± 11.9
82.7 ± 20.3
b N
otes: Values are M
ean ± SD
; a P<
0.05, b P<
0.001 for group comparisons; * natural log transform
ed variables were used for com
parisons but untransform
ed data are shown.
101
!
!
Correlation analyses indicated that age was not correlated with VO2max
(r=0.081; P=0. 276), total PA (r=-0.089; P=0.232), MVPA (r=-0.007; P=0.925) or
PAI (r=-0.080; p=0.281) in girls. In boys, age was correlated with VO2max
(r=0.440; P<0.001), but not with total PA (r=0.039; P=0.667), MVPA (r=0.071;
P=0.430) and PAI (r=-0.001; P=0.988).
The proportions of participants classified as fit were different for girls and
boys (!2=113.273; P<0.001). 26.8% of girls and 88.2% of boys were classified as
fit according to FITNESSGRAM™ standards for CRF. There were also differences
between the proportions of girls (24.6%) and boys (52.8%) that meet a daily
average of 60 minutes spent in MVPA (!2=25.774; P<0.001). Moreover, 65.2% of
active participants were classified as fit, while 55.6% of low active participants
were low fit (!2=12.320; P<0.001). In Table 2, the proportion of participants in
each PA context level is described according to sex, CRF and PA levels. In the
lower levels of engagement in the PA contexts, the proportions were higher for
girls, low fit and low active participants. For higher scores in PA contexts, the
proportions were increased for boys, and for those who are fit or active.
Table 3 describes logistic regression models for estimating odds ratios OR
for being fit and for being active, according to engagement levels in PA contexts.
Crude analyses indicated a significant trend for the association between age and
CRF (!=0.177; 95%CI=0.035-0.319; P<0.001; OR=1.194; 95%CI=1.035–1.376).
In comparison with girls, boys presented an increased odds ratio (OR) for being fit
(OR=20.419; 95%CI=10.870-38.356). The interaction age*sex (boys) was also
associated with CRF levels (OR=1.246; 95%CI=1.190-1.304). In the unadjusted
analysis (crude), each independent variable presented some level with an
increased OR for being fit, in comparison with reference categories. To estimate
the OR for being fit, all PA contexts were included in the adjusted model (multiple
logistic regression) together with age, sex, age*sex interaction and MVPA levels.
After seven steps of backward selection, only the level of engagement in
competitive sports, adjusted for sex and age*sex interaction, remained associated
with the chances of being fit.
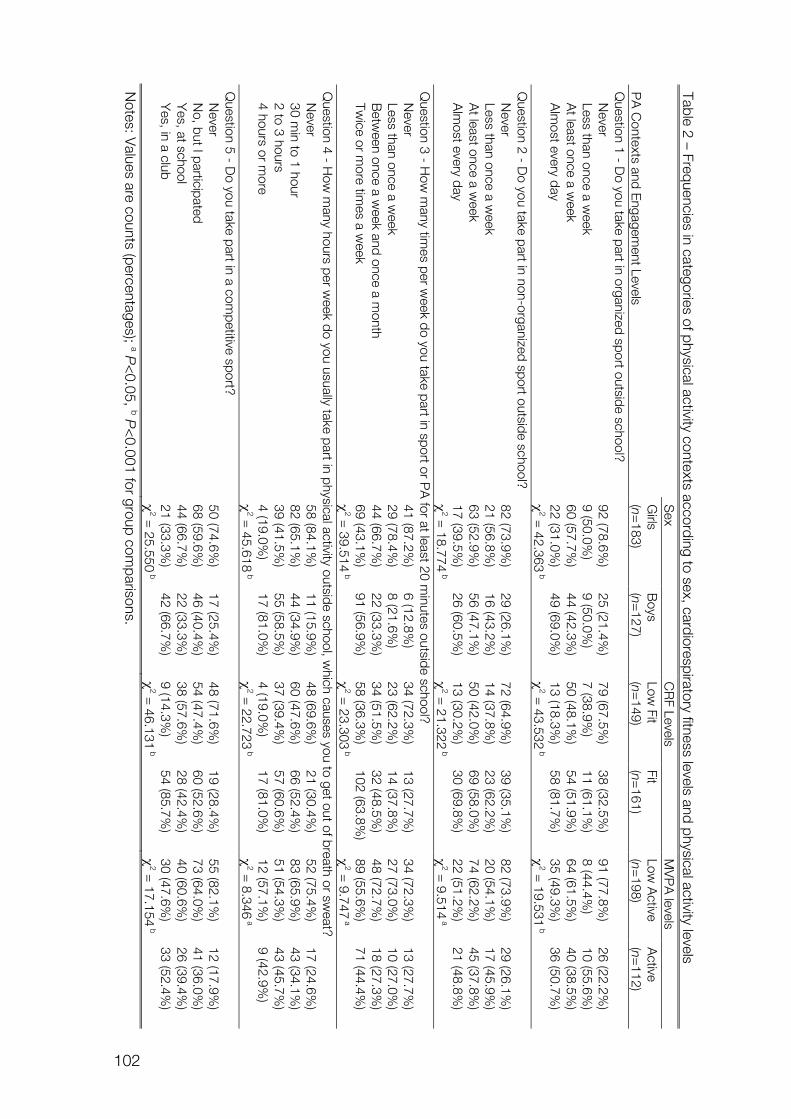
102
!
! Table 2 – Frequencies in categories of physical activity contexts according to sex, cardiorespiratory fitness levels and physical activity levels
PA
Contexts and E
ngagement Levels
Sex
CR
F Levels M
VP
A levels
Girls
(n=183)
Boys
(n=127)
Low Fit
(n=149)
Fit (n=
161) Low
Active
(n=198)
Active
(n=112)
Question 1 - D
o you take part in organized sport outside school? N
ever 92 (78.6%
) 25 (21.4%
) 79 (67.5%
) 38 (32.5%
) 91 (77.8%
) 26 (22.2%
) Less than once a w
eek 9 (50.0%
) 9 (50.0%
) 7 (38.9%
) 11 (61.1%
) 8 (44.4%
) 10 (55.6%
) A
t least once a week
60 (57.7%)
44 (42.3%)
50 (48.1%)
54 (51.9%)
64 (61.5%)
40 (38.5%)
Alm
ost every day 22 (31.0%
) 49 (69.0%
) 13 (18.3%
) 58 (81.7%
) 35 (49.3%
) 36 (50.7%
)
!2 =
42.363 b
!2 =
43.532 b
!2 =
19.531 b
Question 2 - D
o you take part in non-organized sport outside school? N
ever 82 (73.9%
) 29 (26.1%
) 72 (64.9%
) 39 (35.1%
) 82 (73.9%
) 29 (26.1%
) Less than once a w
eek 21 (56.8%
) 16 (43.2%
) 14 (37.8%
) 23 (62.2%
) 20 (54.1%
) 17 (45.9%
) A
t least once a week
63 (52.9%)
56 (47.1%)
50 (42.0%)
69 (58.0%)
74 (62.2%)
45 (37.8%)
Alm
ost every day 17 (39.5%
) 26 (60.5%
) 13 (30.2%
) 30 (69.8%
) 22 (51.2%
) 21 (48.8%
)
!2 =
18.774 b
!2 =
21.322 b
!2 =
9.514 a
Question 3 - H
ow m
any times per w
eek do you take part in sport or PA
for at least 20 minutes outside school?
Never
41 (87.2%)
6 (12.8%)
34 (72.3%)
13 (27.7%)
34 (72.3%)
13 (27.7%)
Less than once a week
29 (78.4%)
8 (21.6%)
23 (62.2%)
14 (37.8%)
27 (73.0%)
10 (27.0%)
Betw
een once a week and once a m
onth 44 (66.7%
) 22 (33.3%
) 34 (51.5%
) 32 (48.5%
) 48 (72.7%
) 18 (27.3%
) Tw
ice or more tim
es a week
69 (43.1%)
91 (56.9%)
58 (36.3%)
102 (63.8%)
89 (55.6%)
71 (44.4%)
!
2 = 39.514
b !
2 = 23.303
b !
2 = 9.747
a Q
uestion 4 - How
many hours per w
eek do you usually take part in physical activity outside school, which causes you to get out of breath or sw
eat? N
ever 58 (84.1%
) 11 (15.9%
) 48 (69.6%
) 21 (30.4%
) 52 (75.4%
) 17 (24.6%
) 30 m
in to 1 hour 82 (65.1%
) 44 (34.9%
) 60 (47.6%
) 66 (52.4%
) 83 (65.9%
) 43 (34.1%
) 2 to 3 hours
39 (41.5%)
55 (58.5%)
37 (39.4%)
57 (60.6%)
51 (54.3%)
43 (45.7%)
4 hours or more
4 (19.0%)
17 (81.0%)
4 (19.0%)
17 (81.0%)
12 (57.1%)
9 (42.9%)
!
2 = 45.618
b !
2 = 22.723
b !
2 = 8.346
a Q
uestion 5 - Do you take part in a com
petitive sport? N
ever 50 (74.6%
) 17 (25.4%
) 48 (71.6%
) 19 (28.4%
) 55 (82.1%
) 12 (17.9%
) N
o, but I participated 68 (59.6%
) 46 (40.4%
) 54 (47.4%
) 60 (52.6%
) 73 (64.0%
) 41 (36.0%
) Y
es, at school 44 (66.7%
) 22 (33.3%
) 38 (57.6%
) 28 (42.4%
) 40 (60.6%
) 26 (39.4%
) Y
es, in a club 21 (33.3%
) 42 (66.7%
) 9 (14.3%
) 54 (85.7%
) 30 (47.6%
) 33 (52.4%
)
!2 =
25.550 b
!2 =
46.131 b
!2 =
17.154 b
Notes: V
alues are counts (percentages); a P<
0.05, b P<
0.001 for group comparisons.
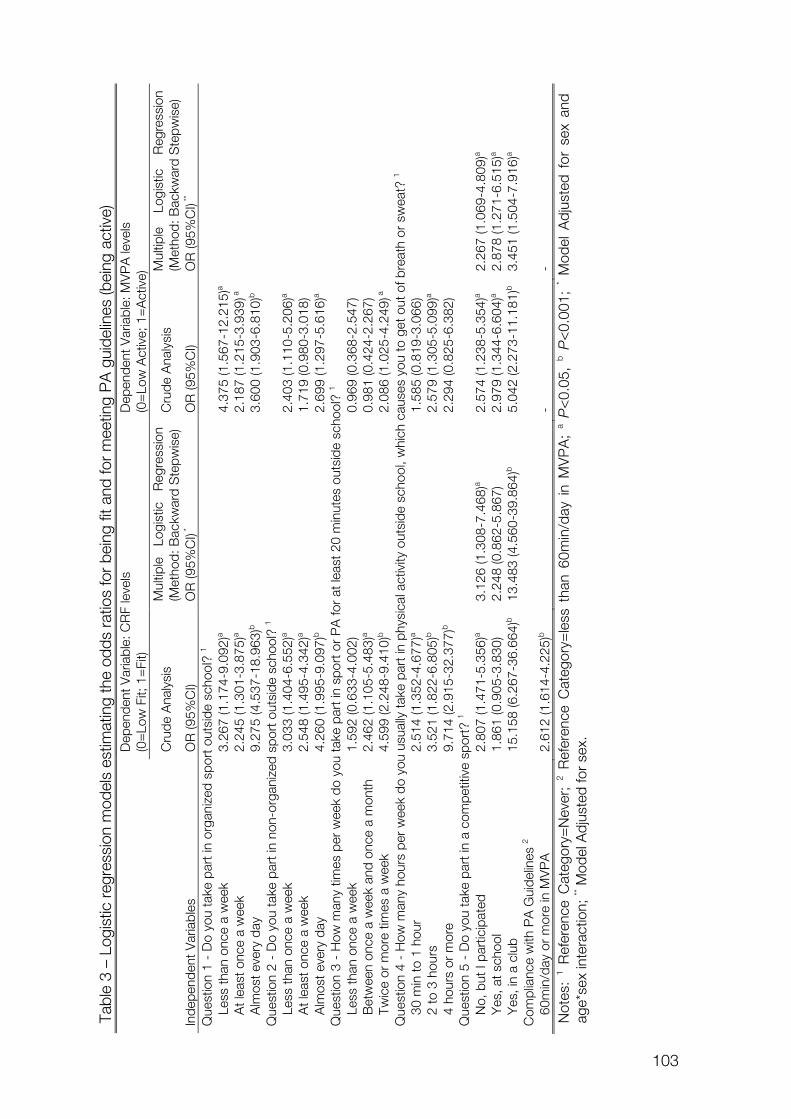
103
!
!Tabl
e 3
– Lo
gist
ic r
egre
ssio
n m
odel
s es
timat
ing
the
odds
rat
ios
for
bein
g fit
and
for
mee
ting
PA
gui
delin
es (b
eing
act
ive)
Inde
pend
ent V
aria
bles
Dep
ende
nt V
aria
ble:
CR
F le
vels
(0
=Lo
w F
it; 1
=Fi
t) D
epen
dent
Var
iabl
e: M
VP
A le
vels
(0
=Lo
w A
ctiv
e; 1
=A
ctiv
e)
Cru
de A
naly
sis
Mul
tiple
Lo
gist
ic
Reg
ress
ion
(Met
hod:
Bac
kwar
d S
tepw
ise)
C
rude
Ana
lysi
s M
ultip
le
Logi
stic
R
egre
ssio
n (M
etho
d: B
ackw
ard
Ste
pwis
e)
OR
(95%
CI)
OR
(95%
CI) *
O
R (9
5%C
I) O
R (9
5%C
I) **
Que
stio
n 1
- D
o yo
u ta
ke p
art i
n or
gani
zed
spor
t out
side
sch
ool?
1
Less
than
onc
e a
wee
k 3.
267
(1.1
74-9
.092
)a
4.37
5 (1
.567
-12.
215)
a
A
t lea
st o
nce
a w
eek
2.24
5 (1
.301
-3.8
75)a
2.
187
(1.2
15-3
.939
) a
Alm
ost e
very
day
9.
275
(4.5
37-1
8.96
3)b
3.
600
(1.9
03-6
.810
)b
Que
stio
n 2
- D
o yo
u ta
ke p
art i
n no
n-or
gani
zed
spor
t out
side
sch
ool?
1
Less
than
onc
e a
wee
k 3.
033
(1.4
04-6
.552
)a
2.40
3 (1
.110
-5.2
06)a
At l
east
onc
e a
wee
k 2.
548
(1.4
95-4
.342
)a
1.71
9 (0
.980
-3.0
18)
Alm
ost e
very
day
4.
260
(1.9
95-9
.097
)b
2.69
9 (1
.297
-5.6
16)a
Q
uest
ion
3 -
How
man
y tim
es p
er w
eek
do y
ou ta
ke p
art i
n sp
ort o
r P
A fo
r at
leas
t 20
min
utes
out
side
sch
ool?
1
Less
than
onc
e a
wee
k 1.
592
(0.6
33-4
.002
)
0.96
9 (0
.368
-2.5
47)
Bet
wee
n on
ce a
wee
k an
d on
ce a
mon
th
2.46
2 (1
.105
-5.4
83)a
0.
981
(0.4
24-2
.267
)
Tw
ice
or m
ore
times
a w
eek
4.59
9 (2
.248
-9.4
10)b
2.
086
(1.0
25-4
.249
) a
Q
uest
ion
4 -
How
man
y ho
urs
per
wee
k do
you
usu
ally
take
par
t in
phys
ical
act
ivity
out
side
sch
ool,
whi
ch c
ause
s yo
u to
get
out
of b
reat
h or
sw
eat?
1
30 m
in to
1 h
our
2.51
4 (1
.352
-4.6
77)a
1.
585
(0.8
19-3
.066
)
2
to 3
hou
rs
3.52
1 (1
.822
-6.8
05)b
2.
579
(1.3
05-5
.099
)a
4
hour
s or
mor
e 9.
714
(2.9
15-3
2.37
7)b
2.
294
(0.8
25-6
.382
)
Que
stio
n 5
- D
o yo
u ta
ke p
art i
n a
com
petit
ive
spor
t? 1
N
o, b
ut I
part
icip
ated
2.
807
(1.4
71-5
.356
)a 3.
126
(1.3
08-7
.468
)a 2.
574
(1.2
38-5
.354
)a 2.
267
(1.0
69-4
.809
)a
Yes
, at s
choo
l 1.
861
(0.9
05-3
.830
) 2.
248
(0.8
62-5
.867
) 2.
979
(1.3
44-6
.604
)a 2.
878
(1.2
71-6
.515
)a
Yes
, in
a cl
ub
15.1
58 (6
.267
-36.
664)
b 13
.483
(4.5
60-3
9.86
4)b
5.04
2 (2
.273
-11.
181)
b 3.
451
(1.5
04-7
.916
)a C
ompl
ianc
e w
ith P
A G
uide
lines
2
60
min
/day
or
mor
e in
MV
PA
2.
612
(1.6
14-4
.225
)b
- -
Not
es:
1 Ref
eren
ce C
ateg
ory=
Nev
er;
2 Ref
eren
ce C
ateg
ory=
less
tha
n 60
min
/day
in
MV
PA
; a P
<0.
05,
b P<
0.00
1; * M
odel
Adj
uste
d fo
r se
x an
d ag
e*se
x in
tera
ctio
n; **
Mod
el A
djus
ted
for
sex.
104
!
!
When the compliance with an average of 60min/day of MVPA was
established as the outcome, no trend was detected for the relationship between
age and MVPA levels (!=0.082; 95%CI=-0.132-0.158; P=0.857; OR=1.194;
95%CI=0.877–1.171). The OR for being active was higher in boys (OR=3.424;
95%CI=2.110 – 5.558) when compared to girls. The interaction age*sex (boys)
was also associated with MVPA levels (OR=1.086; 95%CI=1.050-1.122). In the
unadjusted analysis, most of PA context had some level of engagement
associated with an increased OR for being active, except for the participation in
sport or PA for at least 20 minutes outside school (question 3). Multiple logistic
regression, after seven steps of backward selection, showed that taking part in
competitive sports (question 5) increases the OR for being active, with adjustment
for sex.
Table 4 presents descriptive values for physical characteristics, CRF and
PA according to the participation in competitive sports. GLM with adjustments for
age and sex indicated significant trends for SR laps, VO2max, PAI, total PA,
SEDPA, MODPA, VIGA and MVPA. With exception of SEDPA, which was higher
for those who never took part in competitive sports, greater values of CRF and PA
were found for those who participate in competitive sports in a club.
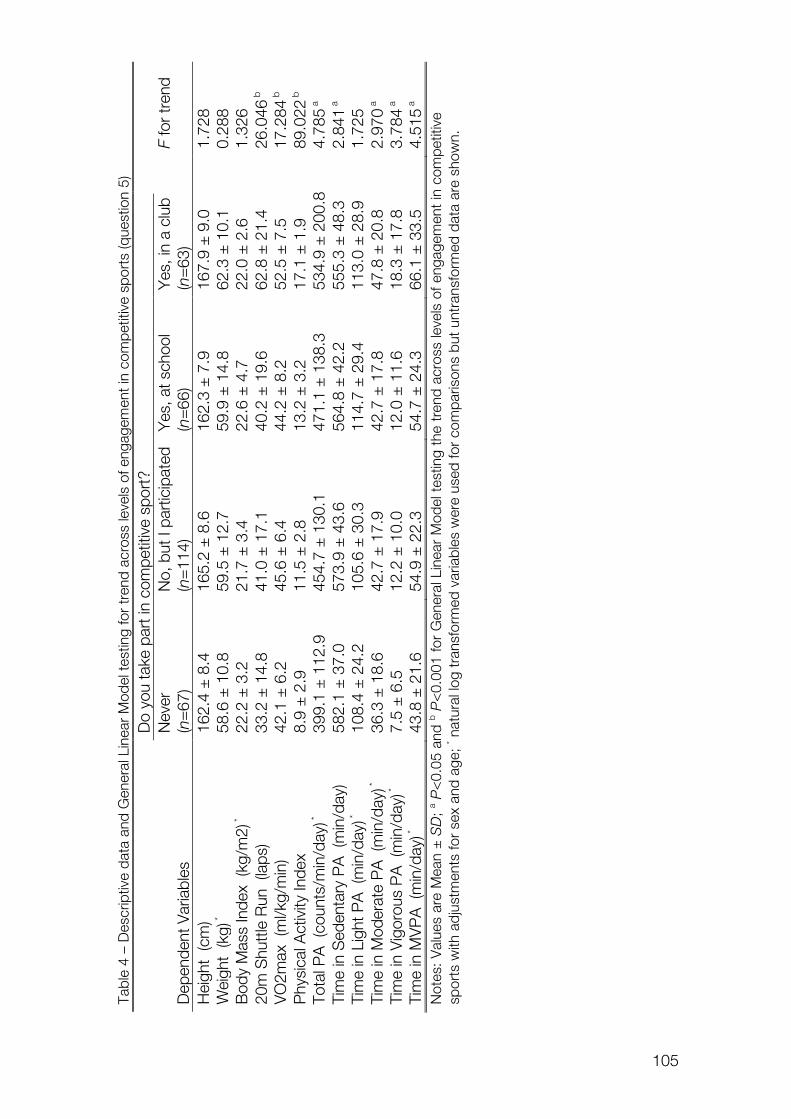
105
!
!Tabl
e 4
– D
escr
iptiv
e da
ta a
nd G
ener
al L
inea
r M
odel
test
ing
for
tren
d ac
ross
leve
ls o
f eng
agem
ent i
n co
mpe
titiv
e sp
orts
(que
stio
n 5)
Do
you
take
par
t in
com
petit
ive
spor
t?
Nev
er
No,
but
I pa
rtic
ipat
ed
Yes
, at s
choo
l Y
es, i
n a
club
F
for
tren
d D
epen
dent
Var
iabl
es
(n=
67)
(n=
114)
(n
=66
) (n
=63
)
Hei
ght
(cm
) 16
2.4
± 8
.4
165.
2 ±
8.6
16
2.3
± 7
.9
167.
9 ±
9.0
1.
728
Wei
ght
(kg)
*
58.6
± 1
0.8
59.5
± 1
2.7
59.9
± 1
4.8
62.3
± 1
0.1
0.28
8 B
ody
Mas
s In
dex
(kg/
m2)
*
22.2
± 3
.2
21.7
± 3
.4
22.6
± 4
.7
22.0
± 2
.6
1.32
6 20
m S
hutt
le R
un (
laps
) 33
.2 ±
14.
8 41
.0 ±
17.
1 40
.2 ±
19.
6 62
.8 ±
21.
4 26
.046
b
VO
2max
(m
l/kg/
min
) 42
.1 ±
6.2
45
.6 ±
6.4
44
.2 ±
8.2
52
.5 ±
7.5
17
.284
b
Phy
sica
l Act
ivity
Inde
x 8.
9 ±
2.9
11
.5 ±
2.8
13
.2 ±
3.2
17
.1 ±
1.9
89
.022
b
Tota
l PA
(co
unts
/min
/day
) *
399.
1 ±
112
.9
454.
7 ±
130
.1
471.
1 ±
138
.3
534.
9 ±
200
.8
4.78
5 a
Tim
e in
Sed
enta
ry P
A (
min
/day
) 58
2.1
± 3
7.0
573.
9 ±
43.
6 56
4.8
± 4
2.2
555.
3 ±
48.
3 2.
841 a
Ti
me
in L
ight
PA
(m
in/d
ay) *
10
8.4
± 2
4.2
105.
6 ±
30.
3 11
4.7
± 2
9.4
113.
0 ±
28.
9 1.
725
Tim
e in
Mod
erat
e P
A (
min
/day
) *
36.3
± 1
8.6
42.7
± 1
7.9
42.7
± 1
7.8
47.8
± 2
0.8
2.97
0 a
Tim
e in
Vig
orou
s P
A (
min
/day
) *
7.5
± 6
.5
12.2
± 1
0.0
12.0
± 1
1.6
18.3
± 1
7.8
3.78
4 a
Tim
e in
MV
PA
(m
in/d
ay) *
43
.8 ±
21.
6 54
.9 ±
22.
3 54
.7 ±
24.
3 66
.1 ±
33.
5 4.
515 a
N
otes
: Val
ues
are
Mea
n ±
SD
; a P<
0.05
and
b P<
0.00
1 fo
r G
ener
al L
inea
r M
odel
tes
ting
the
tren
d ac
ross
leve
ls o
f eng
agem
ent
in c
ompe
titiv
e sp
orts
with
adj
ustm
ents
for
sex
and
age;
* nat
ural
log
tran
sfor
med
var
iabl
es w
ere
used
for
com
paris
ons
but u
ntra
nsfo
rmed
dat
a ar
e sh
own.
106
!
!
Discussion
Present findings showed that there are associations between compliance
with PA guidelines of 60min/day of MVPA and being fit, involvement in competitive
sports in a club and being fit, and participating in competitive sports and comply
with PA recommendations. Also, in comparisons with girls, boys are much more
likely for being fit and for complying with PA guidelines. Stepwise logistic
regressions including the different PA questions suggested that being involved in
competitive sports in a club may be more important to ensure healthier CRF levels
than complying with 60min/day in MVPA defined from accelerometer
measurements.
Evidence from previous studies suggests that sports participation is
associated with enhanced fitness, reduced body fat, low blood pressure, and
reduced risk for the clustering of CVD risk factors in youths (Ara et al., 2004;
Boreham, Twisk, Savage, Cran, & Strain, 1997). It could be expected that young
people committed to higher levels of competitive sports would be involved in
greater volumes of PA resulting in training processes. Data from cross-sectional
studies indicated that trained young athletes have higher values of VO2peak in
comparison with their untrained peers (Armstrong, Tomkinson, & Ekelund, 2011;
Rowland, Wehnert, & Miller, 2000). Furthermore, data from experimental exercise-
training studies reported significant improvements in youths’ CRF (Armstrong et al.,
2011; Stoedefalke, Armstrong, Kirby, & Welsman, 2000; Tolfrey et al., 2004).
However, although there is plentiful data in the literature supporting that exercise-
training programs improve CRF, there appears to be no meaningful dose-
response relationship between habitual daily PA and maximal oxygen uptake
(Armstrong et al., 2011). Cross-sectional studies with accelerometer measured PA
and measured or estimated VO2peak reported low-to-moderate correlations (r
values from 0.1 to 0.4) (Dencker & Andersen, 2008). On the other hand, data from
the present study indicated that children and adolescents who take part in
107
!
!
competitive sports at club level spend more time in MVPA and have higher
VO2max (Table 4).
Findings from the present study add new evidence in the area of health-
related PA and fitness. It seems that not just the study of intensity, frequency,
duration and volume in which PA is carried out, but also the understanding of the
context in which PA takes place may contribute to develop strategies for
improving youths’ PA and health. When PA contexts were analysed separately,
results from the present study showed that healthier levels of CRF were
associated with greater levels of engagement in organized sport outside the
school, non-organized sport outside the school, PA for more than 20min outside
the school, breath taking or sweating PA outside the school and competitive
sports. When PA contexts were taken together in a stepwise analysis, and
adjusting for physical activity levels assessed by accelerometers, participation in
competitive sports becomes an independent factor to increase the odds to have
healthier levels of CRF. Therefore, regular training for competitive sports might be
a strategy to empower health-related PA and to enhance CRF, thereby improving
cardio-protection.
Consistent with data previously reported (Machado Rodrigues et al., 2010;
J.R. Ruiz et al., 2007; Trost et al., 2002; Welk et al., 2011), in the present study
boys tended to be more physically active and have greater CRF levels than girls,
although the odds of boys for being fit seems to be somewhat unique in
comparison with girls. It is known that boys are more engaged in sports and
intensive (moderate to vigorous) physical activities, while girls are more likely to be
involved in lighter activities and leisure PA (Mota & Esculcas, 2002). Moreover, it is
alarming that girls scored lower levels of engagement for all the five PA contexts
analysed in the present study. Sex per se is considered a biological determinant of
PA, which can also be affected by psychological, social and environmental factors
(Seabra, Mendonca, Thomis, Anjos, & Maia, 2008; Uijtdewilligen et al., 2011).
However, it is not clear how these determinants interact with sex in order to
influence overall PA and the participation in PA in distinguished contexts.
108
!
!
Collectively, these findings suggest that girls are in greater risk for being
insufficient active, which might contribute to reduced fitness levels. However, to
the best of our knowledge, this is the first study using the new FITNESSGRAMTM
reference standards (Welk et al., 2011), which makes difficult comparisons with
other populations. On the other hand, up to the present date it was not possible
to ascertain if the new FITNESSGRAMTM reference standards (Welk et al., 2011)
are too much demanding for girls, and therefore, overestimating the proportion of
those classified as unfit. Nevertheless, girls seem to be a target group for specific
PA interventions.
Physical activity guidelines (Janssen, 2007; Strong et al., 2005; WHO,
2010) suggest that children and young people should accumulate 60 min/day of
moderate to vigorous physical activity in order to improve physical fitness, bone
health, cardiovascular and metabolic health biomarkers and to reduce symptoms
of anxiety and depression. It is accepted that these recommendations are based
on solid evidence (Andersen, Riddoch, Kriemler, & Hills, 2011), although the
differences in study designs and methods for assessing PA and CVD risk factors
have to be considered. Some considerations should be addressed when
compliance with PA guidelines assessed with accelerometers is the object of
analysis. The options that researchers take when reducing the data (number of
days, minimum daily wearing time and intensities cut-offs) and whether the
compliance with 60min/day in MVPA is analysed daily or on the average of
accepted days strongly affect the prevalence of subjects complying with
recommendations (Beets, Bornstein, Dowda, & Pate, 2011). In our analyses, we
assumed an operational definition of an adjusted average of 60min/ day for
accepted days as the reference for reaching recommended PA levels. In fact,
some of the evidence in which the guidelines are based performed their analyses
in terms of average values (Andersen et al., 2006). Indeed, more research is
needed to resolve issues with intensity cut points and interpretation of PA
guidelines (Beets et al., 2011).
109
!
!
Findings from the present study should also be taken into consideration
with some limitations. Although the results clearly suggest associations between
the levels of CRF and different features of PA and engagement in sport, the cross-
sectional design does not allow elucidating a dose-response effect between these
PA domains and cardiovascular health in young people. On the other hand, a
positive point of the current data was the combination of the assessment of
physical activity by questionnaire and accelerometers. While questionnaires can
provide information about the context, type, structure and organization of physical
activity and sports which young people are involved in, accelerometers allow
directly assessment of intensity, frequency, duration and volume of physical
activity (Corder et al., 2008; Ekelund, Tomkinson, & Armstrong, 2011). Together
with CRF data, this approach for assessing PA allowed to analyse the settings
that really seemed to be prognostic determinants of the former health markers.
Thus, it seemed that the participation in competitive sports is more effective than
other contexts of PA to reach healthier levels of CRF, and compliance with PA
recommendations. Other organized or structured physical activity contexts, may
contribute to achieve healthier PA and CRF levels, like for instance Physical
Education classes or leisure-time physical activities. However, because in these
contexts there are additional educational and social purposes, they are not so
effective to generate the appropriate dose of MVPA to reach health benefits.
In conclusion, there was an independent association between the
participation in competitive sports, compliance of MVPA guidelines and
cardiorespiratory fitness levels. Current results indicate that being active and/or
involved in competitive sports increases the chances of having high
cardiorespiratory fitness. Our findings suggest a pathway for promoting healthier
levels of cardiorespiratory fitness through the engagement in competitive sports,
increasing the chances of compliance with PA guidelines.
110
!
!
Acknowledgements
The Foundation of Science and Technology (FCT) supported GS with the PhD
grant reference SFRH/BD/45090/2008. The study was also supported by FCT
with the research project reference PTDC/DES/72424/2006 (FCOMP-01-0124-
FEDER-007183). Authors declare no conflict of interest.
References
Andersen, L. B., Harro, M., Sardinha, L. B., Froberg, K., Ekelund, U., Brage, S., &
Anderssen, S. A. (2006). Physical activity and clustered cardiovascular risk
in children: a cross-sectional study (The European Youth Heart Study).
Lancet, 368(9532), 299-304.
Andersen, L. B., Hasselstrøm, H., Grønfeldt, V., Hansen, S. E., & Karsten, F.
(2004). The relationship between physical fitness and clustered risk, and
tracking of clustered risk from adolescence to young adulthood: eight years
follow-up in the Danish Youth and Sport Study. International Journal of
Behavioral Nutrition and Physical Activity, 1(1), 6.
Andersen, L. B., Riddoch, C., Kriemler, S., & Hills, A. P. (2011). Physical activity
and cardiovascular risk factors in children. British Journal of Sports
Medicine, 45(11), 871-876.
Andersen, L. B., Sardinha, L., Froberg, K., Riddoch, C. J., Page, A. S., &
Anderssen, S. A. (2008). Fitness, fatness and clustering of cardiovascular
risk factors in children from Denmark, Estonia and Portugal: The European
Youth Heart Study. International Journal of Pediatric Obesity, 3(SUPPL.1),
58-66.
Anderssen, S. A., Cooper, A. R., Riddoch, C., Sardinha, L. B., Harro, M., Brage,
S., & Andersen, L. B. (2007). Low cardiorespiratory fitness is a strong
predictor for clustering of cardiovascular disease risk factors in children
111
!
!
independent of country, age and sex. European Journal of Cardiovascular
Prevention and Rehabilitation, 14(4), 526-531.
Ara, I., Vicente-Rodriguez, G., Jimenez-Ramirez, J., Dorado, C., Serrano-Sanchez,
J. A., & Calbet, J. A. (2004). Regular participation in sports is associated
with enhanced physical fitness and lower fat mass in prepubertal boys.
International Journal of Obesity and Related Metabolic Disorders, 28(12),
1585-1593.
Armstrong, N., Tomkinson, G., & Ekelund, U. (2011). Aerobic fitness and its
relationship to sport, exercise training and habitual physical activity during
youth. British Journal of Sports Medicine, 45(11), 849-858.
Beets, M. W., Bornstein, D., Dowda, M., & Pate, R. R. (2011). Compliance with
national guidelines for physical activity in U.S. preschoolers: measurement
and interpretation. Pediatrics, 127(4), 658-664.
Blair, S. N., Kohl, H. W., 3rd, Paffenbarger, R. S., Jr., Clark, D. G., Cooper, K. H.,
& Gibbons, L. W. (1989). Physical fitness and all-cause mortality. A
prospective study of healthy men and women. Journal of the American
Medical Association, 262(17), 2395-2401.
Boreham, C. A., Twisk, J., Savage, M. J., Cran, G. W., & Strain, J. J. (1997).
Physical activity, sports participation, and risk factors in adolescents.
Medicine and Science in Sports and Exercise, 29(6), 788-793.
Brage, S., Wedderkopp, N., Ekelund, U., Franks, P. W., Wareham, N. J.,
Andersen, L. B., & Froberg, K. (2004). Features of the metabolic syndrome
are associated with objectively measured physical activity and fitness in
Danish children: The European Youth Heart Study (EYHS). Diabetes Care,
27(9), 2141-2148.
Caspersen, C. J., Powell, K. E., & Christenson, G. M. (1985). Physical activity,
exercise, and physical fitness: definitions and distinctions for health-related
research. Public Health Reports, 100(2), 126-131.
Corder, K., Ekelund, U., Steele, R. M., Wareham, N. J., & Brage, S. (2008).
Assessment of physical activity in youth. Journal of Applied Physiology,
105(3), 977-987.
112
!
!
Dencker, M., & Andersen, L. B. (2008). Health-related aspects of objectively
measured daily physical activity in children. Clinical Physiology and
Functional Imaging, 28(3), 133-144.
Ekelund, U., Anderssen, S. A., Froberg, K., Sardinha, L. B., Andersen, L. B., &
Brage, S. (2007). Independent associations of physical activity and
cardiorespiratory fitness with metabolic risk factors in children: The
European youth heart study. Diabetologia, 50(9), 1832-1840.
Ekelund, U., Tomkinson, G., & Armstrong, N. (2011). What proportion of youth are
physically active? Measurement issues, levels and recent time trends.
British Journal of Sports Medicine, 45(11), 859-865.
Gutin, B., Barbeau, P., Owens, S., Lemmon, C. R., Bauman, M., Allison, J., . . .
Litaker, M. S. (2002). Effects of exercise intensity on cardiovascular fitness,
total body composition, and visceral adiposity of obese adolescents.
American Journal of Clinical Nutrition, 75(5), 818-826.
Gutin, B., Yin, Z., Humphries, M. C., & Barbeau, P. (2005). Relations of moderate
and vigorous physical activity to fitness and fatness in adolescents.
American Journal of Clinical Nutrition, 81(4), 746-750.
Janssen, I. (2007). Physical activity guidelines for children and youth. Applied
Physiology, Nutrition and Metabolism, 32, S109–S121.
Koorts, H., Mattocks, C., Ness, A. R., Deere, K., Blair, S. N., Pate, R. R., &
Riddoch, C. (2011). The association between the type, context, and levels
of physical activity amongst adolescents. Journal of Physical Activity and
Health, 8(8), 1057-1065.
Ledent, M., Cloes, M., & Piéron, M. (1997). Les jeunes, leur activité physique et
leurs percepctions de la santé, de lá form, des capacités athlétics et de
lápparence. ADEPS, 159/160, 90-95.
Lohman, T. G., Roche, A. F., & Martorell, R. (1988). Anthropometric
Standardization Reference Manual. Champaign, IL: Human Kinetics.
Machado Rodrigues, A. M., Coelho e Silva, M. J., Mota, J., Cumming, S. P.,
Sherar, L. B., Neville, H., & Malina, R. M. (2010). Confounding effect of
113
!
!
biologic maturation on sex differences in physical activity and sedentary
behavior in adolescents. Pediatric Exercise Science, 22(3), 442-453.
Mota, J., & Esculcas, C. (2002). Leisure-time physical activity behavior: stuctured
and unstructures choises according to sex, age, and level of physical
activity. International Journal of Behavioral Medicine, 9(2), 111-121.
Raitakari, O. T., Porkka, K. V. K., Taimela, S., Telama, R., Rasanen, L., & Viikari, J.
S. A. (1994). Effects of persistent physical activity and inactivity on coronary
risk factors in children and young adults. The Cardiovascular Risk in Young
Finns Study. American Journal of Epidemiology, 140(3), 195-205.
Reed, K. E., Warburton, D. E. R., Lewanczuk, R. Z., Haykowsky, M. J., Scott, J.
M., Whitney, C. L., . . . McKay, H. A. (2005). Arterial compliance in young
children: The role of aerobic fitness. European Journal of Cardiovascular
Prevention and Rehabilitation, 12(5), 492-497.
Rowland, T., Wehnert, M., & Miller, K. (2000). Cardiac responses to exercise in
competitive child cyclists. Medicine and Science in Sports and Exercise,
32(4), 747-752.
Ruiz, J. R., Ortega, F. B., Meusel, D., Harro, M., Oja, P., & Sjöström, M. (2006).
Cardiorespiratory fitness is associated with features of metabolic risk
factors in children. Should cardiorespiratory fitness be assessed in a
European health monitoring system? The European Youth Heart Study.
Journal of Public Health, 14(2), 94-102.
Ruiz, J. R., Ortega, F. B., Meusel, D., & Sjöström, M. (2007). Traditional and novel
cardiovascular risk factors in school-aged children: A call for the further
development of public health strategies with emphasis on fitness. Journal
of Public Health, 15(3), 171-177.
Ruiz, J. R., Ortega, F. B., Rizzo, N. S., Villa, I., Hürtig-Wennlöf, A., Oja, L., &
Sjöström, M. (2007). High cardiovascular fitness is associated with low
metabolic risk score in children: The European Youth Heart Study. Pediatric
Research, 61(3), 350-355.
114
!
!
Seabra, A. F., Mendonca, D. M., Thomis, M. A., Anjos, L. A., & Maia, J. A. (2008).
Biological and socio-cultural determinants of physical activity in
adolescents. Cadernos de Saúde Pública, 24(4), 721-736.
Silva, G., Oliveira, N. L., Aires, L., Mota, J., Oliveira, J., & Ribeiro, J. C. (2012).
Calculation and validation of models for estimating VO2max from the 20-m
shuttle run test in children and adolescents. Archives of Exercise in Health
and Disease, 3(1-2), 145-152.
Stoedefalke, K., Armstrong, N., Kirby, B. J., & Welsman, J. R. (2000). Effect of
training on peak oxygen uptake and blood lipids in 13 to 14-year-old girls.
Acta Paediatrica, 89(11), 1290-1294.
Strong, W. B., Malina, R. M., Blimkie, C. J. R., Daniels, S. R., Dishman, R. K.,
Gutin, B., . . . Trudeau, F. (2005). Evidence based physical activity for
school-age youth. Journal of Pediatrics, 146(6), 732-737.
The Cooper Institute for Aerobics Research. (2004). FITNESSGRAM Test
Administration Manual (3rd ed.). Champaign, Illinois, USA: Human Kinetics.
Tolfrey, K., Jones, A. M., & Campbell, I. G. (2004). Lipid-lipoproteins in children:
an exercise dose-response study. Medicine and Science in Sports and
Exercise, 36(3), 418-427.
Trost, S. G., Pate, R. R., Sallis, J. F., Freedson, P. S., Taylor, W. C., Dowda, M., &
Sirard, J. (2002). Age and gender differences in objectively measured
physical activity in youth. Medicine and Science in Sports and Exercise,
34(2), 350-355.
Uijtdewilligen, L., Nauta, J., Singh, A. S., van Mechelen, W., Twisk, J. W., van der
Horst, K., & Chinapaw, M. J. (2011). Determinants of physical activity and
sedentary behaviour in young people: a review and quality synthesis of
prospective studies. British Journal of Sports Medicine, 45(11), 896-905.
Wei, M., Gibbons, L. W., Kampert, J. B., Nichaman, M. Z., & Blair, S. N. (2000).
Low cardiorespiratory fitness and physical inactivity as predictors of
mortality in men with type 2 diabetes. Annals of Internal Medicine, 132(8),
605-611.
115
!
!
Welk, G. J., Laurson, K. R., Eisenmann, J. C., & Cureton, K. J. (2011).
Development of youth aerobic-capacity standards using receiver operating
characteristic curves. American Journal of Preventive Medicine, 41(4 Suppl
2), S111-116.
WHO. (2010). Global recommendations on physical activity for health. Switzerland:
World Health Organization.

116

117
OVERALL DISCUSSION

118
119
Overal l Discussion
Main findings from the original research carried out in this thesis support
the idea that the performance in a field test, the 20-meter Shuttle Run is a valid
marker of the cardiorespiratory fitness (Study I ) and a suitable tool for the
stratification of cardio-metabolic risk in children and adolescents (Study I I ).
Furthermore, this measurement of CRF might be an important indicator of
increased metabolic risk, independently of central adiposity levels (Study I I I ).
Additionally, assuming CRF as an independent risk factor for cardiovascular
diseases, the competitive sports might be a relevant context to achieve higher
levels of moderate to vigorous physical activity and to improve cardiovascular
health profile (Study IV).
All the research comprised in this thesis was carried out with the
perspective that CRF is a powerful marker of cardiovascular health since the early
ages, even when assessed by a field test. In Portugal, an adapted version of the
original SR (PACER – Progressive Aerobic Cardiovascular Endurance Run) is
widely used, since the evaluation of physical fitness with the FITNESGRAMTM
battery (The Cooper Institute, 2007; The Cooper Institute for Aerobics Research,
1999) is a standard procedure in the Portuguese Physical Education curricula.
Additionally, SR have been used exhaustively by Portuguese and other
international researchers for the assessment of CRF (Aires, Andersen, et al., 2010;
Aires et al., 2011; Guerra, Ribeiro, Costa, Duarte, & Mota, 2002; Martins, Silva,
Santos, Ribeiro, & Mota, 2008; Mota et al., 2002; Nielsen & Andersen, 2003;
Reed, Warburton, Macdonald, Naylor, & McKay, 2008; Sakuragi et al., 2009). In a
previous study accomplished from our research group (Ruiz et al., 2009), we
analysed the criterion-validity of SR and five different equations for the estimation
of VO2max in Portuguese youths. Main findings from this previous study suggest
that validity was moderate for the five equations analysed, from Léger et al. (1988),
Barnett et al. (1993) [two equations], Matsuzaka et al. (2004) and Ruiz et al. (2008).
For the correlations with measured VO2max, coefficients ranged from 0.59 (Léger
120
equation) to 0.76 (Ruiz equation). Furthermore, the standard error of estimates
varied from 5.3 (Barnett equation a) to 6.5 ml.kg-1.min.1 (Léger equation) and the
systematic error (the mean difference between estimated and measured VO2max)
ranged from 1.3 (Barnett equation b) to 5.5 ml.kg-1.min.1 (Léger equation). With the
exception for the Barnett equation b, the other four equations significantly
underestimate the directly measured VO2max. A worrying result from this study
was that the Léger equation, the most cited and used, provides the less valid
estimation of VO2max. We have considered that the attempt to estimate new
equations adjusted for the Portuguese youth population would be valuable, due to
the validation and errors observed in previous studies. Indeed, with the Study I
(Silva, Oliveira, et al., 2012), we improved the validity of SR as a tool for assessing
CRF in Portuguese youth. In a cross validation group, we described a decreased
standard error of the estimate of VO2max (4.9 ml.kg-1.min.1), a reduced systematic
error (-0.1 ml.kg-1.min.1) and an increased validation coefficient (r=0.84; P<0.001)
for the equation calculated by linear regression. However, some advantages and
disadvantages in using equations to estimate VO2max should be elucidated. If the
interest were to compare results between populations assessed by different CRF
tests, the expression of VO2max (in ml.kg-1.min-1) estimated by an appropriate
equation in each population would satisfy this limitation. On the other hand, the
substantial dispersion of random error existing in equations could lead to biased
results when the analysis require more sensitive within-individual differential data,
like in longitudinal analyses and intervention studies. If that was the case, may be
a raw indicator of SR performance, such as the number of laps or stages
completed in the test, could be more sensitive to detect small but significant
changes in CRF. Indeed, the performance in the SR seemed to be per se a good
indicator of CRF with increased correlations with directly measured VO2max,
r=0.75 (P<0.001) for the number of laps and r=0.77 (P<0.001) for completed
stages [Study I (Silva, Oliveira, et al., 2012)]. Additionally, the use of equations
that were originally determined in other populations might lead to non-negligible
errors of assessment and, by consequence, misclassification in risk stratification.
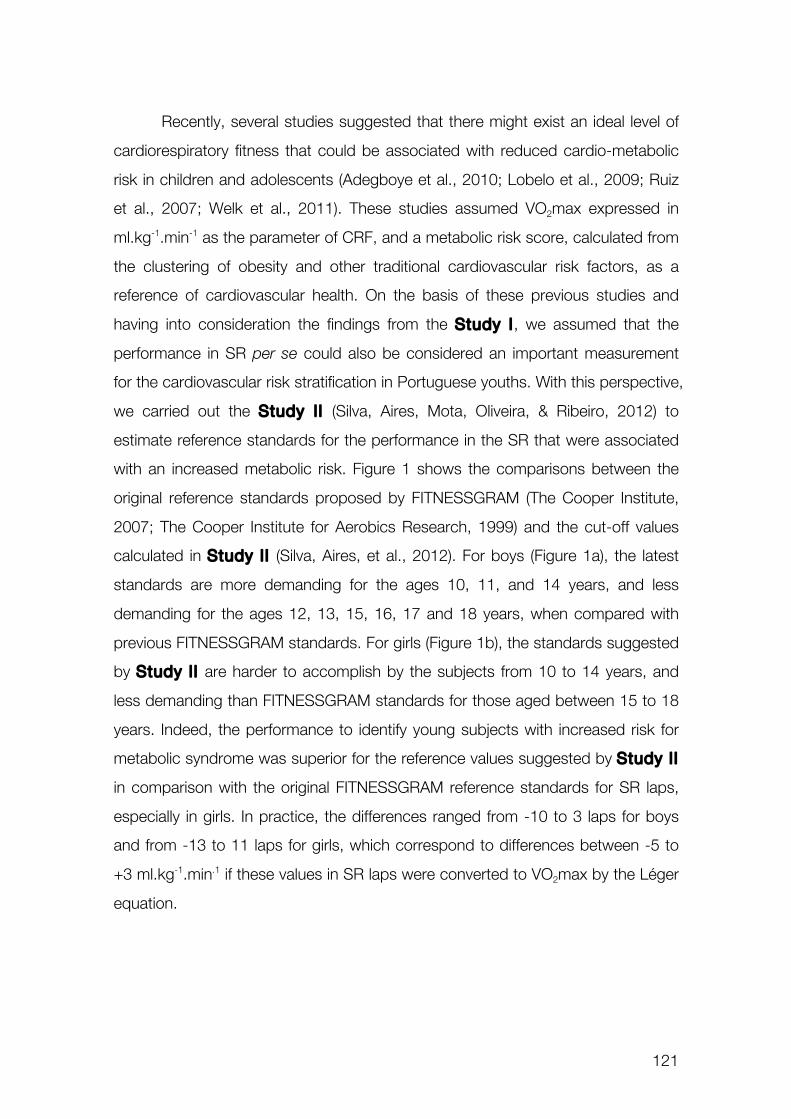
121
Recently, several studies suggested that there might exist an ideal level of
cardiorespiratory fitness that could be associated with reduced cardio-metabolic
risk in children and adolescents (Adegboye et al., 2010; Lobelo et al., 2009; Ruiz
et al., 2007; Welk et al., 2011). These studies assumed VO2max expressed in
ml.kg-1.min-1 as the parameter of CRF, and a metabolic risk score, calculated from
the clustering of obesity and other traditional cardiovascular risk factors, as a
reference of cardiovascular health. On the basis of these previous studies and
having into consideration the findings from the Study I, we assumed that the
performance in SR per se could also be considered an important measurement
for the cardiovascular risk stratification in Portuguese youths. With this perspective,
we carried out the Study I I (Silva, Aires, Mota, Oliveira, & Ribeiro, 2012) to
estimate reference standards for the performance in the SR that were associated
with an increased metabolic risk. Figure 1 shows the comparisons between the
original reference standards proposed by FITNESSGRAM (The Cooper Institute,
2007; The Cooper Institute for Aerobics Research, 1999) and the cut-off values
calculated in Study I I (Silva, Aires, et al., 2012). For boys (Figure 1a), the latest
standards are more demanding for the ages 10, 11, and 14 years, and less
demanding for the ages 12, 13, 15, 16, 17 and 18 years, when compared with
previous FITNESSGRAM standards. For girls (Figure 1b), the standards suggested
by Study I I are harder to accomplish by the subjects from 10 to 14 years, and
less demanding than FITNESSGRAM standards for those aged between 15 to 18
years. Indeed, the performance to identify young subjects with increased risk for
metabolic syndrome was superior for the reference values suggested by Study I I
in comparison with the original FITNESSGRAM reference standards for SR laps,
especially in girls. In practice, the differences ranged from -10 to 3 laps for boys
and from -13 to 11 laps for girls, which correspond to differences between -5 to
+3 ml.kg-1.min.1 if these values in SR laps were converted to VO2max by the Léger
equation.
122
Figure 1 – Reference standards for 20-m shuttle run (number of completed laps) for boys (Figure 1a) and girls (Figure 1b). Straight lines represent the reference standards suggested by Silva et al. (2012). Dashed lines represent reference standards proposed by FITNESSGRAM (1999-2007).
Taking into consideration the performance of previous reference standards
suggested for VO2max values in ml.kg-1.min-1 (Adegboye et al., 2010; Lobelo et al.,
2009; Ruiz et al., 2007; Welk et al., 2011), the results for risk stratification
presented in the Study I I are completely acceptable. The area under the curve
(AUC) for our reference standards was 0.710 (95% CI=0.620-0.790; P<0.001) for
boys and 0.660 (95% CI=0.580-0.740; P< 0.001) for girls’ cut-off values. The
efficiency, the best trade-off ratio for true-positive and true-negative cases, for the
latest reference standards suggested for SR laps was 0.684 in boys and 0.633 in
girls. These findings are similar to those reported for reference standards based
on VO2max values (Adegboye et al., 2010; Lobelo et al., 2009; Ruiz et al., 2007;
Welk et al., 2011). These results support the idea that reference standards based
in SR laps are so effective for cardio-metabolic risk stratification in youths as much
as VO2max reference values, which highlights the practical relevance for the
findings from Study I I . Additionally, 90% of girls and 100% of boys that were
classified as being positive cases of metabolic syndrome according to the IDF
definition (IDF, 2007) were low fit. These results highlight the relevance of the new
reference values calculated from the performance in SR, as excellent indicators for
stratification of youths with increased metabolic risk in the school setting. In
5!
10!
15!
20!
25!
30!
35!
40!
45!
50!
55!
60!
65!
70!
75!
10! 11! 12! 13! 14! 15! 16! 17! 18!
20-m
Shutt
le R
un (la
ps)!
Age (years)!
Silva et al. (2012)!
FITNESSGRAM (1999-2007)!
5!
10!
15!
20!
25!
30!
35!
40!
45!
50!
55!
60!
65!
70!
75!
10! 11! 12! 13! 14! 15! 16! 17! 18!
20-m
Shutt
le R
un (la
ps)!
Age (years)!
Silva et al. (2012)!
FITNESSGRAM (1999-2007)!
a. Boys! b. Girls!
123
comparison with previous FITNESSGRAMTM reference standards, our cut-off
values were 10% more effective to identify girls that were classified as positive
cases of metabolic syndrome, and no difference were found among boys. Taking
into consideration some of the aforementioned limitations regarding the use of
equations to estimate VO2max, it might be advantageous to use SR laps as the
reference standard to identify children and adolescents with increased metabolic
risk. This procedure might reduce the chances of misclassification of subjects
accounted by errors in the estimation of VO2max.
In the Study I I I , we analysed the associations between CRF, central
adiposity and clustered metabolic risk factors. For this study, we assumed CRF
expressed in VO2max values (ml.kg-1.min-1) estimated from SR with the equation
previously validated for Portuguese youths (Study I ). CRF was classified
according to age and sex adjusted quartiles. A metabolic risk score was
calculated from four traditional metabolic risk factors (excluding the adiposity
component): HDL-cholesterol (HDL-C), triglycerides (TRIG), glucose (GLU) and
mean arterial pressure (MAP). In the main analysis, there was a significant trend for
decreasing metabolic risk with the increasing of CRF levels. When waist
circumference (WC) was included in the analysis as a covariate, the trend was
attenuated but remained significant. When we analysed the combined
associations between CRF/WC levels and metabolic risk, our results suggested
that children and adolescents with increased central adiposity might decrease the
odds ratio for an increased metabolic risk if their CRF was increased. These
results support the rationale that CRF might have a significant effect over
metabolic risk, independently of central adiposity in Portuguese youths. These
findings are in accordance with the associations, trends and relationships
described in previous studies (Andersen et al., 2008; Eisenmann, Welk, Ihmels, &
Dollman, 2007; Eisenmann, Welk, Wickel, & Blair, 2007; Ekelund et al., 2007). For
instance, Andersen et al. (2008) demonstrated that the association between CRF
and metabolic risk score had approximately the same strength as with fatness,
and similar results were obtained with skinfold thickness and waist circumference.
124
Interestingly, similar findings were described in studies with different protocols and
tests to assess CRF and adiposity. Despite differences in methodological and
statistical approaches, collectively, these findings support with strong evidence the
thought that CRF is a powerful and independent marker of cardiovascular health
since childhood and adolescence. Although the clinical manifestations of CVD
rarely occur in youths, it is preoccupying that cardiovascular and metabolic risk
factors tend to cluster and to track from adolescence to adulthood, and this is
strongly related to physical fitness (Andersen et al., 2004). In adults, CRF is the
strongest predictor of mortality among normal subjects and those with CVD (Blair
et al., 1989; Myers et al., 2002). Therefore, the maintenance of increased CRF
levels over individuals’ growth and development might have some cardioprotective
effect even when exposed to single or clustered risk factors. Together, these
evidences reinforce the notion that low CRF should warrant as much attention as
others major cardiovascular risk factors in health surveillance policies.
In the sequence of the previous studies, we assumed CRF as an
independent risk factor for the development of CVD since the early ages. Thus, we
thought that it would be relevant not just to develop strategies of assessment and
risk stratification, but also to identify some evidence to support future intervention,
in a more involved perspective of primary prevention of CVD. Assuming estimated
CRF levels as the outcome, we aimed to analyse whether levels of moderate to
vigorous physical activity and the participation in different contexts of physical
activity were associated with healthier levels of CRF (Study IV). Although the
strong evidence supporting the recommendations of 60 min per day of moderate
to vigorous physical activity for subjects in school ages (Andersen et al., 2011),
our results suggest that the participation in competitive sports might have an
independent association with increased CRF levels. These results are in
accordance with previous data showing that participation in organized sports is
associated with decreased levels of traditional cardiovascular risk factors (Ara et
al., 2004; Boreham et al., 1997). Cross-sectional analysis and exercise-training
studies suggest that training, which is an important component of the participation
125
in competitive sports, lead to significant improvements in CRF and general
cardiovascular health (Armstrong et al., 2011; Rowland et al., 2000; Stoedefalke
et al., 2000; Tolfrey et al., 2004). A multilevel longitudinal analysis that we carried
out in a previous study (Aires et al., 2012) showed that the participation in
competitive sports over 4 years, especially in the club level, was associated with
increased CRF over time. On the other hand, associations between objectively
measured physical activity and CRF have been reported to range from low to
moderate (Dencker & Andersen, 2008). Our results (Study IV), pointed that there
was an independent association between the participation in competitive sports,
compliance of MVPA guidelines and cardiorespiratory fitness levels, which might
suggest a pathway for promoting healthier levels of cardiorespiratory fitness
through the engagement in competitive sports, increasing the chances of
compliance with PA guidelines.
Finally, it should be underlined that findings from the present thesis were
taken in a perspective of a school-based population of Portuguese youths. These
findings highlight the relevance of school in terms of public health. It seems that
health surveillance policies should focus their efforts for primary prevention of
cardiovascular diseases at school, once school is the perfect setting to access the
majority of the youngsters’ population. Indeed, it is worth including the evaluation
of some health parameters in the schools routine, once indicators of health-related
physical fitness are easy to operate by teachers and health professionals. The
procedures to access most of traditional risk factors are invasive and not suitable
for screening subjects at risk among large populations. Indeed, some procedures
such as collection of blood samples are uncomfortable for most of the children.
On the other hand, the assessment of cardiorespiratory fitness, especially through
the 20-meter Shuttle Run Test, might be considered a valuable and simple tool for
targeting children and adolescents in risk of later development of CVD and other
metabolic related disorders. Additionally, schools offer a favourable environment to
intervene over obesity, low fitness and sedentary lifestyles. Therefore, it is

126
increasingly important to recognize the role of schools in public health strategies
and politics, to improve general health and reduce the burden of CVD.

127
CONCLUSIONS

128
129
Conclusions
This thesis adds new findings to the body of evidences suggesting that
cardiorespiratory fitness should be considered an essential independent risk factor
for cardiovascular diseases since paediatric ages. Moreover, compiling the results
from the investigations originated in the present thesis, the following conclusions
should be outlined:
! Equations estimated from Portuguese youths provide valid estimates of
maximal oxygen uptake (VO2max), the standard measure of
cardiorespiratory fitness. The model calculated from the linear regression
should be recommended to estimate VO2max from the 20-meter Shuttle
Run Test in future studies carried out with Portuguese children and
adolescents.
! Reference standards based on the performance in the 20-meter Shuttle
Run Test expressed in laps that were calculated from the Portuguese youth
population provide a valuable tool for screening children and adolescents
with increased metabolic risk.
! Low cardiorespiratory fitness estimated from the 20-meter shuttle run test
is associated with increased metabolic risk, independently of central
adiposity, in children and adolescents.
! In Portuguese youths, participation in competitive sports is associated with
the compliance of recommended levels of moderate to vigorous physical
activity and with increased cardiorespiratory fitness. Therefore, participation
in competitive sports should be promoted since the early ages in order to
improve cardiovascular health.

130

131
REFERENCES

132
133
References
Adegboye, A. R., Anderssen, S. A., Froberg, K., Sardinha, L. B., Heitmann, B. L.,
Steene-Johannessen, J., et al. (2010). Recommended aerobic fitness level
for metabolic health in children and adolescents: a study of diagnostic
accuracy. Br J Sports Med, 45(9), 722-728.
Aires, L., Andersen, L. B., Mendonca, D., Martins, C., Silva, G., & Mota, J. (2010).
A 3-year longitudinal analysis of changes in fitness, physical activity, fatness
and screen time. Acta Paediatr, 99(1), 140-144.
Aires, L., Pratt, M., Lobelo, F., Santos, R. M., Santos, M. P., & Mota, J. (2011).
Associations of cardiorespiratory fitness in children and adolescents with
physical activity, active commuting to school, and screen time. J Phys Act
Health, 8 Suppl 2, S198-205.
Aires, L., Silva, G., Martins, C., Santos, M. P., Ribeiro, J. C., & Mota, J. (2012).
Influence of Activity Patterns in Fitness During Youth. International Journal
of Sports Medicine, 33(4), 325-329.
Aires, L., Silva, P., Santos, R., Santos, P., Ribeiro, J. C., & Mota, J. (2008).
Association of physical fitness and Body Mass Index in youth. Minerva
Pediatrica, 60(4), 397-405.
Aires, L., Silva, P., Silva, G., Santos, M. P., Ribeiro, J. C., & Mota, J. (2010).
Intensity of physical activity, cardiorespiratory fitness, and body mass index
in youth. J Phys Act Health, 7(1), 54-59.
Alberti, K. G., Zimmet, P., & Shaw, J. (2006). Metabolic syndrome - a new world-
wide definition. A Consensus Statement from the International Diabetes
Federation. Diabet Med, 23(5), 469-480.
Andersen, L. B., & Haraldsdottir, J. (1993). Tracking of cardiovascular disease risk
factors including maximal oxygen uptake and physical activity from late
134
teenage to adulthood. An 8-year follow-up study. Journal of Internal
Medicine, 234(3), 309-315.
Andersen, L. B., Harro, M., Sardinha, L. B., Froberg, K., Ekelund, U., Brage, S., et
al. (2006). Physical activity and clustered cardiovascular risk in children: a
cross-sectional study (The European Youth Heart Study). Lancet,
368(9532), 299-304.
Andersen, L. B., Hasselstrøm, H., Grønfeldt, V., Hansen, S. E., & Karsten, F.
(2004). The relationship between physical fitness and clustered risk, and
tracking of clustered risk from adolescence to young adulthood: eight years
follow-up in the Danish Youth and Sport Study. International Journal of
Behavioral Nutrition and Physical Activity, 1(1), 6.
Andersen, L. B., Riddoch, C., Kriemler, S., & Hills, A. P. (2011). Physical activity
and cardiovascular risk factors in children. British Journal of Sports
Medicine, 45(11), 871-876.
Andersen, L. B., Sardinha, L., Froberg, K., Riddoch, C. J., Page, A. S., &
Anderssen, S. A. (2008). Fitness, fatness and clustering of cardiovascular
risk factors in children from Denmark, Estonia and Portugal: The European
Youth Heart Study. International Journal of Pediatric Obesity, 3(SUPPL.1),
58-66.
Andersen, L. B., Wedderkopp, N., Hansen, H. S., Cooper, A. R., & Froberg, K.
(2003). Biological cardiovascular risk factors cluster in Danish children and
adolescents: The European youth heart study. Preventive Medicine, 37(4),
363-367.
Anderssen, S. A., Cooper, A. R., Riddoch, C., Sardinha, L. B., Harro, M., Brage,
S., et al. (2007). Low cardiorespiratory fitness is a strong predictor for
clustering of cardiovascular disease risk factors in children independent of
country, age and sex. European Journal of Cardiovascular Prevention and
Rehabilitation, 14(4), 526-531.
135
Ara, I., Vicente-Rodriguez, G., Jimenez-Ramirez, J., Dorado, C., Serrano-Sanchez,
J. A., & Calbet, J. A. (2004). Regular participation in sports is associated
with enhanced physical fitness and lower fat mass in prepubertal boys.
International Journal of Obesity and Related Metabolic Disorders, 28(12),
1585-1593.
Armstrong, N., Tomkinson, G., & Ekelund, U. (2011). Aerobic fitness and its
relationship to sport, exercise training and habitual physical activity during
youth. British Journal of Sports Medicine, 45(11), 849-858.
Barnett, A., Chan, L. Y. S., & Bruce, I. C. (1993). A preliminary study of the 20-m
multistage shuttle run as a predictor of peak VO2 in Hong Kong Chinese
students. Pediatric Exercise Science, 5, 42-50.
Bell, R. D., Macek, M., Rutenfranz, J., & Saris, W. H. M. (1986). Health indicators
and risk factors of cardiovascular diseases during childhood and
adolescence. In J. Rutenfranz, R. Mocellin & F. Klimt (Eds.), Children and
Exercise XII (pp. 19-27). Champaign, Illinois, USA: Human Kinetics.
Berenson, G. S., Srinivasan, S. R., Bao, W., Newman Iii, W. P., Tracy, R. E., &
Wattigney, W. A. (1998). Association between multiple cardiovascular risk
factors and atherosclerosis in children and young adults. New England
Journal of Medicine, 338(23), 1650-1656.
Berenson, G. S., Wattigney, W. A., Tracy, R. E., Newman Iii, W. P., Srinivasan, S.
R., Webber, L. S., et al. (1992). Atherosclerosis of the aorta and coronary
arteries and cardiovascular risk factors in persons aged 6 to 30 years and
studied at necropsy (The Bogalusa Heart Study). American Journal of
Cardiology, 70(9), 851-858.
Blair, S. N., Kohl, H. W., 3rd, Paffenbarger, R. S., Jr., Clark, D. G., Cooper, K. H.,
& Gibbons, L. W. (1989). Physical fitness and all-cause mortality. A
prospective study of healthy men and women. Journal of the American
Medical Association, 262(17), 2395-2401.
136
Boreham, C., Twisk, J., Murray, L., Savage, M., Strain, J. J., & Cran, G. (2001).
Fitness, fatness, and coronary heart disease risk in adolescents: The
Northern Ireland Young Hearts Project. Medicine and Science in Sports
and Exercise, 33(2), 270-274.
Boreham, C. A., Ferreira, I., Twisk, J. W., Gallagher, A. M., Savage, M. J., &
Murray, L. J. (2004). Cardiorespiratory fitness, physical activity, and arterial
stiffness: the Northern Ireland Young Hearts Project. Hypertension, 44(5),
721-726.
Boreham, C. A., Twisk, J., Savage, M. J., Cran, G. W., & Strain, J. J. (1997).
Physical activity, sports participation, and risk factors in adolescents.
Medicine and Science in Sports and Exercise, 29(6), 788-793.
Brage, S., Wedderkopp, N., Ekelund, U., Franks, P. W., Wareham, N. J.,
Andersen, L. B., et al. (2004). Features of the metabolic syndrome are
associated with objectively measured physical activity and fitness in Danish
children: The European Youth Heart Study (EYHS). Diabetes Care, 27(9),
2141-2148.
Cole, T. J., Bellizzi, M. C., Flegal, K. M., & Dietz, W. H. (2000). Establishing a
standard definition for child overweight and obesity worldwide: international
survey. Bmj, 320(7244), 1240-1243.
Cook, S., Auinger, P., Li, C., & Ford, E. S. (2008). Metabolic syndrome rates in
United States adolescents, from the National Health and Nutrition
Examination Survey, 1999-2002. J Pediatr, 152(2), 165-170.
Cook, S., Weitzman, M., Auinger, P., Nguyen, M., & Dietz, W. H. (2003).
Prevalence of a metabolic syndrome phenotype in adolescents: Findings
from the Third National Health and Nutrition Examination Survey, 1988-
1994. Archives of Pediatrics and Adolescent Medicine, 157(8), 821-827.
Council of Europe committee for the development of sport. (1988). Eurofit.
Handbook for the EUROFIT tests of physical fitness. Rome (Italy): Edigraf
editoriale grafica.
137
Cureton, K. J., & Plowman, S. A. (2008). Aerobic capacity assessments. In G. J.
Welk & M. D. Meredith (Eds.), FITNESSGRAM Reference Guide (3rd ed.,
pp. 96-120). Dallas, TX: The Cooper Institute.
Cureton, K. J., & Warren, G. L. (1990). Criterion-referenced standards for youth
health-related fitness tests: a tutorial. Research Quarterly in Exercise and
Sport, 61(1), 7-19.
Daviglus, M. L., Stamler, J., Pirzada, A., Yan, L. L., Garside, D. B., Liu, K., et al.
(2004). Favorable cardiovascular risk profile in young women and long-term
risk of cardiovascular and all-cause mortality. JAMA, 292(13), 1588-1592.
Dencker, M., & Andersen, L. B. (2008). Health-related aspects of objectively
measured daily physical activity in children. Clinical Physiology and
Functional Imaging, 28(3), 133-144.
Dencker, M., Thorsson, O., Karlsson, M. K., Linden, C., Svensson, J., Wollmer, P.,
et al. (2006). Daily physical activity and its relation to aerobic fitness in
children aged 8-11 years. European Journal of Applied Physiology, 96(5),
587-592.
Eisenmann, J. C., Katzmarzyk, P. T., Perusse, L., Tremblay, A., Despres, J. P., &
Bouchard, C. (2005). Aerobic fitness, body mass index, and CVD risk
factors among adolescents: The Quebec family study. International Journal
of Obesity, 29(9), 1077-1083.
Eisenmann, J. C., Welk, G. J., Ihmels, M., & Dollman, J. (2007). Fatness, fitness,
and cardiovascular disease risk factors in children and adolescents. Med
Sci Sports Exerc, 39(8), 1251-1256.
Eisenmann, J. C., Welk, G. J., Wickel, E. E., & Blair, S. N. (2007). Combined
influence of cardiorespiratory fitness and body mass index on
cardiovascular disease risk factors among 8-18 year old youth: The
Aerobics Center Longitudinal Study. Int J Pediatr Obes, 2(2), 66-72.
138
Ekelund, U., Anderssen, S. A., Froberg, K., Sardinha, L. B., Andersen, L. B., &
Brage, S. (2007). Independent associations of physical activity and
cardiorespiratory fitness with metabolic risk factors in children: The
European youth heart study. Diabetologia, 50(9), 1832-1840.
Ferreira, I., Henry, R. M., Twisk, J. W., van Mechelen, W., Kemper, H. C.,
Stehouwer, C. D., et al. (2005). The metabolic syndrome, cardiopulmonary
fitness, and subcutaneous trunk fat as independent determinants of arterial
stiffness: the Amsterdam Growth and Health Longitudinal Study. Archives
of Internal Medicine, 165(8), 875-882.
Freedman, D. S., Serdula, M. K., Srinivasan, S. R., & Berenson, G. S. (1999).
Relation of circumferences and skinfold thicknesses to lipid and insulin
concentrations in children and adolescents: The Bogalusa Heart Study.
American Journal of Clinical Nutrition, 69(2), 308-317.
Gaya, A., & Silva, G. (2007). Projeto Esporte Brasil (PROES-BR) - Observatório
permanente dos indicadores de saúde e fatores de prestação esportiva em
crianças e jovens. Manual de aplicação de medidas e testes, normas e
critérios de avaliação. Porto Alegre: Universidade Federal do Rio Grande
do Sul. Escola de Educação Física. Centro de Excelência Esportiva.
Gidding, S. S., Dennison, B. A., Birch, L. L., Daniels, S. R., Gilman, M. W.,
Lichtenstein, A. H., et al. (2006). Dietary recommendations for children and
adolescents: A guide for practitioners. Pediatrics, 117(2), 544-559.
Guerra, S., Ribeiro, J. C., Costa, R., Duarte, J., & Mota, J. (2002). Relationship
between cardiorespiratory fitness, body composition and blood pressure in
school children. Journal of Sports Medicine and Physical Fitness, 42(2),
207-213.
Gutin, B., Barbeau, P., Owens, S., Lemmon, C. R., Bauman, M., Allison, J., et al.
(2002). Effects of exercise intensity on cardiovascular fitness, total body
composition, and visceral adiposity of obese adolescents. American
Journal of Clinical Nutrition, 75(5), 818-826.
139
Gutin, B., Yin, Z., Humphries, M. C., & Barbeau, P. (2005). Relations of moderate
and vigorous physical activity to fitness and fatness in adolescents.
American Journal of Clinical Nutrition, 81(4), 746-750.
Gutin, B., Yin, Z., Humphries, M. C., Bassali, R., Le, N. A., Daniels, S., et al.
(2005). Relations of body fatness and cardiovascular fitness to lipid profile
in black and white adolescents. Pediatr Res, 58(1), 78-82.
IDF. (2007). The IDF consensus definition of the metabolic syndrome in children
and adolescents: International Diabetes Federation Communications.
Jae, S. Y., Heffernan, K. S., Fernhall, B., Oh, Y. S., Park, W. H., Lee, M. K., et al.
(2010). Association between cardiorespiratory fitness and arterial stiffness
in men with the metabolic syndrome. Diabetes Research and Clinical
Practice, 90(3), 326-332.
Janssen, I. (2007). Physical activity guidelines for children and youth. Applied
Physiology, Nutrition and Metabolism, 32, S109–S121.
Kavey, R. E. W., Daniels, S. R., Lauer, R. M., Atkins, D. L., Hayman, L. L., &
Taubert, K. (2003). American Heart Association guidelines for primary
prevention of atherosclerotic cardiovascular disease beginning in childhood.
Circulation, 107(11), 1562-1566.
Lauer, R. M., Lee, J., & Clarke, W. R. (1988). Factors affecting the relationship
between childhood and adult cholesterol levels: The muscatine study.
Pediatrics, 82(3), 309-318.
Léger, L. A., Lambert, A., Goulet, A., Rowan, C., & Dinelle, Y. (1984). Capacity
aerobic des Quebecois de 6 a 17 ans - test Navette de 20 metres avec
paliers de 1 minute. Can J Appl Sport Sci, 9, 64-69.
Leger, L. A., & Lambert, J. (1982). A maximal multistage 20-m shuttle run test to
predict VO2 max. European Journal of Applied Physiology and
Occupational Physiology, 49(1), 1-12.
140
Léger, L. A., Mercier, D., Gadoury, C., & Lambert, J. (1988). The multistage 20
metre shuttle run test for aerobic fitness. Journal of Sports Sciences, 6(2),
93-101.
Li, S., Chen, W., Srinivasan, S. R., Bond, M. G., Tang, R., Urbina, E. M., et al.
(2003). Childhood Cardiovascular Risk Factors and Carotid Vascular
Changes in Adulthood: The Bogalusa Heart Study. Journal of the American
Medical Association, 290(17), 2271-2276.
Lobelo, F., Pate, R. R., Dowda, M., Liese, A. D., & Ruiz, J. R. (2009). Validity of
cardiorespiratory fitness criterion-referenced standards for adolescents.
Medicine & Science in Sports & Exercise, 41(6), 1222-1229.
Lydakis, C., Stefanaki, E., Stefanaki, S., Thalassinos, E., Kavousanaki, M., &
Lydaki, D. (2012). Correlation of blood pressure, obesity, and adherence to
the Mediterranean diet with indices of arterial stiffness in children. European
Journal of Pediatrics.
Mahoney, L. T., Burns, T. L., Stanford, W., Thompson, B. H., Witt, J. D., Rost, C.
A., et al. (1996). Coronary risk factors measured in childhood and young
adult life are associated with coronary artery calcification in young adults:
The Muscatine study. Journal of the American College of Cardiology, 27(2),
277-284.
Martins, C., Silva, F., Santos, M. P., Ribeiro, J. C., & Mota, J. (2008). Trends of
cardiovascular risk factors clustering over time: A study in two cohorts of
portuguese adolescents. Pediatric Exercise Science, 20(1), 74-83.
Matsuzaka, A., Takahashi, Y., Yamazoe, M., Kumakura, N., Ikeda, A., Wilk, B., et
al. (2004). Validity of the multistage 20-m shuttle-run test for Japanese
children, adolescents, and adults. Pediatric Exercise Science, 16(2), 113-
125.
McMurray, R. G., & Andersen, L. B. (2010). The Influence of Exercise on Metabolic
Syndrome in Youth: A Review. American Journal of Lifestyle Medicine, 4(2),
176-186.
141
Mota, J., Guerra, S., Leandro, C., Pinto, A., Ribeiro, J. C., & Duarte, J. A. (2002).
Association of maturation, sex, and body fat in cardiorespiratory fitness.
American Journal of Human Biology, 14(6), 707-712.
Myers, J., Prakash, M., Froelicher, V., Do, D., Partington, S., & Atwood, J. E.
(2002). Exercise capacity and mortality among men referred for exercise
testing. New England Journal of Medicine, 346(11), 793-801.
Nicklas, T. A., Von Duvillard, S. P., & Berenson, G. S. (2002). Tracking of serum
lipids and lipoproteins from childhood to dyslipidemia in adults: The
Bogalusa Heart Study. International Journal of Sports Medicine,
Supplement, 23(1).
Nielsen, G. A., & Andersen, L. B. (2003). The association between high blood
pressure, physical fitness, and body mass index in adolescents. Preventive
Medicine, 36(2), 229-234.
Ortega, F. B., Ruiz, J. R., Castillo, M. J., & Sjöström, M. (2008). Physical fitness in
childhood and adolescence: A powerful marker of health. International
Journal of Obesity, 32(1), 1-11.
Reed, K. E., Warburton, D. E. R., Macdonald, H. M., Naylor, P. J., & McKay, H. A.
(2008). Action Schools! BC: A school-based physical activity intervention
designed to decrease cardiovascular disease risk factors in children.
Preventive Medicine, 46(6), 525-531.
Ribeiro, J. C., Guerra, S., Oliveira, J., Teixeira-Pinto, A., Twisk, J. W. R., Duarte, J.
A., et al. (2004). Physical activity and biological risk factors clustering in
pediatric population. Preventive Medicine, 39(3), 596-601.
Rowland, T., Wehnert, M., & Miller, K. (2000). Cardiac responses to exercise in
competitive child cyclists. Medicine and Science in Sports and Exercise,
32(4), 747-752.
Ruiz, J. R., Ortega, F. B., Meusel, D., Harro, M., Oja, P., & Sjöström, M. (2006).
Cardiorespiratory fitness is associated with features of metabolic risk
142
factors in children. Should cardiorespiratory fitness be assessed in a
European health monitoring system? The European Youth Heart Study.
Journal of Public Health, 14(2), 94-102.
Ruiz, J. R., Ortega, F. B., Rizzo, N. S., Villa, I., Hürtig-Wennlöf, A., Oja, L., et al.
(2007). High cardiovascular fitness is associated with low metabolic risk
score in children: The European Youth Heart Study. Pediatric Research,
61(3), 350-355.
Ruiz, J. R., Ramirez-Lechuga, J., Ortega, F., Castro-Pinero, J., Benitez, J. M.,
Arauzo-Azofra, A., et al. (2008). Artificial neural network-based equation for
estimating VO2max from the 20 m shuttle run test in adolescents. Artificial
Intelligence in Medicine, 44(3), 233-245.
Ruiz, J. R., Silva, G., Oliveira, N., Ribeiro, J., Oliveira, J., & Mota, J. (2009).
Criterion-related validity of the 20-m shuttle run test in youths aged 13-19
years. Journal of Sports Sciences, 27(9), 899-906.
Sakuragi, S., Abhayaratna, K., Gravenmaker, K. J., O'Reilly, C., Srikusalanukul, W.,
Budge, M. M., et al. (2009). Influence of adiposity and physical activity on
arterial stiffness in healthy children: the lifestyle of our kids study.
Hypertension, 53(4), 611-616.
Silva, G., Aires, L., Mota, J., Oliveira, J., & Ribeiro, J. C. (2012). Normative and
criterion-related standards for shuttle run performance in youth. Pediatric
Exercise Science, 24(2), 157-169.
Silva, G., Oliveira, N. L., Aires, L., Mota, J., Oliveira, J., & Ribeiro, J. C. (2012).
Calculation and validation of models for estimating VO2max from the 20-m
shuttle run test in children and adolescents. Archives of Exercise in Health
and Disease, 3(1-2), 145-152.
Srinivasan, S. R., & Berenson, G. S. (1995). Childhood lipoprotein profiles and
implications for adult coronary artery disease: the Bogalusa Heart Study.
Am J Med Sci, 310 Suppl 1, S62-67.
143
Stamler, J., Stamler, R., Neaton, J. D., Wentworth, D., Daviglus, M. L., Garside, D.,
et al. (1999). Low risk-factor profile and long-term cardiovascular and
noncardiovascular mortality and life expectancy: findings for 5 large cohorts
of young adult and middle-aged men and women. JAMA, 282(21), 2012-
2018.
Stoedefalke, K., Armstrong, N., Kirby, B. J., & Welsman, J. R. (2000). Effect of
training on peak oxygen uptake and blood lipids in 13 to 14-year-old girls.
Acta Paediatrica, 89(11), 1290-1294.
Strong, W. B., Malina, R. M., Blimkie, C. J. R., Daniels, S. R., Dishman, R. K.,
Gutin, B., et al. (2005). Evidence based physical activity for school-age
youth. Journal of Pediatrics, 146(6), 732-737.
Taylor, H. L., Buskirk, E., & Henschel, A. (1955). Maximal oxygen intake as an
objective measure of cardiorespiratory performance. Journal of Applied
Physiology, 8, 73-80.
Taylor, R. W., Jones, I. E., Williams, S. M., & Goulding, A. (2000). Evaluation of
waist circumference, waist-to-hip ratio, and the conicity index as screening
tools for high trunk fat mass, as measured by dual-energy X-ray
absorptiometry, in children aged 3-19 y. Am J Clin Nutr, 72(2), 490-495.
The Cooper Institute. (2007). FITNESSGRAM/ACTIVITYGRAM: Test Administration
Manual (4th ed.). Champaign, IL: Human Kinetics.
The Cooper Institute for Aerobics Research. (1999). FITNESSGRAM test
administration manual. Champaign, IL: Human Kinetics.
Tolfrey, K., Jones, A. M., & Campbell, I. G. (2004). Lipid-lipoproteins in children:
an exercise dose-response study. Medicine and Science in Sports and
Exercise, 36(3), 418-427.
Tomkinson, G. R., Leger, L. A., Olds, T. S., & Cazorla, G. (2003). Secular trends in
the performance of children and adolescents (1980-2000): an analysis of
144
55 studies of the 20m shuttle run test in 11 countries. Sports Medicine,
33(4), 285-300.
Urbina, E. M., Gao, Z., Khoury, P. R., Martin, L. J., & Dolan, L. M. (2012). Insulin
resistance and arterial stiffness in healthy adolescents and young adults.
Diabetologia, 55(3), 625-631.
Urbina, E. M., Kimball, T. R., Khoury, P. R., Daniels, S. R., & Dolan, L. M. (2010).
Increased arterial stiffness is found in adolescents with obesity or obesity-
related type 2 diabetes mellitus. J Hypertens, 28(8), 1692-1698.
Webber, L. S., Srinivasan, S. R., Wattigney, W. A., & Berenson, G. S. (1991).
Tracking of serum lipids and lipoproteins from childhood to adulthood. The
Bogalusa Heart Study. American Journal of Epidemiology, 133(9), 884-899.
Welk, G. J., Laurson, K. R., Eisenmann, J. C., & Cureton, K. J. (2011).
Development of youth aerobic-capacity standards using receiver operating
characteristic curves. American Journal of Preventive Medicine, 41(4 Suppl
2), S111-116.
WHO. (2010). Global recommendations on physical activity for health. Switzerland:
World Health Organization.