Embed Size (px)
Citation preview
The Journal of Neuroscience, September 1994, 14(g): 54375452
Gustatory, Olfactory, and Visual Convergence within the Primate Orbitofrontal Cortex
Edmund T. Rolls1 and Leslie L. Baylis*
‘Department of Experimental Psychology, University of Oxford, Oxford OX1 3UD, United Kingdom and *Department of Psychology, University of California at San Diego, La Jolla, California 92093-0109
Behavioral and perceptual responses to food depend on a convergence between gustatory, olfactory, and visual infor- mation. In previous studies a secondary cortical taste area has been found in the caudolateral orbitofrontal cortex of the primate. Furthermore, neurons with olfactory responses have been recorded in a more medial part of the orbitofrontal cortex, and visual inputs have been shown to influence neu- rons in an intermediate region. These studies suggest that the orbitofrontal cortex may act as a region for convergence of multiple sensory modalities including chemosensation.
In the present study neurons throughout the caudal two- thirds of the orbitofrontal cortex of the macaque were tested to gustatory, to olfactory, and to visual stimulation to inves- tigate whether convergence occurs. Neurons in this region of cortex were found that responded to stimulation of the taste, olfactory, or visual system. In addition, some neurons were found with bimodal responses, responding for example to both taste and olfactory, or taste and visual stimuli. Since these multimodal neurons were found in very close proximity to unimodal neurons, and the unimodal sensory neurons were intermingled, it is possible that the orbitofrontal cortex rep- resents the first cortical area of convergence for these three modalities in primates.
[Key words: multimodal convergence, chemosensoty, per- ception, feeding, orbitofrontal cortex, frontal lobe]
Flavor perception depends on both gustatory and olfactory sen- sations and the functional integration ofthe afferent information arising from each of these sensory systems. The anatomical basis of this sensory convergence is as yet unclear, despite the large amount of evidence pointing to interactions between these two modalities. Visual information, especially concerning the color of foods, has been shown to affect ingestive behavior and per- haps inthtence the perceived flavor of foods (see Rolls et al., 1982). The three sensory modalities of olfaction, gustation, and vision are clearly distinct in the periphery, and may not interact until the level of the cortex in primates.
Taste fibers enter the brainstem and synapse in the nucleus
Received Apr. 8, 1993; revised Feb. 18, 1994; accepted Mar. 15, 1994. This research was supported by MRC Program Grant 85 13790. We are very
arateful to Dr. J. C. Smith of Florida State Universitv fol’ the desian of the olfactometer, and to T. Chisholm for running some of the experiments here. We are especially grateful to Dr. G. C. Baylis for help with graphics, and for his many useful comments of previous drafts of this article.
Correspondence should be addressed to Leslie Baylis, Department of Psychology 0109, University of California, San Diego, La Jolla, CA 92093-0109.
Copyright 0 1994 Society for Neuroscience 0270-6474/94/145437-16$05.00/O
of the solitary tract, from which they project to the parvocellular region of the ventroposteromedial nucleus (VPMpc) of the thal- amus (Norgren, 1990). This subnucleus is thought to be prin- cipally gustatory in nature, although some neurons responding to oral tactile stimuli have also been found (Pritchard et al., 1989). These authors failed to find any neurons responding to visual or auditory stimuli within VPMpc. Primary gustatory cortex, located in the insular and opercular cortex, receives a monosynaptic input from VPMpc (Pritchard et al., 1986). A large number of cells with gustatory responses have been studied within insular and opercular cortex by Scot et al. (1986b) and Yaxley et al. (1990).
The olfactory system is largely anatomically distinct from the gustatory pathways. Olfactory fibers leave the olfactory bulb via the lateral olfactory tract, which bifurcates and projects to the pyriform cortex and the lateral olfactory nucleus (Powell et al., 1965; Price, 1990). The pyriform cortex has direct connections to a relatively medial part of the orbitofrontal cortex, area 13a, and to the mediodorsal nucleus of the thalamus, which in turn projects to the orbitofrontal cortex (Price, 1990).
The orbitofrontal cortex (OFC) of the macaque has been shown to contain neurons responding to sensory stimuli in the three modalities of taste, olfaction, and vision, although no study has systematically investigated all three together. For example, neu- rons responsive to gustatory stimulation have recently been re- ported in the caudolateral orbitofrontal (CLOF) cortex (Rolls et al., 1990; L. L. Baylis and E. T. Rolls, unpublished obser- vations). This region has recently been shown to be a secondary cortical taste area since it receives a strong projection from the primary taste cortex and none from the VPMpc (Wiggins et al., 1987; L. L. Baylis, E. T. Rolls, and G. C. Baylis, unpublished observations). Anteromedial to the CLOF is the centroposterior orbitofrontal (CPOF) cortex located in Walker’s (1940) area 13, where gustatory and visual neurons have been found (Benevento et al., 1977; Thorpe et al., 1983). Further, Tanabe et al. (1974) have shown that there is a population of neurons in the OFC responsive to olfactory stimulation (see also Tanabe et al., 1975a- c; Takagi, 1979; Yarita et al., 1980). These workers have also demonstrated evoked potentials from olfactory bulb stimulation in approximately the same area of the OFC where taste neurons were found.
On the basis of these studies, it is clear that the OFC receives sensory information from all three modalities, and it is likely that there is an area within the OFC that receives overlapping projections (see Rolls, 1989). Taste neurons in the CLOF and CPOF lie within regions that receive projections from the insular and opercular gustatory areas. There is less agreement as to the pathways involved in the projection of olfactory information to
5438 Rolls and Baylis - Multimodal Responses in OFC
Table 1. Gustatory stimuli used in this study
Abbrevi- Concentra- ation Tastant tion (M)
G N
: M
Glucose Sodium chloride Hydrochloric acid Quinine hydrochloride Monosodium glutamate
1.0 0.1 0.01 0.001 0.1
the CLOF and CPOF (Potter and Nauta, 1979). Other neu- roanatomical and neurophysiological studies have shown that visual, somatosensory, and auditory cortices project to these areas as well (Kuypers et al., 1965; Pandya and Kuypers, 1969). However, the degree to which the polysensory overlap repre- sents convergence at the level of single cells is unknown. The aim of the present study was to determine whether in the sec- ondary taste cortex, in the CLOF, and in adjoining cortical regions such as the CPOF, there are multimodal inputs, and if so, whether these multimodal inputs converge onto single cells.
Materials and Methods Recordings Recordings were made from single neurons in the frontal cortex of awake, behaving cynomolgous macaques (Mucaca fascicularis). Subjects were initially prepared for recording using recording techniques that have been described previously (Rolls et al., 1976; Scott et al., 1986a). This enabled the daily placement of recording electrodes to precisely determined locations. The three male cynomolgous monkeys used as subjects weighed between 3.0 and 4.2 kg during testing. Monkeys were given access to water ad libitum at all times, and were fed upon their return to their home cages. Testing sessions lasted between 2 and 5 hr, on average approximately 4 hr. Glass insulated tungsten microelectrodes were constructed in the manner of Merrill and Ainsworth (1972), but without platinum plating. The high stability in the recording of the cells allowed some cells to be monitored for over 4 hr. The signal from the microelectrode was passed through a source-follower FET circuit im- mediately next to the monkey’s head, then through an amplifier with active high and low-pass filters. From here the signal was displayed on an oscilloscope and fed via a window discriminator to the computer. The computer (Microvax II, Digital Equipment Corp.) collected the spike arrival times and displayed summary statistics or a peristimulus time histogram and rastergram on line.
Localization of recording sites X-Radiographs were used to locate the position of the microelectrode after each recording track relative to the permanent reference electrodes and to the anterior sphenoidal process (henceforth sphenoid). Sphenoid was used as a reference due to its visibility on x-radiographs and because it is a bony landmark that has a relatively invariant position with respect
Table 2. Olfactory stimuli used in this study
Abbreviation Odorant
Ba Banana Le Lemon Or Orange Pi Pineapple Eu Eugenol (clove) Sa Smoked salmon On Onion Ca Caprylic acid (burnt plastic) Ci Cineole (eucalyptus)
Table 3. Number and proportion (in parentheses) of cells responding in each sensory modality
Modality of response Posterior Anterior Combined
Gustatory 31 (66%) 38 (33.9%) 69 (43.7%) Olfactory 0 (0%) 1.5 (13.4%) 15 (9.5%) Visual 5 (10.6%) 24 (2 1.4%) 29 (18.4%)
Gustatory and olfactory 1 (2.1%) 15 (13.4%) 16 (10.0%) Gustatory and visual 8 (17%) 15 (13.4%) 23 (14.6%) Olfactory and visual 0 (0%) 5 (4.5%) 5 (3.2%)
Trimodal 1 (2.1%) 0 (0.0%) 1 (0.6%)
Total 46 (100%) 112 (100%) 158 (100%)
The primary taste cortex as physiologically identified by Rolls et al. (1990) and anatomically by Pritchard et al. (1986) lies posterior to the exterior frontal opcr- culum. This lies approximately 2 mm anterior to sphenoid. This x-ray landmark has therefore been used to divide neurons into those in a posterior division (and hence mainly within the primary taste cortex) and an anterior division (within higher-order taste cortex).
to brain structures (Aggleton and Passingham, 198 1). The mean position of the tip of the sphenoid process was 11 mm dorsal and 20 mm anterior to ear-bar zero in this species. During the final recording tracks in each monkey, microlesions were made through the tip of the recording elec- trode to mark the location of typical units. These lesions allowed the positions of all cells that were known with respect to bony landmarks to be fixed relative to the brain sections.
Gustatory stimuli Five gustatory stimuli were employed for neurophysiological testing as shown in Table 1. The monkey’s mouth was rinsed with distilled water during the intertrial interval (which lasted at least 30 set, or until neu- ronal activity returned to baseline levels). The stimuli were delivered intraorally in quantities of 0.5 ml with a hand-held 3 ml syringe. For chronic recording in monkeys, this manual method for stimulus delivery is effective because it allows for repeated stimulation of a large receptive field despite different mouth and tongue positions adopted by the mon- keys as palatability of the solutions varies (Scott et al., 1986a).
Olfactory stimuli The nine olfactory stimuli employed for neurophysiological olfactory testing were chosen in order to represent food and nonfood odors (see Table 2). They included food-related fruit odors such as pineapple, banana, limonene (lemon), and orange; other food-related odors such as salmon and onion; and nonfood odors such as caprylic acid (plastic) and cineole. At low concentrations these substances will primarily stim- ulate the olfactory system. However, it is possible that moderate to high concentrations may be reached that lead to some stimulation of the trigeminal system in addition to the olfactory system.
Manual presentation. These stimuli, in aqueous solution, were pre- sented to the monkey using a cotton swab saturated with the odorant held 1 cm directly in front of the monkey’s nose. The intensities of the stimuli were chosen so that they were easily identifiable by humans. Moreover, these same stimuli were used in an olfactory discrimination task and were shown to be discriminable from each other by the mon- keys.
Olfactory discrimination task (ODT). Two olfactory stimuli chosen from the nine described previously were used, where one was paired with the S+ (black currant juice) if the monkey licked while the second was paired with the S- (aversive saline). The probability of the S+ was 0.5. A computer-controlled odor delivery system emitted an odorant for 1 set through a delivery tube located 1 cm from the monkey’s nostrils. In this system, air passed at a controlled rate through a carbon filter to a set of solenoid-operated air valves. Each air valve was connected via a wash-bottle containing the odorant to its own 1 mm (outside diameter) stainless-steel tube. These tubes were brought together 1 cm in front of the monkey’s nose. This delivery system ensured that there was no dead space, and no shared delivery tube that could be contaminated by dif- ferent odorants. The computer operated one of the solenoids to deliver an odor for 1 set on each trial. The solenoids were in a muffled enclosure, and white noise ensured that their operation could not be discriminated
The Journal of Neuroscience, September 1994, M(9) 5439
Gustatory Olfactory
by the monkey. Odorant removal was facilitated by an air extraction system connected to the back of a hood that surrounded the monkey’s head. The onset of olfactant on each trial was signaled to the monkey by a 0.5 set 450 Hz tone. The computer presented the results of every trial individually as a rastergram ofsingle neuron activity and computed, on line, the peristimulus time histograms together with the statistical analyses of changes in neuronal firing rate using cumulative sum sta- tistics (Woodward and Goldsmith, 1964) and T tests.
Visual stimuli
Manual testing for visual responsiveness. In the period immediately before the manual delivery of gustatory and olfactory stimuli, the mon- key could see the stimulus. For some neurons, this visual stimulation activated the neuron. When this occurred, the responses to food-related visual stimuli (bite-sized pieces of apple or banana or the sight of the black currant juice syringe) and visual stimuli unrelated to food (e.g., common laboratory objects) were compared. Recording continued if the cell responded differentially to food-related versus non-food-related visual objects. However, if a cell responded indiscriminately to all visual stimuli and not to any taste or olfactory stimuli, then recording from that particular cell ceased and it was classified as having a nonselective visual response. Only visual responses that were food selective, or that occurred in neurons that also had taste or olfactory responses (i.e., in bimodally responsive cells), were analyzed. All cells with such visual responses were tested in a visual discrimination task.
Table 4. The mean spnotaneous activity and the mean evoked response to the best gustatory, olfactory, or visual stimuli for unimodal and bimodal cells
Spontaneous activity (spikes/set)
Response to optimal (spikes/set)
Gustatory responses Gustatory only Gustatory-olfactory Gustatory-visual
Olfactory responses OlfacJory only Olfactory-gustatory Olfactory-visual
Visual responses Visual only Visual-gustatory Visual*lfactory
4.9 17.3 (3.1) 4.8 13.7 (2.8) 5.4 21.8 (3.3)
3.9 14.1 (3.1) 4.8 10.1 (2.6) 5.9 10.2 (2.2)
5.2 13.5 (1.4) 5.4 18.2 (1.8) 5.9 21.7 (2.1)
The evoked response is shown as the increase in firing rate from the spontaneous rate. The SEM of the evoked response is given in parentheses.
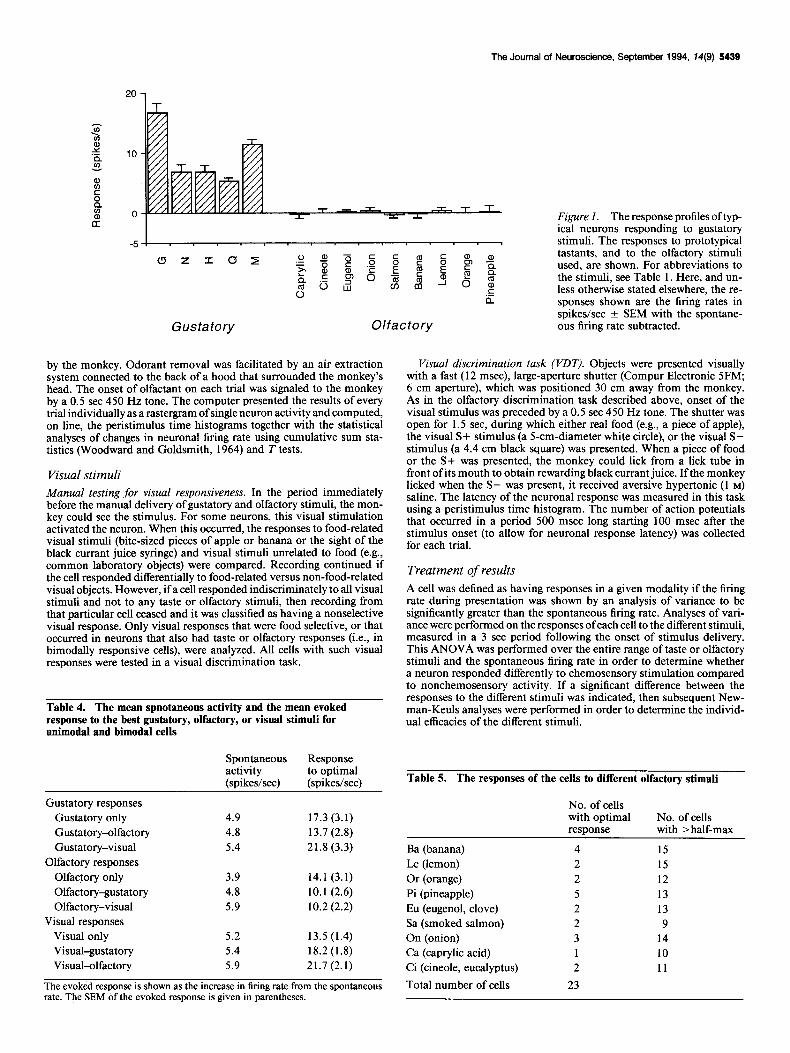
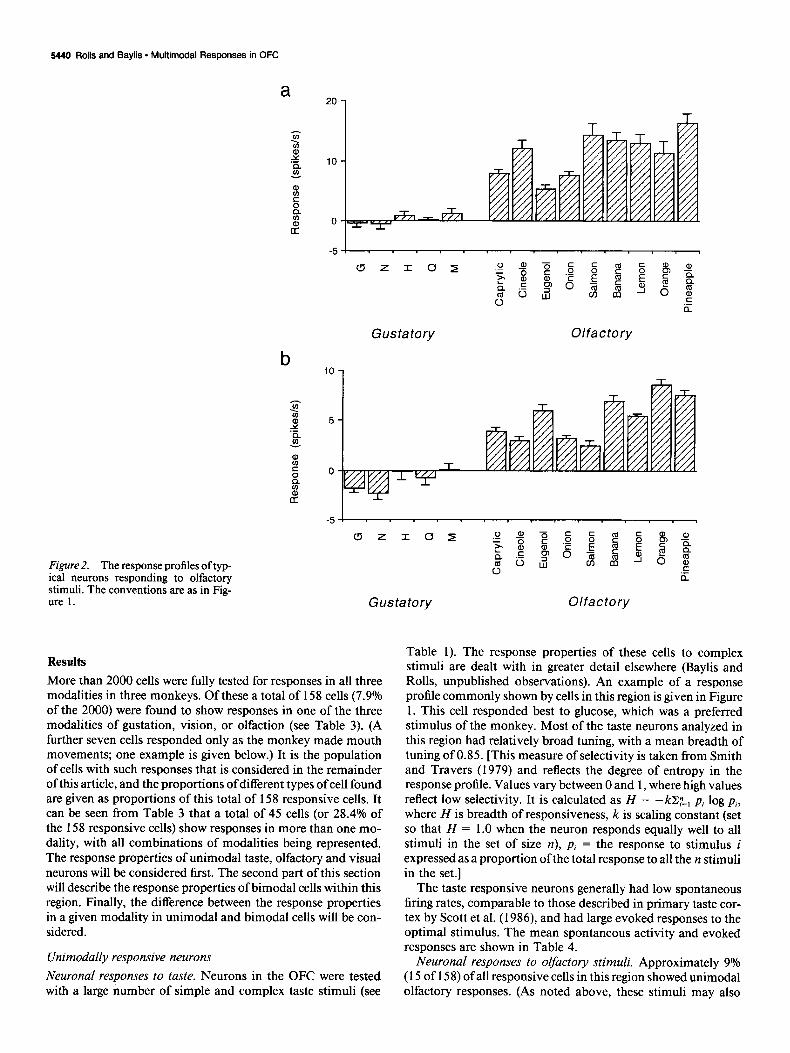
Figure 1. The response profiles oftyp- ical neurons responding to gustatory stimuli. The responses to prototypical tastants, and to the olfactory stimuli used, are shown. For abbreviations to the stimuli, see Table 1. Here, and un- less otherwise stated elsewhere, the re- sponses shown are the firing rates in spikeslsec ? SEM with the spontane- ous firing rate subtracted.
Visual discrimination task (VDT). Objects were presented visually with a fast (12 msec), large-aperture shutter (Compur Electronic 5FM; 6 cm aperture), which was positioned 30 cm away from the monkey. As in the olfactory discrimination task described above, onset of the visual stimulus was preceded by a 0.5 set 450 Hz tone. The shutter was open for 1.5 set, during which either real food (e.g., a piece of apple), the visual S+ stimulus (a 5-cm-diameter white circle), or the visual S- stimulus (a 4.4 cm black square) was presented. When a piece of food or the S+ was presented, the monkey could lick from a lick tube in front of its mouth to obtain rewarding black currant juice. If the monkey licked when the S- was present, it received aversive hypertonic (1 M) saline. The latency of the neuronal response was measured in this task using a peristimulus time histogram. The number of action potentials that occurred in a period 500 msec long starting 100 msec after the stimulus onset (to allow for neuronal response latency) was collected for each trial.
Treatment of results A cell was defined as having responses in a given modality if the firing rate during presentation was shown by an analysis of variance to be significantly greater than the spontaneous firing rate. Analyses of vari- ance were performed on the responses of each cell to the different stimuli, measured in a 3 set period following the onset of stimulus delivery. This ANOVA was performed over the entire range of taste or olfactory stimuli and the spontaneous firing rate in order to determine whether a neuron responded differently to chemosensory stimulation compared to nonchemosensory activity. I f a significant difference between the responses to the different stimuli was indicated, then subsequent New- man-Keuls analyses were performed in order to determine the individ- ual efficacies of the different stimuli.
Table 5. The responses of the cells to different olfactory stimuli
No. of cells with optimal response
No. of cells with > half-max
Ba (banana) 4 Le (lemon) 2 Or (orange) 2 Pi (pineapple) 5 Eu (eugenol, clove) 2 Sa (smoked salmon) 2 On (onion) 3 Ca (caprylic acid) 1 Ci (cineole, eucalyptus) 2
Total number of cells 23
15 15 12 13 13 9
14 10 11
5440 Rolls and Baylis * Multimodal Responses in OFC
a
Gustatory Olfactory
b
Figure 2. The response profiles of typ- ical neurons responding to olfactory stimuli. The conventions are as in Fig- ure 1. Gustatory Olfactory
Results
More than 2000 cells were fully tested for responses in all three modalities in three monkeys. Of these a total of 158 cells (7.9% of the 2000) were found to show responses in one of the three modalities of gustation, vision, or olfaction (see Table 3). (A further seven cells responded only as the monkey made mouth movements; one example is given below.) It is the population of cells with such responses that is considered in the remainder of this article, and the proportions of different types of cell found are given as proportions of this total of 158 responsive cells. It can be seen from Table 3 that a total of 45 cells (or 28.4% of the 158 responsive cells) show responses in more than one mo- dality, with all combinations of modalities being represented. The response properties of unimodal taste, olfactory and visual neurons will be considered first. The second part of this section will describe the response properties of bimodal cells within this region. Finally, the difference between the response properties in a given modality in unimodal and bimodal cells will be con- sidered.
Unimodally responsive neurons
Neuronal responses to taste. Neurons in the OFC were tested with a large number of simple and complex taste stimuli (see
Table 1). The response properties of these cells to complex stimuli are dealt with in greater detail elsewhere (Baylis and Rolls, unpublished observations). An example of a response profile commonly shown by cells in this region is given in Figure 1. This cell responded best to glucose, which was a preferred stimulus of the monkey. Most of the taste neurons analyzed in this region had relatively broad tuning, with a mean breadth of tuning of 0.85. [This measure of selectivity is taken from Smith and Travers (1979) and reflects the degree of entropy in the response profile. Values vary between 0 and 1, where high values reflect low selectivity. It is calculated as H = -kZ:-, pi log p,, where H is breadth of responsiveness, k is scaling constant (set so that H = 1.0 when the neuron responds equally well to all stimuli in the set of size n), p, = the response to stimulus i expressed as a proportion of the total response to all the n stimuli in the set.]
The taste responsive neurons generally had low spontaneous firing rates, comparable to those described in primary taste cor- tex by Scott et al. (1986), and had large evoked responses to the optimal stimulus. The mean spontaneous activity and evoked responses are shown in Table 4.
Neuronal responses to olfactory stimuli. Approximately 9% (15 of 158) of all responsive cells in this region showed unimodal olfactory responses. (As noted above, these stimuli may also
The Journal of Neuroscience, September 1994. 14(9) 5441
A
I I I1llll II I Ii I L I I IL
I III1 I 111111 III I I I I I I II I L I II I II II I IL II II I
II I I IIIII~I I I II IL I lllll I
I I I IIII L I I L I I
I I II I II II I IL I III II IllI LI II I II I III I IIL I I I I I ILI III I
I I 11111111111111111111111 III II IIIIIII L I I II I I
I I I I II 111111 I I II lllll II II L I IIIII IIIU I I I UII II II I I II III II I I III I I I Ill HIII I I II IIL I IIIII L
I 1 I I I Ill Ill IIll LI I II LL I I
II I I II III II I I II I IIlL IIIIIIII L
, I I I I 1 I I
-400 0 400 800
B Peristimulus Time
VDT Reward a, 5 50
uz
1200
h-w
LL .BB J ..Jhh I II I II I I I I I II I III I
I I I I I I I I I II II I I I I I
I I I I I I I II II I III I I II I I I I II I I
I I I II I I I I I I I I I II II IIII II I I I I
I I I I I I I I
II I I llllllI I I I I I I I I I II I I I I I
I I II II I I I I I I I I I II III I I I I I
II III1 I I
I I I
r I # I I I I I I I
-400 0 400 800 1200
Peristimulus Time (ms)
VDT Saline
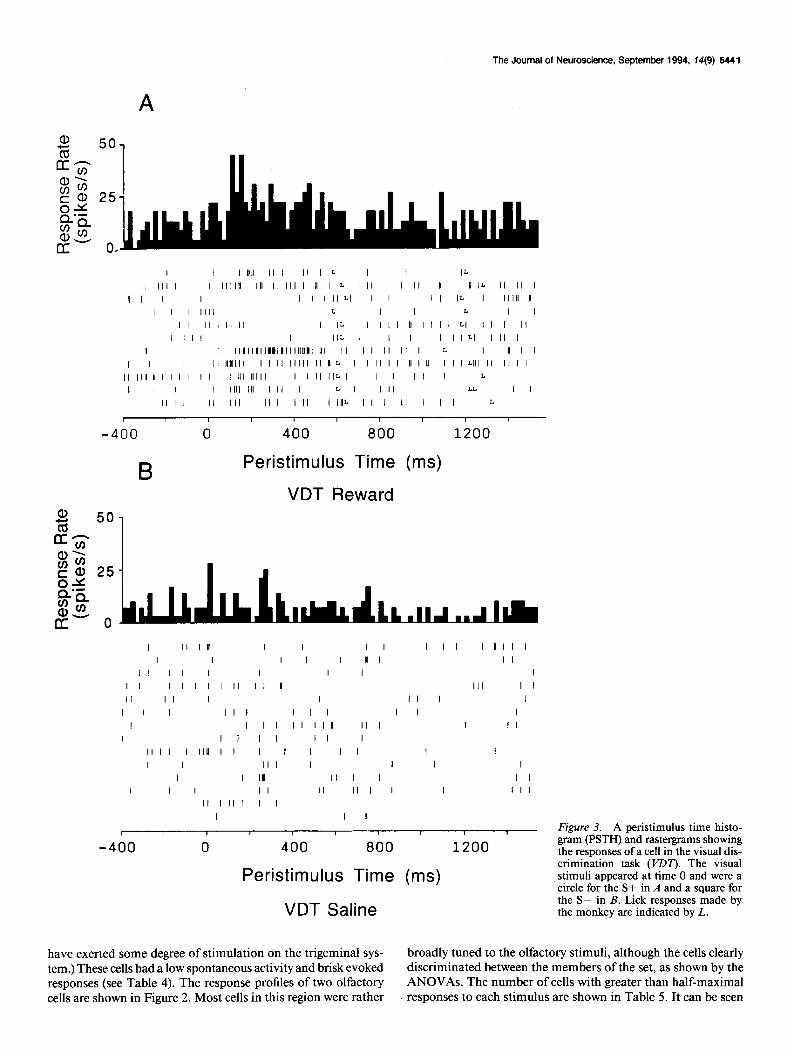
Figure 3. A peristimulus time histo- gram (PSTH) and rastergrams showing the responses of a cell in the visual dis- crimination task (VDT). The visual stimuli appeared at time 0 and were a circle for the S+ in A and a square for the S- in B. Lick responses made by the monkey are indicated by L.
have exerted some degree of stimulation on the trigeminal sys- broadly tuned to the olfactory stimuli, although the cells clearly tern.) These cells had a low spontaneous activity and brisk evoked discriminated between the members of the set, as shown by the responses (see Table 4). The response profiles of two olfactory ANOVAs. The number of cells with greater than half-maximal cells are shown in Figure 2. Most cells in this region were rather responses to each stimulus are shown in Table 5. It can be seen
5442 Rolls and Baylis * Multimodal Responses in OFC
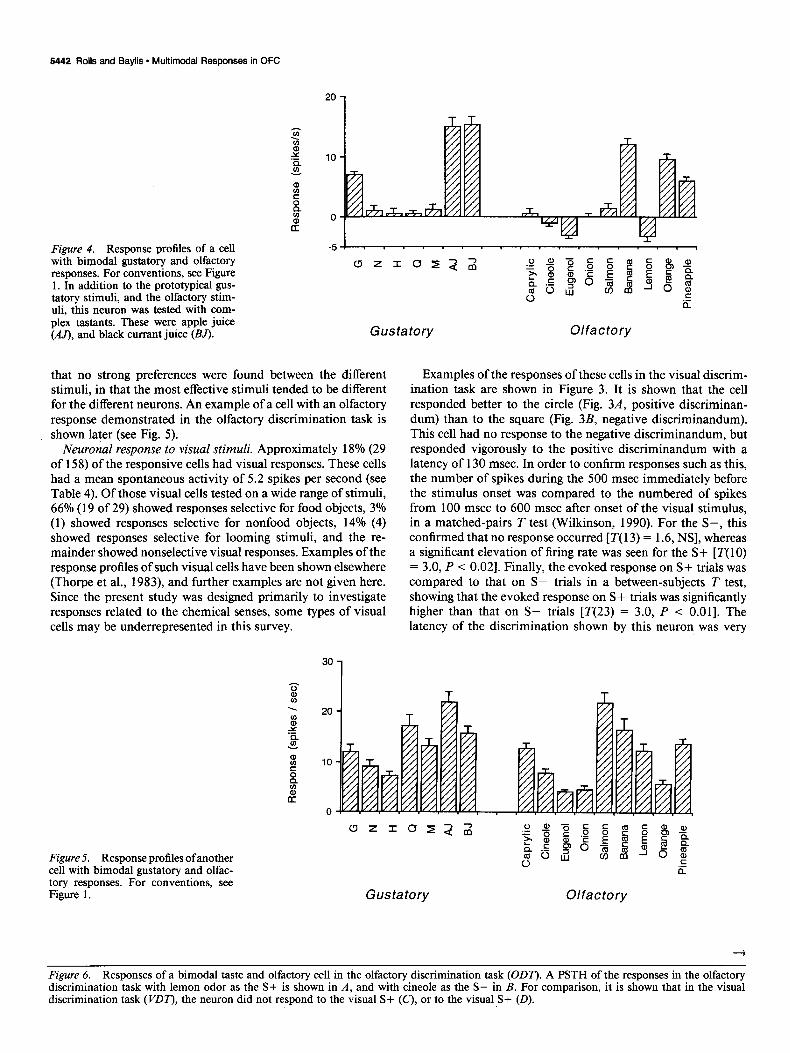
Figure 4. Response profiles of a cell with bimodal gustatory and olfactory responses. For conventions, see Figure 1. In addition to the prototypical gus- tatory stimuli, and the olfactory stim- uli, this neuron was tested with com- plex tastants. These were apple juice (M), and black currant juice (BJ).
that no strong preferences were found between the different stimuli, in that the most effective stimuli tended to be different for the different neurons. An example of a cell with an olfactory response demonstrated in the olfactory discrimination task is shown later (see Fig. 5).
Neuronal response to visual stimuli. Approximately 18% (29 of 158) of the responsive cells had visual responses. These cells had a mean spontaneous activity of 5.2 spikes per second (see Table 4). Of those visual cells tested on a wide range of stimuli, 66% (19 of 29) showed responses selective for food objects, 3% (1) showed responses selective for nonfood objects, 14% (4) showed responses selective for looming stimuli, and the re- mainder showed nonselective visual responses. Examples of the response profiles of such visual cells have been shown elsewhere (Thorpe et al., 1983), and further examples are not given here. Since the present study was designed primarily to investigate responses related to the chemical senses, some types of visual cells may be underrepresented in this survey.
Gustatory Olfactory
Figure 5. Response profiles of another cell with bimodal gustatory and olfac- tory responses. For conventions, see Figure 1.
30
20
1
Examples of the responses of these cells in the visual discrim- ination task are shown in Figure 3. It is shown that the cell responded better to the circle (Fig. 3A, positive discriminan- dum) than to the square (Fig. 3B, negative discriminandum). This cell had no response to the negative discriminandum, but responded vigorously to the positive discriminandum with a latency of 130 msec. In order to confirm responses such as this, the number of spikes during the 500 msec immediately before the stimulus onset was compared to the numbered of spikes from 100 msec to 600 msec after onset of the visual stimulus, in a matched-pairs T test (Wilkinson, 1990). For the S-, this confirmed that no response occurred [ T( 13) = 1.6, NS], whereas a significant elevation of firing rate was seen for the S+ [T(lO) = 3.0, P < 0.021. Finally, the evoked response on S+ trials was compared to that on S- trials in a between-subjects T test, showing that the evoked response on S+ trials was significantly higher than that on S- trials [T(23) = 3.0, P < 0.011. The latency of the discrimination shown by this neuron was very
Gustatory Olfactory
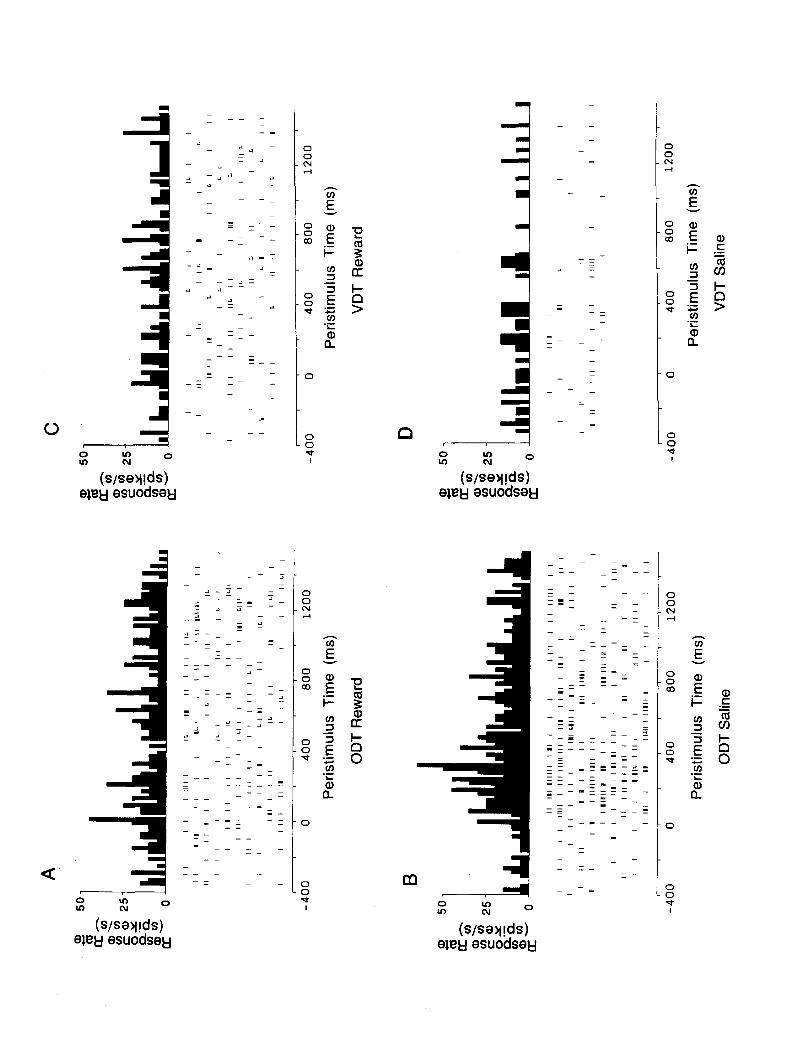
Figure 6. Responses of a bimodal taste and olfactory cell in the olfactory discrimination task (ODT). A PSTH of the responses in the olfactory discrimination task with lemon odor as the S+ is shown in A, and with cineole as the S- in B. For comparison, it is shown that in the visual discrimination task (VDT), the neuron did not respond to the visual S+ (C), or to the visual ,S+ (D).
C
-400
d
400
800
' '
' 12
00
Per
istim
ulus
Ti
me
(ms)
OD
T R
ewar
d
B
I
-400
0
400
800
1200
, -4
00
0 40
0 80
0 12
00
Per
istim
ulus
Ti
me
(ms)
VDT
Rew
ard
D
I II!
I
I I
I II
I I
I I
I I
I II
I II
I
H II
I ,
I, I
I II
I I
I lllll
I
II II
I I
III
I I
I
-400
0
400
800
1200
Per
istim
ulus
Ti
me
(ms)
P
eris
timul
us
Tim
e (m
s)
OD
T Sa
line
VDT
Salin
e
5444 Rolls and Baylis * Multimodal Responses in OFC
G N H Q M
Tastant
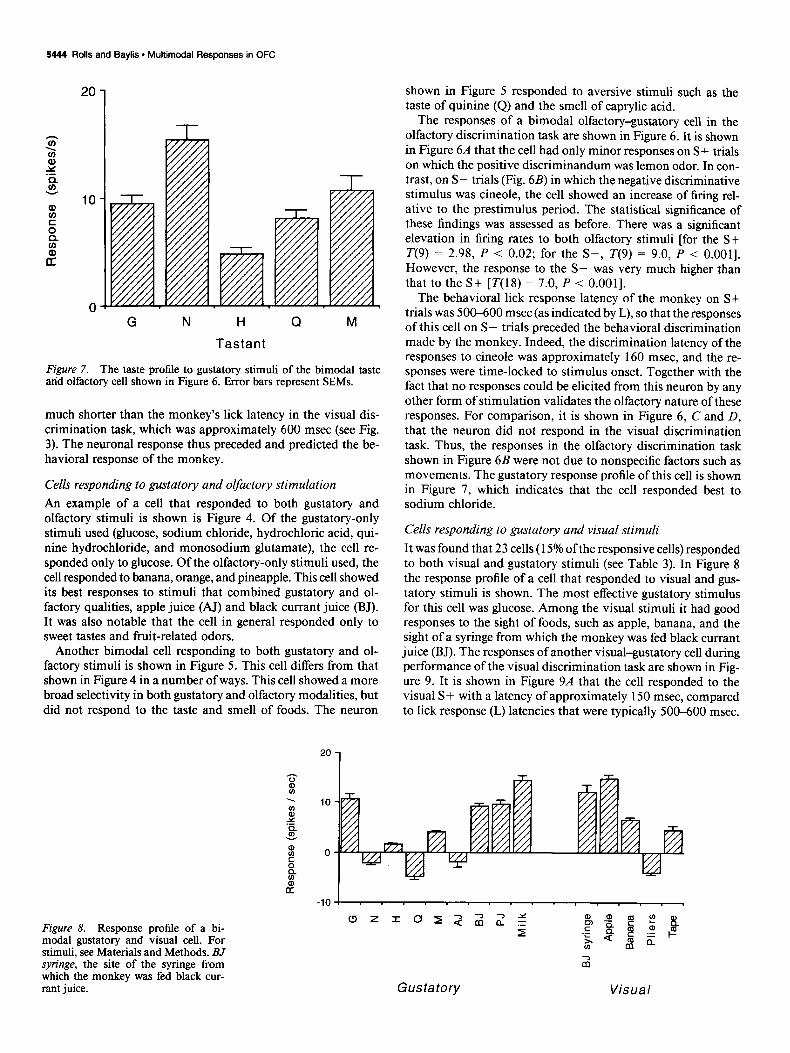
Figure 7. The taste profile to gustatory stimuli of the bimodal taste and olfactory cell shown in Figure 6. Error bars represent SEMs.
much shorter than the monkey’s lick latency in the visual dis- crimination task, which was approximately 600 msec (see Fig. 3). The neuronal response thus preceded and predicted the be- havioral response of the monkey.
Cells responding to gustatory and olfactory stimulation An example of a cell that responded to both gustatory and olfactory stimuli is shown is Figure 4. Of the gustatory-only stimuli used (glucose, sodium chloride, hydrochloric acid, qui- nine hydrochloride, and monosodium glutamate), the cell re- sponded only to glucose. Of the olfactory-only stimuli used, the cell responded to banana, orange, and pineapple. This cell showed its best responses to stimuli that combined gustatory and ol- factory qualities, apple juice (AJ) and black currant juice (BJ). It was also notable that the cell in general responded only to sweet tastes and fruit-related odors.
Another bimodal cell responding to both gustatory and ol- factory stimuli is shown in Figure 5. This cell differs from that shown in Figure 4 in a number of ways. This cell showed a more broad selectivity in both gustatory and olfactory modalities, but did not respond to the taste and smell of foods. The neuron
shown in Figure 5 responded to aversive stimuli such as the taste of quinine (Q) and the smell of caprylic acid.
The responses of a bimodal olfactory-gustatory cell in the olfactory discrimination task are shown in Figure 6. It is shown in Figure 6A that the cell had only minor responses on S+ trials on which the positive discriminandum was lemon odor. In con- trast, on S- trials (Fig. 6B) in which the negative discriminative stimulus was cineole, the cell showed an increase of firing rel- ative to the prestimulus period. The statistical significance of these findings was assessed as before. There was a significant elevation in firing rates to both olfactory stimuli [for the S+ T(9) = 2.98, P < 0.02; for the S-, T(9) = 9.0, P < O.OOl]. However, the response to the S- was very much higher than that to the S+ [T(18) = 7.0, P < O.OOl].
The behavioral lick response latency of the monkey on S+ trials was 500-600 msec (as indicated by L), so that the responses of this cell on S- trials preceded the behavioral discrimination made by the monkey. Indeed, the discrimination latency of the responses to cineole was approximately 160 msec, and the re- sponses were time-locked to stimulus onset. Together with the fact that no responses could be elicited from this neuron by any other form of stimulation validates the olfactory nature of these responses. For comparison, it is shown in Figure 6, C and D, that the neuron did not respond in the visual discrimination task. Thus, the responses in the olfactory discrimination task shown in Figure 6B were not due to nonspecific factors such as movements. The gustatory response profile of this cell is shown in Figure 7, which indicates that the cell responded best to sodium chloride.
Cells responding to gustatory and visual stimuli It was found that 23 cells (15% of the responsive cells) responded to both visual and gustatory stimuli (see Table 3). In Figure 8 the response profile of a cell that responded to visual and gus- tatory stimuli is shown. The most effective gustatory stimulus for this cell was glucose. Among the visual stimuli it had good responses to the sight of foods, such as apple, banana, and the sight of a syringe from which the monkey was fed black currant juice (BJ). The responses of another visual-gustatory cell during performance of the visual discrimination task are shown in Fig- ure 9. It is shown in Figure 9A that the cell responded to the visual S+ with a latency of approximately 150 msec, compared to lick response (L) latencies that were typically 500-600 msec.
Figure 8. Response profile of a bi- modal gustatory and visual cell. For stimuli, see Materials and Methods. BJ syringe, the site of the syringe from which the monkey was fed black cur- rant juice. Gustatory Visual
The Journal of Neuroscience, September 1994, f4(9) 5445
Peristimulus Time (ms)
VDT Reward
IN I,, I I, I, I I, II I IN, I II I II I, I
I I I, I I I I I I I l
I, II,,,, Ill I I I I I I I III I I I I I I Ill, I
I I I II ,I I, I I, I II I I II I
I I III,,, I II III I I I,, II,, I,, 1,111 I I I I I II I I I I
I ,,,,I ,,lN,I I I III I I I I I I, 11,111 I I I, I,,, II I I
I, I, I I I I I I I, I I, I I
I II I llllll I, I,, ,,I,, I,, ,,,I I II I ,I II I I I ,I ,111,111111 I
I
-400 0 400 800 1200
Peristimulus Time (ms)
G N H Q M
Gustatory Stimulus
VDT Saline
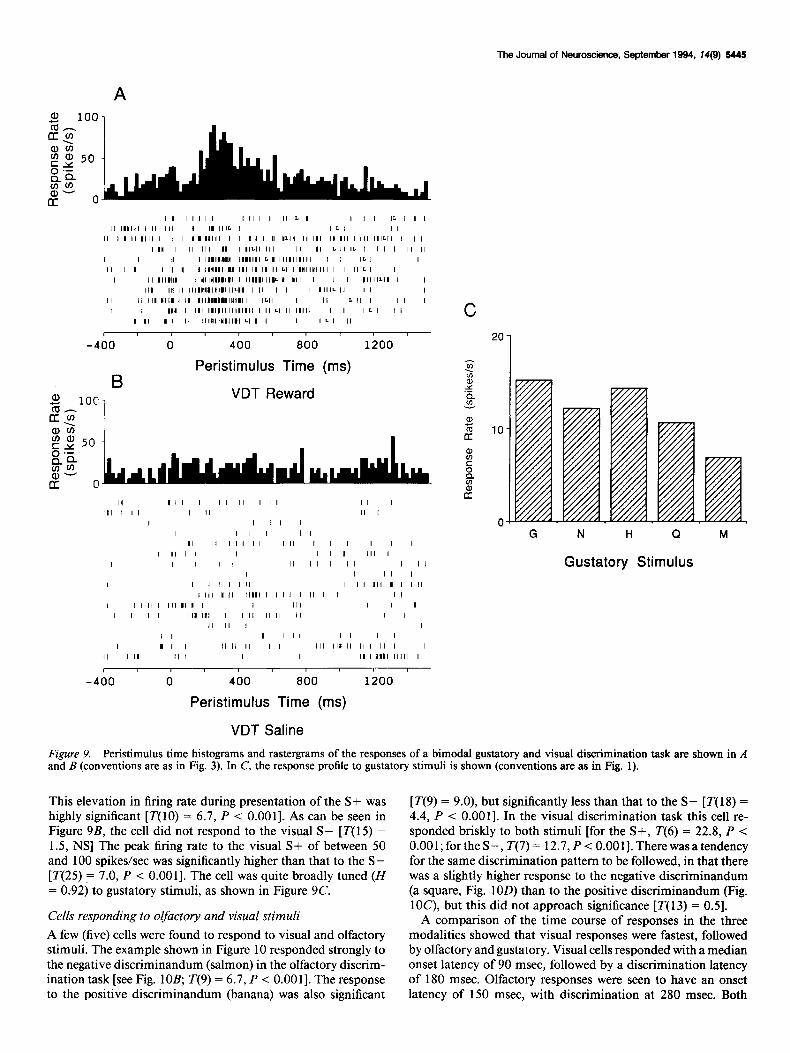
Figure 9. Peristimulus time histograms and rastergrams of the responses of a bimodal gustatory and visual discrimination task are shown in A and B (conventions are as in Fig. 3). In C, the response profile to gustatory stimuli is shown (conventions are as in Fig. 1).
This elevation in firing rate during presentation of the S+ was highly significant [T(lO) = 6.7, P < O.OOl]. As can be seen in Figure 9B, the cell did not respond to the visual S- [ T( 15) = 1.5, NS] The peak firing rate to the visual S+ of between 50 and 100 spikes/set was significantly higher than that to the S- [T(25) F 7.0, P < O.OOl]. The cell was quite broadly tuned (H = 0.92) to gustatory stimuli, as shown in Figure 9C.
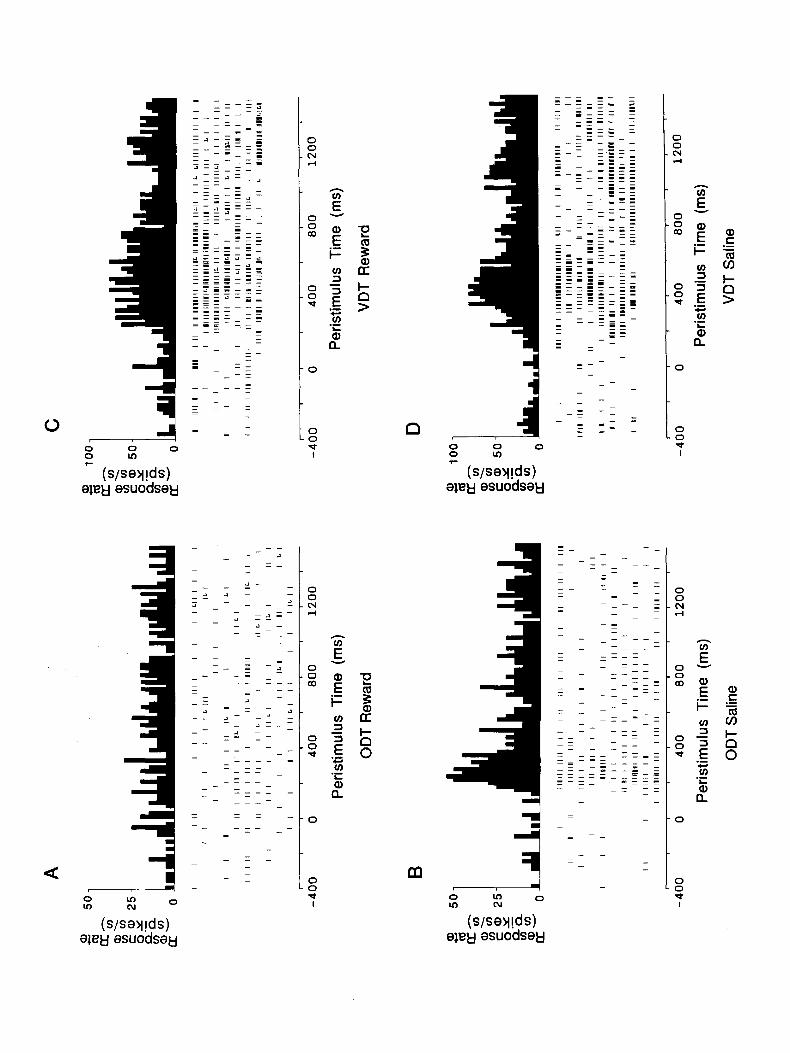
Cells responding to olfactory and visual stimuli A few (five) cells were found to respond to visual and olfactory stimuli. The example shown in Figure 10 responded strongly to the negative discriminandum (salmon) in the olfactory discrim- ination task [see Fig. lOB, T(9) = 6.7, P < O.OOl]. The response to the positive discriminandum (banana) was also significant
[T(9) = 9.0), but significantly less than that to the S- [ r( 18) = 4.4, P < O.OOl]. In the visual discrimination task this cell re- sponded briskly to both stimuli [for the S+, T(6) = 22.8, P < O.OOl;fortheS-, T(7)= 12.7,P< O.OOl].Therewasatendency for the same discrimination pattern to be followed, in that there was a slightly higher response to the negative discriminandum (a square, Fig. 1OD) than to the positive discriminandum (Fig. lOC), but this did not approach significance [T( 13) = 0.51.
A comparison of the time course of responses in the three modalities showed that visual responses were fastest, followed by olfactory and gustatory. Visual cells responded with a median onset latency of 90 msec, followed by a discrimination latency of 180 msec. Olfactory responses were seen to have an onset latency of 150 msec, with discrimination at 280 msec. Both
A C
Per
istim
ulus
Ti
me
(ms)
P
eris
timul
us
Tim
e (m
s)
OD
T R
ewar
d VD
T R
ewar
d
B
I lllll
l IIl
l I
I II
I II
III
II III
II
YI
Ill,,
II III
II
II II
1111
11u
III,
/ I
I I
I III
1 I
II II
I ,
II ,
I I
I I
IllIII
I I
I II
I I
I I
IIIIII
I II
I III
I
I I
!,iHI
I
I I
III
I I
I II
I I
I II
lllll,lll
I,
I! II
IIIIIl
11ll
II I
II I
IIIII
I I
I I
lllllxll
II
I III
I
I Illl
lIllll
, I
I II
!/I
I I
I I
Illlll
II I
l III
III
1 I
I I
I llI
IIHII
III
I III
II
I I
II II
I Illl
llll I
I ,
-400
0
400
800
1200
I Ill1
II
I Ill
I II
II llllY
llll 11
1111
11~
II IY
IIIII
11~1
1 I
I L
Llllll
III
,I I
I I
I I
I lllll
llllll~l
lillPllR
lllllllll
III1
I lllll
l I
Ill I
L I
I II
I I
I llA
llllllllll
llllll~
II II
I III
IL
III
IIIIIL
I I
I I
I I
I II
I II
I II
lllll
~Illll
lIIIll~
lII
I I
411
I I
I. I
I lll~
lI II
I II
I III
I
II I
III
II LI
I LI
I
IIIIII
II lllll
ll lllll
I
III
I II
I I
I I
I II
I Ill1
11
1111
111
II II
I 11
11
IIIIW
llll
llllI
II IIl
L Illl
lll I
IIll
I III!
lllll
ll llIl
llul
IL
I lllll
I
I I
II L
1111
1111
11
lw.lU
I I
-400
0
400
800
1200
D I
I Ill
III
I lllll
llllllllll
llll1li
III I
I I
II III
IIIIII
II
III
III
I III
1111
1111
1111
11
I I
I I
II I
I
1111
1111
1I
II IH
II
lllllll
Ill Ill1
II
III1
I III
I
I lllll
II
llllll
I I
II I
I 11
1111
1111
111
II Ill1
I
II III
I II
lllllllI
II
IIIII
I I
lllltlllf
lllllll
IIIIII
IIIII
II I
I II
I III
II I
III
llllllll
III
I I
I 11
1111
1 II
II I
I I
I I
I ,I
I I,
I lllll
llllllllll
l Ill
I II
I I
I III
II lw
llllllllll
llllllll
I III
1 II
I II
II Illl
ll III
I
I
I II
I I
1111
1111
1 II
IIIIII
IIIIII
IIIIII
IIIIII
II I
I IIII
IIlllII
,
-400
0
400
800
1200
Per
istim
ulus
Ti
me
(ms)
P
eris
timul
us
Tim
e (m
s)
OD
T Sa
line
VDT
Salin
e
The Journal of Neuroscience, September 1994, f4(9) 5447
A
I Illll~ll I II Ill1n~l III
I II llll~l illIlL I
IIIIIIIL I II II llllL I
IIIIL III I I 1111Ll I
IIPIIm4 III I IL I IIlFll I
I 111 IL II IlLI I
I I I lllll~lll II I III II
I 111 LI I II IllIlL I
III llll~ll I Ill&l II
II I 111111~11 I I 1WHl I
I IlIllYl I I Ill Wll II
I 1 I I 1 I I I I I
-400 0 400 800 1200
Peristimulus Time (ms)
VDT Reward
B
III I I
I I I I
III I I I IIII
-400 0 ’ 400 800 ’ 1200 ’ Peristimulus Time (ms)
VDT Saline
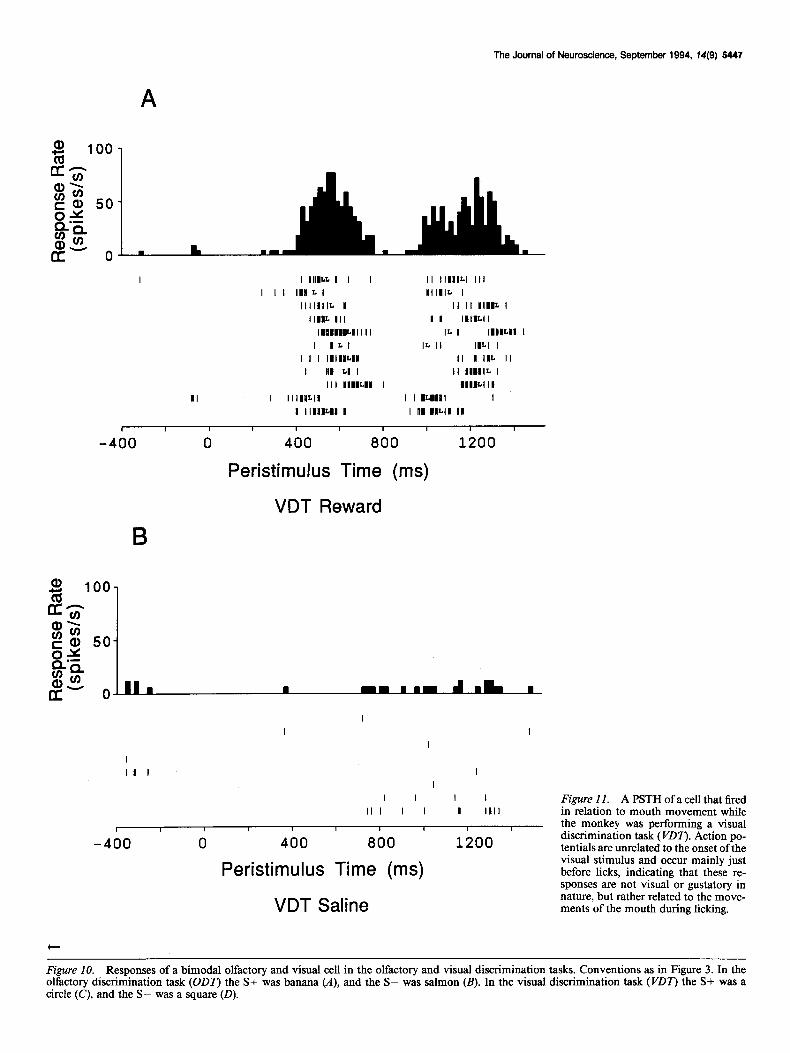
Figure II. A PSTH of a cell that fired in relation to mouth movement while the monkey was performing a visual discrimination task (PDT’). Action po- tentials are unrelated to the onset of the visual stimulus and occur mainly just before licks, indicating that these re- sponses are not visual or gustatory in nature, but rather related to the move- ments of the mouth during licking.
Figure 10. Responses of a bimodal olfactory and visual cell in the olfactory and visual discrimination tasks. Conventions as in Figure 3. In the olfactory discrimination task (ODT) the S+ was banana (A), and the S- was salmon (B). In the visual discrimination task (VDT) the S+ was a circle (C), and the S- was a square (0).
5446 Rolls and Baylis * Multimodal Responses in OFC
rz4 Unimodal Gustatory Neurons 20
1 0 Gustatory-Olfactory Neurons
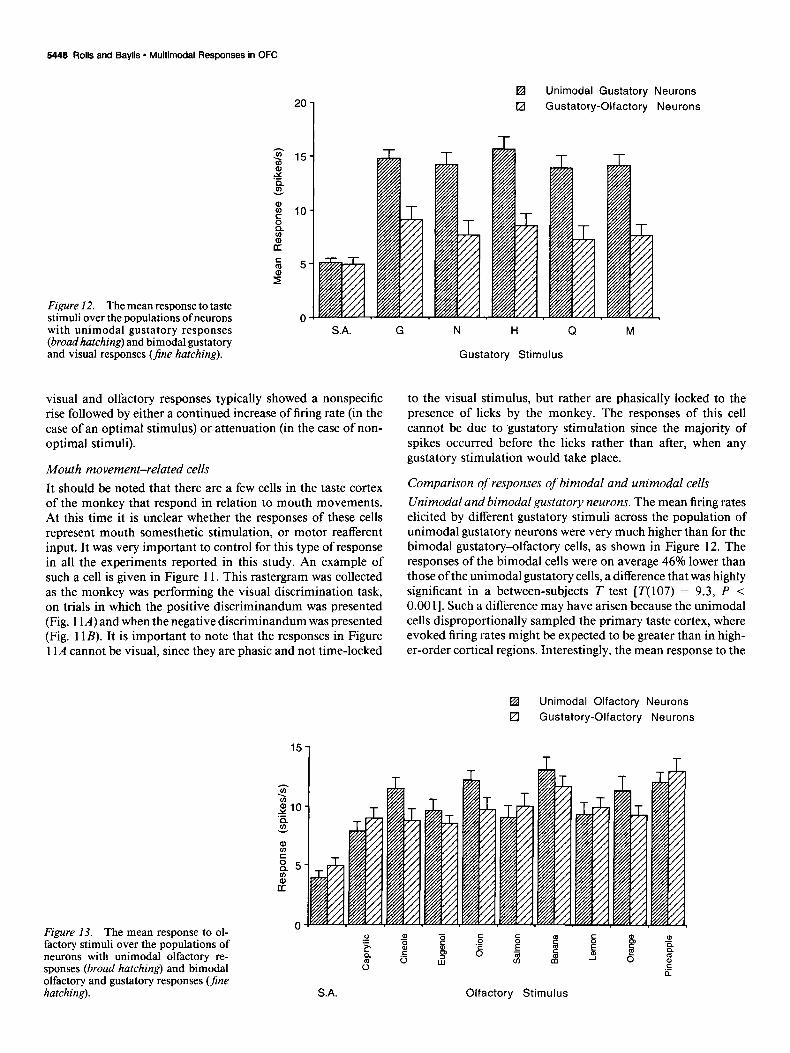
Figure 12. The mean response to taste stimuli over the populations of neurons with unimodal gustatory responses (broad hatching) and bimodal gustatory and visual responses (fine hatching).
S.A. G N H Q M
Gustatory Stimulus
visual and olfactory responses typically showed a nonspecific rise followed by either a continued increase of firing rate (in the case of an optimal stimulus) or attenuation (in the case of non- optimal stimuli).
Mouth movement-related cells
It should be noted that there are a few cells in the taste cortex of the monkey that respond in relation to mouth movements. At this time it is unclear whether the responses of these cells represent mouth somesthetic stimulation, or motor reafferent input. It was very important to control for this type of response in all the experiments reported in this study. An example of such a cell is given in Figure 11. This rastergram was collected as the monkey was performing the visual discrimination task, on trials in which the positive discriminandum was presented (Fig. 11A) and when the negative discriminandum was presented (Fig. 11B). It is important to note that the responses in Figure 11 A cannot be visual, since they are phasic and not time-locked
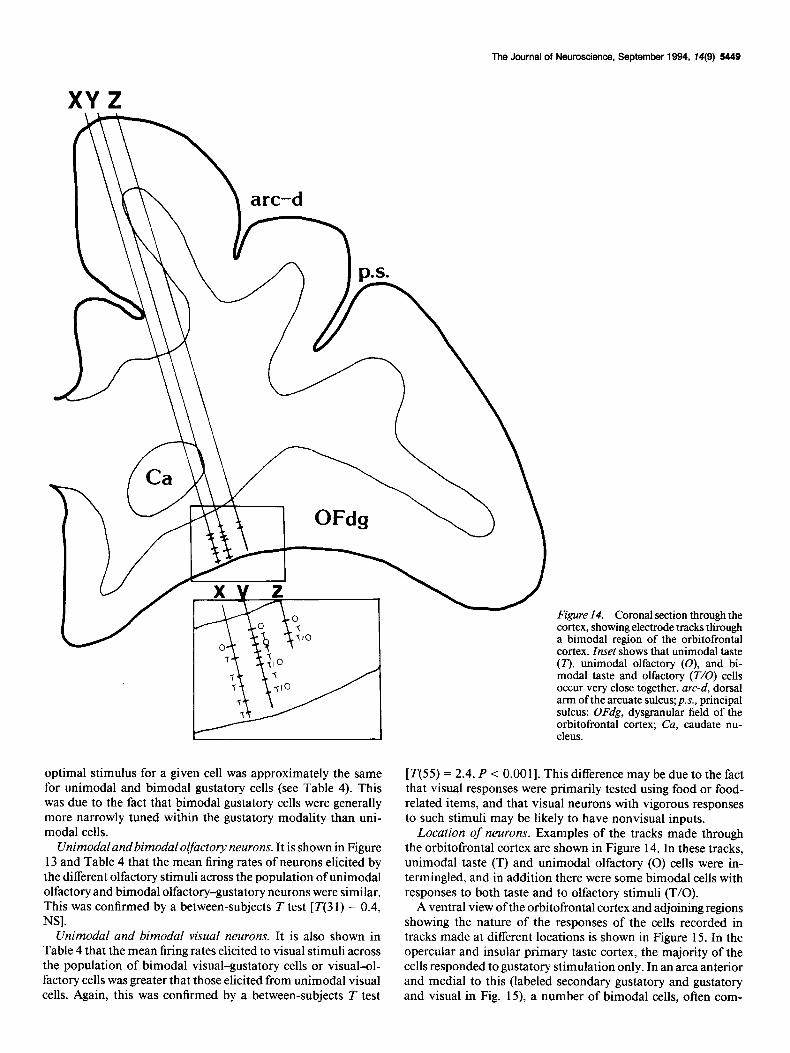
Figure 13. The mean response to ol- factory stimuli over the populations of neurons with unimodal olfactory re- sponses (broad hatching) and bimodal olfactory and gustatory responses (fine hatching).
to the visual stimulus, but rather are phasically locked to the presence of licks by the monkey. The responses of this cell cannot be due to gustatory stimulation since the majority of spikes occurred before the licks rather than after, when any gustatory stimulation would take place.
Comparison of responses of bimodal and unimodal cells
Unimodal and bimodal gustatory neurons. The mean firing rates elicited by different gustatory stimuli across the population of unimodal gustatory neurons were very much higher than for the bimodal gustatory-olfactory cells, as shown in Figure 12. The responses of the bimodal cells were on average 46% lower than those of the unimodal gustatory cells, a difference that was highly significant in a between-subjects T test [T( 107) = 9.3, P < 0.00 I]. Such a difference may have arisen because the unimodal cells disproportionally sampled the primary taste cortex, where evoked firing rates might be expected to be greater than in high- er-order cortical regions. Interestingly, the mean response to the
q Unimodal Olfactory Neurons
El Gustatory-Olfactory Neurons
S.A. Olfactory Stimulus
The Journal of Neuroscience, September 1994, 74(9) 5449
optimal stimulus for a given cell was approximately the same for unimodal and bimodal gustatory cells (see Table 4). This was due to the fact that bimodal gustatory cells were generally more narrowly tuned wiihin the gustatory modality than uni- modal cells.
Unimodal and bimodal olfactory neurons. It is shown in Figure 13 and Table 4 that the mean firing rates of neurons elicited by the different olfactory stimuli across the population of unimodal olfactory and bimodal olfactory-gustatory neurons were similar. This was confirmed by a between-subjects T test [T(3 1) = 0.4, NS].
Unimodal and bimodal visual neurons. It is also shown in Table 4 that the mean firing rates elicited to visual stimuli across the population of bimodal visual-gustatory cells or visual-ol- factory cells was greater that those elicited from unimodal visual cells. Again, this was confirmed by a between-subjects T test
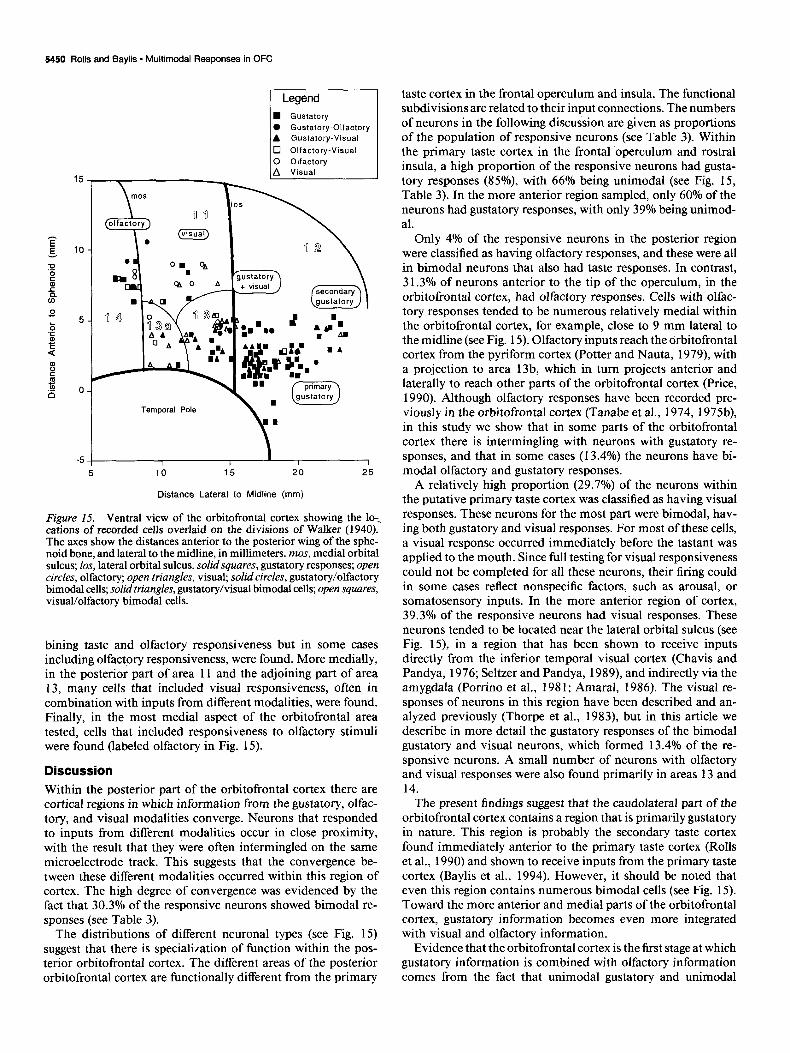
Figure 14. Coronal section through the cortex, showing electrode tracks &ough a bimodal region of the orbitofrontal cortex. Inset shows that unimodal taste (T), unimodal olfactory (O), and bi- modal taste and olfactory (T/O) cells occur very close together. arc-d, dorsal arm of the arcuate sulcus; p.s., principal sulcus; OFdg, dysgranular field of the orbitofrontal cortex; Cu, caudate nu- cleus.
[T(55) = 2.4, P < O.OOl]. This difference may be due to the fact that visual responses were primarily tested using food or food- related items, and that visual neurons with vigorous responses to such stimuli may be likely to have nonvisual inputs.
Location of neurons. Examples of the tracks made through the orbitofrontal cortex are shown in Figure 14. In these tracks, unimodal taste (T) and unimodal olfactory (0) cells were in- termingled, and in addition there were some bimodal cells with responses to both taste and to olfactory stimuli (T/O).
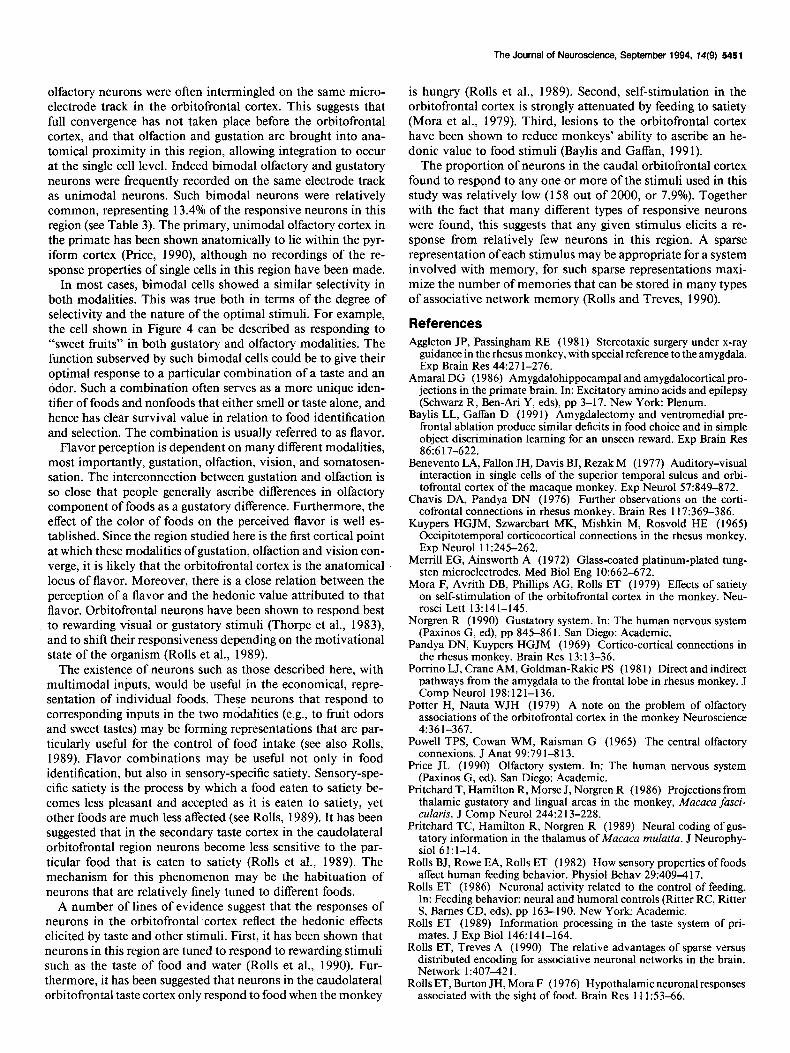
A ventral view of the orbitofrontal cortex and adjoining regions showing the nature of the responses of the cells recorded in tracks made at different locations is shown in Figure 15. In the opercular and insular primary taste cortex, the majority of the cells responded to gustatory stimulation only. In an area anterior and medial to this (labeled secondary gustatory and gustatory and visual in Fig. 15) a number of bimodal cells, often com-
5450 Rolls and Baylis * Multimodal Responses in OFC
Legend
n Gustatory 0 Gustatory-Olfactory l-----l A Gustatory-Visual
0 Olfactory-Visual 0 Olfactory
15 A Visual
5
I I 1 I
10 15 20
Distance Lateral to Midline (mm)
I 25
Figure IS. Ventral view of the orbitofrontal cortex showing the lo-., cations of recorded cells overlaid on the divisions of Walker (1940). The axes show the distances anterior to the posterior wing of the sphe- noid bone, and lateral to the midline, in millimeters. mos, medial orbital sulcus; los, lateral orbital sulcus. solid squares, gustatory responses; open circles, olfactory; open triangles, visual; solid circles, gustatory/olfactory bimodal cells; solid triangles, gustatory/visual bimodal cells; open squares, visual/olfactory bimodal cells.
bining taste and olfactory responsiveness but in some cases including olfactory responsiveness, were found. More medially, in the posterior part of area 11 and the adjoining part of area 13, many cells that included visual responsiveness, often in combination with inputs from different modalities, were found. Finally, in the most medial aspect of the orbitofrontal area tested, cells that included responsiveness to olfactory stimuli were found (labeled olfactory in Fig. 15).
Discussion Within the posterior part of the orbitofrontal cortex there are cortical regions in which information from the gustatory, olfac- tory, and visual modalities converge. Neurons that responded to inputs from different modalities occur in close proximity, with the result that they were often intermingled on the same microelectrode track. This suggests that the convergence be- tween these different modalities occurred within this region of cortex. The high degree of convergence was evidenced by the fact that 30.3% of the responsive neurons showed bimodal re- sponses (see Table 3).
The distributions of different neuronal types (see Fig. 15) suggest that there is specialization of function within the pos- terior orbitofrontal cortex. The different areas of the posterior orbitofrontal cortex are functionally different from the primary
taste cortex in the frontal operculum and insula. The functional subdivisions are related to their input connections. The numbers of neurons in the following discussion are given as proportions of the population of responsive neurons (see Table 3). Within the primary taste cortex in the frontal operculum and rostra1 insula, a high proportion of the responsive neurons had gusta- tory responses (85%) with 66% being unimodal (see Fig. 15, Table 3). In the more anterior region sampled, only 60% of the neurons had gustatory responses, with only 39% being unimod- al.
Only 4% of the responsive neurons in the posterior region were classified as having olfactory responses, and these were all in bimodal neurons that also had taste responses. In contrast, 31.3% of neurons anterior to the tip of the operculum, in the orbitofrontal cortex, had olfactory responses. Cells with olfac- tory responses tended to be numerous relatively medial within the orbitofrontal cortex, for example, close to 9 mm lateral to the midline (see Fig. 15). Olfactory inputs reach the orbitofrontal cortex from the pyriform cortex (Potter and Nauta, 1979), with a projection to area 13b, which in turn projects anterior and laterally to reach other parts of the orbitofrontal cortex (Price, 1990). Although olfactory responses have been recorded pre- viously in the orbitofrontal cortex (Tanabe et al., 1974, 1975b), in this study we show that in some parts of the orbitofrontal cortex there is intermingling with neurons with gustatory re- sponses, and that in some cases (13.4%) the neurons have bi- modal olfactory and gustatory responses.
A relatively high proportion (29.7%) of the neurons within the putative primary taste cortex was classified as having visual responses. These neurons for the most part were bimodal, hav- ing both gustatory and visual responses. For most of these cells, a visual response occurred immediately before the tastant was applied to the mouth. Since full testing for visual responsiveness could not be completed for all these neurons, their firing could in some cases reflect nonspecific factors, such as arousal, or somatosensory inputs. In the more anterior region of cortex, 39.3% of the responsive neurons had visual responses. These neurons tended to be located near the lateral orbital sulcus (see Fig. 15), in a region that has been shown to receive inputs directly from the inferior temporal visual cortex (Chavis and Pandya, 1976; Seltzer and Pandya, 1989), and indirectly via the amygdala (Porrino et al., 1981; Amaral, 1986). The visual re- sponses of neurons in this region have been described and an- alyzed previously (Thorpe et al., 1983), but in this article we describe in more detail the gustatory responses of the bimodal gustatory and visual neurons, which formed 13.4% of the re- sponsive neurons. A small number of neurons with olfactory and visual responses were also found primarily in areas 13 and 14.
The present findings suggest that the caudolateral part of the orbitofrontal cortex contains a region that is primarily gustatory in nature. This region is probably the secondary taste cortex found immediately anterior to the primary taste cortex (Rolls et al., 1990) and shown to receive inputs from the primary taste cortex (Baylis et al., 1994). However, it should be noted that even this region contains numerous bimodal cells (see Fig. 15). Toward the more anterior and medial parts of the orbitofrontal cortex, gustatory information becomes even more integrated with visual and olfactory information.
Evidence that the orbitofrontal cortex is the first stage at which gustatory information is combined with olfactory information comes from the fact that unimodal gustatory and unimodal
The Journal of Neuroscience, September 1994, f4(9) 5451
olfactory neurons were often intermingled on the same micro- electrode track in the orbitofrontal cortex. This suggests that full convergence has not taken place before the orbitofrontal cortex, and that olfaction and gustation are brought into ana- tomical proximity in this region, allowing integration to occur at the single cell level. Indeed bimodal olfactory and gustatory neurons were frequently recorded on the same electrode track as unimodal neurons. Such bimodal neurons were relatively common, representing 13.4% of the responsive neurons in this region (see Table 3). The primary, unimodal olfactory cortex in the primate has been shown anatomically to lie within the pyr- iform cortex (Price, 1990), although no recordings of the re- sponse properties of single cells in this region have been made.
In most cases, bimodal cells showed a similar selectivity in both modalities. This was true both in terms of the degree of selectivity and the nature of the optimal stimuli. For example, the cell shown in Figure 4 can be described as responding to “sweet fruits” in both gustatory and olfactory modalities. The function subserved by such bimodal cells could be to give their optimal response to a particular combination of a taste and an odor. Such a combination often serves as a more unique iden- tifier of foods and nonfoods that either smell or taste alone, and hence has clear survival value in relation to food identification and selection. The combination is usually referred to as flavor.
Flavor perception is dependent on many different modalities, most importantly, gustation, olfaction, vision, and somatosen- sation. The interconnection between gustation and olfaction is so close that people generally ascribe differences in olfactory component of foods as a gustatory difference. Furthermore, the effect of the color of foods on the perceived flavor is well es- tablished. Since the region studied here is the first cortical point at which these modalities of gustation, olfaction and vision con- verge, it is likely that the orbitofrontal cortex is the anatomical locus of flavor. Moreover, there is a close relation between the perception of a flavor and the hedonic value attributed to that flavor. Orbitofrontal neurons have been shown to respond best to rewarding visual or gustatory stimuli (Thorpe et al., 1983) and to shift their responsiveness depending on the motivational state of the organism (Rolls et al., 1989).
The existence of neurons such as those described here, with multimodal inputs, would be useful in the economical, repre- sentation of individual foods. These neurons that respond to corresponding inputs in the two modalities (e.g., to fruit odors and sweet tastes) may be forming representations that are par- ticularly useful for the control of food intake (see also Rolls, 1989). Flavor combinations may be useful not only in food identification, but also in sensory-specific satiety. Sensory-spe- cific satiety is the process by which a food eaten to satiety be- comes less pleasant and accepted as it is eaten to satiety, yet other foods are much less affected (see Rolls, 1989). It has been suggested that in the secondary taste cortex in the caudolateral orbitofrontal region neurons become less sensitive to the par- ticular food that is eaten to satiety (Rolls et al., 1989). The mechanism for this phenomenon may be the habituation of neurons that are relatively finely tuned to different foods.
A number of lines of evidence suggest that the responses of neurons in the orbitofrontal cortex reflect the hedonic effects elicited by taste and other stimuli. First, it has been shown that neurons in this region are tuned to respond to rewarding stimuli such as the taste of food and water (Rolls et al., 1990). Fur- thermore, it has been suggested that neurons in the caudolateral orbitofrontal taste cortex only respond to food when the monkey
is hungry (Rolls et al., 1989). Second, self-stimulation in the orbitofrontal cortex is strongly attenuated by feeding to satiety (Mora et al., 1979). Third, lesions to the orbitofrontal cortex have been shown to reduce monkeys’ ability to ascribe an he- donic value to food stimuli (Baylis and Gaffan, 199 1).
The proportion of neurons in the caudal orbitofrontal cortex found to respond to any one or more of the stimuli used in this study was relatively low (158 out of 2000, or 7.9%). Together with the fact that many different types of responsive neurons were found, this suggests that any given stimulus elicits a re- sponse from relatively few neurons in this region. A sparse representation of each stimulus may be appropriate for a system involved with memory, for such sparse representations maxi- mize the number of memories that can be stored in many types of associative network memory (Rolls and Treves, 1990).
References Aggleton JP, Passingham RE (1981) Stereotaxic surgery under x-ray
guidance in the rhesus monkey, with special reference to the amygdala. Exp Brain Res 44127 l-276.
Amaral DG (1986) Amygdalohippocampal and amygdalocortical pro- jections in the primate brain. In: Excitatory amino acids and epilepsy (Schwarz R, Ben-Ari Y, eds), pp 3-17. New York: Plenum.
Baylis LL, Gaffan D (199 1) Amygdalectomy and ventromedial pre- frontal ablation produce similar deficits in food choice and in simple object discrimination learning for an unseen reward. Exp Brain Res 86:617-622.
Benevento LA, Fallon JH, Davis BJ, Rezak M (1977) Auditory-visual interaction in single cells of the superior temporal sulcus and orbi- tofrontal cortex of the macaque monkey. ExpNeurol 57:849-872.
Chavis DA. Pandva DN (1976) Further observations on the corti- cofrontal connections in rhesus monkey. Brain Res 117:369-386.
Kuypers HGJM, Szwarcbart MK, Mishkin M, Rosvold HE (1965) Occipitotemporal corticocortical connections in the rhesus monkey. Exp Neurol 11:245-262.
Merrill EG, Ainsworth A (1972) Glass-coated platinum-plated tung- sten microelectrodes. Med Biol Eng 10:662-672.
Mora F, Avrith DB, Phillips AG, Rolls ET (1979) Effects of satiety on self-stimulation of the orbitofrontal cortex in the monkey. Neu- rosci Lett 13:141-145.
Norgren R (1990) Gustatory system. In: The human nervous system (Paxinos G, ed), pp 845-86 1. San Diego: Academic.
Pandya DN, Kuypers HGJM (1969) Cortico-cortical connections in the rhesus monkey. Brain Res 13: 13-36.
Porrino LJ, Crane AM, Goldman-Rakic PS (198 1) Direct and indirect pathways from the amygdala to the frontal lobe in rhesus monkey. J Comp Neurol 198:121-136.
Potter H, Nauta WJH (1979) A note on the problem of olfactory associations of the orbitofrontal cortex in the monkey Neuroscience 4:361-367.
Powell TPS, Cowan WM, Raisman G (1965) The central olfactory connexions. J Anat 99~79 l-8 13.
Price JL (1990) Olfactory system. In: The human nervous system (Paxinos G, ed). San Diego: Academic.
Pritchard T, Hamilton R, Morse J, Norgren R (1986) Projections from thalamic gustatory and lingual areas in the monkey, Mucaca fusci- dark J Comp Neurol 244:2 13-228.
Pritchard TC, Hamilton R, Norgren R (1989) Neural coding of gus- tatory information in the thalamus of Mucacu mulatta. J Neurophy- siol 61:1-14.
Rolls BJ, Rowe EA, Rolls ET (1982) How sensory properties of foods affect human feeding behavior. Physiol Behav 29:409-117.
Rolls ET (1986) Neuronal activity related to the control of feeding. In: Feeding behavior: neural and humoral controls (Ritter RC, Ritter S, Barnes CD, eds), pp 163-190. New York Academic.
Rolls ET (1989) Information processing in the taste system of pri- mates. J Exp Biol 146:141-164.
Rolls ET, Treves A (1990) The relative advantages of sparse versus distributed encoding for associative neuronal networks in the brain. Network 1:407-42 1.
Rolls ET, Burton JH, Mora F (1976) Hypothalamic neuronal responses associated with the sight of food. Brain Res 111:53-66.
5452 Rolls and Baylis - Multimodal Responses in OFC
Rolls ET, Burton MJ, Mora F (1980) Neurophysiological analysis of brain-stimulation reward in the monkey. Brain Res 194:339-357.
Rolls ET, Sienkiewicz ZJ, Yaxley S (1989) Hunger modulates the responses to gustatory stimuli of single neurons in the caudolateral orbitofrontal cortex of the macaque monkey. Eur J Neurosci 1:53- 60.
Rolls ET, Yaxley S, Sienkiewicz ZJ (1990) Gustatory responses of single neurons in the orbitofrontal cortex of the macaque monkey. J Neurophysiol64:1055-1066.
Scott TR, Yaxley S, Sienkiewicz ZJ, Rolls ET (1986a) Gustatory re- sponses in the nucleus tractus solitarius of the alert cynomolgus mon- key. J Neurophysiol 55: 182-200.
Scott TR, Yaxley S, Sienkiewicz ZJ, Rolls ET (1986b) Gustatory re- sponses in the frontal opercular cortex of the alert cynomolgus mon- key. J Neurophysiol 56876-890.
Seltzer B, Pandya DN (1989) Frontal lobe connections of the superior temporal sulcus in the rhesus monkey. J Comp Nemo1 28 1:97-l 13.
Smith DV, Travers JB (1979) A metric for the breadth of tuning of gustatory neurons. Chem Senses Flavor 4:215-229.
Takagi SF (1979) Dual systems for sensory olfactory processing in higher primates: Trends Neurosci 2:3 13-3 15.
Tanabe T. Iino M. Ooshima Y. Takaai SF (1974) An olfactorv area in the prefrontal lobe. Brain Res 807127-l 30. ’
Tanabe T, Iino M, Ooshima Y, Takagi SF (1975a) Neurophysiological studies on the prefrontal olfactory center in the monkey. In: Olfaction and taste V (Denton DG, Coghlan JP, eds), pp 309-3 12. New York: Academic.
Tanabe T, Yarita H, Iino M, Ooshima Y, Takagi SF (1975b) An olfactory projection area in orbitofrontal cortex of the monkey. J Neurophysiol 38:1269-1283.
Tanabe T, Iino M, Takagi SF (1975~) Discrimination of odors in the olfactory bulb, pyriform-amygdaloid areas, and orbitofrontal cortex of the monkey. J Neurophvsiol38: 1284-1296.
Thorpe SJ, Rolls ET, Maddison S (1983) Neuronal activity in the orbitofrontal cortex of the behaving monkey. Exp Brain Res 49:93- 115.
Walker A E (1940) A cytoarchitectural study of the prefrontal area of the macaque monkey.J Comp Neurol73:59-86.
Wiaains LL. Rolls ET. Bavlis GC (1987) Afferent connections of the - , , - ~ I
caudolateral orbitofrontal cortex taste area of the primate. Sot Neu- rosci Abstr 13: 1406.
Wilkinson L (1990) Systat: the system for statistics. Evanston, IL: Systat.
Woodward RH, Goldsmith PL (1964) ICI monograph 3, Cumulative sum techniques: mathematical and statistical techniques for industry. Edinburgh: Oliver and Boyd.
Yarita H, Iino M, Tanabe T, Kogure S, Takagi SF (1980) A tran- sthalamic olfactory pathway to orbitofrontal cortex in the monkey. J Neurophysiol43:69-85.
Yaxley S, Rolls ET, Sienkiewicz ZJ (1990) Gustatory responses of single neurons in the insula of the macaque monkey. J Neurophysiol 63:689-700.