Embed Size (px)
Citation preview

Guns and Butter? Fighting Violence with the Promiseof Development ∗
Gaurav Khanna1 and Laura Zimmermann2
1University of Michigan2University of Georgia
September 2014
Abstract
There is a growing awareness that government programs may be important in thefight against internal conflict, but existing papers find support for a variety of effects andpotential explanations. Using a regression-discontinuity design, we analyze the impactof one of the world’s largest anti-poverty programs, the Indian employment guaranteescheme NREGS, on the intensity of Maoist conflict, the biggest internal security threatto the country. Our results show that insurgency-related violence increases in the firstyear after the introduction of NREGS, with the effect being concentrated in the veryshort run. Insurgents are the most affected group, and police-initiated attacks andattacks by insurgents on civilians both increase. We discuss how these results andadditional tests relate to a number of established theories in the literature. Whilewe cannot rule out all alternative explanations, one mechanism consistent with theempirical results is that NREGS induces civilians to share more information with thestate, making police action more effective.
JEL: H12, H53, H56, I38
Keywords: public works program, National Rural Employment Guarantee Scheme,NREGA, NREGS, India, regression discontinuity design, terrorism, Naxalites, Maoists,conflict, insurgency, civil war
∗Corresponding author: Laura Zimmermann. Brooks Hall, 310 Herty Drive, Athens, GA 30602. email:[email protected]. We thank Achyuta Adhvaryu, Manuela Angelucci, Raj Arunachalam, Prashant Bharad-waj, Adi Dasgupta, James Fenske, Kishore Gawande, Devesh Kapur, Julien Labonne, Jacob Shapiro, JeffreySmith, Oliver Vanden Eynde, Dean Yang and participants at the Pacific Conference for Development Eco-nomics 2013, the Centre for Studies of African Economies Conference 2013, the Workshop on India’s MaoistInsurgency at Princeton University, and the University of Michigan Development Seminar for valuable com-ments, feedback and suggestions. We also thank Melissa Trebil for excellent research assistantship.

1 Introduction
Internal military conflicts between government troops and insurgents are common in many
developing countries.1 Governments have traditionally relied very heavily on military force,
but there is a growing awareness that this alone may not be enough to end violence since
insurgents often rely on the loyalty of the local population in their guerrilla tactics and
recruit members from economically marginalized groups. In such situations, government
anti-poverty programs that target conflict areas are increasingly seen as a potential tool for
reducing conflict intensity by raising the opportunity cost of being an insurgent and improving
the willingness of civilians to support the government.2 At the same time, however, such
programs may increase violence, for example if the resources flowing into conflict areas make
territorial control of these locations more attractive for insurgents.3
What effect government programs have on internal conflict intensity is therefore an em-
pirical question, and understanding the underlying mechanisms is essential for identifying
the appropriate set of interventions. Across a number of different countries and types of
programs, recent papers find both positive and negative impacts of government programs on
internal conflicts that are typically consistent with more than one explanation.4 Given this
heterogeneity, a deeper understanding of how government programs of different types and
across different contexts affect internal violence is of high policy relevance.
In this paper, we analyze the impact of the world’s largest public-works program, the
Indian National Rural Employment Guarantee Scheme (NREGS), on the incidence of Maoist
violence in the country, which the Indian Prime Minister referred to as the “single biggest
internal security threat”.5 NREGS is based on a legal guarantee of 100 days of public-sector
1Over 20% of countries experienced internal violence over the course of the 1990s (Blattman and Miguel2010). Cross-country data also shows a high correlation between poverty and conflict (see e.g. Collierand Hoeffler 2007). Miguel et al. (2004) and Miguel and Satyanath (2011) find that economic growth,instrumented by rainfall shocks, has a negative impact on conflicts. For recent microeconomic studies on therelationship between development and conflict, see e.g. Do and Iyer (2007), Murshed and Gates (2005), andHumphreys and Weinstein (2008).
2See e.g. Grossman (1991) for an opportunity cost model and Berman, Shapiro and Felter (2011) for amodel of civilian support in the context of street gangs.
3See e.g. Hirshleifer (1989), Grossman (1991), Skaperdas (1992).4See e.g. Berman, Shapiro and Felter 2011, Berman et al. 2011, Nunn and Qian 2012, Crost, Felter and
Johnston 2012, Dube and Vargas 20135Hindustan Times, April 13 2006: Naxalism biggest threat: PM
1
employment to all rural households (about 70 percent of the population) willing to work at
the minimum wage, and annual expenditures on the scheme amount to around one percent
of Indian GDP. While the program’s main goal is to generate labor market opportunities,
one of the expectations of the government was to reduce incidents of Maoist-related violence.
Based on the existing theoretical and empirical literature, it is unclear how NREGS should
be expected to affect insurgency-related violence. NREGS operates on a much larger scale
than the programs analyzed in the existing within-country analyses and large implementation
problems especially in the initial stages seem to have severely limited the monetary benefits
for the poor.6 Furthermore, as a public-works program, the employment guarantee scheme is
a different type of government intervention than the ones analyzed in the literature. These
differences in context, delivery mechanism, and scale may have important consequences for
the relevance of various mechanisms.7
Our empirical estimation strategy relies on the fact that NREGS was rolled out non-
randomly in three implementation phases, with poor districts being treated earlier. The
government used an algorithm to assign districts to phases which generates state-specific
treatment discontinuities and allows the use of a regression discontinuity design to analyze
the empirical impact of the program. The results show that for districts that received the
program, treatment at the cutoff leads to about 914 more fatalities in about 368 more inci-
dents over the following year. We find that more attacks are initiated by the police, and that
the insurgents are the most affected group, whereas there is little impact on police casualties.
There is also some evidence of an increase in the number of attacks by insurgents on civilians.
Most of these impacts are concentrated in the short run, and the results are robust across a
number of different specifications.
We discuss the empirical predictions of the most prominent theories in the existing liter-
ature and how consistent they are with the empirical results and qualitative evidence. While
a public-works program like NREGS may be seen as a combination of an employment inter-
6See e.g. Dutta et al. (2012) and Niehaus and Sukhtankar (2013) for implementation issues with NREGS.7Berman et al. (2013), for example, show that development programs that are smaller, implemented in
a more secure environment and with the help of experts seem to be more successful at reducing violence inIraq than other programs.
2

vention and an infrastructure program, the program in practice hardly seems to create any
assets or destroyable infrastructure (Ministry of Rural Development 2010). This means that
NREGS does not provide many appropriable assets that would be attractive to gain control
over and limits the opportunities for the insurgents to sabotage the scheme. While the public-
works scheme also suffers from implementation problems in terms of employment generation,
the actual and especially the expected future benefits from the scheme may therefore play
the larger role in explaining the empirical patterns.8
Overall, our paper contributes to our understanding of the impact of government programs
on insurgency-related violence in a number of ways. First, the empirical findings suggest
that NREGS led to an increase in violence in the first year of implementation, with the effect
being driven by the first few months. This means that dynamic patterns may be important,
which so far have been largely ignored in the literature, but which may be very important
if short-run and longer run impacts are very different. Second, we find little evidence of a
dominant role for opportunity costs or insurgent sabotage in explaining the program effects.
The results are consistent with a citizen-support explanation in which the introduction of
NREGS makes civilians more likely to assist the state in the fight against insurgents, but
we cannot fully rule out some alternative explanations like an increase in the spotlight on
treatment districts. Third, while most of the existing literature focuses on programs that
are implemented quite well, the Indian context provides the often more realistic case of a
government initiative that at least initially faced severe implementation issues. Our results
paired with other evidence from the literature suggest that the promise of development in the
form of anticipated program benefits may already have important consequences for conflict
intensity. Fourth, in contrast to most of the existing literature that focuses on infrastructure
programs and food-aid schemes, NREGS is mainly a job-creation program. Based on our
results, the impacts of a public-works program on violence are more similar to infrastructure
programs (Crost, Felter and Johnston 2014) and food-aid schemes (Nunn and Qian 2012)
than US-implemented reconstruction programs (Berman, Shapiro and Felter 2011) at least
in the short run, albeit for plausibly different reasons. Fifth, the program in question is much
8See e.g. Dutta et al. (2012) and Niehaus and Sukhtankar (2013) for implementation issues with NREGS.
3

larger in scale than the other studied programs and the conflict has been the major internal
security threat for one of the world’s largest countries since the late 1960s.
The remainder of this paper is structured as follows: Section 2 discusses potential hy-
potheses regarding the impact of NREGS on violence. Section 3 provides some background
on the Maoist movement and NREGS, whereas section 4 describes the empirical strategy
and the data. Section 5 presents the main results as well as some extensions and robustness
checks, and section 6 concludes.
2 Theories about the Impact of Government Programs
on Violence
There are a number of existing theories in the broader literature on the relationship between
development and conflict that are relevant in the context of the impact of government pro-
grams on violence. Two prevalent theories in the literature predict a fall in the incidence
of conflict.9 The first theory is an opportunity-cost story: If the program provides jobs
and other welfare benefits from participation in the scheme, the program will increase the
opportunity cost of being a Maoist. Naxalite supporters should therefore drop out of the
organization to take advantage of these improved economic opportunities, and rebels should
find it harder to recruit new soldiers, both of which decrease the strength of the insurgents
and their ability to inflict violence (see e.g. Grossman 1991 for such a model). We would
then expect to see a fall in the number of insurgents, which may lead to a decrease in the
amount of overall violence.10 All of this assumes that NREGS actually generates economic
9An additional theory considers the problem of credible commitment: In a situation where the governmenthas been unable to credibly commit to economic development and in which insurgents fight for better economicconditions, a program like NREGS may solve this problem and ‘complete the contract’ (Powell 2006) betweenrebels and the government. The introduction of NREGS gives insurgents fewer reasons to continue theirstruggle since NREGS may be costly to dismantle because the right to the program is laid down in a law, andviolence should fall. There may be asymmetric information about the dismantling costs of NREGS, however,and the rebels may expect the government to renege on the promise (Dal Bo and Powell 2007).
10This idea is also closely related to work on economic inequality and group formation in the conflictliterature. Grossman (1999) argues, for example, that incentives such as wages, opportunities to loot andprotection from danger are often used to motivate participation. In this view, economic inequality may leadto conflict because there is more to gain from victory (Fearon 2007).
4

benefits.
The second theory that predicts a fall in violence after the introduction of NREGS is
a citizen-support or ‘hearts and minds’ explanation. The idea is that the introduction of a
government program like NREGS may improve the relationship of the state and its citizens by
making the government’s commitment to economic development more credible.11 This may
make civilians more willing to share information with the police, which should improve police
effectiveness in tracking down insurgents, and will therefore lead to a decrease in violence as
the insurgents are starting to lose the fight (see e.g. Berman, Shapiro and Felter 2011 for a
model on counterinsurgency in Iraq and the Akerlof and Yellen 1994 study on street-gangs).
We should also expect insurgents to be the most heavily affected group.
In contrast to these two theories, one of the most widespread theories in the literature sug-
gests, however, that we should expect violence to increase after the introduction of NREGS.
This theory focuses on the idea of competition for resources (see e.g. Hirshleifer 1989, Gross-
man 1991, Skaperdas 1992): If NREGS increases the wealth of a region, this creates a larger
resource pie that is worth fighting over. Contest models that focus on this channel usually
predict that when resources rise in a region in equilibrium more effort will be put into fighting
rather than production. Again, this presupposes that NREGS generates resources that can
be appropriated through violence. We would also expect both rebel attacks against police
forces and police-initiated attacks against the insurgents to increase over time as more assets
are created, but there is little reason to expect an increase in violence against civilians.
A second potential mechanism for an increase in violence is another version of the citizen-
support channel, which is based on the idea that increased citizen support may well lead to
an initial increase in violence through more police attacks and potential retaliatory attacks
by insurgents on civilians before violence decreases in the longer run.12 In the appendix,
we develop such a model of citizen support that takes into account potential dynamic pat-
terns. The model sets up a two-stage game between three players - the government, the
11In general, citizen support for conflict parties can take many different forms. See e.g. Petersen (2001) foran argument about how unorganized government opposition evolved into more organized rebellion in EasternEuropean countries in the late 1980s.
12See e.g. Kalyvas (2006) for a comparative study of guerrilla wars in the political science literature thatargues that conflict parties prefer using selective violence against informers and defectors.
5

insurgents and the civilians. Unlike similar models in the literature (Berman, Shapiro and
Felter 2011), the insurgents try to acquire territorial control rather than just imposing costs
on the government, and can affect the probability of control by increasing the number of
attacks against the police. Civilians choose how much information to share with the police,
whereas the police and rebels choose the amount of military action to take. In equilibrium,
the model predicts that the introduction of a government program will lead to an increase
in the support and information provided by the civilians to the police. This leads to an
increase in violence, with the higher violence levels being driven by police-initiated attacks
and retaliatory attacks by the insurgents against civilians. Violence levels should be high in
the short run, but should fall over time as the government starts winning the conflict due to
better information.
A variant of this channel is the idea that violence may increase after program introduction
because insurgents try to sabotage the program to prevent the government from winning
over civilians. Crost, Felter and Johnston (2014) find such an effect in the context of an
infrastructure program in the Philippines, but unlike them we find no evidence of Maoists
directly attacking NREGS work-sites.
Another mechanism that would predict an increase in violence is that NREGS may put a
spotlight on treatment areas, encouraging the police to increase their efforts of cracking down
on crime in these regions because of external pressures for the program to be seen as running
smoothly. As NREGS is a big program that has garnered a lot of attention in the media, this
could incentivize the state and district leaders to put pressure on the police to work harder
than before to ensure a good image of their districts in the press, for example. This increased
police effort would imply the same pattern as the citizen-support channel, with an increase
in violence and especially of police-initiated attacks. The spotlight theory should encourage
the police to crack down on other forms of crime and violence as well to make the security
situation in their district look good, however. Moreover, under the citizen-support channel
insurgents have a reason to retaliate against civilians, whereas there is no such motive under
the spotlight theory.
6

While most of these different theories about the impact of government programs on inter-
nal violence can be disentangled by focusing on the implied patterns of changes in violence
and of the most heavily affected groups, available qualitative and quantitative evidence on
the nature of the Maoist conflict in India and the working of the employment guarantee
scheme also provides useful information on the attractiveness of the various mechanisms in
the Indian context.
3 Background
3.1 The Naxalite Movement
According to the Government of India, the Naxalite movement is one of India’s most severe
threats to national security. In 2006, Prime Minister Manmohan Singh famously referred to it
as “the single biggest internal security challenge ever faced by our country”.13 Members of the
movement are typically called Naxalites or Maoists, although official government documents
often refer to affected districts as Left-Wing Extremism (LWE) districts.14
Naxalites have been operating since 1967 when landlords attacked a tribal villager in
the village of Naxalbari in West Bengal and triggered an uprising. By the early 1970s, the
movement had spread to Andhra Pradesh, Bihar and Orissa but splintered into more than 40
groups. In 2004, the two biggest previously competing Naxalite groups joined hands to form
the Communist Party of India (Maoist). This is believed to have substantially exacerbated
India’s problem with the Naxalites and to have driven the recent growth in violence (Lalwani
2011). The Indian Home Ministry believed the movement to have around 15000 members in
2006, to control about one fifth of India’s forests, and to be active in 160 districts (Ministry
of Home Affairs 2006). Figure 1 shows all the districts that experienced at least one Maoist
incident between January 2005 and March 2008, the period studied in this paper, in black,
13Hindustan Times, April 13, 2006: Naxalism biggest threat: PM14There is some debate in the literature about the correct way of addressing the insurgents. Mukherji
(2012) argues, for example, that the insurgents should be referred to as Maoists rather than Naxalites sincethe organizations that grew out of the original Naxalite movement of the 1960s mostly reject the actions ofthe Communist Party of India (Maoist) (CPI(M)) that is largely responsible for the violence in recent years.A number of Naxalite organizations even refer to the CPI(M) as terrorists.
7

dark gray and light gray. As can be seen, Naxalite-affected districts are concentrated in the
eastern parts of India. These areas are often referred to as the Red Corridor.
The Naxalites’ main goal is to overthrow the Indian state and to create a liberated zone
in central India, since they believe that the Indian government neglects the lower classes
of society and exclusively caters to the elites. The Indian government has been fighting
the Maoists since the 1960s, but decades of using force have been largely unsuccessful in
suppressing the movement. While India officially subscribes to a population-centric approach
to counterinsurgency, which relies on a mixture of force and winning the support of the
local population by taking care of their grievances, a number of researchers note that India
traditionally relies almost exclusively on military strength to fight the Naxalites (see e.g.
Banerjee and Saha 2010, Lalwani 2011). The main responsibility in this fight rests with
the civil and paramilitary forces of the state police in the affected areas, although they are
often supported by central paramilitary battalions.15 Many observers also refer to the often
widespread disregard for local perceptions, however, as well as the sometimes excessively
brutal nature of police force behavior that affects many civilians. These destroy not only the
trust of the local population in the Indian state but also the opportunity for police forces to
take advantage of information on insurgents and other forms of assistance provided by the
people (Bakshi 2009, Lalwani 2011, Sundar 2011).
Both Maoists and security forces believe that civilians have a lot of information on the
insurgents, so pressures on the local tribal population (also called adivasis) to pick a side and
cooperate with one of the conflict parties is high. The Naxalites’ continued survival depends
on help from civilians who hide them and provide them with resources and information.
Maoist insurgents often warn the local population not to provide shelter or information to
police forces, for example, and instead ask them to keep track of government personnel and
their actions.16 The government, on the other hand, often also does not seem to regard
15While some states have been more successful at suppressing violence than others, the central governmentgenerally blames the overall failure to contain the Naxalites on inadequate training and equipment, as wellas on poor coordination between police forces of different states.
16There is some evidence that insurgents in turn provide civilians with some help, for example in the formof teaching them more effective farming techniques (Mukherji 2012). Naxalites also claim to protect civiliansfrom exploitation by large mining conglomerates (Borooah 2007).
8

civilians as neutral, and some experts claim that an important percentage of incarcerated
adivasis are in jail due to false accusations of being Maoist supporters (Mukherji 2012).
In addition to these pressures, adivasis also face economic incentives to join the conflict:
Their knowledge of local conditions in the often remote forest areas is very valuable for
both insurgents and government troops. In areas of chronic underdevelopment with few
employment opportunities, working for one of the conflict parties therefore allows the poor
to earn some income (Mukherji 2012).17
In consequence, many adivasis are involved in the conflict as tacit supporters, informants
and recruited fighters on both sides, and switching sides once conditions change is not un-
common.18 Economic opportunities or changes in the perception of which side has the upper
hand seem to affect behavior: Maoists who surrender to the police and provide information
on their organization receive a monthly stipend and other financial assistance to start a new
life, for example.19 Vanden Eynde (2011) also shows that Naxalite violence against civilians
increases after negative rainfall shocks, which is consistent with his theoretical model in which
Maoists try to prevent the local population from being recruited as government informants
during bad economic times. A number of instances where Maoists left leaflets after killing
civilians, in which they accused the victims of being police informers, are also in line with
the idea that Maoists retaliate against civilians believed to support the government.20
The fight against the Maoists is inextricably related to the political sphere, with the
state and central governments using their political and military influence to intensify the
crackdown. With a change of guard at the Ministry of Home Affairs, “Operation Greenhunt”
was launched in 2009 supported by state forces as an “all-out offensive” against the rebels.21
At around the same time, political parties in West Bengal accused each other of allying with
17Many low-rank Maoists directly involved in encounters with security personnel as well as an importantportion of the police force consist of young tribals, for example.
18See e.g. Mukherji (2012)19See http://www.satp.org/satporgtp/countries/india/maoist/documents/papers/naxalsurrender1009.htm
for the government guidelines on surrendered Maoists.20See e.g. www.satp.org for the following press releases from 2007: “Cadres of the CPI-Maoist shot dead a
45-year-old shopkeeper at Sringeri in the Chikmagalur District, suspecting him to be a Police informer...Beforefleeing, they left behind pamphlets with a message that read: ‘Let us expose informers and teach them a befittinglesson.’” “Two brothers were killed at Tamba village by the CPI-Maoist cadres on suspicion of being Policeinformers... More than 20 Police informers have reportedly been killed in the last one year in Jharkhand.”
21Sethi, Aman (6 February 2013). “Green Hunt: the anatomy of an operation”. The Hindu
9

Maoists during the state elections.22 Of the many instances of government and political
parties involved in the crackdown, one of the most controversial has been the formation of a
civilian militia called the Salwa Judum by the Chhattisgarh state government in 2005. The
group was led by the elected Leader of the Opposition and whole-heartedly supported by
the party in power (Mukherji 2012). Civilians and tribals were armed and encouraged to
participate since they were thought to have better information. In 2011, the Supreme Court
disbanded the group on the grounds that it was unconstitutional. For civilians, all of these
instances mean that it may often be difficult to clearly distinguish between police actions
and broader strategies by the state.
In light of this complex situation, the view that military force alone may not be effective
in solving the Naxalite problem in the long run seems to have grown in recent years: In
2007, for example, Prime Minister Manmohan Singh said ‘Development and internal security
are two sides of the same coin. Each is critically dependent on the other.’23 He also noted
that many Maoist recruits come from economically deprived and marginalized groups of
society. The central government has therefore shown a growing interest in increasing economic
development in underdeveloped areas of the country through anti-poverty programs, in the
hope that an improvement in the local population’s situation would lead to a reduction in
Naxalite violence (Ramana 2011). NREGS is by far the most ambitious and largest anti-
poverty program introduced by the Indian government, and some case studies suggest that
the program may have indeed helped reduce violence in certain areas.24
This change in conflict intensity also seems to hold more generally: Maoists have been
losing ground in a number of Indian states. They are now mostly non-existent in Andhra
Pradesh and have lost influence in Bihar and even their stronghold states Jharkhand and
Chhattisgarh. The Maoists seem to be forced to move out of many traditional areas of
Maoist control and to retreat into the Dandakaranya forest area where their headquarters
are assumed to be (Mukherji 2012).
Improved access to information seems to have played an important role in this devel-
22South Asian Terrorism Portal - www.satp.org/satporgtp/countries/india/maoist/Assessment/2013/westbengal.html23The Indian Express, December 20, 2007: Divide, uneven growth pose threat to our security: PM24See oneworld.net (2011) for a case study of Balaghat in Madhya Pradesh.
10

opment: The Indian Home Secretary Gopal K. Pillai said in 2010, for example, that the
intelligence gathering system of the police has improved over the last couple of years, making
police forces more successful at catching Maoists.25 These developments are also recognized
by the insurgents, who are accusing the government of turning the local population into
police informers and of using surrendered Maoists as sources of information.26
3.2 NREGS
The National Rural Employment Guarantee Scheme (NREGS) is often referred to as the
largest government anti-poverty program in the world.27 The scheme provides an employment
guarantee of 100 days of manual public-sector work per year at the minimum wage to all
rural households. The legal right to this employment is laid down in the National Rural
Employment Guarantee Act (NREGA) that was passed in the Indian Parliament in August
2005. Under the scheme, all households can apply for work at any time of the year as long as
they live in rural areas and their members are prepared to do manual work at the minimum
wage.28
NREGS was rolled out non-randomly in accordance with a poverty ranking across the
country in three phases: 200 districts received the scheme in February 2006 (Phase 1), whereas
130 districts started implementation in April 2007 (Phase 2). Since April 2008, the scheme
operates in all rural districts in India (Ministry of Rural Development 2010).29
25Summary of a lecture given by Gopal K. Pillai on March 10, 2010, which is available at:http://www.idsa.in/event/EPLS/Left-WingExtremisminIndia
26According to a press report from 2007, for example: “The CPI-Maoist reportedly issued a press release atChintapalli village in the Visakhapatnam District, blaming the Police for turning the Girijans (local tribals)into informers by spending huge amounts of money... (and) that surrendered Maoists are helping the Police,were not leading a normal life and were always with the Police who provided them with all luxuries and usedthem in combing operations...”
27The program was renamed to Mahatma Gandhi National Rural Employment Guarantee Scheme (MGN-REGS) in 2009, but the abbreviations NREGS and NREGA (for the Act on which it is based) have stuck inthe academic literature on this topic.
28Wages are to be paid within 15 days after the work was performed, otherwise the worker is eligible foran unemployment allowance. For more details on the scheme see e.g. Dey et al. (2006), Government ofIndia (2009), and Ministry of Rural Development (2010). While the minimum wage is state-specific, NREGAspecifies a floor minimum wage which was Rs. 60 per day at the introduction of the program. It has beenraised over time, and was Rs. 120 per day in 2009.
29The scheme only excludes districts with a 100 percent urban population, and is active in 99 percent ofIndian districts.
11

Many of the poorest Indian districts are also those heavily affected by Naxalite violence,
as can be seen from Figure 1. The figure shows Red Corridor districts predicted to receive
NREGS is Phase 1, Phase 2, and Phase 3 in black, dark gray, and light gray, respectively, and
reveals that a large proportion of Maoist-affected districts are poor enough to be assigned to
the first implementation phase. One potential concern with development programs in these
areas is that the presence of local governments is relatively weak and Naxalites may hinder
or prevent the working of these schemes in their fight against the government.
Sabotage of the program by the Naxalites does not seem to be a large-scale problem for the
working of NREGS: In contrast to a number of other government schemes, chief secretaries
from the seven states most heavily affected by Naxalite violence believe NREGS to work rela-
tively well in their districts.30 Case studies in Jharkhand, Chhattisgarh and Orissa also come
to the conclusion that the Naxalites are not blocking NREGS projects, with the exception
of road construction projects which Maoists claim are built for military counterinsurgency
purposes (Banerjee and Saha 2010). In our manual coding of all incidents of Maoist violence
used in this paper there was also no incident that targeted a NREGS worksite, providing
further evidence against the hypothesis that Naxalites sabotage the program in important
ways.31 There is some evidence for other forms of interference with the implementation of
NREGS, however, such as influencing the types of projects undertaken under NREGS by
threatening to destroy infrastructure projects or extorting payments from NREGS work (see
e.g. Parashar 2013 for a case study).32
An emerging literature suggests that implementation issues may substantially limit the
effectiveness of the program, with widespread rationing of NREGS employment especially in
poorer states and corruption in the form of underpaid wages and ghost workers (Dutta et al.
2012, Niehaus and Sukhtankar 2013). Drawing on field reports about the working of NREGS
on the ground, the five states Andhra Pradesh, Chhattisgarh, Madhya Pradesh, Rajasthan
30The Times of India, April 14, 2010: Naxals backing NREGA?31Private contractors are unwelcome under the National Rural Employment Guarantee Act, but some
states still employ them on NREGS projects. There is no clear expected relationship between the presenceof contractors and Maoist violence. While our data do find a handful of Maoist-contractors incidents, noneare related to NREGS contractors.
32See also the newspaper report at Daily Bhaskar.com titled ‘Disturbing pics: Naxals behead two MNREGAcontractors after they refuse to pay ’levy’; leave heads on village road’ from July 24, 2013.
12

and Tamil Nadu are often referred to as ‘star states’ because of the higher implementation
quality of the program in those areas (Dreze and Khera 2009, Khera 2011).33
A number of papers have also focused on analyzing the impact of the employment guar-
antee scheme on rural labor markets in India. Using difference-in-difference approaches, em-
pirical analyses often suggest low overall benefits but positive impacts on public employment
and private-sector wages in the agricultural off-season, in areas with high implementation
quality, and among casual workers (Azam 2012, Berg et al. 2012, Imbert and Papp 2013).
Zimmermann (2013a) uses a regression-discontinuity framework and finds that NREGS is
primarily used as a safety net rather than as an additional form of employment and does
not lead to an overall increase in public-sector employment, the casual private-sector wage
or household income. Taken together, the empirical literature on NREGS therefore suggests
that while there may be important heterogeneous impacts, overall NREGS does not raise the
opportunity cost of other occupations in the traditional sense of offering a better paid job,
although the program may affect opportunity costs through occupational changes induced
by the safety net (Zimmermann 2013a).
The available information on the implementation of NREGS also helps rule out that
the competition for appropriable resources explains the program effects on violence, since
NREGS creates hardly any appropriable assets in practice. A breakdown of project categories
reveals that NREGS focuses on drought-proofing measures and does not generate a lot of
infrastructure improvement or physically appropriable assets.34
Since we focus on a similar time interval as the existing literature in our empirical anal-
ysis, the impacts of the scheme on violence in this paper are therefore unlikely to be driven
by any substantial household income increases or by a fight for the control of appropriable
resources. Instead, the effects could be due to changes in the opportunity cost of being a
33The proportion of households issued job cards (which are free cards required to be able to apply forNREGS employment) in the first year of implementation on average is also substantially higher in star statesthan in the rest of the country, suggesting a much higher level of awareness of NREGS even if householdsmay not necessarily have received employment or known much about the detailed provisions of the scheme.
34According to Ministry of Rural Development (2010), for example, the breakdown of projects for thefinancial year 2008-09, was as follows: 46% water conservation, 20% provision of irrigation facility to landowned by lower-caste individuals, 18% land development, 15% rural connectivity (roads), 1% any otheractivity.
13

Maoist supporter or the promise of government benefits since households may expect future
benefits from the program or see NREGS as a signal of the government’s commitment to the
fight against poverty. This last effect could change the people’s perception of the government
and their expectation of which side will eventually win the conflict. This may be particularly
strong if the police become more effective at tracking down insurgents because of improved
information and assistance from civilians. NREGS differs from previous and mostly unsuc-
cessful government anti-poverty programs because of its legal status, scope, and prominence
in the government’s agenda, which could make citizens more likely to believe that the promise
of development is credible than under past initiatives. Zimmermann (2013b) finds empirical
effects of NREGS on the government’s performance during the next general elections that are
consistent with such a view: districts that had just started implementing NREGS in the year
prior to the election were more likely to vote for the government and seemed less sensitive to
implementation quality than areas with longer access to the program.
Two concurrent papers in the literature analyze the impact of NREGS on Maoist violence
and discuss potential explanations for their results. Fetzer (2013) shows that NREGS atten-
uates the relationship between rainfall shocks and Maoist violence, which could mean that
the importance of income fluctuations as a driver of Maoist violence declines once NREGS
provides a safety net during bad economic times. Dasgupta, Gawande and Kapur (2014)
use a difference-in-difference approach and find that NREGS increases Maoist violence in the
first year of implementation, but then leads to lower violence in the year after. This long-run
reduction in violence is concentrated in Andhra Pradesh, a state with high implementation
quality relative to other areas. The authors attribute this effect to rising opportunity costs.35
While the opportunity-cost channel is consistent with these results, the mechanism cannot
explain the overall effect of the employment guarantee scheme that we find in this paper.
Additionally, the results in both papers could also be consistent with other explanations such
as a citizen-support story. Vanden Eynde (2011) argues, for example, that the link between
violence and rainfall shocks arises out of the citizen-support channel since he proposes a model
35We are unable to look at the longer-run impacts of NREGS in our paper, because this requires comparingPhase 1 to Phase 3 districts to each other since Phase 2 districts received NREGS about a year after Phase1 districts.
14

where Maoists try to prevent the local population from becoming police informants in bad
economic times by increasing their attacks on civilians suspected to work for the government.
Fetzer’s (2013) results could therefore also be consistent with the citizen-support channel,
since NREGS increases the willingness of civilians to help the government at all times, and not
just during bad economic times, breaking the link between rainfall fluctuations and violence.
The empirical patterns in Dasgupta, Gawande and Kapur (2014) are also consistent with
a citizen-support channel explanation which predicts a short-run increase and a long-run
decrease in violence, whereas the higher conflict intensity in the short run is difficult to
explain with an opportunity-cost story.
In terms of the potential mechanisms discussed in the theory section, qualitative and
quantitative evidence on the working of NREGS therefore points to a number of theories as
potentially relevant in the Indian context, including opportunity cost, citizen support and
spotlight theories. On the other hand, an outright sabotage of the program or fight for
appropriable resources as the potential channels seems less likely. To test these different
explanations empirically, we exploit the roll-out of the program in a regression-discontinuity
design.
4 Identification Strategy, Data and Empirical Specifi-
cation
4.1 NREGS Roll-out and the Assignment Algorithm
The Indian government used an algorithm to determine which districts would start imple-
menting the program in which phase. Zimmermann (2013a) reconstructs the algorithm from
available information on the NREGS roll-out and institutional knowledge about the imple-
mentation of development programs in India. The algorithm has two stages: First, the
number of treatment districts that are allocated to a given state in a given phase is deter-
mined. It is proportional to the prevalence of poverty across states, which ensures inter-state
15

fairness in program assignment.36 Second, the specific treatment districts within a state are
chosen based on a development ranking, with poor districts being chosen first.
We use this procedure in our empirical analysis. The ‘prevalence of poverty’ measure used
in the first step of the reconstructed algorithm is the state headcount ratio times the rural
state population, which provides an estimate of the number of below-the-poverty-line people
living in a given state and shows how poverty levels compare across states. In the first step
of the algorithm, a state is therefore assigned the percentage of treatment districts that is
equal to the percentage of India’s poor in that state. For the calculations, we use headcount
ratios calculated from 1993-1994 National Sample Survey (NSS) data.37
The development index used to rank districts within states comes from a Planning Com-
mission report from 2003 that created an index of ‘backwardness’, which is a term often used
in India to refer to economic underdevelopment. The index was created from three outcomes
for 17 major states: agricultural wages, agricultural productivity, and the proportion of low-
caste individuals (Scheduled Castes and Scheduled Tribes) living in the district (Planning
Commission 2003).38 Districts were ranked on their index values. In addition to making
district allocation decisions based on economic development, the government had a separate
list of 32 districts heavily affected by Maoist violence.39 These districts were not subject to
the algorithm and all received NREGS in the first implementation phase. In order to closely
replicate the algorithm used, we drop these districts from our sample for the empirical anal-
ysis. Our results are robust to including the 32 districts and assigning them a predicted
36In practice this provision also ensures that all states (union territories are usually excluded from suchprograms) receive at least one treatment district.
37We use the state headcount ratios from Planning Commission (2009), since the original headcount ratiocalculations do not have estimates for new states that had been created in the meantime. Since these areofficial Planning Commission estimates, they are likely to be closest to the information the Indian governmentwould have had access to at the time of NREGS implementation. NSS is a nationally representative householdsurvey dataset. The newest available information on headcount ratios at the time would have been the 1999-2000 NSS data, but that dataset was subject to data controversies and therefore not used.
38The purpose of the index was to identify especially underdeveloped districts for wage and self-employmentprograms and, as mentioned above, it was used in pre-NREGS district initiatives, although those programswere much less extensive than NREGS and usually envisioned as temporary programs. Data on the threeoutcome variables was unavailable for the remaining Indian states, and it is unclear whether a comparablealgorithm using different outcome variables was used for them. We therefore restrict our empirical analysisto these 17 states. There are no Maoist-related incidents in NREGS districts in the dropped states in oursample period.
39See e.g. Planning Commission (2005) for a mention of this for an earlier program.
16

treatment status based on their economic development index values, however.
Because of the two-step procedure of the algorithm, the resulting cutoffs for treatment
assignment in a given phase are state-specific. Since implementation proceeded in three
phases, two cutoffs can be empirically identified: the cutoff between Phase 1 and Phase
2, and the cutoff between Phase 2 and Phase 3. These correspond to the Phase 1 and
Phase 2 NREGS roll-out, respectively. We exploit both cutoffs in a regression discontinuity
framework.
Since treatment cutoffs differ by state, ranks are made phase- and state-specific for the
empirical analysis and are normalized so that a district with a normalized state-specific rank
of zero is the last district in a state to be eligible for receiving the program in a given
phase.40 This allows the easy pooling of data across states, since the treatment effect can
then be measured at a common discontinuity in each phase.
The overall prediction success rate of the assignment algorithm is 83 percent in Phase
1 and 82 percent in Phase 2. The prediction success rate is calculated as the percent of
districts for which predicted and actual treatment status coincide.41 This means that there
is some slippage in treatment assignment in both phases, and considerable heterogeneity in
the performance of the algorithm across states. Nevertheless, the algorithm performs quite
well in almost all states and the prediction success rates are also considerably higher than the
ones that would be expected from a random assignment of districts, which are 40.27 percent
for Phase 1 and 37.45 percent for Phase 2 at the national level, respectively.42 Overall, this
suggests that the proposed algorithm works well for predicting Phase 1 and Phase 2 district
allocations.
To achieve internal validity, the RD framework crucially relies on the idea that beneficia-
40Rank data in the 17 major Indian states is complete for all districts classified as rural by the PlanningCommission in their report, so there is no endogeneity in the availability of data in these states. Urbandistricts in the Planning Commission report are districts that either include the state capital or that havean urban agglomeration of more than one million people. Rank data is available for 447 of 618 districts inIndia. Data for the index creation was unavailable in some states, in most cases because of internal stabilityand security issues during the early 1990s when most of the data was collected. We exclude these states fromthe analysis.
41Prediction success rates for Phase 2 are calculated after dropping Phase 1 districts from the analysis.42Part of the fuzziness of the treatment discontinuity is potentially due to measurement error in the head-
count ratios if the Indian government used different values than the ones reported in Planning Commission(2009).
17

ries were unable to perfectly manipulate their treatment status, so that observations close to
the treatment cutoff value are plausibly similar on unobservables and differ only with respect
to their treatment status (Lee 2008). In the case of the two-step RD, this means that dis-
tricts should not have been able to manipulate their predicted status under the algorithm in
either step. This seems plausible: As mentioned above, the headcount poverty ratio used to
calculate the number of treatment districts for a state in the first step of the algorithm used
data from the mid-1990s, which had long been available by the time the NREGS assignment
was made.43
Like the information used for the first step, it also seems unlikely that it was possible to
tamper with the data used in the second step of the algorithm: The ‘backwardness’ index
was constructed from outcome variables collected in the early to mid-1990s, eliminating the
opportunity for districts to strategically misreport information. Additionally, the suggestion
of the original Planning Commission report had been to target the 150 least developed
districts, but NREGS cutoffs were higher than this even in Phase 1 (200 districts received it
in Phase 1). Therefore, districts would have had an incentive to be among the 150 poorest
districts but not to be among the 200 or 330 least developed districts for Phase 1 and Phase
2, respectively. Lastly, the Planning Commission report lists the raw data as well as the exact
method by which the development index was created, again eliminating room for districts to
manipulate their rank. Overall, it therefore seems like manipulation of the rank variable is
not a major concern.44
Figures 2a and 2b look more closely at the distribution of index values over state-specific
ranks. They plot the relationship between the Planning Commission’s index and the normal-
ized state-specific ranks for the Phase 1 and Phase 2 cutoffs, respectively. For most states,
the poverty index values seem smooth at the cutoff of 0, again suggesting that manipulation
43The algorithm also uses state rural population numbers from the 2001 Census to transform headcountratios into absolute numbers, but those figures were also long publicly available at the time. The RD maybe potentially fuzzier than it really is because of some potential for measurement error introduced into thealgorithm at this step since the exact numbers the government used in this step are not known, but thisshould not introduce systematic bias into the empirical analysis.
44This does not mean that actual treatment assignment was not subject to political pressures since com-pliance with the algorithm is often below 100 percent. It can be shown that deviations from the algorithmare correlated with party affiliation.
18

of the underlying poverty index variable is not a big concern.
Another way of analyzing whether manipulation is likely to be a problem is to test whether
there are any discontinuities at the cutoffs in the baseline data. If districts close to the cutoff
are really similar to each other, so that outcome differences are just due to the different
treatment status, we should not find impacts in the baseline data. Table 2 presents the
results of such an analysis for employment, wages and education and Table 3 presents it for
the main outcome variables used in this paper (the number of violence-affected individuals, of
fatalities, major incidents and total incidents) for the time period before NREGS was rolled
out to any phase. Figures A.6 and A.7 show the results graphically. Overall, these tables
and figures suggest again that manipulation is not an important problem.45
Finally, we need to verify that there really is a discontinuity in the probability of receiv-
ing NREGS at the state-specific cutoff values. Figures 2c and 2d show the probability of
receiving NREGS in a given phase for each bin, as well as fitted quadratic regression curves
and corresponding 95 percent confidence intervals on either side of the cutoff. The graphs
demonstrate that the average probability of receiving NREGS jumps down at the disconti-
nuity, although this discontinuity is much stronger in Phase 2 than in Phase 1. This suggests
that there is indeed a discontinuity in the probability of being treated with the employment
guarantee scheme at the cutoff.
4.2 Data and Variable Creation
The primary source of data used in this paper comes from the South Asian Terrorism Portal
(SATP). This is a website managed by a registered non-profit, non-governmental organization
called the Institute of Conflict Management in New Delhi. The Institute provides consul-
tancy services to governments and does extensive research on insurgency-related activities.
The SATP aggregates and summarizes news reports on Naxalite-related incidents, and such
45Since Phase 2 received the program later than Phase 1, the pre-treatment phase for Phase 2 in theorylasts an additional year. As we later show explicitly, however, it looks like Phase 2 was affected by spillovereffects from Phase 1 districts before it actually received NREGS. Our main results also include the baselineoutcome variable as a regressor, which controls for any baseline differences and should soak up some of theresidual variance.
19

summaries usually contain the location of the incident (district), the date of the incident, the
number of casualties (Naxalites, civilians, or police), and the number of injuries, abductions
or surrenders. The source also codes the incident as ‘minor’ or ‘major.’
In many cases, the party initiating an incident can be identified from the newspaper
description, and we manually code up these details for the incidents in our sample. Events
are labeled as police-initiated, Maoist initiated against the government or Maoist incidents
against civilians.
An example of a police-initiated attack in the newspaper reports is this incident: “Chhat-
tisgarh, 2006: July 7 Central Reserve Police Force personnel raided a CPI-Maoist hideout
under Basaguda police station in the Dantewada district and shot dead seven Maoists.’ ’ On
the other hand, a typical Maoist attack aimed at government troops reads like this: “West
Bengal, 2006: February 26 Cadres of the CPI-Maoist detonate a landmine blowing up a police
vehicle that killed four persons, including two security force (SF) personnel, at Naakrachhara
in the West Midnapore district.’ ’ Lastly, incidents like the following one are labeled as a
Maoist-initiated attack against civilians: “Andhra Pradesh, 2007: November 16 Three per-
sons, including two migrant tribals from the Bastar region of Chhattisgarh, were killed by
cadres of the CPI-Maoist in Narsingpet village of Chintoor mandal in Khammam district.
Before the killing, the Maoists reportedly grilled them in the presence of the villagers by
organizing a panchayati (village level meeting) and branded them as police informants.’ ’
Using this information we construct violence-intensity variables at the district-month
level, with ‘no incidents’ being coded as zero. If some information is unclear, we verify the
information by searching for the source news reports. We use data between January 2005 (the
earliest time for which data is available on the website) and March 2008, since the districts in
the final phase started receiving NREGS in April 2008. This gives us data before and after
implementation of the program, with about two years of post-treatment data for Phase 1
districts and a year’s worth of after-NREGS data for Phase 2 districts. This dataset is then
merged with information on the poverty rank from the 2003 Planning Commission Report.
As is common with this kind of dataset, there are certain limitations to using it: The
20

number of Naxalites killed or injured is difficult to verify and may be incomplete, and security
forces may have an incentive to overstate their accomplishments by inflating the numbers.
This concern is mitigated to some degree by the fact that police are required to disclose
names and ranks of the Maoists killed to validate their reports and that we make use of
incidents reported in the media rather than administrative data.
The potential data quality limitations introduce measurement error into the analysis,
but will not systematically bias our regression discontinuity (RD) results unless reporting
standards on Naxalite violence are systematically correlated with the predicted treatment
status of NREGS according to the government algorithm. Such a correlation may occur if the
spotlight theory holds and the police face external pressures to perform better in treatment
areas than in control districts. In the empirical results section, we provide evidence against
the spotlight theory by analyzing which parties initiated incidents and by looking at other
types of violence and crime.
Table 1 shows some summary statistics for our primary variables of interest. Our dataset
records 1458 incidents, covering a total of 2030 fatalities. 267 of these incidents were coded
by the SATP source as ‘major’. Furthermore, in this 39-month period, 2545 people were
either injured, abducted or surrendered to the police. On average, in any given red-corridor
district, there are about 0.44 deaths a month related to Naxalite activities and about 0.32
incidents a month.
We also collect data on the police force from the Indian Ministry of Home Affairs, which
contains state-level information on the number of police officers, police posts and stations, as
well as some other measures of police strength. District-level data on other types of crimes
also come from the Ministry of Home Affairs.
4.3 Empirical Specification
Since NREGS was rolled out based on an algorithm that assigned state-specific ranks to
districts, these ranks can be used as a running variable in an RD framework.46 In an ideal
46Our results are also robust to the choice of the running variable. Our analysis uses the poverty rank asthe running variable, whereas an alternative would be to use the underlying poverty index values. We use
21

case, we would restrict the data to observations in the close neighborhood of the cutoff and
estimate the treatment effect at the cutoff using local linear regressions. As the number of
observations near the cutoff is limited, however, we are also using all available observations
that are relevant for a given cutoff. This means that we drop Phase 3 districts in our analysis
of the introduction of the first phase of NREGS, and drop Phase 1 when analyzing the Phase
2 cutoff. Such an increase of the bandwidth will increase the precision of the estimates
because of a larger sample size, but potentially introduces bias since observations far away
from the cutoff can influence the treatment effect estimated at the cutoff (Lee and Lemieux
2010).
We address this concern in three ways: First, all result tables show the estimated co-
efficients for three different parametric specifications (linear, linear with slope of regression
line allowed to differ on both sides of the cutoff, quadratic). The quadratic flexible spec-
ification is always outperformed statistically by the linear flexible specification, and using
F-tests we cannot reject the null hypothesis that other higher-order polynomial terms are
irrelevant.47 Second, while our results use all districts of the treatment and control phase in
a given specification, we test the robustness of our main estimates by varying the bandwidth
and restricting the sample to observations closer to the cutoff. Third, Figures 3c to 3f show
the non-parametric relationships between the main outcome variables of interest and also
plot quadratic polynomial regression curves. Similar to the summary statistics, they show
that insurgency-related violence intensity is low in many districts. We therefore also test the
robustness of our results to the use of a Count Data models, like the zero-inflated Poisson
model.
Since the algorithm only generates a fuzzy RD, we use a two-stage least squares specifi-
the rank since it is the variable that treatment is based on since the first step of the algorithm specifies thesize of the treatment group. This implies that what determines a district’s distance from the cutoff is itsrank rather than its poverty index value, since in many situations a district could have a very different indexvalue without altering its treatment likelihood. Additionally, the conditional mean function of the outcomesof interest is flatter when using the rank rather than the index, which means that a large bandwidth is lessproblematic when using the rank variable. Our results are robust to using the index value as a runningvariable instead, however, even though they tend to be less precise.
47More flexible models also tend to be unstable in the second stage of the two-stage least squares estima-tion procedure, although the estimated coefficients are often qualitatively similar to the quadratic results.Furthermore, Gelman and Imbens (2014) discourage the use of higher-order polynomials.
22

cation where actual NREGS receipt in a given phase is instrumented with predicted NREGS
treatment according to our algorithm, although intent-to-treat effects of the main results
are reported in the appendix. To increase the precision of our estimates, we control for the
baseline outcome variable.48 To ensure that the RD results are not affected by observations
far away from the cutoff, we run results separately by cutoff, and drop the observations that
should not affect the treatment effect at a given cutoff: for Phase 1 district assignment,
we only include Phase 1 and Phase 2 districts in the analysis, and drop Phase 3 districts.
Similarly, for Phase 2 cutoff regressions, we drop Phase 1 observations and only consider the
remaining districts. Most of our empirical analysis focuses on the Phase 1 cutoff, since base-
line Maoist violence levels in districts near the Phase 2 cutoff are much lower. The bulk of
the effect of NREGS on violence should therefore occur in early treatment districts, although
we also analyze the impact of the program for the later districts.
The equation below shows the regression equation where f(.) is a function of actual
NREGS receipt nregs (instrumented with predicted NREGS receipt) and the district’s rank
based on the state-specific normalized index rank. We show results for linear, linear with
flexible slopes and quadratic functions of f(.).
yij= β0 + β1nregsi + f(rank, nregs) + β2baseline yi+ εij
yij is an outcome variable of interest in district i and month j, and the coefficient of
interest is β1. Standard errors are clustered at the district level.
5 Results
5.1 Main Results
The main results are presented in Tables 4 to 6. Table 4 shows the impact of NREGS on
Maoist incidents for the four main outcome variables in the first year after the program was
introduced: individuals affected (deaths/ injuries/ abductions); deaths; major incidents; and
48Controlling for month and year fixed effects, or month*year fixed effects leaves the results unaltered.
23
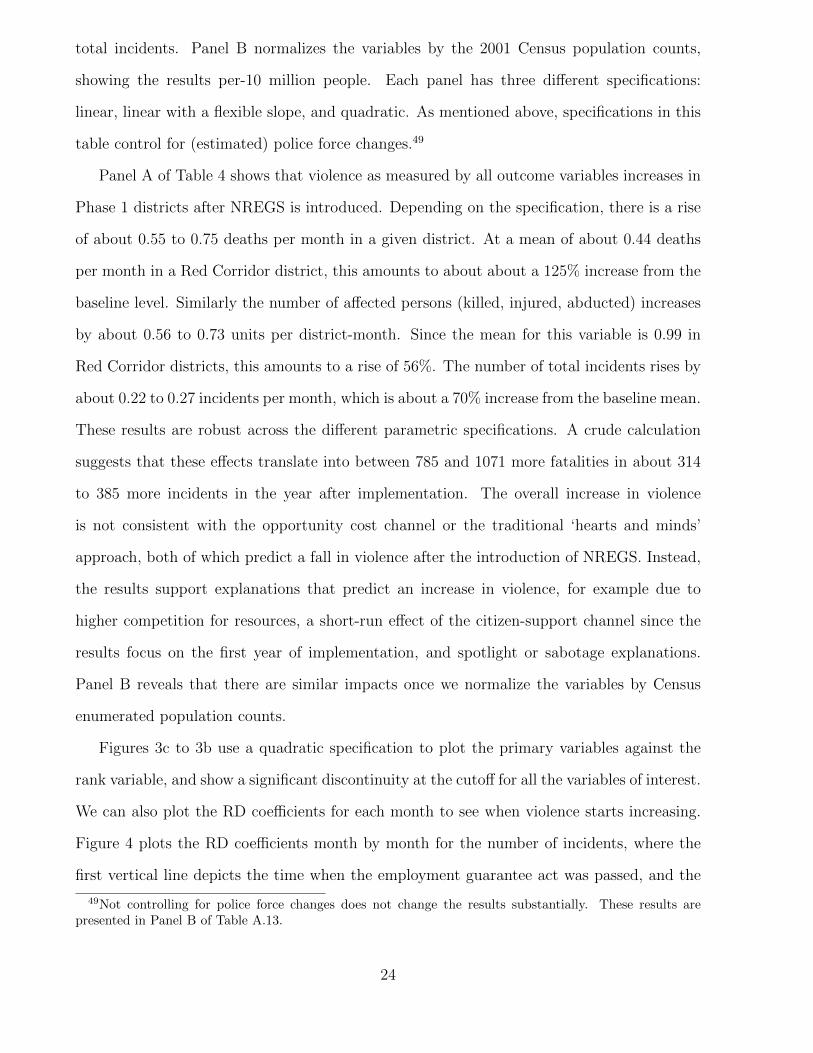
total incidents. Panel B normalizes the variables by the 2001 Census population counts,
showing the results per-10 million people. Each panel has three different specifications:
linear, linear with a flexible slope, and quadratic. As mentioned above, specifications in this
table control for (estimated) police force changes.49
Panel A of Table 4 shows that violence as measured by all outcome variables increases in
Phase 1 districts after NREGS is introduced. Depending on the specification, there is a rise
of about 0.55 to 0.75 deaths per month in a given district. At a mean of about 0.44 deaths
per month in a Red Corridor district, this amounts to about about a 125% increase from the
baseline level. Similarly the number of affected persons (killed, injured, abducted) increases
by about 0.56 to 0.73 units per district-month. Since the mean for this variable is 0.99 in
Red Corridor districts, this amounts to a rise of 56%. The number of total incidents rises by
about 0.22 to 0.27 incidents per month, which is about a 70% increase from the baseline mean.
These results are robust across the different parametric specifications. A crude calculation
suggests that these effects translate into between 785 and 1071 more fatalities in about 314
to 385 more incidents in the year after implementation. The overall increase in violence
is not consistent with the opportunity cost channel or the traditional ‘hearts and minds’
approach, both of which predict a fall in violence after the introduction of NREGS. Instead,
the results support explanations that predict an increase in violence, for example due to
higher competition for resources, a short-run effect of the citizen-support channel since the
results focus on the first year of implementation, and spotlight or sabotage explanations.
Panel B reveals that there are similar impacts once we normalize the variables by Census
enumerated population counts.
Figures 3c to 3b use a quadratic specification to plot the primary variables against the
rank variable, and show a significant discontinuity at the cutoff for all the variables of interest.
We can also plot the RD coefficients for each month to see when violence starts increasing.
Figure 4 plots the RD coefficients month by month for the number of incidents, where the
first vertical line depicts the time when the employment guarantee act was passed, and the
49Not controlling for police force changes does not change the results substantially. These results arepresented in Panel B of Table A.13.
24

second vertical line marks when Phase 1 was implemented. The figure shows that, across
the different specifications, the increase in violence is almost immediate when NREGS is
introduced. Similarly, Figure 5, which plots the monthly RD coefficients for the number of
persons affected, shows that while there is an immediate increase in violence, there is also a
slight dissipation of effects over time. The figures therefore suggest that violence increases
almost immediately after the introduction of the program, rather than increasing slowly
over time. This pattern, together with existing qualitative and quantitative evidence on low
implementation quality, types of projects, and locations of insrugent attacks in our data
makes the competition for resources and sabotage explanations less plausible, since violence
should increase more strongly over time once assets can be appropriated or more projects
can be sabotaged.
Since the data allows us to distinguish between civilians, Maoists and the police force,
we can study the impact of NREGS on each of these groups in terms of fatalities, injuries
and abductions. In many cases, it is also possible to code up which conflict party initiated
the attack. All of this information allows us to better distinguish predictions of various
hypotheses: According to the citizen-support channel, for example, the police should have
better information to catch Naxalites, and the insurgents, in turn, may want to retaliate
against civilians for helping the police. Thus, we should see an increased number of police-
initiated attacks against insurgents and more attacks by Maoists on civilians. This also
implies that the bulk of the impact should be concentrated on Naxals and civilians. Table 5
reports the empirical results of this analysis, focusing again on Phase 1 districts.
Panel A of Table 5 depicts the results for who initiates these attacks and shows that an
important part of the increase in violence comes from police-initiated attacks on the Maoists.
This is consistent across specifications, and shows a sharp increase in police-initiated attacks
in regions that received NREGS.50 The results also show the Maoists retaliating against
civilians, but not a very large increase in Maoist-on-police attacks. The retaliation against
civilians is consistent with the citizen-support story since the Maoists are punishing civilians
50The RD coefficient for the fraction of police initiated attacks in total attacks shows that this fractionrose by somewhere between 2.4 and 2.8 percentage points.
25
for becoming police informers, but there is no reason to expect retaliation against civilians
under the spotlight and competition for resources theories. These empirical patterns are also
not predicted by a sabotage explanation. Additionally, the competition for resources story
implies a large increase in the number of Maoist attacks on the police, which is not consistent
with the empirical patterns we find.
Panel B of Table 5 presents the RD results for fatalities classified by each of these groups.
Civilian and police casualty estimates are small and imprecisely estimated, whereas Naxal
casualties increase by between 0.3 and 0.4 deaths a month after the introduction of the
NREGS, an effect that is also statistically significant at the 5% level. Appendix Table A.10
presents the per-capita results, which again show that the Maoist deaths contribute to most
of the new casualties. The police force does not experience a statistically significant increase
in fatalities, and the magnitudes are also much smaller. Overall, these results are again
consistent with the citizen-support predictions, but much less so with alternative theories.
Since we have monthly data, it is possible to look at dynamic patterns. Focusing on
the Phase 1 implementation group, Table 6 divides the post-treatment period into the short
run (Panel A) and the medium run (Panel B). There are 14 months before Phase 2 receives
NREGS, so we divide them equally into the short run (first 7 months after NREGS eligibility)
and the medium run (months 8 through 14). The results show that an important part of the
impact occurs in the short run. The impact on the number of affected persons is somewhere
between 1.6 and 2.2 times higher, and fatalities are 1.4 to 1.6 times higher in the short run
than in the medium run. Again, these empirical patterns are consistent with the citizen-
support channel and the spotlight theory, but not with the opportunity cost story, although
rising opportunity costs over time once NREGS is implemented better could contribute to the
downward trend in violence. These dynamics are also inconsistent with the resource-curse
story: as resources are introduced and increased over time, violence should go up rather than
fall.
26

5.2 Extensions
The main results suggest that a citizen-support story (that predicts a short-run increase
in violence) and a spotlight theory about treatment districts receiving more attention fit
the empirical results best, although a spotlight theory would not necessarily predict the
retaliation effect by Maoists against civilians that we find. A further test of the plausibility
of some versions of the spotlight theory is presented in Appendix Table A.11, which focuses
on the impact of NREGS on other types of violence and crime. If police officers feel an
increased pressure to perform better in treatment areas because of increased attention paid
to NREGS districts, then we may expect that increased police efforts should apply to other
forms of violence and crime as well. Appendix Table A.11 provides no evidence of NREGS
having a statistically significant impact on crime, however, and the magnitudes tend to be
small. This reduces the plausibility of a spotlight explanation, although it cannot rule out
all potential versions of it.51
If the citizen-support channel is relevant, we should also expect it to be especially im-
portant in areas where program awareness and implementation quality are higher, although
this may also be consistent with more attention being paid to these areas in a spotlight
theory approach. Therefore, the number of police-initiated attacks should be higher in these
areas than in the rest of the country. One measure of implementation quality often used in
the existing NREGS literature are the so-called ‘star states’ where, based on field reports,
awareness of the program and implementation quality tend to be much higher than in the
rest of the country (Dreze and Khera 2009, Khera 2011). In Table 7, the NREGS treatment
variable is interacted with an indicator variable equal to one if a state is a ‘star state’, and
zero otherwise. As the table shows, police-initiated attacks are indeed higher in star-state
NREGS districts than in other treatment districts.
Given that violence levels increase almost immediately after the introduction of NREGS
despite severe challenges with implementation in practice, an implication of this is that citi-
51Our crime data come from Indian government sources, whereas the conflict data is drawn from newspaperreports, for example. It is therefore possible that the increased attention on treatment districts is mainly dueto the media, and therefore affects newspaper reports, whereas there is no difference in administrative data.
27

zens may respond more strongly to the promise of development rather than actual program
benefits. Zimmermann (2013b) finds results consistent with NREGS having such an effect
at the time of the Indian general elections in 2009, where the districts with shortest expo-
sure to the program were more likely to vote for the government and were less sensitive to
implementation quality than areas with longer access to the program.52
If the promise of development is important, then we may find that civilians also change
their behavior even in still untreated districts. This effect may occur especially in Phase 2
districts once Phase 1 districts have started implementation since the people in those districts
can take Phase 1 implementation as a signal of the government’s commitment to following
through with the program and may be aware of the fact that their districts will receive the
treatment soon. We would then expect to find positive spillover effects of the program onto
Phase 2 districts.
Table 8 confirms that this effect does indeed hold empirically. At the time that Phase 1
districts have access to NREGS (and other phases do not) there is an increase in violence
in Phase 2 districts (Panel A). However, this increase dissipates over time, and by the time
Phase 2 is in the spotlight, there is no longer any impact (Panel B). The Phase 2 results are
therefore difficult to explain with the spotlight theory. If the police or media work harder
in treatment areas due to increased attention on law and order in NREGS areas, there is no
reason for the police or newspaper reporters in still untreated areas to increase their effort
levels.
Overall, the empirical patterns presented in the results section suggest that violence goes
up when NREGS is introduced, and does so already in the very short run. A large proportion
of the increase is due to police-initiated attacks on Maoists. There is also some retaliation by
the Maoists on civilians, but most of the increase in fatalities is explained by rebels dying.
All of these empirical patterns are consistent with the predictions of a citizen-support model
in which civilians are willing to share information and other forms of support with the police
52A number of researchers believe that NREGS was important in ensuring the re-election of the Indiangovernment (see Zimmermann 2013b for details). Electoral benefits from government programs have alsobeen found in other contexts (see e.g. De la O 2013, Manacorda et al. 2011, Pop-Eleches and Pop-Eleches2012).
28

after NREGS implementation starts, which allows government troops to crack down more
efficiently on the Maoists. They are difficult to explain with many alternative explanations
like the opportunity cost channel or a number of versions of the spotlight theory, however,
although we cannot completely rule out that there is an alternative explanation that fits the
results.
5.3 Robustness Checks
A number of checks can be performed to test the robustness of the main results and are
reported in the appendix. We focus on our main results, which look at the impact on Phase
1 districts in these additional specifications.
In order to ensure that a handful of large attacks by Maoists or police are not driving the
results, the we repeat the analysis by dropping all district-months wherein more than twenty
persons were killed or injured.53 The results of this analysis are shown in Appendix Table
A.9 and Figure A.8.
Another important concern is that there may be measurement error in the rank variable
that is used as the running variable, which may lead to districts right at the cutoff being
assigned to the wrong side of the cutoff. We provide a robustness check by using a donut-hole
approach that drops the districts with state-level ranks lying between -1 and 1 (the cutoff
is at a state-specific rank of 0). These results are presented in Panel A of Appendix Table
A.12. They are similar, both in magnitude and statistical significance, to our main results,
implying that the estimated treatment effects do not seem to be driven by measurement error
of the observations close to the cutoff. Panel B of Table A.12 presents the main results when
varying the bandwidth by restricting the analysis to observations closer to the cutoff, and
once again produces similar results.
Our main results are also robust to a number of other specifications presented in the
appendix: Panel A of Table A.13 estimates the intent-to-treat (ITT) version of the main
results, while Panel B of Table A.13 reproduces the main results without controlling for the
53This drops the most violent eleven district-months from the districts that received NREGS. The resultsare robust to picking other cutoffs.
29
strength of the police force. Both specifications consistently maintain the main results.54
Another potential concern with the main specifications is the nature of the data. All
outcomes are count-data outcomes, but we estimate the treatment effects within a normal
regression framework rather than using count-data models. Panel A of Appendix Table
A.14 therefore presents the the results from a Zero-Inflated Poisson Count-Data Model. The
Poisson model is the most widely used count-data model (Cameron and Trivedi 2013). Since
the data has an excess of zero-values (i.e. no casualties in a given district-month), we use
the zero-inflated version of this model. The coefficients are interpreted as the change in the
log-counts of the dependent variable on introduction of NREGS, and again show the same
qualitative patterns as our main results. The results are also robust to using other count
data models like the hurdle model using a Logit-Poisson specification.
Panel B of Table A.14 presents the results using a difference-in-difference (DID) approach
rather than the RD, which is the most common empirical identification strategy used to
study the impacts of NREGS in the literature. We conduct two different types of DID
exercises: the Intent-to-Treat (ITT) version, where treatment is assigned based on who should
have received NREGS according to the algorithm; and the Actual Treatment version where
treatment depends on actually receiving NREGS. While the DID approach estimates the
overall average treatment effect on the treated and therefore a different parameter than the
RD specifications, the results are again qualitatively similar.
Lastly, we conduct other robustness checks not reported here by re-doing our main results
after controlling for rainfall shocks in the current month and in the entire preceding year.
We also control for average monthly wages, and find that our results are robust to all these
specifications. To the extent that rainfall shocks and wages capture what happens to income
in these regions after NREGS is introduced, these results indicate that the opportunity-cost
54One possible simultaneous change with NREGS implementation could be an increase in the size of thepolice force. Since we do not have data on the actual police force in a district, we estimate it using state-levelinformation, where any change in the police force for a given state is assumed to be attributable to NREGSdistricts. In reality, these state-level estimates most likely overemphasize the change in the police force andmay therefore provide us with conservative estimates of the impact of NREGS. Our main analysis thereforeincludes police force controls, although, as Panel B of Table A.13 shows, the results are very similar withoutthese controls. Other tables were re-made without police controls (i.e. who initiates the attacks, and who iskilled, etc.), and the results are robust to not including the controls.
30

channel is not the driving force behind these results. In other specifications, we also control
for the timing of the state elections, in some specifications using not just the election month
but also up to 5-months leading up to an election, and our results are unaffected by these
controls.
6 Conclusion
This paper has analyzed the impact of introducing a large public-works program in India, the
National Rural Employment Guarantee Scheme (NREGS), on incidents of left-wing violence
by the Naxalite movement. We exploit the fact that the program was phased in over time ac-
cording to an algorithm that prioritized economically underdeveloped districts in a regression
discontinuity (RD) design. The results are robust across a number of different specifications
and show a substantial rise in violence in the first year of implementation in the districts
that received NREGS, especially in the very short run. Insurgents are the primary affected
group as police-initiated attacks rise, with little impact on police force casualties. There is
also some evidence for an increase in Maoist-initiated attacks against civilians. The impact
is largest among districts that received NREGS in the first phase of the roll-out, but there
are positive spillovers of violence to the districts that are next in line to receive the program.
These empirical patterns as well as other available qualitative and quantitative evidence
on the conflict are consistent with a model in which the government program makes civilians
more willing to support the police because it improves the relationship between the gov-
ernment and the people. In contrast, the results are difficult to explain with a number of
alternative theories, although we cannot completely rule out that there is a different expla-
nation that fits the results. Securing the assistance of the local population may therefore be
an important factor in internal conflicts and may help answer Max Weber’s (1919) question
on whether the State should use force or development to tackle internal conflict. For the
Indian government, which has been trying to fight the Naxalites for over 30 years, the best
strategy may be to combine both force and development.
It is unclear, however, how successful such strategies are likely to be in the longer run. In
31

the Indian context, a growing body of literature questions the effectiveness of NREGS as a
tool for actual development due to various implementation problems, although the program
still seems to provide some benefits through its safety net function. This implies that at least
a part of what may win over the local community initially are anticipated welfare benefits and
the promise of development rather than substantial actual changes. Such a mere promise of
development may not be a credible enough tool to ensure the aid received from the civilian
population over a longer period of time, however. Once civilians realize that the program is
not delivering on its promises, this may not only stop civilian aid in exchange for the benefits
of the program, but may lead to distrust in government programs in general. Therefore,
an important component to winning the continued support by the people may be to ensure
that government anti-poverty programs are implemented effectively and actually fulfill the
promise of development.
32

References
Akerlof, George and Janet Yellen. 1994. ‘Gang Behavior, Law Enforcement, and CommunityValues.’ Issue 53 of CIAR Program in Economic Growth and Policy reprint series
Azam, Mehtabul. 2012. ‘The Impact of Indian Job Guarantee Scheme on Labor MarketOutcomes: Evidence from a Natural Experiment.’ IZA Discussion Paper 6548.
Bakshi, G D. 2009. ‘Left Wing Extremism in India: Context, Implications and ResponseOptions.’ Manekshaw Paper No. 9.
Banerjee, Kaustav and Partha Saha. 2010. ‘The NREGA, the Maoists and the Developmen-tal Woes of the Indian State.’ Economic and Political Weekly, XLV(28): 42-48.
Berg, Erlend, Bhattacharyya, Sambit, Durgam, Rajasekhar, and Manjula Ramachandra.Can Rural Public Works Affect Agricultural Wages? Evidence from India. CSAE WorkingPaper WPS/2012-05, 2012.
Berman, Eli, Callen, Michael, Felter, Joseph H. and Jacob N. Shapiro. 2011. ‘Do WorkingMen Rebel? Insurgency and Unemployment in Afghanistan, Iraq, and the Philippines.’Journal of Conflict Resolution 55 (4): 496-528.
Berman, Eli, Shapiro, Jacob N., and Joseph H. Felter. 2011. ‘Can Hearts and Minds BeBought? The Economics of Counterinsurgency in Iraq.’ Journal of Political Economy,119(4): 766-819.
Berman, Eli, Felter, Joseph H., Shapiro, Jacob N., and Erin Troland. 2013. ‘Modest, Secure,and Informed: Successful Development in Conflict Zones.’ American Economics ReviewPapers and Proceedings, 103(3): 1-8.
Blattman, Chris and Edward Miguel. 2010. ‘Civil War.’ Journal of Economic Literature48(1): 3-57.
Borooah, Vani K. 2008. ‘Deprivation, Violence and Conflict: An Analysis of ‘Naxalite’Activity in the Districts of India. International Journal of Conflict and Violence, 2: 317-333.
Cameron, A. Colin and Pravin K. Trivedi. 2013. ‘Regression Analysis of Count Data.’ 2ndedition, Econometric Society Monograph No.53, Cambridge University Press.
Collier, Paul and Anke Hoeffler. 2007. ‘Civil War’, in Handbook of Defense Economics. K.Hartley and T. Sandler eds: Elsevier North Holland.
Crost, Benjamin, Felter, Joseph and Patrick Johnston. 2012. ‘Conditional Cash Transfersand Civil Conflict: Experimental Evidence from the Philippines.’ Mimeo
Crost, Benjamin, Felter, Joseph and Patrick Johnston. 2014. ‘Aid under Fire: DevelopmentProjects and Civil Conflict.’ American Economic Review, 104(6): 1833-56.
Dal Bo, Ernesto and Robert Powell. 2007. ‘Conflict and Compromise in Hard and TurbulentTimes.’ UC Berkeley Department of Political Science Working Paper.
33

Dasgupta, Adi, Kishore Gawande, and Devesh Kapur. 2014. ‘Can Anti-poverty ProgramsReduce Conflict? India’s Rural Employment Guarantee and Maoist Insurgency,’ Mimeo.
De la O, Ana. 2013. ‘Do Conditional Cash Transfers Affect Electoral Behavior? Evidencefrom a Randomized Experiment in Mexico.’ American Journal of Political Science, 57(1):1-14.
Dey, Nikhil, Jean Dreze, and Reetika Khera. 2006. Employment Guarantee Act: A Primer.(Delhi: National Book Trust, India)
Do, Quy-Toan and Lakshmi Iyer. 2007. ‘Poverty, Social Divisions and Conflict in Nepal.’Unpublished working paper, Harvard Business School.
Dreze, Jean and Reetika Khera. 2009. ‘The Battle for Employment Guarantee.’ Frontline,26(1).
Dube, Oeindrila and Juan F. Vargas. 2013.‘Commodity Price Shocks and Civil Conflict:Evidence from Colombia.’ Review of Economic Studies, 80(4): 1384-1421.
Dutta, Puja, Murgai, Rinku, Ravallion, Martin, and Dominique van de Walle. 2012. ‘DoesIndia’s Employment Guarantee Scheme Guarantee Enployment? World Bank Policy Re-search Working Paper 6003.
Fearon, James D. 2007. ‘Economic development, insurgency, and civil war,’ in Institutionsand Economic Performance. Elhanen Helpman ed. Cambridge: Harvard University Press.
Fetzer, Thiemo. 2014. ‘Can Workfare Programs Moderate Violence? Evidence from India,’Mimeo.
Gelman, Andrew and Guido Imbens. 2014. ‘Why High-order Polynomials Should not beused in Regression Discontinuity Designs’ NBER Working Paper 20405
Government of India. 2009. ‘The National Rural Employment Guarantee Act.’
Grossman, Herschell I. 1991. ‘A General Equilibrium Model of Insurrections.’ AmericanEconomic Review, 81(4): 912-21.
Grossman, Herschell I. 1999. ‘Kleptocracy and revolutions.’ Oxford Economic Papers, 51,267-83.
Hirshleifer, Jack. 1989. ‘Conflict and rent-seeking functions: Ratio versus difference modelsof relative success.’ Public Choice, 63, 101-12.
Humphreys, Macartan and Jeremy M. Weinstein. 2008. ‘Who Fights? The Determinants ofParticipation in Civil War.’ American Journal of Political Science, 52(2): 436-455.
Imbert, Clement, and John Papp. 2013. ‘Labor Market Effects of Social Programs: Evidenceof India’s Employment Guarantee.’ Centre for the Study of African Economies WorkingPaper WPS/2013-03.
Kalyvas, Stathis. 2006. The Logic of Civil War (Cambridge and New York: CambridgeUniversity Press)
34

Khera, Reetika. 2011. The Battle for Employment Guarantee. Oxford University Press.
Lalwani, Sameer. 2011. ‘India’s Approach to Counterinsurgency and the Naxalite Problem.’CTC Sentinel, 4(10): 5-9.
Lee, David S. 2008. ‘Randomized Experiments from Non-Random Selection in U.S. HouseElections.’ Journal of Econometrics, 142(2): 675-697.
Lee, David S., and Thomas Lemieux. 2010. ‘Regression Discontinuity Designs in Economics.’Journal of Economic Literature, 48(2): 281-355.
Manacorda, Marco, Edward Miguel, and Andrea Vigorito. 2011. ‘Government Transfers andPolitical Support.’ American Economic Journal: Applied Economics, 3(3).
Miguel, Edward, Shanker Satyanath and Ernest Sergenti. 2004. ‘Economic Shocks and CivilConflict: An Instrumental Variables Approach.’ Journal of Political Economy, 112(4): 725-53.
Miguel, Edward, and Shanker Satyanath. 2011. ‘Re-examining Economic Shocks and CivilConflict.’ American Economic Journal: Applied Economics, 3(4): 228-232.
Ministry of Home Affairs, Government of India. 2006. ‘Annual Report 2006-2007.’
Ministry of Rural Development, Department of Rural Development, Government of India.2010. ‘Mahatma Gandhi National Rural Employment Guarantee Act 2005 - Report to thePeople 2nd Feb 2006 - 2nd Feb 2010.’
Mukherji, Nirmalangshu. 2012. The Maoists in India: Tribals under Siege. (London: PlutoPress, United Kingdom)
Murshed, S. Mansoob and Scott Gates. 2005. ‘Spatial-Horizontal Inequality and the MaoistInsurgency in Nepal.’ Review of Development Economics, 9(1): 121-34.
Niehaus, Paul, and Sandip Sukhtankar. 2013. ‘Corruption Dynamics: The Golden GooseEffect.’ American Economic Journal: Economic Policy, 5(4): 230-269.
Nunn, Nathan and Nancy Qian. 2012. ‘Aiding Conflict: The Impact of U.S. Food Aid onCivil War.’ NBER Working Paper No. 17794.
oneworld.net. 2011. ‘Community MGNREGS Programme for Naxalite Affected Areas.’ Re-port.
Parashar, Swati. 2013. ‘Armed Resistance, (In)Security and the Household: A Case Stuy ofthe Maoist Insurgency in India.’ in The Global Political Economy of the Household in SouthAsia, edited by Juanita Elias and Samanthi J. Gunawardana, Palgrave Macmillan.
Petersen, Roger. 2001. Resistance and Rebellion: Lessons from Eastern Europe (Cambridgeand New York: Cambridge University Press)
Planning Commission. 2003. ‘Report of the Task Force: Identification of Districts for Wageand Self Employment Programmes.’
35

Planning Commission. 2005. ‘Report of the Inter-Ministry Task Group on Redressing Grow-ing Regional Imbalances.’
Planning Commission. 2009. ‘Report of the Expert Group to Review the Methodology forEstimation of Poverty.’
Pop-Eleches, Cristian and Grigore. 2012. ‘Government Spending and Pocketbook Voting:Quasi-Experimental Evidence from Romania.’ Quarterly Journal of Political Science, 7(30).
Powell, Robert. 2006. ‘War as a Commitment Problem.’ International Organization, 60,169-203.
Ramana, P.V. 2011. ‘India’s Maoist Insurgency: Evolution, Current Trends, and Responses.’in India’s Contemporary Security Challenges, edited by Michael Kugelman, Woodrow Wil-son International Center for Scholars Asia Program.
Skaperdas, Stergios. 1992. ‘Cooperation, Conflict, and Power in the Absence of PropertyRights.’ American Economic Review, 82(4): 720-39.
Sundar, Nandini. 2011. ‘At War with Oneself: Constructing Naxalism as India’s Biggest Se-curity Threat.’ in India’s Contemporary Security Challenges, edited by Michael Kugelman,Woodrow Wilson International Center for Scholars Asia Program.
Vanden Eynde, Oliver. 2011. ‘Targets of Violence: Evidence from India’s Naxalite Conflict.’Mimeo.
Weber, Max. 1919. ‘Politics as a Vocation.’ ‘Politik als Beruf,’ Gesammelte PolitischeSchriften, pp. 396-450. Duncker and Humblodt, Munich
Zimmermann, Laura. 2013a. ‘Why Guarantee Employment? Evidence from a Large IndianPublic-Works Program.’ Mimeo.
Zimmermann, Laura. 2013b. ‘Jai Ho? The Impact of a Large Public Works Program on theGovernment’s Election Performance in India.’ Mimeo.
36

.Table 1: Summary Statistics
Mean Mean Total
Red Corridor Districts All Districts All DistrictsDeaths 0.441 0.116 2030Injured/Abducted/Captured 0.553 0.146 2545Affected 0.994 0.262 4575Major Incidents 0.058 0.015 267Total Incidents 0.317 0.084 1458
Maoists Killed 0.162 0.043 744Civilians Killed 0.166 0.044 763Police Killed 0.114 0.030 523
A unit of observation is a district in a given month and year (i.e. district-month-year). There are a total of 39months from January 2005 till March 2008. “Red Corridor” districts are districts with Maoist-related incidents.“Affected Persons” indicates number of persons killed, injured, abducted or captured.“Major Incidents” indicatesnumber of Major Incidents as coded by the SATP website. “Total Incidents” is number of total Maoist-relatedincidents.
37

Table 2: Education, Employment and Wages at Baseline
HH Agri Labor HH Self-emp in Agri Pvt Wage Pvt Wage Ext
Linear -0.102 -0.00495 9.571 1.864(0.0775) (0.0748) (8.120) (3.903)
R-squared 0.067 0.120 0 0.118
Linear Flex Slope -0.139* 0.121 -0.260 -6.352(0.0803) (0.0784) (5.807) (3.863)
R-squared 0.003 0.036 0.109 0.114
Quadratic -0.142 0.0913 7.998 -2.986(0.0976) (0.0908) (9.051) (4.553)
R-squared 0.019 0.119 0 0.188
Education Pvt Emp Public Emp Emp in Family Work
Linear 0.351 0.0191 -0.00141 -0.0590(0.330) (0.0616) (0.00305) (0.0668)
R-squared 0 0.116 0 0.086
Linear Flex Slope 0.282 -0.0939 -0.00111 0.0938(0.338) (0.0654) (0.00262) (0.0683)
R-squared 0.022 0 0 0.056
Quadratic 0.395 -0.0622 -0.00433 0.0536(0.400) (0.0764) (0.00337) (0.0785)
R-squared 0 0.088 0 0.151
Regressions of the form yij= β0 + β1nregsi + f(rank, nregs) + εij where yij is an outcome variable of interestin district i and month j, and the coefficient of interest is β1. The function f(.) is either linear, linear withflexible slopes or quadratic.Regressions of baseline variables across 225 districts that are in either Phase 1 or 2 of the program.Data source: The National Sample Survey of India (2004-5) - Employment and Unemployment ModuleDependent Variables: Variables give district-level averages in 2004/05 for male, working age workers (18-60years) in rural areas. HH agri labor is proportion of households engaged in agricultural labor, HH self-emp inagri is proportion of households self-employed in agriculture, education is years of schooling, pvt wage is privatedaily casual wage in past 7 days in rupees, pvt wage ext is the private daily casual wage for everyone with apositive wage and 0 for everyone with a missing wage, pvt emp, public emp, and emp in family work are theproportion of workers working in public, private casual, and family employment during last week.
38

.Table 3: Baseline Pre-Treatment Results
Panel A: Non-Normalized
Specification Affected Fatalities Major TotalPersons Incidents Incidents
Linear 0.517 0.0666 0.0142 -0.0232(0.782) (0.317) (0.0319) (0.110)
R-squared 0.005 0.004 0.008 0.003
Linear Flexible Slope 0.0773 -0.147 -0.00850 -0.0899(0.534) (0.277) (0.0271) (0.120)
R-squared 0.004 0 0.001 0
Quadratic 0.198 -0.162 -0.0142 -0.107(0.758) (0.349) (0.0345) (0.138)
R-squared 0.006 0 0.003 0
Outcome Mean 0.580 0.263 0.035 0.170
Panel B: Per Capita
Specification Affected Fatalities Major TotalPersons Incidents Incidents
Linear 10.34 3.409 0.337 0.821(10.39) (3.673) (0.375) (0.969)
R-squared 0.002 0.003 0.005 0.008
Linear Flexible Slope 5.603 1.566 0.157 0.320(6.097) (2.210) (0.226) (0.644)
R-squared 0.004 0.005 0.005 0.006
Quadratic 8.537 2.304 0.195 0.457(9.529) (3.384) (0.347) (0.926)
R-squared 0.003 0.005 0.006 0.009
Outcome Mean 6.577 3.012 0.360 1.748
Regressions of the form yij= β0 + β1nregsi + f(rank, nregs) + β2baseline yi+ εij where yijis an outcome variable of interest in district i and month j, and the coefficient of interest isβ1. The function f(.) is either linear, linear with flexible slopes or quadratic.Time period: looks at impacts for the 13 months pre-treatment.Panel A contains direct impacts (not normalizing for population). Panel B shows the impactper-10 million people (based on population counts from the 2001 Census).Controls include baseline averages of each dependent variable and police force changes. Unitof observation is district-month. Regressions contain 2964 observations in 228 district-clusters(Phase 1 and Phase 2 districts) and 13 months.Dependent Variables: “Affected Persons” indicates number of persons killed, injured, abductedor captured. “Fatalities” indicates total number of deaths. “Major Incidents” indicates numberof ‘Major Incidents’ as coded by the SATP website. “Total Incidents” is number of totalMaoist-related incidents.
39

.Table 4: Main Results
Panel A: Non-Normalized
Specification Affected Fatalities Major TotalPersons Incidents Incidents
Linear 0.636** 0.594** 0.104*** 0.272**(0.294) (0.275) (0.0402) (0.112)
R-squared 0.487 0.438 0.380 0.457
Linear Flexible Slope 0.561* 0.548* 0.0843** 0.228**(0.300) (0.301) (0.0376) (0.105)
R-squared 0.487 0.439 0.386 0.466
Quadratic 0.723** 0.746** 0.124*** 0.274**(0.351) (0.352) (0.0475) (0.128)
R-squared 0.487 0.434 0.375 0.456
Outcome Mean 0.580 0.263 0.035 0.170
Panel B: Per Capita
Specification Affected Fatalities Major TotalPersons Incidents Incidents
Linear 2.393** 1.852* 0.537** 1.183**(1.135) (1.044) (0.240) (0.539)
R-squared 0.526 0.522 0.562 0.683
Linear Flexible Slope 1.906* 1.536 0.391** 0.959*(1.047) (1.113) (0.187) (0.541)
R-squared 0.526 0.523 0.563 0.685
Quadratic 2.277* 2.387* 0.602** 1.060*(1.209) (1.275) (0.246) (0.607)
R-squared 0.526 0.522 0.562 0.684
Outcome Mean 6.577 3.012 0.360 1.748
Panel A contains direct impacts (not normalizing for population). Panel B shows the impactper-10 million people (based on population counts from the 2001 Census).Controls include baseline averages of each dependent variable and police force changes. Unitof observation is district-month. Regressions contain 3192 observations: 228 district-clusters(Phase 1 and Phase 2 districts) in 14 months post-Phase 1 implementation and pre-Phase 2implementation.“Affected Persons” indicates number of persons killed, injured, abducted or captured. “Fa-talities” indicates total number of deaths. “Major Incidents” indicates number of ‘MajorIncidents’ as coded by the SATP website. “Total Incidents” is number of total Maoist-relatedincidents.
40

.Table 5: Who Initiates the Attacks and Who is Killed
Panel A: Who Initiates
Specification Police Maoist Maoiston Maoist on Police on Civilians
Linear 0.110* 0.0250** 0.0945*(0.0610) (0.0121) (0.0496)
R-squared 0.133 0.180 0.350
Linear Flexible Slope 0.0889* 0.0218** 0.0626(0.0470) (0.0111) (0.0394)
R-squared 0.140 0.181 0.357
Quadratic 0.100* 0.0252* 0.0898*(0.0607) (0.0135) (0.0528)
R-squared 0.136 0.180 0.351
Outcome Mean 0.057 0.028 0.071
Panel B: Who is Killed
Specification Civilians Police MaoistsKilled Killed Killed
Linear 0.146 0.0456 0.356**(0.119) (0.0677) (0.176)
R-squared 0.337 0.176 0.204
Linear Flexible Slope 0.132 0.0339 0.306**(0.120) (0.0508) (0.152)
R-squared 0.337 0.176 0.211
Quadratic 0.168 0.0980 0.394**(0.140) (0.0749) (0.200)
R-squared 0.337 0.175 0.200
Outcome Mean 0.095 0.079 0.089
Panel A shows the results for ‘who initiates the attacks and against whom.’ PanelB reports the results for ‘who is killed’.Controls include baseline averages of each dependent variable and police forcechanges. Unit of observation is district-month. Regressions contain 3192 ob-servations: 228 district-clusters (Phase 1 and Phase 2 districts) in 14 monthspost-Phase 1 implementation and pre-Phase 2 implementation.
41

.Table 6: The Short Run and the Medium Run
Panel A: Short Run
Specification Affected Fatalities Major TotalPersons Incidents Incidents
Linear 0.778** 0.641** 0.123** 0.273*(0.383) (0.322) (0.0552) (0.142)
R-squared 0.655 0.599 0.510 0.577
Linear Flexible Slope 0.760* 0.671* 0.113* 0.251*(0.420) (0.364) (0.0585) (0.139)
R-squared 0.655 0.598 0.513 0.581
Quadratic 0.967** 0.855** 0.162** 0.311*(0.488) (0.425) (0.0712) (0.170)
R-squared 0.654 0.595 0.501 0.571
Panel B: Medium Run
Specification Affected Fatalities Major TotalPersons Incidents Incidents
Linear 0.484* 0.458** 0.0855** 0.273***(0.273) (0.222) (0.0371) (0.106)
R-squared 0.359 0.360 0.273 0.370
Linear Flexible Slope 0.396* 0.397* 0.0639** 0.224**(0.233) (0.223) (0.0285) (0.0955)
R-squared 0.359 0.361 0.279 0.381
Quadratic 0.445 0.520** 0.0862** 0.240**(0.281) (0.259) (0.0361) (0.108)
R-squared 0.359 0.358 0.273 0.376
Outcome Mean 0.580 0.263 0.035 0.170
Panel A shows Short Run impacts (months 1 through 7 after implementations).Panel B shows the Medium Run (months 8 through 14 after implementation).Controls include baseline averages of each dependent variable and police forcechanges. Unit of observation is district-month. Regressions contain 1596 obser-vations: 228 district-clusters (Phase 1 and Phase 2 districts) in the 7 month periods.“Affected Persons” indicates number of persons killed, injured, abducted or cap-tured. “Fatalities” indicates total number of deaths. “Major Incidents” indicatesnumber of ‘Major Incidents’ as coded by the SATP website. “Total Incidents” isnumber of total Maoist-related incidents.
42

.Table 7: Who Initiates the Attacks: Star States vs Non-Star States
Specification Police Maoist Maoiston Maoist on Police on Civilians
Linear:
NREGS 0.0609 0.0294** 0.0735*(0.0380) (0.0141) (0.0390)
NREGS*Star States 0.116* -0.0130 0.0593(0.0685) (0.00899) (0.0560)
Star States -0.0136 0.00688* -0.0305(0.0170) (0.00380) (0.0269)
R-squared 0.136 0.181 0.351
Linear Flexible Slope:
NREGS 0.0257 0.0228* 0.0244(0.0217) (0.0127) (0.0200)
NREGS*Star States 0.363** 0.0312 0.190(0.174) (0.0328) (0.126)
Star States -0.0222 0.00597 -0.0372(0.0193) (0.00376) (0.0279)
R-squared 0.153 0.185 0.362
Quadriatic:
NREGS 0.0592 0.0298** 0.0681*(0.0398) (0.0151) (0.0401)
NREGS*Star States 0.116* -0.0130 0.0602(0.0675) (0.00870) (0.0548)
Star States -0.0139 0.00695 -0.0314(0.0166) (0.00429) (0.0260)
R-squared 0.137 0.181 0.352
Outcome Mean 0.057 0.028 0.071
Star States include Andhra Pradesh, Chhattisgarh, Tamil Nadu, Rajasthanand Madhya Pradesh, which according to field reports have a higher imple-mentation quality of the NREGS than other states (Dreze and Khera 2009,Khera 2011).Controls include baseline averages of each dependent variable and policeforce changes. Unit of observation is district-month. Regressions contain3192 observations: 228 district-clusters (Phase 1 and Phase 2 districts) in14 months post-Phase 1 implementation and pre-Phase 2 implementation.
43

.Table 8: Phase 2 - While Phase 1 is Treated and Phase 2 Treatment
Panel A: During Phase 1 Treatment
Specification Affected Fatalities Major TotalPersons Incidents Incidents
Linear 0.131** 0.0825* 0.00345 0.0348***(0.0537) (0.0435) (0.00434) (0.0122)
R-squared 0.137 0.141 0.206 0.309
Linear Flexible Slope 0.208* 0.129* 0.0109 0.0434*(0.113) (0.0739) (0.00910) (0.0236)
R-squared 0.090 0.103 0.191 0.296
Quadratic 0.183** 0.114* 0.00992 0.0425**(0.0925) (0.0625) (0.00717) (0.0199)
R-squared 0.128 0.134 0.203 0.305
Panel B: Phase 2 Treatment Period
Specification Affected Fatalities Major TotalPersons Incidents Incidents
Linear -0.161 -0.180 -0.00620 0.00399(0.194) (0.168) (0.00906) (0.0307)
R-squared 0.055 0.038 0.044 0.184
Linear Flexible Slope -0.0331 -0.137 -0.00650 0.0327(0.232) (0.173) (0.00908) (0.0462)
R-squared 0.055 0.040 0.043 0.178
Quadratic -0.0702 -0.134 -0.00562 0.0237(0.200) (0.157) (0.00809) (0.0377)
R-squared 0.058 0.040 0.044 0.185
Outcome Mean 0.580 0.263 0.035 0.170
Panel A contains impacts on Phase 2 districts during February 2006 and March 2007.During this period, Phase 1 received NREGS, and Phase 2 did not. The regressionscontain 3178 observations: 227 district-clusters (Phase 2 and Phase 3 districts) in 14months post-Phase 1 implementation and pre-Phase 2 implementation.Panel B shows the impact on Phase 2 districts during April 2007 and March 2008.During this period, Phase 2 also received NREGS. Regressions contain 2497 observa-tions: 227 district-clusters (Phase 2 and Phase 3 districts) in 11 months post-Phase 2implementation and pre-Phase 3 implementation.Controls include baseline averages of each dependent variable and police force changes.Unit of observation is district-month.“Affected Persons” indicates number of persons killed, injured, abducted or captured.“Fatalities” indicates total number of deaths. “Major Incidents” indicates number of‘Major Incidents’ as coded by the SATP website. “Total Incidents” is number of totalMaoist-related incidents.
44

Figure 1: Red Corridor Districts and NREGS Phase
Note: Red corridor districts are all districts that had at least one Naxalite incident in the 39 months of thedata used in this paper (January 2005-March 2008). All non-white districts are red corridor districts. Redcorridor districts predicted to receive NREGS in the first, second, and third phase based on the algorithmare in black, dark grey, and light grey, respectively.
45

Figure 2: Distribution of Index and Discontinuities by Phase
(a) Distribution of Index - Phase 1.
(b) Distribution of Index - Phase 2.
(c) Phase 1 Discontinuity.
(d) Phase 2 Discontinuity.
Note: The first row of figures plot the distribution of the index by each state. The second row of figuresshow the discontinuities in treatment for each phase. Negative and zero normalized state rank numbers aredistricts that should have received NREGS based on the government algorithm, whereas positive numbersare assigned to the districts that should have been ineligible according to the district ranking.
46

Figure 3: Discontinuities for Main Variables
(a) Total Number of Major Incidents.
(b) Total Number of Incidents.
(c) Persons Killed, Injured, Abducted orCaptured.
(d) Total Number of Persons Killed.
(e) Police Initiated Attacks.
(f) Maoist Initiated Attacks.
Note: The bin size for each figure is 1. Negative and zero normalized state rank numbers are districts thatshould have received NREGS based on the government algorithm, whereas positive numbers are assigned tothe districts that should have been ineligible according to the district ranking. The sample is restricted tothe time period post the NREGS implementation. A version of this graph without outliers can be found inthe appendix.
47

Figure 4: Monthly RD Coefficients - Total Number of Incidents
.
Note: Coefficients of month-by-month RD regressions of number of incidents. The first vertical line indicatesthe passage of the Act in Parliament, and the second vertical line indicates the first month of implementationin Phase 1. Our analysis ends 14 months after program implementation because Phase 2 districts startedimplementing NREGS at that point. Each point on the graph is coefficient for a different regression restrictingthe sample to the corresponding month.
Figure 5: Monthly RD Coefficients - Number of Persons Affected
.
Note: Coefficients of month-by-month RD regressions of number of persons affected. The first vertical lineindicates the passage of the Act in Parliament, and the second vertical line indicates the first month ofimplementation in Phase 1. Each point on the graph is coefficient for a different regression restricting thesample to the corresponding month.
48

A For Online Publication: Additional Tables and Fig-
ures
Figure A.6: Pre-Treatment Discontinuities for Main Variables
(a) Total Number of Major Inci-dents.
(b) Total Number of Incidents.
(c) Persons Killed, Injured, Ab-ducted or Captured.
(d) Total Number of PersonsKilled.
(e) Police Initiated Attacks.
(f) Maoist Initiated Attacks.
Note: The bin size for each figure is 1. Negative and zero normalized state rank numbers are districts thatshould have received NREGS based on the government algorithm, whereas positive numbers are assigned tothe districts that should have been ineligible according to the district ranking. The sample is restricted tothe time period before the first phase NREGS implementation. A version of this graph without outliers canbe found in the appendix.
i

Figure A.7: Discontinuities for Nonoutcome Variables at Baseline
ii
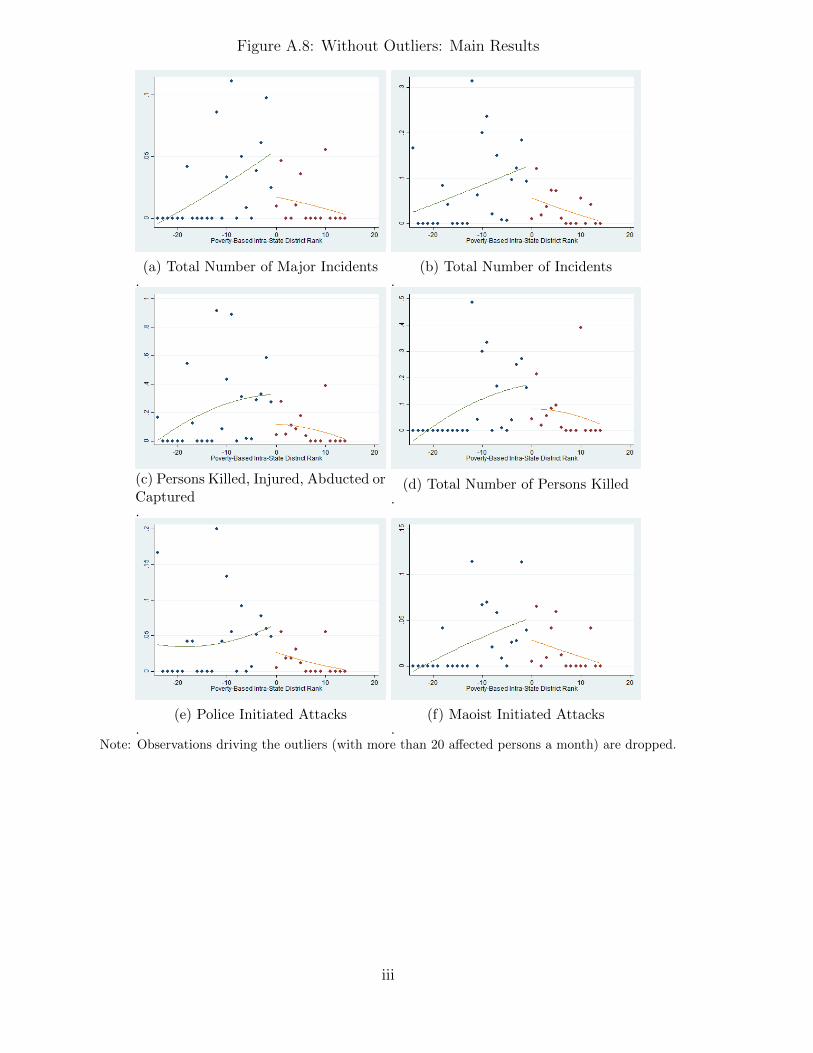
Figure A.8: Without Outliers: Main Results
(a) Total Number of Major Incidents.
(b) Total Number of Incidents.
(c) Persons Killed, Injured, Abducted orCaptured.
(d) Total Number of Persons Killed.
(e) Police Initiated Attacks.
(f) Maoist Initiated Attacks.
Note: Observations driving the outliers (with more than 20 affected persons a month) are dropped.
iii

Table A.9: Main Results: Without Biggest Incidents (Outliers)
Specification Affected Fatalities Major TotalPersons Incidents Incidents
Linear 0.373** 0.376** 0.0724** 0.173***(0.189) (0.166) (0.0286) (0.0637)
R-squared 0.320 0.311 0.202 0.358
Linear Flexible Slope 0.323** 0.344** 0.0553*** 0.145***(0.148) (0.169) (0.0211) (0.0551)
R-squared 0.321 0.312 0.207 0.364
Quadriatic 0.383** 0.460** 0.0795*** 0.162**(0.193) (0.205) (0.0299) (0.0657)
R-squared 0.320 0.309 0.199 0.360
Outcome Mean 0.580 0.263 0.035 0.170
Dropping outlier incidents - large attacks by Maoists or police that affect(kill/injure) more than 20 persons at a time. These eliminate the deadliest 11district-month observations. Robust to using other cutoffs. Controls include base-line averages of each dependent variable and police force changes. Unit of observa-tion is district-month. Regressions contain 3184 observations: 228 district-clusters(Phase 1 and Phase 2 districts) in 14 months post-Phase 1 implementation andpre-Phase 2 implementation.
iv

.Table A.10: Who Initiates the Attacks and Who is Killed (Per Capita)
Panel A: Who Initiates the Attacks
Specification Police Maoist Maoiston Maoist on Police on Civilians
Linear 0.975** 0.133 0.491**(0.412) (0.101) (0.227)
Linear Flexible Slope 0.741** 0.153 0.254(0.375) (0.107) (0.171)
Quadratic 0.779* 0.102 0.436**(0.424) (0.0957) (0.208)
Outcome Mean 0.578 0.329 0.753
Panel B: Who is Killed
Specification Civilians Police MaoistsKilled Killed Killed
Linear 0.531 -0.232 2.051***(0.716) (0.632) (0.755)
Linear Flexible Slope 0.358 -0.148 1.613**(0.561) (0.372) (0.763)
Quadratic 0.595 0.201 2.137**(0.706) (0.637) (0.897)
Outcome Mean 1.099 0.958 0.956
Results are per-10 million people (based on population counts from the 2001 Census). Panel Agives the results for ‘who initiates the attacks and against whom.’ Panel B shows the resultsfor ‘who is killed’. Controls include baseline averages of each dependent variable and policeforce changes. Unit of observation is district-month. Regressions contain 3192 observations: 228district-clusters (Phase 1 and Phase 2 districts) in 14 months post-Phase 1 implementation andpre-Phase 2 implementation.
v

.Table A.11: Other Types of Crime and Violence: Phase 1
total crimes murder kidnapping theft burglary riots
Linear 1,287 13.63 33.93 -30.27 -28.09 -107.2(945.6) (39.51) (30.07) (174.8) (93.75) (115.4)
R squared 0.943 0.778 0.820 0.910 0.882 0.774
Linear Flexible 754.8 28.72 28.70 -39.61 -68.79 -86.29(924.1) (35.76) (29.43) (189.1) (93.69) (107.9)
R squared 0.947 0.776 0.820 0.911 0.882 0.775
Quadratic 988.9 55.56 29.78 -36.06 -42.57 -122.9(1,134) (48.31) (34.59) (220.3) (115.3) (129.8)
R squared 0.945 0.771 0.820 0.911 0.882 0.772
Outcome mean 2768.17 57.23 38.10 325.04 122.18 105.36
Regressions contains 225 observations, where the unit of observation is a district.Source: Home Ministry of India
vi
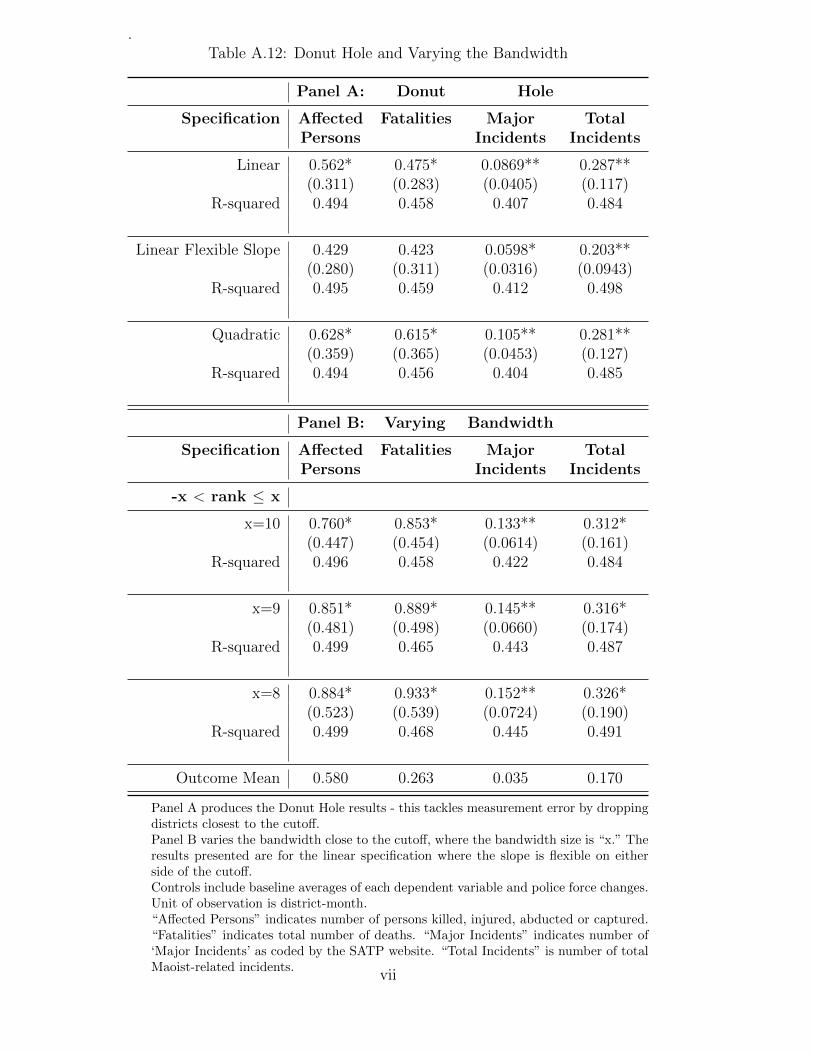
.Table A.12: Donut Hole and Varying the Bandwidth
Panel A: Donut Hole
Specification Affected Fatalities Major TotalPersons Incidents Incidents
Linear 0.562* 0.475* 0.0869** 0.287**(0.311) (0.283) (0.0405) (0.117)
R-squared 0.494 0.458 0.407 0.484
Linear Flexible Slope 0.429 0.423 0.0598* 0.203**(0.280) (0.311) (0.0316) (0.0943)
R-squared 0.495 0.459 0.412 0.498
Quadratic 0.628* 0.615* 0.105** 0.281**(0.359) (0.365) (0.0453) (0.127)
R-squared 0.494 0.456 0.404 0.485
Panel B: Varying Bandwidth
Specification Affected Fatalities Major TotalPersons Incidents Incidents
-x < rank ≤ x
x=10 0.760* 0.853* 0.133** 0.312*(0.447) (0.454) (0.0614) (0.161)
R-squared 0.496 0.458 0.422 0.484
x=9 0.851* 0.889* 0.145** 0.316*(0.481) (0.498) (0.0660) (0.174)
R-squared 0.499 0.465 0.443 0.487
x=8 0.884* 0.933* 0.152** 0.326*(0.523) (0.539) (0.0724) (0.190)
R-squared 0.499 0.468 0.445 0.491
Outcome Mean 0.580 0.263 0.035 0.170
Panel A produces the Donut Hole results - this tackles measurement error by droppingdistricts closest to the cutoff.Panel B varies the bandwidth close to the cutoff, where the bandwidth size is “x.” Theresults presented are for the linear specification where the slope is flexible on eitherside of the cutoff.Controls include baseline averages of each dependent variable and police force changes.Unit of observation is district-month.“Affected Persons” indicates number of persons killed, injured, abducted or captured.“Fatalities” indicates total number of deaths. “Major Incidents” indicates number of‘Major Incidents’ as coded by the SATP website. “Total Incidents” is number of totalMaoist-related incidents.
vii

.Table A.13: Intent-to-Treat (ITT) and Without Police Controls
Panel A: ITT
Specification Affected Fatalities Major TotalPersons Incidents Incidents
Linear 0.287** 0.270** 0.0470*** 0.124**(0.133) (0.123) (0.0176) (0.0499)
R-squared 0.489 0.445 0.393 0.480
Linear Flexible Slope 0.317* 0.309* 0.0486** 0.132**(0.166) (0.166) (0.0211) (0.0602)
R-squared 0.489 0.445 0.393 0.480
Quadratic 0.335** 0.348** 0.0578*** 0.129**(0.162) (0.161) (0.0215) (0.0594)
R-squared 0.489 0.445 0.393 0.480
Panel B: Without Police
Specification Affected Fatalities Major TotalPersons Incidents Incidents
Linear 0.559* 0.499* 0.0945** 0.240**(0.298) (0.280) (0.0394) (0.109)
R-squared 0.486 0.430 0.378 0.446
Linear Flexible Slope 0.541* 0.510 0.0806** 0.209**(0.310) (0.315) (0.0382) (0.106)
R-squared 0.486 0.429 0.381 0.452
Quadratic 0.721** 0.738** 0.121** 0.261**(0.362) (0.371) (0.0486) (0.133)
R-squared 0.485 0.425 0.371 0.442
Outcome Mean 0.580 0.263 0.035 0.170
Panel A shows the Intent-to-Treat impacts (the reduced form results). Panel Bshows the results without controlling for changes to the police force.Controls include baseline averages of each dependent variable. Unit of observation isdistrict-month. Regressions contain 3192 observations: 228 district-clusters (Phase1 and Phase 2 districts) in 14 months post-Phase 1 implementation and pre-Phase2 implementation.“Affected Persons” indicates number of persons killed, injured, abducted or cap-tured. “Fatalities” indicates total number of deaths. “Major Incidents” indicatesnumber of ‘Major Incidents’ as coded by the SATP website. “Total Incidents” isnumber of total Maoist-related incidents.
viii

.Table A.14: Non RD Specifications: Count Data and Difference-in-Differences
Panel A: Count Data
Specification Affected Fatalities Major TotalPersons Incidents Incidents
Linear 2.207** 2.443*** 2.552*** 1.619**(1.014) (0.881) (0.618) (0.760)
Linear Flexible Slope 2.125*** 2.306*** 2.108*** 1.105*(0.733) (0.634) (0.483) (0.596)
Quadratic 2.503** 2.466*** 2.204*** 1.368(1.066) (0.723) (0.551) (0.931)
Panel B: Difference in Differences
Specification Affected Fatalities Major TotalPersons Incidents Incidents
Intent-to-Treat 0.223* 0.108 0.0154 0.107**(0.132) (0.0982) (0.0103) (0.0512)
R-squared 0.428 0.395 0.359 0.478
Actual Treatment 0.303** 0.0970 0.0227* 0.0556**(0.151) (0.101) (0.0129) (0.0260)
R-squared 0.345 0.355 0.319 0.445
Outcome Mean 0.580 0.263 0.035 0.170
Panel A shows the results using a Count Data Model. The model used in this table is theZero-Inflated Poisson model, where the zeros are predicted using pre-treatment averages ofthe dependent variable. The results are very similar using Hurdle Models (Logit-Poisson).Panel B shows the Difference-in-Differences results. The Intent-to-Treat results assignstreatment status to districts who should have received NREGS, whereas the ‘Actual Treat-ment’ row assigns treatment status to districts that actually received NREGS.Controls include baseline averages of each dependent variable. Unit of observation is district-month. Regressions contain 3192 observations: 228 district-clusters (Phase 1 and Phase 2districts) in 14 months post-Phase 1 implementation and pre-Phase 2 implementation.“Affected Persons” indicates number of persons killed, injured, abducted or captured. “Fa-talities” indicates total number of deaths. “Major Incidents” indicates number of ‘MajorIncidents’ as coded by the SATP website. “Total Incidents” is number of total Maoist-related incidents.
ix

B A Citizen-Support Model
We set up a theoretical model that incorporates the importance of citizens assisting thegovernment by sharing information, although in practice this can also include other forms ofassistance. While there are some models that stress the importance of citizen support, suchas the models in Berman, Shapiro and Felter (2011) on counterinsurgency in Iraq and theAkerlof and Yellen (1994) study on street-gangs, our model differs from those in a number ofrespects that fit our context better. First, we allow insurgents to fight for territory, whereasthe rebels’ goal in the Berman, Shapiro and Felter model is only to impose costs on thegovernment. Second, in our model civilians make their information-sharing decisions beforerather than after the government and the insurgents move. Lastly, we consider how aggregateviolence patterns may change dynamically.
The model describes the optimal strategies in the conflict by three players, the govern-ment, the Maoists, and the civilians. In the Indian context, the employment guarantee schemewas implemented across the country and prioritized poor districts regardless of their internalsecurity condition in the assignment algorithm. Therefore, the decision about whether, andif so, how much, to invest in anti-poverty programs like an employment guarantee scheme istaken to be exogenous.55 There are L identical locations in the country where the govern-ment fights for territorial control with the insurgents. In each location, the probability thatthe government gains control of the territory p(m, v, i), depends positively on the amount ofgovernmental military action m, negatively on the amount of Maoist violence inflicted uponthe police v, and positively on the amount of information that the police has i.
Civilians (C) first choose how much information i to share with the government to max-imize their expected utility
EUC = b(i) − cC(r(i)) + p(m, v, i)u(yG + g) + (1 − p(m, v, i))u(yN) (1)
where b(i) is the utility derived from the benefits of sharing information with the govern-ment, which may include both monetary and non-monetary components.56 cC(r(i)) measuresthe disutility from sharing information because Maoists may retaliate against civilians forsharing information based on a known retaliation function r(i). yG and yN are the benefitscivilians receive when their location is under government control or Naxalite control at theend of the period, respectively, and u(.) is the utility function for these benefits. g is the extrabenefit to citizens from governmental programs like an employment guarantee scheme.57
Overall, civilians therefore take into account both costs and benefits that arise directlyfrom providing assistance to the government and the benefits provided by whoever is in powerat the end of the period, which is also influenced by the level of information.
55In other contexts, a number of economic and political economy factors will enter the government’sobjective function in addition to anticipated internal security benefits.
56The results are not sensitive to the order of moves as long as the rebels and the police move simultaneously,and the government expenditure is decided on before the civilians move. The order used in this model isrelated to the context - where civilians first decide on providing tip offs to the government, and the policethen act on the information.
57While some of the literature like Kalyvas (2006) sees territorial control as a precondition for collaboration,our model is built on the idea that the expected benefits from future territorial control by the governmentmay induce civilians to support the government in the fight against insurgents. This support will be low if theprobability of government control is very low, consistent with the idea that it is difficult for the governmentto receive citizen support if its position in the conflict is weak.
x

After civilians have made their decision, government troops and the insurgents simulta-neously decide on their actions. The police (G) decides how much military action m to takeagainst the Maoists to maximize the expected utility
EUG = p(m, v, i) − cG(m) (2)
For simplicity, the government’s expected utility from territorial control is assumed toequal the probability p(.) that the government gains control, whereas the disutility frommilitary action is given by cG(m).
At the same time, the Naxalites (N) determine how many attacks v to plan against thegovernment, maximizing their expected utility
EUN = [1 − p(m, v, i)] − cN(v) (3)
where cN(v) are the costs incurred from violence level v and 1 − p(.) is the probabilitythat the Maoists will be in control of the location at the end of the period. Additionally,the Maoists retaliate against civilians for working as police informers, where retaliation r(i)increases with the amount of information and assistance provided to the police.58
Together, the decisions by government actors and insurgents determine the level of vio-lence in a given location and the endogenous probability that the government gains territorialcontrol. At the end of the period, a location either becomes controlled by the government orremains contested, and payoffs are realized. In the next period, the process is repeated in alllocations that remain contested, whereas there is no further violence in government-controlledareas. Cost functions cC(.), cG(.), and cN(.) are increasing and convex.
The model can be solved by backward induction to find the pure-strategy subgame perfectNash equilibrium. Once civilians have decided on the amount of information i* to share withthe government, the government maximizes its expected utility, taking i* and the violencelevel v chosen simultaneously by the Maoists as given. The first-order condition of (2) istherefore given by
∂p(m, v, i∗)
∂m− c′G(m) ≤ 0 (4)
This equation pins down the best response function of military action m* for everypotential violence level v chosen by the insurgents. Since cG(.) is convex in m whereas p(.) isconcave in m, a unique maximum exists according to the Intermediate Value Theorem thatsatisfies the second-order conditions.
Similarly, the first-order condition for the Maoists is given by
−∂p(m, v, i∗)∂v
− c′N(v) = 0 (5)
which implicitly traces out the best-response function of v* for every potential governmentviolence level m. Assuming that p(.) is decreasing and convex in v, this once again satisfiesthe second-order conditions.
In equilibrium, both actors make correct predictions about the level of violence chosen bythe other player, leading to a Nash equilibrium in each subgame given the level of i∗ where
58The retaliation is used to prevent further sharing of information, which is something that is not capturedin this one-period model. It is also possible to model retaliation as a decision taken simultaneously with thecivilian’s information sharing in order to capture the value of the ‘threat’ of retaliation.
xi

the best-response functions for the two players intersect. Assuming that pmv = pvm < 0,59
it can be shown that dm∗dv
< 0 and dv∗dm
> 0 using the Implicit Function Theorem, whichguarantees the existence of a unique Nash equilibrium.
We assume that government military action is more effective with access to more infor-mation pmi > 0, while more information could make Maoist attacks against the police lesseffective pvi ≤ 0. This, in turn, implies that according to the Implicit Function Theoremdm∗di
> 0 and dv∗di
≥ 0, so more shared information by the civilians leads to higher levels ofviolence by both conflict parties.60
Civilians decide how much information to share with the government at the beginning ofthe period, knowing the best response and equilibrium violence-level functions, which leadsto the first-order condition
b′(i) − cC(r(i)) +dp
di[u(yG + g) − u(yN)] ≤ 0 (6)
where dpdi
= ∂p∂m
dmdi
+ ∂p∂v
dvdi
+ ∂p∂i
.61 By the implicit function theorem, di∗
dg=− dp
diu′(yG+g)
SOC> 0.
This implies that civilians will assist the police with more information or assistance whenthey receive governmental programs like NREGS.62
As discussed above, a higher level of shared information increases m∗ and v∗. Additionally,Naxalites also retaliate more against civilians since r(i) is increasing in i. This means thatoverall violence in a given location rises after the introduction of the government program,and the impact will be greater for districts that do a better job of implementing the program.
The equilibrium decisions by civilians, insurgents and the government determine the prob-ability p∗ that the government will gain control in a given location, or district, at the end ofthe period. Since all locations are identical, in expectation the number of contested territories`t will decrease over time according to the relationship
`t = (1 − p∗)`t−1 (7)
After the conflict has lasted τ periods, the number of contested location is therefore: `τ =(1− p∗)τ`0. Given the simplifying assumption in this model that violence in a location stopsonce the government gains control, the number of territories decreases over time until thewar ends in period T when `T = 0.
The improved information flow increases the equilibrium probability that the governmentgains control in a location, which will speed up the end of the conflict. With a highergovernment success probability more locations will fall under government control in a periodthan before, leading to the fewer contested territories in the next period. While violence ina given location has gone up, this effect means that the aggregate violence, averaged acrosslocations, will fall over time as the government wins the war more quickly than it otherwise
59Intuitively, a given actor’s effectiveness of violence on control over a location becomes lower the higherthe violence of the other conflict party.
60For the police, the military action is complementary to the amount of information, and thus increaseswith more information. The rebels, however, fight harder to hold on to territory that is slipping away.
61Assistance and information increases the probability of police control if ∂p∂m
dmdi + ∂p
∂i > −∂p∂v
dvdi .
62While the police force in practice largely consists of local officers whereas NREGS is a national program,implementation quality largely depends on local institutions. Zimmermann (2013b) finds, for example, thatboth the government parties as well as local incumbents regardless of party affiliation benefit from NREGSin areas where the program is implemented well in the 2009 general elections. This suggests that the peopleare aware that local institutions and personnel matter.
xii

would have.Overall, the model therefore generates a number of testable predictions about the impact
of a government program like NREGS on the incidence of conflict. First, the introductionof NREGS increases insurgency-related violence in the short-run. In the longer run, violencefalls. Second, the program increases the government’s effectiveness in tracking down insur-gents, so there are more police-initiated attacks. This also implies that insurgents should bemore likely to die or to be injured/captured than before. Furthermore, civilians may be moreaffected by violence if the Maoists retaliate against them for sharing information.
xiii