Embed Size (px)
Citation preview
Gunneb
o Annual R
eport 2019
The Gunnebo Group operates worldwide providing innovative products,
software and services to control the flow of valuables, cash and people.
Gunnebo offers entrance control, safe storage, cash management and
integrated security solutions to customers primarily within retail, mass
transit, public & commercial buildings, industrial & high-risk sites and
banking. The Group has a turnover of MSEK 5,500 and is listed on
NASDAQ Stockholm.
Gunnebo Annual Report 2019
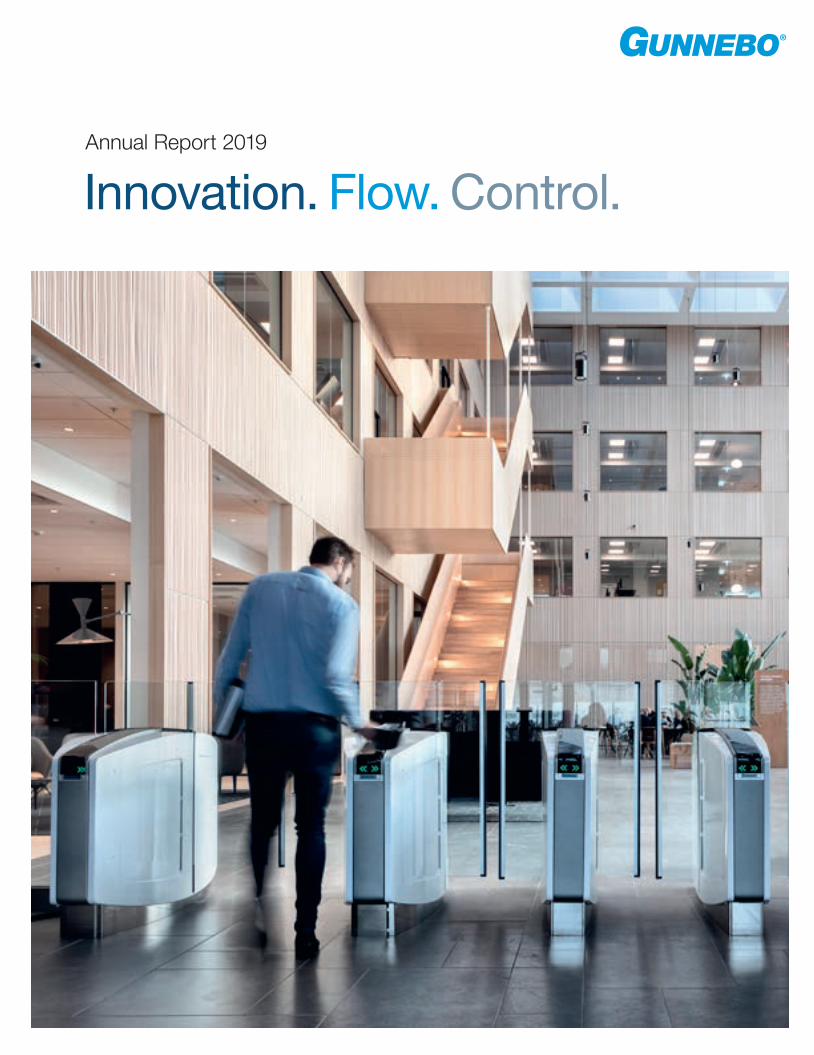
Innovation. Flow. Control.Annual Report 2019
The Gunnebo Group 2019 in Brief 2
Brands 2
Comments by the CEO 4
Strategy 6
Business Model 8
Targets and Performance 10
Offering 12
Business Unit Entrance Control 14
Business Unit Safe Storage 18
Business Unit Cash Management 22
Business Unit Integrated Security 26
Risk Management and Sensitivity 30 Analysis
Corporate Governance 34
Group Executive Team 41
Board of Directors 42
Sustainability Report 2019 44
Financial Statements 52
Consolidated Income Statements 54
Consolidated Statements of 54 Comprehensive Income
Consolidated Balance Sheets 56
Consolidated Statements of Cash Flow 58
Consolidated Statements of Changes 60 in Equity
Notes – Consolidated Financial Statements 61
Parent Company 79
Parent Company Income Statements 79
Parent Company Statements of 79 Comprehensive Income
Parent Company Balance Sheets 80
Parent Company Statements of Cash Flow 81
Parent Company Statements of Changes 82 in Equity
Notes – Parent Company 83
Proposed Distribution of Earnings 86
Proposed Policy for Remuneration to 87 Senior Executives
Auditor’s Report 89
Capital Market Information for the Capital Market 92
The Gunnebo Share 94
Other Seven-Year Review 96
Reconciliation of Key Performance Measures 98
Definitions 100
Contact Details 101
Unless otherwise stated, text and numbers refer to continuing operations.
Contents
This document is essentially a
translation of the Swedish
language version. In the event of
any discrepancies between this
translation and the original
Swedish document, the latter
shall be deemed correct.
The Annual Report
The Board and CEO of Gunnebo AB
(publ), company registration number
556438-2629, hereby submit the
Annual Report and consolidated
accounts for the 2019 financial year.
The Annual Report is presented on
pages 2, 8–11, 30–40 and 44–88.
The Annual Report has been audited
by Gunnebo’s auditors.
See the Auditor’s Report on pages
89–91.
The Sustainability Report, examined
by the auditors, can be found on
pages 44–51.
The Corporate Governance Report,
examined by the auditors, can be
found on pages 34–40.
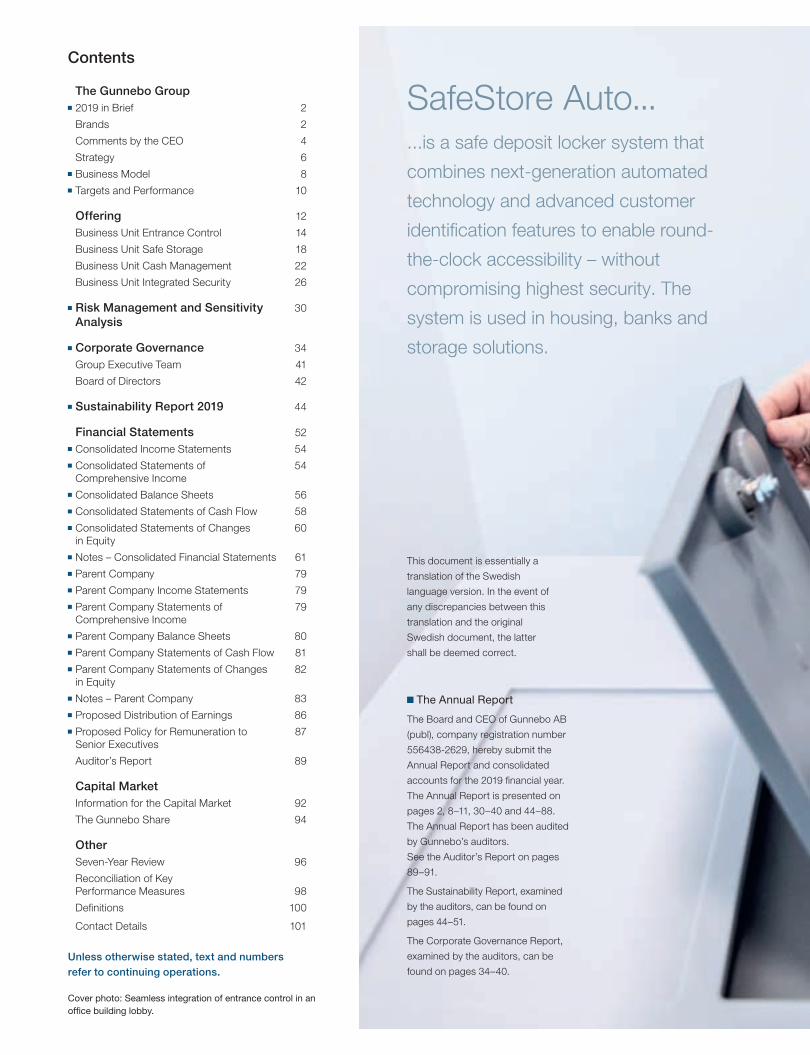
Cover photo: Seamless integration of entrance control in an office building lobby.
SafeStore Auto......is a safe deposit locker system that
combines next-generation automated
technology and advanced customer
identification features to enable round-
the-clock accessibility – without
compromising highest security. The
system is used in housing, banks and
storage solutions.

Innovation. Flow.
Control.The Gunnebo Group’s Business Units are missioned to support their customers by delivering innovative products, software and services to better control the flow of valuables, cash and people.
Entrance Control shapes the future of people flow management and advances the way public and private buildings control access and flow by creating innovative passage barriers and detection systems for a more intuitive and secure user experience.
Safe Storage develops innovative solutions for the protection of valuables at home, in transit and at work and helps businesses and people control access to those valuables more effectively.
Cash Management creates an efficient and secure flow of cash for retailers, banks and CIT companies by delivering smart solutions which automate cash handling and optimise the cash cycle.

Financial Highlights• Order intake amounted to MSEK 5,485
(5,218), an increase of 5% (2% in con-stant currencies) year-on-year
• Net sales amounted to MSEK 5,459 (5,128), a growth of 6% (3% in constant currencies) year-on-year
• EBITA amounted to MSEK 321 (334) and the EBITA margin to 5.9% (6.5)
• Items affecting comparability (IAC) amounted to MSEK –91 (–29)
• Operating profit (EBIT) amounted to MSEK 192 (265)
• Free cash flow amounted to MSEK 197 (124) and free cash flow per share amounted to SEK 2.41 (1.62)
• A dividend of SEK 0.00 per share (0.50), is proposed
Business Highlights• The Business Unit structure fully im-
plemented. With this, the regional or-ganisation structures ceased to exist at year-end 2019.
• Cost-efficiency programme launched in July and implemented according to plan, full effect from half year 2020
• Acquisition and integration of Czech entrance control company, Cominfo
• Rights issue of some MSEK 360 completed in Q3
• Strategic overview of business oper-ations within Business Unit Integrated Security
• New President & CEO in November and a new, leaner Group Executive Team as of 1 January 2020
2019 2018
Net sales, MSEK 5,459 5,128
EBITA, MSEK 321 334
EBITA, % 5.9 6.5
Amortisation and impairment from acquisition related intangibles –47 –40
Items affecting comparability (IAC) –91 –29
EBIT 192 265
Net profit 45 120
Earnings per share, SEK 0.55 1.57
Free cash flow 197 124
Net debt/EBITDA, times 3.0 3.5
Dividend per share (*proposed), SEK 0.00* 0.50
Key Ratios
www.gunnebo.com
www.chubbsafes.com
www.gunnebogateway.com
www.sallen.es
www.rosengrens.com
www.steelage.com
www.hamiltonsecuritysolutions.com
www.elkosta.com
www.cominfo-trade.com
www.minimax.co.in
Ten Strong Brands
2019 in Brief

SafeDeposit and Closed Cash Handling......combined here on MSC cruise ship, the Grandiosa, as
a solution for efficiently and securely managing the cash
used to charge special payment cards.

4
Gunnebo Annual Report 2019 / The Gunnebo Group
During the year, we demonstrated our ca-pability in several complex projects. Within Entrance Control to airports and high-risk sites and within Cash Management to cash-in-transit companies around the world. We have also started to optimise the go-to- market model which for Safe Storage has resulted in a shift from direct to indirect sales in important markets in Europe.
The new organisational structure was finalised and implemented while we contin-ued to develop our business and offerings. Feedback from our customers on the new organisation has been positive, and employ-ee surveys show increased engagement from our employees. During the year we implemented and integrated the acquisition of Cominfo into Business Area Entrance Control. In July 2019 we also launched a
cost-efficiency programme, which is now being realised according to plan and will take full effect from the second half of 2020. In addition, we carried out a rights issue, which contributed some MSEK 360 in the third quarter. When I assumed the role of President & Group CEO in November I pre-sented a leaner, more focused management team to lead the Group into the future.
Comments by the CEO
A Year of Change to Build a Stronger Gunnebo
Today, Gunnebo consists mainly of the three Business Units Entrance Control, Safe Storage and Cash Management. All have a global footprint with capacity to deliver complex solutions to satisfy the needs of customers, both large and small.

5
Performance
For the full year, we had a sales growth of 3% in constant currencies, and an EBITA in line with last year resulting in a margin of 5.9%. Even if this is far from satisfactory, it is still a decent result, considering all ongoing chang-es. We ended the year with a net debt/EBITDA of 3.0, an improvement of 0.5 compared to last year, and generated a strong free cash flow of MSEK 197 mainly due to focus on our working capital.
Development by Business Unit
Entrance Control had a strong year with an increase in net sales of 21% in constant currencies. The integration of Cominfo goes according to plan, and the expected syner-gies have been confirmed.
Safe Storage reported 6% sales growth in constant currencies. As part of the cost- efficiency programme, the Business Unit will address the cost structure in Europe. Safe Storage has begun its journey to change its route-to-market in Europe to a partnership model. In parallel, market testing of new, innovative products aimed at driving growth is now ongoing in several customer seg-ments. We expect some of these projects to already contribute to sales in 2020.
Cash Management had a challenging year where net sales contracted by 9% in con-stant currencies. However, a stronger cost focus and launch of several new products have set the stage for increased sales and improved margins ahead.
Integrated Security is a portfolio of local business operations that closed a weak 2019 with a 6% decline in net sales in constant currencies. Profitability improved over the year due to cost actions, but has not reached a satisfactory level. In the ongoing strategic
review, customer and product synergies with other Business Units have been identified. To capture these synergies, some 20% of the Integrated Security business operations will be merged into Safe Storage and Entrance Control as of 1 January 2020. At the same time, the Business Unit will change name to Other Business, which better reflects the
Business Unit’s diversified operations. The new reporting structure and historical key ratios will be presented in the first quarter of 2020. The strategic review of the remaining business operations in Other Business will continue during 2020.
Engaged and Motivated Employees
2019 has been a year of change where all employees in the European sales organisa-tion adapted to new ways of working in the Business Unit organisation. During the fourth quarter we took the last step and convert-ed Asia-Pacific, Middle East & Africa and Americas into the Business Unit structure. To do this change – and still manage to keep the momentum of sales growth – is a true achievement. A big thank you to our 4,200 employees who have been very positive driving forces in making this change happen!
In Focus 2020
As newly appointed President & CEO, I can see how Gunnebo’s employees, products, brand portfolio, sustainability agenda and international market presence will allow us to further strengthen our customer service and grow our sales while improving profitability in the coming years. We are active in exciting
market segments and geographic markets with an annual growth rate ranging from 3% to 6%. The Cominfo acquisition shows Gunnebo’s capability to further strengthen our market position through strategic ac-quisitions. While addressing cost levels, we continue investing in customers and innova-tion – the keys to long-term growth.
I am convinced that both our customers and other stakeholders will start to see posi-tive effects of the change during 2020. I look forward to leading Gunnebo going forward, together with the executive team and the Group’s employees, with our target set on profitable growth.
Finally, I would like to thank all our share-holders, customers and business partners for your trust and valuable contribution during our change journey, and to Gunnebo’s continued development.
Gothenburg, March 2020Stefan Syrén, President & CEO
Our employees, products, brand portfolio, sustainability agenda and international market presence will allow growth

6
Gunnebo Annual Report 2019 / The Gunnebo Group
Group Strategy & Main Initiatives 2019
2019 has to a large extent been about implementing the strategic plan that was established in 2018. Following a thorough review of the Group’s business where the end customer and product offering were put in the centre, certain non-core businesses were divested. This was followed by the launch of a new way to drive and govern the business, through a new customer-centric organisation built by product offering in Business Units.
All Business Units are managed according to the same governance model, where each Business Unit has the strategic responsibility and full accountability for their respective val-ue chains – from identifying customer needs to service as well as the full profit and loss responsibility. Clear customer focus and the decentralised ownership by Business Unit will enable Gunnebo to drive profitable growth.
Read more on pages 12-29 about each Busi-ness Unit.
The Security Market
Development and growth in the global secu-rity market comes from increased needs for security and protection, urbanisation, devel-opment of infrastructure, increased wealth and higher standard of living, technology-
driven growth and connectivity as well as compliance with legislation and regulations.
To capture the market growth generated from these global trends, the Business Units Entrance Control, Safe Storage and Cash Management will adapt product offerings to the customers’ specific needs and optimise value chain through tailored go-to-market models. Business Unit Integrated Security is made up of a number of local businesses, each with its own market conditions having their own strategic direction.
Group Strategic Priorities and Outcome 2019
The Group has identified four overarching strategic priorities, which the Business Units’ strategies aim to fulfil:
Shareholder valueBy delivering sustainable, profitable growth, Gunnebo shall deliver value for its share-holders through dividend payments and increased shareholder value. Outcome 2019: After the introduction of the customer-centric organisation, Gunnebo is ready to deliver the next phase of its devel-opment. The Group will to a greater extent develop new customer offerings and take
advantage of the opportunities offered by acquisitions and divestments.
With this in mind, and considering that the company completed a new share issue of some MSEK 360 in 2019, of which MSEK 250 has been used for acquisitions, the Board estimates that a continued strength-ening of the Group’s balance sheet will increase the company’s ability to act in the coming year. The Board therefore proposes a dividend of SEK 0.00 (0.50) per share for the financial year 2019. This divergence from the long-term dividend policy should be regarded as temporary.
Satisfied customersBy providing products, services and soft-ware giving peace of mind, Gunnebo shall strive to exceed customer expectations.
Gunnebo is measuring customer satisfac-tion in different ways, per Business Unit and geography.
Engaged employeesGunnebo shall provide its employees with opportunities to develop personally and professionally.Outcome 2019: In the fourth quarter of 2019, the Group conducted a new em-ployee engagement survey. One of the key
Gunnebo’s strategy is to develop products and solutions to create a safer world by delivering innovative products, software and services to better control the flow of valuables, cash and people.
1995
Gunnebo Industries is acquired by HIDEF, a venture capital company
founded by the Swedish government in 1991. HIDEF changes its name
to Gunnebo AB and is listed on the Stockholm Stock Exchange for the
first time. The new company focuses on delivering security solutions
globally.
1995–2005
Acquisitions
Gunnebo AB enters into an expansive decade and
acquires almost 50 companies from around the world, the
majority of which specialise in security solutions.
2005
Gunnebo Industries, at the time the Gunnebo Engineering division, is distributed to Group’s shareholders and is
listed on the Stockholm Stock Exchange.
Historical TimelineThe name Gunnebo comes from the village of Gunnebo in eastern Småland, a province in southern Sweden, where, in 1764, Hans Hultman opened a forge and started to produce nails and chains. This relatively limited business grew steadily until Gunnebo Bruks Nya AB was founded in 1889, which had several metalworking factories. Gunnebo Bruks Nya AB later became known as Gunnebo Industries.

7
2016–2018
Profitable Growth
Gunnebo begins the implementation of the strategy for profitable growth, aiming at
shifting the Group into an operating company with global processes, standardised and lean ways of
working, customer focus, as well as a good profitability and cash
flow focus.
2006–2008
Integration
Gunnebo AB begins the process of integrating the
acquisitions made over the previous 12 years.
2009–2015
Footprint Extension
The overriding vision, “To be the leading global provider of a safer future”, is defined for the Group. Following the establishment of a
sales company in China in 2010, the Group continues to develop its market presence in growth markets through the establishment or acquisition of Gunnebo Brazil (2011), Gunnebo Malaysia (2012), Hamilton, United
States (2012), Gunnebo South Korea (2013) and Sallén, Spain (2015).
metrics – employee engagement – shows an improvement compared to the global survey done in 2017. This signals that, despite orga-nisational changes due to the implementa-tion of a Business Unit structure, employees welcome simplified ways of working, clear responsibilities and a stronger platform for personal development and performance.
Sustainable businessGunnebo shall drive sustainable and ethical business activities throughout its value chain.Outcome 2019: Since the base-year 2016, a majority of the non-financial targets have been developing in the right direction. How-ever, it is already now clear that the Group will not achieve all targets at year-end 2020. During 2020, the non-financial targets will be reviewed and activity plans for further devel-opment of the sustainability agenda will be communicated.
Read more about sustainability on pages 44–51.
Strategic Activities in 2019Business unit structure implemented
The transformation of Gunnebo into a Group with customer focus by product offering in Business Units started mid-2018 with embedding the European sales companies into the Business Unit structure. In a second step, during second half of 2019, the sales
companies in Region Asia-Pacific, Middle- East & Africa and Region Americas were em-bedded into the Business Unit organisations. With this, the regional organisation structures ceased to exist at year-end 2019.
Acquisition of Cominfo s.a.Gunnebo announced the closing of the ac-quisition of Czech Entrance Control compa-ny, Cominfo, on 2 July. The acquisition is in line with the Group’s strategic agenda and is further strengthening Business Unit Entrance Control. Cominfo is a very good strategic fit for Entrance Control since it extends the geographical footprint and product offering. Moreover, there are synergies within produc-tion and R&D.
Cominfo has an annual sales of some MSEK 140 and a profitability in line with Entrance Control. The acquisition has been consolidated into the Group’s accounts as of the third quarter 2019.
Cost-efficiency programme launchedWith the Business Unit structure implement-ed, Gunnebo will have a leaner end-to-end business model. The speed of change was accelerated in July, when the Group an-nounced a cost-efficiency programme that will generate annual cost savings of some MSEK 100, with full effect from half year 2020. The programme will bring non-recur-
ring charges of some MSEK 60 where the majority, MSEK 53, has been taken in 2019.
The programme comprises a mix of over-head reductions in Europe, mainly within the Business Units Safe Storage and Integrated Security as well as management changes in the Group Executive Team and the disman-tling of regional structures in Asia-Pacific and the Americas as of year-end.
Rights issueAt an extraordinary general meeting in Au-gust, the Group’s shareholders approved the Board of Director’s resolution on a rights issue of some MSEK 360, which was over-subscribed and successfully closed at the end of September. The capital was used for the acquisition of Cominfo s.a. and to further improve the net debt.
New President and CEOIn November, Henrik Lange, who had been President and CEO of the Group since June 2015, handed over the leadership to Stefan Syrén. Stefan took up the position as Presi-dent and CEO in addition to his responsibili-ties as SVP Business Unit Safe Storage and SVP Business Unit Integrated Security. Robert Hermans was appointed Executive Vice President alongside his role as SVP Entrance Control.
2018–
Focus on Customers
Implementation of the profitable growth strategy continues. By year-end 2018, the measures had
led to a transition to a customer-centric focus built around the product offering. As a result,
the Group’s operations in France, Belgium and Luxembourg were divested during 2018. The
strategy also led to new financial targets and the implementation of a new organisational structure
by product offering in Business Units. In July 2019, the entrance control company Cominfo
a.s. was acquired as part of the strategy to grow the Business Unit Entrance Control.
Vision. Be a leading global
provider of a safer future.Mission. Create a safer world.

8
Gunnebo Annual Report 2019 / The Gunnebo Group
Market Drivers Strategy Execution in Business Units
Market drivers provide input to the Business Unit strategies and offerings. They help clarify where value can be created and generate business opportunities. The following under-lying market drivers are common denominators for all four Business Units and support continued long-term growth in the security industry:
Gunnebo’s strategy is to develop solutions to create a safer world. This is done by delivery of innovative products, software and services to better control the flow of valuables, cash and people.
By delivering on this strategy, value is created for the Group’s stakeholders:
• Shareholder value • Satisfied customers
• Engaged employees • Sustainable business
Business ModelGunnebo’s business model identifies the underlying market drivers that form the basis for creating focused strategies by Business Unit. By delivering on these strategies, value is created for the Group’s stakeholders.
Entrance ControlMission: Provide inno-vative entrance control systems designed for an intuitive user experience.
Vision: Shape the future of people flow manage-ment.
Increased Security Awareness
The threat from terrorism has led to increased de-mand for security, particularly at public and comm-ercial sites. People are also more conscious about personal safety and security, and of those close to them.
Urbanisation
A growing proportion of the global population live in cities. Both the size and population of urban areas are increasing.
Development of Infrastructures
Urbanisation is leading to an expansion of inner-city infrastructures and greater demand for better transportation networks.
Increased Wealth and a Higher Standard of Living
Just as the global population is growing so is the middle class, particularly in fast developing countries.
Technology-driven Growth and Connectivity
As the Internet of Things begins to create real value for customers, previously unconnected security products are becoming intelligent and provide access to data which can be utilised to improve business efficiencies.
Compliance With Legislation and Regulations
As new regulations come into force to tackle security issues on a national, regional and international level, sites must improve security to ensure compliance.
Safe StorageMission: Protect valuables and to provide peace of mind at home, in transit and at work.
Vision: Become the number one protector of v aluables in selected markets through industry leading innovation.

9
Stakeholder Value CreationStrategy Execution in Business Units
The Business Units’ strategies individually lay out the priorities and activities that will ensure fulfilment of the Group strategy.
By creating Business Units by product offering – designed by customer needs and go-to-market model, they can develop spec- ific offerings for their respective customer segments. This is how Gunnebo will win in the marketplace.
Our Business
Shareholders
The profits the Group generates is for the benefit of its shareholders through dividend payments and increased share value. Dividend: MSEK 38
Customers
The Group’s revenues represent the market value of the value Gunnebo delivers to its customers. Turnover: MSEK 5,459
Suppliers
Through building strategic supplier partnerships throughout the value chain, the Group supports job creation beyond its own business. Cost of material, transport, vehicles, travel and other costs: MSEK 3,196
Creditors
A long-term sustainable net debt/EBITDA ratio and improved profitability allow for strong, long-lasting relationships with financing partners. Cost of credit facilities and interest: MSEK 66
Our PeopleEmployees (4,256)
The Group works to ensure a motivated, engaged and accountable workforce by providing personal development and opportunities to grow professionally within the orga-nisation. This enables employees to deliver value-added offerings to the Group’s customers. Remuneration and social security charges to employees, subcontractors and consultants: MSEK 1,817
Our ImpactSociety
The Group is committed to creating a sustainable and ethical business which strives to minimise its impact on the environment. Income taxes paid: MSEK 115
Cash ManagementMission: Be the experts in the complete payment cycle providing cost- effective and secure solu-tions through innovative business models.
Vision: Lead and co- develop the future cus-tomer payment cycle by offering best-in-class up-time and peace of mind.
Integrated SecurityIntegrated Security is made up of a number of local businesses.
The strategy for each business is to achieve the Group’s target for profitability and growth.

10
Gunnebo Annual Report 2019 / The Gunnebo Group
Targets & PerformanceGunnebo’s targets are those that the Board and the Group Executive Team deem to be most relevant to ensure profitable growth and the development of a sustainable business.
Non-Financial Targets 2020Gunnebo’s non-financial targets were adopted in 2016, with 2016 as base. The targets support sustainable, profitable growth. By taking a long-term approach to sustainability, with clearly defined targets ensures that Gunnebo’s 4,200 employees create a sustainable, attractive offering for the Group’s customers and partners resulting in value for the shareholders.
Read more about Sustainability on on pages 44–51.
Target 2020 Aggregated Outcome 2016–2019
Environment Energy & Climate
Reduce the use of electricity at manufacturing units and major sales units
-8% +0.3%
Reduce CO² emissions from manufacturing units and sales units -15% -2.5%
Reduce CO² emissions from own fleet on average -20% -4.6%
Waste
Increase recycling from non-hazardous waste in production
+8% +0.3%
Environmental Management
All manufacturing units ISO 14001 certified 100% 89%
Supply Chain All major suppliers comply with the Group’s Code of Conduct 100% 93%
Occupational
Health
All manufacturing units OHSAS 18001 or ISO 45001 certified 100% 78%

11
Financial Targets
Sales GrowthWith focus on the Business Units, the Group is struc-tured to capture growth in the market
5% 3%
ProfitabilityEBITA target defined by Busi-ness Unit ensures dedicated focus on driving improve-ments
>10% 5.9%
Net Debt/EBITDAA level of less than 2.5 will ensure the Group’s long-term financial strength
<2.5 3.0
Gunnebo’s financial targets* focus on profitable growth that will contribute to a good return for the company’s shareholders.* For definitions of the financial targets, please see page 100.
Target Outcome 2019
%
–6
–4
–2
4
0
2
6
–8
2019201820171 2 3 4 1 2 3 4 1 2 3 4
400
600
800
1,400
1,000
1,200
1,600
MSEK
Sales Sales growth 12M, %
200
40
60
80
140
100
120
160
180
%
EBITA EBITA %EBITA % 12M
20
2
3
4
7
5
6
8
9
1
2019201820171 2 3 4 1 2 3 4 1 2 3 4
MSEK
%
2
1
4
3
5
2019 1)201820171 2 3 4 1 2 3 4 1 2 3 4
400
800
1,600
1,200
2,000
MSEK
Net debt Net debt/EBITDA1) Net debt includes the effect of IFRS 16 Leases effective from 1 January 2019.
Comparative figures have not been restated.

12
Gunnebo Annual Report 2019 / Offering
OfferingThe Gunnebo Group is a global provider of security solutions where the offering is focused on four Business Units: Entrance Control, Safe Storage, Cash Management and Integrated Security.
Protecting valued items from burglary, fire and explosion
Controlling and regulating access at key entry points
Safe Storage
Entrance Control
37%
24%
of Group sales
of Group sales

13
Each business to achieve the Group’s target for
profitability and growth
Creating an efficient and secure cash cycle
Integrated Security
Cash Management
20%
19%
of Group sales
of Group sales

14
Gunnebo Annual Report 2019 / Offering
Business Unit
Entrance Control
Gunnebo provides a wide range of entrance control gates including tripod turnstiles, speed gates, full-height turnstiles and security revolving doors to regulate the flow of people into, out of and around a site such as office buildings and high-risk sites. The offering also includes solutions specifically designed for metro and railway ap-plication (ticket validation gates) and airports (passenger process automations such as automated boarding, anti-return, immigration and pre-security gates). Moreover, Gunnebo also provides high-security outdoor perimeter protection solutions in cer-tain geographical areas.
The Global Market for Pedestrian Entrance Control
The market for pedestrian entrance control has an estimated CAGR market growth of around 5% up to 2023, in a market that has a value of BSEK 7.5. On this market, Gunnebo has a market share of 12%, making it the second largest player globally.
Geographically, the highest growth rates are expected to come from Asia, the Middle East and Africa. But it is also predicted that mature markets in Europe and Americas will see healthy growth during the coming years.
In terms of customer segments, market growth is typically driven by urbanisation where airports, metro and bus rapid transport systems (BRTs) are the segments expected to have highest increase in demand. Public and commercial buildings and in particular office and government buildings remain the main portion of the market and are expected to grow. In the coming years segments such as education, leisure and entertainment as well as high security are also expected to show an increase in demand.
Performance 2019
Entrance Control reported a strong growth in net sales of 21% in constant curren-cies. The integration of Cominfo is going according to plan, and the expected syner-gies have been confirmed. Entrance Control keeps growing with innovative solutions in the mass transit segment and several new orders have been won with airports. This has been possible due to Gunnebo’s ability to deliver global projects with large volumes and excellent quality.
For the full year, the Business Unit reported an EBITA of MSEK 204 (176), resulting in an EBITA margin of 15.6% (16.8). Entrance Control has been able to both grow and invest in future growth during the year, which explains the slightly lower EBITA margin compared to last year.
Entrance Control is about protecting people, assets and buildings through controlling access using passage barriers and detection systems.
Market Drivers and Trends
• Growth of urban populations driving inner city developments for metro and systems for bus rapid transport (BRT)
• Increased cross-border movement of people gives airport constraints with increased number of travellers
• Staff and visitors increasing universal mobility
• Increased process efficiency and opening hours
• Growing terrorism and crime threats, actual and perceived
• Major investments in critical infrastructure such as power plants, airports and military sites
Strategic Priorities
• Broad offering from crash-rated outdoor range for high security to indoor access and flow control
• Specialised ranges for airport and metro with focus on passenger experience
• Process optimisation through automation with healthy ROI thanks to durability and reliability
• Scalable manufacturing capacity to deliver large projects with tight lead time
• Ergonomic design to simplify human machine interaction
• Customisation capacity for integration of third-party devices
• Data analytics capability for development of process opti-misation tools
• Biometric-ready offering for easy integration in the upcoming identi-fication ecosystems
• Software platform for flow management to enhance operational efficiency
Gunnebo has a global market share of 12%, making it the second largest player worldwide

15
Sales model Direct: 10% Indirect: 90%, through system integrators and distributors
Market segmentsPublic and commercial build-ings, stadia, high-risk sites, metro and airports
Selected customers Honeywell, JP Morgan, LG, Shell, Siemens, Stockholms Lokaltrafik (SL) and Swedavia Airports
Product Offering: Speedgates, tripod turnstiles, airport products, full-height turnstiles
15.6%21%EMEA 51%
Asia-Pacific 34%Americas 15%MSEK 1,307
2019 2018
Net Sales, MSEK 1,307 1,048
Sales Growth, % 21 13
EBITA, MSEK 204 176
EBITA, % 15.6 16.8
Entrance Control in Figures
Share of Group
EBITA margin Sales by regionSales growth Net sales
Brands
Market Structure
Alvarado, Automatic Systems, Dormakaba, Magnetic Autocontrol,
Integrated Design Limited, Boon Edam 12%5%Market share, 2018 Selected competitorsMarket growth, 2016–2023Market value, 2018
MSEK 7,400
Vision. Shape the future of people flow
management.
Mission. Provide innovative entrance control
systems designed for an intuitive user experience.
Sales Model and Customer Structure
Manufacturing Units Zlin (CZ), Lavis (IT), Halol (IN), Kunshan (CN)
47%24%EBITA
Key ratios
Net sales

16
Gunnebo Annual Report 2019 / Offering
Background
Swedavia owns, operates and develops a network of 10 Swedish airports from Malmö in the south to Kiruna in the north. The company was formed in 2010 and is wholly owned by the Swedish government.
During 2018, 42 million passengers flew to and from Swedavia’s airports. Stock-holm Arlanda and Gothenburg Landvetter airports have the most passengers, with close to 34 million between them during 2018. Arlanda has experienced passenger growth for more than 100 consecutive months.
Challenges
Air travel is on the rise. The airline industry predicts that passenger numbers will dou-ble by 2027 to more than 8 billion globally.
Swedavia is a world leader in operating climate-smart airports. It has an objective to emit zero fossil carbon dioxide from its own operations by the end of 2020.
Innovation is one of Swedavia’s four core values, and the company is constantly working to create a seamless and stress-free travel experience. One result of this is the introduction of self-boarding gates.
Solution
Swedavia is installing around 240 Gunne-bo BoardSec boarding gates and PreSec pre-security gates at its airports. Almost half of these are at Arlanda, a further 13% at Landvetter, 10% at Malmö, and a further
30% at seven regional Swedavia Airports. By the end of 2019, most of the installations had been completed.
Results
The new gates have already improved the passenger experience at Swedish airports, reducing queues and giving people more quality time at the airport. The gates are integrated with all types of boarding cards, including digital passes in mobile phones.
Quotes
“These automated systems have now given our passengers at Arlanda 20–30% more
time to spend with our service offerings at the airport.”Johan Monie, Business Process Manager at Arlanda Airport
“Bromma Airport now has an even speed-ier, smoother passenger process with these systems. Passenger satisfaction has actually increased by 18% since their intro-duction.”Susanne Strand, Passenger & Customer Experience Manager at Bromma Airport
Swedavia Increases Customer Satisfaction by 18% by Implementing Gunnebo Entrance Control Solutions // Swedavia, Sweden
Customer Case
17
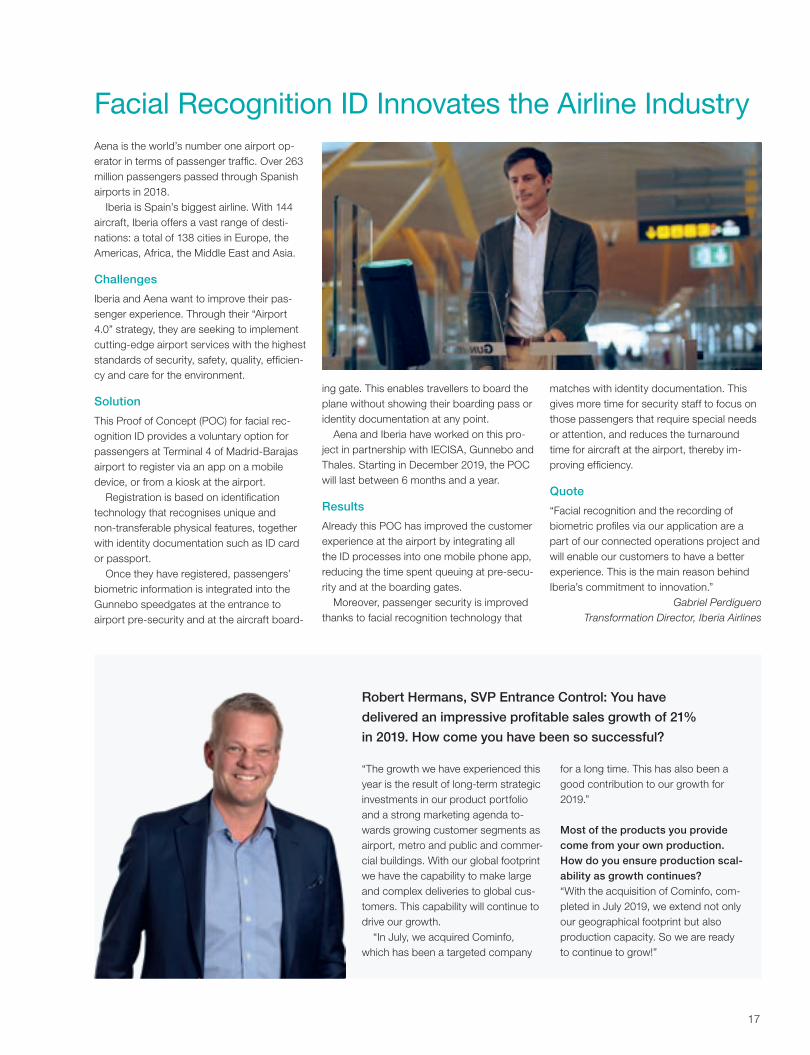
Aena is the world’s number one airport op-erator in terms of passenger traffic. Over 263 million passengers passed through Spanish airports in 2018.
Iberia is Spain’s biggest airline. With 144 aircraft, Iberia offers a vast range of desti-nations: a total of 138 cities in Europe, the Americas, Africa, the Middle East and Asia.
Challenges
Iberia and Aena want to improve their pas-senger experience. Through their “Airport 4.0” strategy, they are seeking to implement cutting-edge airport services with the highest standards of security, safety, quality, efficien-cy and care for the environment.
Solution
This Proof of Concept (POC) for facial rec-ognition ID provides a voluntary option for passengers at Terminal 4 of Madrid-Barajas airport to register via an app on a mobile device, or from a kiosk at the airport.
Registration is based on identification technology that recognises unique and non-transferable physical features, together with identity documentation such as ID card or passport.
Once they have registered, passengers’ biometric information is integrated into the Gunnebo speedgates at the entrance to airport pre-security and at the aircraft board-
ing gate. This enables travellers to board the plane without showing their boarding pass or identity documentation at any point.
Aena and Iberia have worked on this pro-ject in partnership with IECISA, Gunnebo and Thales. Starting in December 2019, the POC will last between 6 months and a year.
Results
Already this POC has improved the customer experience at the airport by integrating all the ID processes into one mobile phone app, reducing the time spent queuing at pre-secu-rity and at the boarding gates.
Moreover, passenger security is improved thanks to facial recognition technology that
matches with identity documentation. This gives more time for security staff to focus on those passengers that require special needs or attention, and reduces the turnaround time for aircraft at the airport, thereby im-proving efficiency.
Quote
“Facial recognition and the recording of biometric profiles via our application are a part of our connected operations project and will enable our customers to have a better experience. This is the main reason behind Iberia’s commitment to innovation.”
Gabriel Perdiguero Transformation Director, Iberia Airlines
Facial Recognition ID Innovates the Airline Industry
Robert Hermans, SVP Entrance Control: You have
delivered an impressive profitable sales growth of 21%
in 2019. How come you have been so successful?
“The growth we have experienced this year is the result of long-term strategic investments in our product portfolio and a strong marketing agenda to-wards growing customer segments as airport, metro and public and commer-cial buildings. With our global footprint we have the capability to make large and complex deliveries to global cus-tomers. This capability will continue to drive our growth.
“In July, we acquired Cominfo, which has been a targeted company
for a long time. This has also been a good contribution to our growth for 2019.”
Most of the products you provide come from your own production. How do you ensure production scal-ability as growth continues?“With the acquisition of Cominfo, com-pleted in July 2019, we extend not only our geographical footprint but also production capacity. So we are ready to continue to grow!”

18
Gunnebo Annual Report 2019 / Offering
A wide range of safe storage products is available from the Gunnebo brands, in-cluding modular strong rooms and vault doors, mechanical and automated safe deposit lockers, high-security electronic locks and locking systems, safes and filing cabinets, globally marketed through the renowned brands Chubbsafes, Hamilton and Steelage. These brands have been providing customers with peace of mind for centuries. Gunnebo’s offering in Safe Storage also includes high-security server cab-inets (SecureIT) that protect sensitive IT equipment not only against intrusion, manip-ulation and wilfull damage, but also from intelligence gathering and and high-energy electromagnetic pulse attacks.
The products are certified by independent certification bodies which guarantee a specific level of protection against burglary, fire or explosives. Since there is no global certification standard, Gunnebo certifies its products in accordance with the most trusted regional norms, such as EN in Europe, UL in the USA and BIS in India. Independent certification is important for customers as it provides a recognised clas-sification system which corresponds to local insurance ratings.
The Global Market for Safe Storage
The market for safe storage is very fragmented with only a few players acting on more than one continent. The market is also fragmented in terms of offering, stretch-ing from high-graded products down to basic metal safes. Total market value is estimated at some 32 BSEK where Europe, Middle East and Africa represents 39%, Asia-Pacific 33% and Americas 28%. The annual CAGR market growth is estimated at 6% until 2022.* *Source: Global Safes & Vaults Market 2018–2022
Performance 2019
Safe Storage reported sales growth of 6% in constant currencies. As part of the cost-efficiency programme, the Business Unit will continue reviewing the cost struc-ture in Europe. Safe Storage has begun its journey to change its route-to-market in Europe to a partnership model. In parallel, market testing of new, innovative, prod-ucts aimed at driving growth is now ongoing in several customer segments. Some of these projects are already expected to contribute to sales in 2020.
For the full year, the Business Unit’s EBITA amounted to MSEK 144 (151), resulting in a margin of 7.1% (8.3). The lower margin is explained by a cost level in Europe which was too high and costs for setting up the new Business Unit global structure. The overall cost structure is being addressed by the cost-efficiency programme launched in July 2019.
Business Unit
Safe StorageThe mission of Safe Storage is to protect cash, valued items and data from burglary, fire and explosion, as well providing peace of mind at home, in transit and at work. Market Drivers and Trends
• Demand for safes and vaults to protect valuables growing outside the banking sector
• Changing needs of what individuals and businesses want to protect drives customisation
• Cybersecurity growing in importance
• Safe storage products integrating technology for more connectivity
• Greater security concerns, due to terrorism and a more uncertain world order for all public and high-risk sites
Strategic Priorities
• Customer-driven solutions through a new, proprietary innovation model
• Capture growth within Safe Storage by product offering and sales through distribution partners
• Support bank customers in their change process
• Grow the business by entering new, targeted market segments with tailor-made solutions
• Develop solutions for intellectual property and data protection
• Provide enhanced competence in security and high-risk site protection
Innovation will drive future growth in an expanding market

19
Sales model Direct: complex projects, ATM safes and serviceIndirect: safes, cabinets and service
Market segmentsBank, public sector, homes, retail, commercial offices, pharma, distribution, ware-houses storing high- value goods and high-risk sites
Selected customersJP Morgan Chase & Co, Manappuram, Nova Vaults, SEB, Watsons Personal Care, FamilyMart, Indonesia National Museum, National Center for Research on Human Evolution
Product Offering: Safes, vaults and vault doors, security cabinets, automated safe deposit lockers, high-security locking systems
7.1%6%MSEK 2,019
2019 2018
Net Sales, MSEK 2,019 1,826
Sales Growth, % 6 4
EBITA, MSEK 144 151
EBITA, % 7.1 8.3
Safe Storage in Figures
Share of Group
EBITA margin Sales by regionSales growth Net sales
Brands
Market Structure
FireKing, Godrej, Tristar, Liberty, Promet, Wertheim,
Robur, Phoenix safe, Invest Rem7%6%Market share, 2019 Selected competitorsMarket growth, 2019–2022Market value, 2019
MSEK 32,000
Vision. Become the number one protector of valuables
in selected markets through industry leading innovation.
Mission. To protect valuables and to provide peace
of mind at home, in transit and at work.
Sales Model and Customer Structure
Manufacturing Units Doetinchem (NL), Markersdorf (DE), Halol (IN), Jakarta (ID), Cincinnati (US)
EBITA
Key ratios
Net sales
EMEA 56%Asia-Pacific 27%
Americas 17%
33%37%

20
Gunnebo Annual Report 2019 / Offering
In the spring of 2019, Gunnebo installed a large automated safe deposit locker system, SafeStore Auto, in Singapore, as demand for instant access to secure stor-age grows with wealthy people investing in precious metals and gems. The project clearly signals a potential market outside the banking sector, which has been the traditional customer segment for these innovative devices.
With 4,251 boxes, this SafeStore Auto installation is by far the largest in Asia. The client, Singapore G Pte Ltd, held a lavish opening ceremony attended by bankers, business people, the media and high net
worth individuals. Singapore G leases office space and stor-
age and is marketing the deposit boxes to wealthy people. As this is already the sec-ond major SafeStore Auto installation in Sin-gapore, it certainly underlines the potential to grow in this area, especially with service providers outside the banking industry.
The project was a logistical challenge with very tight deadlines. Installing the solution required 12 shipping containers from three different factories from all over the world.
Moreover, the installation took place on the third storey of an existing building,
with floor loading constraints, stringent fire regulations and the need to reposition and strengthen walls. Gunnebo’s global engineering team – known for reliability and professionalism – built the main structure, supported by a local partner and Gunnebo staff from Singapore and Malaysia.
Quote
“It was a tough challenge, but we managed to do it – and even ahead of schedule! The owner was very happy with Gunnebo.”Eric Lim, Channel Sales Manager, Safe Storage
Asia’s Largest SafeStore Auto Installation Signals Market Potential // Singapore G Pte Ltd
Customer Case

21
The growing number of self-service environ-ments has increased customer expectations for round-the-clock accessibility for valua-bles. Particularly in the area of safe deposit lockers as users expect high tech solutions today. So how should businesses which offer safe deposit lockers address this?
Safeguarding client valuables in safe de-posit lockers (SDLs) is a service offered by banks as well as hotels, cruise ships, casinos and many other operators in the hospitality industry. Security and client convenience are their top priorities.
A new generation of safe deposit lockers combining automated technology and ad-vanced identification features, developed by Gunnebo, has emerged providing the flexibility required for most convenient 24/7 self-deposit or retrieval of valuables.
Designed to offer extended services to users, automated self-service SDLs are also modular enough to fit into small, medium or large spaces. Flexible, compact and porta-ble, these new systems fulfil the needs of
banks, hotels, homes or offices who want to create self-service areas.
The Benefits of Self-Service SDLs
Customers are not the only ones to benefit from fully automated safe deposit lockers. Managers in the banking, hospitality or ser-vice industries also have much to gain from a high-tech safe deposit locker solution.
A first-class customer service for the pro-tection of valuables helps increase turnover and client satisfaction by:• Freeing up staff for more value-added ac-
tivities as customers no longer need to be accompanied into the vault room to deposit or retrieve their belongings,
• Optimising space allocation as self-service SDL areas require less room,
• Providing increased ROI opportunities since 24/7 availability allows for increased rental fees,
• Differentiating the brand by delivering an innovative self-service environment and attracting a new generation of users not pre-viously interested in safe-deposit lockers,
• Reducing back-office administration thanks to an automated registration process and system monitoring,
• Providing customers with a service with uncompromised security,
• Generating usage data which can be used to improve the customer experience.
This is an edited version of a post originally published on Gunnebo’s blog.
Why Self-Service is a Fast-Moving Trend in Safe Deposit Lockers
Stefan Syrén, SVP Safe Storage: Innovation is key for Safe Storage going
forward. What activities have been carried out in 2019, and when will we
start to see the results?
“There is a very big opportunity for us to devel-op innovative solutions for our customers and expand into new customer segments. We are now well on our way. In 2019, we increased our spend on innovation, which we now do in three dimensions:
• Design to cost, aiming at continuing to work with improving the way we build our products
in a smarter way,• Leveraging on local successes and scale them up to become global,• Introducing new offering to new customer segments and/or taking key offerings into new market seg-ments through innovative business models.We expect the results to come through from 2020 and onwards. This is just the beginning, we
will continue to invest heavily in innovation in the coming years as well.”
During 2019, you have shifted your route-to-market from direct to indirect through enter-ing partnerships on several key markets in Europe. Why?“Gunnebo should focus on being good at under-standing customer demands and translate them into product innovation, product supply and man-agement of safe storage project businesses. For product sales, we will continue to enter into part-nerships on our key markets. This is how we have been successfully operating our Safe Storage business in markets such as US, India and South-East Asia for a long time. Now we will benefit from this knowledge in Europe as well.”

22
Gunnebo Annual Report 2019 / Offering
Business Unit
Cash Management
Gunnebo’s portfolio consists of solutions for deposit, dispensing and recycling of notes and coins, envelope and coin roll systems, closed cash management, drive-up systems, application and monitoring software, and services.
With this portfolio, Gunnebo is seen as a provider with a comprehensive offering, for CIT service providers, banks and retailers both in front-end and back-office.
The Global Cash Market
That cash is disappearing is – globally – still a myth. Between 2011 and 2018, cash in circulation relative to GDP has increased 9.6% across all continents. 85% of transactions globally are made in cash, 79% in Europe*.
Traditionally, cash has been managed by banks globally, but in recent decades, there has been a shift towards cash being managed by retailers. This has meant increased costs for bricks-and-mortar retailers, where the cost of cash often ac-counts for between 5% and 10% of total costs. A third player in the cash ecosys-tem is CIT companies, which provide services to facilitate the physical flow of cash between the bank and retailer.*Source: Global cash report from paymentscardsandmobile.com
Performance 2019
Cash Management ended a challenging year where net sales fell by 9% in constant currencies. A stronger cost focus and the expected increase in sales of newly launched products set the stage for increased sales and improved margins ahead. Cash Management has launched several innovative products and pieces of soft-ware over the year. In 2020, the Business Unit presented a partnership with Loomis in the US, for which Gunnebo developed both products and software for Titan Z, Loomis’ new retail solution for cash deposits. This shows that Gunnebo has the expertise and capacity required to develop and deliver hardware and software solutions to global partners.
For the full year, the Business Unit’s EBITA amounted to MSEK 68 (122), resulting in a margin of 6.6% (11.2). The lower margin is mainly explained by the drop in sales volume in all regions while Gunnebo has continued to invest in growing customer segments. Gunnebo is taking measures targeting the profitability structure in the Business Unit.
Cash Management is about reducing the cost of handling notes and coins for banks and retailers. It is also about supporting cash-in-transit (CIT) service providers to expand their offering to retailers through providing software, hardware and services that increase efficiency and safety throughout the cash cycle.
Our key differentiator today is software
Market Drivers and Trends
• Increased focus on efficient management of cash due to high costs
• Focus on the total cost of ownership management
• As-a-Service infrastructure
Strategic Priorities
• Provide fit-for-purpose hardware, software and services to optimise the cash process
• Provide software that allows cash optimisation and central device management
• Offer new business models such as pay-per-use

23
Sales model Bank: direct, with partners and CIT. Retail: direct, with partners, CIT and banks
Market segmentsRetail, bank and other businesses managing cash
Selected customers Auchan, Carrefour, COOP, Rabobank, Transguard, Emirates NBD, Coles, Z- energy, Lojas Americanas, RaiaDrogasil
Product Offering: Closed cash management, recycling, cash deposit, cash management software
6.6%–9%MSEK 1,034
2019 2018
Net Sales, MSEK 1,034 1,090
Sales Growth, % –9 2
EBITA, MSEK 68 122
EBITA, % 6.6 11.2
Cash Management in Figures
Share of Group
EBITA margin Sales by regionSales growth Net sales
Brands
Market Structure
Glory, Tidel, Suzohapp, Arca, Diebold Nixdof and
Cash Guard7%5%Market share, 2019 Selected competitorsMarket growth, 2018–2020Market value, 2018
MSEK 15,000
Vision. Lead and co-develop the future customer payment
cycle by offering best-in-class uptime and peace of mind.
Mission. Be the experts in the complete payment cycle providing cost-
effective and secure solutions through innovative business models.
Sales Model and Customer Structure
Manufacturing Units Binefar (ES), Cincinnati (US)
EBITA
Key ratios
Net sales
EMEA 71%Asia-Pacific 7%Americas 22%
16%19%

24
Gunnebo Annual Report 2019 / Offering
Hermitage Amsterdam lies in the heart of the Dutch capital and ranks among the most visited museums in the Netherlands.
Unlike most museums, the Hermitage itself has no artwork or permanent collec-tion. Instead it organises two exhibitions a year with items from the 3.5 million works of art housed by its parent museum, the Hermitage in St. Petersburg, Russia.
The Hermitage attracts an average of 420,000 visitors each year, including many students from schools who are offered free art lessons.
Managing Cash Payments
The Hermitage has grown in recent years particularly since the opening of a restau-rant in 2015. Together with the ticket office and shop, this meant the addition of a third area where the museum was taking pay-ments. Overall 25% of visitors were paying with cash – less than the national average of 40% (2018) – so it was essential for the Hermitage to organise cash operations efficiently.
A Partnership Built on Trust
“After we had decided to choose a cash recycling solution for the Hermitage, we started an investigation into the various options,” explains Finance Manager, Peter.
They compared five machines and judged them based on the following crite-ria:• The machines had to be safe and robust
(with an ECB certified safe),• There had to be sufficient capacity for
coins (cash registers),• Only a CIT company should be able to
open the cash recycler – no member of staff should have access to the safe,
• Within the system, it should be possible to make the money flows from different departments visible separately, for exam-
ple the cash flows from the museum shop and the museum entrance,
• The purchase price and the annual op-erating costs should not be too high and through a more efficient system, the museum should be able to make cost savings.“After an extensive evaluation, we finally
opted for Gunnebo’s SafeRecycling solu-tion,” says Peter.
Separate Payment Areas
Since it was necessary for the museum to keep the cash coming in from the different payment areas separate, a Gunnebo Safe-Recycling solution for notes and coins was the ideal option. Not only does it track the amount being deposited by employee, but this data is easily visible and can be checked online using Gunnebo’s CashCon-trol software.
“Human error is not uncommon so cash automation naturally saves us time. With this system in place, proper control of the process is possible,” comments Peter.
The recycling system is accurate and cash differences come to light automatically.
“This saves a lot of time and frustration as you do not have to re-count the money manually,” he adds.
Cash Availability
When employees deposit cash, it is first sorted and then used to replenish the float. If there is an overflow of money, it is stored in the back office ready to be collected by CIT services. To make back-office process-es as self-sufficient as possible – and to avoid having to order too many coins from the CIT company – staff return the overflow cassette with coins to the SafeRecycling unit.
“It is nice that the Gunnebo SafeRecy-cling solution has a large capacity, other-wise we would have to re-order coins much more often,” states Peter.
In the past, cash payments were also made by the Hermitage. There was an em-ployee who managed the cash and made sure that cash was available. Because Gun-nebo SafeRecycling can issue the deposit-ed coins and notes, the museum has been able to cancel this internal cash register and effectively create its own ATM.
“Gunnebo’s great experience in retail solutions certainly played a major role in choosing supplier,” concludes Peter, “And I am still happy with our choice.”
Cash Recycling Delivers Cash Process Efficiency // Hermitage Amsterdam
Customer Case

25
Automated cash recycling is an excellent way of not only reducing operational costs but also improving the customer experience. For sites with multiple points of sale, such as museums, hotels, casinos and cruise ships, managing and processing cash is a serious challenge.
Portioning out cash, keeping cash reg-isters stocked with change and counting up at the end of the day are necessary, functional tasks, but are costing businesses time and therefore a considerable amount of money.
As a functional task, manual cash handling is not adding any value and pre-vents staff from spending time on the floor with the customer.
Automated cash recycling significantly reduces time spent on such tasks (for a member of staff who usually counts cash manually, a cash recycling machine can easily save them 30 minutes or more) and it eliminates cash-counting errors. This in turn means less stress for employees and de-livers a return on investment to businesses from savings on time, cash collection and bank charges.
The Benefits of Cash Recycling Are Hard to Ignore
Christian Weisser, SVP Cash Manage ment: How has Cash Man-
agement’s software offering evolved to meet business needs?
“Our key differentiator in the market today is software, and it will become even more critical in the future. Gunnebo already has one of the strongest software platforms on the market, and in order to support retailers, banks and cash-in-transit partners going forward we provide connectivity through common cloud-based platforms, which also allow remote service, and new business models not requiring up-front investments in hardware.”
During 2019, Cash Management expe-rienced a decline in sales and margins. What actions are taken to secure the Business Unit capture growth in the market with improved margins going forward?“We are in the middle of a transition of our
business model, which has been made possible by the Business Unit structure. We are working on several levels to get back into profitable growth including new partnerships, an aggressive marketing activity plan and adjustment of the fixed cost structure.”
This is an edited version of a post originally published on Gunnebo’s blog.

26
Gunnebo Annual Report 2019 / Offering
Business Unit
Integrated Security
Products and services in this Business Unit can generally be divided into the following areas:
• Integrator business for electronic se-curity encompassing solutions for access control, intruder security and video surveil-lance. Business in this product area normally takes place in project form and Gunnebo generally sells, installs and services products purchased via third-party suppliers.
This business is carried out under the Gunnebo brand.
• Electronic article surveillance (EAS) and loss prevention encompassing anti-theft systems for the retail and fashion industries. The offering includes sales of third-party products as well as in-house developed products under the Gateway brand name.
Bundled into loss prevention solutions also including CCTV and access control the offer-ing is sold under the Gunnebo brand.
• Fire projects and fire safety includes ma-jor projects to integrate fire security systems on larger sites. This business is sold under the Gunnebo brand.
Fire safety refers to sales of fire hydrants, fire extinguishers, protection panels and flex-ible sprinkler piping. Fire safety is sold under the Minimax brand in India.
• Gunnebo Business Solutions is the Group’s common platform in software solu-tions being developed in the Business Units Entrance Control, Safe Storage and Cash Management. The common platform enables Gunnebo to offer Software-as-a-Service solutions. It also opens up the opportunity to offer new business models as subscriptions, including product-as-a-service. This devel-opment is customer-driven and is core for several of the ongoing innovation projects.
Integrated Security consists of a number of local business operations, each with its own market conditions and having their own strategic direction.
• Gunnebo Retail Solutions is a suite of software services focusing on digital store operations for retailers. The solution is based on the trend where shopping for the end cus-tomer is all about speed, convenience and flexibility. This creates a need for retail stores to become even more efficient and one key factor to get there is digitalisation.
Gunnebo Retail Solutions have committed to enable physical stores to stay competitive, by digitising store operations and keeping the store in full flow. It enables store operations to reach new levels of efficiency, by optimis-ing current and new processes, allowing all of the store’s systems to be managed in one application.
The solution is managed as a start-up within the Gunnebo Group and has won its first clients during the year.
Market Structure
Gunnebo estimates that the total market value for Integrated Security is over BSEK 400. The annual market growth during 2019, according to the Group’s assessment, is 3%, and Gunnebo estimates itself to have a limit-ed market share of under 1% globally, but a stronger position in certain geographies.
Strategic Review
In 2019, Gunnebo has made a strategic review of the Unit’s business operations where customer and product synergies have been identified with other Business Units. This means that approximately 20% of the business operations will be merged into Safe Storage and Entrance Control in 2020. At the same time, the Business Unit will change name to Other Business, which better reflects the Business Unit’s diversified operations. The new reporting structure and
historical key ratios will be presented in the first quarter report of 2020. The strategic review of the remaining business operations in Other Business will continue.
Performance 2019
Integrated Security ended a weak 2019 with a 6% decline in net sales in constant curren-cies. Profitability improved over the year but has not reached a satisfactory level. In the ongoing strategic review customer and prod-uct synergies have been identified with other Business Units. As a consequence of the strategic review, items affecting compara-bility and an impairment totalling MSEK –56 were linked to the Business Unit in the fourth quarter.
For the full year, EBITA amounted to MSEK 17 (1), resulting in an EBITA margin of 1.5% (0.1). The full year EBITA improvement was a result of the ongoing cost-efficiency meas-ures taken to improve the performance of the local operations.

27
Strategy & Goal. The strategy for each individual business
within Integrated Security is to optimise the customer offering
within each business, with the common goal to achieve the
Group’s target for profitability and growth.
Product Offering: Electronic security, fire security, loss prevention and group-common digital platforms
1.5%–6%MSEK 1,099
2019 2018
Net Sales, MSEK 1,099 1,164
Sales Growth, % –6 –5
EBITA, MSEK 17 1
EBITA, % 1.5 0.1
Integrated Security in Figures
Share of Group
EBITA margin Sales by regionSales growth Net sales
Market Structure
<1%3%Market share, 2018Market growth, 2018Market value, 2018
BSEK 400
Brands
Manufacturing Units Halol (IN), Cincinnatti (US)
EBITA
Key ratios
Net sales
EMEA 39%Asia-Pacific 21%Americas 40%
4%20%

28
Gunnebo Annual Report 2019 / Offering
Background
RD, created in November 2011 from the merger between Raia S.A. and Drogasil S.A., is Brazil’s leading drugstore brand with more than 2,000 shops in 23 states. It is also the leading chain in terms of revenue and combines an integrated portfolio of assets focused on health and well-being.
Growing Together with Gunnebo
The partnership with Gunnebo began in 2011 and has evolved gradually. With a base of 30.6 million active customers, the company has been aiming to increasingly improve in-store customer shopping expe-rience.
RaiaDrogasil locations have adopted a more modern layout and the product mix
has been expanded by 14,000 items to meet changing consumer preferences.
No Compromise on Security
Throughout these changes, RaiaDrogasil has prioritised security and has worked with Gunnebo to minimise losses.
After nine years of in-store anti-theft protection, which has been expanded along with the company’s expansion nationwide and supported by a maintenance contract managed through a customised web portal, the partnership between Gunnebo and RaiaDrogasil reaches the next level of secu-rity. During 2019, Gunnebo has developed the entire infrastructure and technology solutions for three loss prevention reference stores in São Paulo, where, besides the antennas and tags, there are alarms, video analytics (CCTV and Gatecash), people flow
counters and queue management systems. In addition, Gunnebo has provided an ad-vertising solution integrated with the CCTV system to help drive sales.
Winning the Battle Against Inventory Losses
The intent of the project is to help store leaders further reduce inventory losses through better management with more technology. Gunnebo antennas and labels are present in 98% of the more than 2,000 stores installed in 23 states, 47% of them in São Paulo.
According to the company, in the last six years inventory losses have been falling by about 10% annually with the set manage-ment (procedures and processes), peo-ple (training and culture) and technology (equipment and software).
Complete Loss Prevention Solution Reduces Shrinkage // RD, Drugstore Brand, Brazil
Customer Case

29
The rising threat posed by terrorism is a challenge faced around the world. During 2019, Gunnebo worked closely together with the Spanish Ministry for Home Affairs to address border control for the country.
The Spanish Ministry for Home Affairs is responsible for national security and as a part of this remit, needs to know who is entering the country. When the government identified a need to reinforce border securi-ty, Gunnebo was able to help.
The Ministry was specifically looking for technology able to identify black-listed indi-viduals and also keep a track of the number of people entering and leaving Spain from and to countries outside of the European Union.
Gunnebo delivered an Integrated Secu-rity project securing six entrance points at the southern border by equipping the area with 35 facial recognition cameras
connected to a software platform for video analysis.
As a result, the Ministry can now imme-diately raise an alarm if someone tries to enter the country who is considered to be a threat. The facial capture technology also allows them to crosscheck daily on who has come into the country against those who have left to ascertain which people are still on Spanish soil.
Stefan Syrén, SVP Integrated Security: In 2019, Integrated
Security did not achieve the Group’s targets on growth and
profitability. What measures will ensure the Business Unit is
developing in the right direction 2020?
Integrated Security is a portfolio of different, standalone businesses. Some are performing well in line and above Group targets for growth and profitability, some are not. We are currently reviewing these different businesses, to define the strategy for each of them going forward. It is already now clear that around 20%
of the Unit has synergies with other Business Units in Gunnebo and will be integrated into Entrance Control and Safe Storage during Q1 2020. With this, the Unit will change name to Other Business and the strategic review of the remaining business op-erations will continue with increased focus.
Customer Case
Border Control Crucial to National Security// Spanish Ministry for Home Affairs

30
Gunnebo Annual Report 2019 / Risk Management and Sensitivity Analysis
Risk Management
The Group has operations in more than 20 markets, sales in a further 100 markets through partnerships and manufacturing operations at nine production sites in nine markets. Gunnebo has a relatively diverse customer base, acting in different market segments, niches and geographies.
The Group’s business is diversified, which gives Gunnebo an underlying risk spread.
During 2019, the Group Executive Team has revisited its view on the Group’s most significant risks, the result is presented in the risk table starting on next page.
Risk Management and Monitoring
Risk management within the Group is an important part of management of the Group. It aims to identify, evaluate and manage risks and, thereby, mitigate or monitor potential negative effects. The management teams in Gunnebo’s Business Units are ultimately responsible for identifying, assessing and managing risks in their area of responsibil-ity. The respective management teams are supported by resources within central group functions and bound by group-wide policies, principles, guidelines and instructions.
The Group’s risk management is moni-tored by the Group Executive Team, partly through operational review meetings and partly through quarterly business board meetings. In these the Business Unit man-agement teams describe developments in their respective units as well as identified risks and mitigations. Further control is achieved through the inclusion of representa-tives of the Group Executive Team and senior management on the internal Boards of Direc-tors. The Group CEO reports to the Board of Gunnebo AB about the development of the Group’s significant risks and the Board of Gunnebo AB has the overall responsibility for the Group’s risk management and for decid-ing the Group’s strategic direction.
Most Significant Risks
Gunnebo has chosen to group the risks into three areas:• Risks related to the industry and the
operations• Legal risks• Financial risks
Risks related to the industry and the operationsRisks related to the industry are strongly con-nected to Gunnebo’s external dependencies such as demand and market conditions as well as industry risks such as technological and regulatory changes.
Operational risks are risks directly linked to the operational business, from product development to access of raw materials and suppliers. They include risks related to the Group’s own manufacturing and sustaina-bility as well as the risk that products, soft-ware, services and deliveries do not meet the required standards. Furthermore, they cover risks related to IT, customer credit risks and counterparty risks.
Legal risksLegal risks relate to Gunnebo being a global operation that is subject to laws, regulations and rules pertaining to, for example, the envi-ronment, health and safety, trade restrictions, anti-competition regulations and currency regulations.
Financial risksFinancial activities are carried out in accord-ance with the finance policy established by the Board, which regulates how financial risks are to be managed and the limits within which Gunnebo Treasury and Gunnebo’s subsidiaries may operate.
Read more about Gunnebo’s financial risk management on page 75, note 20.
Insureable Risks
Gunnebo has a group-wide insurance pro-gramme to protect the Group’s insurable assets and activities. The programme covers property and business interruption insurance, general and product liability, transport insur-ance, business travel, crime insurance, direc-tors’ and officers’ liability and employment practices liability. Linked to the insurance pro-gramme is a programme for identifying and evaluating risks at the Group’s manufacturing units and related financial consequences. The programme includes both self-assessments and regular factory inspections. The results of these reviews are summarised in a points system for risk exposure at each plant, ena-bling management to control the risks and to assess the need for risk-reduction measures and establish priorities.
Crisis Management
Gunnebo strives to have a flexible structure of crisis management being capable to re-spond to any type of crisis quickly, decisively and in a coordinated manner.
Therefore, each local market and bigger plant has a crisis management team con-sisting of the General Manager/Country Manager/Plant Manager and an appointed deputy crisis manager. If and when a crisis has occurred the General Manager/Country Manager/Plant Manager shall extend the crisis management team with the HR man-ager and Communication/Marketing where applicable.
The crisis management team at Group level, consisting of SVP Human Resources & Sustainability (crisis manager), CFO (dep-uty crisis manager) and Director Investor Relations has the responsibility to secure that relevant employees at Gunnebo have the necessary knowledge and capabilities to handle incidents. In the event of a major incident, which can be considered to impact the Group as a whole, the Group’s crisis management team, including the Board of Directors, is informed and assesses how to handle the event.
To identify, evaluate, manage and monitor risks is a central role in the management and
control of Gunnebo’s business operations. With the shift into the Business Unit structure
where the Business Units have a relative independence from the parent company and
each other, the Group has increased its focus on Risk Management during the year.

31
Risk Description Type of Risk Comment
Risks related to changed mar-ket conditions, changed eco-nomic climate and changes in cus-tomer behavior
Changed market conditions and trends as a consequence of, for example, changed extra-neous circumstances and security conditions, a weaker economic climate, changed political prioritisations, new legislation as well as techni-cal developments and digitalisation all have an impact on the demand for Gunnebo’s products, services and software.
Industry & Operations
The Group’s relatively broad product range and customer structure, as well as its global market coverage with sales and production in a large number of countries, provide a good distribu-tion of risk restricting the effect of a change in demand limited to a particular customer, indus-try, region or country.
Risks related to product de-velopment and other competition factors
In order to compete effectively, Gunnebo must implement new technology and regularly adapt and update its products, services and software as well as business models to prevailing tech-nological and digital conditions and trends.
Industry & Operations
Gunnebo keeps track of the evolution of stand-ards and their impact. The Group has put in place a product development process, with tollgates and validation steps. Starting with the initial specification, it covers the whole product lifecycle, including launching and phase-out.
Compliance related risks
Gunnebo’s operations on the global security market and its geographic spread expose Gun-nebo to risks related to sustainability factors such as human rights, employment conditions and corruption.
Legal The Group’s Code of Conduct, as well as policies and guidelines on compliance with applicable laws in certain areas, have been implemented. Compliance risks are managed through operational business decisions and operations regarding compliance to rules and regulations in all businesses throughout the Group on all levels, by all employees, and moni-tored through periodic risk workshops.
Risks related to outages and disruptions at its manufacturing units
These risks include, among other things, ex-treme weather conditions and natural disasters, fire, theft, systems failures, mechanical failures or equipment breakdown and similar risks.There is also a risk that, in the future, Gunne-bo will be unable to build new plants or make investments in existing plants on favourable terms, or will be unable to rationalise produc-tion.
Industry & Operations
The manufacturing units are involved in an audit programme driven by the Group’s insurance company. The insurance company regularly re-views the risks associated with each plant and helps to design action plans to reduce them. Hence, a Group crisis management procedure and local business continuity plan for each plant have been implemented. These allows the Group to anticipate its response to any major unplanned event.
Project risks and contract- related risks
Gunnebo’s business is conducted in part through sales of fixed quantities at a fixed price, and in part through projects where the contract sum can be significant and the projects extend over several years and include significant ele-ments of integration, adaptation and service. Long and sometimes complex projects expose Gunnebo to risks and impose major demands for project planning and control as well as monitoring, to ensure that from time to time obligations and assessments regarding project costs and revenues provide a satisfactory basis for reporting of revenues, costs and profitability.
Industry & Operations
The implementation of the Business Unit organ-isational structure ensures that development, manufacturing, sales, service and back-office are aligned end-to-end, making Gunnebo more integrated and prepared to run complex pro-jects in a cost-efficient, agile and transparent way. The Group authority matrix ensures overall governance.
The Gunnebo Group’s Most Significant Risks
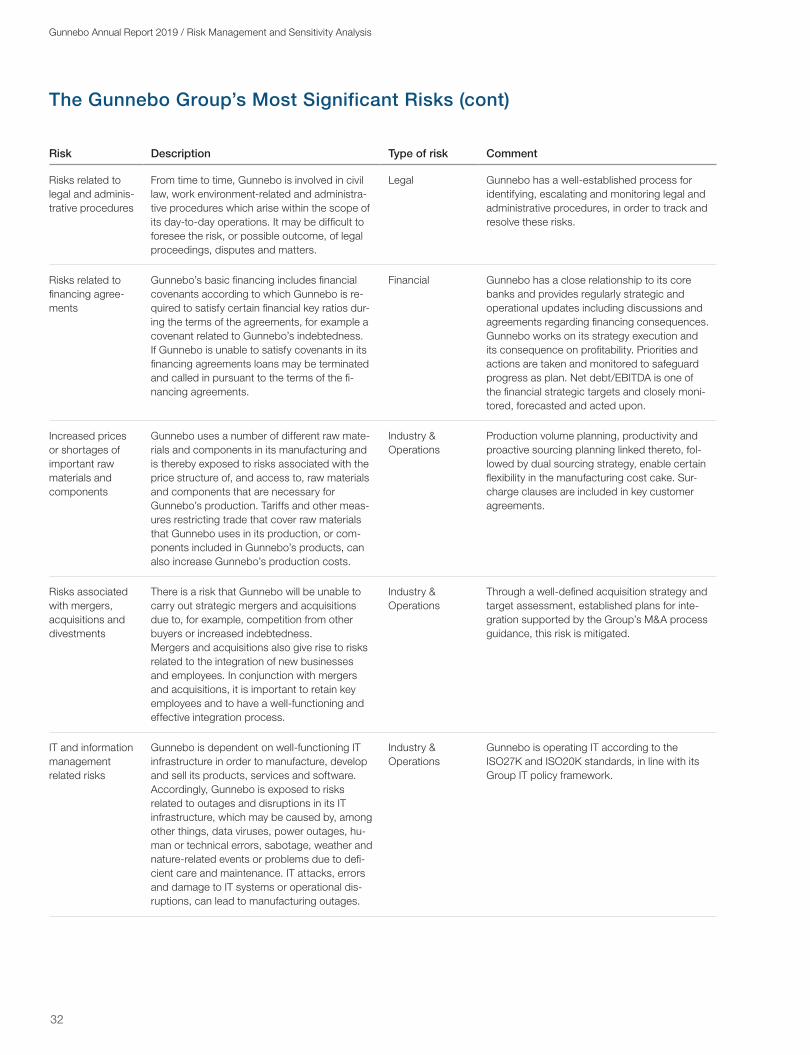
32
Gunnebo Annual Report 2019 / Risk Management and Sensitivity Analysis
The Gunnebo Group’s Most Significant Risks (cont)
Risk Description Type of risk Comment
Risks related to legal and adminis-trative procedures
From time to time, Gunnebo is involved in civil law, work environment-related and administra-tive procedures which arise within the scope of its day-to-day operations. It may be difficult to foresee the risk, or possible outcome, of legal proceedings, disputes and matters.
Legal Gunnebo has a well-established process for identifying, escalating and monitoring legal and administrative procedures, in order to track and resolve these risks.
Risks related to financing agree-ments
Gunnebo’s basic financing includes financial covenants according to which Gunnebo is re-quired to satisfy certain financial key ratios dur-ing the terms of the agreements, for example a covenant related to Gunnebo’s indebtedness.If Gunnebo is unable to satisfy covenants in its financing agreements loans may be terminated and called in pursuant to the terms of the fi-nancing agreements.
Financial Gunnebo has a close relationship to its core banks and provides regularly strategic and operational updates including discussions and agreements regarding financing consequences. Gunnebo works on its strategy execution and its consequence on profitability. Priorities and actions are taken and monitored to safeguard progress as plan. Net debt/EBITDA is one of the financial strategic targets and closely moni-tored, forecasted and acted upon.
Increased prices or shortages of important raw materials and components
Gunnebo uses a number of different raw mate-rials and components in its manufacturing and is thereby exposed to risks associated with the price structure of, and access to, raw materials and components that are necessary for Gunnebo’s production. Tariffs and other meas-ures restricting trade that cover raw materials that Gunnebo uses in its production, or com-ponents included in Gunnebo’s products, can also increase Gunnebo’s production costs.
Industry & Operations
Production volume planning, productivity and proactive sourcing planning linked thereto, fol-lowed by dual sourcing strategy, enable certain flexibility in the manufacturing cost cake. Sur-charge clauses are included in key customer agreements.
Risks associated with mergers, acquisitions and divestments
There is a risk that Gunnebo will be unable to carry out strategic mergers and acquisitions due to, for example, competition from other buyers or increased indebtedness. Mergers and acquisitions also give rise to risks related to the integration of new businesses and employees. In conjunction with mergers and acquisitions, it is important to retain key employees and to have a well-functioning and effective integration process.
Industry & Operations
Through a well-defined acquisition strategy and target assessment, established plans for inte-gration supported by the Group’s M&A process guidance, this risk is mitigated.
IT and information management related risks
Gunnebo is dependent on well-functioning IT infrastructure in order to manufacture, develop and sell its products, services and software. Accordingly, Gunnebo is exposed to risks related to outages and disruptions in its IT infrastructure, which may be caused by, among other things, data viruses, power outages, hu-man or technical errors, sabotage, weather and nature-related events or problems due to defi-cient care and maintenance. IT attacks, errors and damage to IT systems or operational dis-ruptions, can lead to manufacturing outages.
Industry & Operations
Gunnebo is operating IT according to the ISO27K and ISO20K standards, in line with its Group IT policy framework.

33
Sensitivity Analysis
Profits are affected by changes in certain factors of importance to the
Group, as explained below. The calculation is made on the basis of the
Group’s structure at year-end and assuming all other factors remain
unchanged.
Costs
The annual cost of steel-based products account for approximately MSEK 410.Consequently, an increase of 10% in the cost of these products reduces the operating profit by around MSEK 41. An increase of 1% in wages and salaries (including social security charges) reduces the operating profit by around MSEK 16. An increase of 1% in interest rates would increase the Group’s annual interest cost with around MSEK 18, based on the cur-rent position. The Group had a net debt including post-employment benefits of MSEK 1,761 on 31 December 2019.
Currency Impact
Most of the operating profit is made outside Sweden and there are income and purchase costs in several currencies, meaning the Group is exposed to currency risks.
Read more about Financial Risk Manage-ment and Financial Instruments in Note 20,
page 75.
Expenses by Nature, MSEK 5,244
Material costs, 44% Remuneration to employees, 30% Temporary personnel
and subcontractors, 4% Vehicle and travel costs, 4% Depreciation
and amortisation, 4% Transport costs, 3% Other costs, 11%
Change Effect
Selling prices A 1% increase in the selling price would positively affect income and operating profit by approximately MSEK 55.
Labour costs A 1% increase in labour costs, including social security charges would negatively affect operating profit by approximately MSEK 16.
Steel prices A general increase in steel prices of 10% would negatively affect profit by around MSEK 41 for the subsequent 12 months.
Currencies A 10% depreciation of the value of the SEK would positively affect profit before tax by approximately MSEK 24 in total. Of this, MSEK 11 would be netted transaction exposure, without taking the Group’s forward cover into account. The remaining would be attributable to translation exposure.
Interest expenses Given the same borrowing liability and the same fixed interest terms as at the end of the year, a one percentage point increase in all of Gunnebo’s borrowing currencies
would negatively affect profit by approximately MSEK 18 after interest rate hedging, for the subsequent 12 months.

Gunnebo Annual Report 2019 / Corporate Governance
34
In addition to Swedish law, the Group’s corporate governance is based on the Swedish Corporate Governance Code (referred to below as “the Code”), NASDAQ Stockholm’s Rule Book for Issuers and the Swedish Securities Council’s statements on good practices on the Swedish stock market.
This Report summarises the structure of corporate governance and how corporate governance has been performed and developed within the Group during the 2019 financial year. Gunnebo follows the rules of the Code and provides explanations for the cases in which it deviated from the Code rules in 2019.
Governance and Division of Responsibilities
Corporate governance structured around and adapted to the Group’s operations are essential to commercial success and increased profit-ability. Gunnebo’s corporate governance involves segregation of duties, governance and effective control over the Group’s operations. This safeguards that the Group meets its commitments to sharehold-ers, customers, employees, suppliers and other stakeholders, and that the operations meet agreed targets, applicable legislation and internal policies and guidelines.
In 2019, the following groups were primarily in charge of the gov-ernance, management, control and segregation of responsibilities at Gunnebo:• Shareholders• Board of Directors• CEO• Group Executive Team• Business Unit and regional management teams• Group corporate functions
Shareholders
Shareholders exercise their influence at the Annual General Meeting or, if held, at Extraordinary General Meetings, which are Gunnebo’s highest decision-making bodies. All shareholders registered in the transcript of the shareholders’ register at a certain point of time before the Meeting and who have registered their attendance at the Meeting before the stipulated deadline in the notice to attend are entitled to participate in the Meeting and exercise full voting rights.Shareholders who are unable to attend the Meeting in person may appoint a proxy. Shareholders wishing to have an issue addressed at a General Meeting should submit their request in writing to the Board well enough in advance to be included in the convening notice to the General Meeting.
Corporate Governance ReportGunnebo AB (publ) is a Swedish public limited company listed on NASDAQ Stockholm, Mid Cap. The company applies the Swedish Corporate Governance Code.
2019 Annual General Meeting
The 2019 Annual General Meeting was held on 11 April at Stenham-marsalen, the Concert Hall in Gothenburg. A total of 89 shareholders attended the Meeting, representing approximately 64% of the num-ber of shares and votes in the company. Chairman of the Board Mar-tin Svalstedt was elected Chairman of the Meeting. All Board mem-bers elected by the Meeting attended, except Anna Borg Sæther.
Minutes from the Annual General Meeting have been published on Gunnebo’s website, www.gunnebogroup.com. The Meeting adopted resolutions including:• Adoption of the P&L statements and balance sheets for the com-
pany and the Group included in the annual report for the 2018 financial year,
• A dividend according to the Board’s proposal of SEK 0.50 per share for the 2018 financial year,
• Discharge of all Board members and the CEO from liability for the administration of the company’s attains during the 2018 financial year,
• Re-election of all Board members and Martin Svalstedt as Chair-man of the Board,
• Determination of remuneration to the Board of Directors and auditor,
• Principles for remuneration of senior executives,• Election of Deloitte AB as the company’s auditor until the end of the
2020 Annual General Meeting,• Authorisation for the Board to, in conjunction with agreements on
company acquisitions, at one or several occasions during the pe-riod up until the next Annual General Meeting, resolve on the issue of shares, with or without deviation from the preferential rights for the shareholders for payment in cash, by contribution in kind or by set-off, for a maximum number of shares corresponding to 10% of the total shares in the company,
• Implementation of a long-term share-based incentive program.
2019 Extraordinary General Meeting
On 26 August an Extraordinary General Meeting was held at Väst-svenska Handelskammaren in Gothenburg. A total of 50 sharehold-ers attended the Meeting, representing 62% of the number of shares and votes in the company. Chairman of the Board Martin Svalstedt was elected Chairman of the Meeting.
The Extraordinary General Meeting approved the Board of Direc-tors’ decision on a rights issue of ordinary shares.

35
Overview of Gunnebo’s Corporate Governance 2019
Important External Regulations
Swedish Companies Act and Annual Accounts Act
NASDAQ Stockholm’s Rules for Issuers
Swedish Corporate Governance Code
Important Internal Governing Documents
Articles of Association
Instructions and rules of procedure (Board, CEO and Board committees)
Group Policies
The Group’s Code of Conduct
Shareholders
Board of Directors
CEO and Group Executive Team
Business Unit & Regional management teams
Operational management
Nomination Committee
Group functions
External auditors Remuneration Committee
Audit Committee
The rights issue added some MSEK 360 to Gunnebo’s balance sheet before issue costs.
The proceeds were primarily used to decrease the gross indebt-edness that temporarily was increased through the acquisition of Cominfo a.s.. The purchase price for the acquisition was MSEK 258. The remaining part of the proceeds was used to increase Gunnebo’s financial capacity through further decrease of the Group’s gross indebtedness. This allows for Gunnebo to capture market opportuni-ties and realise the Group’s strategy for profitable growth.
2020 Annual General Meeting
The next Annual General Meeting of shareholders in Gunnebo AB (publ) will be held at Hotel Elite Park Avenue in Gothenburg on Tuesday 21 April. More information about the Annual General Meeting is available on page 92 of this Annual Report and at www.gunnebogroup.com.
Nomination Committee
The task of the Nomination Committee is to present proposals to the Annual General Meeting for decisions in such matters as the election of the Chairman of the Meeting, Board members (number, name and Chairman), fees to the Board of Directors, and remuneration for com-mittee work, auditor selection and fees.
It was decided at the 2017 Annual General Meeting that, until further notice, Gunnebo’s Nomination Committee would consist of the Chairman of the Board and one representative from each of the three largest shareholders as per the final banking day of August of each year. This means that the following shareholder representa-tives constitutes the Nomination Committee for the period until the 2020 Annual General Meeting: Dan Sten Olsson (appointed by Stena Adactum), Mikael Jönsson (appointed by Vätterledens Invest), Ricard Wennerklint (appointed by If Skadeförsäkring) and Martin Svalstedt, Chairman of the Board and convener. The Chairman of the Nomina-tion Committee is Dan Sten Olsson.

Gunnebo Annual Report 2019 / Corporate Governance
36
JANDEC
OKT
SEP
DecemberBM: Report from the Board’s committees; report from the CEO; financial performance update and plan 2019; budget 2020; invest- ments, acquisitions and divestments; evaluation of the board.AC: Audit and internal control update; accounting, valuation and tax update. RC: LTIP 2020 review continued. Indepth review of the HR agenda for the company. Approval of new 2020 salaries for the Group Executive Team.
NovemberBM: Report from the Board’s committees; report from the CEO; update of Q3 financial performance; Q3 interim report; Integrated Security strategy update; new President and CEO.AC: Update on Q3 financial performance; Q3 interim report; Q3 audit review; treasury, insurance and financial risk update; account-ing, valuation and tax update.RC: Bonus structure for 2020 aligned, LTIP 2020 direction outlined.
AprilBM: Acquisition and financing proposal, report from the Board’s committees; report from CEO; financial performance update; M&A and strategy update; Cash Manage-ment and Safe Storage business update.BM: Statutory meeting.BM: Report from the Board’s committees; update on Q1 financial performance; Q1 interim report, acquisition and right issue. AC: Review of AC rules of procedures; re-port on Q1 financial performance; Q1 interim report; audit and internal control plan for the year; new accounting principles; finance policy adherence.
JuneBM: Acquisition, right issue and financing considerations. RC: Bonus 2019 H1 and H2 review and approval.
MarchBM: AGM notice and proposals.
JanuaryRC: 2019 LTIP targets approved.
SeptemberBM: Entrance Control business visit and update; strategy update and decision.BM: Allotment of new shares in rights issue.RC: Approval of bonus H1 for the Group Executive Team.
JulyBM: Strategy review of the Group and Business Units.BM: Report from the Board’s committees; report from the CEO; update of Q2 financial performance; Q2 interim report.BM: Change of CEO; Q2 interim report.BM: Decision on right issue, announcement and EGM.AC: Q2 financial performance; Q2 interim report according to new layout; audit plan and fees, litigations and claims overview.
AugustBM: Terms and conditions for right issue, announcement.BM: Approval of prospectus, announce-ment.
OctoberRC: Proposal on bonus structure for 2020, update on the HR agenda.
February BM: Report from the Board’s committees; report from CEO; report on Q4 and full year financial performance; audit report; Q4 interim report; proposal of dividends; update regarding M&A, financing considerations and strategy.AC: Report on Q4 and full year financial performance; audit report; Q4 interim report; litigations and claim overview and annual certification process; recommendation of audit firm, review of the financial perfor-mance project.AC: Review of Annual Report 2018. RC: 2019 LTIP potential for CEO approved.
BM = Board Meeting
AC = Audit Committee
RC= Remuneration Committee
JANDEC
OC
T
FEBM
AR
NOV
AP
RM
AY
JUN
SEP
AUG
JUL
The Board’s Work

37
In the Nomination Committee’s opinion, all its members are in-dependent of the company and its Group Executive Team. Further-more, Mikael Jönsson and Ricard Wennerklint are deemed to be independent of the company’s largest shareholder in terms of votes. In a deviation from item 2.4 (second paragraph) of the Code, two of the Nomination Committee’s members are also Board members who are not deemed to be independent of the company’s largest shareholders. The reason for the deviation is that Mikael Jönsson is the person in Vätterledens Invest who has the best knowledge of the company and its board. No remuneration is paid by the company to the members for their work on the Nomination Committee. The Nomination Committee held three meetings prior to the date of this Annual Report. Contact the Nomination Committee by e-mail to [email protected] or by post to Gunnebo AB, attention the Nominations Comittee to the address printed on page 92.
Board
The overall task of the Board of Directors is to be accountable for the company’s organisation and management of the company’s business. In the execution of its duties, the Board is to manage the interests of all shareholders. It is also the Board’s duty and respons-ibility to ensure that Corporate Governance is adhered to and that this report is prepared.
The Articles of Association stipulate that the Board shall comprise no fewer than five and no more than seven members, with no more than two deputies. Board members are elected every year at the Annual General Meeting for a period that extends to the close of the next Annual General Meeting.
In 2019, Gunnebo’s Board comprised six members elected by the Annual General Meeting. Moreover, the employees have the right to appoint two representatives and two deputies to the Board. None of Gunnebo’s senior executives are members of the Board. The CEO and the CFO participate at Board meetings, the latter also serving as secretary. Furthermore, other senior executives participate at meetings whenever required. The Board’s work is primarily governed by the Swedish Companies Act, the Code and the Board’s rules of procedure. The rules of procedure are adopted every year at the statutory meeting of the Board.
The current rules of procedure state that the Board shall hold at least six scheduled meetings between Annual General Meetings including the statutory board meeting. The rules of procedure also outline the segregation of work and responsibilities between the Board, the Chairman, the Board Committees and the CEO.
The Board’s Work in 2019
In 2019, the Board convened 16 times in addition to the statutory meeting. The work of the Board has been performed as illustrated in the table on page 36.
Chairman of the Board
Martin Svalstedt was re-elected the Chairman of the Board of Direc-tors at the 2019 Annual General Meeting. It is the Chairman of the Board’s responsibility to lead and divide the Board’s work and to en-sure that it is conducted in an organised and effective manner. This includes ensuring that the Board completes its duties, monitoring the progress of the company and ensuring that the Board continuously
receives the information required for the Board to perform its work to the necessary standard in accordance with the relevant regulations. The Chairman does not participate in the operational management of the company.
Independence of Board Members
Pursuant to the Code, the majority of Board members elected at the Annual General Meeting must be independent of the company and its Group Executive Team, and at least two of its members must also be independent of the company’s major shareholders. The share- holdings of the individual Board members and their independence of the company, its Group Executive Team and the major shareholders, and other assignments in other companies are presented on pages 42–43.
Evaluation of the Board’s Work
The work of the Board is evaluated every year by a survey completed by the members of the Board. The results of this survey form the basis for continuous improvements to the Board’s work in the com-pany. The evaluation, for which the Chairman of the Board is respon-sible, includes issues regarding meetings, material and the manner in which the Chairman of the Board and the Board in general perform their main duties in accordance with rules of procedure. The results of the survey have been presented to and discussed by the Board and been presented to the Nomination Committee by the Chairman of the Board. The evaluation is the basis for the Nomination Commit-tee in terms of its various proposals regarding the Board.
Board Committees
During 2019, the Board of Directors of Gunnebo had two Commit-tees: the Audit Committee and the Remuneration Committee. The representatives sitting on these Committees are appointed by the Board.
Audit Committee
The Audit Committee is a preparatory body for contact between the Board and the auditors. The Audit Committee follows written rules of procedure. The Committee’s duties include:• Monitoring the company’s financial reporting and submitting rec-
ommendations and proposals to ensure the reliability of the report-ing,
• Monitoring the efficiency of the company’s internal control and risk management as regards the financial reporting,
• Remaining informed about the status of the audit of the annual report and the consolidated financial statements and about the conclusion of the Swedish Inspectorate of Auditors’ quality controls of the auditors,
• Examining and monitoring the impartiality and independence of the auditors, and in particular identifying whether the auditors provide any other services to the company than the audit, and discussing any threats to impartiality and independence and any other matters with the auditors,
• Providing assistance in preparing proposals for resolution by the General Meeting on the election of auditors and fees to auditors, for which the Committee is to monitor that the auditors’ mandate period does not exceed applicable regulations, submit a recom-

Gunnebo Annual Report 2019 / Corporate Governance
38
mendation on the election of auditors and, when electing a new auditor, procure an audit in accordance with the provisions of Article 16 of the EU Auditor Regulation. If new auditors are to be elected, the recommendation is to provide reasoning and contain at least two alternatives and the Committee is, in such cases, to provide reasons on which auditor it prefers,
• Ensuring that the Group’s nine-month report and Annual Report are reviewed by the Group’s auditors.
Following the 2019 statutory board meeting, the Committee com-prised Eva Elmstedt (Chairperson), Anna Borg Sæther and Mikael Jönsson. All of the members of the Audit Committee are independent of the company and company management and two members are also independent of the company’s major shareholders.
The Committee held 6 meetings during the year and the Group’s auditors participated in all of them. The Group’s auditors also par-ticipated at one Board meeting to present an overview of their audit and review of internal control. The auditors then met with the Board without the presence of representatives from the Group. Matters ad-dressed by the Committee are illustrated on page 36. The attendance of the Committee members at meetings is presented in the table below.
Remuneration Committee
The Remuneration Committee follows written rules of procedure. The Remuneration Committee’s tasks include:
• Submitting proposals on guidelines for remuneration of the Presi-dent and other senior executives,
• Monitoring and evaluating ongoing variable short and long-term remuneration programmes for the Group Executive Team and pro-grammes concluded during the year,
• Monitoring and evaluating the application of the guidelines for re-muneration of senior managers as adopted by the Annual General Meeting and current remuneration structures and remuneration levels in the company,
• Addressing strategically important HR issues, such as management development and succession planning,
• Preparing other matters related to employment terms and condi-tions, such as general principles for salary levels, company car policy, Code of Conduct and other matters delegated to the Committee by the Board.
Following the 2019 statutory board meeting, the Committee com-prised Martin Svalstedt (Chairman), Mikael Jönsson and Göran Bille. All of the members of the Remuneration Committee are independent of the company and company management and one member is also independent of the company’s major shareholders. The Committee held nine meetings during the year, at which items such as long-term incentive programmes, bonus model, bonus outcomes and guidelines for remuneration to senior executives were discussed. The attendance of the committee members at meetings is presented in the table below.
Statistics on Attendance and Independence of Board Members 2019
Independent in Relation to:
NameElected at Annual General Meeting Elected Board Meetings
Remuneration Committee
AuditCommittee
The Company and Executive Management
The Company’s Largest
Shareholders
Total Remuneration,
SEK
Martin Svalstedt 2003 16 (C) 9 (C) Yes No 500,000
Göran Bille 2008 16 (M) 9 (M) Yes Yes 285,000
Anna Borg Sæther 2017 14 (M) 6 (M) Yes Yes 270,000
Charlotte Brogren 2012 12 (M) Yes Yes 255,000
Eva Elmstedt 2015 16 (M) 6 (C) Yes Yes 320,000
Mikael Jönsson 2000 16 (M) 8 (M) 6 (M) Yes No 315,000
Employee Representatives Total: 1,945,000
Micke Fridström 2018 14 (M)
Irene Thorin* 2011 4 (M)
Crister Carlsson** 2019 12 (M)
Number of Meetings: 16 9 6
C=Chairman M=Member
*Left the assignment in April 2019
**Took up the assignment in April 2019
39
Auditors
Gunnebo’s auditors are elected at the Annual General Meeting. They audit one interim report and the annual report, accounting and reporting for the Group as well as the Board’s and CEO’s manage-ment of the company in accordance with generally accepted auditing standards in Sweden.
After every financial year, the auditor submits an auditor’s report for the Parent Company and a consolidated auditor’s report to the Annual General Meeting as well as a supplementary report to the Audit Committee under the EU Auditor Regulation.
At the 2019 Annual General Meeting, the registered public audit firm Deloitte AB was elected as the auditor with Hans Warén as the auditor in charge. The current mandate period expires at the 2020 Annual General Meeting. The auditors present their audit to the Audit Committee and the Board of Directors. In addition to their standard audit assignments, Deloitte provides assistance in the form of ad-visory and investigative assignments. The assignments performed are not deemed to give rise to a disqualification situation. Information regarding fees to auditors is provided in Note 7.
President & CEO and the Group Executive Team
It is the CEO’s responsibility to implement and ensure the execution of the strategies, business plans and operational targets adopted by the Board. The CEO is also responsible for ensuring that the Board receives the information and material necessary for making decisions. Furthermore, he presents reports at Board meetings and continuously keeps the Board and Chairman informed of the Group’s and company’s financial position and performance.
This year the transformation into Business Units and the conse-quential organisational changes followed by adjusted governance models have been a focused areas.
During the year, there has been a shift in President & CEO for the Group. Henrik Lange, who joined Gunnebo in 2015, decided to step down from the position and handed over to Stefan Syrén 7 Novem-ber 2019.
The CEO is assisted by a Group Executive Team comprising managers for Business Units, regions and group functions. With the Business Unit structure fully implemented at year-end the regional structure ceased to exist. As a consequence the SVPs for Region Asia-Pacific, Middle East and Africa and Americas left the Group Executive Team at year-end 2019. Also the function of central Mar-keting & Communication was discontinued at year-end meaning that the SVP Marketing and Communications left the Group Executive Team at the end of 2019.
With these changes, the Group Executive Team as of 1 January 2020 is made up of five persons: • President and CEO who also holds the positions as SVP for Busi-
ness Unit Safe Storage and Business Unit Integrated Security• Executive Vice President, Deputy CEO and SVP Business Unit
Entrance Control• SVP Business Unit Cash Management• Group CFO• SVP HR and Sustainability
The Group Executive Team is presented on page 41 in this Annual Report.
In 2019, the Group Executive Team held 13 meetings. The meet-ings mainly focused on implementation, monitoring and follow-up on the Group’s strategic direction with Business Units by product offering, change management activities, financial performance de-velopment, acquisitions and divestment activities as well as financial follow-up visavi forecast and plans.
Business Unit and Regional Management Teams
Gunnebo’s business activities consist of the Business Units Entrance Control, Safe Storage, Cash Management and Integrated Security. The three first Business Units each has a global end-to- end respon-sibility for product management, supply chain and sales where each Business Unit also has an operational management team which is responsible for the unit’s business operations. The fourth Business Unit, Integrated Security, comprises of several local businesses man-aged in line with the Group’s governance model, each with its own strategic agenda but with the common targets to reach the Group’s financial goals. Until year-end 2019 the Group had management teams for the business in Region Asia-Pacific, Middle East and Africa and Region Americas. These management teams have during the year been focusing on the transition into Business Unit structure in respective region, as well as securing full focus on customers and business also in times of change. As of year-end 2019 all countries have been embedded into the Business Unit structure, hence the regional structure and their management teams ceased to exist as of this date.
The operational management teams are the bodies under the Group Executive Team that are responsible for strategy implemen-tation, operational management and ensuring that the decisions which have been made are executed. These management teams are also responsible for leading the day-to-day operations in each unit and usually comprise the head of each unit and the most important heads of staff functions.
Group Functions
Gunnebo’s head office consists of the group functions for the co-ordination of corporate management, human resources, sustainabil-ity, legal and compliance, finance, IT, brand management, corporate communications, investor relations and M&A. These functions are responsible for preparing relevant group-wide strategies, priorities, plans and policies for their respective functional areas of responsibil-ity and for driving, supporting and controlling the development of the organisation based on their respective areas of expertise.

Gunnebo Annual Report 2019 / Corporate Governance
40
Board of Directors’ Report on Internal Control
The Board is responsible for internal governance and control stipu-lated by Swedish law (Companies Act and Annual Accounts Act) and the Swedish Corporate Governance Code. Gunnebo AB applies and complies with these requirements. The Board’s report is limited to addressing internal control in respect of financial reporting and Gun-nebo has decided to describe how the internal control is organised.
Internal Control in Respect of Financial Reporting
Internal control comprises of: control environment, risk assessments, control activities, information and communication as well as follow-up and management.
Financial internal control is one of Gunnebo’s central corporate governance components with the purpose to obtain reasonable assurance with respect of the reliability of external financial reporting in the form of interim reports, annual reports and year-end reports. The objective is to ensure that the financial reporting is prepared and presented in accordance with law, applicable financial reporting standards and other requirements for listed companies and that local statutory regulations are adhered to.
The Group’s internal control environment is evaluated using a self-assessment of internal controls and is performed annually in all subsidiaries. The results are followed up by sample test assessments performed by the auditors. The results of the assessments are com-piled centrally and reported to the Audit Committee. Identified weak-nesses as well as areas for improvement to strengthen internal con-trol are incorporated into future self-assessments with the purpose to continuously strengthen the company’s internal control environment. The Board annually evaluates the need for a separate internal audit function and has determined that the Group’s current process is suf-ficient to ensure an adequate internal control environment.
Control Environment
The Board has prepared instructions for the CEO. The responsibility for upholding an effective control environment has been delegated to the CEO.
The corporate finance function acts as the Group’s internal con-trol function and aligns and reports to the Audit Committee and to the CEO. The function develops and improves the internal control in respect of financial reporting, both proactively by focusing on the internal control environment and by reviewing how the internal con-trol works.
Internal governing documents for the financial reporting mainly comprise the Group’s Finance Policy, Group Treasury Policy, Group Internal Control Policy, Group Financial Accounting and Reporting Policy, Group Authority Matrix and Group Powers Reserved Policy.
Risk Assessment
Gunnebo’s risk assessment is intended to prevent, identify, evaluate and rectify significant risks in respect of financials and business in the Group’s companies and Business Units.
The risk assessment results in identifying significant risks and how these can be mitigated or monitored and where the risk assessment is reassessed every year. More information about the Group’s risks is available in the section “Risk and Sensitivity Analysis” on pages 30-33 and in Note 20, Financial Risk Management and Financial Instruments.
Gunnebo’s Code of Conduct covers principles for how the opera-tions are to be conducted.
Information and Communication
For the purpose of ensuring that the external information is correct, complete and timely, Gunnebo has adopted a Communication policy. Within the company, there are also instructions regarding information security and how to communicate financial information between the Board, Management, other employees as well as with the external market. Gunnebo has an established process for whistleblowing, accessible for all employees. It can be used anonymously.

41
Christian Weisser
Born 1966. SVP Business Unit Cash Management since 2019.
Principal education and professional experience: Degree in industrial business management at Nixdorf Computer AG. Senior executive positions within Diebold Nixdorf, recently as SVP and Managing Director for the region Europe, Middle East & Africa.Other current assignments/positions: Member of Planfocus software GmbH Advisory Board.Holding: 90,000 shares and 200,000 call options.
Robert Hermans
Born 1968. Executive Vice President and SVP Business Unit Entrance Control since 2010.
Principal education and professional experience: Master of Science in Business Administration from Uppsala University and MBA, Stockholm School of Economics. Country Manager, Gunnebo South Africa, President, Gunnebo Lifting, Managing Director, Cargo Control Systems (South Africa) and other senior positions in marketing and sales in the Gunnebo Industries Group.Other current assignments/positions: Board member of TsarMedia AB and Satpack Travel.Holding: 55,000 shares and 200,000 call options.
Åke Bengtsson*
Born 1963. Group Chief Financial Officer since February 2020.
Principal education and professional experience: Executive MBA, CBS-SIMI, Copenhagen. CEO and CFO at Haldex, CFO at PartnerTech and CFO at Cardo Entrance Solutions.Other current assignments/positions: –Holding: 15,000 shares.
*Succeeded Susanne Larsson as CFO 10 February 2020.
Christian Carlsson
Born 1975. SVP Human Resources & Sustainability since 2016.
Principal education and professional experience: M.A. in Human Resources Management from Bournemouth University. SVP Human Resources, Papyrus, Director Global HR Operation, Damco, Head of HR, Damco Nordic, Baltic and Russia. Compensation and Benefit Manager, Volvo Car Corporation.Other current assignments/positions: –Holding: –
321 Stefan Syrén*
Born 1966. President and CEO since November 2019. SVP Business Unit Safe Storage and SVP Business Unit Integrated Security since 2018.
Principal education and professional experience: M.Sc. Chemical Engineering, Chalmers University of Technology. Senior positions at Procter & Gamble, COO, Papyrus and CEO, Alliance Healthcare Deutschland.Other current assignments/positions: Board member of Spakera Holding AB.Holding: 140,000 shares and 250,000 call options.
* Succeeded Henrik Lange as President and CEO 7 November 2019.
54
1 2 3
4 5
Group Executive Team March 2020
The information above refers to the situation of March 2020. Shareholdings include members’ own holdings and those of spouses, minors and children living at home, holdings of associated companies and holdings through capital insurance.

Gunnebo Annual Report 2019 / Corporate Governance
42
1 2 3
4
7
5
8
6
Board of Directors as of 31 December 2019

43
Anna Borg Sæther
Born 1971. Board member since 2017. Member of the Audit Committee.
Principal education and professional experience: Masters in Economy and Political Science, Uppsala University. Senior positions at Vattenfall and Klarna.Other current assignments/positions: CFO, Vattenfall AB. Board member of Cellmark AB and deputy Board member of Maeterlinck AB.Holding: 3,750 shares.
Independent in relation to the Company and the Group Executive Team, as well as the Company’s major shareholders.
3 Göran Bille
Born 1955. Board member since 2008. Member of the Remuneration Committee.
Principal education and professional experience: Master of Science in Business Administration, Stockholm University. President and CEO, AB Lindex and Gina Tricot AB. Leading positions within the H&M group, including President of H&M Rowells, Country Manager of H&M Sweden and Divisional Manager of H&M Woman.Other current assignments/positions: Board member of KappAhl AB (publ).Holding: 62,500 shares.
Independent in relation to the Company and the Group Executive Team, as well as the Company’s major shareholders.
21 Martin Svalstedt
Born 1963. Chairman of the Board of Directors since 2008 and Board member since 2003. Chairman of the Remuneration Committee.
Principal education and professional experience: Master of Science in Business Administration, Karlstad University. CEO, Stena Adactum AB, CFO, Capio AB. Senior financial positions at Stora Enso and ABB.Other current assignments/positions: Board member, Stena Adactum AB. Chairman of the Board of Ballingslöv International AB and Stena Renewable AB. Deputy chairman of the Board of Envac AB. Board member of Scandic Hotels Group AB (publ) and Svedbergs i Dalstorp AB.Holding: 255,738 shares.
Independent in relation to the Company and the Group Executive Team, but not in relation to the Company’s major shareholders.
Mikael Jönsson
Born 1963. Board member since 2000. Member of the Audit Committee and the Remuneration Committee.
Principal education and professional experience: University studies in Economics, Gothenburg School of Business, Economics and Law at the University of Gothenburg. Various senior positions at Vätterledens Invest AB.Other current assignments/positions: CEO and board member of Vätterledens Invest AB. Chairman of the board of Lids Industri AB, Kopparbergs Bryggeri AB, Brovallsmacken AB and Tjugotjugonio AB. Board member of Bådefluna Invest AB, Wipcore AB and Nordic E-Commerce Knowledge AB. Holding: 191,666 shares.
Independent in relation to the Company and the Group Executive Team, but not in relation to the Company’s major shareholders.
Charlotte Brogren
Born 1963. Board member since 2012.
Principal education and professional experience: Ph.D., Lund University. Leading positions within ABB. Other current assignments/positions: CTO, Alimak Group AB (publ). Chairman of the board of HMS Networks AB. Board member of the Swedish Foundation for Strategic Research.Holding: 3,750 shares.
Independent in relation to the Company and the Group Executive Team, as well as the Company’s major shareholders.
Eva Elmstedt
Born 1960. Board member since 2015. Chairman of the Audit Committee.
Principal education and professional experience: Bachelor of Science, double major in Economics and Computer Science (Honors), Indiana University of Pennsylvania and Stockholm School of Economics. Senior positions within Nokia (Executive Vice President and Head of Services, Nokia Networks and Nokia Siemens Networks), Ericsson and telecom operator 3.Other current assignments/positions: Chairman of the Board of Proact IT Group AB. Board member of Addtech AB, Arjo AB (publ), Semcon AB (publ) and Smart Eye AB (publ). Holding: 21,983 shares.
Independent in relation to the Company and the Group Executive Team, as well as the Company’s major shareholders.
654
Micke Fridström
Born 1964. Member of the Board since 2018. Representative of Unionen.
Principal education and professional experience: Electrical and tele-technical education. Key Technician, Gunnebo Business Unit Integrated Security in Sweden.Other current assignments/positions: –Holding: 1,250 shares.
Crister Carlsson
Born 1965. Member of the Board since 2019. Representative of Unionen.
Principal education and professional experience: Electric Power Engineering. Key Technician, Gunnebo Business Unit Cash Management in Sweden.Other current assignments/positions: –Holding: –
87
The information above refers to the situation of March 2020. Shareholdings include members’ own holdings and those of spouses, minors and children living at home, holdings of associated companies and holdings through capital insurance.
44
Gunnebo Annual Report 2019 / Sustainability Report
Financial PerformanceAchieve the Group’s financial goals by driving a sustainable business
GovernanceDemonstrate clear and ethical leadership
SuppliersEstablish clear guidelines and expectations for suppliers and implement necessary controls
Health & SafetyProvide safe working conditions and prevent any major incidents
Development, Training & EngagementDevelop employees and the organisation
CommunityAct positively in the local community
Climate & EnergyReduce the Group’s energy consumption and CO2 emissions
Natural ResourcesOptimise use of water and raw materials
WasteManage waste to reduce its impact
Sustainability ReportAs a global provider of security solutions within Entrance Control, Safe Storage, Cash Management and Integrated Security, the Gunnebo Group is engaged in sustainability. The Group considers sustainability to be a key success factor and strongly believes that it goes hand in hand with the ambition of Gunnebo being a leading provider of a safer future.
In 2018, Gunnebo decided to embrace a whole new Sustainability Approach. This was done in order to anchor the Group’s com-mitment even more firmly in the corporate culture. Gunnebo’s sustainability approach focuses on three pillars:Our Business: The Group aims to build and maintain a sustainable and ethical business – internally and in collaboration with its busi-ness partners.Our People: The Group wants to offer good working and living conditions for both em-ployees and the people around it.Our Impact: The Group wants to minimise its impact on the planet by controlling its waste, emissions, and consumption of ener-gy and natural resources.
Sustainability Management
The Group’s work with sustainability is based on the Code of Conduct that supports sus-tainable activities across the value chain. The Code of Conduct’s ethical guidelines are complemented by clear leadership, which aim to provide the Group’s employees with the tools needed to manage the broad spec-trum of opportunities and risks faced by a global business.
Gunnebo’s sustainability targets were es-tablished in 2016, with 2016 being the base year. The targets are based on an assess-ment and represent areas where Gunnebo has the greatest impact on society, the envi-ronment and employees, and what has the greatest influence on Gunnebo’s results.
The focus is on energy and climate, waste management, environmental management, compliance with the Code of Conduct in the supply chain, and occupational health and safety.
The Group’s sustainability reporting runs parallel with other reporting and includes all manufacturing units and sales units. Energy consumption and waste recycling are among the parameters reported on a quarterly basis as well as accidents and status on suppliers’
compliance with the Code of Conduct. The reporting procedures enable transparent, trustworthy documentation of Gunnebo’s sustainability impact and form the basis for target follow-up.
The management of sustainability risks is an integral part of the Group’s risk manage-ment process.
Read more about the Group’s risk management on pages 30–32.
Group Sustainability Committee
Appropriate structures need to be put in place if sustainability is to be systematical-ly integrated into business practices. The Sustainability Committee is made up of the Group’s CEO and six SVPs from the Group Executive Team which represent all areas of the company. They meet three times a year, and the members’ responsibilities include: promoting the sustainability agenda through-out the Group, defining strategic priorities and programmes and monitoring progress.
The committee’s focus in 2019 has been to fully implement the Group’s new Sustaina-bility Approach and to follow up on the deci-sions made in 2018: to implement a Suppli-er’s Code of Conduct, to communicate about the approach through Sustainability days and to ban single-use plastics from offices around the globe.
This year, a few key decisions were also taken linked to the latest strategic changes in the Group: • Update of the Group Code of Conduct,• Employee Engagement Survey,• Focusing on occupational safety in key
areas where the Group has its highest risk,• Developing a new assessment tool to track
the changes and progress in the Group related to Sustainability.In 2020, the Group is planning to further
embed those changes in daily practices and transition to a new set of non-financial targets.
Gunnebo Sustainability
Approach
Our People
Our Business
Our Impact

45
Gunnebo’s stakeholders are found worldwide. The Group’s business develops through open dialogue, feedback from the market and the expectations and needs of stakeholders. Gunnebo’s main stakeholders are those that most greatly influ-ence or are influenced by its business activities – customers, employees, suppliers and shareholders.Customers: During 2019 customer surveys have been carried out on several of the Group’s markets, the results from which lead to continuous improvements.Employees: The Group is maintaining constant dialogue with employees through different channels, driven and monitored by Group HR. Employee engagement surveys are important tools for understanding what is working well and identifying where further efforts are needed and a new global survey was con-ducted in late 2019. It disclosed areas of improvements and as
a means of measuring progress and effectiveness of the actions taken, it will be renewed during 2020. See more on outcome on page 49 under “Our People”.Suppliers: Relationships with the Group’s suppliers are devel-oped through regular interaction to ensure that the suppliers comply with Gunnebo’s Supplier’s Code of Conduct. Published in late 2018, the Group has made continuous effort in communi-cating its new Supplier’s Code of Conduct throughout 2019.Shareholders: The dialogue with shareholders has been very important during 2019, due to the successful rights issue carried out in the third quarter. The communication with share-holders is based on the Annual General Meeting, but also takes place in meetings with shareholders, investors and analysts, and presentations at various shareholder meetings, with a high level of ambition as regards accessibility.
Non-Financial Targets
Gunnebo’s sustainability targets were established in 2016, with 2016 as the base-year and 2020 as the year for fulfillment. The targets support sustainable, profitable growth. By taking a long-term approach to sustainability, with clearly defined
targets, it is ensured that Gunnebo’s some 4,200 employees create a sustainable, attractive offering for the customers and partners resulting in value for the shareholders.
Stakeholder Dialogue
Target Aggregated Outcome 2016–2019
Energy & Climate Reduce the use of electricity at manufacturing and major sales units by 8% from 2016 to 2020.
Reduce CO2 emissions from production sites and sales units by 15% from 2016 to 2020.
Reduce CO2 emissions from own fleet by 20% on average from 2016 to 2020.
Total electricity consumption 16,748 MWh (Base year 2016: 16,695), an increase of 0.3%.
Total CO2 emissions 18,814 tonnes CO2 (Base year 2016: 19,298), a decrease of 2.5%.
Average CO2 126g/km (Base year 2016: 133), a decrease of 4.6%.
Supply ChainAs a global organisation, Gunnebo’s goal is to ensure that all major suppliers comply with the Group’s Code of Conduct.
Gunnebo published a new Code of Conduct for suppliers in 2018. At the end of 2019, 93% (70% in 2018) of the Group’s major suppliers were compliant.
Health & Safety
Gunnebo’s goal is to create healthy, suitable working environments where employees can develop their full potential. In its work for a safe working environment, the aim is for all manufacturing units to be OHSAS 18001 or ISO 45001 certified.
At the end of 2019, seven out of nine manufacturing units were certified to OHSAS 18001 (Base year 2016: three out of eight).
Waste Increase recycling of non-hazardous waste in production by 8% from 2016 to 2020.
97.7% (Base year 2016: 97.4) of all non-hazardous waste generated in manufacturing units was recycled.
Environmental Management Systems
All manufacturing units ISO 14001 certified.
At the end of 2019, all sites but one had been cer-tified.

Gunnebo Annual Report 2019 / Sustainability Report
Gunnebo understands sustainability not only within the context of environmental pro-tection, but also as a whole approach. The growth and profitability of Gunnebo enables the Group to invest in innovations that drive higher levels of efficiency so more environ-mental benefits can be achieved.
Code of Conduct
In 2019, Gunnebo has updated its Code of Conduct in order to reflect the latest stra-tegic changes in the Group and integrate it within its Sustainability Approach. While the
overall structure and some content has been renewed, the core is identical: Gunnebo’s Code of Conduct aims to give employees clear guidelines, defining how they should act ethically in their jobs and act professionally in their interactions with all of the Group’s stakeholders. It is based on: • UN Declaration of Human Rights• UN Global Compact• ILO Principles of Rights at Work• OECD Guidelines for Multinational
Enterprises• UN Convention against Corruption
• ISO 26000 Guidance on social responsibilityThe latest version of the Code of Conduct
can be found at www.gunnebogroup.com.During 2019 and following this update, it
was the Group ambition to refresh all em-ployee’s training on the Code of Conduct through its HR online training platform. Hence, at the end of 2019, over 99% of all employees had taken this refreshment train-ing.
This training activity is also part of the introduction programme for new employees
46
Our Business
Gunnebo’s sustainability impact across the value chain derives from both direct and indirect operations. Ability to manage impact starts with product development activities, followed by purchasing, manu-facturing, sales, delivery and installation, service and end of use. The table below summarises the Group’s sustainability impact and how that impact is managed.
Product Development Purchasing Manufacturing Sales Delivery and Installation Service and End of Use
Description of impact
Product development is a vital part of all Business Unit’s growth strategies. Sustainability concerns start at the conceptual phase. All Business Units create new products, anticipating future needs, without compromising on quality, price or sustainability. The choice of materials can impact the environment and the people who make and use the products. Thereby, it is important to consider the length of the products’ full lifecycle, their energy consumption and how they are disposed of at the end of their lifecycle.
Product development is an important step that will set in motion industrialisation, where one can control future costs and avoid unnecessary steps and waste.
To build a strong supply chain, Gunnebo selectively chooses its suppliers. The Group invests in win-win relationships to assure the ultimate objective: to serve the needs of end customers and create value for the Group’s stakeholders.
When business partners are selected, it is important to consider the impact on them and their impact on the environment. Gunnebo supports jobs creation beyond its operations, through building strategic partnerships. It is the Group’s responsibility to make sure that business is carried out in accordance with Gunnebo Supplier’s Code of Conduct throughout the supply chain regarding environmental care, occupational health, human rights and anti-corruption.
Gunnebo operates nine manufacturing units worldwide with about 1,100 employees. This workforce provides the input and flexibility the Group needs to meet customers’ demands. Gunnebo works continuously at all these sites to reduce the environmental footprint while optimising performance and maintaining high standards of quality and safe working conditions.
Gunnebo’s work with sustainability is largely customer-driven. By providing high-qualitysecurity products, services and software, the Group aims to create value and build a safer future for customers around the world.
Gunnebo has sales companies in more than 20 countries. The Group also has a channel partner network, giving it access to 100 additional markets.Gunnebo focuses its customer offering through its four Business Units. Local knowledge in each market combined with a global presence allows Gunnebo to deliver to businesses of all sizes, helping them to create a safer world for their customers, their employees and society as a whole.Throughout the sales process, regardless of channel, Gunnebo works to counter corruption.
In terms of logistics footprint, Gunnebo’s manu-facturing units are located in Americas, Europe and Asia. In order to optimise the transportation of products, the Group builds partnerships with selected logistics companies to deliver a high standard of service while considering cost and environmental impact. Once delivered, products are installed by either Gunnebo’s own employees or sub-contractors. The Group works continuously to maintain high standards of quality and safe working conditions throughout the installation process.
Management of the complete lifecycle is important for Gunnebo. Gunnebo’s products are meant to last and the Group’s competitive advantage is based on total cost of ownership. It is the Group’s ambition to ensure that all clients receive good service throughout the entire lifecycle. Gunnebo offers services which are tailor-made to customer needs.
Gunnebo can also be a preferred partner when it comes to finding a replacement for outdated materials and identifying recycling and disposal options.
Factors affecting
impact
• Choice of materials (hazardous and non- hazardous) used in products
• Length of product lifecycle• End of use, recycling and disposal• Efficiency in industrialisation
• Economic, social and environmental impacton suppliers
• The origin of parts and raw materials• Transportation and greenhouse gas emis-
sions• Packaging waste
• Energy consumption• Water consumption• Waste disposal and water discharge• Employment and working conditions
• Financial performance of sales• Employment and working conditions• Product offering delivering sustainable solutions
• Transportation and GHG emissions• Economic, social and environmental impact on
transporters and sub-contractors• Employment and working conditions• Packaging waste
• Economic performance in service sales• End of use, recycling and disposal• Electronic and metallic waste• Technicians’ transportation and GHG emissions
Tools to manage impact
• Proportion of different materials in products• Procedures to control the use of hazardous
materials• Product certification• Industrialisation procedure
• Group purchasing strategy• Supplier assessment• Supplier’s Code of Conduct• Local supplier policy• Development of suppliers
• Environment and safety management system (ISO 14001 and OHSAS 18001)
• Code of Conduct• Group sustainability targets
• Group Business Units sales and marketing strategy• Customer survey• Code of Conduct
• Group logistics strategy• Transportation optimisation• Transporter and sub-contractor assessment• Code of Conduct
• Group after-sales and service strategy• Portfolio of offering for service, replacement and
disposal of products• Route-planning for technicians
Sustainability Impact Across the Value Chain

to help ensure understanding of Gunnebo’s corporate culture. It is the responsibility of each manager within the Gunnebo organ-isation to ensure that employees are fully informed about the Group’s Code of Con-duct and to ensure that it is implemented and followed. Managers should act in such a way that their behavior is an example of the Code of Conduct in practice.
Supply Chain
Our operations and customers are all over the world. As such, the Group wants to
ensure that it can source products and servi-ces of a consistently high quality everywhere. In response, a global network of suppliers for the Group manufacturing units has been established. Today, this network compris-es several thousands of suppliers with a total purchasing volume of approximately €100million. Around 80% of this figure is attributable to 250 suppliers, which are the Group’s major suppliers.
In order to clearly define the Group’s ex-pectations, the Gunnebo Supplier’s Code of Conduct has been released at the end
of 2018. The Group strives to ensure that all major suppliers adhere to this Supplier’s Code of Conduct and uses the principles therein among the criteria for selecting new business partners.
At the end of 2019, 93% of the Group’s major suppliers were declaring in line with the principles that are set in the Supplier’s Code of Conduct.
Furthermore, in 2019, 34 suppliers audits on Sustainability have been performed by the purchasing teams in order to follow up on compliance with the most critical suppliers.
47
Product Development Purchasing Manufacturing Sales Delivery and Installation Service and End of Use
Description of impact
Product development is a vital part of all Business Unit’s growth strategies. Sustainability concerns start at the conceptual phase. All Business Units create new products, anticipating future needs, without compromising on quality, price or sustainability. The choice of materials can impact the environment and the people who make and use the products. Thereby, it is important to consider the length of the products’ full lifecycle, their energy consumption and how they are disposed of at the end of their lifecycle.
Product development is an important step that will set in motion industrialisation, where one can control future costs and avoid unnecessary steps and waste.
To build a strong supply chain, Gunnebo selectively chooses its suppliers. The Group invests in win-win relationships to assure the ultimate objective: to serve the needs of end customers and create value for the Group’s stakeholders.
When business partners are selected, it is important to consider the impact on them and their impact on the environment. Gunnebo supports jobs creation beyond its operations, through building strategic partnerships. It is the Group’s responsibility to make sure that business is carried out in accordance with Gunnebo Supplier’s Code of Conduct throughout the supply chain regarding environmental care, occupational health, human rights and anti-corruption.
Gunnebo operates nine manufacturing units worldwide with about 1,100 employees. This workforce provides the input and flexibility the Group needs to meet customers’ demands. Gunnebo works continuously at all these sites to reduce the environmental footprint while optimising performance and maintaining high standards of quality and safe working conditions.
Gunnebo’s work with sustainability is largely customer-driven. By providing high-qualitysecurity products, services and software, the Group aims to create value and build a safer future for customers around the world.
Gunnebo has sales companies in more than 20 countries. The Group also has a channel partner network, giving it access to 100 additional markets.Gunnebo focuses its customer offering through its four Business Units. Local knowledge in each market combined with a global presence allows Gunnebo to deliver to businesses of all sizes, helping them to create a safer world for their customers, their employees and society as a whole.Throughout the sales process, regardless of channel, Gunnebo works to counter corruption.
In terms of logistics footprint, Gunnebo’s manu-facturing units are located in Americas, Europe and Asia. In order to optimise the transportation of products, the Group builds partnerships with selected logistics companies to deliver a high standard of service while considering cost and environmental impact. Once delivered, products are installed by either Gunnebo’s own employees or sub-contractors. The Group works continuously to maintain high standards of quality and safe working conditions throughout the installation process.
Management of the complete lifecycle is important for Gunnebo. Gunnebo’s products are meant to last and the Group’s competitive advantage is based on total cost of ownership. It is the Group’s ambition to ensure that all clients receive good service throughout the entire lifecycle. Gunnebo offers services which are tailor-made to customer needs.
Gunnebo can also be a preferred partner when it comes to finding a replacement for outdated materials and identifying recycling and disposal options.
Factors affecting
impact
• Choice of materials (hazardous and non- hazardous) used in products
• Length of product lifecycle• End of use, recycling and disposal• Efficiency in industrialisation
• Economic, social and environmental impacton suppliers
• The origin of parts and raw materials• Transportation and greenhouse gas emis-
sions• Packaging waste
• Energy consumption• Water consumption• Waste disposal and water discharge• Employment and working conditions
• Financial performance of sales• Employment and working conditions• Product offering delivering sustainable solutions
• Transportation and GHG emissions• Economic, social and environmental impact on
transporters and sub-contractors• Employment and working conditions• Packaging waste
• Economic performance in service sales• End of use, recycling and disposal• Electronic and metallic waste• Technicians’ transportation and GHG emissions
Tools to manage impact
• Proportion of different materials in products• Procedures to control the use of hazardous
materials• Product certification• Industrialisation procedure
• Group purchasing strategy• Supplier assessment• Supplier’s Code of Conduct• Local supplier policy• Development of suppliers
• Environment and safety management system (ISO 14001 and OHSAS 18001)
• Code of Conduct• Group sustainability targets
• Group Business Units sales and marketing strategy• Customer survey• Code of Conduct
• Group logistics strategy• Transportation optimisation• Transporter and sub-contractor assessment• Code of Conduct
• Group after-sales and service strategy• Portfolio of offering for service, replacement and
disposal of products• Route-planning for technicians

48
Gunnebo Annual Report 2019 / Sustainability Report
This to mitigate a significant proportion of the Group risks and impacts in Sustainability.
Reporting of Violation
All Gunnebo employees are informed about how to report any conduct that they believe to be a violation of law or of the Gunnebo’s Code of Conduct to their immediate manag-er. If that manager is in any way involved in the situation being reported or has any other form of conflicting interests, the employee reports the situation to the manager’s im-mediate superior. If, for any reason, neither of these reporting channels can be used, the alleged violation may be reported in accordance with Gunnebo’s whistle-blowing procedure.
Human Rights
As a global organisation, it is Gunnebo’s ambition to comply with human rights prin-ciples in controllable aspects of its business. Gunnebo respects international conventions on human rights, which act as guidance for all of the Group’s own operations.
Gunnebo’s approach to human rights is stated in the Code of Conduct and stresses that all humans, whatever nationality, gender, ethnic origin, religion, language, or any other status, are all equally entitled to human rights without discrimination.
Gunnebo does not tolerate any form of harassment or violence in the workplace, and the use of forced labour and child labour is strictly prohibited in all company opera-tions. This is important to state, as Group operations are conducted to a certain extent in high-risk countries in terms of child and forced labour.
The human rights risk means risk of child labour, forced or compulsory labour but also risk of discrimination, prevention of freedom of association and collective bargaining as well as health and safety issues. Human rights risk is not considered to be material for Gunnebo’s direct operations, but as the Group does business with suppliers from high-risk countries the Group strives to get all major suppliers to comply with the supplier Code of Conduct. The Group shall not do business with suppliers that do not uphold basic human rights. Working
with human rights with regard to suppliers involves training activities and mandatory self-assessments for compliance with the supplier Code of Conduct.
Anti-Corruption
Gunnebo’s approach to anti-corruption is stated in the Group’s Code of Conduct and in the fraud and corruption policy. The Group applies zero tolerance to all cases of bribery and corruption. No employee of Gunnebo should accept any gift or personal favour that might reasonably be believed to have an in-fluence on business transactions. Deviations should be reported to management. The impact of corruption effects both Gunnebo and its stakeholders. Business not conduct-
ed in an ethical manner might lead to impris-onment and financial penalties and effects both partners and their employees by unfair and uncontrolled terms, as well as Gunnebo by damage to its reputation and results. The corruption risk arises in both sales and pur-chasing situations.
As the Group also does business with partners from countries with a high risk of corruption, it strives to get its partners to comply to its ethical value. Therefore, the Group published it supplier’s Code of conduct in 2018 and its Business Partner’s Code of Conduct in 2019. Those documents outline the Group expectations and their principles set the criteria for selecting new business partners.
Manufacturing UnitsAt the end of 2019, the Group had nine manufacturing units in nine countries worldwide. All of them are certified ISO 9001, eight out of nine ISO 14001 and seven out of nine OHSAS 18001 or ISO 45001.
EuropeDoetinchem, Netherlands
Factory employees: 114Production: ATM safesCertification: ISO 14001, ISO 9001, OHSAS 18001
Lavis, Italy
Factory employees: 77Production: Entrance control Certification: ISO 14001, ISO 9001, OHSAS 18001
Markersdorf, Germany
Factory employees: 47Production: Safes and vaults Certification: ISO 14001, ISO 9001, OHSAS 18001
Binefar, Spain
Factory employees: 91Production: Cash managementCertification: ISO 14001, ISO 9001, OHSAS 18001
Zlin, Czech Republic
Factory employees: 73Production: Entrance controlCertification: ISO 9001
AsiaHalol, India
Factory employees: 321Production: Safes and vaults, ATM safes, Entrance control Certification: ISO 14001, ISO 9001, OHSAS 18001
Jakarta, Indonesia
Factory employees: 227Production: Safes and vaultsCertification: ISO 14001, ISO 9001, OHSAS 18001
Kunshan, China
Factory employees: 58Production: Entrance controlCertification: ISO 14001, ISO 9001
Americas Cincinnati, USA
Factory employees: 115Production: Safes and vaults, cash managementCertification: ISO 14001, ISO 9001, OHSAS 18001

49
Gunnebo’s employees are the Group’s great-est asset and the key to long-term growth and success. The Group wants to be an employer that people are proud to work for. Gunnebo’s employees make their own con-tributions to sustainable development, both in their daily business lives and as members of society.
Employees
Gunnebo is working purposefully to create a common culture, with dedicated employees who take responsibility, work together and have an inclusive approach. An important aspect of a successful business is that the Group’s 4,256 (4,449) employees at year-end reflect the diversity of its customers and society.
The Gunnebo Group strives to be an em-ployer that offers equal opportunities for all employees and fosters differences and potential in an endeavor to meet customers’ needs and build a long-term profitable busi-ness. This goal is put into practice through a number of diversity and equality activities, and various development programmes. By offering safe and healthy working environ-ments, the Group aims to create workplaces where employees can develop.
Your Voice Employee Survey
Employee surveys are important tools for understanding what is working well and iden-tifying where further efforts are needed. At the end of 2019, a new employee engage-ment survey was carried out in the Group. Results among other show an increased level of employee engagement. This is positive, against the backdrop of all organisational changes that have taken place during last year.
The global survey also disclosed areas of improvements. Notably is also the high participation rate of close to 85% which indicates a genuine interest in the Gunnebo organisation about sharing their opinion.
Result is being analyzed and leaders are trained in utilising the result in the best way. This survey will be followed up already during Q3 2020 with another agile survey in order to drive further improvements.
Occupational Health and Safety
It is the Group’s goal and major responsibility to provide safe working conditions for its employees and people exposed to its activ-
ities and thereby offer healthy working envi-ronments where employees can develop and grow. Focus on this matter prevents negative impact for employees in form of accidents in the workplace and also contributes to Gunnebo’s reputation as a responsible em-ployer.
The main focus is to control main risk activities through dedicated programmes in order to prevent any major incidents. Gunne-bo cannot accept any event that could result in an employee being seriously injured.
To support its approach, the Group is implementing a new Group Health & Safety group policy since the end of 2018. It ap-plies to all Gunnebo operations and will help protect employees, visitors, locations and surrounding communities.
During 2019 increased focus has been put on initiatives cross the Group and outcome is 41% decrease in injuries. A step in the right direction and the Group’s ambition contin-ues.
Especially, the Group is committed to control the risks associated with hazardous process in its manufacturing facilities by developing safety management systems. Gunnebo’s aim is that all manufacturing units should be certified to the OHSAS 18001 or ISO 45001 management system for health and safety. At the end of 2019, seven out of nine units were certified according to this
standard and are preparing the transition to the new ISO 45001 standard in 2020.
Risk assessments are also conducted for every activity of the Group, which result in lo-cal prevention action plans in accordance to local regulation. The Group is also starting to implement Group safety standards in order to go further than regulations and put under control its high risks activities.
In order to manage the accident reporting, investigation and assessment process in a uniform way, the Group has a global report-ing system to better understand causes for any incident, and to define counteractive measures to avoid repeats and improve the way of working. This enables to monitor the performance as a Group with the aim to reduce the frequency of accidents on a permanent basis. This reporting process has enabled the Group to implement a quarterly newsletter and meeting where results, the most recent serious events and the possible preventive actions are shared and discussed.
Performance management Gunnebo’s performance management pro-cess places an emphasis on commitment and accountability around agreed individual objectives. Individual development is a two way street – with performance management the Group has introduced self-assessments and more employee involvement. Perfor-
Our People
83% 17%
83% 17%
83% 17%
83% 17%
83% 17%
83% 17%
Employees by Country Employees by Region
Gender Distribution
Managers Employees
India, 23% Indonesia, 16% Netherlands, 8% Spain, 7% Mexico, 5% Sweden, 5% USA, 5% Czech Republic, 4% Germany, 4% Italy, 4% UK, 3% Brazil, 3% China, 3% Other, 10%
EMEA, 40% Asia-Pacific, 44% Americas, 16%
Men Women
83% 17%
83% 17%

50
mance management is a process to ensure each employee makes a real impact on the business. During 2019, it became fully digital which enhances the ability to both improve the quality of the feedback as well as focus and endurance.
Gunnebo’s focus is to plan for its employ-ees’ development, so that it goes hand in hand with the Group’s business goals. The aim is to give all employees opportunities to develop to their full potential, and to know what is expected of them in the short and long term. Structured personal development reviews are therefore conducted every year with all employees in the Group. The aim of these reviews is to set individual goals and formalise the assessment of personal progress. They are also an important tool in ensuring that all employees work towards the same goals, i.e. full implementation of the Group’s strategy.
Development of employeesCollaboration and capitalising on internal strengths and resources are prioritised areas in Gunnebo’s leadership development pro-grammes. It is therefore the aim of the Group that all managers should participate in at least one of the programmes being offered, namely: • “The ACE” (Action, Communication, En-
gagement) development programme is the leadership foundation for all within Gunne-bo Group,
• “Road to Growth” is a leadership pro-gramme intended for middle managers with potential to grow in Gunnebo,
• The Group’s programme for employees in senior positions who usually report to a member of the Group Executive Team is called “Challenger”. During 2019 the Group also launched
dedicated training initiatives to support the organisational transformation. Focus has been placed on change management train-ings for leaders.
E-learning platform for trainingTo facilitate the dissemination of knowledge and increase accessibility to training, Gun-nebo has made a broad scope of e-courses available for its employees, covering skills such as project management, communica-tion and sales training. Taking courses online contributes to reducing the costs and envi-ronmental impact associated with travelling.
The courses and information sharing are available in the e-platform and is an impor-tant base for employee development and performance management, where the perfor-mance management system is connected to the e-platform for training to facilitate for both employees and managers to embed these classes in the personal development plan. Increased utilisation year over year shows the dedication from employees to continue to develop.
Human capital risk The human capital risk is significant for Gunnebo. The Group strives to recruit and retain the right people. The risk is handled by clearly defined wanted behaviors stated in the Performance Cornerstones and these are used in the recruitment process for profile mapping as well as in performance manage-ment.
EqualityGunnebo’s employees are recruited and promoted solely based on their qualifications for the job. Equal opportunities and treat-ment apply for all the Group’s employees irrespective of gender, marital status, ethnic or national background. Each employee shall be rewarded in a correct and fair manner in accordance with their individual performance and contribution to the success of the com-pany.
Equality is an important element of the Group’s work with diversity. Of the Group’s employees, 17% are women and 17% of the Group’s managers are women.
Gunnebo’s aim is to ensure that women and men are treated equally and provided with the same opportunities to develop. To increase the proportion of female employees and achieve a more balanced gender distri-bution in the long term, the Group works, for example, to promote the inclusion of female employees in the succession planning pro-cess as well as the participation of women in leadership development programmes. Since the Group’s pay structure is based on a glob-al system, it supports the ambition of equal pay for equal work, where any differences in pay levels are driven by local conditions.
DiversityOne of Gunnebo’s strategic goals is to in-crease insight into and harness the benefits of the Group’s diversity. For a global compa-
ny, understanding of local market conditions, cultural and employee needs, is pivotal to develop the business. Diversity is encour-aged at all levels in the Group and Gunnebo strives to represent as many dimensions of diversity as possible and to meet customer demands in a global market. This work con-siders gender, origin, industry background and other indicators of diversity. At year-end 2019, Gunnebo had 498 (considering all the employees who have direct reports) compa-ny managers and members of management teams, representing 35 nationalities.
Social conditionsGunnebo strives to be an organisation char-acterised by equality and diversity, traits which contribute to creativity and breed new ideas, which in turn are a prerequisite for business success. Gunnebo continuously has several global projects under way to ensure that the company fosters the Group’s diversity and develops equal workplaces.
The Group’s recruitment tool supports an objective recruitment process as it measures several different personality traits that are relevant to occupational settings. Ultimately the test measures traits with the purpose of determining behavioural styles of work. This enables Gunnebo to as objectively as possi-ble determine the best candidate for the job posted. Social conditions are not considered to be material for Gunnebo’s direct opera-tions. Gunnebo manages this sustainability risk with support from the Group’s code of conduct, its recruitment and remuneration policy as well as global system for pay struc-ture.
Local activitiesThe Gunnebo code of conduct helps ensure that the Group runs its business ethically and that potentially negative social impact is understood and avoided. In addition to social issues in purchasing and production, Gun-nebo also plays an active role in the commu-nities where it operates, creating additional positive social impact and strengthening the local communities where the Group oper-ates. Its local companies are encouraged to support politically and religiously unaffiliated grass root projects in their vicinity which lead to greater equality, and a higher level of education and general standard of living.
Gunnebo Annual Report 2019 / Sustainability Report
51
Our ImpactAs a company that operates at an international level, Gunnebo recognizes its responsibilities concerning the impact that its business activities have on the environment. The Group has formalised its commit-ment to environmental excellence when adopted the first Environmental Policy in 2008 which has latest been updated in 2018.
Environment
The activities of the Group are always carried out with consideration for the environment. Environmen-tal impact under the Group’s direct control, is to be minimized in the day-to-day operation, and resourc-es are to be used sparingly and efficiently.
Environmental impacts primarily take place in production processes through material and energy consumption, emissions to air and water, or the creation of noise and waste. To restrict the environ-mental impact of production, the Group has all of its manufacturing units but one certified in accordance with ISO 14001. Environmental risk analyses are carried out in connection with such certification. These analyses provide good information about the various risks at the manufacturing units and relevant action programmes can then be implemented on a local scale. The systems also include procedures for internal audits and the handling of non-conformities. Inspections are performed regularly by external certification bodies.
Environmental targets and reportingIn 2016, Gunnebo identified the areas where its environmental impact is greatest and set a number of non-financial targets for its environmental perfor-mance. Since then, the Group has been working to secure this reporting and regularly updates infor-mation to make sure its environmental management remains relevant. The following areas were identified as having the greatest environmental impact: the use of electricity at manufacturing units and large sales units, carbon dioxide emissions from man-ufacturing and sales units as well as from its own fleet of vehicles, and the recycling of non-hazardous waste in production. Hence, in 2016, new goals were set for all of these areas, while reporting pro-cedures were improved and quality assured.
Looking aheadAs mentioned, the group updated its ten year old Environmental Policy in 2018. By reviewing risks and impact analysis, it was decided to focus on: • Decreasing CO
2 emissions and energy con-sumption,
• Optimising the use of water and raw materials through improvement of processes,
• Managing waste in the most responsible way possible.
As such, the work in the coming years will be centered around:
• Carbon reduction strategy to better manage emis-sions from operation,
• Energy management improvement by starting a new phase of energy analysis,
• Continuous efforts to reduce fuel consumption, • Increasing the use of recycled materials, • Diminishing the impact of the packaging used, • Waste management improvement in all level of the
company, • Lifecycle perspective in the Group’s product de-
velopment procedures in order to continue efforts in areas such as reducing a product’s energy consumption and simplifying source separation when a product can no longer be used,
• Involve employees in those changes as responsi-bilities for environmental care are shared through-out the Group – every employee is responsible for thinking of the world around them and has an important role to play in the Group’s environmental work.
52
Gunnebo Annual Report 2019 / Financial Statements
Contents Financial Statements
Stay Updated
Scan this QR code with your smartphone or go to www.gunnebogroup.com
Consolidated Income Statements 54
Consolidated Statements of Comprehensive Income 54
Consolidated Balance Sheets 56
Consolidated Statements of Cash Flow 58
Consolidated Statements of Changes in Equity 60
Notes Consolidated Financial Statements 61
Parent Company 79
Parent Company Income Statements 79
Parent Company Statements of Comprehensive Income 79
Parent Company Balance Sheets 80
Parent Company Statements of Cash Flow 81
Parent Company Statements of Changes in Equity 82
Notes Parent Company 83
Proposed Distribution of Earnings 86
Proposed Policy for Remuneration to Senior Executives 87
Auditor’s Report 89
Unless otherwise stated, text and numbers refer to continuing operations.
Visit the Gunnebo Group website. The latest information for investors, analysts and financial journalists who follow the Gunnebo Group. Sign up to receive regular financial reports and press releases.


54
Gunnebo Annual Report 2019 / Financial Statements
MSEK Note 2019 2018
Net sales 2 5,459 5,128Cost of goods sold 2, 5 –4,064 –3,686Gross profit 1,395 1,442
Selling expenses 2, 5 –663 –611Administrative expenses 2, 5 –517 –577Other operating income 8 24 42Other operating expenses 8 –47 –31Operating profit (EBIT) 192 265
Financial income and expenses, net 9 –76 –53Profit before taxes 116 212
Income taxes 10 –71 –92Net profit from continuing operations 45 120
Net profit/loss from discontinued operations 4 — –803Net profit/loss 45 –683
Net profit/loss attributable to:Shareholders of the Parent Company 45 –683Non-controlling interests — 0
45 –683
Earnings per share before dilution, SEK 16 0.55 –8.95Of which, continuing operations, SEK 0.55 1.57Of which, discontinuing operations, SEK — –10.52
Earnings per share after dilution, SEK 16 0.55 –8.94Of which, continuing operations, SEK 0.55 1.57Of which, discontinuing operations, SEK — –10.51
Consolidated Statements of Comprehensive Income
MSEK Note 2019 2018
Net profit/loss 45 –683
Other comprehensive income
Items that will not be reclassified to the income statementRemeasurements (actuarial gains and losses) 17 –41 33Income taxes 10 9 –7Subtotal –32 26
Items that may be reclassified to the income statementTranslation differences in foreign operations 48 16Hedging of net investments 2 –2Cash flow hedges 20 1 3Subtotal 51 17
Other comprehensive income 19 43
Total comprehensive income 64 –640
Total comprehensive income attributable to:Shareholders of the Parent Company 64 –640Non-controlling interests — 0
64 –640
Consolidated Income Statements
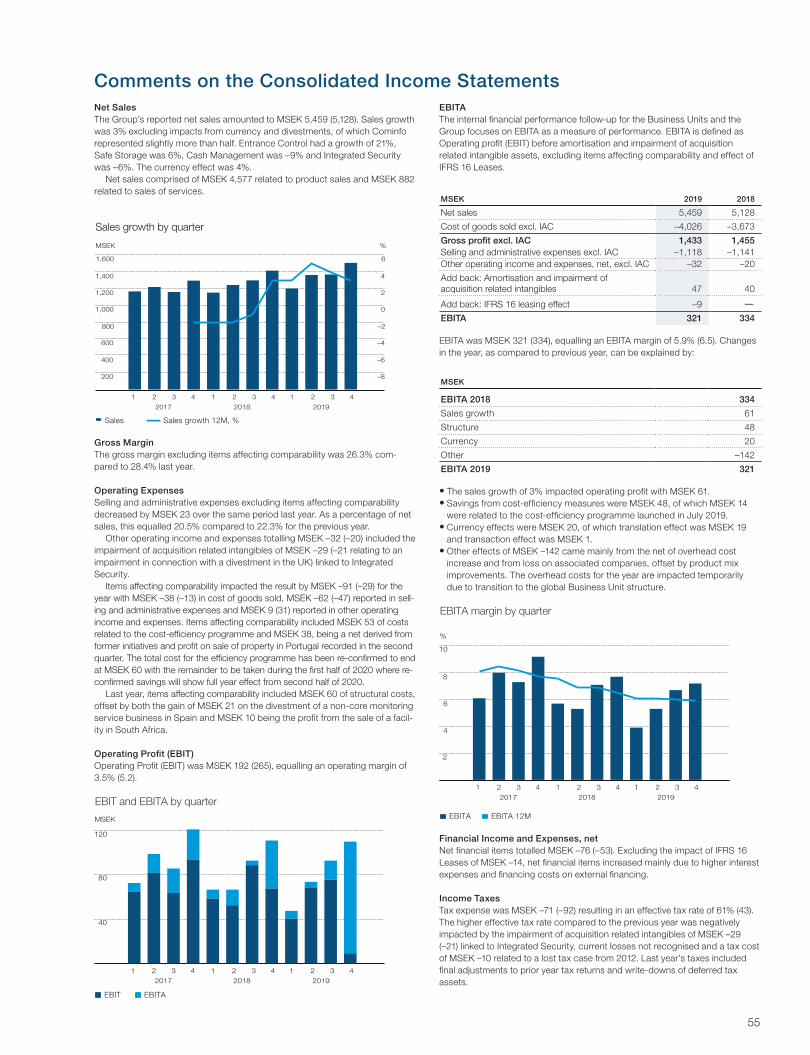
55
Comments on the Consolidated Income StatementsNet SalesThe Group’s reported net sales amounted to MSEK 5,459 (5,128). Sales growth was 3% excluding impacts from currency and divestments, of which Cominfo represented slightly more than half. Entrance Control had a growth of 21%, Safe Storage was 6%, Cash Management was –9% and Integrated Security was –6%. The currency effect was 4%.
Net sales comprised of MSEK 4,577 related to product sales and MSEK 882 related to sales of services.
%
13 14 15
–6
–4
–2
4
0
2
6
–8
201920182017
1 2 3 4 1 2 3 4 1 2 3 4
400
600
800
1,400
1,000
1,200
1,600
MSEK
Sales Sales growth 12M, %
200
Sales growth by quarter
Gross MarginThe gross margin excluding items affecting comparability was 26.3% com-pared to 28.4% last year.
Operating ExpensesSelling and administrative expenses excluding items affecting comparability decreased by MSEK 23 over the same period last year. As a percentage of net sales, this equalled 20.5% compared to 22.3% for the previous year.
Other operating income and expenses totalling MSEK –32 (–20) included the impairment of acquisition related intangibles of MSEK –29 (–21 relating to an impairment in connection with a divestment in the UK) linked to Integrated Security.
Items affecting comparability impacted the result by MSEK –91 (–29) for the year with MSEK –38 (–13) in cost of goods sold, MSEK –62 (–47) reported in sell-ing and administrative expenses and MSEK 9 (31) reported in other operating income and expenses. Items affecting comparability included MSEK 53 of costs related to the cost-efficiency programme and MSEK 38, being a net derived from former initiatives and profit on sale of property in Portugal recorded in the second quarter. The total cost for the efficiency programme has been re-confirmed to end at MSEK 60 with the remainder to be taken during the first half of 2020 where re-confirmed savings will show full year effect from second half of 2020.
Last year, items affecting comparability included MSEK 60 of structural costs, offset by both the gain of MSEK 21 on the divestment of a non-core monitoring service business in Spain and MSEK 10 being the profit from the sale of a facil-ity in South Africa.
Operating Profit (EBIT)Operating Profit (EBIT) was MSEK 192 (265), equalling an operating margin of 3.5% (5.2).
40
80
120
13 14 15
2019201820171 2 3 4 1 2 3 4 1 2 3 4
MSEK
EBIT EBITA
EBIT and EBITA by quarter
EBITAThe internal financial performance follow-up for the Business Units and the Group focuses on EBITA as a measure of performance. EBITA is defined as Operating profit (EBIT) before amortisation and impairment of acquisition related intangible assets, excluding items affecting comparability and effect of IFRS 16 Leases.
MSEK 2019 2018
Net sales 5,459 5,128
Cost of goods sold excl. IAC –4,026 –3,673
Gross profit excl. IAC 1,433 1,455Selling and administrative expenses excl. IAC –1,118 –1,141Other operating income and expenses, net, excl. IAC –32 –20
Add back: Amortisation and impairment of acquisition related intangibles 47 40
Add back: IFRS 16 leasing effect –9 —EBITA 321 334
EBITA was MSEK 321 (334), equalling an EBITA margin of 5.9% (6.5). Changes in the year, as compared to previous year, can be explained by:
MSEK
EBITA 2018 334
Sales growth 61
Structure 48
Currency 20
Other –142
EBITA 2019 321
• The sales growth of 3% impacted operating profit with MSEK 61.• Savings from cost-efficiency measures were MSEK 48, of which MSEK 14
were related to the cost-efficiency programme launched in July 2019. • Currency effects were MSEK 20, of which translation effect was MSEK 19
and transaction effect was MSEK 1. • Other effects of MSEK –142 came mainly from the net of overhead cost
increase and from loss on associated companies, offset by product mix improvements. The overhead costs for the year are impacted temporarily due to transition to the global Business Unit structure.
2
6
4
8
10
13 14 15
2019201820171 2 3 4 1 2 3 4 1 2 3 4
%
EBITA EBITA 12M
EBITA margin by quarter
Financial Income and Expenses, netNet financial items totalled MSEK –76 (–53). Excluding the impact of IFRS 16 Leases of MSEK –14, net financial items increased mainly due to higher interest expenses and financing costs on external financing.
Income TaxesTax expense was MSEK –71 (–92) resulting in an effective tax rate of 61% (43). The higher effective tax rate compared to the previous year was negatively impacted by the impairment of acquisition related intangibles of MSEK –29 (–21) linked to Integrated Security, current losses not recognised and a tax cost of MSEK –10 related to a lost tax case from 2012. Last year’s taxes included final adjustments to prior year tax returns and write-downs of deferred tax assets.

56
Gunnebo Annual Report 2019 / Financial Statements
MSEK Note31 December
201931 December
2018
ASSETS
Non-current assetsGoodwill 11 1,525 1,408Other intangible assets 11 374 306Right of use assets 12 243 —Property, plant and equipment 13 322 282Deferred tax assets 10 228 195Other long-term assets 43 50Total non-current assets 2,735 2,241
Current assetsInventories 14 754 717Total customer receivables 15 972 1,018Current tax receivables 120 113Other short-term assets 19 189 198Cash and cash equivalents 744 569Total current assets 2,779 2,615
TOTAL ASSETS 5,514 4,856
EQUITY AND LIABILITIES
Equity attributable to shareholders of Parent Company 1,464 1,087Total equity 1,464 1,087
Non-current liabilitiesLong-term financial liabilities 20 1,805 1,863Provisions for post-employment benefits 17 411 375Long-term portion of lease liabilities 12 148 —Deferred tax liabilities 10 59 50Total non-current liabilities 2,423 2,288
Current liabilitiesAccounts payable 585 594Current tax liabilities 95 113Short-term provisions 18 51 55Short-term financial liabilities 20 37 45Short-term portion of lease liabilities 12 100 —Other short-term liabilities 19 759 674Total current liabilities 1,627 1,481
TOTAL EQUITY AND LIABILITIES 5,514 4,856
Consolidated Balance Sheets

57
Comments on the Consolidated Balance SheetsIntangible AssetsIntangible assets changed by MSEK 185 (–196) during the year, of which MSEK 176 related to the acquisition of Cominfo, MSEK –29 (–) caused by goodwill impairments and MSEK 42 (78) by currency. Amortisation was MSEK 50 (53) of which MSEK 18 (19) comes from acquisition related intangible assets. Capital expenditures on intangible assets were MSEK 46 (72) related to product and software development. Last year even included MSEK 299 caused by impair-ments related to divestments.
Right of Use AssetsThe Group has adopted IFRS 16 Leases as from 1 January 2019 using themodified retrospective approach, under which no restatement is made of com-parative financial information for 2018. Upon adoption, right of use assets and lease liabilities were recognised in the amount of MSEK 254. Right of use assets changed by MSEK –11 during the year, of which MSEK 91 related to additions, MSEK –111 was depreciation and MSEK 9 by currency.
Property, Plant and EquipmentProperty, plant and equipment changed by MSEK 40 (–63) during the year, of which MSEK 30 related to the acquisition of Cominfo, MSEK –16 (–10) was caused by sales during the year and MSEK 8 (8) by currency. Depreciation was MSEK 51 (61). Investments in property, plant and equipment amounted to MSEK 69 (65) relating to the Safe Storage in the US and Entrance Control in the UK. Last year also included MSEK 59 caused by impairments related to divestments.
Net Operating Working Capital DevelopmentNet operating working capital decreased to MSEK 520 (610), representing 9.5% (11.9).
Net operating working capital, MSEK 2019% of
sales 2018 % of sales
Inventories 754 13.8% 717 14.0%
Total customer receivables 972 17.8% 1,018 19.9%
Accounts payable –585 10.7% –594 11.6%
Other operating assets/liabilities –621 11.4% –531 10.4%
Total 520 9.5% 610 11.9%
Excluding the effect of divested balances, accounts receivable and inventories accounted for the majority of the net working capital decrease, with currency effect being minor.
%
13 14 15
201920182017
1 2 3 4 1 2 3 4 1 2 3 4
20
30
50
40
70
60
10
1,000
1,500
2,500
2,000
3,500
3,000
MSEK
Operating capital employed Capital employed
500
Operating capital employed
Return on operating capital employed Return on capital employed
Long and Short-Term Financial LiabilitiesThe Group’s long- and short-term financial liabilities amounted to MSEK 2,094 (1,908), whereof MSEK 8 (17) related to bank overdraft facilities and the remain-der being mainly borrowings from financial institutions. Total credit facilities amounted to MSEK 2,627 (2,591) of which MSEK 785 (682) remained unused at the end of 2019.
Net DebtNet debt amounted to MSEK 1,761 (1,714) at the end of 2019. Excluding provi-sions for post-employment benefits, net debt increased to MSEK 1,350 in 2019 from MSEK 1,339 in 2018 where the change includes both an increase from the inclusion of the IFRS 16 Leases liability of MSEK 254, offset by increased cash mainly attributable to the net proceeds from the rights issue.
Net debt/EBITDA ratio (net leverage) decreased from 3.5 at the end of 2018 to 3.0 at the end of 2019.
%
13 14 15
2
1
4
3
5
201920182017
1 2 3 4 1 2 3 4 1 2 3 4
400
800
1,600
1,200
2,000
MSEK
Net debt/EBITDA
Net debt incl. post-employment benefits (PEB) Net debt
Net debt incl. PEB/EBITDA Net debt/EBITDA
Post-employment BenefitsThe Group's provisions for post-employment benefits were MSEK 411 (375) representing an increase of MSEK 36. The increase is mainly caused by the changes in financial assumptions, as well as pension payments.
EquityEquity amounted to MSEK 1,464 (1,087) at year-end representing an increase of MSEK 377, mainly attributable to the net proceeds from the rights issue of MSEK 351 (–). Net profit from continuing operations decreased to MSEK 45 (120).
Currency translation adjustments contributed positively with MSEK 50 (14), including the effects of hedging of net investments. Actuarial losses, gross of MSEK –41 (33) together with their related tax effect of MSEK 9 (–7), also caused a net decrease in equity. Dividends paid amounted to MSEK –38 (–92).
EmployeesAt the end of 2019, the number of registered employees was 4,256 (4,412), of which 193 employees were related to the acquisition of Cominfo. The average number of employees was 4,226 (4,363).

58
Gunnebo Annual Report 2019 / Financial Statements
MSEK Note 2019 20181)
OPERATING ACTIVITIESOperating profit 192 –410Adjustment for non-cash items: Depreciation 51 61 Amortisation and impairments 79 74 Depreciation right of use assets 111 — Impairments and write-downs, discontinued operations — 526 Other non-cash items 15 76Post-employment benefit payments –46 –47Income taxes paid –115 –80Interest and other financial items –65 –45Changes in working capital: Inventories 21 3 Total customer receivables 91 108 Accounts payable –20 7 Other operating assets and liabilities, net 70 –31Net cash flow from operating activities 384 242
INVESTING ACTIVITIESCapital expenditure for intangible assets 11 –46 –72Capital expenditure for property, plant and equipment 13 –69 –65Sale of property, plant and equipment 34 19Acquisition of operations 3 –253 –59Divestment of operations 3, 4 –2 –235Net cash flow from investing activities –336 –412
Net cash flow after investments, before financing 48 –170
FINANCING ACTIVITIESProceeds from loans 375 1,385Repayments of loans –459 –995Change in short-term loans –9 –48Lease liability payments –106 —Other financing items –6 –16Rights issue 351 —Sale of treasury shares — 1Dividends –38 –92Net cash flow from financing activities 108 235
Net cash flow 156 65
Cash and cash equivalents at the beginning of the year 569 498Net cash flow 156 65Translation differences 19 6Cash and cash equivalents at the end of the year 744 569
Consolidated Statements of Cash Flow
CHANGE IN LIABILITIES FROM FINANCING ACTIVITIES AND NET DEBT
MSEKClosing balance
Cash changes
Non-cash changes
Translation differ-ences
Adjusted opening balance
1 Jan
IFRS 16 adjust-
ments 2)
Closing balance
2018
Long-term loans, including short-term portion 1,834 –75 17 1 1,891 — 1,891Finance lease liability, including short-term portion 248 –106 92 8 254 254 —Short-term loans 8 –9 — — 17 — 17Other short-term financial assets (-)/liabilities (+) 4 –6 10 — 0 — 0Total liabilities from financing activities 2,094 –196 119 9 2,162 254 1,908Cash and cash equivalents –744 –156 — –19 –569 — –569Net debt 1,350 –352 119 –10 1,593 254 1,339
Post-employment benefits, net 411 –46 67 15 375 – 375Net debt including post-employment benefits 1,761 –398 186 5 1,968 254 1,714
1) Includes cash flow from discontinuing operations.2) Adjusted opening balance as of 1 January 2019 due to the implementation of IFRS 16 Leases.

59
Comments on the Consolidated Statements of Cash FlowGeneralThe figures in the statement of cash flow have been adjusted to remove the effect of exchange rate differences arising from the translation of the subsidiar-ies’ balance sheets to the Swedish krona, as these do not represent cash flow.
Cash Flow from Operating ActivitiesNet cash flow from operating activities was MSEK 384 in 2019 compared to MSEK 242 in 2018. The improved cash flow mainly relates to the improvement of working capital.
Interest and other financial items included interest received of MSEK 24 (18) and interest paid of MSEK –50 (–45). The Group’s interest paid increased main ly due to higher interest expenses and financing costs on external financing.
Changes in working capital in total were MSEK 162 (87), an improvement of MSEK 75. This is mainly a result of higher advance payments received.
Cash Flow from Investing ActivitiesCapital expenditures on intangible assets totalled MSEK 46 (72) of which the majority related to product and software development. Capital expenditures on property, plant and equipment were in line with last year and totalled MSEK 69 (65). Additionally, there is a positive cash flow effect of MSEK 34 (19) from proceeds from the sale of non-current assets, being mainly the sale of prop-erty in Portugal of MSEK 26 (13, mainly related to the sale of facility in South Africa). Acquisition related payments amounted to MSEK –253 (–59), whereof MSEK –237 was related to the acquisition of Cominfo and MSEK –16 to previous acquisitions.
Divestment related payments of MSEK –235 in 2018 were mainly related to the divestment of businesses in France, Belgium and Luxembourg, and MSEK –59 related to the minority buy-out in both Brazil and Mexico, as well as an earn-out.
Free Cash FlowFree cash flow is shown in the following table:
MSEK 2019 2018
Operating profit 192 –410
Depreciation 51 61
Amortisation and impairment, acquisition related intangibles 47 40
Impairments and write-downs, discontinued operations — 526
Amortisation, other intangible assets 32 34
Depreciation right of use assets plus IFRS 16 leasing effect 120 —
Other –220 –96
Change in working capital 162 87
Operating cash flow 384 242
Other investing cash flow excluding acquisitions –81 –118
Lease liability payments –106 —
Free cash flow 197 124
Free cash flow for the year 2019 amounted to MSEK 197 compared to MSEK 124 in 2018. Free cash flow per share 2019 was SEK 2.41 compared to SEK 1.62 for 2018.
50
150
100
200
13 14 15
–50
–100
2019201820171 2 3 4 1 2 3 4 1 2 3 4
Free cash flow by quarter
Free Cash Flow
MSEK
Cash Flow from Financing ActivitiesCash flow from financing activities of MSEK 108 (235), included the impact of IFRS 16 Leases with payments of MSEK –106 (–) and a net change in loans of MSEK 252 (326), of which the net proceeds from the rights issue were MSEK 351. Other financing flows included changes in bank overdrafts and realised currency swaps related to the long-term loans.
Dividends paid to shareholders totalled MSEK 38 (92) equivalent to SEK 0.50 (1.20) per share.
20
40
60
%
13 14 15
2015 2016 2017 2018 2019 *
Annual dividend of net profit, % * Proposed
Dividend in percent of net profit
Cash and Cash Equivalents Cash and cash equivalents include cash and short-term investments having an original maturity of 3 months.

60
Gunnebo Annual Report 2019 / Financial Statements
Consolidated Statements of Changes in Equity
Equity attributable to the shareholders of the Parent Company
MSEKShare
capital
Other contri buted
capitalHedging reserves
Trans lation reserves
Retained earnings Subtotal
Non-controlling
interestsTotal
equity
Opening balance 1 January 2019 385 988 –1 –200 –85 1,087 — 1,087 Net profit — — — — 45 45 — 45 Other comprehensive incomeTranslation differences — — — 48 — 48 — 48Hedging of net investments — — — 2 — 2 — 2Cash flow hedges — — 1 — — 1 — 1Actuarial gains and losses — — — — –41 –41 — –41Income taxes — — — — 9 9 — 9Subtotal — — 1 50 –32 19 — 19
Transactions with shareholdersRights issue 96 255 — — — 351 — 351Dividends — — — — –38 –38 — –38Subtotal 96 255 — — –38 313 — 313
Closing balance 31 December 2019 481 1,243 0 –150 –110 1,464 — 1,464
Equity attributable to the shareholders of the Parent Company
MSEKShare
capital
Other contri buted
capitalHedging reserves
Trans lation reserves
Retained earnings Subtotal
Non-controlling
interestsTotal
equity
Opening balance 1 January 2018 385 988 –4 –214 679 1,834 32 1,866 Net profit — — — — –683 –683 0 –683 Other comprehensive incomeTranslation differences — — — 16 — 16 0 16Hedging of net investments — — — –2 — –2 — –2Cash flow hedges — — 3 — — 3 — 3Actuarial gains and losses — — — — 33 33 — 33Income taxes — — — — –7 –7 — –7Subtotal — — 3 14 26 43 0 43
Transactions with shareholdersSale of treasury shares — — — — 1 1 — 1Acquisition of non-controlling interest — — — — –16 –16 –32 –48Share-based remuneration — — — — 0 0 — 0Dividends — — — — –92 –92 — –92Subtotal — — — — –107 –107 –32 –139
Closing balance 31 December 2018 385 988 –1 –200 –85 1,087 0 1,087

61
Note 1 Critical Accounting Policies
Basis of Presentation (IAS 1) The consolidated financial statements of Gunnebo AB are prepared in accord-ance with International Financial Reporting Standards (IFRS) as adopted by the European Union (EU). Furthermore, they are in compliance with the Swedish Financial Reporting Board’s RFR 1, Supplementary Accounting Rules for Groups, as well as their interpretations (UFR). The consolidated financial state-ments are prepared on the historical cost basis except as disclosed in the accounting policies below.
The Annual Report of the Parent Company, Gunnebo AB, has been signed by the Board of Directors on 19 March 2020. The income statement and bal-ance sheet, and the consolidated income statement and consolidated balance sheet are subject to adoption at the Annual General Meeting on 21 April 2020.
Basis of Consolidation (IFRS 10)The consolidated financial statements include the Parent company, Gunnebo AB, and those companies in which it directly or indirectly exercises control, and hereafter is referred to as “the Group” or “the Gunnebo Group”. Control exists when the Group has the right to direct the relevant activities of a com-pany, is exposed to variable returns and can use those rights to affect those returns. For the majority of the Group’s subsidiaries, control exists via 100% ownership. There are also a limited number of subsidiaries controlled by Gunnebo where ownership is less than 100%, where control is exercised through contractual rights. Additionally, the Group has minor holdings where the Group exercises significant influence rather than control. These companies are referred to as Associated companies and are accounted for using the equity method.
Business Combinations and Goodwill (IFRS 3)All business combinations are accounted for in accordance with the purchase method. At the date of acquisition, the acquired assets, assumed liabilities and contingent liabilities (net identifiable assets) are measured at fair value, which requires the use of estimates. The most significant acquired net assets are intangibles, such as product development, customer relationships, and brand name.
The fair values of these were derived with the assistance of external valua-tion experts using generally accepted valuation techniques based on fore-casted future cash flows. Other acquired net assets include, to a lesser degree property, plant and equipment, inventories, financial assets and liabilities which have been valued using reference to available market information. Any excess of the cost of acquisition over fair values of net identifiable assets of the acquired business is recognised as goodwill.
Segment Information (IFRS 8)Operating segments were identified based on the internal structure of the Group’s business activities and whose operating results are regularly reviewed by the chief operating decision maker (CODM) in order to allocate resources and assess performance. The internal financial reporting and follow-up of the Group’s operating profit occurs at the Business Unit level, where such informa-tion is provided to the CODM by Safe Storage, Cash Management, Entrance Control and Integrated Security. Consequently, the Group considers these to be the primary reportable operating segments.
The measurement principles used in the Group’s operating segments are based on the IFRS principles as adopted in the consolidated financial state-ments, with exception of IFRS 16 Leases, which is a reconciling item. Refer to Note 2 for detailed information.
Translation of Foreign Financial Statements (IAS 21)Gunnebo AB’s functional currency is the Swedish krona (SEK), which is also the Group’s reporting currency. All foreign subsidiaries report in their functional currency being the currency of the primary economic environment in which the subsidiary operates, in almost all cases this is the country of operation. Upon consolidation, all balance sheet items are translated to the Swedish krona based on the year-end closing rates. Income statement items are translated at
average exchange rates for the year. The accumulated exchange differences arising from these translations are recognised via other comprehensive income to the translation reserve in equity. Such translation differences are reclassified into the income statement upon the disposal of the foreign operation.
Transactions in foreign currencies during the year have been translated at the exchange rate prevailing at the respective transaction date. Assets and lia-bilities denominated in a foreign currency, primarily receivables and payables and loans, have been translated at the exchange rates prevailing at the balance sheet date. Exchange gains and losses related to accounts receivable and payables and other operating receivables and payables are included in other operating income and expenses. The exchange gains and losses relating to financial assets and liabilities are included in financial income and expenses.
The major currency rates were:
Average rates Closing rates
Country Unit Currency 2019 2018 2019 2018
Australia 1 AUD 6.57 6.49 6.51 6.32
Brazil 1 BRL 2.40 2.39 2.25 2.32
China 1 CNY 1.37 1.31 1.33 1.31
EU 1 EUR 10.59 10.26 10.43 10.28
UK 1 GBP 12.07 11.59 12.21 11.35
Indonesia 1,000 IDR 0.67 0.61 0.67 0.62
India 100 INR 13.43 12.72 13.25 12.82
USA 1 USD 9.46 8.69 9.32 8.97
Revenue from Contracts with Customers (IFRS 15)The Group generates revenue streams which are deliverables within the Busi-ness Units Entrance Control, Safe Storage, Cash Management and Integrated Security. The deliverables identified in these Business Units are similar globally, include both product and services, and are relatively non-complex and with a few exceptions, are short-term in nature. The majority involves a fixed quantity of goods at a fixed price, where revenue is recognised at the point in time that the customer obtains control, typically at delivery to an agreed-upon site or after installation. The Group strives to obtain advance payments from custom-ers prior to performance to cover costs of materials. Otherwise, invoicing occurs when all performance obligations in the contract are fulfilled.
The Group to a lesser degree, also has short-term contracts involving moreintegration/customisation and which are built to a certain extent on customersite. Revenue is recognised over time for these contracts using a cost basedpercentage of completion. Invoicing occurs periodically according to a con-tractually agreed timetable.
The Group sells separate service and extended warranty contracts forits products. These are separate deliverables where the revenue is recognisedover the duration of the contract, most often using a straight-line approach.The Group strives to invoice one year in advance for these contracts, otherwisea periodic invoicing is performed.
Returns and refunds are not offered as they are not customary in the marketfor security products.
Intangible Assets (IAS 38)Intangible assets are stated at initial cost less any accumulated amortisation and any impairment. Amortisation is made on a straight-line basis over the esti-mated useful lives and begins once the asset is ready for its intended use. The useful lives are based to a large extent on historical experience, the expected application, as well as other individual characteristics of the asset. The useful lives are:
• Customer relationships 5–10 years• Capitalised software 3–5 years• Product development expenditures 3–5 years• Product development acquired in business combinations 3 years• Strategic brand name, indefinite• Goodwill, indefinite
Notes – Consolidated Financial Statements Amounts in MSEK unless otherwise stated

62
Gunnebo Annual Report 2019 / Financial Statements
Internally developed intangiblesThe Group’s most significant internally developed intangibles are product development and software developed for internal use. Development expendi-tures are capitalised when, in management’s judgement, it is probable that they will result in future economic benefits for the Group and the expenditures during the development phase can be reliably measured. Management evalu-ates the ability to complete the project, evidence of technical feasibility, inten-tion and ability to use or sell the asset. In evaluating product development pro-jects, management considers the existence of a customer order as significant evidence of technological and economic feasibility.
All other research expenditures as well as development expenditures not meeting the capitalisation criteria are charged to cost of goods sold in the income statement when incurred.
Leases (IFRS 16)Right of use assets and lease liabilities are valued as the present value of the remaining lease payments, discounted with using each subsidiary's incremen-tal borrowing rate for that leased asset.
Right of use assets are depreciated on a straight-line basis over the lease term. The Group determines the lease term as the non-cancellable term of the lease, together with any periods covered by an option to extend the lease if it is reasonably certain to be exercised.
Future lease payments are allocated to an amortisation of the lease liability and to a finance cost in the income statement. The above accounting is applied at Group level while the Business Units continue to apply the previous lease accounting where operational leases are expensed when incurred, hence there is no IFRS 16 Leases effect on EBITA. This will be a reconciling item in the Group’s segment reporting.
Property, Plant and Equipment (PPE) (IAS 16)Machinery, land, buildings and office equipment are stated in the balance sheet at cost, less accumulated depreciation and any impairment loss.
Depreciation is provided on a straight-line basis and is calculated based on cost, with significant components depreciated separately. The rates of depre-ciation are based on the estimated useful lives of the assets, which have been determined mainly with reference to historical experience. The useful lives are:• Buildings 20–50 years• Machinery 5–15 years• Office equipment 3–5 years
Impairment of Intangible Assets and Property, Plant and Equipment (IAS 36)Intangible assets with definite useful lives and property, plant and equipment are tested for impairment whenever events or changes in circumstances indi-cate that the carrying value may not be recoverable.
Intangible assets with indefinite useful livesGoodwill and brand name with indefinite useful lives have been allocated to the cash generating units (CGUs) and are tested for impairment annually and whenever an indication of impairment exists. A CGU is the smallest identifiable group of assets that generates cash inflows that are largely independent of the cash inflows from other assets or groups of assets. Gunnebo regards its busi-ness units as CGUs, with the exception of Integrated Security which is com-prised of several local integrator businesses, considered to be separate indi-vidual CGUs. These CGU’s are the lowest level that the Group monitors these intangible assets. The Group determined that the acquired strategic brand name has an indefinite useful life, as the intention is to retain and develop this brand in the foreseeable future.
Calculation of recoverable amountThe recoverable amount is the greater of the estimated fair value less costs to sell and value in use. In assessing value in use, a discounted cash flow model (DCF) is used. This assessment contains a key source of estimation uncer-tainty because the estimates and assumptions used in the DCF model encom-
pass uncertainty about future events and market conditions. The actual out-comes may be significantly different. However, estimates and assumptions have been reviewed by management and are consistent with short-term fore-casts and the long-term strategic plans.
The DCF model involves the forecasting of future operating cash flows and includes estimates of revenues, operating costs and working capital require-ments, as well as a number of assumptions, the most significant being the growth rates and the discount rate. These forecasts of future operating cash flows cover a three-year period and are based on business and strategic plans extrapolated using growth rates determined for the Group as a whole. The business plans represent management’s best estimates of future revenues and operating expenses using historical trends, general market conditions, industry trends and forecasts and other currently available information as determined on the lowest operating level of the Business Units. A terminal value is then cal-culated based on the Gordon Growth model, which includes a terminal growth factor representing the real growth rate and expected inflation. Forecasts of future operating cash flows are adjusted to present value by an appropriate discount rate, taking into account the long-term risk-free government bond rate, a market risk premium, a country risk premium where applicable, and the systematic risk of the Group at the date of evaluation.
Management determines the discount rate to be used based on the risk inherent in the Group’s current business model and industry comparisons.
Inventories (IAS 2)Inventories are stated at the lower of cost (first-in, first-out basis) or market value (net realisable value). Initially raw materials and purchased finished goods are valued at actual purchase costs and work in process and manufactured finished goods are valued at actual production costs. Production costs include direct costs such as material and labour, as well as manufacturing overhead as appropriate.
Adjustments to the cost of inventory may be necessary when the cost exceeds net realisable value. The estimates used in determining net realisable value are a source of estimation uncertainty. Management’s estimates are based on current prices, rates of turnover and aging.
Income Taxes (IAS 12)Income tax include current taxes on profits, deferred taxes and other taxes such as withholding taxes on transfers of income from Group companies. Income taxes are recognised in the income statement, except to the extent that they relate to items directly taken to other comprehensive income.
Current taxesAll the companies within the Group compute current income taxes in accord-ance with the tax rules and regulations of the countries where the income is taxable. Provisions have not been made for taxes which may arise on distribu-tion of the remaining unrestricted earnings of foreign subsidiaries as they can be distributed free of tax or as the Group does not intend to internally distribute them in the foreseeable future.
Deferred taxesDeferred tax assets and liabilities are recorded based on enacted tax rates for differences between accounting and tax bases of assets and liabilities, as well as for tax loss carry-forwards.
Significant management judgment is required in determining deferred tax assets related to tax loss carry-forwards. Deferred tax assets are recorded for these, when it is probable that sufficient future taxable income will be gener-ated to utilise the losses. Management’s assessment considers historical prof-itability, tax planning strategies, as well as the expiration of the tax losses, all of which is considered to be strong evidence for the conclusions.
Financial Assets and Financial Liabilities (IFRS 7, IFRS 9)The Group’s financial assets include primarily accounts receivable. The Group’s financial liabilities include primarily accounts payable and loans to financial institutions. All of these are categorised as “loans and receivables” and are measured at amortised cost.
Note 1 cont.

63
Impairment losses relate primarily to allowances for doubtful accounts, which are recognised if management believes that sufficient objective evidence exists indicating that the receivables may not be recovered.
Other financial assets and liabilities include, to a minor extent, derivative instruments. The Group uses derivative instruments to manage the volatility of interest rates (where hedge accounting is applied) and for currency exposure on external borrowing and internal lending.
When hedge accounting is applied, the effective portion of the change in fair values is recognised in other comprehensive income until the hedged item is recognised in the income statement. For other derivatives, which are catego-ris ed as “held for trading”, the changes in fair value are taken through the income statement.
Post-Employment Benefits (IAS 19)The post-employment benefit provisions arise from defined benefit obligations in plans which are either unfunded or funded.
For the unfunded plans, benefits paid out under these plans come from the assets of the company sponsoring the plan. The related provisions carried in the balance sheet represents the present value of the defined benefit obliga-tion.
For funded defined benefit plans, the assets of the plans are held in trusts legally separate from the Group. The related balance sheet provision repre-sents the deficit of the fair value of plan assets over the present value of the defined benefit obligation.
The projected credit unit method is used to determine the present value of all defined benefit obligations and the related current service cost. Valuations are carried out quarterly for the most significant plans and annually for other plans. External actuarial experts are used for these valuations. Estimating the obligations and costs involve the use of assumptions. Such assumptions vary according to the economic conditions of the country in which the plan is located and are adjusted to reflect market conditions at valuation point. How-ever, the actual costs and obligations that in fact arise under the plans may be materially different from the estimates based on the assumptions due to changing market and economic conditions.
The most significant assumptions can vary per plan but in general include discount rate, pension inflation rate and salary growth rate. These assumptions are established for each plan separately. The discount rate for each plan is determined by reference to yields on high quality corporate bonds (AA-rated corporate bonds or indexes as well as mortgage bonds for the plans in Sweden) having maturities matching the duration of the obligation.
Remeasurements arise from changes in actuarial assumptions and experi-ence adjustments, being differences between actuarial assumptions and what has actually occurred. They are recognised immediately in other comprehen-sive income and are never reclassified into the income statement.
For all defined benefit plans the cost charged to the income statement con-sists of current service cost and net interest cost. Net interest cost is classified as financial expense while all other expenses are included in the operating profit.
Some post-employment benefits are also provided by defined contribution schemes, where the Group has no obligation to pay benefits after payment of an agreed-upon contribution to the third party responsible for the plan. Such contributions are recognised as expense when incurred.
Critical Accounting Estimates and Judgements (IAS 1)The preparation of financial statements requires management to make esti-mates and judgements that affect reported assets, liabilities, revenues and expenses. These estimates can be based on historical experiences, other internal/external sources, and/or assumptions that management believes are reasonable under the circumstances. These estimates also form the basis for making judgements about the carrying values of assets and liabilities that are not readily apparent from other sources. Actual outcomes may differ from management’s estimates which could have a significant impact on the Group’s financial statements.
Management believes that the following areas contain the most key judge-ments and the most significant sources of estimation uncertainty used in the preparation of the financial statements, where a different opinion or estimate could lead to significant changes of the Groups financial statements in the upcoming year:• Estimates and key assumptions used in impairment testing of intangibles
(Note 11 of the Group) • Judgement on the realisability of deferred tax assets (Note 10 of the Group)• Important assumptions when calculating post-employment benefit
obligations (Note 16 of the Group)
BrexitGunnebo follows Brexit developments on a regular basis in order to assess any impact the process may have on the business and in order to be able to take measures if needed.
Corona virus (COVID-19)Gunnebo follows Corona developments on a regular basis. The Group Execu-tive Team is closely monitoring and assessing any impact the process may have on the supply chain specifically and the business in general. Moreover, the Business Unit organisations have frequent dialogues with suppliers and customers in this regard.
New or Amended IFRS Standards and New Interpretations in 2019The Group has adopted IFRS 16 Leases as from 1 January 2019 using the modified retrospective approach, under which no restatement is made of com-parative financial information for 2018. Further, the Group has chosen to apply the option to exclude leases with a remaining lease term of less than 12 months from 1 January 2019, where such payments are recognised as an expense in the income statement as under previous accounting. Upon adop-tion, right of use assets and lease liabilities were recognised in the amount of MSEK 254. Both were valued as the present value of the remaining lease pay-ments, discounted with using each subsidiary's incremental borrowing rate for that leased asset. The category “buildings and office space” is the largest cat-egory with MSEK 174 at 1 January 2019, representing leases across all geo-graphic regions. The category “vehicles” included the largest number of leases. Leases also exist for production and office equipment. Refer to Note 12 for detailed information.
The following table represents the reconciliation of lease liabilities as of 1 January 2019:
MSEK
Operating lease obligations 31 December 2018 276
Short-term leases relief option –11
Effect of additional extensions 11
Other effects 2
Gross leasing obligations 278
Discounting effect –24
Lease liability at 1 January 2019 254
The weighted average incremental borrowing rate was 5.5%.
Several other amendments and interpretations apply for the first time in 2019, but do not have an impact on the consolidated financial statements of the Group.
New or Amended IFRS Standards and New Interpretations not yet Effective Certain new accounting standards and interpretations have been published that are not mandatory for 31 December 2019 reporting period and have not been early adopted by the Group. These standards are not expected to have a material impact on the Group in the current or future reporting periods and on foreseeable future transactions.

64
Gunnebo Annual Report 2019 / Financial Statements
Note 2 Operating Segments
The Group’s internal financial reporting and follow-up is based on four Business Units: Entrance Control, Safe Storage, Cash Management and Integrated Security. Each of these are described on pages 12–29.
Net sales 2019 2018
Entrance Control 1,307 1,048
Safe Storage 2,019 1,826
Cash Management 1,034 1,090
Integrated Security 1,099 1,164
Total 5,459 5,128
The internal financial performance follow-up for the Business Units uses EBITA as a measure to assess the performance of the segments. This excludes discontinued operations. Finan-cial income and expenses are not allocated to segments, as this type of activity is driven by the central treasury function, which manages the cash position of the Group. Group func-tions refer to central functions and services within corporate management, business devel-opment, human resources & sustainability, legal & compliance, finance, IT, brand manage-ment, communications and investor relations.
2019 2018
Entrance Control 204 176
Safe Storage 144 151
Cash Management 68 122
Integrated Security 17 1
Subtotal business unit EBITA 433 450
Group functions –112 –116
EBITA 321 334
Amortisations and impairments of acquisition related intangible assets –47 –40
Items affecting comparability (IAC) –91 –29
IFRS 16 leasing effect 9 —
Operating profit (EBIT) 192 265
Financial income and expenses, net –76 –53
Profit before taxes from continuing operations 116 212
Entrance ControlNet sales amounted to MSEK 1,307 (1,048), resulting in a sales growth of 21% (13). Growth came from the Cominfo acquisition, as well as project business to among others airports, metro and bus rapid transport (BRT). Excluding Cominfo, sales growth was 12%.
EBITA amounted to MSEK 204 (176), resulting in a margin of 15.6% (16.8). Entrance Control has been able to both grow and prepare for future growth during the year, which explains the slightly lower EBITA margin compared to last year.
Safe StorageNet sales amounted to MSEK 2,019 (1,826), resulting in a sales growth of 6% (4). The posi-tive sales development during the year comes from continued good sales to banks and strong sales development for ATM safes. EBITA amounted to MSEK 144 (151), resulting in a margin of 7.1% (8.3). The lower margin is explained by European cost level not yet fully impacted by the cost-efficiency program and costs for setting up the new Business Unit global structure.
Cash ManagementNet sales amounted to MSEK 1,034 (1,090), resulting in a sales growth of –9% (2). The nega-tive development during the year comes from lower volumes in Asia-Pacific and Middle East. EBITA amounted to MSEK 68 (122), resulting in a margin of 6.6% (11.2). The lower margin is mainly explained by the drop in sales volume in all regions while Gunnebo has continued to invest in growing customer segments.
Sales by Customer Segment
Bank, 32% Retail, 32% Mass transit, 7% Public and commercial buildings, 19% Industrial and high-risk sites, 10%
Sales by Business Unit
EBITA by Business Unit
Entrance Control, 24%
Safe Storage, 37%
Cash Management, 19%
Integrated Security, 20%
Entrance Control, 47%
Safe Storage, 33%
Cash Management, 16%
Integrated Security, 4%
Depreciation and Amortisation by Business Unit
Capital Expenditure by Business Unit
2019
2019
2018
2018
Entrance Control, MSEK 20 (14)
Safe Storage, MSEK 28 (24)
Cash Management, MSEK 30 (37)
Integrated Security, MSEK 11 (32)
Central Functions, MSEK 12 (6)
Entrance Control, MSEK 28 (22)
Safe Storage, MSEK 34 (20)
Cash Management, MSEK 31 (26)
Integrated Security, MSEK 15 (18)
Central Functions, MSEK 7 (31)

65
Integrated SecurityNet sales amounted to MSEK 1,099 (1,164), resulting in a sales growth of –6% (–5). Good sales development in Americas, Indonesia and Eastern Europe did not fully compensate for lower sales in other markets.
EBITA amounted to MSEK 17 (1), resulting in a margin of 1.5% (0.1). The EBITA improve-ment was a result of the ongoing cost-efficiency measures taken to improve the perfor-mance of the local operations.
The Business Units are also measured on their Operating Capital Employed, which is defined as property, plant and equipment, other intangible assets, total customer receiva-bles, inventories, accounts payable, as well as other short-term assets and short-term liabilities that are not tax-, financial- or IFRS 16 Leases related. Capital expenditure includes intangible assets and property, plant and equipment.
A reconciliation of the Business Units’ Operating Capital Employed to the Group’s Capital Employed is as follows:
2019 2018
Entrance Control 354 181
Safe Storage 428 491
Cash Management 237 258
Integrated Security 197 268
Operating capital employed from Business Units 1,216 1,198
Group functions 4 1
Goodwill 1,525 1,408
Right use of assets 243 —
Capital employed 2,988 2,607
The geographical net sales by market below are based on the geographical location of the customer. Non-current assets consist of goodwill, other intangible assets and property, plant and equipment and are disclosed based on their geographical location.
Net sales by market Non-current assets
Geographical disclosure 2019 2018 2019 2018
Sweden 190 223 177 185
Australia 216 230 21 18
China 252 198 37 5
Germany 274 258 292 258
Hungary 351 307 1 0
India 459 413 70 63
Italy 238 248 51 25
Spain 327 345 205 192
UK 277 318 89 60
USA 710 629 544 499
Other – Europe, Middle East & Africa 1,262 1,205 410 167
Other – Asia-Pacific 371 318 307 295
Other – Americas 532 436 260 229
Total 5,459 5,128 2,464 1,996
Sales by region 2019
Entrance Control
EMEA, 51% Asia-Pacific, 34% Americas, 15%
Integrated Security
EMEA, 39% Asia-Pacific, 21% Americas, 40%
Cash Management
EMEA, 71% Asia-Pacific, 7% Americas, 22%
Safe Storage
EMEA, 56% Asia-Pacific, 27% Americas, 17%

66
Gunnebo Annual Report 2019 / Financial Statements
DivestmentsThere were no divestments during the year ending 31 December 2019. Apart from the sale of the French, Belgium and Luxembourg businesses, Gunnebo completed two minor divestments during 2018 at an aggregate cash consideration of MSEK 21.
For details regarding the sale of the French, Belgium and Luxembourg businesses, refer to Note 4, Discontinued operations.
Note 4 Discontinued Operations
There were no discontinued operations during 2019.
2018On 17 July 2018, the Group announced its intention to divest its business in France, Belgium and Luxembourg. The subsidiaries were sold on 3 December 2018. Accordingly, these businesses were reported as discontinued opera-tions. Financial information relating to the discontinued operation for the period to the date of disposal is set out below.
The divestment included the French sales company, French production facilities in Baldenheim and Bazancourt as well as the Belgian and Luxem-bourg sales companies. The business employed approximately 920 people.
Discontinued Operations in the Income StatementThis Disposal Group represents a major geographical area, and as such was classified as discontinued operations. Consequently, in the consolidated income statement, all revenue and expenses relating to the Disposal Group were excluded from the results of continuing operations and were shown as a single line item on the income statement under the row “Net results from dis-continued operations”. All previously published income statement information has been restated to show this classification.
Net results from discontinued operations included six legal companies, elimination of intercompany amounts, adjustments for divestment related expenses and adjustments for sales and costs that will remain in continued operations.
2018
Net sales 976
Operating expenses excl. depreciation and amortisation –1,057
EBITDA –81
Depreciation and amortisation –22
EBIT –103
Financial income and expenses, net –2
Profit/loss before taxes –105
Income taxes 10
Results from operating activities –95
Loss on divestment –708
Net profit/loss from discontinued operations –803The loss on divestment is specified below. It is based on a purchase price which was symbolic and the effect of transactions required in connection with the divestment. The following assets and liabilities were consequently derecog-nized from the consolidated statement of financial position as of 3 December 2018.
Note 3 Acquisitions and Divestments
Cominfo a.s.1 July 2019, Gunnebo acquired 100 percent of the shares in the Czech com-pany, Cominfo a.s.. Cominfo had some 190 employees at the end of Q4 and offers solutions within entrance control and access systems, where software is an integral part of the offering. The acquisition is in line with the Group's strat-egy to further strengthen the Business Unit Entrance Control. The purchase price amounted to MSEK 233, net of cash. According to the acquisition analy-sis, identified intangible assets arising from the acquisition are primarily attrib-utable to acquired technologies and customer relations.
The recognised goodwill is related to human capital and growth opportuni-ties from synergies. The goodwill is not tax deductible. The acquisition has been consolidated in the Group accounts from the third quarter within Busi-ness Unit Entrance Control.
31 Dec 2019
Fair value of assets and liabilities in acquired operations
Other intangible assets 65
Property, plant and equipment 30
Inventories 40
Total customer receivables 25
Other short-term assets 7
Cash and cash equivalents 25
Accounts payable –9
Other short-term liabilities –14
Deferred tax liabilities –13
Long-term financial liabilities –9
Identifiable net assets 147
Goodwill 111
Total purchase price 258
Less:
Cash in acquired operations –25
Effect on Group cash and cash equivalents at 31 December 233
Acquisition related costs amounted to MSEK 4 and are reported within Selling and administrative expenses in the consolidated income statement and in acquisition related payments in the investing cash flows in the consolidated statement of cash flow.
Earn-Out PaidDuring 2019, an earn-out relating to the acquisition in 2015 of Grupo Sallén Tech S.L. in Spain was paid in the amount of MSEK 15 (15).
Acquisitions of Non-Controlling InterestsDuring 2018, the Group increased its ownership interests in certain subsidiar-ies, with the most significant being the acquisition of the remaining 19.5% of the issued shares of Gunnebo Gateway Brazil S.A. for an amount of MSEK 42.
The effect on the equity attributable to the owners of Gunnebo during the year is summarised as follows:
2019 2018
Carrying amount of non-controlling interests acquired — 32
Consideration paid to non-controlling interests1) — –48
Excess of consideration paid recognised within equity — –16
1) Of which MSEK –4 is not yet paid and included within other operating liabilities.

67
Specification of loss on divestment 2018
Current assets, mainly accounts receivable 515
Deferred tax liabilities –15
Provision for post-employment benefits –96
Current liabilities –522
Cash and cash equivalents 226
Subtotal divested balances 108
Impairments 417
Write-down deferred tax assets 135
Divestment costs 48
Total loss on divestment 708
Cash balances divested companies 226
Divestment costs paid 20
Total cash impact on divestment 246
Impairments included MSEK –232 related to goodwill, MSEK –104 related to other intangibles, plant and equipment, and MSEK –81 related to inventory.
Cash flow information of the discontinued operationsThe following table presents the net cash flows of operating, investing and financing activities reported in the Consolidated cash flow statements.
2018
Cash flow from operating activities –31
Capital expenditure for intangibles, property, plant and equip-ment –20
Divestment related payments –246
Cash flow from investing activities –266
Cash flow from financing activities —
Note 5 Expenses by NatureContinuing operations
Discontinued operations
2019 2018 2018
Material costs 2,284 2,067 89
Change in inventories –25 12 9
Remuneration to employees 1,598 1,545 550
Subcontractors 219 205 142
Transport costs 135 137 37
Vehicle and travel costs 204 176 46
Depreciation 231 113 22
Other costs 598 619 184
Total operating expenses1) 5,244 4,874 1,079
1) Sum of cost of goods sold, selling expenses and administrative expenses.
Expenses by nature Material costs, 44% (42) Remuneration to employees, 30% (32) Temporary personnel and subcontractors, 4% (4) Vehicle and travel costs, 4% (4) Depreciation and amortisation, 4% (2) Transport costs, 3% (3) Other costs, 11% (13)
Note 6 Remuneration to Group Key Management
Remuneration Paid to the Board of Directors of Gunnebo ABRemuneration paid in the calendar year 2019 to the Board of the Parent Company amounted to TSEK 1,945 (2,030), of which TSEK 170 (155) comprises remuneration for committee work. Women occupy 50% (50) of the Board of Directors at year-end.
TSEK 2019 2018
Martin Svalstedt, Chairman 500 500
Göran Bille 285 280
Anna Borg Sæther 270 265
Charlotte Brogren 255 250
Bo Dankis (resigned 2018) — 125
Eva Elmstedt 320 300
Mikael Jönsson 315 310
Total 1,945 2,030
Remuneration to Members of the Gunnebo Group Executive Team (GET)5)
2019 2018
TSEK CEO
Stefan SyrénFormer CEO
Henrik Lange
Deputy CEO Robert
Hermans
Other members in
GET (8)4) TotalCEO
Henrik Lange
Other members in
GET (9)4) Total
Salary 795 5,926 458 22,380 29,559 6,910 22,292 29,202
Bonus1) — 463 184 5,769 6,416 508 2,233 2,741
Long-term incentive programmes2) — — — — — 1,033 1,430 2,463
Other benefits3) 2 124 86 3,159 3,371 121 2,863 2,984
Pension cost 207 2,059 109 5,076 7,451 2,411 5,300 7,711
Severance — 5,759 — 12,176 17,935 — — —
Total 1,004 14,331 837 48,560 64,732 10,983 34,118 45,101
1) Includes only cash-based short-term variable salary expensed for the bonus year 2019.2) Relates to share-based incentive program LTIP 2015.3) Other benefits mainly include housing allowances and car.4) Includes only remuneration for the portion of the year being a member of GET.5) Women occupy 24% (22) of the Group Executive Team.
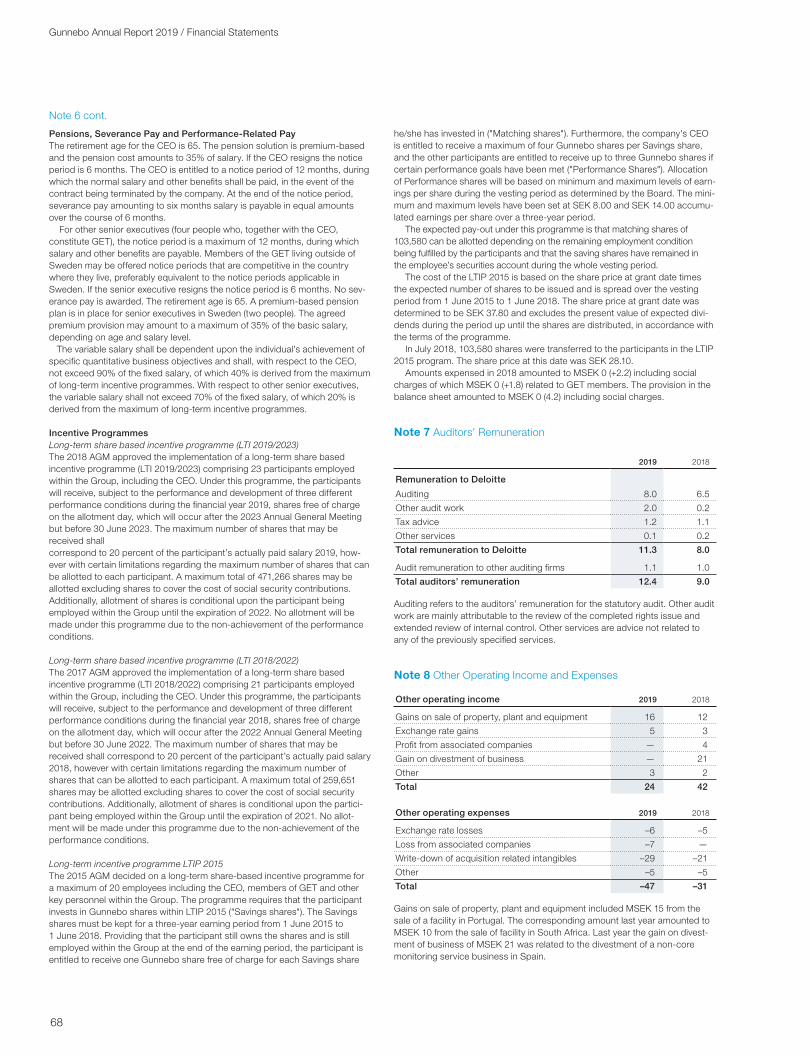
68
Gunnebo Annual Report 2019 / Financial Statements
Pensions, Severance Pay and Performance-Related PayThe retirement age for the CEO is 65. The pension solution is premium-based and the pension cost amounts to 35% of salary. If the CEO resigns the notice period is 6 months. The CEO is entitled to a notice period of 12 months, during which the normal salary and other benefits shall be paid, in the event of the contract being terminated by the company. At the end of the notice period, severance pay amounting to six months salary is payable in equal amounts over the course of 6 months. For other senior executives (four people who, together with the CEO, constitute GET), the notice period is a maximum of 12 months, during which salary and other benefits are payable. Members of the GET living outside of Sweden may be offered notice periods that are competitive in the country where they live, preferably equivalent to the notice periods applicable in Sweden. If the senior executive resigns the notice period is 6 months. No sev-erance pay is awarded. The retirement age is 65. A premium-based pension plan is in place for senior executives in Sweden (two people). The agreed premium provision may amount to a maximum of 35% of the basic salary, depending on age and salary level. The variable salary shall be dependent upon the individual’s achievement of specific quantitative business objectives and shall, with respect to the CEO, not exceed 90% of the fixed salary, of which 40% is derived from the maximum of long-term incentive programmes. With respect to other senior executives, the variable salary shall not exceed 70% of the fixed salary, of which 20% is derived from the maximum of long-term incentive programmes.
Incentive ProgrammesLong-term share based incentive programme (LTI 2019/2023)The 2018 AGM approved the implementation of a long-term share based incentive programme (LTI 2019/2023) comprising 23 participants employed within the Group, including the CEO. Under this programme, the participants will receive, subject to the performance and development of three different performance conditions during the financial year 2019, shares free of charge on the allotment day, which will occur after the 2023 Annual General Meeting but before 30 June 2023. The maximum number of shares that may be received shall correspond to 20 percent of the participant’s actually paid salary 2019, how-ever with certain limitations regarding the maximum number of shares that can be allotted to each participant. A maximum total of 471,266 shares may be allotted excluding shares to cover the cost of social security contributions. Additionally, allotment of shares is conditional upon the participant being employed within the Group until the expiration of 2022. No allotment will be made under this programme due to the non-achievement of the performance conditions.
Long-term share based incentive programme (LTI 2018/2022)The 2017 AGM approved the implementation of a long-term share based incentive programme (LTI 2018/2022) comprising 21 participants employed within the Group, including the CEO. Under this programme, the participants will receive, subject to the performance and development of three different performance conditions during the financial year 2018, shares free of charge on the allotment day, which will occur after the 2022 Annual General Meeting but before 30 June 2022. The maximum number of shares that may be received shall correspond to 20 percent of the participant’s actually paid salary 2018, however with certain limitations regarding the maximum number of shares that can be allotted to each participant. A maximum total of 259,651 shares may be allotted excluding shares to cover the cost of social security contributions. Additionally, allotment of shares is conditional upon the partici-pant being employed within the Group until the expiration of 2021. No allot-ment will be made under this programme due to the non-achievement of the performance conditions.
Long-term incentive programme LTIP 2015The 2015 AGM decided on a long-term share-based incentive programme for a maximum of 20 employees including the CEO, members of GET and other key personnel within the Group. The programme requires that the participant invests in Gunnebo shares within LTIP 2015 ("Savings shares"). The Savings shares must be kept for a three-year earning period from 1 June 2015 to 1 June 2018. Providing that the participant still owns the shares and is still employed within the Group at the end of the earning period, the participant is entitled to receive one Gunnebo share free of charge for each Savings share
he/she has invested in ("Matching shares"). Furthermore, the company's CEO is entitled to receive a maximum of four Gunnebo shares per Savings share, and the other participants are entitled to receive up to three Gunnebo shares if certain performance goals have been met ("Performance Shares"). Allocation of Performance shares will be based on minimum and maximum levels of earn-ings per share during the vesting period as determined by the Board. The mini-mum and maximum levels have been set at SEK 8.00 and SEK 14.00 accumu-lated earnings per share over a three-year period.
The expected pay-out under this programme is that matching shares of 103,580 can be allotted depending on the remaining employment condition being fulfilled by the participants and that the saving shares have remained in the employee’s securities account during the whole vesting period.
The cost of the LTIP 2015 is based on the share price at grant date times the expected number of shares to be issued and is spread over the vesting period from 1 June 2015 to 1 June 2018. The share price at grant date was determined to be SEK 37.80 and excludes the present value of expected divi-dends during the period up until the shares are distributed, in accordance with the terms of the programme.
In July 2018, 103,580 shares were transferred to the participants in the LTIP 2015 program. The share price at this date was SEK 28.10.
Amounts expensed in 2018 amounted to MSEK 0 (+2.2) including social charges of which MSEK 0 (+1.8) related to GET members. The provision in the balance sheet amounted to MSEK 0 (4.2) including social charges.
Note 7 Auditors’ Remuneration
2019 2018
Remuneration to Deloitte
Auditing 8.0 6.5
Other audit work 2.0 0.2
Tax advice 1.2 1.1
Other services 0.1 0.2
Total remuneration to Deloitte 11.3 8.0
Audit remuneration to other auditing firms 1.1 1.0
Total auditors’ remuneration 12.4 9.0
Auditing refers to the auditors’ remuneration for the statutory audit. Other audit work are mainly attributable to the review of the completed rights issue and extended review of internal control. Other services are advice not related to any of the previously specified services.
Note 8 Other Operating Income and Expenses
Other operating income 2019 2018
Gains on sale of property, plant and equipment 16 12
Exchange rate gains 5 3
Profit from associated companies — 4
Gain on divestment of business — 21
Other 3 2
Total 24 42
Other operating expenses 2019 2018
Exchange rate losses –6 –5
Loss from associated companies –7 —
Write-down of acquisition related intangibles –29 –21
Other –5 –5
Total –47 –31
Gains on sale of property, plant and equipment included MSEK 15 from the sale of a facility in Portugal. The corresponding amount last year amounted to MSEK 10 from the sale of facility in South Africa. Last year the gain on divest-ment of business of MSEK 21 was related to the divestment of a non-core monitoring service business in Spain.
Note 6 cont.

69
The write-down of acquisition related intangibles of MSEK –29 (–21) was linked to Integrated Security business.
Investments in associated companies were MSEK 5 (12). This included a 55% ownership in Gateway Security Portugal Ltda, a 48% ownership in Prodimo AB and a 49% ownership in Gateway Varesikring A/S.
Note 9 Financial Income and Expenses, net
2019 2018
Financial income
Interest income 24 17
Exchange rate gains and other income 2 13
Total 26 30
Financial expenses
Interest expense –50 –44
Net financial cost on pensions –11 –12
Lease financial cost –14 —
Exchange rate losses –5 –9
Bank charges and guarantee costs –16 –11
Other –6 –7
Total –102 –83
Financial income and expenses, net –76 –53
Note 10 Income Taxes
Tax expense 2019 2018
Current tax expense –97 –90
Deferred tax expense 26 –2
Total –71 –92
Taxes charged to other comprehensive income includes MSEK 9 (–7) related to remeasurements of post-employment benefits.
For 2018, the tax expense excludes the tax income from the discontinued operation of MSEK 10 which has been included in loss from discontinued operation (see Note 4).
Reconciliation of Swedish tax rate with effective tax rate 2019 2018
Profit before taxes 116 212
Tax calculated using the statutory tax rate in Sweden 21.4% (22.0%) –25 –47
Effect of tax rates in foreign jurisdictions –7 –13
Other, incl. non-deductible/ non-taxable items –7 13
Current year losses for which no deferred tax asset is recognised –14 –16
Other valuation allowance changes — –9
Changes in estimates related to prior years –13 –15
Withholding taxes –5 –5
Total –71 –92
Effective tax rate in % 61% 43%
On 14 June 2018, Sweden enacted major changes to its corporate income tax rules. The new law reduces the corporate income tax rate in two steps, from 22.0% to 21.4% from 1 January 2019 and to 20.6% from 1 January 2021. This change resulted in a loss of MSEK 1 related to the remeasurement of deferred tax assets of the Group’s Swedish subsidiaries, being recognised during the year ended 2018.
2019
Deferred tax balances, netDeferred tax
assetsDeferred tax
provisions
Non-current assets 9 58
Current assets 24 1
Provisions for post-employment benefits 57 0
Short-term provisions 14 —
Other 24 —
Tax loss carry-forwards 100 —
Closing balance 228 59
2018
Deferred tax balances, netDeferred tax
assetsDeferred tax
provisions
Non-current assets — 46
Current assets 21 4
Provisions for post-employment benefits 47 0
Short-term provisions 10 —
Other 32 0
Tax loss carry-forwards 85 —
Closing balance 195 50
Change of deferred tax on temporary differences and unused tax losses 2019 2018
Opening balance, net 145 256
Recognised in net profit, continuing operations 26 –2
Recognised in net profit, discontinued operations 0 22
Acquired companies –13 0
Divested deferred tax balance, net 0 10
Write-down of deferred tax assets 0 –135
Tax recognised in other comprehensive income 9 –7
Translation differences 2 1
Closing balance, net 169 145
Tax Loss Carry-Forwards At 31 December 2019, the Group had total tax loss carry-forwards of MSEK 1,761 (1,846). There is no expiration date for the utilisation of approximately 93% of the tax loss carry-forwards. Deferred tax assets regarding tax loss carry-forwards are recognised to the extent that realisation of the related tax benefit through future taxable profits is probable within the near future. Deferred tax assets of MSEK 100 (85) related to tax loss carry-forwards of MSEK 484 (502), have been recognised in the balance sheet. These deferred tax assets include an amount of MSEK 57 (73) related to subsidiaries which have incurred taxable losses during the current period.
Management believes that the tax loss carry-forwards will be utilised in the future mainly due to the following reasons: there is a history of pre-tax income; these subsidiaries will generate taxable income in the near term; there are viable tax strategies that could be implemented to accelerate taxable income in order to realise a portion of the recorded deferred tax assets; and a significant portion of the net operating losses has an indefinite life or does not expire in the near term.

70
Gunnebo Annual Report 2019 / Financial Statements
Note 11 Intangible Assets
2019 GoodwillOther intangible
assets
Acquisition costs
Opening balance 1,408 787
Capital expenditure — 46
Acquired companies 111 65
Disposals — –3
Translation differences 35 14
Closing balance 1,554 909
Accumulated amortisation and impairments
Opening balance 0 481
Amortisation — 50
Impairments 29 —
Divestments — –3
Translation differences — 7
Closing balance 29 535
Net book value 1,525 374
2018 GoodwillOther intangible
assets
Acquisition costs
Opening balance 1,596 855
Capital expenditure — 72
Divestments –253 –187
Reclassifications — 16
Translation differences 65 31
Closing balance 1,408 787
Accumulated amortisation and impairments
Opening balance — 541
Amortisation — 53
Impairments 253 46
Divestments –253 –177
Translation differences — 18
Closing balance — 481
Net book value 1,408 306
Other intangible assets include acquisition-related brand name with an indefinite useful life, customer relations and product development with carrying amounts totalling MSEK 83 (80), MSEK 50 (55) and MSEK 57 (–) respectively. Additionally, it also includes internally generated capitalised product develop-ment and software developed for internal use with carrying amounts totalling MSEK 113 (92) and MSEK 71 (79) respectively. During the year, capital expend-iture on product development projects totalled MSEK 46 (46).
Amortisation is included in cost of goods sold with MSEK –37 (–40) , selling expenses with MSEK –2 (–3) and administrative expenses with MSEK –11 (–10), in the consolidated income statement.
Impairment losses, as included within other operating income and expenses in the profit and loss statement, include an impairment of Goodwill linked to Integrated Security. See impairment testing below for further discussion. Dur-ing 2018, Impairment losses related to divestments made during the year, with the most significant being the divestment of the French, Belgium and Luxem-bourg businesses amounting to MSEK 232. See note 4 Discontinued opera-tions for further discussions regarding this divestment. Additionally, it included an impairment loss of MSEK 21, resulting from the divestment of an Integrated Security business in the UK.
Impairment TestingThe table below shows the total carrying amount of goodwill and brand name with an indefinite useful life as allocated per CGU for the purposes of impair-ment testing. Taking into account that it has been assessed that cash flows attributable to the brand name cannot be separated from the other cash flows within the CGU, an impairment test was performed for both goodwill and the brand name jointly for the relevant CGU. The brand name amounted to MSEK 83 (80) and was included within the CGU Safe Storage, whereas Goodwill was allocated across multiple CGU's (the Business Units). During 2019, goodwill has been re-allocated due to shifts in the business units coming from the reorganisation.
CGUs 2019 2018
Entrance Control 281 291
Safe Storage 845 487
Cash Management 380 403
Other CGUs 102 307
Carrying amount 1,608 1,488
The recoverable amount of the CGU's was based on value in use, as described in Note 1, determined by discounting the future cash flows to be generated from the continuing use of the CGU's. The recoverable amount was deter-mined to be higher than its carrying amount for all CGU's except where an impairment charge of MSEK 29 was taken on Goodwill related to the Electronic article surveillance business.
The calculation of value in use for all CGU's is most sensitive to the following assumptions:
Discount rates Value in use is calculated using the pre-tax discount rate of 7.8% (9.1) which equates to the Group’s weighted average cost of capital, WACC. The CGUs, being the business units, are all relatively diversified and have a widely spread geographical coverage and, to a large extent, a diversified customer segment base. Specific risks, if any, have been considered in the projected cash flows. The same discount rate has therefore been used for all CGUs. A sensitivity test was performed based on a 1 percentage point increase, as a reasonably possible adverse change. This would not result in any impairment.
Operating marginsThe average growth rate used to extrapolate the future operating cash flows, results in growth at a constant margin development over the forecast period. A sensitivity test was performed using a flat operating margin over the forecast period, as a reasonably possible, yet aggressive adverse change. This would result in a further impairment in the Electronic article surveillance business included in other CGU’s.
Growth rates used to extrapolate cash flows beyond the forecast periodA terminal growth value of 2.0% (2.0) was used to calculate growth in the termi-nal period. A sensitivity test was performed to reduce this to 0%, which would not result in an impairment.

71
Note 12 Leases
The table below presents the right of use assets per category:
2019
Buildings and office
space Vehicles
Production and office
equipment
Total
Acquisition values
Opening balance 173 62 19 254
Additions 67 20 4 91
Modifications –3 — — –3
Translation differences 5 2 1 8
Closing balance 242 84 24 350
Accumulated depreciation
Opening balance — — — —
Depreciation 70 32 9 111
Modifications –3 — — –3
Translation differences –1 — — –1
Closing balance 66 32 9 107
Net book value 176 52 15 243
Contracted maturity dates for leasing liabilities
Less than 12 months 100
1-2 years 61
2-5 years 67
Over 5 years 20
Total 248
Total cash outflow for leases in 2019 was MSEK 120 wherof MSEK 14 repres-ented interest expenses. The expense for short-term leases for which lease accounting is not applied totalled MSEK 7.
Note 13 Property, Plant and Equipment
2019Buildings and land1)
Machi- nery
Equip-ment
Construc-tion in
progress
Total
Acquisition costs
Opening balance 179 342 260 42 823
Capital expenditure 4 32 19 14 69
Acquisitions 24 0 4 2 30
Disposals –23 –21 –29 — –73
Reclassifications — 20 — –20 —
Translation differences 6 12 13 2 33
Closing balance 190 385 267 40 882
Accumulated depreciation and impairment
Opening balance 82 240 219 — 541
Depreciation 8 24 19 — 51
Disposals –14 –15 –28 — –57
Translation differences 3 9 13 — 25
Closing balance 79 258 223 — 560
Net book value 111 127 44 40 322
2018Buildings and land1)
Machi-nery
Equip-ment
Construc-tion in
progress
Total
Acquisition costs
Opening balance 388 531 354 48 1 321
Capital expenditure 6 12 21 26 65
Disposals –9 –13 –10 0 –32
Divestments –228 –203 –115 –7 –553
Reclassifications 9 3 0 –27 –15
Translation differences 13 12 10 2 37
Closing balance 179 342 260 42 823
Accumulated depreciation and impairment
Opening balance 283 401 292 — 976
Depreciation 10 26 25 — 61
Disposals –6 –8 –8 — –22
Divestments –229 –204 –116 –13 –562
Impairments 13 13 20 13 59
Translation differences 11 12 6 0 29
Closing balance 82 240 219 0 541
Net book value 97 102 41 42 282
1) Including land improvements.
Depreciation is included in cost of goods sold with MSEK –36 (–47), selling expenses with MSEK –4 (–3) and administrative expenses with MSEK –11 (–11) in the consolidated income statement.
Note 14 Inventories
2019 2018
Raw materials 201 190
Work in progress 42 38
Finished goods 464 431
Installation work in progress 47 58
Total 754 717
At 31 December 2019 the Group's obsolescence amounted to MSEK 79 (74).
Note 15 Total Receivables From Customers and Contract Liabilities
2019 2018
Accounts receivable 939 946
Contract assets:
Unbilled revenues (point in time) 6 11
Percentage of completion (over time) 27 61
Total receivables from customers 972 1,018
The contract assets primarily relate to the Group's rights to consideration for products delivered yet not billed at the reporting date. Contract assets are trans-ferred to receivables when invoicing occurs, which happens when all perform-ance obligations under the contract are completed.
The ending balances at 2019 are expected to be invoiced completely within the next year.
Standard payment terms vary geographically, however the Group strives for 30 days.
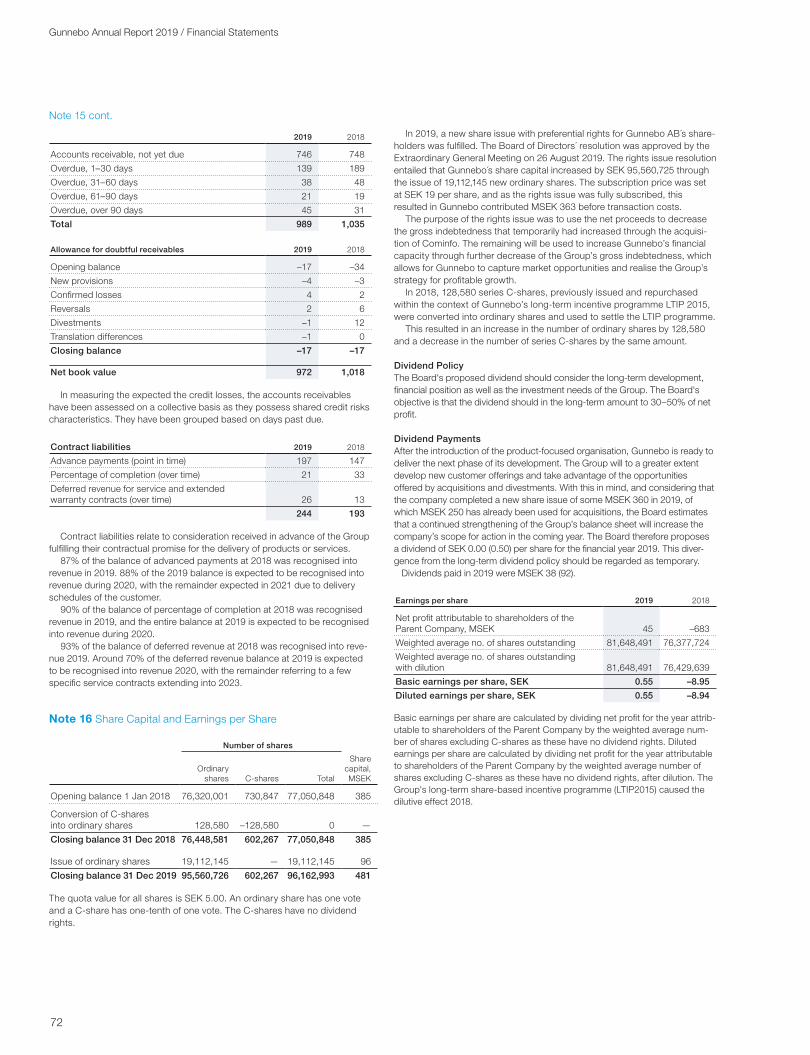
72
Gunnebo Annual Report 2019 / Financial Statements
2019 2018
Accounts receivable, not yet due 746 748
Overdue, 1–30 days 139 189
Overdue, 31–60 days 38 48
Overdue, 61–90 days 21 19
Overdue, over 90 days 45 31
Total 989 1,035
Allowance for doubtful receivables 2019 2018
Opening balance –17 –34
New provisions –4 –3
Confirmed losses 4 2
Reversals 2 6
Divestments –1 12
Translation differences –1 0
Closing balance –17 –17
Net book value 972 1,018
In measuring the expected the credit losses, the accounts receivables have been assessed on a collective basis as they possess shared credit risks characteristics. They have been grouped based on days past due.
Contract liabilities 2019 2018
Advance payments (point in time) 197 147
Percentage of completion (over time) 21 33
Deferred revenue for service and extended warranty contracts (over time) 26 13
244 193
Contract liabilities relate to consideration received in advance of the Group fulfilling their contractual promise for the delivery of products or services.
87% of the balance of advanced payments at 2018 was recognised into revenue in 2019. 88% of the 2019 balance is expected to be recognised into revenue during 2020, with the remainder expected in 2021 due to delivery schedules of the customer.
90% of the balance of percentage of completion at 2018 was recognised revenue in 2019, and the entire balance at 2019 is expected to be recognised into revenue during 2020.
93% of the balance of deferred revenue at 2018 was recognised into reve-nue 2019. Around 70% of the deferred revenue balance at 2019 is expected to be recognised into revenue 2020, with the remainder referring to a few specific service contracts extending into 2023.
Note 16 Share Capital and Earnings per Share
Number of shares
Ordinary shares C-shares Total
Share capital, MSEK
Opening balance 1 Jan 2018 76,320,001 730,847 77,050,848 385
Conversion of C-shares into ordinary shares 128,580 –128,580 0 —
Closing balance 31 Dec 2018 76,448,581 602,267 77,050,848 385
Issue of ordinary shares 19,112,145 — 19,112,145 96
Closing balance 31 Dec 2019 95,560,726 602,267 96,162,993 481
The quota value for all shares is SEK 5.00. An ordinary share has one vote and a C-share has one-tenth of one vote. The C-shares have no dividend rights.
Note 15 cont.
In 2019, a new share issue with preferential rights for Gunnebo AB´s share-holders was fulfilled. The Board of Directors´ resolution was approved by the Extraordinary General Meeting on 26 August 2019. The rights issue resolution entailed that Gunnebo´s share capital increased by SEK 95,560,725 through the issue of 19,112,145 new ordinary shares. The subscription price was set at SEK 19 per share, and as the rights issue was fully subscribed, this resulted in Gunnebo contributed MSEK 363 before transaction costs.
The purpose of the rights issue was to use the net proceeds to decrease the gross indebtedness that temporarily had increased through the acquisi-tion of Cominfo. The remaining will be used to increase Gunnebo’s financial capacity through further decrease of the Group’s gross indebtedness, which allows for Gunnebo to capture market opportunities and realise the Group’s strategy for profitable growth.
In 2018, 128,580 series C-shares, previously issued and repurchased within the context of Gunnebo’s long-term incentive programme LTIP 2015, were converted into ordinary shares and used to settle the LTIP programme.
This resulted in an increase in the number of ordinary shares by 128,580 and a decrease in the number of series C-shares by the same amount.
Dividend PolicyThe Board's proposed dividend should consider the long-term development, financial position as well as the investment needs of the Group. The Board's objective is that the dividend should in the long-term amount to 30–50% of net profit.
Dividend PaymentsAfter the introduction of the product-focused organisation, Gunnebo is ready to deliver the next phase of its development. The Group will to a greater extent develop new customer offerings and take advantage of the opportunities offered by acquisitions and divestments. With this in mind, and considering that the company completed a new share issue of some MSEK 360 in 2019, of which MSEK 250 has already been used for acquisitions, the Board estimates that a continued strengthening of the Group’s balance sheet will increase the company’s scope for action in the coming year. The Board therefore proposes a dividend of SEK 0.00 (0.50) per share for the financial year 2019. This diver-gence from the long-term dividend policy should be regarded as temporary. Dividends paid in 2019 were MSEK 38 (92).
Earnings per share 2019 2018
Net profit attributable to shareholders of the Parent Company, MSEK 45 –683
Weighted average no. of shares outstanding 81,648,491 76,377,724
Weighted average no. of shares outstanding with dilution 81,648,491 76,429,639
Basic earnings per share, SEK 0.55 –8.95
Diluted earnings per share, SEK 0.55 –8.94
Basic earnings per share are calculated by dividing net profit for the year attrib-utable to shareholders of the Parent Company by the weighted average num-ber of shares excluding C-shares as these have no dividend rights. Diluted earnings per share are calculated by dividing net profit for the year attributable to shareholders of the Parent Company by the weighted average number of shares excluding C-shares as these have no dividend rights, after dilution. The Group's long-term share-based incentive programme (LTIP2015) caused thedilutive effect 2018.

73
Note 17 Post-Employment Benefits
2019
Amounts recognised in the consolidated balance sheet UK Canada Sweden Germany Other Total
Defined benefit obligations (DBO) 699 153 138 42 101 1,133
Plan assets –542 –155 — — –25 –722
Total provisions for post-employment benefits 157 –2 138 42 76 411
2018
Amounts recognised in the consolidated balance sheet UK Canada Sweden Germany Other Total
Defined benefit obligations 600 131 117 45 92 985
Plan assets –457 –132 — — –21 –610
Total provisions for post-employment benefits 143 –1 117 45 71 375
The Group operates a number of post-employment defined benefit pension plans and other long-term employee benefits, mainly in the UK, Canada, Sweden, and Germany.
UKIn the UK, pension commitments are mainly secured through payments into a defined benefit pension plan. The plan is a final salary pension plan and is closed to new employees who instead are entitled to defined contribution pension solutions. To meet legal requirements, the plan comprises an independent foundation and is funded. The foundation’s assets are managed by a board comprising representatives for Gunnebo and the employees who are members of the plan. The assets are managed in accordance with national legislation and in collaboration with professional advisors and fund managers. The weighted average remaining term of the DBO is 18 years.
CanadaCanada has pensions plans which are contributory career average earnings type plans for both salaried and certain bargaining unit employees. Both plans are funded. Additionally there is a funded Supplemental Retirement Plan (SERP), as well as a post-retirement benefit plan which is an unfunded defined benefit plan, providing medical benefits to retirees and their spouses. The weighted average duration of the DBO is 16 years.
SwedenIn Sweden, pension liabilities comprise a defined benefit pension plan, relating to lifelong retirement pensions, where the benefits are primarily based on the employees’ final pay. This liability is guaranteed by a credit insurance from PRI Pensionsgaranti Mutual Insurance Company. The weighted average remaining term of the DBO is 20 years. There are no funding requirements for the Swedish plans. The disability- and survivors’ pension part of the ITP-plan is secured through an insurance solution with the company Alecta and is classi-fied as a multi-employer defined benefit plan. However, as Alecta has not been able to provide sufficient information to enable the ITP plan to be reported as a defined-benefit plan, it is reported as a defined-contribution plan. Alecta’s collective funding ratio was 148% (142%) as of 31 December 2019. The collective funding ratio reflects the fair value of Alecta’s plan assets as a per-centage of plan commitments, measured in accordance with Alecta’s actuarial assumptions, which are not consistent with IAS 19. Expected contributions in the next reporting period for ITP 2 insurance covered by Alecta are MSEK 2.
GermanyThe main pension plans in Germany are unfunded plans. The majority of entitlement conditions are determined in accordance with the governmental pensions act. There are no regulatory funding requirements. The weighted average remaining term of the DBO is 16 years.
Other CountriesThe most significant plans include the unfunded pension plans in Indonesia. Additionally, there are termination indemnity plans in Italy, where lump sum payments are made upon termination, as well as other long-term service award, jubilee and healthcare plans. The weighted average remaining term of the DBO is 9 years.

74
Gunnebo Annual Report 2019 / Financial Statements
Note 17 cont.
Actuarial AssumptionsThe following were the principal actuarial assumptions at the reporting date (expressed as weighted averages):
2019 UK Canada SwedenGer-
many Other
Discount rate 2.1% 3.0% 1.5% 1.8% 4.2%
Expected salary increase rate n/a 3.5% 2.5% n/a 5.8%
Inflation 3.3% 2.5% 1.8% 2.0% 2.7%
2018 UK Canada SwedenGer-
many Other
Discount rate 2.9% 4.0% 2.4% 1.8% 5.9%
Expected salary increase rate n/a 3.5% 2.8% 0.0% 3.7%
Inflation 3.5% 2.5% 2.0% 2.0% 2.1%
Sensitivity AnalysisReasonably possible changes at the reporting date to one of the relevant actu-arial assumptions, holding other assumptions constant, would have affected the defined benefit obligation by the amounts shown below.
Assumptions+1 percent-
age point–1 percent-
age point
Discount rate –158 167
Expected salary increase rate 14 –10
Inflation 59 –55
2019 2018
Specification of changes in the net defined benefit obligationPresent value
of obligationFair value of plan assets Total
Present value of obligation
Fair value of plan assets Total
Opening balance 985 –610 375 1,109 –615 494
Expenses:
Current service cost 10 0 10 18 — 18
Past service cost 1 0 1 8 — 8
Interest expense (+)/income (–) 32 –21 11 30 –17 12
Other 4 3 7 0 2 3
47 –18 29 56 –15 41
Remeasurements:
Return on plan assets excluding amounts included in interest income — –73 –73 — 15 15
Actuarial gains (–) and losses (+) arising from changes in demographic assump-tions –11 — –11 –11 — –11
Actuarial gains (–) and losses (+) arising from changes in financial assumptions 110 — 110 –49 — –49
Experience-based gains (–) and losses (+) 17 — 17 –6 — –6
Other –6 — –6 11 — 11
110 –73 37 –55 15 –40
Cash flow:
Employee contributions to the plan 2 –2 0 2 –2 0
Employer contributions to the plan 0 –25 –25 — –23 –23
Payment of pension benefits –72 52 –20 –58 38 –20
–70 25 –45 –56 13 –43
Other:
Divestments — — — –93 3 –90
Translation differences 61 –46 15 24 –11 13
Closing balance 1,133 –722 411 985 –610 375
For 2018, past service costs include a charge in relation to the equalisation of male and female guaranteed minimum pension ("GMP") entitlement following recent changes in UK legislation during the year.
Other remeasurements include the effects of one of our Canadian plans has a surplus that is not recognised on the basis that future economic benefits are not available to the entity in the form of a reduction in future contributions or a cash refund.
Of the present value of DBO, MSEK 877 (756) relates to funded pensions and other plans, and MSEK 256 (228) to non-funded pensions and other plans. The total benefit expense for defined benefit plans amounted to MSEK 25 (40), whereof MSEK 14 (27) has been charged to operating expenses and MSEK 11 (13) to financial expenses. Expenses related to defined contribution plans amounted to MSEK 52 (57). The Group expects to pay MSEK 35 (45) in contri-butions to its defined benefit plans in 2020.
Specification of plan assets
2019 UK Canada Other Total
Government bonds 158 52 11 221
Commercial papers 207 — — 207
Shares 115 86 — 201
Real estate 8 — — 8
Liquid funds 54 17 14 85
Total 542 155 25 722
2018 UK Canada Other Total
Government bonds 151 42 10 203
Commercial papers 165 — — 165
Shares 90 79 — 169
Real estate 5 — — 5
Liquid funds 46 11 11 68
Total 457 132 21 610
Plan assets include no financial instruments in Gunnebo AB or assets used within the Group.

75
Note 18 Provisions
2019Restruc-
turing Litigation Warranty Other Total
Opening balance 2 4 46 3 55
Provisions during the year 19 0 12 2 33
Utilised during the year –5 0 –8 0 –13
Reversed during the year — — –25 0 –25
Translation differences 1 0 3 –3 1
Closing balance 17 4 28 2 51
Provisions for restructuring activities relate to structural reorganisations andshut-down costs that the Group is obligated to settle.
The Group conducts its normal course of business on a global basis which includes operating in both well developed countries as well as politically insta-ble countries. From time to time, the Group becomes a party in legal disputes. These are monitored and assessed continuously during the year by manage-ment. The provision for litigation represents management’s best estimate of the future cash flows necessary to settle these at the end of 2019, although the timing of the settlement is uncertain.
These estimates take into consideration the nature of the litigation, the legal process in the applicable jurisdiction, the progress of the cases, the opinions of internal and external legal counsel and advisers regarding the outcome of the case and experience with similar cases.
Warranty provisions involve estimates of the outcome of claims resulting from defective products. Assumptions are required for anticipated returns and for cost for replacing defective products and/or compensating customers for damage caused by the Group's products. These assumptions are based on historical claims statistics, and expected costs to remedy as well as time lags.
Note 19 Other Short-Term Assets and Liabilities
Other short-term assets 2019 2018
Other short-term receivables 107 115
Prepaid insurance premiums 6 6
Prepaid rent 9 9
Accrued interest 1 2
Other prepaid items 66 66
Total 189 198
Other short-term liabilities 2019 2018
Other short-term liabilities 99 102
Holiday pay liability 64 68
Accrued salaries 81 79
Social security charges 35 33
Contract liabilities* 244 193
Accrued interest 0 2
Other accrued items 236 197
Total 759 674
* Refer to Note 15 for a further description of contract liabilities.
Note 20 Financial Risk Management and Financial Instruments
Financial Risk ManagementThe Group’s financial activities are carried out in accordance with the finance policy approved by the Board of Directors, which regulates how financial risks are to be managed and the limits within which the Group’s internal bank, Gunnebo Treasury AB, and the subsidiaries may operate.
Risk Description and Risk ManagementThe main financial risks that the Group is exposed to are; financing risk, inter-est rate risk, liquidity risk, currency risk and credit risk. Each of these are defined below with a policy description as well as information on the manage-ment of them during the year.
Liquidity riskLiquidity risk refers to the risk of not having access to cash and cash equiva-lents or undrawn lines of credit in order to fulfil payment obligations. The finance policy stipulates that available cash and cash equivalents and unused lines of credit shall always amount to a minimum of MSEK 350. Cash in the Group shall be deposited with the internal bank or in local cash pools. The Group has centralised its liquidity management in cash pools in the main Euro-pean countries where it operates, as well as in Singapore and the USA. These cash pools are used to match the local subsidiaries’ surpluses and deficits in each country and currency. Since the Group is a net borrower, the surplus liquidity is used to reduce external loan liabilities.
The contracted maturity dates for the Group’s financial assets and liabilities are shown in the table below.
Financing riskFinancing risk refers to the risk that financing of the Group’s capital require-ment and refinancing of outstanding borrowings are rendered more difficult or more expensive. In order to limit the financing risk, the Group’s finance policy stipulates that the total outstanding volume of borrowing must be covered by long-term credit facilities of at least 12 months at any given time.
Credit facilities totalled MSEK 2,627 (2,591) at the end of the year, of which MSEK 1,842 (1,909) was drawn. The average duration of the agreed credit facilities was 3.29 years (4.25). The long-term credit facilities chiefly comprise of a syndicated loan agreement of MEUR 140 which falls due in June 2022. In addition, the Group has a bilateral term loan for MEUR 75 which falls due in April 2024. Furthermore, there are a number of other short-term credit facilities totalling MSEK 361 (364). Individual subsidiaries can have external financing when taxes and other regulations in certain countries make it unfavourable to take up loans from foreign group companies.

76
Gunnebo Annual Report 2019 / Financial Statements
Note 20 cont.
Loan maturity structure Credit facilityOf which
drawn
2020 361 37
2021 and later 2,266 1,805
Total 2,627 1,842
Interest rate riskThe interest rate risk refers to the negative effect on the Group’s result and cash flow of a lasting change in market interest rates. The effect may, however, be limited in the short-term through carefully selected interest maturity struc-tures and by entering into fixed interest agreements in the form of interest rate hedges. The Group’s finance policy stipulates that a maximum of 60% of the outstanding volume of borrowing can be hedged with interest derivatives, the average term of which must not exceed 36 months.
At the end of the year, the Group’s loan portfolio had an average fixed inter-est term of 3 (3) months and the average rate of interest on the loan portfolio1) was 1.8% (1.7).
1) Including margins.
Sensitivity Analysis: Given the same borrowing liability and the same fixed interest terms as at the end of the year, a one percentage point increase in the market interest rate would increase the Group’s interest cost by approximately MSEK 18 on an annual basis.
Currency riskThe consolidated financial statements are prepared in the Swedish krona. However, the Group has operations in a large number of countries worldwide, and consequently is exposed to currency risks. These are transaction expo-sure, translation exposure (net investments) and translation exposure (income statement).
Total currency effects resulted in a positive impact on operating profit ofMSEK 20 of which MSEK 1 relates to transaction effects and MSEK 19 totranslation effects.
Transaction exposureThe Group has revenues and purchase cost in several currencies and is there-fore exposed to exchange rate fluctuations. This currency risk is called trans-action exposure and has an impact on the Group’s operating profit. In accord-ance with the finance policy, the Group does not ordinarily hedge transaction exposure. Hedging may, however, be carried out for large projects and for a large, stable, currency flow, provided the exposure is deemed considerable and the hedging can be done at a reasonable cost. However, some minor hedge exists in the acquired Czech operations with maturity dates over the coming 27 months. Other hedging should usually not be for more than 12 months and there has not been hedged transaction exposure for other curren-cies in 2019 or 2018.
Contracted maturity dates for financial assets and liabilitiesLess than 6 months
6–12 months 1–2 years 2–3 years
Total contracted
cash flow
Accounts receivable 989 — — — 989
Cash and cash equivalents 744 — — — 744
Bank loans and overdraft facilities1) –1,857 –15 –29 –29 –1,930
Accounts payable –585 — — — –585
Derivatives
- Interest-rate swap agreements outflow — — — — —
- Currency forward contracts not included in hedge accounting outflow –788 — — — –788
inflow 784 — — — 784
Total –713 –15 –29 –29 –786
1) The amounts are nominal and include interest. Rollover dates on borrowing under the Group’s syndicated credit facilities fall within 6 months but the guaranteed credit facilities do not mature until 2022 and 2024.
For financial liabilities with a long-contracted term but a short/variable interest, the variable interest has been adopted as the quoted interbank rate as of 31 December 2019. The base currency of the currency forward contract has been remeasured at the applicable closing rate as of 31 December 2019 while the future flows of the other type of currency are measured at the contracted rate.
The commercial currency flow in 2019 after net calculations of opposite flows amount to MSEK 114 (134) on an annual basis. The largest transactional currency flows are shown in the chart below. The Group is a net seller of EUR, AUD and DKK while a net buyer of CNY and CZK.
–150 –75 0 75 150
EUR
AUD
DKK
CZK
CNY
Net currency flows 2019, MSEKLorem ipsum
Translation exposure (net investments)Upon consolidation, the net assets of foreign subsidiaries are translated into the Swedish krona, which result in translation differences impacting other comprehensive income and accumulate in equity. In order to limit the negative effects of translation differences on the Group’s equity, hedging may be done through borrowing and currency derivative contracts, provided the exposure is deemed considerable and the hedging can take place at a reasonable cost. The net assets of foreign subsidiaries amounted to MSEK 345 (288) on 31 December 2019.
One net investment hedge exists where the currency effect in other compre-hensive income was MSEK 2 (–2).
Translation exposure (income statement)Exchange rate fluctuations also affect Group profit when income statements of foreign subsidiaries are translated into the Swedish krona. Expected future profit in foreign subsidiaries are not hedged against exchange rate fluctuations.
Sensitivity analysis: A 10% depreciation of the value of the Swedish krona against all other curren-cies would increase profit before tax by a total of approximately MSEK 24, of which approximately MSEK 11 would be netted transaction exposure. The remaining MSEK 13 is attributable to translation exposure (income statement).
The effects on profit before tax of a 10% depreciation of the Swedish krona against the Group´s top five individual currencies are shown in the charts below, separately for transactional and translational exposures.

77
The nominal amounts of all derivative instruments are as follows:
2019 2018
Interest rate swap agreements
Term of less than 1 year 0 206
Interest rate swap agreements total 0 206
Currency forward contracts1) 784 908
Total 784 1,114
1) Currency forward contracts relating to borrowing in foreign currencies, with the gross
amount calculated at future forward rate.
Financial Assets and Liabilities Covered by Netting or Similar Agreements The Group has entered into general agreements (ISDAs) with all counterparties regarding transactions in derivative instruments. All receivables and liabilities related to such instruments may, therefore, be offset in their entirety against the respective counterparty. The table below shows the Group’s derivatives on the closing day taking into account the netting opportunities.
Gross
Netting
agreement Net
Assets 1 –1 0
Liabilities –5 1 –4
The Capital Structure of the GroupOne of the Group’s long-term financial objectives is to have an equity ratio of no less than 30%. The equity ratio at the end of the year was 27% (22). Another of the Group’s aims is to achieve a return of 15% on capital employed. The return on capital employed (excluding items affecting comparability) for 2019 was 10.8% (12.8).
The Group’s borrowing is unsecured. The borrowing is however limited by financial obligations in the loan agreements in the form of covenants. These mainly relate to the key ratios of interest coverage ratio and net debt/EBITDA. With regard to the prevailing terms in the loan agreements, available credit facilities amounted to MSEK 28 (132) at the end of the year as all financial com-mitments in the form of covenants was fulfilled.
Fair Value DisclosuresThe table below presents the financial assets and financial liabilities measured at fair value.
Financial instruments measured at fair value For all assets and liabilities measured at fair value, which comprise derivative instruments, the fair value has been established based on measurement tech-niques which are, in all essentials, based on observable market data. Accord-ing to the fair value hierarchy of IFRS 13, such measurement methods are referred to as Level 2.
Other financial assets and liabilitiesFor financial instruments such as accounts receivable, accounts payable and other non-interest-bearing financial assets and liabilities, which are recognised at amortised cost less any write-down, the fair value is deemed to be the same as the carrying amount due to the short anticipated duration.
The Group’s long-term borrowing primarily relates to long-term credit facili-ties but with short fixed interest rate periods and a stable credit margin. The fair value is therefore deemed to be the same as the carrying amount.
–5
–10
–15
10
5
15
EU
R
AU
D
DK
K
CZK
CN
Y
Transactional effect of 10% weaker SEK against top five currencies, MSEK
–4
4
8
INR
US
D
CN
Y
CZ
K
ZA
R
ETranslational effect of 10% weaker SEK against top five currencies, MSEK
Lorem ipsum
A 10% depreciation of the Swedish krona against all other currencies would result in an increase in equity of approximately MSEK 35, with the largest effect coming from the INR.
Credit RiskFinancial credit riskCredit risk refers to the risk of a loss if the counterparty fails to fulfil its obliga-tions. Exposure arises both when depositing surplus liquidity and in receiva-bles from banks which arise via derivative instruments. The Group’s finance policy includes a list of permitted counterparties and maximum credit exposure with each approved counterparty. The Group has also entered into general agreements (ISDAs) with all counterparties for transactions in derivative instru-ments. Cash and cash equivalents shall primarily be used to reduce outstand-ing liabilities which limits the volume of outstanding surplus liquidity.
Customer credit riskAn instruction has been established regulating the management of customer credit within the Group. Each subsidiary is responsible for checking and con-trolling credit risk with customers. The rules applicable for issuing credit locally are documented in local credit policies regulating credit limits, payment terms and collection procedures. Customer financing packages are also approved by Gunnebo Treasury.
The Group’s maximum exposure to credit risk is equivalent to the book values of financial assets, as shown in the table below:
2019 2018
Accounts receivable 972 1,018
Other short-term receivables 63 64
Cash and cash equivalents 744 569
Maximum exposure to credit risk 1,779 1,651
Derivative Instruments and HedgingCurrency forward contractsCurrency forward contracts are used to manage the currency risk of receiva-bles and liabilities denominated in foreign currencies. The Group has chosen not to apply hedge accounting since the receivables, liabilities and related for-ward currency contracts are all valued at the closing exchange rate through the income statement.
Interest rate swapsInterest rate swaps are used to hedge the interest payments on borrowings. Hedge accounting is applied and the nominal value of outstanding interest rate swap agreements designated as cash flow hedges amounted to MSEK 0 (206) on 31 December 2019.
Under hedge accounting, the effective portion of changes in fair value of derivative instruments which are designated as cash flow hedges and which fulfil the requirements of hedge accounting is recognised via other comprehen-sive income and accumulated under equity. The amount recognised in other comprehensive income for the year 2019 was MSEK 1 (3).

78
Gunnebo Annual Report 2019 / Financial Statements
Note 22 Personnel
Average number of employees per country 2019
of which men 2018
of which men
Sweden 184 130 187 133
Australia 42 37 43 38
Brazil 134 97 140 106
Canada 130 96 124 94
Czech Republic 72 61 — —
China/Hong Kong 126 31 118 88
Denmark 68 56 66 55
Finland 4 3 4 3
France 7 4 7 4
Germany 170 143 175 148
Hungary 7 5 8 5
India 1,010 976 961 929
Indonesia 658 578 738 650
Italy 147 120 157 128
Malaysia 33 22 32 21
Mexico 214 199 234 211
Netherlands 321 298 354 328
Norway 17 16 20 19
Poland 55 45 56 46
Portugal 24 17 34 27
Singapore 18 11 21 12
South Africa 43 27 64 41
South Korea 16 13 16 13
Spain 282 216 304 234
Switzerland 22 17 30 23
UAE 36 27 32 25
UK 161 114 228 167
USA 225 182 210 167
Total continuing operations 4,226 3,541 4,363 3,715
Total discontinued operations — — 843 682
Total 4,226 3,541 5,206 4,397
Of the average number of employees in continuing operations 685 (648) were female. The average number of employees abroad in continuing operations was 4,042 (4,176).
Note 23 Related Parties
Information on remuneration to members of the Board and the Group key management is provided in Note 6 of the Group. A list of Group companies is found in Note 11 of the Parent Company. There were no other transactions with related parties.
Note 20 cont.
2019 2018
Financial assetsCarrying amount
Fair value
Carrying amount
Fair value
Financial assets measured at fair value1) 1 1 2 2
- of which derivatives for which hedge accounting does not apply 1 1 2 2
Other financial assets2) 1,716 1,716 1,587 1,587
Total financial assets 1,717 1,717 1,589 1,589
Financial liabilities
Financial liabilities measured at fair value3) 5 5 3 3
- of which derivatives for which hedge accounting does not apply 5 5 2 2
- of which interest rate swap agree-ments for which hedge account-ing of cash flows applies — — 1 1
Other financial liabilities4) 2,427 2,427 2,503 2,503
- of which financial liabilities for which hedge accounting does not apply 2,427 2,427 2,297 2,297
- of which financial liabilities for which hedge accounting of cash flows applies — — 206 206
Total financial liabilities 2,432 2,432 2,506 2,506
1) Assets included in other short-term receivables. 2) Assets included in accounts receivable and cash and cash equivalents. 3) Liabilities included in other short-term liabilities. 4) Liabilities included in accounts payable as well as short-term and long-term borrowing.
Note 21 Contingent Liabilities
2019 2018
Guarantees 147 255
Total 147 255
Guarantees for the fulfilment of various contractual obligations are part of the Group’s normal business activities. At the time of publication of this annual report, there were no indications that guarantees reported as contingent liabilities will result in payments.

79
MSEK Note 2019 2018
Net revenue 2 330 266Administrative expenses 2, 6, 9, 10 –320 –257Operating profit (EBIT) 10 9
Financial income and expenses, net 3 –6 –4Profit after financial items 4 5
Appropriations 4 –6 81Profit/loss before taxes –2 86
Income taxes 5 –11 –21Net profit/loss –13 65
Parent Company Statements of Comprehensive Income
MSEK 2019 2018
Net profit/loss –13 65Other comprehensive income — —Total comprehensive income –13 65
Parent Company Income Statements
Parent Company
The Group’s Parent Company, Gunnebo AB (publ), is a Swedish public limited company registered with the Swedish Companies Registration Office under the company registration number 556438-2629. The Board has its registered office in Gothenburg in Sweden. The Company's shares are listed on NASDAQ, Stockholm, MidCap.
Gunnebo AB is a holding company which has the main task of owning and managing shares in other Group companies, as well as providing group-wide functions and services within corporate man-
agement, business development, human resources, legal affairs, financial control/finance, IT, quality, logistics, the environment and communication & investor relations. Net revenue for 2019 amounted to MSEK 330 (266), representing services invoiced to subsidiaries. Profit after financial items was MSEK 4 (5). Net profit/loss amounted to MSEK –13 (65). Group contributions had an impact on net profit/loss of MSEK –6 (81).

80
Gunnebo Annual Report 2019 / Financial Statements
MSEK Note31 December
201931 December
2018
ASSETS
Non-current assetsIntangible assets 6 69 72
Property, plant and equipment 2 2Investments in Group companies 11 1,615 1,585Deferred tax assets 5 13 12Total non-current assets 1,699 1,671
Current assetsReceivables from Group companies 250 118Prepaid expenses and accrued income 18 16Cash and cash equivalents 0 0Total current assets 268 134
TOTAL ASSETS 1,967 1,805
EQUITY AND LIABILITIES
Restricted equityShare capital (96,162,993 shares with a quota value of SEK 5) 481 385Statutory reserve 539 539Development reserve 50 51Total restricted equity 1,070 975
Unrestricted equityShare premium reserve 711 456Retained earnings 55 27Net profit/loss –13 65Total unrestricted equity 753 548
Total equity 1,823 1,523
Current liabilitiesLiabilities to Group companies 73 206Accounts payable 30 43Other short-term liabilities 7 41 33Total current liabilities 144 282
TOTAL EQUITY AND LIABILITIES 1,967 1,805
Parent Company Balance Sheets

81
MSEK Note 2019 2018
OPERATING ACTIVITIESOperating profit 10 9Adjustment for depreciation 12 7Interest expenses to subsidiaries –6 –8Taxes paid –12 –4Net cash flow from operating activities 4 4
Cash flow from changes in working capitalChange in operating receivables –147 –63Change in operating liabilities 121 21Total change in working capital –26 –42
Net cash flow from operating activities –22 –38
INVESTING ACTIVITIESDividends from subsidiaries — 3Investments in subsidiaries 11 –30 —Capital expenditure for intangible assets 6 –8 –34Capital expenditure for tangible assets –1 —Net cash flow from investing activities –39 –31
FINANCING ACTIVITIESRepayments of Group loan –138 –112Change in cash pooling accounts, net –190 151Group contributions received 100 119Group contributions paid –24 —Rights issue 351 —Sale of treasury shares — 1Dividends –38 –92Net cash flow from financing activities 61 67
Net cash flow 0 –2
Cash and cash equivalents at the beginning of the year 0 2Cash and cash equivalents at the end of the year 0 0
Parent Company Statements of Cash Flow

82
Gunnebo Annual Report 2019 / Financial Statements
Parent Company Statements of Changes in Equity
Restricted equity Unrestricted equity
MSEK Share capitalStatutory
reserveDevelopment
reserveShare pre-
mium reserveRetained earnings Total
Opening balance 1 January 2019 385 539 51 456 92 1,523
Comprehensive incomeNet profit/loss — — — — –13 –13Other comprehensive income — — — — — —Subtotal — — — — –13 –13
Transactions with shareholdersRights issue 96 — — 255 — 351Change in development reserve — — –1 — 1 0Dividends — — — — –38 –38Subtotal 96 — –1 255 –37 313
Closing balance 31 December 2019 481 539 50 711 42 1,823
Restricted equity Unrestricted equity
MSEK Share capitalStatutory
reserveDevelopment
reserveShare pre-
mium reserveRetained earnings Total
Opening balance 1 January 2018 385 539 40 452 132 1,548
Comprehensive incomeNet profit — — — — 65 65Other comprehensive income — — — — — —Subtotal — — — — 65 65
Transactions with shareholdersShare-based remuneration, incl. sale of treasury shares — — — 4 –2 2Change in development reserve — — 11 — –11 0Dividends — — — — –92 –92Subtotal — — 11 4 –105 –90
Closing balance 31 December 2018 385 539 51 456 92 1,523

83
Note 1 Parent Company's Accounting Principles
The financial statements of the Parent Company are prepared in accordance with the Annual Accounts Act and The Swedish Financial Reporting Board’s recommendation RFR 2 Accounting for Legal Entities. In accordance with RFR 2, IFRS is applied to the greatest extent possible under Swedish legis-lation, but full compliance is not possible. The areas in which the Parent Com-pany’s accounting policies differ from the Group are described below.
For a description of the Group’s accounting policies including effects of new IFRS standards, see note 1 of the Group.
Group ContributionAccording to RFR 2, group contributions paid by the Parent Company to sub-sidiaries are recognised as an increase in the carrying amount of the participa-tions in the receiving subsidiaries. The Swedish Financial Reporting Board has also introduced an alternative rule which means group contributions, both received and paid, may be recognised as an appropriation. Gunnebo has decided to apply the alternative rule.
Note 2 Revenues and Expenses by Nature
The Group’s Parent Company, Gunnebo AB, is a holding company which has the main task of owning and managing shares in other Group companies, as well as providing Group-wide functions and services within corporate manage-ment, business development, human resources, legal affairs, financial control/finance, IT, quality, logistics, the environment and communication & investor relations. Net revenue for 2019 amounted to MSEK 330 (266) representing ser-vices towards subsidiaries, whereof MSEK 62 (49) is related to IT services and MSEK 268 (217) relates to management and brand fees. Operating expenses of MSEK –320 (–257) are specified below.
2019 2018
Remuneration for employees 91 75
Temporary personnel and subcontractors 74 32
Amortisation and depreciation 12 7
Other costs 143 143
Total operating expenses 320 257
Note 3 Financial Income and Expenses, net
2019 2018
Financial income
Dividends from subsidiaries — 3
Financial expenses
Interest expenses to subsidiaries –6 –7
Total –6 –4
Note 4 Appropriations
2019 2018
Group contributions received — 99
Group contributions paid –6 –18
Total –6 81
Notes – Parent Company
Note 5 Income Taxes
2019 2018
Current tax expense –7 –14
Deferred tax expense –4 –7
Total –11 –21
Reconciliation of Swedish tax rate with effective tax rate 2019 2018
Profit before tax –2 86
Tax using the Swedish tax rate (21.4% vs. 22% 2018) 0 –19
Withholding tax –4 –4
Adjustment of prior year taxes –8 0
Other 1 2
Total –11 –21
At 31 December 2019, the Parent Company had total tax loss carry-forwards of MSEK 0 (0). Deferred tax assets in the balance sheet relate to pensions amoun ting to MSEK 13 (12).
Note 6 Intangible Assets
2019 2018
Opening balance acquisition costs 106 92
Capital expenditure 8 34
Disposal — –20
Closing balance 114 106
Opening balance accumulated amortisation 34 29
Amortisation 11 5
Closing balance 45 34
Net book value 69 72
Intangible assets mainly comprise software for internal use.
Note 7 Other Short-Term Liabilities
2019 2018
Holiday pay liability 6 5
Social security charges 18 17
Accrued salaries 5 2
Other items 12 9
Total 41 33
Note 8 Contingent Liabilities
2019 2018
Guarantees 1,956 2,114
Total 1,956 2,114
Refers mainly to guarantees for subsidiaries. There are no pledged assets.

84
Gunnebo Annual Report 2019 / Financial Statements
Note 9 Personnel
In 2019, the total expense for salaries and other remuneration was MSEK 55 (45). Amounts expensed for social security charges was MSEK 36 (30), which included pension costs of MSEK 14 (12). Severance of MSEK 7 (0) is included.
The average number of employees in the Parent Company was 44 (42), whereof 18 females (16).
There are three women on the Board of the Parent Company and two in the Group Executive Team.
Information on remuneration to the Board of Directors and Group Key Management, see Note 6 of the Group.
Note 10 Auditors’ Remuneration
The audit fees of the Parent Company amounted to MSEK 1 (1) during 2019. For a description of the auditors' remuneration, see Note 7 of the Group.
Note 11 Investments in Group Companies
2019 2018
Opening book value 1,585 1,585
Investments in subsidiaries 30 —
Closing book value 1,615 1,585
Directly held investments in Group companies No. of shares Holding, %
Company registra-tion number (SE) Reg. office Country
Countrycode
Main activities1)
Book value 2019
Book value 2018
Gunnebo Holding GmbH 1 100 Garching Germany DE O 0 0
Gunnebo Holding ApS 1,000 100 Skovlunde Denmark DK O 91 91
Gunnebo India Private Ltd 8,059,880 100 Mumbai India IN M, S 116 116
Gunnebo Holding AB 1,000 100 556573-7508 Gothenburg Sweden SE O 120 90
Gunnebo Nordic AB 251,000 100 556041-2362 Gothenburg Sweden SE S 388 388
Gunnebo Treasury AB 1,000 100 556465-2765 Gothenburg Sweden SE O 900 900
Total 1,615 1,585
1) M=Manufacturing, S=Sales/service, O=Other incl. treasury, dormant and/or holding activities.

85
Subsidiaries’ holdings in Group companies Holding, %Company registra-
tion number (SE) CountryCountry
codeMain
activities
Gunnebo Elkosta Security Equipment Trading and Services LLC 49United Arab
Emirates AE S
Gunnebo Middle East FZE 100United Arab
Emirates AE S
Gunnebo Australia Pty Ltd 100 Australia AU S
Gunnebo Österreich GmbH 100 Austria AT S
Gunnebo Gateway Brasil S.A. 100 Brazil BR S
Gunnebo Gateway Brasil Servicos Ltda 100 Brazil BR S
Gunnebo Canada Inc. 100 Canada CA S
Gunnebo (Suisse) SA 100 Switzerland CH S
Gunnebo Security (China) Co. Ltd 100 China CN M, S
Cominfo a.s. 100 Czech Republic CZ M, S
Gunnebo CZ s.r.o. 100 Czech Republic CZ S
Sec-Com Spol. s.r.o. 100 Czech Republic CZ O
Gunnebo Cash Automation GmbH 100 Germany DE O
Gunnebo Deutschland GmbH 100 Germany DE S
Gunnebo Logistics GmbH 100 Germany DE O
Gunnebo Markersdorf GmbH 100 Germany DE M
Rosengrens GmbH 100 Germany DE O
A/S Gunnebo Nordic 100 Denmark DK S
Grupo Sallén Tech S.L. 100 Spain ES M, S
Gunnebo España SA 100 Spain ES S
Perimentral Sallén Technologies S.L. 100 Spain ES S
Sallén France SAS 100 France FR S
Gunnebo Entrance Control Ltd 100 England GB S
Gunnebo UK Ltd 100 England GB S
Gunnebo Magyarország Kft. 100 Hungary HU S
Gunnebo Hong Kong Ltd 100 Hong Kong HK S
PT Chubb Safes Indonesia 100 Indonesia ID M
PT Gunnebo Indonesia Distribution 100 Indonesia ID S
Gunnebo Services India Private Ltd 100 India IN S
Gunnebo Entrance Control S.p.A. 100 Italy IT M
Gunnebo Italia S.p.A. 100 Italy IT S
Gunnebo Korea Co. Ltd 100 South Korea KR S
Gunnebo México S.A. de C.V. 100 Mexico MX S
Gunnebo Malaysia Sendirian Berhad 100 Malaysia MY S
Gunnebo Doetinchem BV 100 Netherlands NL M
Gunnebo Holding Nederland BV 100 Netherlands NL O
Gunnebo Nederland BV 100 Netherlands NL S
Gunnebo Logistics BV 100 Netherlands NL O
Gunnebo Nordic AS 100 Norway NO S
Gunnebo Polska Sp. z.o.o. 100 Poland PL S
Gunnebo Portugal SA 100 Portugal PT S
Blåaspen Sverige AB 100 Sweden SE O
Gunnebo Cash Automation AB 100 556533-2078 Sweden SE S
Gunnebo Gateway AB 100 556480-7641 Sweden SE S
Gunnebo Business Solutions AB 100 556009-9458 Sweden SE S
Gunnebo Singapore Pte Ltd 100 Singapore SG S
Gunnebo Entrance Control Inc. 100 USA US S
Gunnebo Security Inc. 100 USA US S
Hamilton Products Group, Inc. 100 USA US M, S
Hamilton Safe Company, Inc. 100 USA US M, S
Safe LLC 100 USA US O
All Technologies Access and Parking (Pty) Ltd 100 South Africa ZA O
Gunnebo South Africa (Pty) Ltd 100 South Africa ZA S

86
Gunnebo Annual Report 2019 / Financial Statements
Proposed Distribution of EarningsUnrestricted equity in the Parent Company at the disposal of the Annual General Meeting:
Share premium reserve 711,633,880
Retained earnings 53,849,424
Net loss –12,970,891
Total 752,512,413
The Board of Directors proposes:
and to that the remaining sum be carried forward 752,512,413
Total 752,512,413
Gunnebo is, after the introduction of the product-focused organisation, ready to deliver the next phase of its development. The Group will to a greater extent develop new customer offerings and take advantage of the opportunities offered by acquisitions and divestments.
With this in mind, and considering that the company completed a new share issue of some MSEK 360 in 2019, of which MSEK 250 has already been used for acquisitions, the Board estimates that a continued strengthening of the Group’s balance sheet will increase the compa-ny’s scope for action in the coming year. The Board therefore proposes a dividend of SEK 0.00 (0.50) per share for the financial year 2019. This divergence from the long-term dividend policy should be regarded as temporary.
The Board and the President assure that the consolidated financial statements have been prepared in accordance with the Annual Accounts Act and the International Financial Reporting Standards (IFRS), as adopted by the EU and provide a true and fair view of the financial position and results of the Group. The annual report has been prepared in accordance with generally accepted accounting standards and provides a true and fair view of the financial position and result of the Parent Company. The Board of Directors’ Report for the Group and the Parent Com-pany provides a true and fair view of the development of the Group’s and Parent Company’s operations, financial positions and results and describes significant risks and uncertainties facing the Parent Company and the companies included in the Group.
Gothenburg, 19 March 2020
Martin Svalstedt Chairman
Göran Bille Anna Borg Sæther Charlotte Brogren Board member Board member Board member
Eva Elmstedt Mikael Jönsson Crister Carlsson Micke Fridström Board member Board member Board member Board member
Stefan SyrénPresident and CEO
Our audit report was submitted on 19 March 2020 Deloitte AB
Hans Warén Authorised Public Accountant

87
Scope of the Principles, etc.
These principles concern remuneration and other terms of employ-ment for members of the Gunnebo Group Executive Team and are valid for employment agreements entered into after the approval of the principles by the Annual General Meeting 2020 and for changes to existing employment agreements made thereafter. The principles do not apply to any remuneration decided or approved by the Annual General Meeting.
Remuneration under employments subject to other rules than Swedish may be duly adjusted to comply with mandatory rules or established local practice and to offer competitive remuneration in the countries where the personnel reside, taking into account, to the extent possible, the overall purpose of these guidelines.
The Principles’ Promotion of Gunnebo’s Business Strategy, Long-Term Interests and Sustainability
In short, the Group’s business strategy is to be the leading global provider of products and services within each respective business unit by investing in customer-driven innovative product development and customised solutions, and building lasting business relation-ships that create mutual value. A prerequisite for the successful implementation of the Group’s business strategy and safeguarding of its long-term interests, including its sustainability, is that the Group is able to recruit and retain qualified personnel. To this end, it is nec-essary that the Group offers competitive remuneration and employ-ment conditions on the relevant market for each respective senior executive. These principles enable the Group to offer the executive management a competitive total remuneration, which is expected to promote Gunnebo’s business strategy, long-term interests and sus-tainability.
Long-term share-related incentive plans have been implemented in the Group. Such plans have been resolved by the Annual General Meeting and are therefore excluded from these principles. The plans currently include approximately 20 employees including, among others, the CEO, the Group Executive Team and other key employ-ees within the Group. The performance criteria used to assess the outcome of the plans are distinctly linked to the business strategy and thereby to the Group’s long-term value creation, including its sustainability. As present, these performance criteria comprise earn-ings per share, operating margin, cash flow and organic growth in percentage. For more information regarding these incentive plans, please see www.gunnebogroup.com, under the section Governance – Remuneration.
Variable cash remuneration covered by these principles shall aim at promoting the Group’s business strategy and long-term interests, including its sustainability.
Types of Remuneration, etc.
The Group Executive Team’s total remuneration shall consist of fixed cash salary, variable cash remuneration (bonus), pension benefits
and other benefits. Additionally, the Annual General Meeting may, irrespective of these principles, resolve on, among other things, share-related or share price-related remuneration.
The fixed salary shall take into account the individual’s position, competence, areas of responsibility, performance and experience and shall normally be reviewed on an annual basis. The fixed salary shall constitute the basis for the calculation of the bonus.
The satisfaction of criteria for awarding bonus shall be measured over a period of one or several years. The bonus shall be linked to the fulfilment of predetermined and measurable quantitative and qualitative criteria. The criteria comprise of determined and measur-able objectives related to, among other things, growth, profit and cost development within the Group, as well as individual objectives, which shall be designed so as to contribute to the company's busi-ness strategy and long-term interests, including its sustainability. The bonus for members of the Group Executive Team, including the CEO, shall amount to not more than 50 per cent of the fixed annual cash salary.
To which extent the criteria for awarding bonus have been satis-fied shall be determined by the Remuneration Committee when the measurement period has ended. For financial criteria, the evaluation shall be based on established financial data for the current period. Bonuses can be paid out after the end of the measurement period or be subject to deferred payment.
The Board of Directors shall have the possibility, under applicable law or contractual provisions, subject to the restrictions that may apply under law or contract, to in whole or in part reclaim variable remuneration paid on incorrect grounds (claw-back).
For the CEO, pension benefits, including health insurance, shall be defined contribution based. Bonus shall not qualify for pension ben-efits. The pension premiums for defined contribution plans shall, depending on age and level of salary, amount to not more than 35 per cent of the fixed annual cash salary. For other executives, pen-sion benefits, including health insurance, shall be defined contribu-tion unless the individual concerned is subject to defined benefit pension under mandatory collective agreement provisions. Bonus shall qualify for pension benefits to the extent required by mandatory collective agreement provisions. The pension premiums for defined contribution pension shall amount to not more than 35 per cent of the fixed annual cash salary. The retirement age shall be 65 years.
Other benefits may include, for example, private medical insur-ance and company cars. Such benefits may amount to not more than 10 per cent of the fixed annual cash salary.
Termination of Employment
The notice period may not exceed twelve months if notice of termi-nation of employment is made by the Company. Fixed cash salary during the period of notice and severance pay may together not exceed an amount equivalent to the CEO’s fixed cash salary for two years, and one year for other executives. The period of notice may
Proposed Principles for Remuneration to Senior Executives

88
Gunnebo Annual Report 2019 / Financial Statements
not to exceed nine months without any right to severance pay when termination is made by the executive.
Additionally, remuneration may be paid for non-compete under-takings. Such remuneration shall compensate for loss of income and shall only be paid in so far as the previously employed execu-tive is not entitled to severance pay. The remuneration shall be based on the fixed cash salary at the time of termination of employ-ment and be paid during the time the non-compete undertaking applies, however not for more than twelve months following termi-nation of employment.
Salary and Employment Conditions for Employees
In the preparation of the Board of Directors’ proposal for these remuneration principles, salary and employment conditions for employees of the company have been taken into account by includ-ing information on the employees’ total income, the components of the remuneration and increase and growth rate over time, in the remuneration committee’s and the board of directors’ basis of deci-sion when evaluating whether the principles and the limitations set out herein are reasonable. The development of the gap between the remuneration to executives and remuneration to other employees will be disclosed in the remuneration report.
The Decision-Making Process to Determine, Review and Implement the Principles
The Board of Directors has established a Remuneration Committee. The committee’s tasks include preparing the Board of Directors’ decision to propose principles for executive remuneration. The Board of Directors shall prepare a proposal for new principles at
least every fourth year and submit it to the Annual General Meeting. The principles shall be in force until new principles are adopted by the Annual General Meeting. The Remuneration Committee shall also monitor and evaluate programs for variable remuneration for the Executive Management, the application of the principles for execu-tive remuneration as well as the current remuneration structures and compensation levels in the Company. The members of the Remu-neration Committee are independent of the Company and its Execu-tive Management. The CEO and other members of the Executive Management do not participate in the Board of Directors’ process-ing of and resolutions regarding remuneration-related matters in so far as they are affected by such matters.
Derogation From the Principles
The Board of Directors may temporarily resolve to derogate from the principles, in whole or in part, if in a specific case there is special cause for the derogation and a derogation is necessary to serve the company’s long-term interests, including its sustainability, or to ensure the company’s financial viability. As set out above, the Remu-neration Committee’s tasks include preparing the Board of Directors’ resolutions in remuneration-related matters. This includes any reso-lutions to derogate from the principles.
Transitional Provisions Applicable to the Annual General Meeting 2020
Information on previously resolved remuneration that is not yet due for payment is set out in note 6 on pages 67–68 in this annual report.
No deviations from the principles approved by the Annual General Meeting 2019 have been made.

89
Gunnebo Annual Report 2019 / Financial Statements
Auditor’s ReportThis is a translation of the Swedish language original. In the events of any differences between this translation and the Swedish original, the latter shall prevail.
To the general meeting of the shareholders of Gunnebo AB (publ) corporate identity number 556438-2629
Report on the Annual Accounts and Consolidated Accounts
OpinionsWe have audited the annual accounts and consolidated accounts of Gunnebo AB (publ) for the financial year 2019, except for the corporate governance statement on pages 34–40 and the sustainability report on pages 44–51. The annual accounts and consolidated accounts of the company are included on pages 2, 8–11, 30–40 and 44–88 in this document.
In our opinion, the annual accounts have been prepared in accord-ance with the Annual Accounts Act and present fairly, in all material respects, the financial position of the parent company as of 31 December 2019 and its financial performance and cash flow for the year then ended in accordance with the Annual Accounts Act. The consolidated accounts have been prepared in accordance with the Annual Accounts Act and present fairly, in all material respects, the financial position of the group as of 31 December 2019 and their finan-cial performance and cash flow for the year then ended in accordance with International Financial Reporting Standards (IFRS), as adopted by the EU, and the Annual Accounts Act. Our opinions do not include the corporate governance statement on pages 34–40 and the sustainabil-ity report on pages 44–51.
The statutory administration report is consistent with the other parts of the annual accounts and consolidated accounts.
We therefore recommend that the general meeting of shareholders adopts the income statement and balance sheet for the parent com-pany and the group.
Our opinions in this report on the annual accounts and consolidated accounts are consistent with the content of the additional report that has been submitted to the parent company’s audit committee in accordance with the Audit Regulation (537/2014) Article 11.
Basis for opinionsWe conducted our audit in accordance with International Standards on Auditing (ISA) and generally accepted auditing standards in Swe-den. Our responsibilities under those standards are further described in the Auditor’s Responsibilities section. We are independent of the parent company and the group in accordance with professional ethics for accountants in Sweden and have otherwise fulfilled our ethical responsibilities in accordance with these requirements. This includes that, based on the best of our knowledge and belief, no prohibited ser-vices referred to in the Audit Regulation (537/2014) Article 5.1 have been provided to the audited company or, where applicable, its parent company or its controlled companies within the EU.
We believe that the audit evidence we have obtained is sufficient and appropriate to provide a basis for our opinions.
Key audit mattersKey audit matters of the audit are those matters that, in our profes-sional judgment, were of most significance in our audit of the annual accounts and consolidated accounts of the current period. These matters were addressed in the context of our audit of, and in forming our opinion thereon, the annual accounts and consolidated accounts as a whole, but we do not provide a separate opinion on these matters.
Valuation of goodwill Description of riskIn the balance sheet for the group goodwill amounts to MSEK 1 525 as of 31 December 2019. The value of the goodwill is dependent on future earnings in the cash generating entities, to which the goodwill refers and is assessed for impairment at least once a year. The impair-ment test is based on assumptions of future cash flows and complex matters including a high degree of judgment such as assumptions for growth, profitability and cost of capital (WACC). Any changes in these assumptions may result in a need for impairment. Management has not in addition to performed write-down of goodwill (se note 11) identi-fied any additional impairment need for 2019.
We have considered valuation of goodwill as a key audit matter as a result of its significance and sensitivity for changes in assumptions.
For further information, we refer to Note 1 regarding the Group’s accounting principles and Note 11 regarding intangible assets.
Our audit proceduresOur audit procedures included, but were not limited to:• Review and testing of Gunnebo’s procedures for impairment testing
of goodwill and reconciliation of significant assumptions with budget and business plan,
• Testing of management’s assumptions, mainly related to the varia-bles that have the greatest impact on the impairment testing such as growth, profitability and cost of capital (WACC) and performing sen-sitivity analyses for assessment of headroom for each cash generat-ing unit,
• Review of completeness in relevant disclosures to the financial state-ments,
Our valuation specialists have been involved in the audit procedures.
Valuation of deferred tax assets related to tax losses carried forward Description of riskIn the balance sheet for the group, deferred tax assets related to tax losses carried forward amount to MSEK 100 as of 31 December 2019. The value is dependent on to which extent it is probable that future earnings can be utilized against the accumulated tax losses. Incorrect judgments and assumptions may have a material impact on the group’s result and financial position.
We have considered valuation of deferred tax assets a key audit matter since the valuation is mainly based on assumptions and judg-ments.

90
Gunnebo Annual Report 2019 / Financial Statements
For further information, we refer to note 1 regarding the group’s accounting principles and note 10 regarding income taxes.
Our audit proceduresOur audit procedures included, but were not limited to:• Review of Gunnebo’s procedures for calculation of deferred tax
assets related to tax losses carried forward assessment of the rea-sonability of judgments made regarding future earning capacity for applicable entities,
• Review of completeness in relevant disclosures to the financial state-ments.
Other information than the annual accounts and consolidated accountsThis document also contains other information than the annual accounts and consolidated accounts and is found on pages 1, 3–7, 12–29, 41–51 and 92–101. The Board of Directors and the Managing Director are responsible for this other information.
Our opinion on the annual accounts and consolidated accounts does not cover this other information and we do not express any form of assurance conclusion regarding this other information.
In connection with our audit of the annual accounts and consoli-dated accounts, our responsibility is to read the information identified above and consider whether the information is materially inconsistent with the annual accounts and consolidated accounts. In this proce-dure we also take into account our knowledge otherwise obtained in the audit and assess whether the information otherwise appears to be materially misstated.
If we, based on the work performed concerning this information, conclude that there is a material misstatement of this other informa-tion, we are required to report that fact. We have nothing to report in this regard.
Responsibilities of the Board of Directors and the Managing DirectorThe Board of Directors and the Managing Director are responsible for the preparation of the annual accounts and consolidated accounts and that they give a fair presentation in accordance with the Annual Accounts Act and, concerning the consolidated accounts, in accord-ance with IFRS as adopted by the EU. The Board of Directors and the Managing Director are also responsible for such internal control as they determine is necessary to enable the preparation of the annual accounts and consolidated accounts that are free from material mis-statement, whether due to fraud or error.
In preparing the annual accounts and consolidated accounts, the Board of Directors and the Managing Director are responsible for the assessment of the company’s and the group’s ability to continue as a going concern. They disclose, as applicable, matters related to going concern and using the going concern basis of accounting. The going concern basis of accounting is however not applied if the Board of Directors and the Managing Director intend to liquidate the company, to cease operations, or have no realistic alternative but to do so.
The Audit Committee shall, without prejudice to the Board of Direc-tors’ responsibilities and tasks in general, among other things oversee the company’s financial reporting process.
Auditor’s responsibilityOur objectives are to obtain reasonable assurance about whether the annual accounts and consolidated accounts as a whole are free from material misstatement, whether due to fraud or error, and to issue an auditor’s report that includes our opinions. Reasonable assurance is a high level of assurance, but is not a guarantee that an audit conducted in accordance with ISAs and generally accepted auditing standards in Sweden will always detect a material misstatement when it exists. Mis-statements can arise from fraud or error and are considered material if, individually or in the aggregate, they could reasonably be expected to influence the economic decisions of users taken on the basis of these annual accounts and consolidated accounts.
An additional description of our responsibility for the audit of the annual accounts and the consolidated accounts can be found on the Swedish Inspectorate of Auditors homepage:
https://revisorsinspektionen.se/rn/showdocument/documents/rev_dok/revisors_ansvar.pdf. This description is part of this auditor’s report.
Report on Other Legal and Regulatory Requirements Opinions
In addition to our audit of the annual accounts and consolidated accounts, we have also audited the administration of the Board of Directors and the Managing Director of Gunnebo AB (publ) for the financial year 2019 and the proposed appropriations of the company’s profit or loss.
We recommend to the general meeting of shareholders that the profit to be appropriated in accordance with the proposal in the statu-tory administration report and that the members of the Board of Direc-tors and the Managing Director be discharged from liability for the financial year.
Basis for OpinionsWe conducted the audit in accordance with generally accepted audit-ing standards in Sweden. Our responsibilities under those standards are further described in the Auditor’s Responsibilities section. We are independent of the parent company and the group in accordance with professional ethics for accountants in Sweden and have otherwise ful-filled our ethical responsibilities in accordance with these require-ments.
We believe that the audit evidence we have obtained is sufficient and appropriate to provide a basis for our opinions.
Responsibilities of the Board of Directors and the Managing DirectorThe Board of Directors is responsible for the proposal for appropria-tions of the company’s profit or loss. At the proposal of a dividend, this includes an assessment of whether the dividend is justifiable consider-ing the requirements which the company’s and the group’s type of operations, size and risks place on the size of the parent company’s and the group’s equity, consolidation requirements, liquidity and posi-tion in general.

91
The Board of Directors is responsible for the company’s organisa-tion and the administration of the company’s affairs. This includes among other things continuous assessment of the company’s and the group’s financial situation and ensuring that the company’s organisa-tion is designed so that the accounting, management of assets and the company’s financial affairs otherwise are controlled in a reassuring manner. The Managing Director shall manage the ongoing administra-tion according to the Board of Directors’ guidelines and instructions and among other matters take measures that are necessary to fulfill the company’s accounting in accordance with law and handle the management of assets in a reassuring manner.
Auditor’s responsibilityOur objective concerning the audit of the administration, and thereby our opinion about discharge from liability, is to obtain audit evidence to assess with a reasonable degree of assurance whether any member of the Board of Directors or the Managing Director in any material respect:• has undertaken any action or been guilty of any omission which can
give rise to liability to the company, or• in any other way has acted in contravention of the Companies Act,
the Annual Accounts Act or the Articles of Association.Our objective concerning the audit of the proposed appropriations
of the company’s profit or loss, and thereby our opinion about this, is to assess with reasonable degree of assurance whether the proposal is in accordance with the Companies Act.
Reasonable assurance is a high level of assurance, but is not a guarantee that an audit conducted in accordance with generally accepted auditing standards in Sweden will always detect actions or omissions that can give rise to liability to the company, or that the pro-posed appropriations of the company’s profit or loss are not in accord-ance with the Companies Act.
An additional description of our responsibility for the audit of the annual accounts and the consolidated accounts can be found on the Swedish Inspectorate of Auditors homepage: https://revisorsinspek-tionen.se/rn/showdocument/documents/rev_dok/revisors_ansvar.pdf. This description is part of this auditor’s report. Deloitte AB was appointed auditor of Gunnebo AB (publ) by the gen-eral meeting of the shareholders on 11 April 2019 and has been the company’s auditor since 3 April 2008.
The Auditor’s Opinion Regarding the Statutory Sustainability Report
The Board of Directors is responsible for the statutory sustainability report on pages 34–40, and that it is prepared in accordance with the Annual Accounts Act.
Our examination has been conducted in accordance with FAR’s auditing standard RevR 12 The auditor’s opinion regarding the statu-tory sustainability report. This means that our examination of the statu-tory sustainability report is different and substantially less in scope than an audit conducted in accordance with International Standards on Auditing and generally accepted auditing standards in Sweden. We believe that the examination has provided us with sufficient basis for our opinion.
A statutory sustainability report has been prepared.
The Auditor’s Examination of the Corporate Governance Statement
The Board of Directors is responsible for that the corporate govern-ance statement on pages 44–51 has been prepared in accordance with the Annual Accounts Act.
Our examination of the corporate governance statement is con-ducted in accordance with FAR´s auditing standard RevU 16 The audi-tor’s examination of the corporate governance statement. This means that our examination of the corporate governance statement is differ-ent and substantially less in scope than an audit conducted in accord-ance with International Standards on Auditing and generally accepted auditing standards in Sweden. We believe that the examination has provided us with sufficient basis for our opinions.
A corporate governance statement has been prepared. Disclosures in accordance with chapter 6 section 6 the second paragraph points 2–6 of the Annual Accounts Act and chapter 7 section 31 the second paragraph the same law are consistent with the other parts of the annual accounts and consolidated accounts and are in accordance with the Annual Accounts Act.
Gothenburg 19 March 2020Deloitte AB
Signature on Swedish original
Hans WarénAuthorised public accountant

92
Gunnebo Annual Report 2019 / Capital Market
Gunnebo’s objective is to provide the market with easy-to-access, consistent and transparent financial information. All external and internal communication should be fair and appropriate. Relevant information should be made accessible to all stakeholders simultane-ously and at the promised time.
Communication in the form of reporting to various authorities, financial reporting and information for employees takes place in line with external rules and requirements, the Group’s internal governing documents as well as Gunnebo’s Investor Relations and communica-tion policies.
Information Channels
Gunnebo AB’s website, www.gunnebogroup.com, contains publica-tions, financial information, press releases and information about Gunnebo’s organisation. Information about the Group’s offering can be found on www.gunnebo.com.
Information to shareholdersShareholders are asked what information they would like to see from the company and therefore make an active choice in receiving the
required information. The information channels available to share-holders are interim and annual reports, the corporate website www.gunnebogroup.com as well as the Investor Relations function which is always available to answer questions about the Group’s stra-tegic direction, its offering and business performance. Shareholders can also participate at Gunnebo’s Annual General Meeting.
Questions may be sent directly to [email protected] or submitted by telephone on +46 10 209 50 20. It is also possible to order printed annual reports and interim reports from the Group Head Office on +46 10 209 50 20, from the website or via the above e-mail address.
Stock marketGunnebo’s aim is always to be available to respond to questions from the stock market. Questions about the company’s operations are primarily answered by the Group’s President and CEO, the Chief Financial Officer and the Investor Relations Director. There is also detailed information about the Group’s financial results on the Group website, www.gunnebogroup.com, and about its offering on www.gunnebo.com.
Information for the Capital Market Gunnebo strives to give all stakeholders as fair a view as possible of the Group’s business and financial results. The goal is to provide owners and the stock market with information that supports these parties in the process of evaluating Gunnebo’s business.
Invitation to the 2020 Annual General MeetingGunnebo’s Annual General Meeting will be held at 4:00pm CET on Tuesday 21 April 2020 at Elite Park Avenue Hotel in Gothenburg.
RegistrationShareholders who wish to participate in the Annual Gen-eral Meeting must have their names entered in the regis-ter of shareholders maintained by Euroclear Sweden by no later than Wednesday 15 April 2020 and must notify the AGM of attendance by no later than Wednesday 15 April 2020, preferably before 4:00pm CET, either online at www.gunnebogroup.com, by post to Gunnebo AB, Box 5181, SE-402 26 Gothenburg or by phone on +46 10 209 50 20.
Shareholders whose shares are registered in nominee names must, if they wish to exercise their right to vote at the AGM, have their shares re-registered in their own names by Wednesday 15 April 2020.
Analysts Following Gunnebo Erik Penser
Robert Tovi +46 8 463 [email protected]
21 April 2020
Interim Report January–March 2020
21 April 2020
Annual General Meeting 2020
17 July 2020
Interim Report January–June 2020
Financial Information and Reports 2020
4 November 2020
Interim Report January–September 2020
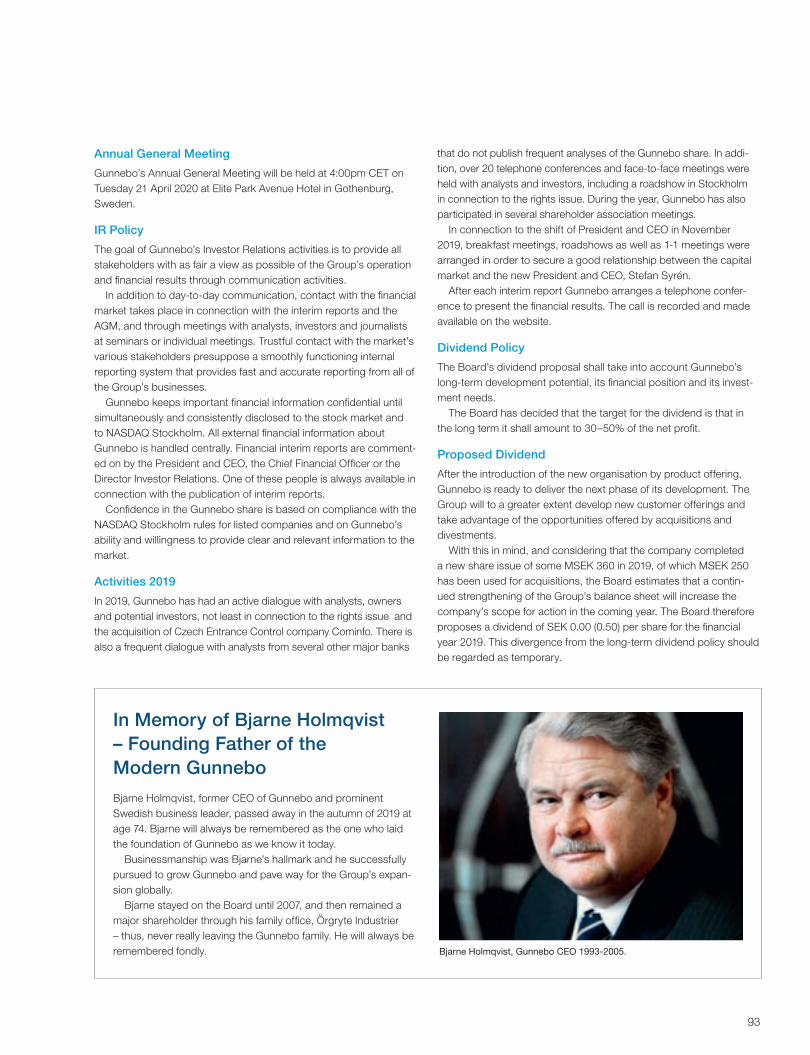
93
Annual General Meeting
Gunnebo’s Annual General Meeting will be held at 4:00pm CET on Tuesday 21 April 2020 at Elite Park Avenue Hotel in Gothenburg, Sweden.
IR Policy
The goal of Gunnebo’s Investor Relations activities is to provide all stakeholders with as fair a view as possible of the Group’s operation and financial results through communication activities.
In addition to day-to-day communication, contact with the financial market takes place in connection with the interim reports and the AGM, and through meetings with analysts, investors and journalists at seminars or individual meetings. Trustful contact with the market’s various stakeholders presuppose a smoothly functioning internal reporting system that provides fast and accurate reporting from all of the Group’s businesses.
Gunnebo keeps important financial information confidential until simultaneously and consistently disclosed to the stock market and to NASDAQ Stockholm. All external financial information about Gunnebo is handled centrally. Financial interim reports are comment-ed on by the President and CEO, the Chief Financial Officer or the Director Investor Relations. One of these people is always available in connection with the publication of interim reports.
Confidence in the Gunnebo share is based on compliance with the NASDAQ Stockholm rules for listed companies and on Gunnebo’s ability and willingness to provide clear and relevant information to the market.
Activities 2019
In 2019, Gunnebo has had an active dialogue with analysts, owners and potential investors, not least in connection to the rights issue and the acquisition of Czech Entrance Control company Cominfo. There is also a frequent dialogue with analysts from several other major banks
that do not publish frequent analyses of the Gunnebo share. In addi-tion, over 20 telephone conferences and face-to-face meetings were held with analysts and investors, including a roadshow in Stockholm in connection to the rights issue. During the year, Gunnebo has also participated in several shareholder association meetings.
In connection to the shift of President and CEO in November 2019, breakfast meetings, roadshows as well as 1-1 meetings were arranged in order to secure a good relationship between the capital market and the new President and CEO, Stefan Syrén.
After each interim report Gunnebo arranges a telephone confer-ence to present the financial results. The call is recorded and made available on the website.
Dividend Policy
The Board’s dividend proposal shall take into account Gunnebo’s long-term development potential, its financial position and its invest-ment needs.
The Board has decided that the target for the dividend is that in the long term it shall amount to 30–50% of the net profit.
Proposed Dividend
After the introduction of the new organisation by product offering, Gunnebo is ready to deliver the next phase of its development. The Group will to a greater extent develop new customer offerings and take advantage of the opportunities offered by acquisitions and divestments.
With this in mind, and considering that the company completed a new share issue of some MSEK 360 in 2019, of which MSEK 250 has been used for acquisitions, the Board estimates that a contin-ued strengthening of the Group’s balance sheet will increase the company’s scope for action in the coming year. The Board therefore proposes a dividend of SEK 0.00 (0.50) per share for the financial year 2019. This divergence from the long-term dividend policy should be regarded as temporary.
In Memory of Bjarne Holmqvist – Founding Father of the Modern Gunnebo
Bjarne Holmqvist, former CEO of Gunnebo and prominent Swedish business leader, passed away in the autumn of 2019 at age 74. Bjarne will always be remembered as the one who laid the foundation of Gunnebo as we know it today.
Businessmanship was Bjarne’s hallmark and he successfully pursued to grow Gunnebo and pave way for the Group’s expan-sion globally.
Bjarne stayed on the Board until 2007, and then remained a major shareholder through his family office, Örgryte Industrier – thus, never really leaving the Gunnebo family. He will always be remembered fondly. Bjarne Holmqvist, Gunnebo CEO 1993-2005.

94
Gunnebo Annual Report 2019 / Capital Market
At the end of 2019 Gunnebo had 10,945 shareholders. The percent-age of foreign ownership amounted to 18.6%. This means that 81.4% of the shares were held by Swedish owners, where 14.2% were held by Swedish natural persons, and 67.2% were held by Swedish legal entities.
Share Capital and Votes
On 31 December 2019, Gunnebo had a share capital of MSEK 481 divided into 96,162,993 shares, of which 602,267 were C-shares, each with a quota value of SEK 5. An ordinary share has one vote and C-shares have 1/10 of one vote. C-shares have no dividend rights.
Read more on page 72, Note 16.
Share Price
At the end of the year the Gunnebo share was trading at SEK 26.60 which is an increase of 19% during the year. During the same period, the Stockholm Stock Exchange OMX 30 Index increased by 26%. The lowest share price paid during the year was SEK 20.55 (6 February) and the highest was SEK 27.69 (20 May).
Trading and Market Value
A total of 23,637,444 shares (16,752,807) were traded in 2019 at a value corresponding to MSEK 568 (459). The average volume traded each trading day was 94,930 shares (67,011), equating to TSEK 2,281 (1,837). The market value on 30 December 2019 was MSEK 2,558.
The Gunnebo ShareThe Gunnebo share has been listed on the Stockholm Stock Exchange since 1993 and can be found on the NASDAQ Stockholm in the Mid Cap segment and the Industrials sector. The abbreviated name is GUNN and the ISIN code is SE0000195570.
The Gunnebo Share 2019
DECJAN FEB MAR APR JUN JUL AUG SEP NOV
20162015 2017 2018 2019
10
20
30
0
30
60
OMX Stockholm_PI
OCTMAY
Source: NASDAQ Share/SEK Trading (no. of shares in thousands)
Source: NASDAQ
0
500
1,000
1,500
2,000
2,500
0
1,000
2,000
3,000
4,000
5,000
6,000
The Gunnebo Share 2015–2019

95
No. of shares 2019 2018 2017 2016 2015
Closing no. of shares, x 1,000 96,163 77,051 77,051 77,051 76,185
Average no. of shares incl. C-shares, x 1,000 82,251 77,051 77,051 76,837 76,180
–3
–6
–9
0
3
15 1716 1918
SEK
Diluted earnings per share
1)15 1716 1918
0.5
1.0
1.5
SEK
Dividend per share
10
20
30
15 1716 1918
SEK
Equity per share
1
0
–1
2
3
15 1716 1918
SEK
Free cash flow per share
Share price related share data 2019 2018 2017 2016 2015
Share price at year-end (last price paid), SEK 26.60 22.40 33.70 38.60 45.00
Highest price during the year (price paid), SEK 27.69 37.10 51.50 45.30 46.10
Lowest price during the year (price paid), SEK 20.55 21.45 30.60 36.80 34.70
Market value at year-end, MSEK 2,558 1,726 2,597 2,974 3,428
P/E ratio, times2) 48 neg. 17 14 21
Dividend yield, %1) 3) n.a. 2.2 3.6 3.1 2.2
1) The Board proposes a dividend of SEK 0.00 per share for the year 2019.2) Listed price on 31 December divided by diluted earnings per share.3) Dividend in relation to listed price on 31 December.
Data per share 2019 2018 2017 2016 2015
Diluted earnings per share, SEK 0.55 –8.94 2.00 2.70 2.18
Equity per share, SEK 15.32 14.22 24.03 24.40 22.65
Free cash flow per share, SEK 2.41 1.62 –0.97 2.09 0.73
Dividend, SEK 0.001) 0.50 1.20 1.20 1.00
1) Board proposal
Largest shareholders, groupedNo. of
shares issuedHolding,
%
Stena Adactum 24,813,832 26.0Vätterledens Invest, with associates 18,722,389 19.5IF Skadeförsäkringar 10,157,080 10.6Brown Brothers/Fidelity Funds 5,255,467 5.5Ålandsbanken (in owner’s place) 2,547,499 2.7Öhman Funds 2,010,952 2.1Unionen 2,000,000 2.1Nordea Funds Småbolag Norden 1,552,700 1.6Avanza Pension 1,185,834 1.2Dimensional Fund International Small Cap 959,616 1.0Other 26,355,357 27.7Total ordinary shares 95,560,726 100.0Gunnebo AB, C-shares 602,267Total shares issued 96,162,993
Changes in share capital Change
Share capital
Total no. of shares
1991 Formation 4 4,0001992 Split 100:1 4 400,0001992 New share issue +96 100 10,000,0001995 New share issue +50 150 15,000,9341995 Conversion +3 153 15,280,7831996 Conversion +10 163 16,275,8191997 New share issue +4 167 16,715,8191997 Conversion +27 194 19,351,1211998 Conversion +4 198 19,813,1501998 New share issue +2 200 19,973,1501999 Conversion 0 200 19,982,3101999 New share issue +6 206 20,625,8812000 Conversion +6 212 21,204,5282001 Conversion 0 212 21,211,1982003 Conversion +7 219 21,889,9742004 Split 2:1 0 219 43,779,9482005 New share issue 0 219 43,854,5482006 New share issue +4 223 44,578,5232007 New share issue +5 228 45,513,3592009 New share issue +151 379 75,855,5982013 New share issue +1 380 75,914,0982014 New share issue +1 381 76,173,5012015 New share issue 0 381 76,185,0012016 New share issue +1 382 76,320,0012016 New share issue C-shares +3 385 77,050,8482019 New share issue +96 481 96,162,993
Shareholders by sizeNo. of
share holdersNo. of out-
standing shares Holding, %
1–500 6,550 1,102,761 1.1501–1,000 1,558 1,218,825 1.31,001–5,000 2,225 4,932,771 5.25,001–10,000 295 2,189,153 2.310,001–50,000 229 4,741,294 5.050,001– 88 81,375,922 85.1Total 10,945 95,560,726 100.0

96
Gunnebo Annual Report 2019
Continuing operationsIncluding discontinued
operations2019 2018 2017 2016 2015 2014 2013
Income statementNet sales 5,459 5,128 4,861 4,892 6,052 5,557 5,271Cost of goods sold –4,064 –3,686 –3,447 –3,462 –4,278 –3,911 –3,689Gross profit 1,395 1,442 1,414 1,430 1,774 1,646 1,582Other operating expenses, net –1,203 –1,177 –1,113 –1,131 –1,454 –1,294 –1,360Operating profit (EBIT) 192 265 301 299 320 352 222Financial income and expenses, net –76 –53 –54 –51 –43 –35 –75Profit before taxes 116 212 247 248 277 317 147Income taxes –71 –92 –95 –92 –109 –90 –45Net profit 45 120 152 156 168 227 102
EBITA / EBITDANet sales 5,459 5,128 4,861 4,892Cost of goods sold excl. IAC –4,026 –3,673 –3,433 –3,447Gross profit excl. IAC 1,433 1,455 1,428 1,445
Selling and administrative expenses excl. IAC –1,118 –1,141 –1,089 –1,104
Other operating income and expenses, net, excl. IAC –32 –20 14 14Add back: Amortisation and impairment of acquisition related intangibles 47 40 22 24Add back: IFRS16 leasing effect –9 — — —
EBITA 321 334 375 379
Add back: Items affecting comparability (IAC) –91 –29 –52 –56Add back: Other amortisation and depreciation 83 73 71 75Add back: Depreciation right of use assets plus IFRS 16leasing effect 120 — — —
EBITDA 433 378 394 398
Key ratios, %Order growth 2 2 –1Sales growth 3 3 –1Gross margin excl. IAC 26.3 28.4 29.4 29.5 29.7 30.2 30.6S&A excl. IAC in % of net sales 20.5 22.3 22.4 22.6 23.1 23.9 25.0EBITDA margin 7.9 7.4 8.1 8.1 7.1 7.9 5.9EBITA margin 5.9 6.5 7.7 7.7EBIT margin 3.5 5.2 6.2 6.1 5.3 6.3 4.2
Return on operating capital employed, MSEK 33.9 35.8 41.5 45.4Return on capital employed, MSEK 10.8 12.4 14.6 15.6
Liquidity informationNet debt incl. post-employment benefits 1,761 1) 1,714 1,407 1,208 1,212 1,039 1,088Net debt 1,350 1) 1,339 1,003 813 850 614 727Net debt incl. post-employment benefits/EBITDA, times 3.9 2) 4.5 3.6 3.0 2.8 2.4 3.5Net debt/EBITDA, times 3.0 2) 3.5 2.5 2.0 2.0 1.4 2.4
EmployeesAverage number of employees 4,226 4,363 4,258 4,481 5,518 5,629 5,656
Seven-Year Review

97
Continuing operations Including discontinued operations
2019 2018 2017 2016 2015 2014 2013
Balance sheetIntangible assets 1,899 1,714 1,910 1,922 1,812 1,675 1,494Right of use assets 243 — — — — — —
Property, plant and equipment 322 282 345 347 358 304 304Deferred tax assets 228 195 322 332 304 339 307Other long-term assets 43 50 17 14 14 16 17Inventories 754 717 902 825 777 785 691Total customer receivables 972 1,018 1,413 1,317 1,150 1,125 1,039Other current assets 309 311 294 312 273 225 173Cash and cash equivalents 744 569 498 581 496 447 392Total assets 5,514 4,856 5,701 5,650 5,184 4,916 4,417
Equity 1,464 1,087 1,866 1,890 1,747 1,694 1,463Financial liabilities 1,842 1,908 1,504 1,403 1,353 1,067 1,126Provision for post-employment benefits 411 375 494 484 362 425 361Lease liabilities 248 — — — — — —
Deferred tax liabilities 59 50 66 90 93 66 64Accounts payable 585 594 742 739 635 660 555Other liabilities 905 842 1,029 1,044 994 1,004 848Total equity and liabilities 5,514 4,856 5,701 5,650 5,184 4,916 4,417
Cash flow statementCash flow from operating activities before changes in working capital 222 155 271 356 305 246 218Cash flow from changes in working capital 162 87 –200 –122 –119 25 –7Cash flow from operating activities 384 242 71 234 186 271 211
Free cash flowFree cash flow 197 124 –74 159 56 223 144
Investments and depreciationCapital expenditure 115 137 150 106 135 78 72Depreciation and amortisation 212 3) 114 117 123 108 88 84
Share data, SEKBasic earnings per share 0.55 –8.95 2.00 2.71 2.18 2.98 1.29Diluted earnings per share 0.55 –8.94 2.00 2.70 2.18 2.98 1.29Equity per share 15.32 14.22 24.03 24.40 22.43 21.93 19.06Free cash flow per share 2.41 1.62 –0.97 2.09 0.73 2.94 1.90Dividend 0.00 4) 0.50 1.20 1.20 1.00 1.00 1.00
1) Net debt includes the effect of IFRS 16 Leases effective from 1 January 2019. Comparative figures have not been restated.2) The proforma rolling 12-month EBITDA has been calculated as an indicative figure for 2019 due to the acquisition of Cominfo in July 2019.3) Depreciation and amortisation include depreciation on right of use assets, i.e. the effect of IFRS 16 Leases adopted from 1 January 2019. Comparative figures have not been restated.4) The Board proposes a dividend of SEK 0.00 per share for the year 2019.
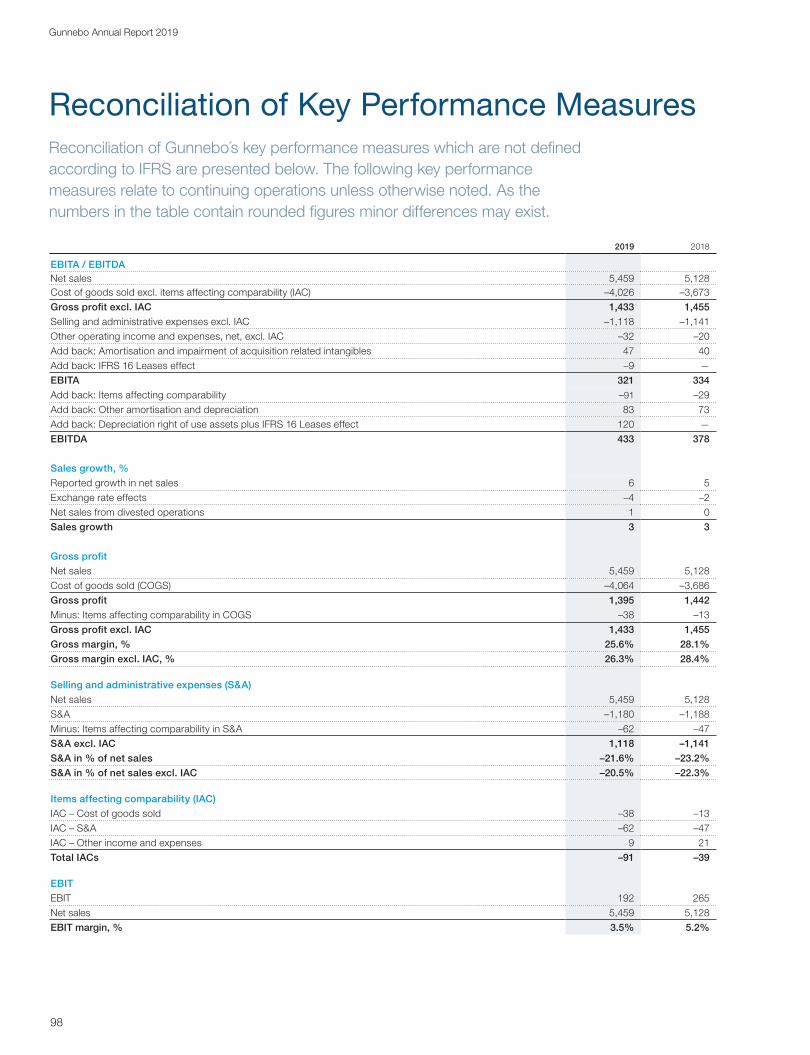
98
Gunnebo Annual Report 2019
Reconciliation of Key Performance MeasuresReconciliation of Gunnebo´s key performance measures which are not defined according to IFRS are presented below. The following key performance measures relate to continuing operations unless otherwise noted. As the numbers in the table contain rounded figures minor differences may exist.
2019 2018
EBITA / EBITDANet sales 5,459 5,128Cost of goods sold excl. items affecting comparability (IAC) –4,026 –3,673Gross profit excl. IAC 1,433 1,455Selling and administrative expenses excl. IAC –1,118 –1,141Other operating income and expenses, net, excl. IAC –32 –20Add back: Amortisation and impairment of acquisition related intangibles 47 40Add back: IFRS 16 Leases effect –9 —
EBITA 321 334Add back: Items affecting comparability –91 –29Add back: Other amortisation and depreciation 83 73Add back: Depreciation right of use assets plus IFRS 16 Leases effect 120 —
EBITDA 433 378
Sales growth, %Reported growth in net sales 6 5Exchange rate effects –4 –2Net sales from divested operations 1 0Sales growth 3 3
Gross profitNet sales 5,459 5,128Cost of goods sold (COGS) –4,064 –3,686Gross profit 1,395 1,442Minus: Items affecting comparability in COGS –38 –13Gross profit excl. IAC 1,433 1,455Gross margin, % 25.6% 28.1%Gross margin excl. IAC, % 26.3% 28.4%
Selling and administrative expenses (S&A)Net sales 5,459 5,128S&A –1,180 –1,188Minus: Items affecting comparability in S&A –62 –47S&A excl. IAC 1,118 –1,141S&A in % of net sales –21.6% –23.2%S&A in % of net sales excl. IAC –20.5% –22.3%
Items affecting comparability (IAC)IAC – Cost of goods sold –38 –13IAC – S&A –62 –47IAC – Other income and expenses 9 21Total IACs –91 –39
EBITEBIT 192 265Net sales 5,459 5,128EBIT margin, % 3.5% 5.2%

99
2019 2018
Operating capital employedSum of PPE, other intangible assets, inventory, customer receivables and other short term assets less accounts payables and other short-term liabilities 1,241 1,198Less: Tax and financial items 21 –1Less: Group functions 4 1Operating capital employed 1,216 1,198Operating capital employed, average 5 quarters 1,278 1,256Sum of Business Unit’s EBITA 433 450Return on operating capital employed, % 33.9% 35.8%
Capital employedOperating capital employed 1,216 1,198Plus: Group functions 4 1Plus: Goodwill 1,525 1,408Plus: Right of use assets 243 —
Capital employed 2,988 2,607Capital employed, average 5 quarters 2,967 2,687EBITA 321 344Return on capital employed, % 10.8% 12.4%
EquityTotal equity 1,464 1,087Less: Equity attributable to non-controlling interests — 0Equity attributable to shareholders of the Parent Company 1,464 1,087Total number of ordinary shares end of period 95,560,726 76,448,581Equity per share, SEK 15.32 14.22
Net debt
Net debt 1,350 1) 1,339Post-employment benefits 411 375
Net debt including post-employment benefits 1,761 1) 1,714
EBITDA 433 378
EBITDA (rolling 12M) 447 2) 378
Net Debt / EBITDA (rolling 12M) 3.0 2) 3.5
Net Debt including post-employment benefits /EBITDA (rolling 12M) 3.9 2) 4.5
Free cash flowNet cash flow after investments, before financing 48 –170Minus: Cash flows from acquisitions/divestments 255 294Add back: Lease liability payments –106 —
Free cash flow 197 124Weighted average number of basic shares before dilution 81,648,491 76,377,724Free cash flow per share, SEK 2.41 1.62
1) Net debt includes the effect of IFRS 16 Leases effective from 1 January 2019. Comparative figures have not been restated.2) The proforma rolling 12-month EBITDA has been calculated as an indicative figure for 2019 due to the acquisition of Cominfo in July 2019.

100
Gunnebo Annual Report 2019
DefinitionsIn the Annual Report, Gunnebo presents certain key performance measures that are not defined according to IFRS. The Group believes that these measures provide investors and the management with valuable supplementary disclosures, since they enable a valuation of the Group’s financial results and position. Since not all companies calculate financials in the same way, they are not always comparable with measures used by other companies. Definitions of Gunnebo key performance measures which are not defined according to IFRS are presented below.
Capital Employed
Operating capital employed plus capital employed from the Group functions, goodwill and right of use assets.
Debt/Equity Ratio
Net debt in relation to equity.
Dividend Yield
Dividend in relation to listed price on 31 December.
EBIT Margin
EBIT as percentage of net sales.
EBITA
EBIT before amortisation and impairment of acquisition related intangible assets, excluding items affecting comparability and effect of IFRS 16 Leases.
EBITA Margin
EBITA as a percentage of net sales.
EBITDA
EBIT before depreciation/amortisation and impairment of intangible assets, right of use assets and property, plant and equipment.
EBITDA Margin
EBITDA as a percentage of net sales.
Equity per Share
Equity attributable to the shareholders of the Parent Company divided by the number of shares excluding C-shares, as these have no dividend rights, at the end of the period.
Equity Ratio
Equity as a percentage of total assets.
Free Cash Flow
Cash flow from operating activities and investing activities excluding cash flows related to acquisitions and divestments, adjusted for finance lease payments.
Free Cash Flow Per Share
Free cash flow divided by weighted average number of shares excluding C-shares as these have no dividend rights.
Gross Margin Excluding IAC
Gross profit excluding IAC, as a percentage of net sales.
Items Affecting Comparability (IAC)
Items affecting comparability are defined as significant items affecting EBIT that are isolated in order to enable a complete understanding of the Group’s financial performance and comparability between periods. Items affecting comparability mainly relate to restructuring activities or structural changes and would include costs for closure of businesses/locations and personnel reductions.
Net Debt
Total liabilities from financing activities less cash and cash equivalents at the end of the period.
Net Debt incl. Post-Employment Benefits (PEB)
Total liabilities from financing activities and provisions for post-employment benefits less cash and cash equivalents at the end of the period.
Net Debt/EBITDA
Net debt divided by EBITDA rolling 12 months.
Net Debt incl. PEB/EBITDA
Net debt including provisions for post-employment benefits divided by EBITDA, rolling 12 months.
Operating Capital Employed
The capital employed that is utilised in the four Business Units. It consists of property, plant and equipment, other intangible assets, inventory, customer receivables and other short-term assets less accounts payables and other short-term liabilities, excluding short term taxes and financial items.
Order Intake Growth
Growth in order intake in constant currencies including organic and acquired order intake, excluding divested order intake.
Reported Growth
The change in reported nominal values, from one period to the next.
P/E Ratio
Listed price on 31 December divided by diluted earnings per share.
Return on Capital Employed
EBITA rolling 12 months as a percentage of average capital employed.
Return on Operating Capital Employed
EBITA rolling 12 months for the four business units, as a percentage of average operating capital employed.
Sales Growth
Growth in net sales in constant currencies including organic and acquired sales, excluding divested sales.

DisclaimerThis report contains future-oriented information. It reflects the management’s current perceptions of certain future events and the possible ensuing results. No guarantees can be given that these perceptions will prove to be correct. Actual future results may vary considerably from the information supplied in this report, partly due to changes in circumstances regarding the economy, market and competition, changed legal requirements and other political measures, variations in exchange rates, business risk assessments and other factors mentioned in this annual report.
Contact DetailsGunnebo AB, Head Office Box 5181SE-402 26 GothenburgVisiting Address: Johan på gårdas gata 7www.gunnebogroup.comTel: +46 10 209 50 20E-mail: [email protected] & CEO: Stefan Syrén
Investor Relations Tel: +46 10 209 50 99 Director, Investor Relations:Isabelle Ljunggren
Business Units
Production: Gunnebo in co-operation with
Newsroom
Printing: BrandFactory
Paper, cover: Tom&Otto Silk 300g
Paper, insert: Tom&Otto Silk 150g
This product can be recycled as paper.
Entrance Control SVP: Robert Hermans Tel: +44 1825 746 120 www.GunneboEntranceControl.com
Safe Storage SVP: Stefan Syrén Tel: +46 10 209 50 20 www.GunneboSafeStorage.com
Cash ManagementSVP: Christian WeisserTel: +46 10 209 50 20www.GunneboCashManagement.com
Integrated SecuritySVP: Stefan SyrénTel: +46 10 209 50 20www.solutions.gunnebo.comwww.gunnebo-gateway.comwww.GunneboIntegratedSecurity.es
101
Gunnebo Around the World Gunnebo has delivery capabilities across the globe. See more information and contacts at www.gunnebogroup.com/About/Locations
OfficesManufacturing Units

Gunneb
o Annual R
eport 2019
The Gunnebo Group operates worldwide providing innovative products,
software and services to control the flow of valuables, cash and people.
Gunnebo offers entrance control, safe storage, cash management and
integrated security solutions to customers primarily within retail, mass
transit, public & commercial buildings, industrial & high-risk sites and
banking. The Group has a turnover of MSEK 5,500 and is listed on
NASDAQ Stockholm.
Gunnebo Annual Report 2019
Innovation. Flow. Control.Annual Report 2019


![Gunnebo Interim Report January-June 2010...Microsoft PowerPoint - Gunnebo-January-June-2010-presentation_publish [Compatibility Mode] Author karmar Created Date 7/15/2010 4:01:23 PM](https://img.pdfslide.us/doc/110x75/5f3a20e11208c42f2d2483af/gunnebo-interim-report-january-june-2010-microsoft-powerpoint-gunnebo-january-june-2010-presentationpublish.jpg)