Embed Size (px)
Citation preview
Gulf of Mexico Salt Tectonics
Evolution of Salt-Sediment SystemsWe have developed an understanding of a number of factors that control the evolution of salt-sediment systems. In the section on salt properties we reviewed the field and laboratory evidence that salt behaves as a fluid over geologic time periods. We also showed through a derivation of the volume rate of flow of salt through a cylinder-within-tube geometry that the salt flow rate is much greater than even the highest rates of sediment deposition in the Gulf of Mexico. These two factors demonstrated that the salt sediment system could be addressed by using the physics of solids immersed in liquids under the influence of gravitational force. In the section on mathematical modeling we demonstrated for a geometry similar to the cylinder-within-tube (used for salt flow calculations) how a growing and compacting, vertical-sided solid body immersed in a fluid would behave as it increased in size. We then modified that mathematical model by making it more analogous to the situation found in the real world. This involved adding a continuous solid covering the fluid (via a thick growing body and a thin one), and making the growing body spherical rather than cylindrical. We were then able to vary parameters such as the relative size of the bodies and the container, the original depth of the fluid and the thickness of the thin body to model how the system would evolve over time. We then assumed that the model was a realistic analogue for the salt-sediment system, since the physical properties and geometry were similar, and inferred a number of geologic implications from what we knew of the behavior of the mathematical system, and of the known behavior of salt and sediment in the Gulf of Mexico. At this point we want to put all of this together and build an illustration of how salt and sediment have evolved from Louann time to the present, focusing on one depocenter and its surrounding salt.
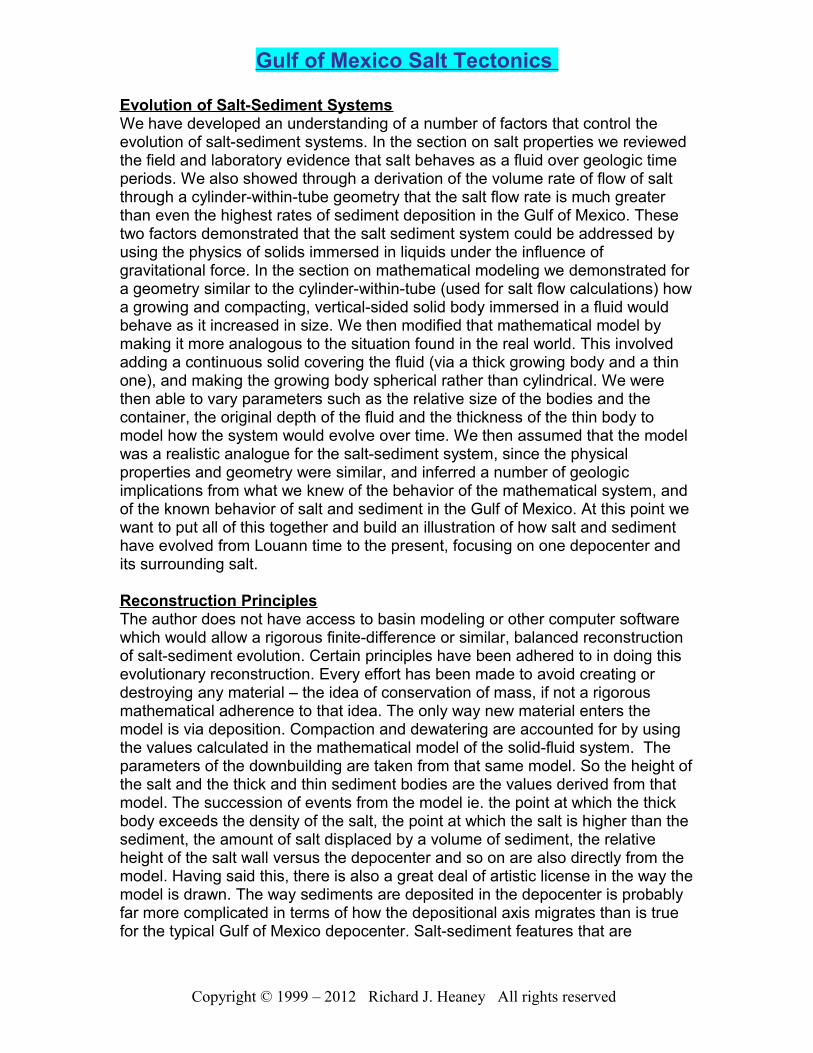
Reconstruction PrinciplesThe author does not have access to basin modeling or other computer software which would allow a rigorous finite-difference or similar, balanced reconstruction of salt-sediment evolution. Certain principles have been adhered to in doing this evolutionary reconstruction. Every effort has been made to avoid creating or destroying any material – the idea of conservation of mass, if not a rigorous mathematical adherence to that idea. The only way new material enters the model is via deposition. Compaction and dewatering are accounted for by using the values calculated in the mathematical model of the solid-fluid system. The parameters of the downbuilding are taken from that same model. So the height of the salt and the thick and thin sediment bodies are the values derived from that model. The succession of events from the model ie. the point at which the thick body exceeds the density of the salt, the point at which the salt is higher than the sediment, the amount of salt displaced by a volume of sediment, the relative height of the salt wall versus the depocenter and so on are also directly from the model. Having said this, there is also a great deal of artistic license in the way the model is drawn. The way sediments are deposited in the depocenter is probably far more complicated in terms of how the depositional axis migrates than is true for the typical Gulf of Mexico depocenter. Salt-sediment features that are
Copyright © 1999 – 2012 Richard J. Heaney All rights reserved

Gulf of Mexico Salt Tectonics
observed on Gulf of Mexico seismic lines were introduced for esthetic reasons. From the standpoint of modeling, the only thing that is important in terms of deposition is the volume of sediment and the area of the depocenter. How the sediment appears is irrelevant, but it should be somewhat realistic. Another principle that was used was that more salt is removed below the thicker deposition and less below the thinner deposition at each stage, since this is required for a fluid-solid system.The three phases of evolution defined in the section on Geologic Inferrences were used in the illustration. So, the first, basinal, phase has the depocenter growing and deepening and floating on top of the salt. When the salt first becomes higher than the sediment, it encroaches over the depocenter but not to any great extent. As the depocenter grounds out, the adjacent depocenter collides with it, greatly accelerating the rate at which the salt moves laterally over the depocenter. There is a fourth stage when the salt sutures over the depocenter, but we have not called it the fourth stage, because it represents the beginning of a new first stage in the allochthonous salt over the top of the original depocenter. The three phases then repeat with some significant differences that will be discussed in detail.In summary, we have referred to this salt-sediment evolutionary sequence as an illustration or a visualization because it is by no means a rigorous, 3-dimensional reconstruction. It is realistic, in that the parameters and progression of the model are based on the rigorous mathematical model of a fluid-solid system which is very similar, although much simpler, than the visualization. From the standpoint of structural geology, the salt-sediment system is actually quite boring (aside from its scale which is truly awe-inspiring). As we saw from the mathematical model, nothing much happens. The thick body gets thicker, descends into the fluid, all the while staying within a few hundred feet above and below the top of the fluid. The most spectacular thing that could happen would be if the fluid flooded over the top of the thick body, but as we showed in the section on Geologic Implications, in the real world this doesn’t appear to happen. The whole system appears to be a very stable, and slowly evolving one, in which nothing much of note happens until the end of the evolution when the depocenters collide. The only force operating is gravity. The are no other stresses to cause complicated things like folds or faults, save for the overall flow of the salt, which tends to move things toward the abyss and pile things up in interesting ways. So, since not much is going on, it is actually not that difficult to imagine how the system evolves. The proof of any reconstruction exercise, of course, is whether it has predictive ability. In this case, we would like to start at the end of Louann deposition with a plain of salt of varying thickness, and through the visualization show how we got to what we see in the Gulf of Mexico today. To that extent, the visualization seems quite useful. The cross-section across the visualization at the end compares very favorably with seismic lines across certain parts of the Green Canyon protraction area, as we will show. This is no accident. The author’s experience in interpreting seismic data in the Gulf of Mexico for over 15 years of necessity guided the reconstruction. However, the point should be made that the
Copyright © 1999 – 2012 Richard J. Heaney All rights reserved

Gulf of Mexico Salt Tectonics
reconstruction arrives at the final picture without having to invoke anything other than the principles of fluid-solid interaction and so on that are described on this website. There was no point along the way where some aspect of the reconstruction required some new factor which hadn’t already been determined. There were some surprises along the way, which provided some predictions about what we should find in wells in certain locations. However, these were not major features of the model. In general, by simply downbuilding sediments into salt in the way described in the modeling, the whole system evolves in a very easy and predictable way. Hopefully this evolutionary visualization will be of use to interpreters in their work. It does explain many of the features that are observed in the salt-sediment system in the Gulf of Mexico. Most importantly, it suggests where hydrocarbon traps will form and what they will look like. In areas where data quality has still not reached a level where interpretation is definitive, it is hoped that the evolutionary model will provide hints as to what the geology is doing in the hidden areas. And certain concepts, such as the depocenters which float for most of their evolution, should be useful in many aspects of geologic analysis. For instance, the concept of “fill and spill” which has been invoked for years to describe deposition of turbidites in the Gulf of Mexico may not be compatible with a system in which depocenters are floating near the top of the salt.
Visualization ConstructionIn setting up this visualization it was important to incorporate as many of the concepts developed here into the model as possible. The large-scale vision of overall salt flow with a blanket of continuous sediment is a 3-D effect, but it was beyond the capability of the author to do a 3-D reconstruction. Instead, the 3-D nature of the system was captured in part by using a map and a cross-section in concert to show the evolution, as shown in Figure SSE-1. The evolution of the depocenter is best shown on the cross-section, and the movement of salt in response to deposition can be seen clearly on the map. So between the two figures, a good idea of the 3-D geometry can be obtained. Adjacent depocenters are included on the map to indicate more of the geometry of the system and how it changes. The movement of the salt is indicated on the map, where warm colors show areas of salt withdrawal, and cool colors show areas of salt inflation. The evolution of the map gives an idea of how the salt walls develop around the depocenter and are then collapsed and moved to the allochthonous level. The map also shows how the allochthonous depocenters develop once the lower depocenter is closed off and isolated from further deposition. It is not a perfect 3-D view by any stretch, but it is better than just a cross-section alone which would give no feel for how the system appears in reality.Sedimentation is assumed to occur most heavily along the axis of the depocenter from the sediment entry point to the sediment exit. This is based on 3D visualization of the top salt within an area of the Green Canyon protraction area, based on depth seismic data. This visualization, which is not shown for reasons of confidentiality, shows clearly that salt encroaches mostly from the areas where
Copyright © 1999 – 2012 Richard J. Heaney All rights reserved

Gulf of Mexico Salt Tectonics
there is a transition from one depocenter to the next. This was used in the visualization. The concept of colliding depocenters, which is critical to forming
Figure SSE-1: Salt-sediment visualization setup – cross-section A – A’ and map of salt thickness
allochthonous salt bodies was also included in the visualization at the point where the depocenter is largely grounded out.
Evolutionary CasesThe most important factor affecting the salt-sediment evolution is the amount of original salt at the autochthonous level. The full three phases of evolution of the salt-sediment system described here do not occur when there is insufficient available salt. This generally occurs around the margins of the Gulf of Mexico basin, near the Cretaceous shelf margin. There are 3 evolutionary cases – for very-thin salt, moderate-thickness salt, and thick salt. In the very-thin and moderate-thickness cases, the depocenters ground out early, because of the lack of underlying salt. As a result, the salt is trapped by sediment and can no longer inflate. The top of the salt is above the sediment only very late in the evolution, if at all, and thus there is little encroachment of salt over the depocenters. There can be inflation of the salt due to collision, but it doesn’t progress to the point of salt canopy formation, so the salt and sediment cease to interact at an early point. In the very-thin salt case, it is very common for the salt to be trapped in a low-relief, early salt wall, with subdued salt-withdrawal depocenters surrounding it. The thinned sediment deposited on the salt wall
Copyright © 1999 – 2012 Richard J. Heaney All rights reserved
Gulf of Mexico Salt Tectonics
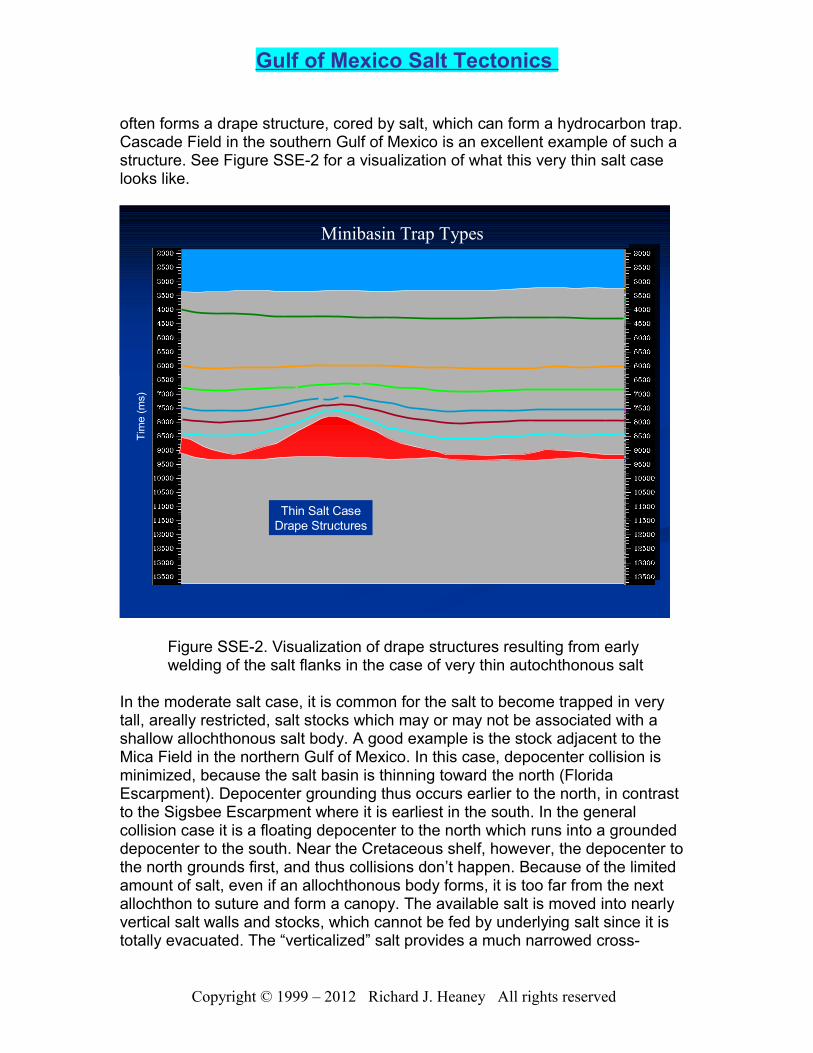
often forms a drape structure, cored by salt, which can form a hydrocarbon trap. Cascade Field in the southern Gulf of Mexico is an excellent example of such a structure. See Figure SSE-2 for a visualization of what this very thin salt case looks like.
Tim
e (m
s)
Minibasin Trap Types
Thin Salt CaseDrape Structures
Figure SSE-2. Visualization of drape structures resulting from early welding of the salt flanks in the case of very thin autochthonous salt
In the moderate salt case, it is common for the salt to become trapped in very tall, areally restricted, salt stocks which may or may not be associated with a shallow allochthonous salt body. A good example is the stock adjacent to the Mica Field in the northern Gulf of Mexico. In this case, depocenter collision is minimized, because the salt basin is thinning toward the north (Florida Escarpment). Depocenter grounding thus occurs earlier to the north, in contrast to the Sigsbee Escarpment where it is earliest in the south. In the general collision case it is a floating depocenter to the north which runs into a grounded depocenter to the south. Near the Cretaceous shelf, however, the depocenter to the north grounds first, and thus collisions don’t happen. Because of the limited amount of salt, even if an allochthonous body forms, it is too far from the next allochthon to suture and form a canopy. The available salt is moved into nearly vertical salt walls and stocks, which cannot be fed by underlying salt since it is totally evacuated. The “verticalized” salt provides a much narrowed cross-
Copyright © 1999 – 2012 Richard J. Heaney All rights reserved

Gulf of Mexico Salt Tectonics
section, compared to the autochthonous salt. Thus, accommodation space available to sediment deposition is minimized. The deposition thus tends to become much more what would be expected for a passive margin without salt influence. A visualization of this case is shown in Figure SSE-3.The thick-salt case is the most interesting. It will be described in eleven stages which take the system from the end of salt deposition to the present day in an area where there is sufficient salt to begin forming a secondary canopy. At each stage the cross-section and map will be shown, along with a commentary describing the main events that take place at that stage. The thin-salt cases will be shown at the stage where they branch off from the thick-salt case.
Dep
th (F
t)
Minibasin Trap Types
Moderate Salt CaseIsolated Stock Structures
Figure SSE-3 Visualization of the isolated stocks which are formed in the case where autochthonous salt supply is moderate
Moving first to the thick autochthonous salt case:
Copyright © 1999 – 2012 Richard J. Heaney All rights reserved

Gulf of Mexico Salt Tectonics
Stage 1
Figure SSE – 4: Illustration in cross-sectional and map view of Stage 1 of the thick-salt case of salt-sediment evolution.
The visualization at his point assumes a thick, autochthonous Louann salt with a flat top (virtually a plain of salt) overlying a horst-and-graben system. The deposition in the Late Jurassic is first established as a relatively uniform Norphlet dune field of aeolian sandstones, succeeded by mixed clastics and carbonates. A channelized-lobe turbidite facies is illustrated here, but the actual nature of the depositional system is not precisely known. Based on observations of seismic data, the system appears to be quite narrowly focused, perhaps in the form of “rolling monoclines” which push the salt out in front and to the sides as they move into the Gulf of Mexico. The critical point here is that the deposition is not uniform – it is thicker and thinner in places. The salt begins to move out from under the depositional thicks and towards the depositional thins as soon as uneven deposition occurs.
Copyright © 1999 – 2012 Richard J. Heaney All rights reserved

Gulf of Mexico Salt Tectonics
Figure SSE – 5: Illustration in cross-sectional and map view of Stage 2 of the thick-salt case of salt-sediment evolution.
At this stage the depocenter, salt walls and carapace are well formed. The feedback between the higher deposition in the depocenter creating a deeper depocenter, which in turn captures more sediment, is well established. The first depositional axis migration occurs as the axes at this stage are offset from the axis of the original deposition. The inflation of the salt walls creates extension in the overlying sediments, creating normal-fault, collapse features. Salt continues to deflate under the depocenter and inflate in the salt walls.
We will divert at this point to the second stage of the thin-salt case, which follows directly from stage 1 (Figure SSE – 5). This is exactly the same as the thick-salt case, with the exception that the depocenter is already close to grounding out
Copyright © 1999 – 2012 Richard J. Heaney All rights reserved

Gulf of Mexico Salt Tectonics
Figure SSE – 6: Illustration in cross-sectional view of Stage 2 of the thin-salt case of salt-sediment evolution.
Copyright © 1999 – 2012 Richard J. Heaney All rights reserved

Gulf of Mexico Salt Tectonics
Figure SSE – 7: Illustration in cross-sectional view of Stage 3 of the thin-salt case of salt-sediment evolution.
In the next stage of this thin-salt case (Figure SSE – 7) the depocenter is entirely grounded out and the salt walls are isolated from any salt supply. The carapace sediment in this case is a significant proportion of the sediment in the depocenter, since the evolution of the depocenter is in its early stages. Thus, there is a sediment section draped over the salt walls which is thick enough to form a hydrocarbon trap, possibly in a four-way closed structure. At this stage the salt-sediment system stops evolving. Sediment deposited after this stage will become increasingly uniform, until the presence of the underlying salt walls becomes very hard to discern from the sediment patterns.This case is visualized in Figure SSE-2This completes the case for a very thin initial salt. We will now return to the evolution of the thick salt case.
Copyright © 1999 – 2012 Richard J. Heaney All rights reserved

Gulf of Mexico Salt Tectonics
Figure SSE – 8: Illustration in cross-sectional and map view of Stage 3 of the thick-salt case of salt-sediment evolution.
At this stage the depocenters are well developed, the salt walls are very inflated, and parts of the depocenters are close to grounding out. The salt is still below the top of the depocenter, which is still floating on the salt. Salt continues to move out from under the depocenter and into the salt walls. The salt walls are thickest in the areas where two or more depocenters are actively withdrawing salt. The carapace sediment continues to thin due to extension and shedding into the depocenters. The sides of the salt walls may be near-vertical, but the salt is still completely confined by the sediment and is not moving out over the depocenters.This is the last stage in the first phase of the evolution of the system – the basinal phase. This is the last stage where the sediment is floating on top of the salt, and is everywhere above the salt.
Copyright © 1999 – 2012 Richard J. Heaney All rights reserved

Gulf of Mexico Salt Tectonics
Figure SSE – 9: Illustration in cross-sectional and map view of Stage 4 of the thick-salt case of salt-sediment evolution.
At this stage, the depocenter is starting to ground out over a significant area. The salt has now moved above the top of the depocenter for the first time. Salt may break through the sediment on top of the salt walls, since it is now more buoyant than the sediment. This results in incorporation of sediment blocks into the salt walls, as well as continued shedding of sediment into the depocenter. The blocks incorporated into the salt can include sediment of any age from stage 1 to the present stage. Because the salt tends to wick away geothermal heat, the organic material in the incorporated blocks will tend to remain immature, forming tar rather than petroleum or gas. Since the blocks are sealed off by the surrounding salt, they will also retain their state of compaction and dewatering at the point when they were surrounded. Their inability to further dewater can result in highly overpressured sediments if the blocks are carried to greater depths. Obviously, the combination of tarry, overpressured sediments can produce a drilling hazard which should be avoided in drilling through the salt. At this stage, the salt begins to encroach over the surrounding depocenters.
We will now digress to examine the second of the thinner salt cases.
Copyright © 1999 – 2012 Richard J. Heaney All rights reserved

Gulf of Mexico Salt Tectonics
Figure SSE – 10: Illustration in cross-sectional view of Stage 5 of the thin-salt case of salt-sediment evolution.
This is the same situation as stage 4 of the thick-salt case, with the exception that the grounding of the depocenter is much more advanced, due to the limited amount of underlying salt. The rotation of the depocenter around the point where it first touched down results in inversion of the depocenter thicks, forming turtle structures. The salt walls are mature enough to be moving over the depocenters. However, the salt supply at the autochthonous level is nearly exhausted. As noted above, the salt supply is diminishing to the north, in the “upflow” direction, so that there is a reduced chance of depocenter collision which would collapse the salt walls and inflate the allochthonous salt.
Copyright © 1999 – 2012 Richard J. Heaney All rights reserved

Gulf of Mexico Salt Tectonics
Figure SSE – 11: Illustration in cross-sectional view of Stage 6 of the thin-salt case of salt-sediment evolution.
Here the final pockets of autochthonous salt underlying the depocenters have been removed and the depocenters are completely grounded out. The small amount of collision has ended as the whole local system is locked down. Accomodation space at the autochthonous level is eliminated, so sediment deposition becomes more uniform across the depocenters. The salt walls will tend to stay locked into their mostly vertical, stock form, aside from some additional minor withdrawal at the allochthonous level. In most cases there is insufficient salt in the allochthonous bodies to move across the depocenters and form a canopy. The moderate salt case is visualized in Figure SSE-3.
Copyright © 1999 – 2012 Richard J. Heaney All rights reserved

Gulf of Mexico Salt Tectonics
We now return to the thick-salt case at stage 5.
Figure SSE – 12: Illustration in cross-sectional and map view of Stage 5 of the thick-salt case of salt-sediment evolution.
At this point the depocenters are grounded to a large extent and adjacent depocenters are starting to interact. Collisions between depocenters start to evacuate salt from the vertical salt walls and inflate the allochthonous salt moving over the depocenters. Rotation of the depocenters towards the edges inverts the depositional thicks, resulting in formation of turtles in the interior of the depocenters. At the edges, the continuing subsidence of the depocenter greatly steepens and even overturns sediments deposited in the early development of the depocenter on much more flat-lying salt. The salt walls are being evacuated along their extended, less inflated portions and inflating in the more vertical portions. This is illustrated in Figure SSE – 12, which is a cross-section along the profile C – C’ shown on the map above.
Copyright © 1999 – 2012 Richard J. Heaney All rights reserved

Gulf of Mexico Salt Tectonics
Figure SSE – 13: Illustration in cross-sectional view along profile C-C’ (see Figure SSE – 12 for profile location).
This profile runs along the strike of the salt walls surrounding the depocenter and shows details of how the salt is being evacuated. Most of the salt wall is being collapsed in response to both deposition in the depocenter, and collision with surrounding depocenters as the depocenters start to ground out. The collapsing walls move salt into the highest parts of the salt where surrounding deposition is heaviest (due to the presence of two or more depocenters). These stock-like portions of the system move salt out over the surrounding depocenters. See Figure SSE – 2 for an illustration of what this looks like in the real-world case. The system thus consists of mostly thinning salt walls and a few focused areas (“feeders”) where salt is being moved up to the allochthonous level. Note that the collapse of most of the salt wall results in a collapse zone in the overlying sediments, which likely forms a seabed low into which the salt moves preferentially. The spreading salt moves into the lows in the lows of the depocenters, as well as into the sediment collapse trough. This is shown in the next figure.
Copyright © 1999 – 2012 Richard J. Heaney All rights reserved

Gulf of Mexico Salt Tectonics
Figure SSE – 14: Illustration in cross-sectional view along profile B-B’ (see Figure SSE – 12 for profile location).
This profile shows details of the salt movement. In this case, the salt at the autochthonous level is moving toward the “feeder” along the salt wall. At the same time, salt from the feeder at the allochthonous level is moving above the salt wall into the sediment low formed by the salt wall collapse. A 3-D rendering of how this evolves is shown in the next illustration. Note that there is no direct connection between the autochthonous and allochthonous salt at the location of the profile. The connection is through the “feeder” along strike.
Copyright © 1999 – 2012 Richard J. Heaney All rights reserved

Gulf of Mexico Salt Tectonics
Salt Wall EvolutionSalt Wall Evolution
Figure SSE – 15: Illustration in 3-D of the evolution of a salt wall
In the lowest drawing, the depocenter is just forming, and the salt wall is inflating all the way around the depocenter in the form of a wall. The highest point on the salt wall is located where deposition is thinnest. Withdrawal of salt from the wall is greatest where sedimentation is the greatest. Once a high forms along the wall, it receives less sedimentation and inflates further, receiving salt from the deflating wall in higher sedimentation areas. Once the salt is higher than the depocenter, it moves out over the depocenter and along the underlying salt wall. The overall evolution results in collapse of the salt wall in general, with large-scale inflation of a few points along the wall which are known as “feeders”.
We will now continue with the evolution of the depocenter for the thick-salt case.
Copyright © 1999 – 2012 Richard J. Heaney All rights reserved

Gulf of Mexico Salt Tectonics
Figure SSE – 16: Illustration in cross-sectional and map view of Stage 6 of the thick-salt case of salt-sediment evolution.
The depocenter at this point is essentially grounded. Interaction between the depocenters continues to evacuate salt from the “feeders” and inflate the allochthonous salt bodies. The allochthonous salt is starting to suture in areas, forming a canopy. The encroaching salt forms traps where the sediments are cut off on the sides of the depocenter. Except in the vicinity of the “feeders” the salt walls have been thinned and beaten down to the point that the wall is becoming more of a weld. Note that the spreading of the allochthonous salt is in all directions from the “feeders” into the local depocenter lows.
Copyright © 1999 – 2012 Richard J. Heaney All rights reserved

Gulf of Mexico Salt Tectonics
Figure SSE – 17: Illustration in cross-sectional and map view of Stage 7 of the thick-salt case of salt-sediment evolution.
At this stage the allochthonous salt has sutured over the autochthonous depocenter and the deposition system has moved on top of the allochthonous salt. A new depocenter forms on the salt canopy. Adjacent depocenters which are not grounded continue to evacuate the salt from the “feeders” and inflate the allochthonous salt. At this point, evacuation of the salt from the “feeders” by downbuilding in the new depocenter starts a new cycle of inflation/deflation in response to sedimentation. The last phase of evolution has ended for the lower depocenter, and the young depocenter is in phase one with the sediment floating on the salt in a basinal geometry.
Copyright © 1999 – 2012 Richard J. Heaney All rights reserved

Gulf of Mexico Salt Tectonics
Figure SSE – 18: Illustration in cross-sectional and map view of Stage 7 of the thick-salt case of salt-sediment evolution.
At this point, new salt walls and depocenters are well established at the allochthonous level, and the evolution continues in phase one at the younger level. At the older level, the last gasp of interaction between the depocenters evacuates the last bits of salt from the vertical stocks and creates a weld which represents the boundary between the depocenters. The weld probably retains a remnant of salt and can act as a lateral seal for hydrocarbon traps. Evolution of the salt-sediment system at the autochthonous level is now at an end.
Copyright © 1999 – 2012 Richard J. Heaney All rights reserved

Gulf of Mexico Salt Tectonics
Figure SSE – 19: Illustration in cross-sectional view of Stage 9 of the thick-salt case of salt-sediment evolution.
At this stage, the allochthonous depocenters are deepening and rapidly evacuating salt from the autochthonous “feeders” into new salt walls. The sediment is still floating on the salt and is everywhere above the salt. This phase one of the evolution is similar to the older sequence, with the important exception that the underlying geology is much more complex. Instead of an underlying “plane of salt” with a more or less uniform thickness (at least locally), the system rests on a very uneven and complicated substrate, which exhibits tremendous variation in salt thickness. The vast majority of the accomodation space provided by the salt is concentrated in the underlying autochthonous “feeders”. Thus, the depocenters will evolve to fill in and collapse the “feeders”, since the sediment always moves to take advantage of the available accomodation space. The fact that the underlying topography is much more basin shaped than was true of the lower system makes it very difficult for the depocenters to invert. Thus, it is very rare to form turtle structures at the allochthonous level. We have not included a map with this cross-section. Refer to earlier illustrations for insight into what is happening areally.
Copyright © 1999 – 2012 Richard J. Heaney All rights reserved

Gulf of Mexico Salt Tectonics
Figure SSE – 20: Illustration in cross-sectional view of Stage 10 of the thick-salt case of salt-sediment evolution.
At this stage the salt has moved above the sediment in the depocenters, and has entered the second encroachment phase. Salt wall evolution has produced a second set of “feeders” which are moving salt from the first allochthonous level to a secondary allochthonous level. The depocenters are starting to ground out, but because the underlying surface is so uneven, there is not a lot of interaction between the depocenters. Inflation of the allochthonous salt in this case is due to gravity driven evacuation of the autochthouous level “feeders”, rather than salt “pumping” driven by depocenter collision. Because of the more vertical geometry, the first set of feeders can be efficiently evacuated, whereas this was not the case at the autochthonous level. In that case, evacuation of the salt to the allochthonous level required a horizontal force, since by the time the “feeders” were developed, the salt was above the sediment. Some aspects of the allochthonous system are the same as the older system ie. encroachment, relative densities, evolution of the salt walls. But it is also quite different in important ways. Thus there is a further evolution in the salt-sediment system which creates quite a different set of structures at the younger levels.
Copyright © 1999 – 2012 Richard J. Heaney All rights reserved

Gulf of Mexico Salt Tectonics
Figure SSE – 21: Illustration in cross-sectional view of Stage 11 of the thick-salt case of salt-sediment evolution.
At this point the depocenters are grounded over large areas. At the allochthonous level, the salt stocks are nearly sutured. If there is enough salt and evacuation of the underlying salt is efficient enough, a secondary canopy can form. The autochthonous “feeders” have been collapsed, creating interesting juxtapositions of older and younger sediment across the welded bottoms of the younger depocenters. In many cases, this results in Cretaceous age sediment ending up against Pliocene or younger sediment. There is no faulting involved in this – it is simply the result of what was deposited at the top versus the bottom of the autochthonous “feeder”. The collapse of the “feeders” potentially breaches underlying hydrocarbon traps, since what was sealed by salt ends up against a weld instead. However, there is at least one example in the Gulf of Mexico where a trap formed by Paleogene aged section truncating against a Plio-Pleistocene depocenter across a weld has been proven to be effective. If you would like to view a movie of the complete evolutionary sequence, click Here.
This completes the visualization of salt-sediment evolution in the Gulf of Mexico. It is a complicated picture, especially at the younger levels, but it was created using a few simple principles. As for how well it predicts the actual evolution of the salt-sediment system, the author offers the following profile from the Green Canyon protraction area for comparison. Those with access to deepwater Gulf of Mexico seismic data have undoubtedly seen profiles which show similar
Copyright © 1999 – 2012 Richard J. Heaney All rights reserved

Gulf of Mexico Salt Tectonics
structures. Most or all of the elements predicted in the visualization exercise can be seen in the real-world example. Thus the visualization seems to offer at least one credible way in which salt and sediment have interacted to form the structures seen in the present-day Gulf of Mexico.
Minibasin Trap Types
Figure SSE-23. Visualization taken from various GOM seismic lines showing salt-sediment evolution which closely resembles stage 11 of the evolutionary geologic model described above.
Summary:A geologic model based on a mathematical fluid-solid model has been developed for the evolution of depocenters, allochthonous salt bodies, salt stocks and salt canopies in the Gulf of Mexico. The geologic model honors the values for such factors as the topographic relief between the salt walls and depocenters, the amount of salt evacuated for a particular volume of sediment, the point at which the average sediment density equals salt density, and so on, that were derived from the mathematical model. Thus, the geologic model, although not a balanced reconstruction, is at least in accord with the demonstrated physics of the interaction of a system with very similar physical properties and forces. The result of applying the principles deduced from the fluid-solid mathematical analogue, including depocenter density retardation, the neutral buoyancy of the depocenters, the 3 phases of depocenter evolution etc., is a geologic model
Copyright © 1999 – 2012 Richard J. Heaney All rights reserved

Gulf of Mexico Salt Tectonics
which easily and naturally reproduces the types of salt and sediment structures which can be observed in the Gulf of Mexico today. Further, it shows at a number of stages along the system evolution how the structures came to be. Hopefully this model will give interpreters an insight into how salt in a particular area has moved in response to sedimentation. Recreating the movement of salt is critical to understanding how depocenters have developed, which in turn can give insights into such factors as heat flow, hydrocarbon migration, sedimentation patterns and timing of structures. Although seismic data, and the picture they give us of the subsurface in the Gulf of Mexico, are always improving, there are still areas where the subsalt data is obscure. In those areas determining if and where traps might be hiding is a matter of applying a model. Hopefully the geologic model presented here will be useful in that context. (For a brief tutorial on the effects of salt on seismic data click Here. Perhaps one of the commonest misconceptions about salt-sediment interactions in the Gulf of Mexico is that most of the salt at one point was buried under thick sediments and due to some stimulus, such as a fault, forced its way through the overlying sediments into the salt stocks and canopies that are now present in the basin. This process is known as diapirism, and is the source of the great bulk of the terminology that is applied to salt-sediment systems. The geologic principle deduced from the fluid-solid mathematical model ie. that the fluid moves immediately upon the introduction of an unbalanced solid load, strongly indicates that the salt being buried is highly unlikely. The geologic model clearly shows that the salt starts out at the sea floor and stays very near to the sea floor throughout the evolution of the system. (The author urges interpreters to note that although parts of allochthonous salt bodies are buried under considerable sediment, at least some part of every one of them is very close to the seafloor). Further, the sediment depocenters are floating on top of the salt for the vast majority of their evolution, so that it would be virtually impossible for salt to force its way through the sediments. If the salt did for some reason decide to move upwards after a long delay, presumably the floating depocenters would merely be carried up with the salt. There would be no mechanism for the salt to force its way through the sediments. The idea of the salt buoyantly pushing up through the sediments is based on the mistaken idea that the sediments are considerably denser than the salt. As we have shown, on average this is not true. Even when the average density is greater than the salt, it is by only .1 or .2 g/cc, which would produce a very weak buoyant force, certainly insufficient for the salt to force its way through much stronger sediments.The main mechanism of the salt-sediment interaction in the Gulf of Mexico is unbalanced sediment loads being applied to the salt and the salt immediately (in geologic terms) getting out of the way. As the geologic evolutionary model shows, this mechanism, along with the idea of the colliding of floating and grounded depocenters, is sufficient to create any structure seen in the present-day Gulf of Mexico. There is no need to invoke any further complications, especially ones that are not based on sound physical principles. The philosophy of Occam's razor – that the simplest solution is the best solution – certainly is applicable here. In the author’s opinion, invoking diapirism to explain Gulf of
Copyright © 1999 – 2012 Richard J. Heaney All rights reserved

Gulf of Mexico Salt Tectonics
Mexico salt-sediment interactions is nothing more than an unneeded and misleading complication.
Copyright © 1999 – 2012 Richard J. Heaney All rights reserved