Embed Size (px)
Citation preview

www.wrksolutions.com 1.888.469.JOBS (5627) Workforce Solutions is an equal opportunity employer/program. Auxiliary aids and services are available upon request to individuals with disabilities. Relay Texas: 1.800.735.2989 (TDD) 1.800.735.2988 (voice) or 711
GULF COAST WORKFORCE BOARD
TENTATIVE AGENDA
10:00 A.M. TUESDAY, April 7, 2020 BY TELECONFERENCE
Dial 713-481-0090 or 1-800-240-3895
Passcode 1066423#
1. Call Roll
2. Adopt Agenda
3. Hear Public Comment
4. Review February 2020 meeting minutes
5. Declare Conflicts of Interest
6. Consider Reports
a. Chair’s Remarks. b. Audit/Monitoring. Briefing on committee’s March
meeting.
7. Take Action a. Procurement. Consider renewing contracts with 15
adult education providers in a total amount not to exceed $18,193,000 for adult education and literacy instruction throughout the region and add $394,000 to career office contracts to further integrate adult education.
b. Request authority to negotiate increases in contract amounts for BakerRipley, Interfaith of the Woodlands,

www.wrksolutions.com 1.888.469.JOBS (5627) Workforce Solutions is an equal opportunity employer/program. Auxiliary aids and services are available upon request to individuals with disabilities. Relay Texas: 1.800.735.2989 (TDD) 1.800.735.2988 (voice) or 711
and Employment and Training Centers for expansion of services in total amounts not to exceed $17.7 million.
c. Request authority for Chair and Vice Chairs to act on behalf of the Board temporarily to accept funds, approve procurements, and authorize contracts.
8. Receive Information a. Performance and Production. Report on the system’s
performance and production. b. Expenditures. Report on the Board’s budget and
expenditures. c. Update on operations. Report on activity regarding
COVID 19.
9. Look at the Economy. Report on current employment data and economic trends
10. Take Up Other Business.
11. Adjourn
If you wish to make a public comment you may do so by providing your comments in writing no later than 5:00 pm on Monday, April 6, 2020 to Deborah Duke at [email protected]. Meeting materials are available on our website at www.wrksolutions.com/about-us/meetings. Workforce Solutions is an equal opportunity employer/program. Auxiliary aids and services are available upon request to individuals with disabilities. Please contact H-GAC at 713.627.3200 at least 48 hours in advance to request accommodations. Deaf, hard-of-hearing or speech-impaired customers may contact: Relay Texas 1-800-735-2989 (TTY) or 1-800-735-2988 (Voice) or 711. Equal opportunity is the law. Gulf Coast Workforce Board-Workforce Solutions 3555 Timmons Lane, Suite 120, Houston, Texas 77027 P.O. Box 22777 Houston, Texas 77227-2777 713.627.3200 1.888.469.5627 toll-free www.wrksolutions.com

IV

MINUTES OF THE GULF COAST WORKFORCE BOARD
TUESDAY, FEBRUARY 4, 2020
UMEMBERS PRESENT
Willie Alexander Gerald Andrews Peter Beard Sarah Bouse Carl Bowles Mary Helen Cavazos Renea Dillon Cheryl Guido Mark Guthrie Bobbie Allen Henderson
Alan Heskamp Guy Robert Jackson Sarah Janes Doug Karr Stephanie Nellons-Paige Jerry Nevlud Adrian Ozuna Monica Riley Adria Ross Janice Ruley
Danielle Scheiner Richard Shaw Isaac Shi Gil Staley Michael Stewart Evelyn Timmins Lizandra Vazquez Carolyn Watson
UH-GAC STAFF MEMBERS PRESENT
Ron Borski AJ Dean Philip Garcia Parker Harvey Mike Temple Mark Guthrie, Chairman, called the meeting to order at approximately 10:00 a.m., on Tuesday, February 4, 2020, in the 2nd floor, H-GAC Conference Rooms A/B/C, at 3555 Timmons Lane, Houston, Texas. Chair Guthrie determined a quorum was present.
UADOPTION OF AGENDA
Chair Guthrie presented the agenda and proposed that item 6, Welcome New Members, be moved to take place prior to Public Comments. UA motion was made and seconded to adopt the agenda as amended. The motion carried and the amended agenda was adopted.

Page 2 of 10
WELCOME NEW MEMBERS
Chair Guthrie welcomed new Board members Carl Bowles, Monica Riley, Adria Ross and Carolyn Watson. Each member was asked to give a brief introduction to the Board. The new members each did so and were welcomed enthusiastically by the Board.
UPUBLIC COMMENT
No one signed up for public comment.
UMINUTES FROM DECEMBER 3, 2019 MEETING
Chair Guthrie asked for any additions or corrections to the minutes for the December 3, 2019 Board meeting and if none, for approval of the minutes as presented. UA motion was made and seconded to approve the minutes as presented. The motion carried.
UDECLARE CONFLICTS OF INTEREST
Chair Guthrie asked for a declaration of any conflicts of interest with items on the agenda. No conflicts of interest were declared. Chair Guthrie reminded the members that they were welcome to declare conflicts with items as they are considered.
UCONSIDER REPORTS
a. Chair’s Report. Chair Guthrie began by reporting that he and other board members and staff attended the Texas Workforce Commission Annual Conference in Grapevine, Texas in early December. The conference hosted over 1600 attendees and included a number of speakers with good information. One informative discussion was presented by a futurist who provided job forecast information, including details of how the AI component is expected to affect the job market in Texas. Chair Guthrie said that he attended the Texas Association of Workforce Boards (TAWB) director meeting preceded the TWC Annual Conference. Margaret Spellings, a former United States Secretary of Education, and the current CEO and President of the Texas 2036 organization, spoke at that meeting. Their goal is to get everyone working together to prepare for what the economy will look like in 2036. A primary focus of the organization is education. Recognizing that if we fail
Page 3 of 10
to do a good job in educating our current base of students, our economy will be difficult in 2036. Chair Guthrie also reported that attended the National Association of Workforce Boards quarterly directors’ meeting in Panama City, Florida in January. The focus of that meeting was on disaster recovery. Chair Guthrie served on a panel that included senior Workforce development representatives from the State of Florida and Puerto Rico. The focus of the panel discussion was recovery from natural disasters such as hurricanes. Chair Guthrie reported that, at the end of 2019, Congress agreed on a budget for our Workforce programs. In general, the Workforce programs we touch were reauthorized for funding with increases on average of 2-3%, depending on the program. Chair Guthrie concluded his report and no action was taken.
b. UAudit/Monitoring Committee. Committee Chair Guy Robert Jackson provided the following report. The Audit/Monitoring Committee met on Wednesday, January 22, 2020 in the Pearland career office with Chair Guy Jackson and members Carl Bowles, Helen Cavazos, Willie Alexander, Sara Bouse, Evelyn Timmins, and Cheryl Guido attending. Operations We have changed our review process this year. We are looking at each contract as a whole, rather than focusing on the various different parts – such as career offices – at different times during the year. We expect this to give us a slightly different view of our contractors’ operations.
• Staff checked on ResCare – which operates three career offices for us: Westheimer, Pearland, and Acres Homes. ResCare is in its third year of managing Westheimer and, at the time of this review, had completed the first year for Pearland and Acres Homes. Staff noted a decline in several compliance elements from our previous
year review, primarily at the Westheimer location. Staff noted a lack of standard procedures for the tracking unit which is based at Westheimer. Staff also commented on a high staff turnover rate at the Westheimer location and voiced concerns about office management, staff training, and corporate level support for the local operation.
For these reasons, staff has rated ResCare as Building Performance – a drop in the rating from last year. Staff iscurrently working with ResCare

Page 4 of 10
on an extended corrective action plan, and staff will go back out to review progress in summer 2020.
Financial Systems Staff reviews each contractor at least once a year for compliance with financial requirements. Staff completed reviews for Community Family Centers, the H.E.A.R.T. Program, University of Houston Downtown, Houston Community College System, Wharton County Junior College, San Jacinto College, and Interfaith of the Woodlands. Trends
• As usual, smaller organizations and those who are new to our system tend to have a larger number of findings and recommendations from financial monitors.
• Staff commonly finds small errors, including a limited number of unallowable charges to our contracts, and confusion around federal and state requirements for policies and procedures.
• Staff has not seen problems that it believes rise to a level of high risk. • Staff provides direct technical assistance to contractors to support
resolution of financial monitoring issues, and staff is building additional training on key areas.
Chair Jackson concluded his report and no action was taken.
TAKE ACTION
a. Budget. Consider proposed Board budget for 2020 in amount of $313,742,103.
The Budget Committee met on Wednesday, January 22, 2020 with Committee Chair Willie Alexander and Committee Vice Chair Gerald Andrews attending. Chair Willie Alexander provided the following report to the Board: Background Each year the Workforce Board approves a budget showing how it uses the revenue it receives to achieve results set out in the Board’s strategic plan – competitive employers, an educated workforce, more and better jobs, and higher incomes – and to operate Workforce Solutions and leverage results in the region. The Board’s revenue landscape has increased substantially in recent years. As our population grows and the labor market changes, funding we receive has increased as well. From 2017 to 2020 the Board’s available revenue has increased nearly 37%.

Page 5 of 10
Current Situation The proposed 2020 budget at just over $313 million is 1.7% more than 2019, attributable principally to increases in our general revenue.
• Our larger formula allotments show the largest increase in early education dollars. We project general revenue will be 2.7% larger than in 2019. The general revenue fund contains the primary dollars which power Workforce Solutions.
• Special federal and state revenue, funds we consider short-lived or with a limited guarantee of continuance, are down in 2020. We have exhausted the disaster recovery dollars made available as a response to Hurricane Harvey.
• We continue incorporating staff from the Vocational Rehabilitation Service into the career offices and estimate contributions over $3,100,000 for this fiscal year. We plan to integrate four additional locations in 2020.
• We have a little over $3.1 million in statewide activity funds available to support a variety of initiatives.
The proposed 2020 Board budget reserves 2.6% of total revenue for operations at the administrative level. The remaining 97.4% delivers direct service to customers. Proposed Board operations total $8,236,883 for 2020, which is a 4.1% increase from the previous year. System operations have increased to $305,505,220, which is a 1.7% increase from 2019.
Direct service to employers and people makes up system operations. Proposed 2020 expenditures are in line with contracts the Board approved for Workforce Solutions in August 2019 and include a portion of the funds we plan to use for contracts beginning in fall 2020.
• Financial aid, the highest dollar value service for people, represents the
large demand for early education, scholarships, work-based learning, and work support in our region. We request an increase to the financial aid pool to $221.5 million.
• We recommend a modest 1% increase to our career office network for the new year. In 2019, we made a sizeable increase in this area to provide more access points for customers.

Page 6 of 10
• Service through our adult education consortium will continue at a comparable level as 2019. Currently we include 14 adult education providers in the consortium and one lead agency.
• We propose increasing dollars budgeted for employer service by 4.6% to expand talent development opportunities and continue our efforts in assisting employers to recruit and screen talent from qualified job seekers.
• We do not propose any major changes in our System IT for 2020 and
recommend preserving the budget at its current level.
We are proposing a Board administrative operations budget at $8.2 million, an increase of 4.1% from 2019. Board operations represent 2.6% of the total budget.
• The personnel line item reflects the Board’s staffing at 49 positions. The
increase in personnel cost results from H-GAC’s budgeted merit increase, the addition of three career outreach specialists, and a project manager. H-GAC provides a pool of funds for merit raises in most years. Managers recommend raises based on an evaluation of employees’ performance. This year the pool will be set at 4%.
• In 2019 H-GAC formed a communications group to assist with public
information & outreach efforts. The added agency support will allow us to reduce the amount we contract out for this function. This change results in a $390,000 decrease in consultants and contracted services.
• Shared costs provided by H-GAC represent the increases identified under
indirect and other line items. Shared support includes functions such as human resources, accounting, and purchasing. The increase in rent is attributable to the additional board staff positions to be housed at H-GAC.
Results With this budget, we plan to achieve the following:
• Serve at least 28,500 employers and 425,000 individuals • Ensure 17,670 of our employers return for service • Assist in creating 3,300 new jobs • Spend at least $15 million on scholarships for more than 5,000 individuals
in high-skill, high-growth occupational training • Support about 24,000 families and 44,000 children with early education • Help more than 230,000 individuals go to work • Raise the incomes of 105,000 by at least 20% • Help 85% of individuals pursuing a post-secondary education attain a
credential (certificate or degree)

Page 7 of 10
Action UA motion was made and seconded to approve the Budget Committee’s recommended 2020 budget in the amount of $313,742,103. After some discussion by the Board, the motion was approved as presented.
b. Budget. Consider proposed funding projects with statewide activity dollars
in amount of $3,214,224.
Chair Willie Alexander continued his report, providing the following information to the Board: Background The Workforce Innovation and Opportunity Act provides funds at the state level with greater flexibility than the dollars formula-allocated to local boards. In the past, Texas competed for these “statewide activity funds”, but this summer allocated most of the dollars among the state’s local boards. Since our report to the Board in August 2019 about these dollars, we have been working to structure projects that invest in our priorities and meet the state’s requirements for use. Current Situation We have included the statewide funds in the draft 2020 Board budget and the Budget Committee proposes using these dollars as follows:
Project BudgetBoard
Contribution Match
Texas Industry Partnership $70,000 $35,000 $35,000Teacher Externships 137,500 107,500 30,000 Entrepreneur Boot Camps 125,000 100,000 25,000 Second Chance/Reentry Network 410,000 410,000 - Youth Docket Diversion 240,000 240,000 - Income Now 250,000 250,000 - Supported Employment 600,000 600,000 - CTE Partnership 120,000 120,000 - Reserve for Scholarships 1,261,724 1,261,724 - Total 3,214,224$ 3,124,224$ 90,000$
Several of the projects require matching funds or resources from partners in the projects, as reflected in the table above.

Page 8 of 10
We will reserve $1.26 million to add to our general scholarship fund and to be available to expand the Second Chance Youth Network, Income Now, and Supported Employment projects, if needed. Action A motion was made and seconded to approve the Budget Committee’s recommendation to fund projects and the reserve for scholarships in the amount of $3,214,224, and to additionally fund expansions of the Second Chance Youth Network, Income Now, and Supported Employment projects, if needed from the reserve for scholarships. Renea Dillon declared a conflict of interest and abstained from voting. After some discussion by the Board, the motion was approved as presented. Chair Alexander concluded his report and no further action was taken.
URECEIVE INFORMATION
a. Performance and Production. Philip Garcia reviewed the Performance and Production measures for October 2019 through December 2019, as follows:
• More Competitive Employers: Market Share and Loyalty data accumulates over the course of the year. However, the TWC reporting system used for these measures stopped functioning in July. TWC is working to correct the reporting system.
New jobs created: we did not meet goal for this measure. Board staff is working with partners to bring jobs to our region and develop best practices to improve this measure.
Earnings Gains: although we did better than last year for the people who successfully gained 20% increase in wages, we still have improvements to make. We continue to follow up with customers and review wage data for this population.
The Texas Workforce Commission has 25 production measures we must meet. Of those measures, we met or exceeded 19 of the measures for the year. The following measures require additional focus: Employed Q2 Post Exit (WIOA Dislocated Workers (DW)) Employed Q4 Post Exit (WIOA DW) Credential Rate (WIOA DW) Employed/Enrolled Q2 Post Exit (WIOA Youth) TANF Full Work Rate Integrated English Language/Civics (July 2019 – December 2019)

Page 9 of 10
Mr. Garcia completed his report and no action was taken.
b. Expenditures AJ Dean reviewed the Financial Status Report representing expenses for the 12 months ending in December 2019, and provided the following report: Overall, we spent approximately 95% of our estimated budget. System expenses included approximately 75% Financial Aid, followed by Office Operations, Adult Education and Employer Service. Mr. Dean completed his report and no action was taken.
ULOOK AT THE ECONOMY Ron Borski provided the Board with a report of employment data and economic trends: We continue to see record low unemployment rates. Houston – MSA and Texas are unchanged compared to previous reporting periods. The US unemployment rate increased slightly to 3.4%. Houston’s unemployment rate has hit record lows each month for the last 9 months of data that has been released. On an over-the-year basis, MSA is up 2.8% which is twice the rate of the nation as a whole. That equates to approximately 88,000 jobs with the largest number of new jobs coming in the category of Professional and Business Services. These numbers are expected to change with the release of benchmark revisions in March. Job growth is expected to remain positive after revisions. Mr. Borski completed his report and no action was taken. Parker Harvey provided the Board with a report on geographic sources of workers flowing into the Houston Metropolitan Area: This report looked at the inter-connectedness of our labor market compared with other labor markets around the country as workers flow across geographic areas. In our region, approximately 170,000 workers change jobs in a given quarter. Of those 170,000 job changes, approximately 105,000 workers were already located in the Houston area. Approximately 47,000 workers come into the region from other Texas metropolitan areas and 6,000 workers come from our border states (Arkansas, Louisiana, New Mexico and Oklahoma). The remaining 12,000 workers come from other states.

Page 10 of 10
Mr. Harvey examined the volume of workers flowing into the Gulf Coast region from other metropolitan areas in the state of Texas, those from metropolitan areas in bordering states and those from metropolitan areas across the US. Board members discussed potential benefits this information might provide to employers in our region for their recruitment efforts. Mr. Harvey completed his report and no action was taken.
UOTHER BUSINESS
There was no other business to be brought before the Board.
UADJOURN
Chair Guthrie adjourned the meeting at approximately 11:15 a.m.

GULF COAST WORKFORCE BOARDBoard Member 06/04/19 08/06/19 10/01/19 12/03/19 02/04/20 04/07/20Alexander, Willie Allen, Karlos Andrews, Gerald Beard, Peter Bouse, Sara Bowles, Carl Cavazos, Mary Helen Dillon, Renea Edwards, ToddGuido, Cheryl Guthrie, Mark Henderson, Bobbie Allen Heskamp, Alan Jackson, Guy Robert Janes, Sarah Karr, Doug LaBroski, Jeff Lewis, Ernest Mahagaokar, Rajen Marshall, Scott McCleskey, KendrickMcCoy, Dexter Mechler, Steve Melton, Edward Nellons-Paige, Stephanie Nevlud, Jerry Ozuna, Adrian Puente, Paul Riley, Monica Ross, Adria Ruley, Janice Scheiner, Danielle Segovia, Valerie Shaw, Richard Shi, Isaac Staley, Gil Stewart, Michael Timmins, Evelyn Vazquez, Lizandra Watson, Carolyn Webster, Michael

Updated: 3/25/2020 Page 1 of 6
GULF COAST WORKFORCE BOARD
ALEXANDER, WILLIE W J Alexander Associates P.C. 1770 St. James Place, Suite 407 Houston, TX 77056 (713) 802-0900, ext. 12 Fax: (713) 802-1188 Category: Business County: City of Houston [email protected] Term: January 1, 2019 thru December 31, 2020
ALLEN, KARLOS PFM Financial Advisors LLC 1200 Smith Street, Suite 1600 Houston, TX 77002 (713) 353-4600 Category: Business County: City of Houston [email protected] Term: January 1, 2016 thru December 31, 2020
ANDREWS, GERALD Gallagher Victory Insurance 122 West Way, Suite 404 Lake Jackson, TX 77566 (979) 297-8604 Fax: (979) 297-7080 Category: Business County: Brazoria [email protected] Term: January 1, 2019 thru December 31, 2020
BEARD, PETER Greater Houston Partnership 701 Avenida de las Americas, Suite 900 Houston, TX 77010 (713) 844-3602 – office Fax: (713) 844-0200 Category: Business County: City of Houston [email protected] Term: January 1, 2019 thru December 31, 2020 Term: January 1, 2019 thru December 31, 2020
BOWLES, Carl Bowles, Womack & Company, P.C. 24 Greenway Plaza, Suite 970 Houston, TX 77046 (713) 621-0050 Fax: (713) 621-0046 Category: Business County: Waller [email protected] Term: January 1, 2019 thru December 31, 2020
BOUSE, SARA Alvin Community College 3110 Mustang Road Alvin, TX 77511 (281) 732-8389 – cell (281) 756-3568 – office Category: Education County: Brazoria [email protected] Term: January 1, 2019 thru December 31, 2020
CAVAZOS, MARY HELEN M.H. Cavazos & Associates 1124 W. Clay Street Houston, TX 77019 (713) 807-1115 Category: Business County: Harris [email protected] Term: January 1, 2019 thru December 31, 2020
DILLON, RENEA Goose Creek CISD 4544 I-10 East Baytown, TX 77521 281-707-3361 Category: Education County: Harris [email protected] Term: January 1, 2018 thru December 31, 2019

Page 2 of 6
EDWARDS, TODD Midtown Redevelopment Authority 410 Pierce Street, Suite 355 Houston, TX 77002 (713) 526-7577 Fax: (713) 526-7519 Category: Business [email protected] Term: January 1, 2019 thru December 31, 2020
GUIDO, CHERYL Department of Assistive and Rehabilitation Services 427 W. 20th, Suite 407 Houston, TX 77008 (713) 802-3101 Fax: (713) 802-3143 Category: State Agency [email protected] Term: January 1, 2018 thru December 31, 2021
GUTHRIE, MARK Winstead PC 600 Travis Street, Suite 5200 Houston, TX 77002 (713) 650-2730 Fax: (713) 650-2400 Category: Business County: City of Houston [email protected] Term: January 1, 2019 thru December 31, 2020
HAWTHORNE, CARI HR Defined, LLC 10101 Fondren #206 Houston, TX 77096 Category: Business County: City of Houston [email protected] Term: June 21, 2018 thru December 31, 2020
HENDERSON, BOBBIE ALLEN Texas Southern University 4203 Charleston Street Houston, TX 77021-1415 (713) 313-7588/(713) 748-6508(h) Fax: (713) 741-6196 Category: Education County: City of Houston [email protected] Term: January 1, 2019 thru December 31, 2020
HESKAMP, ALAN Heskamp & Associates LLC 311 Hoskins Broadway El Campo, TX 77437 (979) 758-4521 Category: Business County: Wharton [email protected] Term: January 1, 2018 thru December 31, 2021
JACKSON, GUY ROBERT Chambers County Abstract Co. Inc. P.O. Box 640 Anahuac, TX 77514 (409) 267-6262, ext. 35 Fax: (409) 267-6355 Category: Business County: Chambers [email protected] Term: January 1, 2019 thru December 31, 2020
JANES, SARAH San Jacinto College 8060 Spencer Highway Pasadena, TX 77505 (281) 478-3605 Fax: (281) 479-8127 Category: Education County: Harris [email protected] Term: January 1, 2018 thru December 31, 2019

Page 3 of 6
KARR, DOUG Pro Staff/Atterro 27 Canoe Birch Place The Woodlands, TX 77382 832-967-7684 Category: Business County: Montgomery [email protected] Term: January 1, 2018 thru December 31, 2019
LaBROSKI, JEFFREY Plumbers Local Union No. 68 502 Link Road P.O. Box 8746 Houston, TX 77249 (713) 869-3592 Fax: (713) 869-3671 Category: Labor County: City of Houston [email protected] Term: January 1, 2019 thru December 31, 2020
LEWIS, ERNEST Adult Reading Center 2246 N Washington Ave Pearland, TX 77581 (281) 485-1000 Category: Literacy County: Brazoria [email protected] Term: January 1, 2018 thru December 31, 2021
MAHAGAOKAR, RAJEN Riverstone Holdings LLC 1000 Louisiana St, 1450 Houston, TX 77002 (713) 844-3600 Category: Business County: Harris [email protected] Term: June 21, 2019 thru December 31, 2020
MARSHALL, SCOTT Worley 5995 Rogerdale Road Houston, TX 77072 (832) 351-6655 Category: Business County: Harris [email protected] Term: January 1, 2018 thru December 31, 2019
McCLESKEY, KENDRICK PricewaterhouseCoopers- 1903 Crockett St. Houston, TX 77007 (281) 788-6046 Category: Business County: City of Houston [email protected] Term: January 1, 2019 thru December 31, 2020
McCOY, DEXTER Fort Bend Independent School District 16431 Lexington Blvd (281) 634-1000 Fax: (281) 327-2834 Category: Education County: Fort Bend [email protected] Term: January 1, 2019 thru December 31, 2020
MECHLER, STEVE TI Constructors 4321 Directors Row, Suite 101 Houston, TX 77092 (281) 272-7980 Category: Business County: Harris [email protected] Term: January 1, 2018 thru December 31, 2019

Page 4 of 6
MELTON, EDWARD Texas Library Association 5749 South Loop East Houston, TX 77033 (713) 274-6600 Category: Literacy County: Harris County [email protected] Term: January 1, 2018 thru December 31, 2019
NELLONS-PAIGE, STEPHANIE Texas Central Rail Holdings 1021 Main Street Houston, TX 77002 (443) 610-3487 Category: Business County: Houston [email protected] Term: January 1, 2019 thru December 21, 2020
NEVLUD, JERRY AGC Houston 3825 Dacoma Street Houston, TX 77092 (713) 843-3700 Fax: (713) 843-3777 Category: Business County: Harris [email protected] Term: January 1, 2018 thru December 21, 2019
OZUNA, ADRIAN Prosperity Bank 80 Sugar Creek Center Blvd Sugar Land, TX 77478 (832) 259-7692 Category: Business County: Harris [email protected] Term: June 21, 2019 thru December 31, 2020
PUENTE, PAUL J. Houston Gulf Coast Building and Construction Trades Council 1301 West 13th St, Suite D Deer Park, TX 77536 (713) 926-4433 Fax: (713) 926-4918 Category: Labor County: City of Houston [email protected] Term: January 1, 2019 thru December 31, 2020
RILEY, MONICA The Community Gatekeepers P.O. Box 2082 Missouri City, TX 77459 (281) 235-3933 Category: CBO County: Fort Bend County [email protected] Term: January 1, 2019 thru December 31, 2020
ROSS, ADRIA CenterPoint Energy 1111 Louisiana Street Houston, TX 77002 (713) 289-4569 Category: Business County: Fort Bend County [email protected] Term: January 1, 2019 thru December 31, 2020
RULEY, JANICE Houston Airport Systems 18600 Lee Road, Suite 130 Humble, TX 77338-4172 (281) 233-7853 Fax: (281)230-8020 Category: Labor County: City of Houston [email protected] Term: January 1, 2019 thru December 31, 2020
Page 5 of 6
SCHEINER, DANIELLE Conroe Economic Development Council 300 W Davis Street Conroe, TX 77301 (936) 522-3529 Category: Economic Development County: Montgomery [email protected] Term: January 1, 2018 thru December 31, 2019
SEGOVIA, VALERIE GARCIA Director of Outreach and Development Nuclear Power Institute 101 Gateway Blvd, Suite A College Station, TX 77845 979-240-5005 Category: CBO County: Matagorda [email protected] [email protected] Term: January 1, 2019 thru December 31, 2020
SHAW, RICHARD Harris County Labor Assembly, AFL-CIO Council 1707 Prism Lane Houston, TX 77043-3344 (713) 240-2472 Category: Labor County: City of Houston [email protected] Term: January 1, 2019 thru December 31, 2020
SHI, ISAAC Golden Section Technology 808 Travis St, Suite 1406 Houston, TX 77002 (713) 806-3020 Category: Business County: City of Houston [email protected] Term: January 1, 2019 thru December 31, 2020
STALEY, GIL The Woodlands Area Economic Development Partnership 9320 Lakeside Blvd., Bldg. 2, Suite 200 The Woodlands, TX 77381 (281) 363-8130 Fax: (281) 298-6874 Category: Business County: Montgomery [email protected] Term: January 1, 2018 thru December 31, 2019
STEWART, MICHAEL United Way of Greater Houston 50 Waugh Drive Houston, TX 77007 (713) 685-2401 Fax: (844) 768-0346 Category: CBO County: City of Houston [email protected] Term: January 1, 2019 thru December 31, 2020
TIMMINS, EVELYN Houston Mayor’s Committee for Employment of People with Disabilities 2120 Lundy Lane Friendswood, TX 77546 (281) 388-1967 Category: CBO County: City of Houston [email protected] Term: January 1, 2019 thru December 31, 2020
VAZQUEZ, LIZANDRA Texas Workforce Commission 3555 Timmons Lane, Suite 120 Houston, TX 77027 (713) 688-6890 Category: State Agency [email protected] Term: January 1, 2019 thru December 31, 2020

Page 6 of 6
WATSON, CAROLYN JPMorgan Chase 712 Main, 4th Floor Houston, TX 77002 (713) 216-5008 Home: (832) 419-9156 Category: Business County: City of Houston [email protected] Term: January 1, 2019 thru December 31, 2020
WEBSTER, MICHAEL Houston Community College 3100 Main Street Houston, TX 77002 (713) 718-8030 Fax: (713) 718-5018 Category: Education County: City of Houston [email protected] Term: January 1, 2019 thru December 31, 2020
WORKFORCE BOARD KEY STAFF: Mike Temple, Director Brenda Williams, Senior Manager Michelle Castrow, Program Manager Dorian Cockrell, Operation Manager Susan Dixon, Employer Service Manager Jenny Johnson, Quality Assurance Manager Deborah Duke, Administrative Coordinator Lucretia Hammond, Grants Management Houston-Galveston Area Council 3555 Timmons Lane, Suite 120 P.O. Box 22777 Houston, TX 77227-2777 (713) 627-3200 Fax: (713) 993-4578 http://www.wrksolutions.org

GULF COAST WORKFORCE DEVELOPMENT BOARD COMMITTEES
Updated: 3/25/2020 Page 1 of 2
Audit/Monitoring Guy Robert Jackson – Chair – Vice Chair Karlos Allen Carl Bowles Sara Bouse Helen Cavazos Cheryl Guido Doug Karr Ernest Lewis – conflict? call him Scott Marshall Kendrick McCleskey Evelyn Timmins
Budget Willie Alexander – Chair Gerald Andrews – Vice Chair Karlos Allen Bobbie Henderson Guy Robert Jackson Sarah Janes Doug Karr Scott Marshall Jerry Nevlud Mike Stewart
By-Laws Appointed by Board Chair as needed
Nominating Guy Robert Jackson – Chair Jeff LaBroski – Vice Chair Alan Heskamp Evelyn Timmins
Oversight Committee (Delete?) Gerald Andrews Bobbie Henderson
Education Bobbie Henderson – Chair Doug Karr – Vice Chair Karlos Allen Sara Bouse Helen Cavazos Renea Dillon Cheryl Guido Alan Heskamp Sarah Janes Jeff LaBroski Scott Marshall Dexter McCoy Steve Mechler Jerry Nevlud Valerie Segovia Richard Shaw
Career Office Karlos Allen – Chair – Vice Chair Cheryl Guido
Employer Services Gerald Andrews – Chair Jeff LaBroski – Vice Chair Sara Bouse Helen Cavazos Cheryl Guido Alan Heskamp Guy Robert Jackson Sarah Janes Scott Marshall Steve Mechler Danielle Scheiner Richard Shaw Gil Staley Evelyn Timmins

Page 2 of 2
Procurement Evelyn Timmins – Chair Bobbie Henderson – Vice Chair Willie Alexander Karlos Allen Sara Bouse Helen Cavazos Cheryl Guido Alan Heskamp Doug Karr Jeff LaBroski Scott Marshall Adrian Ozuna Richard Shaw Gil Staley
Report Card Appointed by Board Chair as needed
Strategic Planning – Chair – Vice Chair Peter Beard Sarah Janes Doug Karr Kendrick McCleskey Dexter McCoy Stephanie Nellons-Paige Adrian Ozuna Paul Puente Richard Shaw Isaac Shi Evelyn Timmins
Communications Evelyn Timmins – Chair – Vice Chair Willie Alexander Karlos Allen Gerald Andrews Bobbie Henderson Guy Robert Jackson Rajen Mahagaokar Stephanie Nellons-Paige Richard Shaw Mike Webster
Government Relations Guy Robert Jackson – Chair – Vice Chair Gerald Andrews Scott Marshall Jerry Nevlud Richard Shaw

VI

Item 6b Page 1 of 1
Audit/Monitoring Committee Update for April 2020
The Audit/Monitoring Committee met on Tuesday, March 24, 2020 by conference call career office with Chair Guy Jackson and members Mark Guthrie, Helen Cavazos, Willie Alexander, Sara Bouse, Evelyn Timmins, Scott Marshall, Gerald Andrews and Cheryl Guido attending.
Adult Education We completed reviews of five Adult Education providers. These organizations provide instruction for English as Second Language; English Language Civics; Integrated English Language Civics; Intensive Services as well as other courses to further skills in the workforce at various locations throughout the region. We noticed eligibility documents were missing in some cases as a result of a change in document requirements.
The Association for the Advancement of Mexican Americans, Brazosport College, Chinese Community Center, and Community Family Centers were all rated Strong Performance. Boys and Girls Club of Walker County was rated Solid Performance.
Career Offices We completed the review of the career offices operated by Interfaith of the Woodlands and have issued the draft report as of March 9, 2020. Interfaith is scheduled to submit a response to all issues identified by April 3, 2020.
Financial Systems We review each contractor at least once a year for compliance with financial requirements. Employment & Training Centers Financial monitors conducted a review of Employment & Training Centers in July 2019 to review financial aid payments. We noted there were no findings in the report. There was no response necessary, and the report was accepted.

VII

Item 7a Page 1 of 2
Procurement Committee Adult Education 2021
The Procurement Committee met on Tuesday, March 24, 2020 by teleconference to consider recommendations for 2010 adult education provider contracts. Members present included the committee chair Evelyn Timmins; the committee vice chair Bobbie Henderson; the Board chair Mark Guthrie; and members Guy Jackson, Doug Karr, Richard Ozuna, and Richard Shaw.
Overview The Workforce Board is the grantee/fiscal agent for the Gulf Coast Adult Education Consortium. Region VI is the lead agency providing technical assistance and support to our fourteen contractors in the consortium. These partners offer a variety of adult education instruction throughout the region. The Adult Education and Family Literacy Act – which authorizes the activities for publicly funded adult education – is part of the Workforce Innovation & Opportunity Act (Title II of the Act).
What we will do We propose continuing adult education and literacy instruction at more than 250 sites throughout the 13-county region. Service includes English language instruction, literacy classes, adult basic education, adult secondary education, integrated education, GED preparation, and joint basic education-skills training classes. During 2021 we will also:
• Work with adult education and career offices in identifying youth customers in order to inform them of available service.
• Continue the integration of adult education with our Employer Service by
continuing to increase employer awareness and offering on-site basic skills and English language instruction.
• Continue integrating adult education providers and service with the career offices
and the Vocational Rehabilitation Service to make it easy for customers to access a full range of Workforce Solutions service no matter where they enter.
• Continue to work on improving outcomes.

Item 7a Page 2 of 2
Recommendations We estimate the availability of just under $19.2 million for the adult education 2021 program year. This is a 2% decrease from 2020. We recommend the target enrollments below:
Target Enrollments 2020-2021 2020 2021 Total Students 21,770 22,205 12 Hour Students 19,593 19,929 Integrated Education/Training 1,265 1,000 English Language/ Civics 1,000 1,000 Integrated English Language/ Civics/ Training 575 575 Intensive Services 620 750
As a part of our funding recommendations for 2021, we have included a range. The end of the range is a “not-to-exceed” limit and the beginning is a proposed starting point for contract negotiations.
Action Request the Board authorize staff to negotiate contracts with adult education providers as shown above for the period July 1, 2020 through June 30, 2021 in total amount not to exceed $18,193,000 and to add funding to career office contractors to integrate adult education in the amount of $ 394,073.

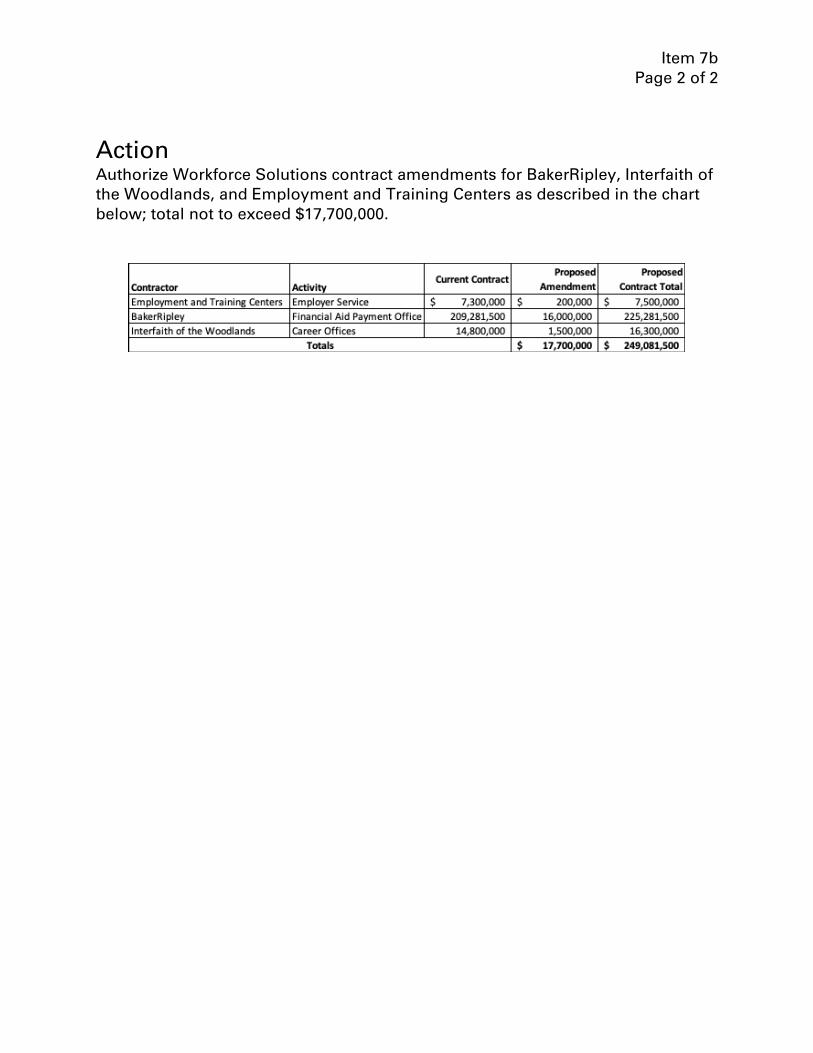
Item 7b Page 1 of 2
Contract Amendments 2020 Workforce Solutions Operations
Background From time to time, the Board receives additional funds during a budget year or we see a need to redistribute funds to assist contractors with expanding service. In either of these situations we work to place or reallocate funds to the best advantage of our system and to make sure we are providing higher levels of service to more customers with the additional dollars.
Current Situation At the present time, we are expecting additional funds (principally for early education/care) and have some uncommitted funds in the current year budget. We propose the following:
• An additional $16 million for the Financial Aid Payment Office contract with BakerRipley to provide financial aid for individuals. Fully $14 million will be used to expand the availability of early education/care for families and children - including those parents who are essential workers during the current public health emergency in health care, governments, and other industries. This amendment will help an additional 3,500 children and bring the total number of children we assist annually to about 36,000 per day. The $2 million balance of this amendment would be available for all other financial aid we provide.
• An additional $1.5 million for career office operations by Interfaith of the
Woodlands. These funds will allow completion of the build-out of local offices in Missouri City, Huntsville, and the Willowbrook area and expansion of workforce service to more ex-offenders re-entering society as well as a job-coaching pilot for individuals with disabilities.
• An additional $200,000 for Employer Service operated by Employment and
Training Centers, Inc. These funds will expand the number of employers we can assist with talent acquisition and talent development and focus Employer Service on employers who need skilled workers during the current public emergency.
The chart below shows requested amendments and proposed contract totals.
Item 7b Page 2 of 2
Action Authorize Workforce Solutions contract amendments for BakerRipley, Interfaith of the Woodlands, and Employment and Training Centers as described in the chart below; total not to exceed $17,700,000.
Item 7c Page 1 of 1
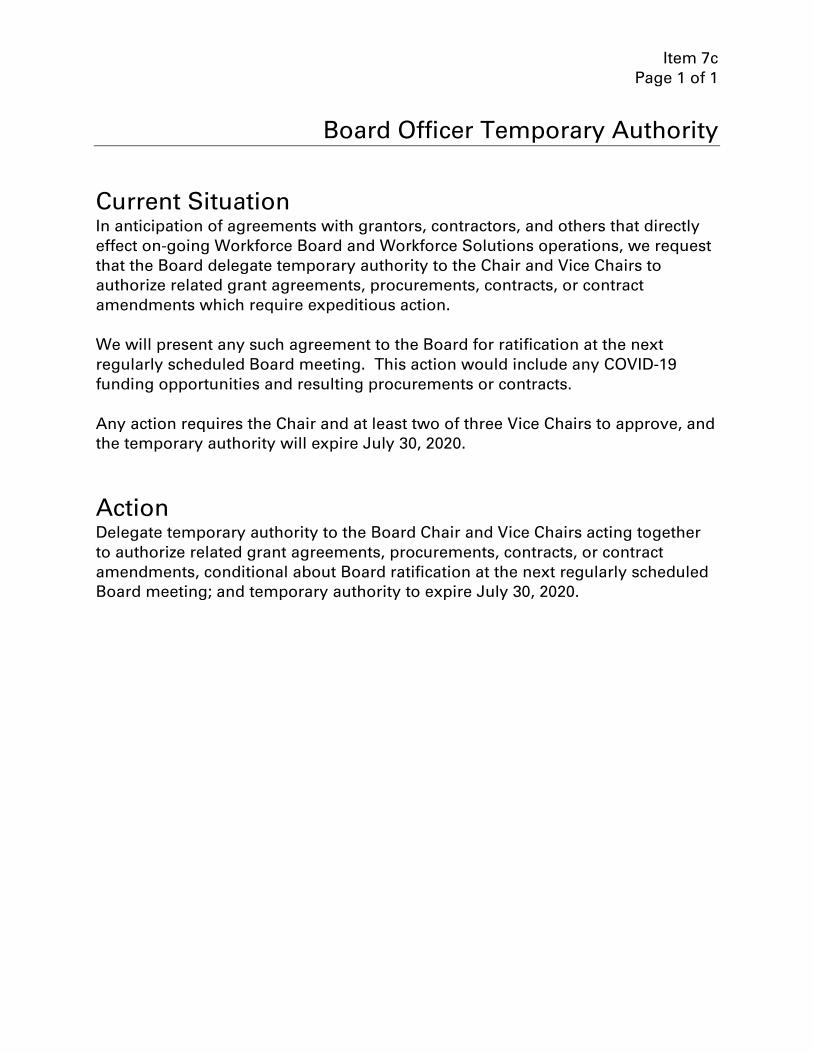
Board Officer Temporary Authority
Current Situation In anticipation of agreements with grantors, contractors, and others that directly effect on-going Workforce Board and Workforce Solutions operations, we request that the Board delegate temporary authority to the Chair and Vice Chairs to authorize related grant agreements, procurements, contracts, or contract amendments which require expeditious action.
We will present any such agreement to the Board for ratification at the next regularly scheduled Board meeting. This action would include any COVID-19 funding opportunities and resulting procurements or contracts.
Any action requires the Chair and at least two of three Vice Chairs to approve, and the temporary authority will expire July 30, 2020.
Action Delegate temporary authority to the Board Chair and Vice Chairs acting together to authorize related grant agreements, procurements, contracts, or contract amendments, conditional about Board ratification at the next regularly scheduled Board meeting; and temporary authority to expire July 30, 2020.

VIII

System PerformanceGulf Coast Workforce Board
Performance Measures
October 2019 to February 2020
75.0%81.3%
28,500INA
37.0%32.3%
62.0%INA
3,300965
77.0%77.2%
Market
Share
Loyalty
New Jobs
Created
Employed
Earnings
Gains
Attain
Credential
Item 8aPage 1 of 2

System Performance
October 2019 to February 2020
Gulf Coast Workforce Board
Production Measures
Number of measures meeting or exceeding
Workforce
Measures that require additional focus
2521
81.4%
Employed Q4 Post Exit - WIOA
DW
86.9%
Employed Q2 Post Exit - WIOA
DW
78.3%
Credential Rate - WIOA DW
87.9%
Integrated English
Language/Civics
Item 8aPage 2 of 2

Item 8b
0.0% 20.0% 40.0% 60.0% 80.0% 100.0%
PEOPLE
EMPLOYERS
SYSTEM IT
BOARD ADMIN
Gulf Coast Workforce Financial Status ReportFor the 2 months ending February 29, 2020
Budget Expenses Target
$1,125,146
$1,719,694
$44,910,222
$46,089
$8,236,883
$10,700,000
$294,090,138
$715,082
$34,494,457
$7,507,520
$2,908,245 $1,719,694
System Expenses
FINANCIAL AID
OFFICE OPERATIONS
ADULT EDUCATION
EMPLOYER SERVICE
$313,742,103
$47,801,150
$-
$50,000,000
$100,000,000
$150,000,000
$200,000,000
$250,000,000
$300,000,000
$350,000,000
Workforce Revenue
YTD Revenue
TotalBudget

Item 8c Page 1 of 1
Workforce Solutions Operations Updates
• All local career offices are closed to public traffic, but we continue to promote our accessibility by telephone, email, and internet to all customers.
• Employer Service is also closed to public traffic, but the staff are available and working.
• All other parts of Workforce Solutions are up and working, including the Financial Aid Support Center and Payment Office. Adult education classes are migrating to online learning.
• We have job postings and continue to work with individuals who want or need to go to work and with the employers that are hiring.
• Most of the inquiries we receive through the offices are individuals calling about unemployment assistance.
• We continue to pay early education/childcare providers and are now able to offer financial assistance to essential workers for childcare.
• We are fielding media inquiries related to unemployment. All comments on unemployment claims are made by the Texas Workforce Commission, while Workforce Solutions addresses available service and advice for employers and prospective job candidates.

IX

Item 9a Page 1 of 23
Labor Market Information FEBRUARY 2020 Employment Data
HOUSTON-THE WOODLANDS-SUGAR LAND METROPOLITAN STATISTICAL AREA Visit our website at www.wrksolutions.com
Impacts of the COVID-19 Virus
The February employment survey was taken during the week that included February 12th, several weeks prior to the first reported COVID-19 case in the Houston area. Given that mandatory stay-at-home orders were not issued until late March, any substantial impacts will not be known until the release of April data on May 22nd.
Principle economist Parker Harvey provides a “rudimentary” basic baseline of what to expect going forward. The analysis looked at the three most recent employment disruptors: Hurricane Harvey, the collapse of oil prices beginning in 2014, and the great recession of 2008. A copy of Parker Harvey’s report is available for download at www.wrksolutions.com/localstats.
February 2020 increases reflected below are expected to be wiped out by job losses related to the COVID-19 outbreak.
The actual rate of unemployment in the Houston-The Woodlands-Sugar Land Metropolitan Statistical Area (H-W-S MSA) fell two-tenths of a percentage point to 3.9 percent, the lowest for the month of February since 2001. Over the previous year the number of individuals in the labor force in the H-W-S MSA increased by 63,114 while the number of unemployed declined by 1,074 driving the rate of unemployment down one-tenth of a percentage point. The rate of unemployment at the state and national level also fell two-tenths of a percentage points in February to 3.6 percent and 3.8 percent respectively, see figure 1.
Unemployment Rate (Actual)
FEB 2020 JAN 2020 FEB 2019 Civilian Labor Force 3,493,272 3,461,219 3,430,158 Total Employed 3,358,703 3,319,680 3,294,515 Unemployed 134,569 141,539 135,643 Unemployment Rate 3.9% 4.1% 4.0%
2
2.5
3
3.5
4
4.5
5
5.5
Jan-18
Feb-18
Mar-18
Apr-18
May-18
Jun-18
Jul-18
Aug-18
Sep-18
Oct-18
Nov-18
Dec-18
Jan-19
Feb-19
Mar-19
Apr-19
May-19
Jun-19
Jul-19
Aug-19
Sep-19
Oct-19
Nov-19
Dec-19
Jan-20
Feb-20
H-W-S MSA 4.9 4.7 4.5 4.2 4.1 4.6 4.5 4.4 4.1 3.9 3.8 4 4.4 4 3.7 3.3 3.4 4 4.1 4.1 3.7 3.6 3.7 3.6 4.1 3.9Texas 4.2 4.1 4 3.7 3.6 4.2 4.1 3.9 3.7 3.5 3.5 3.6 4.1 3.7 3.5 3 3.1 3.7 3.8 3.7 3.4 3.3 3.4 3.3 3.8 3.6U.S. 4.5 4.4 4.1 3.7 3.6 4.2 4.1 3.9 3.6 3.5 3.5 3.7 4.4 4.1 3.9 3.3 3.4 3.8 4.0 3.8 3.3 3.3 3.3 3.4 4.0 3.8
Figure 1. Rate of Unemployment - ActualH-W-S MSA Texas U.S.

Item 9a Page 2 of 23
The Texas Workforce Commission released annual benchmark revisions with the release of January data. Revised data indicate job growth was not as strong as first estimated with payrolls up 62,200 jobs over the year in December 2019, a difference of 25,800 fewer jobs added than original estimates. Revisions were widespread across industries resulting in a much different picture of year-over-year job growth by December 2019.
• Industry sectors with ties to oil and gas exploration and production received revisions indicating things were much weaker than originally estimated with Natural Resources and Mining as well as Manufacturing reporting year-over-year losses by December and Professional and Business Services reporting growth that was nearly halved
• Growth in Construction was slightly stronger overall. While growth in Specialty Trade Contractors was substantially lowered, Construction of Buildings was reporting an increase instead of a loss
• Growth in Trade, Transportation, and Utilities was weaker than originally estimated with Retail Trade reflecting deeper losses and Transportation, Warehousing, and Utilities reporting weaker gains
• Information was no longer reporting a year-over-year loss • Growth in Other Services was lowered substantially
A complete list of growth revisions can be found on pages 15 and 16. Supporting charts showing monthly comparison of original and revised estimates for industry sectors with most substantial revisions are found on pages 17 to 23.
Net Percent Net PercentTotal Nonfarm 88,000 2.8% 62,200 2.0% (25,800)
Mining and Logging 4,300 5.3% -1,900 -2.4% (6,200)Oil and Gas Extraction 3,300 9.0% 400 1.1% (2,900)Support Activities for Mining -1,600 -3.7% -2,500 -6.0% (900)
Construction 9,300 4.2% 12,200 5.3% 2,900Construction of Buildings -3,100 -5.5% 3,400 6.0% 6,500Heavy and Civil Engineering Construction 4,400 8.0% 5,600 9.6% 1,200Specialty Trade Contractors 8,000 7.1% 3,200 2.8% (4,800)
Manufacturing 6,700 2.8% -800 -0.3% (7,500)Trade, Transportation, and Utilities 10,400 1.6% 6,000 0.9% (4,400)
Wholesale Trade 3,200 1.9% 6,100 3.6% 2,900Retail Trade -100 0.0% -5,000 -1.6% (4,900)Transportation, Warehousing, and Utilities 7,300 4.6% 4,900 3.1% (2,400)
Information -1,900 -6.0% 700 2.2% 2,600Financial Activities 4,000 2.4% 4,000 2.4% 0Professional and Business Services 26,300 5.3% 13,600 2.7% (12,700)Educational and Health Services 10,300 2.6% 9,700 2.4% (600)Leisure and Hospitality 4,800 1.5% 7,200 2.2% 2,400Other Services 9,700 8.6% 3,700 3.3% (6,000)Government 4,100 1.0% 7,800 1.9% 3,700
Houston-The Woodlands-Sugar Land Metropolitan Statistical Area
December 2018 to December 2019
DifferenceOriginal Estimate Revised EstimateOver-the-Year Change Over-the-Year Change

Item 9a Page 3 of 23
Total Nonfarm Employment in the H-W-S MSA added 36,800 jobs over the month. February’s 1.2 percent increase was comparable to a 1.1 percent increase in 2019 and 1.3 percent increase in 2018. More than half of the increase was found in two industry sectors: Government, up 10,200 jobs as educational institutions boosted payrolls for the spring semester, and Leisure and Hospitality, up 8,500 jobs due to seasonal hiring. Substantial increases were also found in Financial Activities, Professional and Business Services, Construction, and Manufacturing. The only substantial declines were in Retail Trade, down 1,800 jobs, and Mining and Logging, down 900 jobs. Over-the-month changes for industry sectors can be seen in figure 2. For a complete list of February employment estimates see pages 13 & 14.
Total Nonfarm Employment in the H-W-S MSA increased by 68,900 jobs over the year in February with the pace of job at 2.2 percent, six-tenths of a percentage faster than 1.6 percent at the national level, see figure 3. Most industry sectors were reporting positive over-the-year growth with largest gains found in Education and Health Services, up 16,200 jobs, Professional and Business Services, up 14,500 jobs, and Leisure and Hospitality, up 12,200 jobs, see figure 4. Other Services added jobs at the fastest pace, up 5,500 jobs or 4.8 percent. Several industry sectors were reporting losses with Mining and Logging seeing the most substantial declines, down 5,600 jobs or 6.9 percent. Additional comments by super sector can be found beginning on page 6. Detailed data can be viewed on pages 13 & 14.
-900
5,000
2,900
600
-1,800
-600
200
-700
5,400 5,500
8,500
2,500
10,200
-1.2%
2.1%
1.3%
0.3%
-0.6%
-0.4%
0.6%
-0.4%
1.1% 1.3%
2.6%
2.1%
2.5%
Figure 2. Houston-The Woodlands-Sugar Land MSAMonth Change January 2020 to February 2020
*The Trade, Transportation, and Utilitis super sector is the aggregate of Wholesale Trade, Retail Trade, and Transportation, Warehousing, and Utilities.

Item 9a Page 4 of 23
Jun-07, 4.6%
Nov-09, -4.3%
Nov-12, 4.6%Dec-14, 4.0%
Oct-16, -0.3%
Jan-19, 3.0%
Feb-20, 2.2%Sep-05, 2.4%
Aug-09, -5.0%
Feb-15, 2.3%
Jan-19, 1.7%Feb-20, 1.6%
-6.0%
-5.0%
-4.0%
-3.0%
-2.0%
-1.0%
0.0%
1.0%
2.0%
3.0%
4.0%
5.0%
6.0%
Jan-
05
Jul-0
5
Jan-
06
Jul-0
6
Jan-
07
Jul-0
7
Jan-
08
Jul-0
8
Jan-
09
Jul-0
9
Jan-
10
Jul-1
0
Jan-
11
Jul-1
1
Jan-
12
Jul-1
2
Jan-
13
Jul-1
3
Jan-
14
Jul-1
4
Jan-
15
Jul-1
5
Jan-
16
Jul-1
6
Jan-
17
Jul-1
7
Jan-
18
Jul-1
8
Jan-
19
Jul-1
9
Jan-
20
Figure 3. Current Employment StatisticsActual Over-The-Year Increase/Decrease
H-W-S MSA U.S.
The Great Recession
Oil Price Crash
-5,600
9,700
-2,800
4,500
-2,500
6,200
700
3,000
14,50016,200
12,200
5,5007,300
-6.9%
4.2%
-1.2%
2.6%
-0.8%
4.1%
2.2%
1.8%
2.9%4.0%
3.7%
4.8%
1.7%
Figure 4. Houston-The Woodlands-Sugar Land MSAAnnual Change February 2019 to February 2020
*The Trade, Transportation, and Utilitis super sector is the aggregate of Wholesale Trade, Retail Trade, and Transportation, Warehousing, and Utilities.

Item 9a Page 5 of 23
Seasonally adjusted estimates for the H-W-S MSA and U.S. seen in figure 5 and 6 provide an additional view of growth-trends removing the erratic month-to-month seasonal patterns. On a seasonally adjusted basis, Total Nonfarm Employment was up 18,000 jobs over the month in February and 78,400 jobs over the year. The annual pace of job growth was 2.5 percent, nearly one full percentage-point faster than the nation’s 1.6 percent pace. Growth of Total Nonfarm Employment in the H-W-S MSA has also outperformed the nation over the long-term as well with payrolls up 21.1 percent above the prerecession high compared to 10.2 percent at the national level.
H-W-S MSARecovers All Jobs Lost
During the Recession by November 2011
U.S.Recovers All Jobs Lost
During the Recession by May 2014
100,000,000
110,000,000
120,000,000
130,000,000
140,000,000
150,000,000
160,000,000
170,000,000
2,000,000
2,200,000
2,400,000
2,600,000
2,800,000
3,000,000
3,200,000Ja
n-07
Jul-0
7
Jan-
08
Jul-0
8
Jan-
09
Jul-0
9
Jan-
10
Jul-1
0
Jan-
11
Jul-1
1
Jan-
12
Jul-1
2
Jan-
13
Jul-1
3
Jan-
14
Jul-1
4
Jan-
15
Jul-1
5
Jan-
16
Jul-1
6
Jan-
17
Jul-1
7
Jan-
18
Jul-1
8
Jan-
19
Jul-1
9
Jan-
20
Tota
l Non
agric
ultu
ral E
mpl
oym
ent
Figure 5. Total Non-farm Employment-Seasonally Adjusted
H-W-S MSA U.S.
U.S. RecessionBegins December 2007
U.S. RecessionEnds June 2009
H-W-S MSAUp 18,000
Over the MonthUp 2.5%% Over the Year
Up 21.1% AbovePre-Recession High
U.S. Up 273,000
Over the MonthUp 1.6% Over the Year
Up 10.2% Above Pre-Recession High
The GreatRecession

Item 9a Page 6 of 23
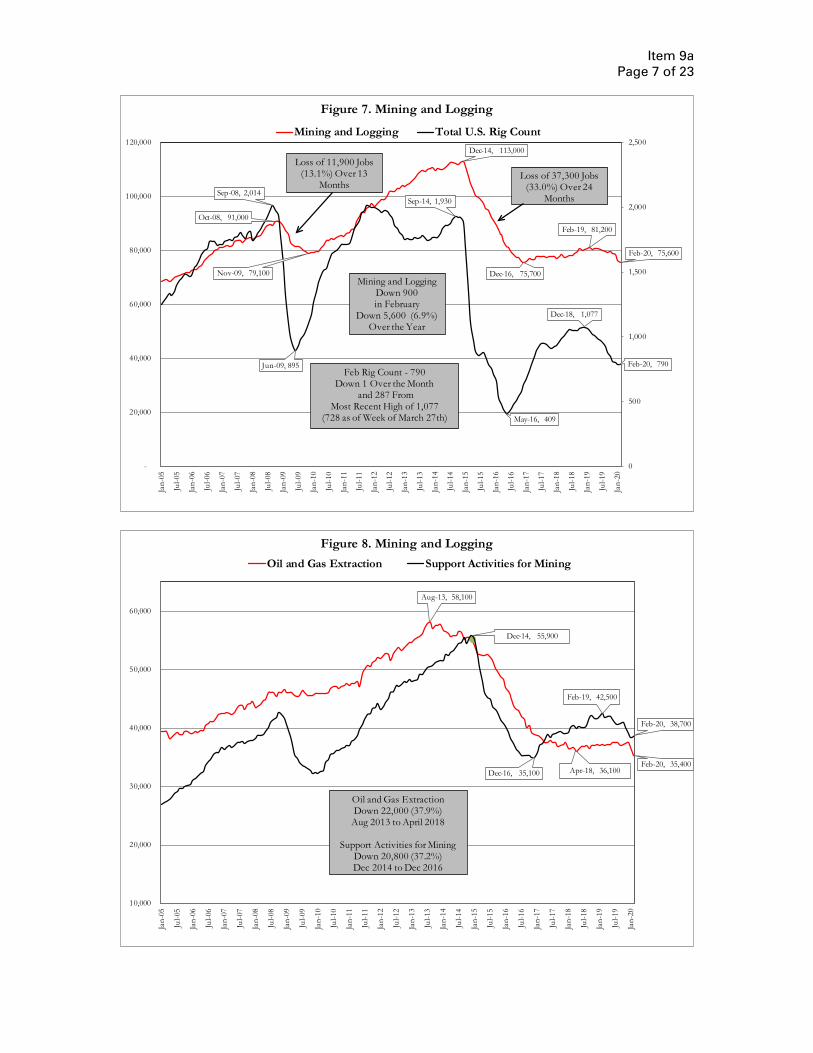
DETAILS BY SUPER SECTOR Mining and Logging, down 900 jobs in February, has suffered declines in eight of the last nine months. This month’s decline was driven by a loss of 1,300 jobs in Oil and Gas Extraction. Mining and Logging employment peaked one year ago at 81,200 in February 2019 and since accumulated a loss 5,600 jobs or 6.9 percent, see figure 7 and 8. Support Activities for Mining has suffered the largest declines, down, 3,800 jobs or 8.9 percent. Oil and Gas Extraction accounted for the remainder of the loss, down 1,800 jobs or 4.8 percent.
The average U.S. rig count fell for the fourteenth consecutive month in February, down by 1 to 790. One in four active rigs have been idled since December 2018, down 287 from 1,077. Combined impacts of an oil-price war between Russia and OPEC nations combined with the effects of COVID-19 have caused a collapse in oil prices by some 60 percent from the beginning of the year to an 18-year low of around $20 by the end of March. Recent events will undoubtedly drive the Texas oil and gas industry into a recession that will likely last until 2021.
Jun-07, 4.6%
Nov-09, -4.3%
Feb-13, 4.5%
Dec-14, 4.1%Sep-18, 3.1%
Feb-20, 2.5%Mar-06, 2.2%
Jul-09, -5.0%
Feb-15, 2.3%
Feb-20, 1.6%
-6.0%
-5.0%
-4.0%
-3.0%
-2.0%
-1.0%
0.0%
1.0%
2.0%
3.0%
4.0%
5.0%
6.0%
Jan-
05
Jul-0
5
Jan-
06
Jul-0
6
Jan-
07
Jul-0
7
Jan-
08
Jul-0
8
Jan-
09
Jul-0
9
Jan-
10
Jul-1
0
Jan-
11
Jul-1
1
Jan-
12
Jul-1
2
Jan-
13
Jul-1
3
Jan-
14
Jul-1
4
Jan-
15
Jul-1
5
Jan-
16
Jul-1
6
Jan-
17
Jul-1
7
Jan-
18
Jul-1
8
Jan-
19
Jul-1
9
Jan-
20
Figure 6. Current Employment StatisticsSeasonally Adjusted Over-The-Year Increase/Decrease
H-W-S MSA U.S.
The Great Recession
Oil Price Crash
Item 9a Page 7 of 23
Oct-08, 91,000
Nov-09, 79,100
Dec-14, 113,000
Dec-16, 75,700
Feb-19, 81,200
Feb-20, 75,600
Sep-08, 2,014
Jun-09, 895
Sep-14, 1,930
May-16, 409
Dec-18, 1,077
Feb-20, 790
0
500
1,000
1,500
2,000
2,500
-
20,000
40,000
60,000
80,000
100,000
120,000
Jan-
05
Jul-0
5
Jan-
06
Jul-0
6
Jan-
07
Jul-0
7
Jan-
08
Jul-0
8
Jan-
09
Jul-0
9
Jan-
10
Jul-1
0
Jan-
11
Jul-1
1
Jan-
12
Jul-1
2
Jan-
13
Jul-1
3
Jan-
14
Jul-1
4
Jan-
15
Jul-1
5
Jan-
16
Jul-1
6
Jan-
17
Jul-1
7
Jan-
18
Jul-1
8
Jan-
19
Jul-1
9
Jan-
20
Figure 7. Mining and Logging
Mining and Logging Total U.S. Rig Count
Feb Rig Count - 790Down 1 Over the Month
and 287 From Most Recent High of 1,077
(728 as of Week of March 27th)
Loss of 11,900 Jobs(13.1%) Over 13
MonthsLoss of 37,300 Jobs
(33.0%) Over 24 Months
Mining and LoggingDown 900 in February
Down 5,600 (6.9%) Over the Year
Aug-13, 58,100
Apr-18, 36,100 Feb-20, 35,400
Dec-14, 55,900
Dec-16, 35,100
Feb-19, 42,500
Feb-20, 38,700
10,000
20,000
30,000
40,000
50,000
60,000
Jan-
05
Jul-0
5
Jan-
06
Jul-0
6
Jan-
07
Jul-0
7
Jan-
08
Jul-0
8
Jan-
09
Jul-0
9
Jan-
10
Jul-1
0
Jan-
11
Jul-1
1
Jan-
12
Jul-1
2
Jan-
13
Jul-1
3
Jan-
14
Jul-1
4
Jan-
15
Jul-1
5
Jan-
16
Jul-1
6
Jan-
17
Jul-1
7
Jan-
18
Jul-1
8
Jan-
19
Jul-1
9
Jan-
20
Figure 8. Mining and Logging Oil and Gas Extraction Support Activities for Mining
Oil and Gas ExtractionDown 22,000 (37.9%)
Aug 2013 to April 2018
Support Activities for MiningDown 20,800 (37.2%)Dec 2014 to Dec 2016

Item 9a Page 8 of 23
Construction added 5,000 jobs in February. More than half of the increase was in Construction of Buildings, up 2,700 jobs. The pace of job growth in Construction peaked one year ago at 7.8 percent, see figure 9. The pace of job growth has since been on the decline resting at 4.2 percent in February, up 9,200 jobs. Most of the increase was found in Construction of Buildings, up 4,000 jobs or 7.0 percent, and Heavy and Civil Engineering Construction, up 5,500 jobs or 9.1 percent. Specialty Trade Contractors were up a mere 200 jobs over the year in February due to recent declines, see figure 10.
Jun-07, 9.8%
Nov-09, -16.1%
Dec-14, 10.3%
Jul-17, -3.8%
Feb-19, 7.8%
Feb-20, 4.2%
Jan-
06
Jul-0
6
Jan-
07
Jul-0
7
Jan-
08
Jul-0
8
Jan-
09
Jul-0
9
Jan-
10
Jul-1
0
Jan-
11
Jul-1
1
Jan-
12
Jul-1
2
Jan-
13
Jul-1
3
Jan-
14
Jul-1
4
Jan-
15
Jul-1
5
Jan-
16
Jul-1
6
Jan-
17
Jul-1
7
Jan-
18
Jul-1
8
Jan-
19
Jul-1
9
Jan-
20-20.0%
-15.0%
-10.0%
-5.0%
0.0%
5.0%
10.0%
15.0%
Figure 9. ConstructionOver-the-Year Change

Item 9a Page 9 of 23
Manufacturing payrolls were up 2,900 jobs in February. Gains were shared among Durable Goods Manufacturing, up 1,200 jobs, and Non-durable Goods Manufacturing, up 1,700 jobs. Manufacturing was reporting a loss of 2,800 jobs over the year in February, down 1.2 percent. The loss was shared among Durable Goods Manufacturing and Non-durable Goods Manufacturing. Durable Goods Manufacturing was down 1,400 jobs or 0.9 percent over the year. Payrolls in Durable Goods Manufacturing peaked in July 2019 and have since been on the decline as oil and gas exploration related demand dry up due to declining oil prices, see figure 11. Non-durable Goods Manufacturing was down 1,400 jobs or 1.6 percent over the year. Payrolls in Non-durable Goods Manufacturing began a gradual decline during the second half of 2019. The Houston Purchasing Managers Index was 50.2 in February, down from 52.4 in January. The Houston PMI indicates likely shifts in production three or four months in advance. Readings over 50 generally indicate production expansion over the near term, while readings below 50 show coming contraction. Combined impacts of an oil-price war between Russia and OPEC nations combined with COVID-19 and their effects on consumption will unquestionably accelerate job losses in Manufacturing throughout the remainder of the year.
Jan-
17Fe
b-17
Mar
-17
Apr
-17
May
-17
Jun-
17Ju
l-17
Aug
-17
Sep-
17O
ct-1
7N
ov-1
7D
ec-1
7Ja
n-18
Feb-
18M
ar-1
8A
pr-1
8M
ay-1
8Ju
n-18
Jul-1
8A
ug-1
8Se
p-18
Oct
-18
Nov
-18
Dec
-18
Jan-
19Fe
b-19
Mar
-19
Apr
-19
May
-19
Jun-
19Ju
l-19
Aug
-19
Sep-
19O
ct-1
9N
ov-1
9D
ec-1
9Ja
n-20
Feb-
20
(8,000)
(6,000)
(4,000)
(2,000)
-
2,000
4,000
6,000
8,000
10,000
Figure 10. ConstructionOver-the-Year Change
Construction of BuildingsSpecialty Trade ContractorsHeavy and Civil Engineering Construction
Heavy and Civil Enengineering Const
Up 5,500 (9.1%) OTY
Construction of Buildings
Up 4,000 (7.0%) OTY
Specialty Trade Contractors
Up 200 (0.2%) OTY

Item 9a Page 10 of 23
.
Trade Transportation, Warehousing & Utilities was down 1,800 jobs in February. Most of the decline was in Retail Trade as retailers continue to trim payrolls following the busy holiday season, down 1,800 jobs. In other areas, an increase of 600 jobs in Wholesale Trade was offset by a loss of 600 jobs in Transportation, Warehousing, and Utilities. Trade, Transportation, Warehousing & Utilities was up 8,200 jobs over the year with the pace of job growth at 1.3 percent. Strongest growth was in Transportation, Warehousing and Utilities, up 6,200 jobs or 4.1 percent. Wholesale Trade also managed a substantial increase of 4,500 jobs over the year, up 2.6 percent. The pace of declines in Retail Trade peaked in November 2019 at 2.0 percent, down 6,300 jobs, and while it was still reporting declines it has since improved to a loss of 2,500 jobs, down 0.8 percent. While declines were found across most retail sectors, the bulk have been in Clothing and Clothing Accessories Stores, down 1,700 jobs or 5.8 percent. The only retail sector to report an increase was Motor Vehicles and Parts Dealers, up 800 jobs or 1.0 percent. As with other industry sectors, COVID-19 will have a large impact on the super sector. As stay at home orders are enacted some retailers that provide day-to-day necessities are seeing increased demand but many others not providing necessities are getting hit hard being forced to shut their doors.
Aug-08, 161,400
Jan-10, 137,800
Dec-14, 180,900
Nov-16, 134,200
Jul-19, 152,100 Feb-20, 148,900
Sep-08, 2,014
Jun-09, 895
Sep-14, 1,930
Feb Rig Count - 790Down 1 Over the Month
and 287 From Most Recent High of 1,077
(728 as of Week of March 27th)Jun-16, 417
Dec-18, 1,077 Feb-20, 790
200
700
1,200
1,700
2,200
100,000
110,000
120,000
130,000
140,000
150,000
160,000
170,000
180,000
190,000
Jan-
05
Jul-0
5
Jan-
06
Jul-0
6
Jan-
07
Jul-0
7
Jan-
08
Jul-0
8
Jan-
09
Jul-0
9
Jan-
10
Jul-1
0
Jan-
11
Jul-1
1
Jan-
12
Jul-1
2
Jan-
13
Jul-1
3
Jan-
14
Jul-1
4
Jan-
15
Jul-1
5
Jan-
16
Jul-1
6
Jan-
17
Jul-1
7
Jan-
18
Jul-1
8
Jan-
19
Jul-1
9
Jan-
20
Figure 11. Durable Goods ManufacturingDurable Goods Manufacturing Total U.S. Rig Count
Loss of 23,600 Jobs(14.6%) Over 17 Months
Loss of 46,700 Jobs(25.8%)
Over 23 Months
Down 1,400 Jobs0.9% Over the Year

Item 9a Page 11 of 23
Information payrolls were up 700 jobs or 2.2 percent over the year in February. Some forty-two percent of the MSA’s employment in Information resides in Telecommunications where payrolls were unchanged over the year. Increases were in areas such as newspaper and periodical publishing, software publishing, motion picture and sound recording, and data processing hosting and related services. Financial Activities reported its first February loss since 2009 reducing payrolls by 700 jobs. The decline was driven by a loss of 800 jobs in Real Estate and Rental and Leasing. The pace of job growth in Financial Activities fell one full percentage point to 1.8 percent as result of February’s loss, up 3,000 jobs. The largest contributor to the increase was Real Estate and Rental and Leasing, up 2,200 jobs or 3.4 percent, followed by Insurance Carriers and Related Activities, up 1,300 jobs or 3.4 percent. Credit Intermediation and Related Activities reported the only decline, down 500 jobs or 1.1 percent over the year.
Professional and Business Services added 5,400 jobs in February. The 1.1 percent increase was slightly stronger than the historical average of 1.0 percent. Administrative and Support and Waste Management and Remediation Services was the largest contributor to the increase, up 5,100 jobs. While the Professional, Scientific, and Technical Services sector only managed an overall net increase of 100 jobs in February, several of its sub-sectors reported gains including Accounting, Tax Preparation, Bookkeeping, and Payroll Services, up 800 jobs as business added staff to assist with the busy tax season, and Architectural, Engineering, and Related Services, up 400 jobs. Losses within Professional, Scientific, and Technical Services were in undefined areas therefore not identifiable. Professional and Business Services was the second largest contributor to over-the-year job growth in the H-W-S MSA, up 14,500 jobs or 2.9 percent. Job gains were found across many industry sectors with most of the growth in Professional, Scientific, and Technical Services, up 12,100 jobs. Within the Professional, Scientific, and Technical Services sector Architectural, Engineering, and Related Services reported the strongest increase, up 4,100 jobs or 5.8 percent with strong gains also found in Accounting, Tax Preparation, Bookkeeping, and Payroll Services, up 1,400 jobs or 4.9 percent, and Computer Systems Design and Related Services, up 1,600 jobs or 4.7 percent. Administrative and Support and Waste Management and Remediation Services also managed a net increase of 4,000 jobs over the year even after accounting for a loss of 3,500 jobs in Employment Services. Lastly, Management of Companies and Enterprises suffered a loss of 1,600 jobs over the year, down 3.4 percent. Education and Health Services was added 5,500 jobs over the month. While February’s 1.3 percent increase was much stronger the historical average of 0.6 percent it was in line with a 1.1 percent average of the last three years. While Educational Services incurred the strongest gain, up 2,100 jobs or 3.3 percent, Health Care and Social Assistance was the largest contributor to the increase, 3,400 jobs or 1.0 percent. Education and Health Services was the largest contributor to job growth in the H-W-W MSA adding 16,200 jobs over the year. The 4.0 percent increase was the fastest pace of job growth the super sector has seen since September 2015. Most of the new jobs were found in Health Care and Social Assistance, up 14,400 jobs or 4.3 percent. Educational Services was up 1,800 jobs or 2.8 percent over the year.

Item 9a Page 12 of 23
Leisure and Hospitality added 8,500 jobs over the month. The 2.6 percent increase was one of the strongest February increases on record and driven by gains in Food Services and Drinking Places, up 7,200 jobs. Leisure and Hospitality added 12,200 jobs over the year. The pace of job growth in the super sector rose to 3.7 percent, its fastest pace since August 2016. Most of new jobs were created in Food Services and Drinking Places, up 8,900 jobs or 3.4 percent. Arts, Entertainment, and Recreation was the second largest contributor to growth, up 2,500 jobs, at the brisk pace of 7.3 percent. COVID-19 will have some of its largest impact on the Leisure and Hospitality super sector with stay at home orders shuttering the doors of many businesses and greatly reducing the profitability of restaurants that are limited to delivery, curbside, and drive thru services. Other Services added 2,500 jobs over the month. February’s 2.1 percent increase was slightly stronger than a 1.8 percent average over the last three years. The super sector was up 5,500 jobs or 4.8 percent over the year. Other Services is comprised of personal care services, dry cleaning and laundry services, various repair service companies (industrial equipment, mining machinery and equipment), as well as religious and social advocacy organizations and others. Government added 10,200 jobs in February as educational institutions boosted payrolls for the spring semester. Most of the increase was in Local Government Educational Services, up 9,100 jobs. Government added 7,300 jobs over the year with the pace of job growth at 1.7 percent. More than half of the increase was in Local Government, up 4,900 jobs, largely driven by gains in Local Government Educational Services, up 3,300 jobs.

Item 9a Page 13 of 23
NONAGRICULTURAL EMPLOYMENTHouston-The Woodlands-Sugar Land MSA FEB 2020 JAN 2020 FEB 2019 Net Percent Net PercentTotal Nonfarm 3,201,800 3,165,000 3,132,900 36,800 1.2% 68,900 2.2%.Total Private 2,775,600 2,749,000 2,714,000 26,600 1.0% 61,600 2.3%.Goods Producing 551,700 544,700 550,400 7,000 1.3% 1,300 0.2%..Mining, Logging and Construction 318,800 314,700 314,700 4,100 1.3% 4,100 1.3%...Mining and Logging 75,600 76,500 81,200 -900 -1.2% -5,600 -6.9%.....Oil and Gas Extraction 35,400 36,700 37,200 -1,300 -3.5% -1,800 -4.8%.....Support Activities for Mining 38,700 38,400 42,500 300 0.8% -3,800 -8.9%...Construction 243,200 238,200 233,500 5,000 2.1% 9,700 4.2%.....Construction of Buildings 61,200 58,500 57,200 2,700 4.6% 4,000 7.0%.....Heavy and Civil Engineering Construction 65,700 64,200 60,200 1,500 2.3% 5,500 9.1%.....Specialty Trade Contractors 116,300 115,500 116,100 800 0.7% 200 0.2%..Manufacturing 232,900 230,000 235,700 2,900 1.3% -2,800 -1.2%...Durable Goods 148,900 147,700 150,300 1,200 0.8% -1,400 -0.9%....Fabricated Metal Product Manufacturing 52,400 52,200 55,000 200 0.4% -2,600 -4.7%....Machinery Manufacturing 48,600 48,500 46,400 100 0.2% 2,200 4.7%.....Agriculture, Construction, and Mining Machinery Manufacturing 29,900 30,100 29,900 -200 -0.7% 0 0.0%....Computer and Electronic Product Manufacturing 13,600 13,500 13,300 100 0.7% 300 2.3%...Non-Durable Goods 84,000 82,300 85,400 1,700 2.1% -1,400 -1.6%....Petroleum and Coal Products Manufacturing 10,700 10,600 10,200 100 0.9% 500 4.9%....Chemical Manufacturing 40,400 40,200 40,100 200 0.5% 300 0.7%.Service-Providing 2,650,100 2,620,300 2,582,500 29,800 1.1% 67,600 2.6%.Private Service Providing 2,223,900 2,204,300 2,163,600 19,600 0.9% 60,300 2.8%..Trade, Transportation, and Utilities 634,100 635,900 625,900 -1,800 -0.3% 8,200 1.3%...Wholesale Trade 176,300 175,700 171,800 600 0.3% 4,500 2.6%....Merchant Wholesalers, Durable Goods 108,800 107,800 107,400 1,000 0.9% 1,400 1.3%.....Professional and Commercial Equipment and Supplies Merchant Wholesalers 18,000 18,000 17,700 0 0.0% 300 1.7%....Merchant Wholesalers, Nondurable Goods 52,600 52,500 52,300 100 0.2% 300 0.6%...Retail Trade 300,400 302,200 302,900 -1,800 -0.6% -2,500 -0.8%....Motor Vehicle and Parts Dealers 43,400 43,100 42,600 300 0.7% 800 1.9%....Building Material and Garden Equipment and Supplies Dealers 21,100 20,700 21,600 400 1.9% -500 -2.3%....Food and Beverage Stores 66,600 66,400 66,800 200 0.3% -200 -0.3%....Health and Personal Care Stores 19,100 19,200 19,300 -100 -0.5% -200 -1.0%....Clothing and Clothing Accessories Stores 27,800 29,200 29,500 -1,400 -4.8% -1,700 -5.8%....General Merchandise Stores 56,600 58,100 57,200 -1,500 -2.6% -600 -1.0%.....Department Stores 18,900 20,200 19,300 -1,300 -6.4% -400 -2.1%.....General Merchandise Stores, including Warehouse Clubs and Supercenters 37,700 37,900 37,900 -200 -0.5% -200 -0.5%...Transportation, Warehousing, and Utilities 157,400 158,000 151,200 -600 -0.4% 6,200 4.1%....Utilities 17,200 17,100 17,200 100 0.6% 0 0.0%.....Air Transportation 20,100 20,200 20,100 -100 -0.5% 0 0.0%.....Truck Transportation 28,000 27,900 28,100 100 0.4% -100 -0.4%.....Pipeline Transportation 12,200 12,100 11,900 100 0.8% 300 2.5%..Information 32,700 32,500 32,000 200 0.6% 700 2.2%....Telecommunications 13,800 13,900 13,800 -100 -0.7% 0 0.0%..Financial Activities 167,400 168,100 164,400 -700 -0.4% 3,000 1.8%...Finance and Insurance 103,300 103,200 102,500 100 0.1% 800 0.8%....Credit Intermediation and Related Activities including Monetary Authorities - 43,500 43,700 44,000 -200 -0.5% -500 -1.1%.....Depository Credit Intermediation including Monetary Authorities - Central B 30,300 30,300 30,200 0 0.0% 100 0.3%
....Financial Investments and Related Activities including Financial Vehicles 20,700 20,800 20,700 -100 -0.5% 0 0.0%
....Insurance Carriers and Related Activities 39,100 38,700 37,800 400 1.0% 1,300 3.4%
...Real Estate and Rental and Leasing 64,100 64,900 61,900 -800 -1.2% 2,200 3.6%
Month Change Year Change

Item 9a Page 14 of 23
Houston-The Woodlands-Sugar Land MSA: Includes Austin, Brazoria, Chambers, Ft. Bend, Galveston, Harris, Liberty, Montgomery, and Waller Counties. All Data is Subject to Revision. Sources: U.S. Department of Labor, BLS, Texas Workforce Commission, Institute for Supply Management, Baker Hughes, and The Federal Reserve Bank of Dallas.
Houston-The Woodlands-Sugar Land MSA FEB 2020 JAN 2020 FEB 2019 Net Percent Net Percent..Professional and Business Services 514,900 509,500 500,400 5,400 1.1% 14,500 2.9%...Professional, Scientific, and Technical Services 249,100 249,000 237,000 100 0.0% 12,100 5.1%.....Legal Services 27,200 27,000 26,700 200 0.7% 500 1.9%.....Accounting, Tax Preparation, Bookkeeping, and Payroll Services 29,800 29,000 28,400 800 2.8% 1,400 4.9%.....Architectural, Engineering, and Related Services 75,200 74,800 71,100 400 0.5% 4,100 5.8%.....Computer Systems Design and Related Services 35,700 35,700 34,100 0 0.0% 1,600 4.7%...Management of Companies and Enterprises 45,900 45,700 47,500 200 0.4% -1,600 -3.4%...Administrative and Support and Waste Management and Remediation Services 219,900 214,800 215,900 5,100 2.4% 4,000 1.9%....Administrative and Support Services 206,300 203,300 204,500 3,000 1.5% 1,800 0.9%.....Employment Services 75,400 75,000 78,900 400 0.5% -3,500 -4.4%.....Services to Buildings and Dwellings 50,700 49,600 49,500 1,100 2.2% 1,200 2.4%..Education and Health Services 416,600 411,100 400,400 5,500 1.3% 16,200 4.0%...Educational Services 65,100 63,000 63,300 2,100 3.3% 1,800 2.8%...Health Care and Social Assistance 351,500 348,100 337,100 3,400 1.0% 14,400 4.3%....Ambulatory Health Care Services 167,300 166,900 163,700 400 0.2% 3,600 2.2%....Hospitals 88,900 88,600 86,500 300 0.3% 2,400 2.8%..Leisure and Hospitality 338,200 329,700 326,000 8,500 2.6% 12,200 3.7%...Arts, Entertainment, and Recreation 36,800 36,000 34,300 800 2.2% 2,500 7.3%...Accommodation and Food Services 301,400 293,700 291,700 7,700 2.6% 9,700 3.3%....Accommodation 28,900 28,400 28,100 500 1.8% 800 2.8%....Food Services and Drinking Places 272,500 265,300 263,600 7,200 2.7% 8,900 3.4%..Other Services 120,000 117,500 114,500 2,500 2.1% 5,500 4.8%..Government 426,200 416,000 418,900 10,200 2.5% 7,300 1.7%...Federal Government 30,300 30,200 29,500 100 0.3% 800 2.7%...State Government 89,500 88,600 87,900 900 1.0% 1,600 1.8%....State Government Educational Services 51,800 51,100 52,600 700 1.4% -800 -1.5%...Local Government 306,400 297,200 301,500 9,200 3.1% 4,900 1.6%....Local Government Educational Services 214,000 204,900 210,700 9,100 4.4% 3,300 1.6%
UNEMPLOYMENT RATE FEB 2020 JAN 2020 FEB 2019H-W-S MSA 3.9 4.1 4.0Texas (Actual) 3.6 3.8 3.7United States (Actual) 3.8 4.0 4.1

Item 9a Page 15 of 23
December 2018 to December 2019 DEC 2019NONAGRICULTURAL EMPLOYMENT Growth RevisionHouston-The Woodlands-Sugar Land MSA Net Percent Net Percent Up or Down Total Nonfarm 88,000 2.8% 62,200 2.0% -25,800Total Private 83,900 3.1% 54,400 2.0% -29,500Goods Producing 20,300 3.8% 9,500 1.7% -10,800..Mining, Logging, and Construction 13,600 4.5% 10,300 3.3% -3,300.Mining and Logging 4,300 5.3% -1,900 -2.4% -6,200...Oil and Gas Extraction 3,300 9.0% 400 1.1% -2,900...Support Activities for Mining -1,600 -3.7% -2,500 -6.0% -900.Construction 9,300 4.2% 12,200 5.3% 2,900..Construction of Buildings -3,100 -5.5% 3,400 6.0% 6,500..Heavy and Civil Engineering Construction 4,400 8.0% 5,600 9.6% 1,200..Specialty Trade Contractors 8,000 7.1% 3,200 2.8% -4,800.Manufacturing 6,700 2.8% -800 -0.3% -7,500..Durable Goods 4,500 3.0% 300 0.2% -4,200...Fabricated Metal Product Manufacturing 300 0.5% -1,300 -2.4% -1,600...Machinery Manufacturing 3,100 6.6% 2,100 4.5% -1,000....Agriculture, Construction, and Mining Machinery Manufacturing 1,500 4.9% -100 -0.3% -1,600...Computer and Electronic Product Manufacturing 0 0.0% 200 1.5% 200..Non-Durable Goods 2,200 2.6% -1,100 -1.3% -3,300...Petroleum and Coal Products Manufacturing 2,000 20.0% 300 2.9% -1,700...Chemical Manufacturing 500 1.2% 500 1.3% 0Service Providing 67,700 2.6% 52,700 2.0% -15,000.Private Service Providing 63,600 2.9% 44,900 2.1% -18,700..Trade, Transportation, and Utilities 10,400 1.6% 6,000 0.9% -4,400...Wholesale Trade 3,200 1.9% 6,100 3.6% 2,900....Merchant Wholesalers, Durable Goods 800 0.7% 2,200 2.1% 1,400.....Professional and Commercial Equipment and Supplies Merchant Wholesalers 800 4.5% 300 1.7% -500....Merchant Wholesalers, Nondurable Goods -1,200 -2.2% 500 1.0% 1,700...Retail Trade -100 0.0% -5,000 -1.6% -4,900....Motor Vehicle and Parts Dealers 900 2.2% 1,000 2.4% 100....Building Material and Garden Equipment and Supplies Dealers -800 -3.7% -1,000 -4.6% -200....Food and Beverage Stores 1,400 2.1% -200 -0.3% -1,600....Health and Personal Care Stores 100 0.5% -500 -2.4% -600....Clothing and Clothing Accessories Stores -800 -2.4% -1,800 -5.2% -1,000....General Merchandise Stores 100 0.2% -700 -1.1% -800.....Department Stores 700 3.1% -200 -0.9% -900.....General Merchandise Stores, including Warehouse Clubs and Supercenters -600 -1.4% -500 -1.2% 100...Transportation, Warehousing, and Utilities 7,300 4.6% 4,900 3.1% -2,400....Utilities 100 0.6% 100 0.6% 0.....Air Transportation 300 1.5% 200 1.0% -100.....Truck Transportation 1,500 5.3% 100 0.4% -1,400.....Pipeline Transportation -300 -2.7% 300 2.5% 600..Information -1,900 -6.0% 700 2.2% 2,600...Telecommunications -400 -3.0% 300 2.2% 700
Original Growth Revised GrowthYear Change Year Change

Item 9a Page 16 of 23
December 2018 to December 2019 DEC 2019NONAGRICULTURAL EMPLOYMENT Growth RevisionHouston-The Woodlands-Sugar Land MSA Net Percent Net Percent Up or Down ..Financial Activities 4,000 2.4% 4,000 2.4% 0...Finance and Insurance 2,300 2.2% 1,000 1.0% -1,300....Credit Intermediation and Related Activities 800 1.8% -200 -0.5% -1,000.....Depository Credit Intermediation 800 2.7% 500 1.7% -300....Financial Investments and Related Activities including Financial Vehicles 600 2.8% -100 -0.5% -700....Insurance Carriers and Related Activities 900 2.4% 1,300 3.4% 400...Real Estate and Rental and Leasing 1,700 2.8% 3,000 4.9% 1,300..Professional and Business Services 26,300 5.3% 13,600 2.7% -12,700...Professional, Scientific, and Technical Services 24,000 10.4% 12,900 5.5% -11,100....Legal Services 500 1.9% 600 2.2% 100....Accounting, Tax Preparation, Bookkeeping, and Payroll Services 200 0.8% 1,000 3.8% 800....Architectural, Engineering, and Related Services 6,400 9.0% 4,100 5.8% -2,300....Computer Systems Design and Related Services 1,500 4.5% 1,700 5.0% 200...Management of Companies and Enterprises -600 -1.3% -1,000 -2.1% -400...Administrative and Support and Waste Management and Remediation Services 2,900 1.3% 1,700 0.8% -1,200....Administrative and Support Services 1,500 0.7% 700 0.3% -800.....Employment Services -1,600 -1.9% -4,700 -5.8% -3,100.....Services to Buildings and Dwellings 600 1.2% 1,600 3.3% 1,000..Educational and Health Services 10,300 2.6% 9,700 2.4% -600...Educational Services 1,800 2.9% 1,900 3.0% 100...Health Care and Social Assistance 8,500 2.5% 7,800 2.3% -700....Ambulatory Health Care Services 6,300 3.9% 1,700 1.0% -4,600....Hospitals 1,800 2.1% 2,200 2.5% 400..Leisure and Hospitality 4,800 1.5% 7,200 2.2% 2,400...Arts, Entertainment, and Recreation 200 0.6% 2,900 8.5% 2,700...Accommodation and Food Services 4,600 1.6% 4,300 1.5% -300....Accommodation 700 2.5% 800 2.9% 100....Food Services and Drinking Places 3,900 1.5% 3,500 1.3% -400..Other Services 9,700 8.6% 3,700 3.3% -6,000Government 4,100 1.0% 7,800 1.9% 3,700.Federal Government 700 2.3% 1,000 3.3% 300.State Government 900 1.0% 1,900 2.2% 1,000..State Government Educational Services 600 1.2% -500 -1.0% -1,100.Local Government 2,500 0.8% 4,900 1.6% 2,400..Local Government Educational Services 1,300 0.6% 3,300 1.6% 2,000
Original Growth Revised GrowthYear Change Year Change

Item 9a Page 17 of 23
Dec-19, 3,209,500
Dec-19, 3,225,700
2,900,000
2,950,000
3,000,000
3,050,000
3,100,000
3,150,000
3,200,000
3,250,000
Jan-
18
Feb-
18
Ma
r-18
Apr
-18
Ma
y-18
Jun-
18
Jul-1
8
Aug
-18
Sep
-18
Oct
-18
Nov
-18
Dec
-18
Jan-
19
Feb-
19
Ma
r-19
Apr
-19
Ma
y-19
Jun-
19
Jul-1
9
Aug
-19
Sep
-19
Oct
-19
Nov
-19
Dec
-19
Total Nonfarm Revised Estimate Original Estimate
December 2019Total Revision
Number Percent(16,200) -0.5%
Dec-19, 78,500
Dec-19, 85,300
70,000
72,000
74,000
76,000
78,000
80,000
82,000
84,000
86,000
88,000
90,000
Jan-
18
Feb-
18
Ma
r-18
Apr
-18
Ma
y-18
Jun-
18
Jul-1
8
Aug
-18
Sep
-18
Oct
-18
Nov
-18
Dec
-18
Jan-
19
Feb-
19
Ma
r-19
Apr
-19
Ma
y-19
Jun-
19
Jul-1
9
Aug
-19
Sep
-19
Oct
-19
Nov
-19
Dec
-19
Mining and Logging Revised Estimate Original Estimate
December 2019Total Revision
Number Percent(6,800) -8.7%

Item 9a Page 18 of 23
Dec-19, 234,900
Dec-19, 242,500
210,000
215,000
220,000
225,000
230,000
235,000
240,000
245,000
Jan-
18
Feb-
18
Ma
r-18
Apr
-18
Ma
y-18
Jun-
18
Jul-1
8
Aug
-18
Sep
-18
Oct
-18
Nov
-18
Dec
-18
Jan-
19
Feb-
19
Ma
r-19
Apr
-19
Ma
y-19
Jun-
19
Jul-1
9
Aug
-19
Sep
-19
Oct
-19
Nov
-19
Dec
-19
Manufacturing Revised Estimate Original Estimate
December 2019Total Revision
Number Percent(7,600) -3.2%
Dec-19, 512,700
Dec-19, 526,800
450,000
460,000
470,000
480,000
490,000
500,000
510,000
520,000
530,000
540,000
Jan-
18
Feb-
18
Ma
r-18
Apr
-18
Ma
y-18
Jun-
18
Jul-1
8
Aug
-18
Sep
-18
Oct
-18
Nov
-18
Dec
-18
Jan-
19
Feb-
19
Ma
r-19
Apr
-19
Ma
y-19
Jun-
19
Jul-1
9
Aug
-19
Sep
-19
Oct
-19
Nov
-19
Dec
-19
Professional and Business Services Revised Estimate Original Estimate
December 2019Total Revision
Number Percent(14,100) -2.8%

Item 9a Page 19 of 23
Dec-19, 241,600Dec-19, 232,200
190,000
200,000
210,000
220,000
230,000
240,000
250,000
Jan-
18
Feb-
18
Ma
r-18
Apr
-18
Ma
y-18
Jun-
18
Jul-1
8
Aug
-18
Sep
-18
Oct
-18
Nov
-18
Dec
-18
Jan-
19
Feb-
19
Ma
r-19
Apr
-19
Ma
y-19
Jun-
19
Jul-1
9
Aug
-19
Sep
-19
Oct
-19
Nov
-19
Dec
-19
Construction Revised Estimate Original Estimate
December 2019Total Revision
Number Percent9,400 3.9%
Dec-19, 59,700
Dec-19, 53,100
46,000
48,000
50,000
52,000
54,000
56,000
58,000
60,000
62,000
Jan-
18
Feb-
18
Ma
r-18
Apr
-18
Ma
y-18
Jun-
18
Jul-1
8
Aug
-18
Sep
-18
Oct
-18
Nov
-18
Dec
-18
Jan-
19
Feb-
19
Ma
r-19
Apr
-19
Ma
y-19
Jun-
19
Jul-1
9
Aug
-19
Sep
-19
Oct
-19
Nov
-19
Dec
-19
Construction of Buildings Revised Estimate Original Estimate
December 2019Total Revision
Number Percent6,600 11.1
%

Item 9a Page 20 of 23
Dec-19, 64,000
Dec-19, 59,200
30,000
35,000
40,000
45,000
50,000
55,000
60,000
65,000
70,000
Jan-
18
Feb-
18
Ma
r-18
Apr
-18
Ma
y-18
Jun-
18
Jul-1
8
Aug
-18
Sep
-18
Oct
-18
Nov
-18
Dec
-18
Jan-
19
Feb-
19
Ma
r-19
Apr
-19
Ma
y-19
Jun-
19
Jul-1
9
Aug
-19
Sep
-19
Oct
-19
Nov
-19
Dec
-19
Heavy and Civil Engineering Construction Revised Estimate Original Estimate
December 2019Total Revision
Number Percent4,800 7.5%
Dec-19, 117,900
Dec-19, 119,900
102,000
104,000
106,000
108,000
110,000
112,000
114,000
116,000
118,000
120,000
122,000
Jan-
18
Feb-
18
Ma
r-18
Apr
-18
Ma
y-18
Jun-
18
Jul-1
8
Aug
-18
Sep
-18
Oct
-18
Nov
-18
Dec
-18
Jan-
19
Feb-
19
Ma
r-19
Apr
-19
Ma
y-19
Jun-
19
Jul-1
9
Aug
-19
Sep
-19
Oct
-19
Nov
-19
Dec
-19
Specialty Trade Contractors Revised Estimate Original Estimate
December 2019Total Revision
Number Percent(2,000) -1.7%

Item 9a Page 21 of 23
Dec-19, 652,900
Dec-19, 655,100
590,000
600,000
610,000
620,000
630,000
640,000
650,000
660,000
Jan-
18
Feb-
18
Ma
r-18
Apr
-18
Ma
y-18
Jun-
18
Jul-1
8
Aug
-18
Sep
-18
Oct
-18
Nov
-18
Dec
-18
Jan-
19
Feb-
19
Ma
r-19
Apr
-19
Ma
y-19
Jun-
19
Jul-1
9
Aug
-19
Sep
-19
Oct
-19
Nov
-19
Dec
-19
Trade, Transportation, and Utilities Revised Estimate Original Estimate
December 2019Total Revision
Number Percent(2,200) -0.3%
Dec-19, 313,900
Dec-19, 314,500
285,000
290,000
295,000
300,000
305,000
310,000
315,000
320,000
325,000
Jan-
18
Feb-
18
Ma
r-18
Apr
-18
Ma
y-18
Jun-
18
Jul-1
8
Aug
-18
Sep
-18
Oct
-18
Nov
-18
Dec
-18
Jan-
19
Feb-
19
Ma
r-19
Apr
-19
Ma
y-19
Jun-
19
Jul-1
9
Aug
-19
Sep
-19
Oct
-19
Nov
-19
Dec
-19
Retail Trade Revised Estimate Original Estimate
December 2019Total Revision
Number Percent(600) -0.2%

Item 9a Page 22 of 23
Dec-19, 161,600
Dec-19, 164,800
130,000
135,000
140,000
145,000
150,000
155,000
160,000
165,000
170,000
Jan-
18
Feb-
18
Ma
r-18
Apr
-18
Ma
y-18
Jun-
18
Jul-1
8
Aug
-18
Sep
-18
Oct
-18
Nov
-18
Dec
-18
Jan-
19
Feb-
19
Ma
r-19
Apr
-19
Ma
y-19
Jun-
19
Jul-1
9
Aug
-19
Sep
-19
Oct
-19
Nov
-19
Dec
-19
Transportation, Warehousing, and Utilities Revised Estimate Original Estimate
December 2019Total Revision
Number Percent(3,200) -2.0%
Dec-19, 32,700
Dec-19, 29,900
28,000
29,000
30,000
31,000
32,000
33,000
34,000
Jan-
18
Feb-
18
Ma
r-18
Apr
-18
Ma
y-18
Jun-
18
Jul-1
8
Aug
-18
Sep
-18
Oct
-18
Nov
-18
Dec
-18
Jan-
19
Feb-
19
Ma
r-19
Apr
-19
Ma
y-19
Jun-
19
Jul-1
9
Aug
-19
Sep
-19
Oct
-19
Nov
-19
Dec
-19
Information Revised Estimate Original Estimate
December 2019Total Revision
Number Percent2,800 8.6%

Item 9a Page 23 of 23
Dec-19, 117,300
Dec-19, 122,400
100,000
105,000
110,000
115,000
120,000
125,000
Jan-
18
Feb-
18
Ma
r-18
Apr
-18
Ma
y-18
Jun-
18
Jul-1
8
Aug
-18
Sep
-18
Oct
-18
Nov
-18
Dec
-18
Jan-
19
Feb-
19
Ma
r-19
Apr
-19
Ma
y-19
Jun-
19
Jul-1
9
Aug
-19
Sep
-19
Oct
-19
Nov
-19
Dec
-19
Other Services Revised Estimate Original Estimate
December 2019Total Revision
Number Percent(5,100) -4.3%
The Gulf Coast Region Economic Impact of COVID-19
Enormous efforts in defeating the coronavirus are being made with early estimates projecting the death toll could be as much as 100,000 to 240,000 even with mitigation efforts according to Dr. Deborah Birx on March 31st, the White House coronavirus response coordinator. We also see enormous efforts on stabilizing the economy with the Coronavirus Aid, Relief, and Economic Security Act (CARES) providing an estimated $2 trillion stimulus. Adding to the issues in the Gulf Coast Region is an oil-price war between Russia and OPEC nations where combined affects have driven oil prices from around $60 per barrel at the beginning of the year to around $20 per barrel.
The impending impacts on the Gulf Coast Region are largely unknown and depend greatly on the depth and duration of the coronavirus. Forecasting the economic impacts become a quite difficult task with large unpredictable reductions in employment in the weeks and perhaps months ahead due to the many layoffs and furloughs. Below is a summary of an economic forecast produced by economist Robert W. Gilmer, Ph.D., director of the Institute for Regional Forecasting at the University of Houston’s Bauer College of Business known for his semi-annual Houston regional economic forecast. The economic scenarios were made up for illustration and the economic effects of the coronavirus ultimately remains unknown at this time.
There were nine different scenarios created by combining those listed below.
Scenarios suggested by a 2006 Congressional Budget Office Report on the possible effects of avian flu on the economy.
Base Case: Business-as-usual scenario assuming the viral outbreak is no worse than the seasonal flu with a 5 to 15 percent case infection rate and any macroeconomic effects are not perceptible.
Moderate COVID-19: This CBO model is the Asian flu of 1957-58 with a 25 percent infection rate. The CBO suggests a serious slowdown in growth or even a very mild recession would result.
Severe COVID-19: The model is the Spanish flu of 1918-20 with 30 percent of the population infected and a high fatality rate.
Oil-price scenarios and the path of local related employment under three price scenarios.
Base Oil Price: Only some continued oil losses in the wake of on-going credit problems
Saudi Plan: Saudis are assumed to quickly push the oil price back up to $55 and Houston’s oil jobs quickly recover 10,600 jobs
Russian Plan: The Russian plan forces 12,600 job cuts, not much deeper than the Saudi Plan but is longer lasting
Item 9bPage 1 of 2
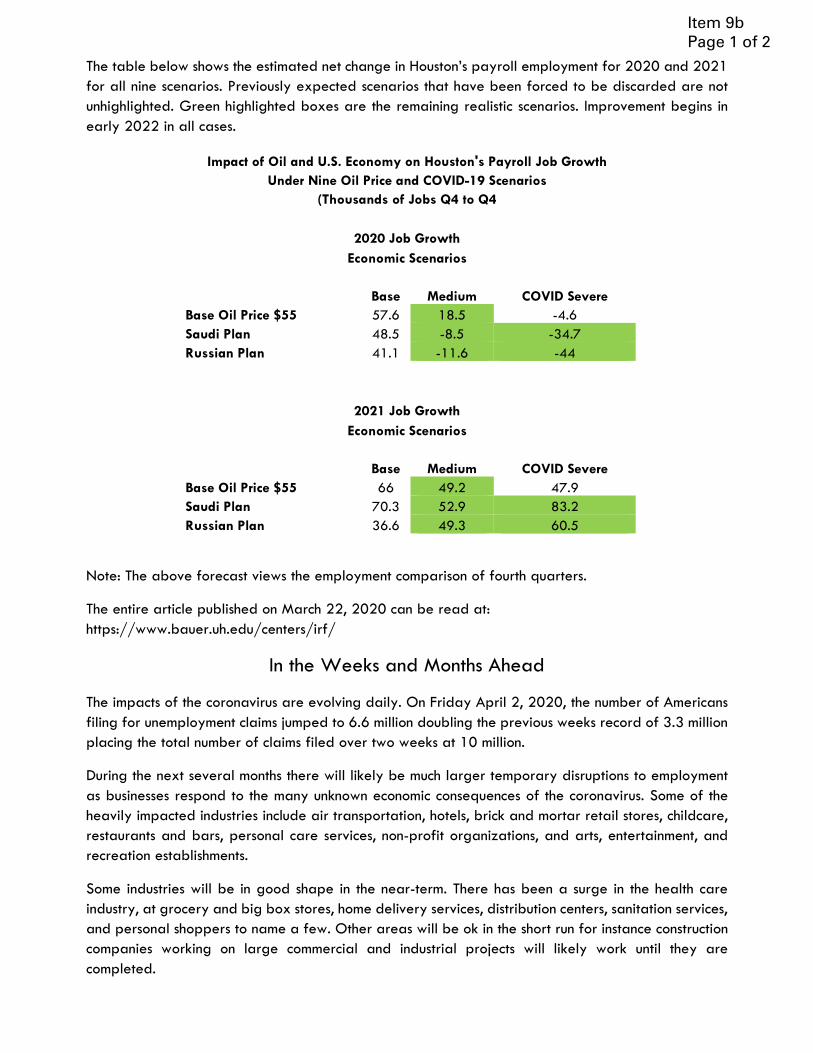
The table below shows the estimated net change in Houston’s payroll employment for 2020 and 2021 for all nine scenarios. Previously expected scenarios that have been forced to be discarded are not unhighlighted. Green highlighted boxes are the remaining realistic scenarios. Improvement begins in early 2022 in all cases.
Impact of Oil and U.S. Economy on Houston's Payroll Job Growth Under Nine Oil Price and COVID-19 Scenarios
(Thousands of Jobs Q4 to Q4
2020 Job Growth Economic Scenarios
Base Medium COVID Severe Base Oil Price $55 57.6 18.5 -4.6Saudi Plan 48.5 -8.5 -34.7Russian Plan 41.1 -11.6 -44
2021 Job Growth Economic Scenarios
Base Medium COVID Severe Base Oil Price $55 66 49.2 47.9 Saudi Plan 70.3 52.9 83.2 Russian Plan 36.6 49.3 60.5
Note: The above forecast views the employment comparison of fourth quarters.
The entire article published on March 22, 2020 can be read at: https://www.bauer.uh.edu/centers/irf/
In the Weeks and Months Ahead
The impacts of the coronavirus are evolving daily. On Friday April 2, 2020, the number of Americans filing for unemployment claims jumped to 6.6 million doubling the previous weeks record of 3.3 million placing the total number of claims filed over two weeks at 10 million.
During the next several months there will likely be much larger temporary disruptions to employment as businesses respond to the many unknown economic consequences of the coronavirus. Some of the heavily impacted industries include air transportation, hotels, brick and mortar retail stores, childcare, restaurants and bars, personal care services, non-profit organizations, and arts, entertainment, and recreation establishments.
Some industries will be in good shape in the near-term. There has been a surge in the health care industry, at grocery and big box stores, home delivery services, distribution centers, sanitation services, and personal shoppers to name a few. Other areas will be ok in the short run for instance construction companies working on large commercial and industrial projects will likely work until they are completed.
Item 9bPage 1 of 2

Parker Harvey, Principal Economist Gulf Coast Workforce Board -- Houston, Texas 713.993.2462 [email protected] www.wrksolutions.com/localstats
www.wrksolutions.com 1.888.469.JOBS (5627) Workforce Solutions is an equal opportunity employer/program. Auxiliary aids and services are available upon request to individuals with disabilities. (Please request reasonable accommodations a minimum of two business days in advance.) Relay Texas: 1.800.735.2989 (TDD) 1.800.735.2988 (voice) or 711
The Gulf Coast Region and COVID-19 in 2020: Unemployment Insurance Claims in Historical Context
Published by Parker Harvey March 27, 2020
In anticipation of ongoing adverse impacts to the Gulf Coast Greater-Houston labor market due to the spread of COVID-19, a look at the effects of recent economic downturns and natural disasters provides context for the potential scale of disruption now unfolding in real time. The data in this brief takes on additional importance given the scarcity of timely labor market information sought after by many. At the time of writing, the region’s most current unemployment rate as of February 2020, sits at 3.9 percent (not-seasonally-adjusted). However neither the unemployment rate nor the latest payroll employment figures reflect COVID-19 impacts on the labor market. This is due to the fact that the two surveys that comprise the local ‘employment situation’ measure payroll counts and work status as of the 12th of the month. According to Johns Hopkins University corona virus resource center, the first confirmed case of COVID-19 in Texas, specifically in Fort Bend County located in the Houston area, took place on March 5, 2020 with full-blown shelter-in-place orders for Harris County not issued until March 24th. As a result, even the March jobs report to be released in late-April may only serve as a prologue to the full range of labor market disruption to come.
Aug-17117,108
Sep-1741,240
Jan-2032,588
Jul-0345,446
Oct-0533,641
Oct-0830,167
Jul-0969,717
Jul-1649,080
Sep-087,810
Sep-178,080
2,000
7,000
12,000
17,000
22,000
27,000
32,000
37,000
42,000
0
25,000
50,000
75,000
100,000
125,000
Jan-90 Jan-93 Jan-96 Jan-99 Jan-02 Jan-05 Jan-08 Jan-11 Jan-14 Jan-17 Jan-20
Gulf Coast Region - Historical Continuing Unemployment Insurance Claims and Filings January 1990 to January 2020
NBER National Recession
Shale Bust
UI Filings*
Actual Continuing Claims
Backcast Estimate Cont. Claims
Estimated Initial Claims
*Data reflects filings for unemployment insurance including Disaster Unemployment Assistance (DUA) and do not equate to approved claims. Estimates of initial claims (not shown here) corresponding to Hurricane Harvey spike suggest ~6% of claims were approved given the brevity of the disruption. Note the negligible impact on continuing claims in the months immediately after the storm.
Hurricane Harvey
HurricaneKatrina
HurricaneIke
Hurricane Harvey
Item 9cPage 1 of 2
Parker Harvey, Principal Economist Gulf Coast Workforce Board -- Houston, Texas 713.993.2462 [email protected] www.wrksolutions.com/localstats
www.wrksolutions.com 1.888.469.JOBS (5627) Workforce Solutions is an equal opportunity employer/program. Auxiliary aids and services are available upon request to individuals with disabilities. (Please request reasonable accommodations a minimum of two business days in advance.) Relay Texas: 1.800.735.2989 (TDD) 1.800.735.2988 (voice) or 711
Given the shortcomings of the monthly jobs figures, we first turn to local data on applications for unemployment insurance, albeit fragmentary, related to Hurricane Harvey. Applications, which do not equate to approved claims, reached nearly 117,000 in the 13-county Gulf Coast Region in the immediate aftermath of the storm. However, due to the brevity of that event compared to COVID-19, which is now entering its third month as a global concern, the impact on rough estimates of initial claims, suggests only six top seven percent of applications were ultimately approved. The impact on continuing claims in the Houston area was even more ephemeral in the months immediately after the storm and virtually undetectable in subsequent months.
Nonetheless, a spike in applications related to COVID-19 of a similar magnitude to that of Hurricane Harvey was anticipated and confirmed by a March 25th article in the Houston Chronicle citing a statement by executive director of the Texas Workforce Commission Ed Serna that “more than 150,000 unemployment insurance claims were filed in Texas [during the week of March 16, 2020]…[with] claims for unemployment benefits…nearing 30,000 per day.” According to the executive director during a Facebook Live Q&A session, a typical day sees roughly 3,000 applications indicating a 900 percent increase. This surge was mirrored if not exceeded by a jump in initial claims at the national level of 3 million, or a nearly 1,500-percent increase over the previous week according to a March 26, 2020 press release by the U.S. Department of Labor. An obvious difference between the current surges in UI applications compared to Hurricane Harvey or other one-off events is that the former is likely to be remain elevated at unprecedented levels for some time even as initial claims evolve into continuing claims.
It is here that we reach the limitations of the truncated applications data and now turn to continuing claims prior to Hurricane Harvey for additional insights. A look back at the data in the chart above indicates that continuing claims reached a record high of nearly 70,000 in July 2009, which marked one month after the official end of the Great Recession per the National Bureau of Economic Research. From there, claims steadily fell over the next five years reaching a cycle low of roughly 27,000 in November 2014. That date also marked the start of falling oil prices that sent Houston into a two-year economic downturn eventually driving claims up to a second-place record high of 50,000 in July 2016. Admittedly, the three most extreme and coincidentally recent disruptions to the Gulf Coast labor market serve as only a rudimentary baseline for what UI claims, and unemployment generally, could look like going forward, but nonetheless provide a frame of reference on at least one aspect of COVID-19’s potential impact on economic activity.
Where does this leave us for the remainder of 2020? The answer is unclear and will depend on the severity and duration of the virus. However given the sheer scale of disruption affecting nearly all forms of work across all industries, the effects on the job market are already being characterized by a host of superlatives that would have been inconceivable just a few short months ago. Regardless, how, where, and when we work will be fundamentally transformed for the foreseeable future.
Item 9cPage 2 of 2