Embed Size (px)
DESCRIPTION
Scattering information
Citation preview
Functional Nucleic Acid Nanoparticle-Based ResonanceScattering Spectral Probe
Guiqing Wen & Aihui Liang & Zhiliang Jiang
Received: 5 October 2012 /Accepted: 30 January 2013 /Published online: 9 February 2013# Springer Science+Business Media New York 2013
Abstract Highly sensitive and selective resonance Ray-leigh scattering (RRS) and surface enhanced resonanceRaman scattering (SERRS) spectral detection techniqueare developed by combining the functional nucleic acidincluding aptamer and DNAzyme, and nanoparticle suchas gold/silver (NG/NS) aggregation and catalysis reaction.The recent progress of resonance scattering spectral tech-nologies including RRS and SERRS are reviewed in thispaper.
Keywords Aptamer .DNAzyme .Nanoparticle . ResonanceRayleigh scattering . Surface enhanced resonance Ramanscattering
Introduction
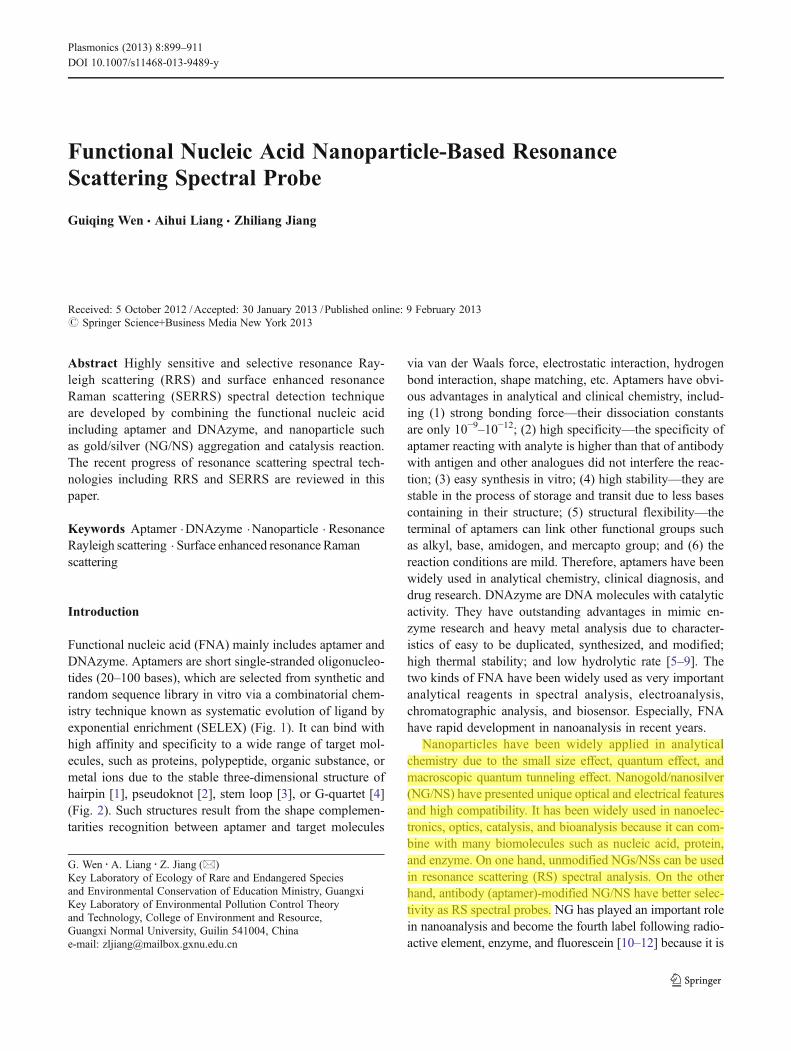
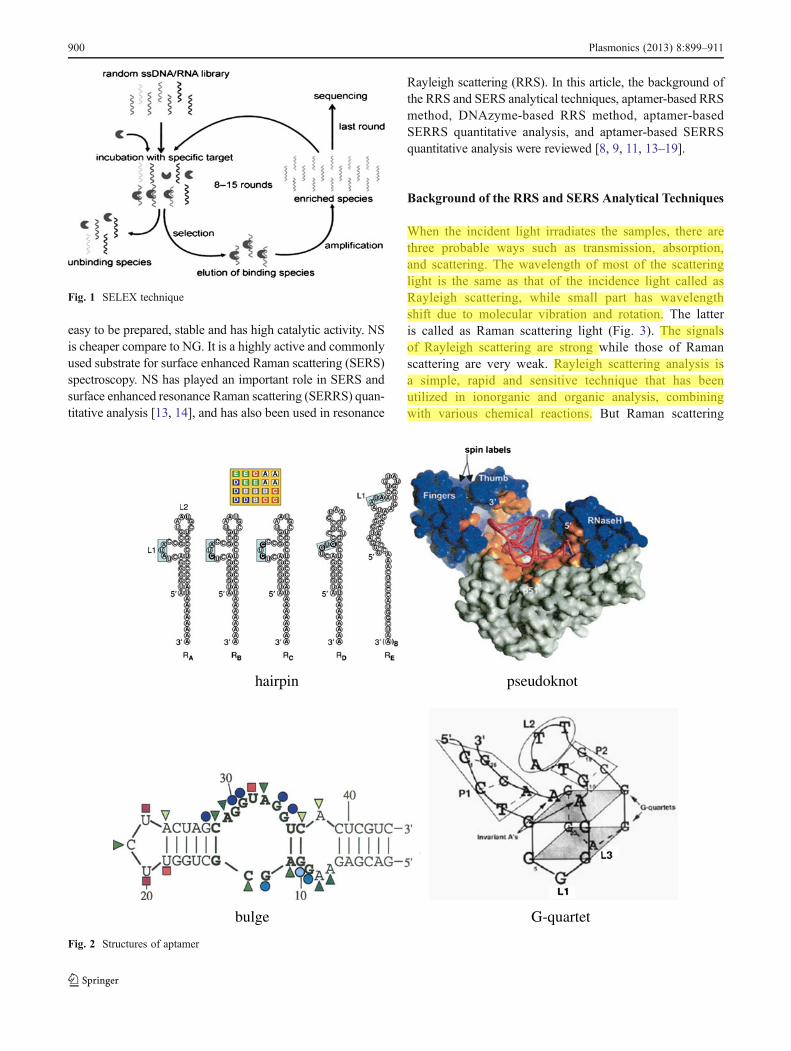
Functional nucleic acid (FNA) mainly includes aptamer andDNAzyme. Aptamers are short single-stranded oligonucleo-tides (20–100 bases), which are selected from synthetic andrandom sequence library in vitro via a combinatorial chem-istry technique known as systematic evolution of ligand byexponential enrichment (SELEX) (Fig. 1). It can bind withhigh affinity and specificity to a wide range of target mol-ecules, such as proteins, polypeptide, organic substance, ormetal ions due to the stable three-dimensional structure ofhairpin [1], pseudoknot [2], stem loop [3], or G-quartet [4](Fig. 2). Such structures result from the shape complemen-tarities recognition between aptamer and target molecules
via van der Waals force, electrostatic interaction, hydrogenbond interaction, shape matching, etc. Aptamers have obvi-ous advantages in analytical and clinical chemistry, includ-ing (1) strong bonding force—their dissociation constantsare only 10−9–10−12; (2) high specificity—the specificity ofaptamer reacting with analyte is higher than that of antibodywith antigen and other analogues did not interfere the reac-tion; (3) easy synthesis in vitro; (4) high stability—they arestable in the process of storage and transit due to less basescontaining in their structure; (5) structural flexibility—theterminal of aptamers can link other functional groups suchas alkyl, base, amidogen, and mercapto group; and (6) thereaction conditions are mild. Therefore, aptamers have beenwidely used in analytical chemistry, clinical diagnosis, anddrug research. DNAzyme are DNA molecules with catalyticactivity. They have outstanding advantages in mimic en-zyme research and heavy metal analysis due to character-istics of easy to be duplicated, synthesized, and modified;high thermal stability; and low hydrolytic rate [5–9]. Thetwo kinds of FNA have been widely used as very importantanalytical reagents in spectral analysis, electroanalysis,chromatographic analysis, and biosensor. Especially, FNAhave rapid development in nanoanalysis in recent years.
Nanoparticles have been widely applied in analyticalchemistry due to the small size effect, quantum effect, andmacroscopic quantum tunneling effect. Nanogold/nanosilver(NG/NS) have presented unique optical and electrical featuresand high compatibility. It has been widely used in nanoelec-tronics, optics, catalysis, and bioanalysis because it can com-bine with many biomolecules such as nucleic acid, protein,and enzyme. On one hand, unmodified NGs/NSs can be usedin resonance scattering (RS) spectral analysis. On the otherhand, antibody (aptamer)-modified NG/NS have better selec-tivity as RS spectral probes. NG has played an important rolein nanoanalysis and become the fourth label following radio-active element, enzyme, and fluorescein [10–12] because it is
G. Wen :A. Liang : Z. Jiang (*)Key Laboratory of Ecology of Rare and Endangered Speciesand Environmental Conservation of Education Ministry, GuangxiKey Laboratory of Environmental Pollution Control Theoryand Technology, College of Environment and Resource,Guangxi Normal University, Guilin 541004, Chinae-mail: [email protected]
Plasmonics (2013) 8:899–911DOI 10.1007/s11468-013-9489-y
easy to be prepared, stable and has high catalytic activity. NSis cheaper compare to NG. It is a highly active and commonlyused substrate for surface enhanced Raman scattering (SERS)spectroscopy. NS has played an important role in SERS andsurface enhanced resonance Raman scattering (SERRS) quan-titative analysis [13, 14], and has also been used in resonance
Rayleigh scattering (RRS). In this article, the background ofthe RRS and SERS analytical techniques, aptamer-based RRSmethod, DNAzyme-based RRS method, aptamer-basedSERRS quantitative analysis, and aptamer-based SERRSquantitative analysis were reviewed [8, 9, 11, 13–19].
Background of the RRS and SERS Analytical Techniques
When the incident light irradiates the samples, there arethree probable ways such as transmission, absorption,and scattering. The wavelength of most of the scatteringlight is the same as that of the incidence light called asRayleigh scattering, while small part has wavelengthshift due to molecular vibration and rotation. The latteris called as Raman scattering light (Fig. 3). The signalsof Rayleigh scattering are strong while those of Ramanscattering are very weak. Rayleigh scattering analysis isa simple, rapid and sensitive technique that has beenutilized in ionorganic and organic analysis, combiningwith various chemical reactions. But Raman scattering
Fig. 1 SELEX technique
hairpin pseudoknot
bulge G-quartet
Fig. 2 Structures of aptamer
900 Plasmonics (2013) 8:899–911
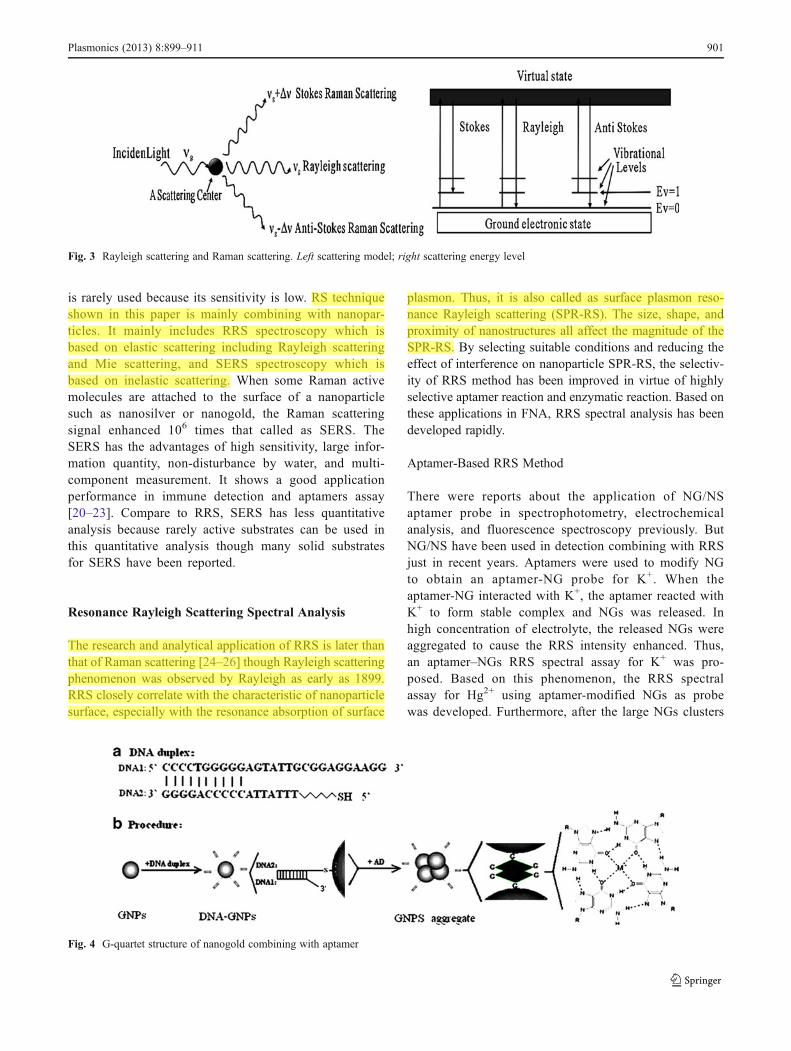
is rarely used because its sensitivity is low. RS techniqueshown in this paper is mainly combining with nanopar-ticles. It mainly includes RRS spectroscopy which isbased on elastic scattering including Rayleigh scatteringand Mie scattering, and SERS spectroscopy which isbased on inelastic scattering. When some Raman activemolecules are attached to the surface of a nanoparticlesuch as nanosilver or nanogold, the Raman scatteringsignal enhanced 106 times that called as SERS. TheSERS has the advantages of high sensitivity, large infor-mation quantity, non-disturbance by water, and multi-component measurement. It shows a good applicationperformance in immune detection and aptamers assay[20–23]. Compare to RRS, SERS has less quantitativeanalysis because rarely active substrates can be used inthis quantitative analysis though many solid substratesfor SERS have been reported.
Resonance Rayleigh Scattering Spectral Analysis
The research and analytical application of RRS is later thanthat of Raman scattering [24–26] though Rayleigh scatteringphenomenon was observed by Rayleigh as early as 1899.RRS closely correlate with the characteristic of nanoparticlesurface, especially with the resonance absorption of surface
plasmon. Thus, it is also called as surface plasmon reso-nance Rayleigh scattering (SPR-RS). The size, shape, andproximity of nanostructures all affect the magnitude of theSPR-RS. By selecting suitable conditions and reducing theeffect of interference on nanoparticle SPR-RS, the selectiv-ity of RRS method has been improved in virtue of highlyselective aptamer reaction and enzymatic reaction. Based onthese applications in FNA, RRS spectral analysis has beendeveloped rapidly.
Aptamer-Based RRS Method
There were reports about the application of NG/NSaptamer probe in spectrophotometry, electrochemicalanalysis, and fluorescence spectroscopy previously. ButNG/NS have been used in detection combining with RRSjust in recent years. Aptamers were used to modify NGto obtain an aptamer-NG probe for K+. When theaptamer-NG interacted with K+, the aptamer reacted withK+ to form stable complex and NGs was released. Inhigh concentration of electrolyte, the released NGs wereaggregated to cause the RRS intensity enhanced. Thus,an aptamer–NGs RRS spectral assay for K+ was pro-posed. Based on this phenomenon, the RRS spectralassay for Hg2+ using aptamer-modified NGs as probewas developed. Furthermore, after the large NGs clusters
Fig. 3 Rayleigh scattering and Raman scattering. Left scattering model; right scattering energy level
Fig. 4 G-quartet structure of nanogold combining with aptamer
Plasmonics (2013) 8:899–911 901
were removed by membrane filtration, the excessaptamer-NG in the filtrate solution exhibits a catalyticeffect on the Cu2O particle reaction between NH2OH andCu(II). The decreased RS intensity of Cu2O particle hada linear response to Hg2+ concentration. So, an aptamer-modified NG catalytic RRS method was built [27]. Themethod of Cu enhancement is cheap, stable, reproducible,
and sensitive and it has the advantage over Ag enhancementor Au enhancement.
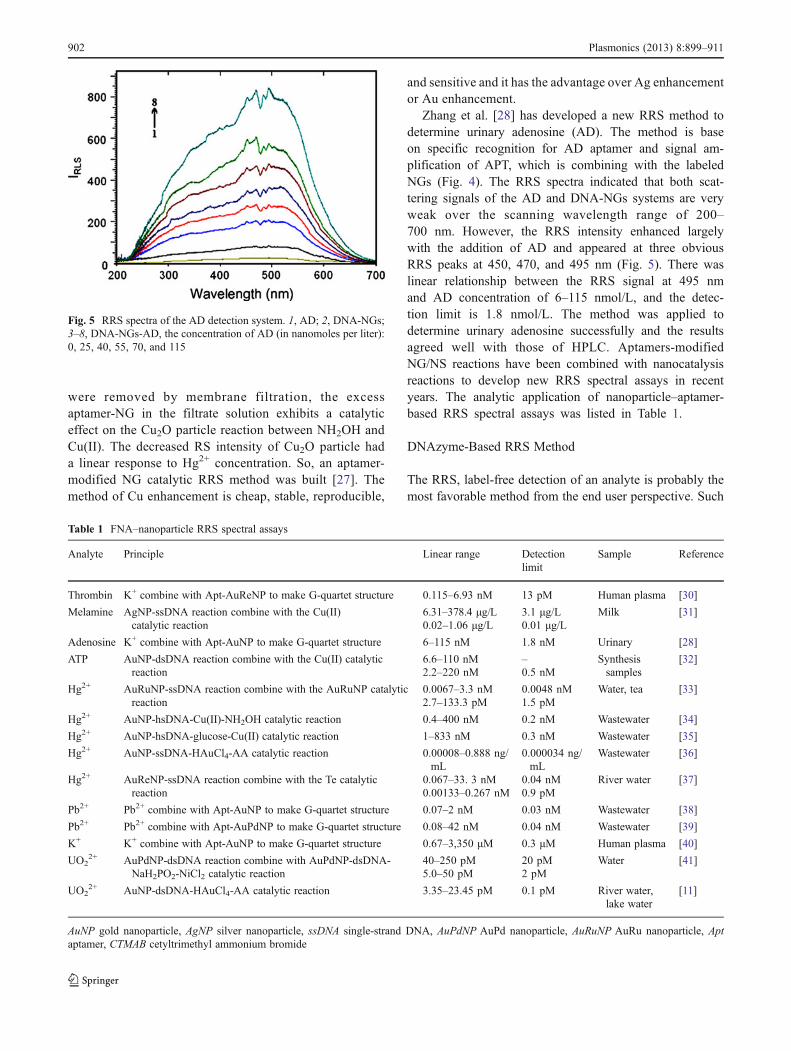
Zhang et al. [28] has developed a new RRS method todetermine urinary adenosine (AD). The method is baseon specific recognition for AD aptamer and signal am-plification of APT, which is combining with the labeledNGs (Fig. 4). The RRS spectra indicated that both scat-tering signals of the AD and DNA-NGs systems are veryweak over the scanning wavelength range of 200–700 nm. However, the RRS intensity enhanced largelywith the addition of AD and appeared at three obviousRRS peaks at 450, 470, and 495 nm (Fig. 5). There waslinear relationship between the RRS signal at 495 nmand AD concentration of 6–115 nmol/L, and the detec-tion limit is 1.8 nmol/L. The method was applied todetermine urinary adenosine successfully and the resultsagreed well with those of HPLC. Aptamers-modifiedNG/NS reactions have been combined with nanocatalysisreactions to develop new RRS spectral assays in recentyears. The analytic application of nanoparticle–aptamer-based RRS spectral assays was listed in Table 1.
DNAzyme-Based RRS Method
The RRS, label-free detection of an analyte is probably themost favorable method from the end user perspective. Such
Fig. 5 RRS spectra of the AD detection system. 1, AD; 2, DNA-NGs;3–8, DNA-NGs-AD, the concentration of AD (in nanomoles per liter):0, 25, 40, 55, 70, and 115
Table 1 FNA–nanoparticle RRS spectral assays
Analyte Principle Linear range Detectionlimit
Sample Reference
Thrombin K+ combine with Apt-AuReNP to make G-quartet structure 0.115–6.93 nM 13 pM Human plasma [30]
Melamine AgNP-ssDNA reaction combine with the Cu(II)catalytic reaction
6.31–378.4 μg/L 3.1 μg/L Milk [31]0.02–1.06 μg/L 0.01 μg/L
Adenosine K+ combine with Apt-AuNP to make G-quartet structure 6–115 nM 1.8 nM Urinary [28]
ATP AuNP-dsDNA reaction combine with the Cu(II) catalyticreaction
6.6–110 nM – Synthesissamples
[32]2.2–220 nM 0.5 nM
Hg2+ AuRuNP-ssDNA reaction combine with the AuRuNP catalyticreaction
0.0067–3.3 nM 0.0048 nM Water, tea [33]2.7–133.3 pM 1.5 pM
Hg2+ AuNP-hsDNA-Cu(II)-NH2OH catalytic reaction 0.4–400 nM 0.2 nM Wastewater [34]
Hg2+ AuNP-hsDNA-glucose-Cu(II) catalytic reaction 1–833 nM 0.3 nM Wastewater [35]
Hg2+ AuNP-ssDNA-HAuCl4-AA catalytic reaction 0.00008–0.888 ng/mL
0.000034 ng/mL
Wastewater [36]
Hg2+ AuReNP-ssDNA reaction combine with the Te catalyticreaction
0.067–33. 3 nM 0.04 nM River water [37]0.00133–0.267 nM 0.9 pM
Pb2+ Pb2+ combine with Apt-AuNP to make G-quartet structure 0.07–2 nM 0.03 nM Wastewater [38]
Pb2+ Pb2+ combine with Apt-AuPdNP to make G-quartet structure 0.08–42 nM 0.04 nM Wastewater [39]
K+ K+ combine with Apt-AuNP to make G-quartet structure 0.67–3,350 μM 0.3 μM Human plasma [40]
UO22+ AuPdNP-dsDNA reaction combine with AuPdNP-dsDNA-
NaH2PO2-NiCl2 catalytic reaction40–250 pM 20 pM Water [41]5.0–50 pM 2 pM
UO22+ AuNP-dsDNA-HAuCl4-AA catalytic reaction 3.35–23.45 pM 0.1 pM River water,
lake water[11]
AuNP gold nanoparticle, AgNP silver nanoparticle, ssDNA single-strand DNA, AuPdNP AuPd nanoparticle, AuRuNP AuRu nanoparticle, Aptaptamer, CTMAB cetyltrimethyl ammonium bromide
902 Plasmonics (2013) 8:899–911
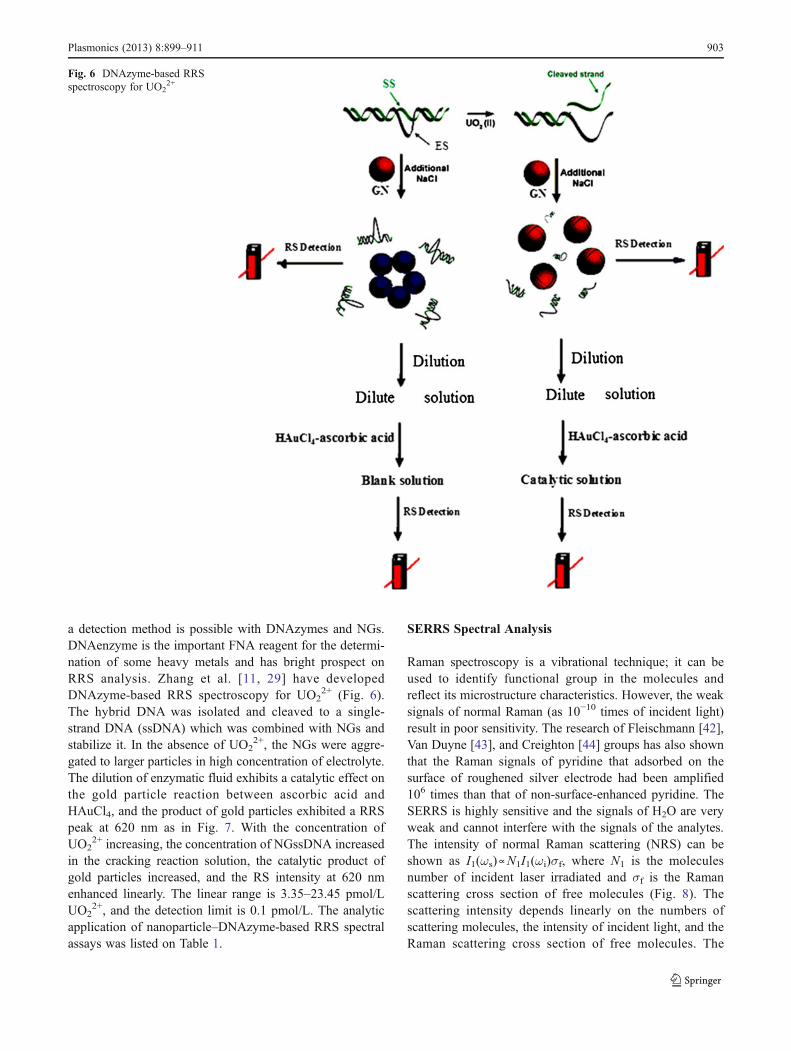
a detection method is possible with DNAzymes and NGs.DNAenzyme is the important FNA reagent for the determi-nation of some heavy metals and has bright prospect onRRS analysis. Zhang et al. [11, 29] have developedDNAzyme-based RRS spectroscopy for UO2
2+ (Fig. 6).The hybrid DNA was isolated and cleaved to a single-strand DNA (ssDNA) which was combined with NGs andstabilize it. In the absence of UO2
2+, the NGs were aggre-gated to larger particles in high concentration of electrolyte.The dilution of enzymatic fluid exhibits a catalytic effect onthe gold particle reaction between ascorbic acid andHAuCl4, and the product of gold particles exhibited a RRSpeak at 620 nm as in Fig. 7. With the concentration ofUO2
2+ increasing, the concentration of NGssDNA increasedin the cracking reaction solution, the catalytic product ofgold particles increased, and the RS intensity at 620 nmenhanced linearly. The linear range is 3.35–23.45 pmol/LUO2
2+, and the detection limit is 0.1 pmol/L. The analyticapplication of nanoparticle–DNAzyme-based RRS spectralassays was listed on Table 1.
SERRS Spectral Analysis
Raman spectroscopy is a vibrational technique; it can beused to identify functional group in the molecules andreflect its microstructure characteristics. However, the weaksignals of normal Raman (as 10−10 times of incident light)result in poor sensitivity. The research of Fleischmann [42],Van Duyne [43], and Creighton [44] groups has also shownthat the Raman signals of pyridine that adsorbed on thesurface of roughened silver electrode had been amplified106 times than that of non-surface-enhanced pyridine. TheSERRS is highly sensitive and the signals of H2O are veryweak and cannot interfere with the signals of the analytes.The intensity of normal Raman scattering (NRS) can beshown as I1(ωs)∝N1I1(ωi)σf, where N1 is the moleculesnumber of incident laser irradiated and σf is the Ramanscattering cross section of free molecules (Fig. 8). Thescattering intensity depends linearly on the numbers ofscattering molecules, the intensity of incident light, and theRaman scattering cross section of free molecules. The
Fig. 6 DNAzyme-based RRSspectroscopy for UO2
2+
Plasmonics (2013) 8:899–911 903
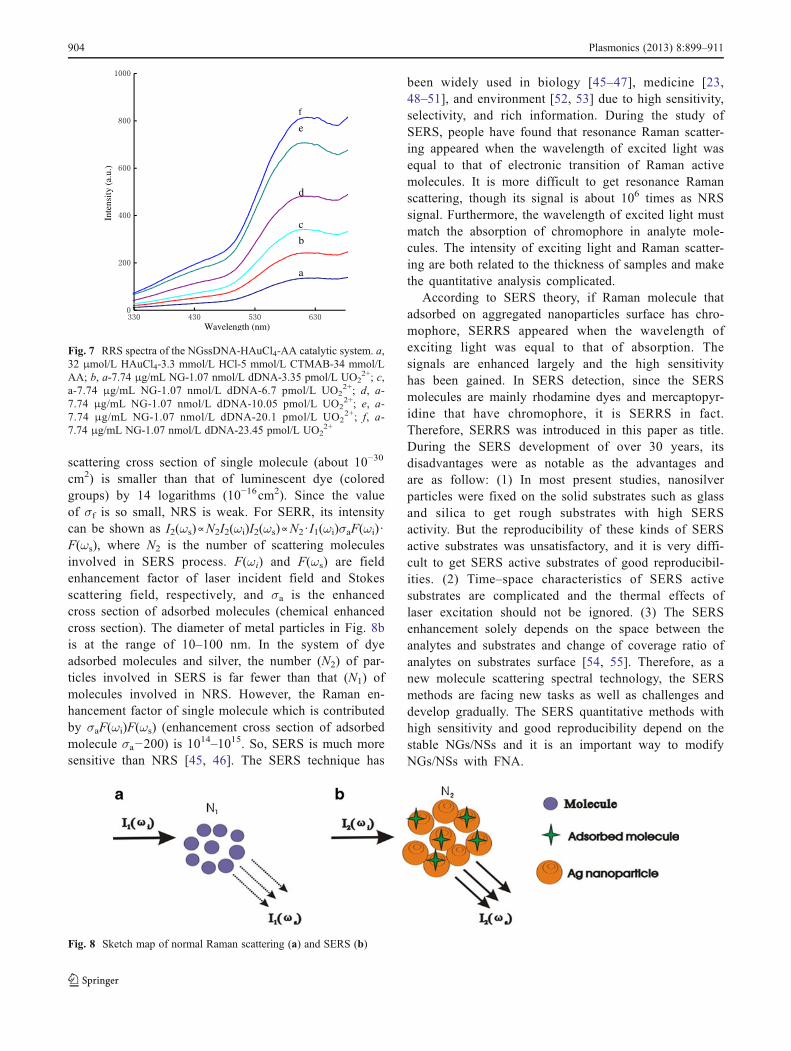
scattering cross section of single molecule (about 10−30
cm2) is smaller than that of luminescent dye (coloredgroups) by 14 logarithms (10−16cm2). Since the valueof σf is so small, NRS is weak. For SERR, its intensitycan be shown as I2(ωs)∝N2I2(ωi)I2(ωs)∝N2· I1(ωi)σaF(ωi) ·F(ωs), where N2 is the number of scattering moleculesinvolved in SERS process. F(ωi) and F(ωs) are fieldenhancement factor of laser incident field and Stokesscattering field, respectively, and σa is the enhancedcross section of adsorbed molecules (chemical enhancedcross section). The diameter of metal particles in Fig. 8bis at the range of 10–100 nm. In the system of dyeadsorbed molecules and silver, the number (N2) of par-ticles involved in SERS is far fewer than that (N1) ofmolecules involved in NRS. However, the Raman en-hancement factor of single molecule which is contributedby σaF(ωi)F(ωs) (enhancement cross section of adsorbedmolecule σa−200) is 1014–1015. So, SERS is much moresensitive than NRS [45, 46]. The SERS technique has
been widely used in biology [45–47], medicine [23,48–51], and environment [52, 53] due to high sensitivity,selectivity, and rich information. During the study ofSERS, people have found that resonance Raman scatter-ing appeared when the wavelength of excited light wasequal to that of electronic transition of Raman activemolecules. It is more difficult to get resonance Ramanscattering, though its signal is about 106 times as NRSsignal. Furthermore, the wavelength of excited light mustmatch the absorption of chromophore in analyte mole-cules. The intensity of exciting light and Raman scatter-ing are both related to the thickness of samples and makethe quantitative analysis complicated.
According to SERS theory, if Raman molecule thatadsorbed on aggregated nanoparticles surface has chro-mophore, SERRS appeared when the wavelength ofexciting light was equal to that of absorption. Thesignals are enhanced largely and the high sensitivityhas been gained. In SERS detection, since the SERSmolecules are mainly rhodamine dyes and mercaptopyr-idine that have chromophore, it is SERRS in fact.Therefore, SERRS was introduced in this paper as title.During the SERS development of over 30 years, itsdisadvantages were as notable as the advantages andare as follow: (1) In most present studies, nanosilverparticles were fixed on the solid substrates such as glassand silica to get rough substrates with high SERSactivity. But the reproducibility of these kinds of SERSactive substrates was unsatisfactory, and it is very diffi-cult to get SERS active substrates of good reproducibil-ities. (2) Time–space characteristics of SERS activesubstrates are complicated and the thermal effects oflaser excitation should not be ignored. (3) The SERSenhancement solely depends on the space between theanalytes and substrates and change of coverage ratio ofanalytes on substrates surface [54, 55]. Therefore, as anew molecule scattering spectral technology, the SERSmethods are facing new tasks as well as challenges anddevelop gradually. The SERS quantitative methods withhigh sensitivity and good reproducibility depend on thestable NGs/NSs and it is an important way to modifyNGs/NSs with FNA.
Wavelength (nm)
Inte
nsit
y (a
.u.)
f
e
d
c
b
a
Fig. 7 RRS spectra of the NGssDNA-HAuCl4-AA catalytic system. a,32 μmol/L HAuCl4-3.3 mmol/L HCl-5 mmol/L CTMAB-34 mmol/LAA; b, a-7.74 μg/mL NG-1.07 nmol/L dDNA-3.35 pmol/L UO2
2+; c,a-7.74 μg/mL NG-1.07 nmol/L dDNA-6.7 pmol/L UO2
2+; d, a-7.74 μg/mL NG-1.07 nmol/L dDNA-10.05 pmol/L UO2
2+; e, a-7.74 μg/mL NG-1.07 nmol/L dDNA-20.1 pmol/L UO2
2+; f, a-7.74 μg/mL NG-1.07 nmol/L dDNA-23.45 pmol/L UO2
2+
Fig. 8 Sketch map of normal Raman scattering (a) and SERS (b)
904 Plasmonics (2013) 8:899–911
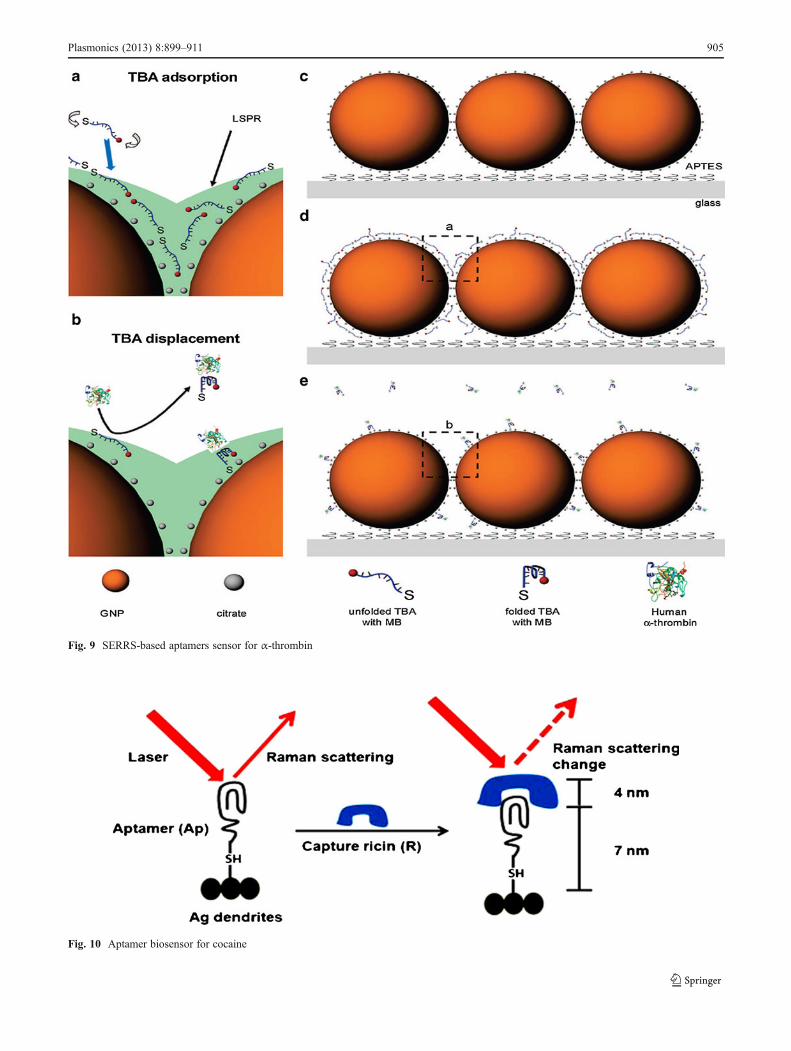
Fig. 9 SERRS-based aptamers sensor for α-thrombin
Fig. 10 Aptamer biosensor for cocaine
Plasmonics (2013) 8:899–911 905
Aptamer-Based SERRS Analysis
Cho et al. [56] have developed a SERRS-based aptamersensor with high sensitivity, high specificity, and good sta-bility (Fig. 9). It can identify and detect α-thrombin ofhuman with a detection limit of 100 pmol/L. He researchgroup [57] has developed a “two-step” aptamers SERRSmethod to detect ricin in liquor foods. In this method, ricinB chain can be captured by aptamer which are conjugatedpairs of nanocrystalline silver, and the values of SERRSsignals are changed (Fig. 10). This kind of aptamer sensorthat made by conjugation is easy to prepare and high sensi-tive. It can be widely used to detect ricin in all kinds ofliquor foods. With this method, the detection limit of ricin insaline, orange juice, and milk is 10, 50, and 100 ng/mL,respectively. Yu et al. [58] have developed a novel aptamersensor for cocaine. They found that the target molecules
which were surface-affinitive to the SERRS substrate hadSERRS signals after combining with a substrate. Under theselected conditions, the detection limit of cocaine is 1 μmol/L.
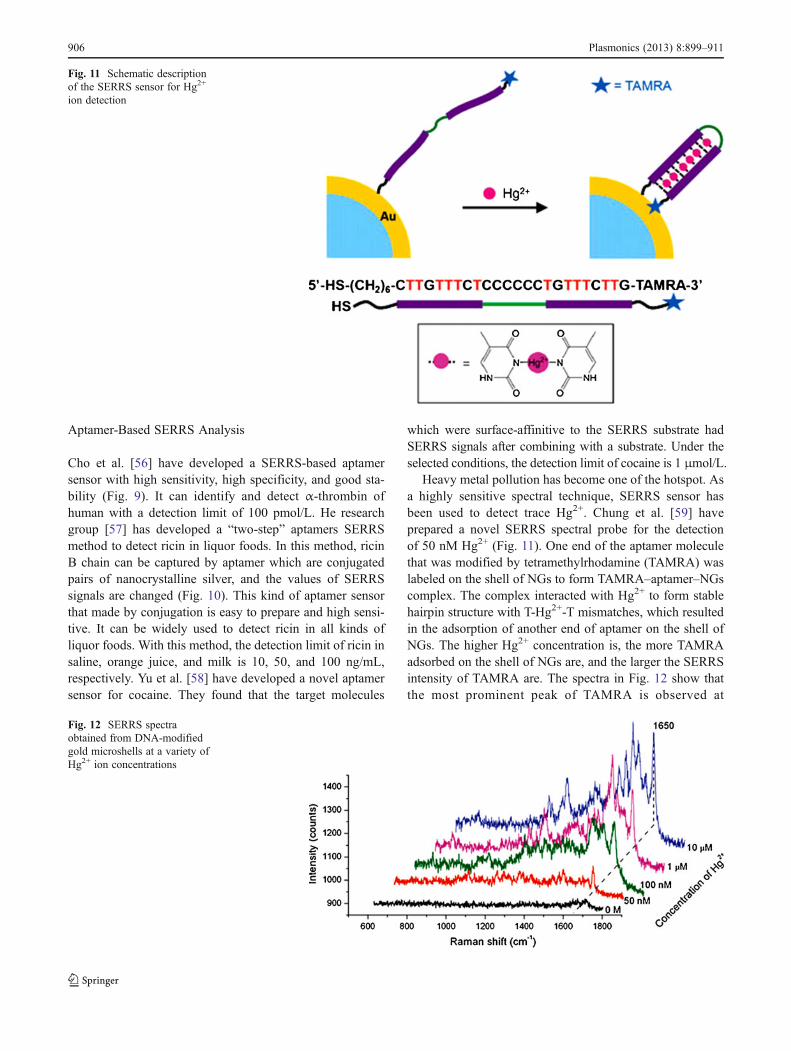
Heavy metal pollution has become one of the hotspot. Asa highly sensitive spectral technique, SERRS sensor hasbeen used to detect trace Hg2+. Chung et al. [59] haveprepared a novel SERRS spectral probe for the detectionof 50 nM Hg2+ (Fig. 11). One end of the aptamer moleculethat was modified by tetramethylrhodamine (TAMRA) waslabeled on the shell of NGs to form TAMRA–aptamer–NGscomplex. The complex interacted with Hg2+ to form stablehairpin structure with T-Hg2+-T mismatches, which resultedin the adsorption of another end of aptamer on the shell ofNGs. The higher Hg2+ concentration is, the more TAMRAadsorbed on the shell of NGs are, and the larger the SERRSintensity of TAMRA are. The spectra in Fig. 12 show thatthe most prominent peak of TAMRA is observed at
Fig. 11 Schematic descriptionof the SERRS sensor for Hg2+
ion detection
Fig. 12 SERRS spectraobtained from DNA-modifiedgold microshells at a variety ofHg2+ ion concentrations
906 Plasmonics (2013) 8:899–911
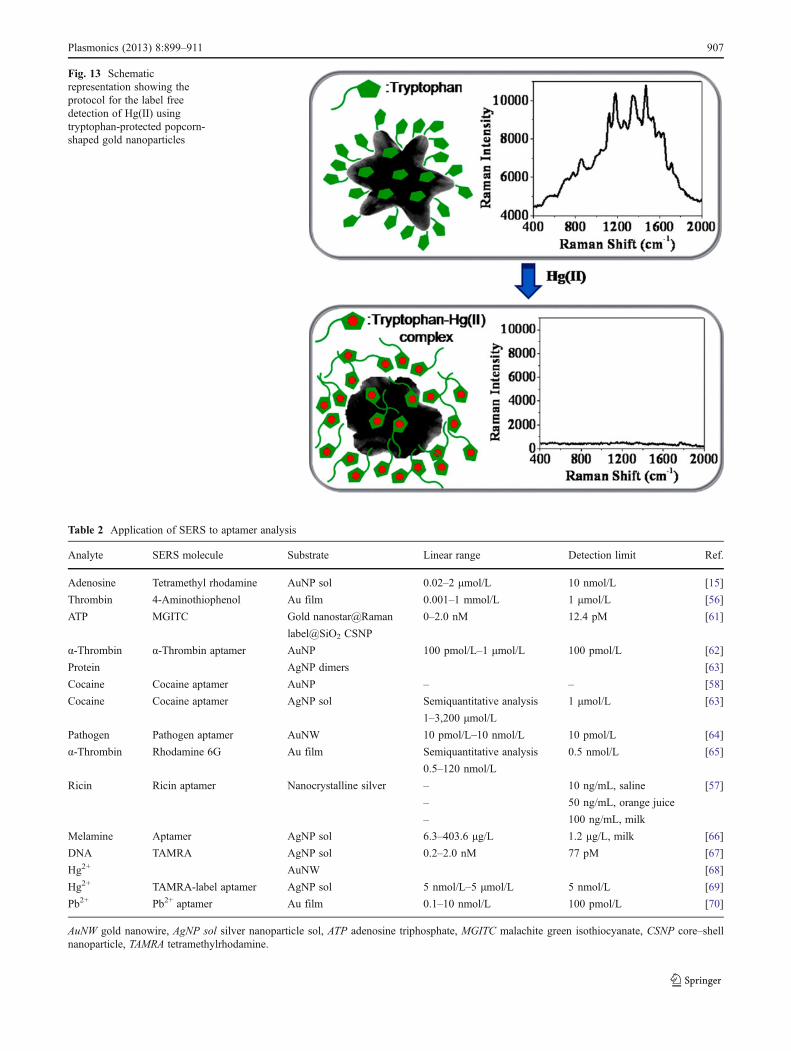
Fig. 13 Schematicrepresentation showing theprotocol for the label freedetection of Hg(II) usingtryptophan-protected popcorn-shaped gold nanoparticles
Table 2 Application of SERS to aptamer analysis
Analyte SERS molecule Substrate Linear range Detection limit Ref.
Adenosine Tetramethyl rhodamine AuNP sol 0.02–2 μmol/L 10 nmol/L [15]
Thrombin 4-Aminothiophenol Au film 0.001–1 mmol/L 1 μmol/L [56]
ATP MGITC Gold nanostar@Raman 0–2.0 nM 12.4 pM [61]
label@SiO2 CSNP
α-Thrombin α-Thrombin aptamer AuNP 100 pmol/L–1 μmol/L 100 pmol/L [62]
Protein AgNP dimers [63]
Cocaine Cocaine aptamer AuNP – – [58]
Cocaine Cocaine aptamer AgNP sol Semiquantitative analysis 1 μmol/L [63]
1–3,200 μmol/L
Pathogen Pathogen aptamer AuNW 10 pmol/L–10 nmol/L 10 pmol/L [64]
α-Thrombin Rhodamine 6G Au film Semiquantitative analysis 0.5 nmol/L [65]
0.5–120 nmol/L
Ricin Ricin aptamer Nanocrystalline silver – 10 ng/mL, saline [57]
– 50 ng/mL, orange juice
– 100 ng/mL, milk
Melamine Aptamer AgNP sol 6.3–403.6 μg/L 1.2 μg/L, milk [66]
DNA TAMRA AgNP sol 0.2–2.0 nM 77 pM [67]
Hg2+ AuNW [68]
Hg2+ TAMRA-label aptamer AgNP sol 5 nmol/L–5 μmol/L 5 nmol/L [69]
Pb2+ Pb2+ aptamer Au film 0.1–10 nmol/L 100 pmol/L [70]
AuNW gold nanowire, AgNP sol silver nanoparticle sol, ATP adenosine triphosphate, MGITC malachite green isothiocyanate, CSNP core–shellnanoparticle, TAMRA tetramethylrhodamine.
Plasmonics (2013) 8:899–911 907
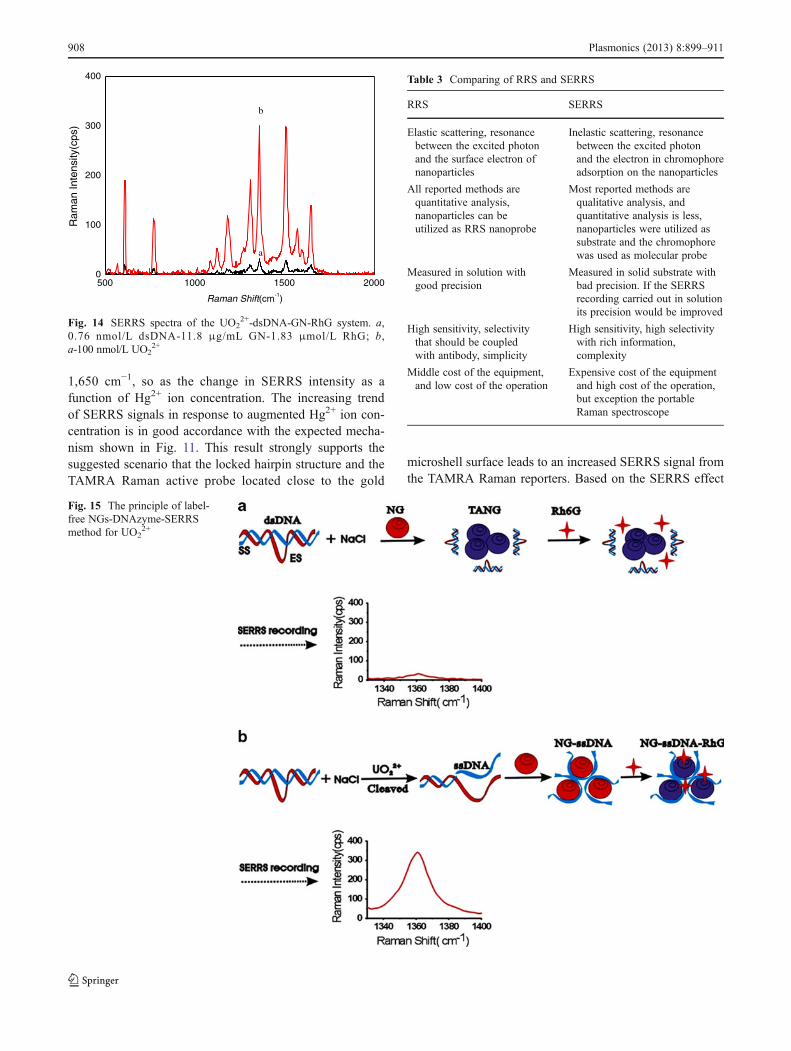
1,650 cm−1, so as the change in SERRS intensity as afunction of Hg2+ ion concentration. The increasing trendof SERRS signals in response to augmented Hg2+ ion con-centration is in good accordance with the expected mecha-nism shown in Fig. 11. This result strongly supports thesuggested scenario that the locked hairpin structure and theTAMRA Raman active probe located close to the gold
microshell surface leads to an increased SERRS signal fromthe TAMRA Raman reporters. Based on the SERRS effect
500 1000 1500 20000
100
200
300
400R
aman
Inte
nsity
(cps
)
Raman Shift(cm-1)
b
a
Fig. 14 SERRS spectra of the UO22+-dsDNA-GN-RhG system. a,
0.76 nmol/L dsDNA-11.8 μg/mL GN-1.83 μmol/L RhG; b,a-100 nmol/L UO2
2+
Fig. 15 The principle of label-free NGs-DNAzyme-SERRSmethod for UO2
2+
Table 3 Comparing of RRS and SERRS
RRS SERRS
Elastic scattering, resonancebetween the excited photonand the surface electron ofnanoparticles
Inelastic scattering, resonancebetween the excited photonand the electron in chromophoreadsorption on the nanoparticles
All reported methods arequantitative analysis,nanoparticles can beutilized as RRS nanoprobe
Most reported methods arequalitative analysis, andquantitative analysis is less,nanoparticles were utilized assubstrate and the chromophorewas used as molecular probe
Measured in solution withgood precision
Measured in solid substrate withbad precision. If the SERRSrecording carried out in solutionits precision would be improved
High sensitivity, selectivitythat should be coupledwith antibody, simplicity
High sensitivity, high selectivitywith rich information,complexity
Middle cost of the equipment,and low cost of the operation
Expensive cost of the equipmentand high cost of the operation,but exception the portableRaman spectroscope
908 Plasmonics (2013) 8:899–911
of tryptophan at 1,467.8 cm−1 and the quenching effect oftryptophan–Hg(II) complex on the NGs, Ray et al. [60] havereported a SERRS sensor for detection of Hg2+ (Fig. 13),with a detection limit of 5 ppb. The application of SERSspectral techniques on aptamer analysis are listed on Table 2[15, 56, 57, 61–67].
DNAzyme-Based SERRS Analysis
Labeling the DNAzyme with Raman tags costs extra timeand materials and they may potentially interfere with theenzymatic activities. Therefore, SERRS sensors withoutthese external tags will have an advantage in these aspects.Recently, several label-free SERRS sensors have been de-veloped by several groups. Base on metal ion catalysis ofDNA cracking, the enzyme reaction was combined with theNG/NS aggregation to develop SERRS methods [68–70].Rhodamine 6G (RhG) is a kind of cationic dye with highSERRS activity that appeared eight strong SERRS peaks atthe Raman shift of 611, 773, 1,185, 1,311, 1,360, 1,510,1,570, and 1,649 cm−1 (Fig. 14). In the conditions of pH 5.5buffer solution (2-(4-morpholino)ethanesulfonic acid) and0.019 mol/L NaCl, NGs cannot be protected by dsDNAand form tight aggregated NGs (TANG). The interactionbetween TANG and RhG was weak and exhibited weaksignals (Fig. 15a). After adding UO2
2+, it can cleave thesubstrate strand of DNA and release a ssDNA. The ssDNAcan be adsorbed on the surface of NGs to form NGs-ssDNAcomplex. Upon the addition of RhG, NGs-ssDNA wasadsorbed to the surface of RhG and exhibited strong SERRSpeak at 1,360 cm−1 (Fig. 15b). The higher the UO2
2+ con-centration, the more ssDNA are produced. And the moreNGs-ssDNA-RhG are, the larger the SERRS intensity is.Thus, the SERRS spectral method for UO2
2+ was developedand the linear range was 5–125 nmol/L.
Conclusion
The RS spectroscopy is a new technique of trace analy-sis. RRS is based on SPR-RS effect of nanoparticles andis the resonance of excited light with the SPR electron. Itis highly sensitive and the selectivity has been improvedby combining with FNA. SERRS appeared when theelectrons in vibrational energy level of colored moleculesthat adsorbed on the surface of nanoparticles resonatedwith the excitation photon. SERRS technology hasadvantages of high sensitivity, good selectivity, and richinformation (Table 3). Its combination with FNA hasimproved the analytical properties such as accuracy andbroadened the scope of analytes.
Exploring RS spectral quantitative methods with charac-teristic of high sensitivity, selectivity, simplicity, speediness,
and online is the further direction of the efforts. Firstly,prepare stable and highly active nanosol. Secondly, explorenew nanoalloy catalytic reaction including homogeneousand heterogeneous nanocatalytic reaction. Thirdly, combineDNAzyme cleaved reaction and aptamer reaction with nano-catalytic reaction to develop new nanocatalytic RS spectraltechnology.
Acknowledgments This work was supported by the National NaturalScience Foundation of China (nos. 21267004, 21165005, and 21075023),and Natural Science Foundation of Guangxi (2013GXNSFGA070003).
References
1. Shi C, Gu HX, Ma CP (2010) An aptamer-based fluorescentbiosensor for potassium ion detection using a pyrene-labeled mo-lecular beacon. Anal Biochem 400(1):99–102
2. Oliver K, Connolly AB, Steinhoff HJ, McGregor A, Goody RS,Restle T (2000) HIV-1 reverse transcriptase-pseudoknot RNAaptamer interaction has a binding affinity in the low picomolar rangecoupled with high specificity. Biol Chem 275:18271–18278
3. Burgstaller P, Kochoyan M, Famulok M (1995) Structural probingand damage selection of citrulline and arginine-specific RNAaptamers identify base positions required for binding. NucleicAcids Res 23:4769–4776
4. David E, Szostak HJW (1995) A DNA aptamer that binds adeno-sine and ATP. Biochem 34:656–665
5. Lu N, Shao CY, Deng ZX (2009) Colorimetric Hg2+ detection witha label-free and fully DNA-structured sensor assembly incorporat-ing G-quadruplex halves. Analyst 134:1822–1825
6. Wang N, Kong DM, Shen HX (2011) Amplification of G-quadruplex DNAzymes using PCR-like temperature cycles forspecific nucleic acid and single nucleotide polymorphism detec-tion. Chem Commun 47:1728–1730
7. Yin BC, Ye BC, Tan WH, Wang H, Xie CC (2009) An allostericdual-DNAzyme unimolecular probe for colorimetric detection ofcopper(II). J Am Chem Soc 131(41):14624–14625
8. Kong DM (2011) Applications of G-Quadruplex-Hemin DNAzymesin sensor design. Progress in Chemistry 23:2019–2031
9. Neo JL, Kamaladasan K, Uttamchandani M (2012) G-quadruplexbased probes for visual detection and sensing. Curr Pharm Des18:2048–2057
10. Bao JF, He P, Yu XJ, Jiang SL, Yan QY (2009) Detection of Hg2+
using gold nanoparticle probes. Acta Chim Sin 67(18):2139–214311. Jiang ZL, Zhang Y, Liang AH, Chen CQ, Tian JN, Li TS (2012)
Free-labeled nanogold catalytic detection of trace UO22+ based on
the aptamer reaction and gold particle resonance scattering effect.Plasmonics 7:185–190
12. Jiang ZL, Li JS, Wen GQ, Liu QY, Liang AH (2010) Nanocatalyticresonance scattering spectral analysis. Sci China Chem 53(5):1049–1054
13. Liu R, Liu JF, Zhou XX, Jiang GB, Liu R (2011) Applications ofRaman-based techniques to on-site and in-vivo analysis. Tr AnalChem 30:1462–1476
14. Smith WE (2008) Practical understanding and use of surfaceenhanced Raman scattering/surface enhanced resonance Ramanscattering in chemical and biological analysis. Chem Soc Rev37:955–964
15. Chen JW, Liu XP, Feng KJ, Liang Y, Jiang JH, Shen GL, Yu RQ(2008) Detection of adenosine using surface-enhanced Raman
Plasmonics (2013) 8:899–911 909
scattering based on structure-switching signaling aptamer. BiosensBioelectron 24:66–71
16. Cho H, Baker BR, Wachsmann-Hogiu S, Pagba CV, Laurence TA,Lane SM, Lee LP, Tok JBH (2008) Aptamer-based SERRS sensorfor thrombin detection. Nano Lett 8:4386–4390
17. Jiang ZL, Yao DM, Wen GQ, Li TS, Chen B, Liang AH (2013) Alabel-free nanogold DNAzyme-cleaved surface-enhanced reso-nance Raman scattering method for trace UO2
2+ using rhodamine6G as probe. Plasmonics 8. doi:10.1007/s11468-012-9476-8
18. Wen GQ, Lin CY, Tang ML, Liu GS, Liang AH, Jiang ZL (2013)A highly sensitive aptamer method for Ag+ using resonanceRayleigh scattering as detection technique and the modified-nanogold as probe. RSC Adv 3. doi:10.1039/C2RA22542E
19. Liu QY, Wei L, Wang LS, Liang AH, Jiang ZL (2012) A label-freeDNAzyme resonance Rayleigh scattering assay for trace Pb2+ basedon nanogold catalysis of HAuCl4-ascorbic acid particle reaction.Anal Lett 45:2737
20. Ren B, Li JF, Huang YF, Zeng ZC, Tian ZQ (2010) Electrochemicalsurface-enhanced Raman spectroscopy—current status and perspec-tive electrochemistry. Chin J Electrochem 16:305–316
21. Ni DD, Wang WW, Yao JL, Zhang XJ, Gu RA (2011)Fabrication of reproducible surface enhanced Raman scatter-ing substrate and its application. Spectroscopy and SpectralAnalysis 31:394–397
22. Wang YL, Irudayaraj J (2011) A SERS DNAzyme biosensor forlead ion detection. Chem Commun 47:4394–4396
23. Dougan JA, Faulds K (2012) Surface enhanced Raman scatteringfor multiplexed detection. Analyst 137:545–554
24. Miller GA (1978) Fluctuation theory of the resonance enhance-ment of Rayleigh scattering in absorbing media. J Phys Chem 82(5):616–618
25. Li YF, Huang CZ, Hu XL (1998) The principles and the applicationsof resonance light scattering technique in the research of biochemis-try and bioanalysis. Chin J Anal Chem 26(12):1508–1512
26. Jiang ZL (2003) Nanoparticle and resonance scattering spectros-copy. Guangxi Normal University Press, Guilin, p 159
27. Jiang ZL, Fan YY, Chen ML, Liang AH, Liao XJ, Wen GQ, ShenXC, He XC, Pan HC, Jiang HS (2009) Resonance scatteringspectral detection of trace Hg(II) using aptamer modified nanogoldas probe and nanocatalyst. Anal Chem 81:5439–5445
28. Zhang JQ, Wang YS, He Y, Jiang T, Yang HM, Tan X, Kang RH,Yuan YK, Shi LF (2010) Determination of urinary adenosine usingresonance light scattering of gold nanoparticles modified structure-switching aptamer. Anal Biochem 397:212–217
29. Zhang Y (2011) Aptamer-nanogold RS spectral method for thedetermination of Hg and U [D]. Guangxi Normal University,Guilin
30. Liang AH, Li JS, Jiang CN, Jiang ZL (2010) Highly selectiveresonance scattering detection of the trace thrombin using aptamer-modified AuRe nanoprobe. Bioproc Biosyst Eng 33(9):1087–1094
31. Jiang ZL, Zhou LP, Liang AH (2011) Resonance scattering detec-tion of trace melamine using aptamer-modified nanosilver probe ascatalyst without separation of its aggregations. Chem Commun 47(11):3162–3164
32. Liang AH, Ouyang HX, Jiang ZL (2011) Resonance scatteringspectral detection of trace ATP based on label-free aptamer reac-tion and nanogold catalysis. Analyst 136(21):4514–4519
33. Liang AH, Zhang J, Cai W, Jiang ZL, Li TS, Yao JN, Shang GY(2011) A highly sensitive resonance scattering spectral assay forHg2+ based on the aptamer-modified AuRu nanoparticle-NaClO3-NaI-cationic surfactant catalytic reaction. Anal Lett 44(8):1442–1453
34. Wen GQ, Liang AH, Jiang ZL, Liao XJ, Li JF, Jiang HS (2010)Resonance scattering spectral detection of ultratrace Hg(II) using her-ring sperm DNA modified nanogold probe as catalyst. Luminescence25(5):373–377
35. Wen GQ, Li JF, Liang AH, Jiang ZL, He XC (2010) Resonancescattering spectral detection of trace Hg2+ using herring spermDNA modified nanogold as catalyst of the Fehling reaction. ActaChim Sin 68(1):83–88
36. Jiang ZL, Wen GQ, Fan YY, Jiang CN, Liu QY, Huang Z,Liang AH (2010) A highly selective nanogold-aptamer catalyticresonance scattering spectral assay for trace Hg2+ usingHAuCl4-ascorbic acid as indicator reaction. Talanta 80(3):1287–1291
37. Jiang ZL, Zhang J, Wen Q, Liang AH, Liu QY, Kang CY, He XC(2010) Aptamer-modified AuRe nanoalloy probe for trace Hg2+
using resonance scattering as detection technique. Chin J Chem 28(7):1159–1164
38. Ling SM, Fan YY, Jiang ZL, Wen GQ, Liu QY, Liang AH(2010) Resonance scattering spectral detection of trace Pb2+using aptamer modified nanogold as a probe. Acta Chim Sin68(4):339–344
39. Jiang ZL, Fan YY, Liang AH, Wen GQ, Liu QY, Li TS(2010) Resonance scattering spectral detection of trace Pb2+
using aptamer modified AuPd nanoalloy as probe. Plasmonics5(4):375–381
40. Liu QY, Fan YY, Li TS, Liang AH, Jiang ZL (2010) Resonancescattering spectral detection of trace K+ by aptamer-modified nano-gold probe. Spectroscopy and Spectral Analysis 30(11):3115–3118
41. Liang AH, Zhang Y, Fan YY, Chen CQ, Wen GQ, Liu QY, KangCY, Jiang ZL (2011) Catalysis of aptamer-modified AuPd nano-alloy probe and its application to resonance scattering detection oftrace UO2
2+. Nanoscale 3(8):3178–318442. Fleischmann M, Hendra PJ, McQuillan AJ (1974) Raman spectra
of pyridine adsorbed at a silver electrode. Chem Phy Lett 26(2):163–166
43. Jeanmaire DL, Van Duyne RP, Sloan AP (1977) Surface Ramanspectroelectrochemistry: part I. Heterocyclic, aromatic, and ali-phatic amines adsorbed on the anodized silver electrode. JElectroanal Chem Interfac Electrochem 84(1):1–20
44. Albrecht MG, Creighton JA (1977) Anomalously intense Ramanof pyridine at a silver electrode. J Am Chem Soc 99(15):5215–5217
45. Zhang SM (2008) Laser scattering spectroscopy. Science, Beijing,p p452
46. Aroca R, Bujalski R (1999) Surface enhanced vibrational spectraof thymine. Vib Spectrosc 19:11–21
47. Luo XL, Buckhout-White S, Bentley WE, Rubloff GW (2011)Biofabrication of chitosan-silver composite SERS substratesenabling quantification of adenine by a spectroscopic shift.Biofabrication 3(3):1–9
48. Sha MY, Xu HX, Natan MJ, Cromer R (2008) Surface-enhancedRaman scattering tags for rapid and homogeneous detection ofcirculating tumor cells in the presence of human whole blood. JAm Chem Soc 130(51):17214–17215
49. Hajdukova N, Prochazka M, Molnar P, Stepanek J (2008) SERRSof free-base porphyrins on immobilized metal gold and silvernanoparticles. Vib Spectrosc 48(1):142–147
50. Chowdhury J (2010) Adsorption of 2-aminobenzothiazole onnano-colloidal silver surface: a concentration and time dependentSERS study aided by density functional theory. Vib Spectrosc52:85–92
51. Samanta A, Maiti KK, Soh KS, Liao XJ, Vendrell M, Dinish US,Yun SW, Bhuvaneswari R, Kim H, Rautela S, Chung J, Olivo M,Chang YT (2011) Ultrasensitive near-infrared Raman reporters forSERS-based in vivo cancer detection. Angew Chem Int Ed 50(27):6089–6092
52. Luo YH, Li K, Wen GQ, Liu QY, Liang AH, Jiang ZL (2012) Arapid surface-enhanced Raman scattering method for the determi-nation of trace Hg2+ using rhodamine 6G-aggregated nanosilver asprobe. Plasmonics 7:461–468
910 Plasmonics (2013) 8:899–911
53. Halvoson RA, Vikesland PJ (2010) Surface-enhanced Ramanspectroscopy (SERS) for environmental analyses. Environ SciTechnolog 44(20):7749–7755
54. Vongsvivut REG, McNaughton D (2010) Surface-enhanced Ramanspectroscopic analysis of fonofos pesticide adsorbed on silver andgold nanoparticles. J Raman Spectroscopy 41:1137–1148
55. Gao SY, Zhang SX, Yang X, Zhang HJ (2007) Surface-enhancedRaman scattering active substrates. Chemistry 12:908–914
56. Cho H, Baker BR, Hogiu SW, Pagba CV, Laurence TA, Lane SM,Lee LP, Tok JBH (2008) Aptamer-based SERRS sensor for throm-bin detection. Nano Lett 8(12):4386–4390
57. He LL, Lamont E, Veeregowda B, Sreevatsan S, Haynes CL,Gonzalez FD, Labuza TP (2011) Aptamer-based surface-enhancedRaman scattering detection of ricin in liquid foods. Chem Sci 2(8):1579–1582
58. Chen JW, Jiang JH, Gao X, Liu GK, Shen GL, Yu RQ (2008) Anew aptameric biosensor for cocaine based on surface-enhancedRaman scattering spectroscopy. Chem Eur J 14(27):8374–8382
59. Han D, Lim SY, Kim BJ, Piao LL, Chung TD (2010) Mercury(II)detection by SERS based on a single gold microshell. ChemCommun 46:5587–5589
60. Senapati T, Senapati D, Singh AK, Fan Z, Kanchanapally R, RayPC (2011) Highly selective SERS probe for Hg(II) detection usingtryptophan-protected popcorn shaped gold nanoparticles. ChemCommun 47(37):10326–10328
61. Li M, Zhang JM, Suri S, Sooter LJ, Ma DL, Wu NQ (2012)Detection of adenosine triphosphate with an aptamer biosensorbased on surface-enhanced Raman scattering. Anal Chem84:2837–2842
62. Neumann O, Zhang D, Tam F, Lal S, Stafshede PW, Halas NJ(2009) Direct optical detection of aptamer conformational changesinduced by target molecules. Anal Chem 81(24):10002–10006
63. Fabris L, Schierhorn M, Moskovits M, Bazan GC (2010) Aptatag-based multiplexed assay for protein detection by surface-enhancedRaman spectroscopy. Small 6(14):1550–1557
64. Kang T, Yoo SM, Yoon I, Lee SY, Kim B (2010) Patternedmultiplex pathogen DNA detection by Au particle-on-wire SERSsensor. Nano Lett 10(4):1189–1193
65. Wang YL, Wei H, Li BL, Ren W, Guo SJ, Dong SJ, Wang EK(2007) SERS opens a new way in aptasensor for protein recogni-tion with high sensitivity and selectivity. Chem Commun 48:5220–5222
66. Wen GQ, Zhou LP, Li TS, Liang AH, Jiang ZL (2010) A sensitivesurface-enhanced Raman scattering method for determination ofmelamine with aptamer-modified nanosilver probe. Chin J Chem30(4):869–874
67. Dougan JA, MacRae D, Graham D, Faulds K (2011) DNA detec-tion using enzymatic signal production and SERS. Chem Commun47:4649–4651
68. Kang T, Yoo SM, Yoon I, Lee S, Choo J, Lee SY, Kim B (2011) Aunanowire-on-film SERRS sensor for ultrasensitive Hg2+ detection.Chem Eur J 17:2211–2214
69. Wang GQ, Chen ZP, Chen LX (2010) Aptamer-nanoparticle-basedoptical probes. Progress in Chemistry 22(3):489–499
70. Sun YH, Kong RM, Lu DQ, Zhang XB, Meng HM, Tan W, ShenGL, Yu RQ (2011) A nanoscale DNA-Au dendrimer as a signalamplifier for the universal design of functional DNA-based SERSbiosensors. Chem Commun 47(13):3840–3842
Plasmonics (2013) 8:899–911 911