Embed Size (px)
Citation preview
Guillermic, M., Lalonde, S., Hendry, K., & Rouxel, O. (2017). Theisotope composition of inorganic Germanium in seawater and deepsea sponges. Geochimica et Cosmochimica Acta, 212, 99-118.https://doi.org/10.1016/j.gca.2017.06.011
Peer reviewed versionLicense (if available):CC BY-NC-NDLink to published version (if available):10.1016/j.gca.2017.06.011
Link to publication record in Explore Bristol ResearchPDF-document
This is the accepted author manuscript (AAM). The final published version (version of record) is available onlinevia Elsevier at https://doi.org/10.1016/j.gca.2017.06.011 . Please refer to any applicable terms of use of thepublisher.
University of Bristol - Explore Bristol ResearchGeneral rights
This document is made available in accordance with publisher policies. Please cite only thepublished version using the reference above. Full terms of use are available:http://www.bristol.ac.uk/red/research-policy/pure/user-guides/ebr-terms/
1
The isotope composition of inorganic Germanium in seawater and deep sea 1
sponges 2
3
4
5
Maxence Guillermic1, Stefan V. Lalonde1, Katharine R. Hendry2, Olivier J. Rouxel3,4* 6
7
1 Institut Universitaire Européen de la Mer, Laboratoire Domaines Océaniques UMR 6538, 8
Université de Brest, BP 80 F- 29280 Plouzané, France 9
2 School of Earth Science, University of Bristol, Wills Memorial Building, Queen’s Road, 10
Bristol BS8 IRJ, UK 11
3 IFREMER, Centre de Brest, Unité Géosciences Marines, 29280 Plouzané, France 12
4 University of Hawaii, Department of Oceanography, Honolulu, HI 96822, USA 13
14
15
16
17
18
19
Submitted to Geochimica et Cosmochimica Acta 20
21
22
23
*Corresponding author: 24
E-mail address: [email protected] 25
26
2
Abstract 27
Although dissolved concentrations of germanium (Ge) and silicon (Si) in modern seawater 28
are tightly correlated, uncertainties still exist in the modern marine Ge cycle. Germanium 29
stable isotope systematics in marine systems should provide additional constraints on marine 30
Ge sources and sinks, however the low concentration of Ge in seawater presents an analytical 31
challenge for isotopic measurement. Here, we present a new method of pre-concentration of 32
inorganic Ge from seawater which was applied to measure three Ge isotope profiles in the 33
Southern Ocean and deep seawater from the Atlantic and Pacific Oceans. Germanium 34
isotopic measurements were performed on Ge amounts as low as 2.6 ng using a double-spike 35
approach and a hydride generation system coupled to a MC-ICP-MS. Germanium was co-36
precipitated with iron hydroxide and then purified through anion-exchange chromatography. 37
Results for the deep (i.e. > 1000 m depth) Pacific Ocean off Hawaii (nearby Loihi Seamount) 38
and the deep Atlantic off Bermuda (BATS station) showed nearly identical δ74/70Ge values at 39
3.19 ± 0.31 ‰ (2SD, n = 9) and 2.93 ± 0.10 ‰ (2SD, n = 2), respectively. Vertical 40
distributions of Ge concentration and isotope composition in the deep Southern Ocean for 41
water depth > 1300 m yielded an average δ74/70Ge = 3.13 ± 0.25 ‰ (2SD, n = 14) and Ge/Si = 42
0.80 ± 0.09 mol/mol (2SD, n = 12). Significant variations in δ74/70Ge, from 2.62 to 3.71 ‰, 43
were measured in the first 1000 m in one station of the Southern Ocean near Sars Seamount 44
in the Drake Passage, with the heaviest values measured in surface waters. Isotope 45
fractionation by diatoms during opal biomineralization may explain the enrichment in heavy 46
isotopes for both Ge and Si in surface seawater. However, examination of both 47
oceanographic parameters and δ74/70Ge values suggest also that water mass mixing and 48
potential contribution of shelf-derived Ge also could contribute to the variations. Combining 49
these results with new Ge isotope data for deep-sea sponges sampled nearby allowed us to 50
determine a Ge isotope fractionation factor of -0.87 ± 0.37 ‰ (2SD, n = 12) during Ge uptake 51
by sponges. Although Ge has long been considered as a geochemical twin of Si, this work 52
underpins fundamental differences in their isotopic behaviors both during biomineralization 53
processes and in their oceanic distributions. This suggests that combined with Si isotopes, Ge 54
isotopes hold significant promise as a complementary proxy for delineating biological versus 55
source effects in the evolution of the marine silicon cycle through time. 56
57
Keywords: stable isotopes, germanium, silicon, sponges, Southern Ocean, chemical 58
oceanography 59
3
60
1. Introduction 61
Germanium (Ge) has long been considered a pseudo-heavy isotope of silicon (Si) 62
because it displays similar behavior in marine and terrestrial environments (Froelich and 63
Andreae, 1981). Dissolved inorganic Ge concentrations in seawater range from 0 to about 64
200 pM and display a correlation with dissolved silica that is remarkably consistent across the 65
world’s oceans, underlying its potential as a complementary tracer for marine silicon cycling 66
(Froelich and Andreae, 1981; Froelich et al., 1985a; Froelich et al., 1985b; Ellwood and 67
Maher, 2003). Relatively constant Ge/Si ratios of 0.76 µmol/mol in seawater worldwide 68
suggest that Ge/Si is not fractionated during biological uptake (Murnane and Stallard, 1988; 69
Froelich et al., 1989), although a preferential uptake of Si versus Ge has been observed at low 70
Si concentrations (< 6 µM) (Ellwood and Maher, 2003). 71
It has been generally thought that oceanic Ge/Si ratios reflect primarily the Ge/Si 72
ratios of the different sources and sinks of Ge and Si in seawater. Seafloor hydrothermal vent 73
fluids at mid-ocean ridges, ridge flanks and volcanic seamounts have Ge/Si ratios of 8 to 14 74
µmol/mol (Mortlock and Froelich, 1987; Wheat and McManus, 2008; Escoube et al., 2015) 75
whereas Ge/Si ratios in rivers are about 0.54 µmol/mol, with significant temporal and spatial 76
variations (0.1 to 2.5 µmol/mol) that depend on weathering regimes (Mortlock and Froelich, 77
1987; Kurtz et al., 2011). Ge/Si in rivers is depressed relative to bulk continental crust (Ge/Si 78
= 1.3 µmol/mol) due to the affinity of Ge for iron oxyhydroxides, organic compounds and 79
secondary soil silicates (Kurtz et al., 2002). The elevated Ge/Si ratio of seafloor hydrothermal 80
fluids is likely the result of mineral-fluid partitioning in the reaction zone and the subsurface 81
precipitation of silicate minerals that fractionate against Ge (Mortlock et al., 1993; Pokrovski 82
and Schott, 1998; Escoube et al., 2015). While the major sink of Si in seawater is the burial of 83
biogenic opal in sediments, mass balance of Ge in seawater requires the existence of a non-84
opal sink, probably associated with an Fe-rich authigenic sink (Hammond et al., 2000; King 85
et al., 2000; McManus et al., 2003; Baronas et al., 2016). 86
Capitalizing on the promise of the Ge/Si proxy, several studies have explored the use 87
of Ge isotope ratios [defined as 74/70Ge = 1000*(74Ge/70Gesample / 74Ge/70GeNIST3120a - 1) as a 88
new geochemical tracer of Ge sources and behavior in oceanic environments and 89
hydrothermal systems (Rouxel et al., 2006; Siebert et al., 2006; Qi et al., 2011; Siebert et al., 90
2011; Escoube et al., 2012; Belissont et al., 2014; Escoube et al., 2015). Based on the Ge 91
isotope composition of modern marine biogenic opal (e.g. sponges and diatoms), previous 92
4
studies have suggested that the Ge isotopic composition of seawater is enriched in heavy 93
isotopes relative to the oceanic crust by up to 2.5 ‰ (Mantoura, 2006; Rouxel et al., 2006). 94
This indirect estimation of the Ge isotope composition of seawater has been used to establish 95
a preliminary isotopic mass balance for Ge in seawater (Escoube et al., 2015). However, due 96
to analytical challenges, the Ge isotopic composition of seawater – and the driving 97
mechanisms behind isotopic fractionation in the marine system – remain unknown. 98
Considering the wealth of previous studies investigating the variations of Si isotopes in 99
seawater (Reynolds et al., 2006; Grasse et al., 2013; de Souza et al., 2014; Cao et al., 2015), 100
the study of Ge isotope systematics in seawater has strong potential both in terms of assessing 101
the global budget of Ge in seawater and also as an oceanographic proxy that could be used in 102
conjunction with Si isotopes to better understand changes in silicon cycling. 103
Here, we report a method for the pre-concentration and Ge isotope analysis of 104
dissolved inorganic Ge in seawater using online hydride-generation coupled to multi-105
collector inductively coupled plasma mass spectrometry (MC-ICP-MS). This method is 106
adapted from techniques described previously (Rouxel et al., 2006; Siebert et al., 2006; 107
Siebert et al., 2011; Escoube et al., 2012) and involves: (1) the addition of Ge double-spike 108
(73Ge, 70Ge) to correct for both instrumental mass bias and Ge isotope fractionation during 109
sample preparation; (2) pre-concentration of inorganic Ge by co-precipitation with iron 110
hydroxide (Fe(OH)3), (3) recovery and dissolution of Fe(OH)3 followed by anion-exchange 111
chromatographic purification of Ge, (4) gaseous hydride introduction into the plasma torch 112
allowing for high sensitivity and aqueous matrix-free isotope analysis. We applied this 113
method to obtain the first Ge isotope profiles in seawater using a set of samples from the 114
Southern Ocean that were previously investigated for Si isotopes (Hendry et al., 2010). We 115
also report new measurements of deep seawater from the Atlantic and Pacific Oceans. By 116
comparing δ74/70Ge from sponges and co-located seawater, we also determined the potential 117
influence of biological uptake on fractionation of Ge isotopes and Ge/Si. 118
119
2. Materials and methods 120
121
2.1. Sample collection 122
Seawater samples and sponges from the Southern Ocean were collected in May 2011 123
from the Drake Passage (Southern Ocean) aboard the R/V Nathaniel B. Palmer. Seawater 124
5
samples were obtained at three stations; "Sars" (59.753°S, 69.057°W; bottom depth at 3141 125
m) nearby the Sars seamount, "Burdwood Bank" (55.054°S, 62.100°W; bottom depth at 4191 126
m), and West Antarctic Peninsula (WAP) off Slope (62.067°S, 62.583°W; bottom depth at 127
4726 m) (Fig. 1). Sampling depths ranged from 2.8 to 3100 m for "Sars", 501 to 4110 m for 128
"Burdwood Bank" and 4.7 to 4718 m for "WAP". Hence, surface seawater was sampled only 129
at two stations. The samples were collected in Niskin bottles during the deep water CTD 130
casts, filtered through 0.4 μm Supor membranes (Pall acropak filters) and stored in pre-131
cleaned 4 L HDPE bottles. The seawater samples were acidified immediately with 132
hydrochloric acid (Optima grade) to reach a final concentration of 0.1 % v/v and stored until 133
further processing in April 2015. Inorganic Si(OH)4 (referred to as Si in this paper) 134
concentration analyses of seawater were carried out at Woods Hole Oceanographic Institution 135
and have been previously reported in Hendry et al. (2010). 136
Sponge samples were obtained from living specimens previously investigated for their 137
Si and Zn isotope signatures (Hendry et al., 2010; Hendry and Andersen, 2013). We selected 138
samples from a north-south transect across the Scotia Sea and Drake Passage, with additional 139
samples from the Scotia Sea, encompassing a range of bottom-water Si concentrations (12 to 140
120 μM) and depths (320 to 2266 m). Sponges were collected aboard the R/V Nathaniel B. 141
Palmer (April-May 2008) by either benthic trawl or dredge, and were subsequently stored 142
dried or frozen. 143
Surface and deep seawater samples from the North Atlantic were obtained from the 144
GEOTRACES IC1 BATS Atlantic intercalibration station (31.667°N; 64.167°W) (Boyle et 145
al., 2012). Although Ge is not considered strictly as contamination-prone element, we 146
selected these samples for documenting potential analytical bias using regular Niskins bottles 147
versus GEOTRACES-compliant rosettes. This set of samples also allows future 148
interlaboratory comparison of seawater Ge isotope values. The GEOTRACES Surface 149
Isotope (GSI) sample was obtained from a 4 L split of a ~500 L tank filled with near surface 150
(7 m) water pumped from the UCSC towed fish. The GEOTRACES Deep Isotope (GDI) 151
sample was obtained from a 4 L split of a ~250 L tank filled from all 24 GO-Flo bottles on 152
the US GEOTRACES trace metal rosette at 2000 m. All samples were filtered on-board at 153
0.2 μm using Pall Acropak capsule filters and stored acidified at pH 1.8 with purified 6 M 154
HCl. 155
Deep seawater from the Pacific Ocean was obtained from 3 stations: FeMO Deep 156
(18.700°N;, 155.183°W), Shinkai Deep (18.767°N, 155.117°W) and South West Loihi 157
6
(18.867°N, 155.300°W). Samples from FeMO Deep were recovered during the cruise FeMO 158
2009 (R/V Kilo Moana) in October 2009, southeast of the Loihi Seamount (Edwards et al., 159
2011). Samples from Shinkai Deep and SW Loihi were recovered during the cruise Loihi 160
2014 (R/V Falkor) in July 2014 at the base and around the summit of the Loihi Seamount, 161
respectively. All seawater samples were collected by CTD rosette using 12 L Niskin bottles 162
internally sprung with silicone. Although Loihi Seamount is known for having significant 163
hydrothermal activity at its summit with westward dispersal of a hydrothermal plume 164
containing high concentrations of Fe (Bennett et al., 2011) and potentially Ge (Escoube et al., 165
2015), we selected samples from areas and water-depths that were removed from the 166
hydrothermal plume (i.e. absence of Fe and Mn anomalies). Because the typical sample size 167
was limited to 1 L, we pooled several samples from a similar range of water depths to obtain 168
sample sizes of 3.5 to 4 L. Hence, for these samples, only the depth range is reported. We 169
analyzed both filtered (through 0.2 μm Supor filters) and unfiltered samples that were 170
acidified to pH 1.8 with 6M HCl (optima grade; Fisher Chemical) prior to analysis. 171
Large volumes of coastal surface seawater were used for the initial stages of analytical 172
development related to Ge pre-concentration and isotope analysis. This internal standard was 173
obtained from the Bay of Brest in March 2015. It was filtered to 0.45 µm and acidified to pH 174
2 using concentrated single distilled hydrochloric acid. 175
176
2.2. Reagents and germanium standard solutions 177
178
The NIST SRM 3120a elemental standard solution (Lot #000411, 10 mg/g) is used in 179
this study as a Ge reference standard, and has been calibrated against other internal standards 180
used in previous Ge isotope studies (Escoube et al., 2012). We used the same double-spike 181
previously employed by Escoube et al. (2012; 2015), prepared from Ge metal spikes 73Ge and 182
70Ge purchased from Isoflex USA (Ge-70 #32-01-70-3259 and Ge-73 #32-01-73-1405). Each 183
spike was dissolved separately and we obtained the following composition for the double-184
spike: 74Ge/70Ge = 0.07614 ± 0.00010; 73Ge/70Ge = 0.60707 ± 0.00008; 72Ge/70Ge = 0.05626 185
± 0.00008 (2sd uncertainties). 186
Iron(III) solution used for Ge co-precipitation was prepared by dissolution of 187
FeCl3·6H2O salt (Acros Organics) in 6 M HCl (single distilled HCl). In order to decrease 188
reagent blanks, the solution was evaporated at 120°C to remove Ge impurities by the 189
7
formation of volatile GeCl4 species (Kaya and Volkan, 2011; Luais, 2012). The stock Fe(III) 190
solution was adjusted to a Fe concentration of 12,000 ppm in 3 M HCl. 191
The hydride generation reagent was made of 10 g of sodium borohydride powder 192
(high purity NaBH4; Fisher Chemical) and 5 g of sodium hydroxide pellets (analytical grade; 193
Acros Organics) dissolved in 1 L of ultrapure water (Milli-Q 18.2 M·cm) and was prepared 194
freshly before each analytical session. During chemical dissolution and purification, high 195
purity HNO3 (distilled grade) and HF (optima grade; Fisher Chemical) were used. 196
197
2.3. Preconcentration of inorganic Ge from seawater 198
The double-spike (70Ge and 73Ge) was first added to the sample bottle to a 199
spike/natural weight ratio, referred hereafter as s/n, of about 1.0. Although Escoube et al. 200
(2012) showed that Ge isotope measurements are still acceptable with a s/n ratio ranging 201
from 0.4 to 8, we found that a narrower s/n ratio of 0.7 to 1.3 provided optimal analytical 202
conditions. Hence, this method requires the prior knowledge of Ge concentration in the 203
samples. In practice, the natural concentration of Ge was estimated by using the average 204
Ge/Si ratio for seawater and known Si concentrations (or water depth). The double-spike was 205
added to the acidified seawater samples and left to equilibrate for at least 2 hours. 206
Experiments done with longer equilibration time revealed no effect on the isotopic value or 207
Ge recovery. 208
About 4 mL of Fe(III) solution at 12,000 ppm Fe was added per liter of seawater, in 209
order to obtain a final solution of about 12 mg Fe/L, and left to equilibrate for two hours. The 210
solution pH was then increased to pH 8 ± 0.3 with concentrated optima-grade ammonia 211
(NH4OH) solution at 14M. Germanium co-precipitation with Fe hydroxides is achieved after 212
100 min (Pokrovsky et al., 2006). Analytical-grade NaOH solution at 8M was used in the 213
initial stage of the experimental development but was discontinued due to significant blank 214
contribution. A contamination of Ge in the NaOH pellets was suspected. The solution was 215
left for at least 12 hours to flocculate. Then, the supernatant was siphoned off and the 216
remaining slurry was transferred into 50mL centrifuge tubes. Fe-oxyhydroxide precipitates 217
were finally recovered after centrifugation at 1500G for 4 minutes. The solid residue was 218
then processed as other mineral or biogenic opal samples as described below. 219
220
2.4. Sponge spicule preparation 221
8
Preparation of the modern sponge spicules followed the protocol described in Hendry 222
et al. (2010) for the measurements of Si isotopes, and was carried out in the Department of 223
Earth Sciences, Oxford University. The modern spicules were initially separated from 224
organic matter by repeatedly heating and sonicating in concentrated HNO3 and 30 % H2O2. 225
Sediment grains were removed by picking until visual inspection showed the spicules to be 226
clear of detritus. The spicules were then additionally cleaned of any remaining organic matter 227
and surface contaminants using three steps: 1) reductive cleaning using hydroxylamine 228
chloride (0.1 %)/acetic acid solution (1 %), 2) etching with sodium fluoride (0.1 % NaF) and 229
3) oxidation with a strong acid solution (50 % HNO3:HCl, in-house distilled) following 230
previous methods (Ellwood et al., 2006). 231
232
2.5. Digestion and chromatographic separation 233
The method used in this study was derived from that used for Ge isotope analysis in 234
rocks and minerals developed in Rouxel et al. (2006). Both Fe-oxyhydroxide precipitates and 235
biogenic opal (avg. 50 and 25 mg, respectively) were dissolved with 1 mL of concentrated 236
HF in Teflon beaker, after addition of an appropriate quantity of Ge double-spike in the case 237
of biogenic opal. Samples were left for 2 hours on a hotplate at 90°C until dissolution was 238
complete. The samples were then left to cool at room temperature and then diluted to 1 M HF 239
using Milli-Q water. 240
An anion-exchange resin (AG1-X8, Bio-Rad, Hercules, CA, USA) was used for the 241
separation of Ge from Fe and other matrix elements and isobaric interferences that could 242
form volatile hydride (e.g. Se). A total of 24 LDPE columns were filled with 1.8 mL of resin 243
(wet volume) and cleaned with 10 mL washes of 3M HNO3, 0.28M HNO3 and Milli-Q water, 244
before being conditioned with 5 mL of 1M HF. The sample was loaded and fluorinated Ge 245
was strongly adsorbed on the resin. 5 mL of 1M HF was used to elute most of the elements of 246
the initial matrix followed by 3mL of Milli-Q water. Finally, Ge was eluted with 10mL of 247
0.28M HNO3. The solution was recovered, evaporated to dryness on a hotplate at 80°C and 248
re-dissolved in a precise volume of 0.28M HNO3 so that all samples attained an identical final 249
Ge concentration (typically 5ppb) for isotope analysis by hydride generation MC-ICP-MS. 250
251
2.6. Hydride generation (HG) MC-ICP-MS analysis 252
9
All measurements were carried out on a Thermo Scientific instrument MC-ICP-MS 253
Neptune (PSO-IFREMER) with similar operating conditions as described in Escoube et al. 254
(2012). An online hydride generation system (CETAC, HGX-200) was used to generate Ge 255
hydride by mixing the Ge sample solution with NaBH4 solution. This system is similar to 256
previous studies (Rouxel et al., 2006) as it used two Argon inlets to transport Ge hydride and 257
stabilize signal intensity, and an on-line PTFE filter to prevent aerosols from reaching the 258
plasma. The sample and NaBH4 solutions were introduced at the same flow rate of about 150 259
µl/min and were mixed in a 10 cm-long reaction coil before entering the gas-liquid separator. 260
The Neptune instrument was operated in low mass resolution mode, and 70Ge, 72Ge, 261
73Ge and 74Ge were measured on L2, C, H1 and H2 cups, whilst 68Zn, 69Ga, 71Ga and 77Se 262
were also monitored on L4, L3, L1 and H4 cups. The isotope 76Ge was not measured because 263
of a major interference from 38Ar2. The NIST 3120a standard solution was measured with the 264
same instrumental set-up before and after each sample analysis. Each analysis consisted of 5 265
blocks of 6 measurements (2 seconds integration time per measurement). The Ge isotope 266
composition of each block of measurements was calculated using the double-spike data 267
reduction scheme presented in Siebert et al. (2001) for Mo isotopes. Data for each sample 268
were then processed by removing the 5 % most extreme δ74/70Ge values (outside 2SD) and 269
normalized to average NIST 3120a values measured before and after the sample. The internal 270
error was reported as two standard errors (2SD/√n) calculated using 5 blocks of 6 271
measurements each. External precision (as 2SD) of the sample was determined by calculating 272
the standard deviation of all NIST 3120a standards measured during the same analytical 273
session. 274
275
3. Results 276
277
3.1. Procedural blank and Ge recovery from seawater 278
During the initial stage of the analytical development, we observed significant 279
contamination of the pure Fe(III) salt used for Ge co-precipitation of approximately 0.1 ng 280
Ge per mg of Fe. Considering that up to 200 mg of Fe(III) was used per sample, this level of 281
Ge blank precluded the analysis of Ge-depleted surface seawater. After further evaporation of 282
the Fe(III) solution in 6 M HCl, Ge blanks were lowered to 0.01 ng/mg Fe. The procedural 283
blanks were determined for each sample set by processing 1 to 4L of spiked ultrapure water 284
10
as an unknown sample. We determined an overall procedural blank ranging from 0.5 ng to as 285
low as 0.1 ng, which may be either resulting from Ge impurities in both the Fe(III) solution 286
and the NaOH or NH4OH used to raise the pH for the co-precipitation step. This corresponds 287
to an equivalent Ge concentration in seawater of 4L-size seawater ranging from 1.8 pM to 0.2 288
pM. By comparison, Ge blanks determined for the chromatographic separation only were 289
below the detection limit of 0.01 ng, and therefore negligible. For surface seawater, the total 290
amount of Ge recovered from a 4L-size sample was about 6 ng, so a maximum of 0.5 ng 291
blank would correspond to up to 25 % of the measured signal, which requires careful 292
examination of its effect on Ge isotope composition. Several lines of evidences suggest that 293
blank contamination did not affect significantly our surface seawater measurement within 294
analytical uncertainty. First, the comparison between surface and deep seawater at BATS 295
(Table 1) and deep Pacific seawater yielded similar δ74/70Ge at 3.1 ± 0.3 ‰ despite significant 296
concentration differences (from 7pM to 117 pM). We also did not observe any positive 297
correlation between Ge/Si and Ge concentration in Ge-depleted surface seawater (Table 2), 298
which would be expected if significant amounts of Ge were derived from blank 299
contamination. We also attempted to measure the Ge isotope composition of the procedural 300
blank and obtained a δ74/70Ge value of 1.6 ± 0.2 ‰ for Ge quantity of 0.4 ng, which is within 301
the range of natural Ge composition (e.g. between crustal and seawater values). For deep 302
seawater with Ge concentrations above 50 pM, the blanks were in all cases negligible with a 303
contribution of less than 3 % of the total measured signal. 304
Although the use of Ge double-spike should correct for potential Ge isotope mass 305
fractionation in the case of incomplete recovery, we evaluated a range of co-precipitation 306
conditions in order to optimize Ge recovery and decrease the overall sample size. It is 307
expected that the recovery yield of Ge using the Fe co-precipitation technique would be 308
dependent on the final sample pH, the amount of Fe-oxyhydroxide in suspension, and the 309
overall kinetics of Ge adsorption. Figure 2 presents the effect of pH and different iron 310
additions on the Ge yield. Maximum adsorption of Ge occurred between pH 6 and 8, 311
regardless of the quantity of Fe(III) added to seawater. These results are generally consistent 312
with the study of Pokrovsky et al. (2006), who found a maximum adsorption of Ge at pH 313
between 6 and 9. However, the yields were lower in our study, and ranged from 70% to > 90 314
% which is probably explained by the much lower Fe concentration (i.e. about 1000-fold) 315
used for Fe coprecipitation compared to the experimental study of Pokrovsky et al. (2006). 316
Iron oxides are also known to co-precipitate a range of trace elements including oxyanions 317
11
and trace metals (e.g. Martinez and McBride, 1998; Raven et al., 1998). Although 318
competition between germanium and other solutes may occur during co-precipitation, we 319
found no significant correlation between yield and nutrient concentrations or depth. 320
321
3.2. Determination of analytical accuracy and potential effects of methylated Ge species 322
We evaluated the accuracy of the analytical procedure using a standard addition 323
method, similar to Rouxel et al. (2006), whereby incremental quantities of the Ge isotope 324
standard was added to an unknown sample. This method allows the robust determination of 325
the Ge concentration and Ge isotope composition of an unknown sample, and whether any 326
changes in the initial matrix-to-analyte ratio causes any analytical artifacts or residual 327
interferences. We used several aliquots of our internal seawater samples from the Bay of 328
Brest, which were doped with various amounts of the Ge NIST 3120a standard. The 329
composite samples were spiked and processed through the same chemical procedure as 330
unknown samples. The Ge concentration and Ge isotope composition of these composite 331
samples are presented in Fig. 3 along with two independent measurements of the pure 332
seawater sample. The relationship between 74/70Ge and Ge concentration values for the 333
composite sample and the percentage of Ge added follows the predicted mixing relationship, 334
with a74/70Ge value for Bay of Brest surface water estimated at 2.54 ± 0.41 ‰ (2SE) and 335
with a Ge concentration of 7.4 ± 0.8 pM (2SE). By comparison, the two independent Ge 336
isotopic measurements of Bay of Brest yielded δ74/70Ge value of 2.42 ± 0.07 ‰ (2SE) and 337
2.27 ± 0.16 ‰ (2SE), which are indistinguishable within uncertainty of the calculated value 338
above, thus confirming the accuracy of the method. 339
Because organometallic Ge species exist in seawater in methyl-Ge (MMGe) and 340
dimethyl-Ge (DMGe) forms (Lewis et al., 1985; Lewis et al., 1989), representing more than 341
70 % of the total Ge in the ocean, care should be taken to avoid the recovery of these species 342
during chemical preconcentration of inorganic Ge. The vertical profiles of MMGe and 343
DMGe in seawater typically show vertically homogeneous concentrations for both species 344
within analytical error of 340 ± 7 pM MMGe and 110 ± 3 pM DMGe (Lewis et al., 1985). 345
Hence, the sum of methylated Ge species in our surface seawater sample from the Bay of 346
Brest is expected to be about 450 pM, which is several orders of magnitude higher than the 347
measured inorganic Ge concentration of 7.4 pM. In spite of their higher abundances, 348
methylated Ge species are unlikely to have co-precipitated with inorganic Ge considering 349
their apparent absence of reactivity in a wide range of biogeochemical processes (Lewis et 350
12
al.,1985), including during early diagenesis leading to inorganic Ge sequestration in Fe-rich 351
marine sediments (King et al., 2000). This situation may be different using other analytical 352
methods involving the generation of volatile Ge hydride directly from seawater (Hambrick et 353
al., 1984). Considering that methylated (i.e. organically-bound) Ge species should have much 354
lighter Ge isotope composition than inorganic Ge species (Li et al., 2009), it is conceivable 355
that the slightly lighter value obtained for the Bay of Brest (δ74/70Ge = 2.4 ‰) compared to 356
deep oceanic waters (δ74/70Ge = 3.1 ‰, see below) could reflect a small proportion of 357
methylated species in our measurements. However, the comparison between surface and deep 358
seawater at BATS (Table 1) yielded similar δ74/70Ge values at about 3.0 ± 0.1 ‰ despite 359
significant concentration differences (7pM to 24 pM). Hence, using a simple mass balance 360
consideration, it is unlikely that methylated Ge species have any influence on the 361
measurement of inorganic Ge species. Moreover, Baronas et al. (2017) recently performed a 362
seawater Ge isotopic analyses separating inorganic Ge from methylated Ge using a liquid 363
nitrogen trapping technique and they obtained similar results for deep seawater at BATS. 364
Finally, it is unlikely that any significant amount of methylated Ge species was 365
converted to inorganic Ge during extended sample storage or exchanged isotopically with the 366
Ge double spike. Lewis et al. (1985) reported that MMGe and DMGe can be converted to 367
inorganic Ge by strong ultraviolet radiation only in freshwater medium, but not in seawater, 368
which confirmed the apparent stability of these compounds during sample storage, even in 369
acidic conditions. Previous studies (Mortlock and Froelich, 1996) have also demonstrated 370
that organogermanium species do not exchange with the inorganic Ge spike under similar 371
analytical conditions and equilibration time than in our study. Consequently, the methylated 372
Ge species are ignored in the present paper and Ge is used to indicate only the inorganic form 373
(predominantly germanic acid). 374
375
3.3. Seawater samples from the Atlantic and Pacific oceans 376
Germanium concentrations and isotopic compositions of the surface (GSI) and deep 377
(GDI) seawater samples from the GEOTRACES IC1 BATS Atlantic intercalibration station 378
(31°40′N 64°10′W) are presented in Table 1. For GS we obtained Ge = 7 pM and 74/70Ge = 379
3.09 ± 0.26 (2SE). For GD we obtained Ge = 24 pM and 74/70Ge = 2.89 ± 0.26 (2SE). By 380
comparison, Froelich et al. (1985a) reported inorganic Ge concentrations of 3.5 pM and 15.6 381
pM, respectively, in surface (10 m) and deep (2000 m) seawater of the Sargasso Sea. Hence 382
Ge concentrations are significantly higher than previously reported. It is possible that such 383
13
increase in Ge concentrations in surface seawater is related to the location of the BATS 384
station near Bermuda, which is a region with typically high seasonal dust deposition. This 385
hypothesis is supported by the fact that GSI and GDI have also relatively high Fe 386
concentrations (0.42 and 0.84 nM, respectively) compared to open seawater where dust 387
supply is more limited (Boyle et al., 2012; John and Adkins, 2012). For example, Fe 388
concentrations as low as 0.02 nM (20 times less than the present surface sample) have been 389
documented in the eastern Atlantic Ocean (Sarthou et al., 2003). On the other hand, if 390
significant contamination (i.e. analytical bias) contributed to the increase of Ge concentration 391
in surface seawater, the contaminant would need to have the same isotope composition (i.e. 392
74/70Ge ≈ 3.0 ‰) as the average seawater value, which is quite unlikely considering that Ge 393
in crustal materials has much lighter 74/70Ge (~ 0.7 ‰, Rouxel et al., 2006; Escoube et al., 394
2012) and our single measurement of procedural blank yielding 74/70Ge ~ 1.6 ‰. 395
Seawater samples from the Pacific Ocean located SW of Hawaii (FeMo Deep station) 396
and nearby Loihi Seamount show remarkable homogeneity in 74/70Ge and Ge concentrations 397
(Table 1). A comparison between unfiltered and filtered samples show a difference of less 398
than 2 % in Ge concentrations and less than 0.3 ‰ in 74/70Ge values - both being close to the 399
analytical uncertainties. Considering that both filtered and unfiltered samples were stored 400
acidified to pH 1.8 for several months, these results suggest that Ge occurs essentially in the 401
dissolved form at these water depths (i.e. between 959 to 3497 m). Considering the entire 402
dataset obtained for the composite samples recovered during cruise Loihi 2014, we obtained 403
average values of 74/70Ge = 3.18 ± 0.32 ‰ (2SD, n=8) and Ge = 101 ± 18pM (2SD, n = 8). 404
These measured Ge concentrations are indistinguishable from previously reported values for 405
the deep Pacific Ocean (Froelich et al., 1985a; Mortlock et al., 1993). Filtered samples from 406
the FeMo Deep station (Table 1) recovered at 500 m and 4000-4900 m depths yielded 407
74/70Ge = 3.13 ± 0.11 ‰ and 3.27 ± 0.06 ‰ respectively, confirming the homogeneity of Ge 408
isotope composition in the deep Pacific Ocean. As expected, the Ge concentration of 86 pM 409
obtained at 500 m depth is lower than that for deeper water (> 4000 m, Ge ≈ 117 pM), again 410
consistent with previous studies (Froelich et al., 1985a; Mortlock et al., 1993). 411
412
3.4. Seawater profiles from the Southern Ocean 413
414
14
Germanium concentrations and isotope compositions at the three stations in the 415
Southern Ocean (Sars, WAP and Burdwood Bank) are reported in Fig. 4, 5 and 6. 416
Germanium and Si concentrations show typical nutrient-type profiles, with lower Ge 417
concentrations (down to 15 pM) in surface waters, increasing with depth up to 106 pM below 418
1000 m. Station WAP shows steeper gradients in Ge, Si and other nutrient at mid water depth 419
compared to the other stations (Fig. 5). Using the relationship between Ge and Si 420
concentrations (Fig. 7), we obtained an average Ge/Si ratio of 0.775± 0.036 (mol/mol) 421
which is consistent within our error to the global oceanic Ge/Si ratio of 0.760 ± 0.004 422
(mol/mol) determined by Sutton et al. (2010). A plot of Ge versus Si concentration 423
produced an intercept of 3.6 ± 3.3 pM, which is higher but also within error of the intercept 424
of 1.27 ± 0.24 pM reported previously using a much larger dataset (Sutton et al., 2010). 425
The Ge isotopic profiles at Sars and WAP show distinct features. Firstly, surface 426
waters are characterized by the heaviest δ74/70Ge values at ~ 3.5 to 3.7 ‰. Secondly, a 427
minimum of δ74/70Ge is observed at mid-water depths, between 500 and 1000 m. Below 1000 428
m, δ74/70Ge values remain relatively constant at both stations, yielding an average of 3.17 ± 429
0.19 ‰ (2SD, n = 7) and 3.21 ± 0.21 ‰ (2SD, n = 5) for Sars and WAP respectively. Ge 430
isotope compositions at the Burdwood Bank station also fall within a range of ~ 2.9 to 3.3 ‰, 431
except for a single sample at 3250 m that show lighter δ74/70Ge at ~ 2.4 ‰. 432
433
3.5. Germanium/Silicon and Ge isotope composition of deep sea sponges 434
Modern sponges from the Southern Ocean present δ74/70Ge values ranging from 1.79 435
to 2.45 ‰ in agreement with previously reported δ74/70Ge values of Pacific Ocean sponges 436
(Rouxel et al., 2006). The dataset include different species of demosponges (Demospongiae) 437
and glass-sponges (Hexactinellida) sampled at water depths of 600 to 2266 m. As presented 438
in Fig. 8, no systematic relationship between δ74/70Ge values and other parameters could be 439
identified. In particular, we did not find an inverse linear relationship between sponge 440
δ74/70Ge and [Si], which has been previously reported for δ30Si and [Si] (Hendry et al., 2010). 441
Compared to overlying seawater, sponges are fractionated toward light Ge isotopes, with a 442
Ge isotope fractionation factor 74/70Geopal-SW ranging from -0.57 to -1.21 ‰ and averaging -443
0.87 ± 0.37 ‰ (2SD, n = 12). Germanium concentrations ranged from 0.13 to 0.35 ppm, 444
corresponding to Ge/Si ratios of 0.11 to 0.30 mol/mol, which is much lower than the 445
15
modern seawater Ge/Si ratio of 0.7 mol/mol and consistent with previous studies (Ellwood 446
et al., 2006; Rouxel et al., 2006). 447
448
4. Discussion 449
450
4.1. Germanium isotope systematics in the Southern Ocean 451
452
The Southern ocean is a complex zone where the mixing of waters from three oceans 453
occurs. The modern day Southern Ocean has large [Si] gradients, with [Si] increasing 454
polewards and with depth due to a combination of water mass mixing, a sloping isopycnal, 455
and opal remineralization (Pollard et al., 2002). The Southern Ocean plays an important role 456
in marine carbon exchange due to high primary productivity and the formation of deep waters 457
with high preformed nutrients (Nelson et al., 1995; Sarmiento et al., 2004). The water masses 458
in the Drake Passage are well known (Orsi et al., 1995; Orsi et al., 1999; Meredith et al., 459
2011) and include: Antarctic Surface Water (AASW), Antarctic Bottom Water (AABW), 460
Lower Circumpolar Deep Water (LCDW), Upper Circumpolar Deep Water (UCDW) and 461
Antarctic Intermediate Water (AAIW) (Fig. 9). The UCDW is characterized by an oxygen 462
minimum and nutrient maximum, while the LCDW is denser (Smax = 34.7) and penetrates 463
south of the Antarctic Circumpolar Current (ACC) into the subpolar regime underneath the 464
AASW, i.e. below direct surface influence and characterized by a subsurface temperature 465
minimum. The UCDW spreads poleward and often reaches the Antarctic continental shelves. 466
The WAP station is separated from the Sars and Burdwood Bank stations by the polar 467
front (PF). Burdwood Bank is characterized by an important influence of the AAIW, which 468
provides oxygen to 1000m depth, and an oxygen minimum that is pronounced from 1200m to 469
2000m (Key et al., 2004). The Sars and WAP off slope stations both have oxygen minima at 470
800m depth. There is an influence of LCDW from 1800m to the bottom, which carries 471
oxygen at depth to the Sars station (Key et al., 2004). A comparison between the δ74/70Ge of 472
dissolved inorganic Ge and oceanographic parameters (e.g. fluorescence, salinity-473
temperature) at the three stations do not show systematic relationships, suggesting, as a 474
whole, that the different water masses of the Southern Ocean have relatively similar Ge 475
isotope compositions. This contrasts with Si isotope systematics of the Southern Ocean, 476
which are characterized by distinct δ30Si signatures in the different water masses (Fripiat et 477
16
al., 2011). Considering that the residence time of Ge is probably shorter than that of Si 478
(between 10,000 to 17,000 years, Treguer and De La Rocha, 2013), heterogeneity in Ge 479
isotope composition between different water masses should be expected. 480
In detail, there is indeed some distinct Ge isotope variability in the water column 481
profiles. We observed that the lowest δ74/70Ge values tend to be related to UCDW and LCDW 482
(minimum of 2.62 and 2.44 ‰ respectively) while the heaviest deep water values were 483
observed for the AABW (range of 2.97 to 3.32 ‰). The larger variations of δ74/70Ge at the 484
Sars station are also observed at the interface between AAIW and LCDW. In the Burdwood 485
Bank water column data, significant variations of δ74/70Ge are also observed at the interface 486
between AAIW and UCDW. For both Sars and WAP profiles, the heaviest δ74/70Ge values, 487
up to ~ 3.7 ‰ and ~ 3.5 ‰, are systematically observed in the shallowest sample (part of 488
AAIW), coinciding with the samples with the highest fluorescence (Table 2). Hence, it can be 489
suggested that the concomitant increase of δ74/70Ge and depletion of Ge in surface seawater at 490
Sars may be related to phytoplankton biomass, and therefore explained by biological uptake. 491
We note, however, that higher sample resolution may be needed to fully resolve the apparent 492
relationships between Ge isotope fractionation and the deep chlorophyll maximum for this 493
ocean region. Depth profiles at Sars also show a subsurface maximum of Ge/Si, which may 494
result from Ge/Si fractionation during Si uptake (Murnane and Stallard, 1988; Froelich et al., 495
1989; Ellwood and Maher, 2003; Sutton et al., 2010). In Fig. 10, δ74/70Ge versus Ge 496
concentrations are reported for the stations where surface seawater was sampled (i.e. Sars and 497
WAP). Following the approach previously used for Si isotopes (De La Rocha et al., 1997), 498
we modeled the variations of δ74/70Ge versus Ge using a Rayleigh distillation model, 499
considering deep values (i.e. > 1000 m) of Ge = 110 pM. Model results for the uppermost 500
water (> 1000 m) at the Sars station suggest that surface seawater values can be explained by 501
a fractionation factor seawater-diatom of 1.00068 ± 0.00009 and initial water δ74/70Ge values of 502
2.26 ± 0.11 ‰. This model, however, cannot be extrapolated to deeper waters (>1300 m), 503
which are characterized by heavier δ74/70Ge values at 3.1 ‰ (Fig. 10). It is also unlikely that 504
Si and Ge in these surface waters were sourced from above 1300 m. Hence, biological 505
removal of Ge in surface waters may not be the sole mechanism explaining the observed 506
water column variations of both Ge concentrations and isotopic compositions at Sars. For the 507
WAP station, the fractionation factor is closer to unity with seawater-diatom of ± 508
0.00011, with initial water δ74/70Ge value of 3.1 ± 0.05 ‰. 509
17
We now further evaluate whether subsurface water mixing could, instead, explain 510
most of the variability observed in Sars and other stations. In particular, the minimum 511
δ74/70Ge ≈ 2.6 ‰ at Sars may suggest the presence of isotopically lighter water masses 512
located at the interface between AAIW and LCDW. Klunder et al. (2014) observed an input 513
of dissolved iron (DFe) from the shelves around Elephant Island into the Drake Passage, 514
which is consistent with earlier findings (Dulaiova et al., 2009). Hence, we propose that 515
similar shelf input may, in principle, contribute to lower δ74/70Ge values, shifting deeper water 516
(500-1000 m depth) from typical deepwater δ74/70Ge values of 3.1 ‰ toward more crustal 517
values at around 0.7 ‰. However, since DFe concentrations were not measured in the same 518
samples as our new Ge data, it is difficult to further test this hypothesis. Considering the 519
different reactivity and residence time of Fe and Ge, it is also possible that the same water 520
column anomaly may not be observed for both elements in a similar manner. Higher 521
resolution sampling, together with measurements of other important nutrients such as PO4 522
and Fe, should ultimately allow us to determine the relative importance of the two 523
mechanisms, driven by differential depth regeneration and/or shelf input, for Ge isotope 524
variations in water column profiles. 525
Far-field hydrothermal venting from the South East Pacific Rise (Well et al., 2003), 526
the Bransfield Strait (Klinkhammer et al., 2001) and the East Scotia Ridge back-arc basin 527
(James et al., 2014) may also potentially impact Ge geochemistry in the region. However, 528
the ≈ 0.5 ‰ shift observed for δ74/70Ge values at 3251 m depth at the Burdwood Bank station 529
is unlikely to result from the contribution of isotopically light hydrothermally-derived Ge 530
(Escoube et al., 2015). In particular, any significant hydrothermal contribution would have 531
been reflected in elevated 3He concentrations which was not observed in this region (Sudre et 532
al., 2011) or an increase in Ge/Si ratios at the same depth which was not observed either 533
(Table 2). 534
535
4.2. Potential mechanisms of Ge isotope fractionation by siliceous phytoplankton 536
537
Our water column concentration and isotopic composition profiles exhibit distinct 538
trends towards lower [Ge] and heavier δ74/70Ge values at shallower depths (Fig. 4-6, 10), 539
indicating that it is possible that Ge isotopes are fractionated during phytoplankton uptake by 540
0.3 ‰ to 0.6 ‰. Such biological fractionation could arise as a result of Ge uptake and 541
18
incorporation into diatom opal, or as a result of incorporation of Ge into organic matter 542
within phytoplankton cells. We explore here the potential mechanisms leading to, or 543
inversely muting, Ge/Si and Ge isotope fractionations by phytoplankton. 544
In a reconnaissance study, Mantoura (2006) reported the experimental determination 545
of Ge isotope fractionation during biological uptake by two marine diatoms, Skeletonema 546
costatum and Thalassiosira weissflogii. Neither of these species appeared to fractionate Ge 547
isotopes during biomineralization of opal. These results were obtained across a wide range of 548
Ge/Si in the culture media. There was no change in measured δ74/70Ge values of opal within 549
the analytical precision of 0.3 ‰, even for Si depletion in solution up to 25 %. Since 550
experiments were not run at higher percentages of Si uptake, it remains unclear as to whether 551
Rayleigh-type fractionation behavior could lead to resolvable seawater δ74/70Ge variations. 552
These diatom species are also not representative of the dominant sub-polar taxa in the 553
Southern Ocean (Crosta et al., 2005) and we cannot rule out potential species-dependent Ge 554
isotope fractionation by marine diatoms as previously reported for Si isotopes (Sutton et al., 555
2013). An important result, however, is that Ge isotope composition measured in uncleaned 556
diatoms, i.e. whole diatom including organic matter and opal, yielded a fractionation factor 557
seawater-diatom = 1.001 ± 0.0004 (2SD) (Mantoura, 2006). Hence, considering the strong 558
affinity of Ge for organic matter, Ge sequestration in phytoplankton cellular material during 559
biological uptake may provide a pool of isotopically light Ge that could be decoupled from 560
Ge in opal at depth during remineralization, resulting in heavier δ74/70Ge values in surface 561
waters (up to ~ 3.7 ‰). Evidence that Ge isotope distributions may be driven by organic 562
matter remineralization is provided by our water column depth profiles, which show a 563
correspondence between apparent oxygen utilization (AOU) — a measure of cellular material 564
degradation — and seawater δ74/70Ge (Fig. 4 - 6). For example, a local minimum in δ74/70Ge 565
is observed at the same depth as the AOU maximum at ~ 800 m at Sars (Fig. 4) with δ74/70Ge 566
values as low as ~ 2.6 ‰, which is likely the result of the release of light Ge isotopes during 567
the remineralization of settling organic matter. The same relationships were however not 568
observed at WAP off slope (Fig. 5) and Burdwood Bank (Fig. 6). Considering that seawater 569
samples at the three Southern Ocean stations were recovered during the austral fall 2011, 570
when sea surface temperatures were already low (2.81 and -0.15 °C, at stations Sars and 571
WAP, respectively), the concept of AOU should be used with caution. In particular, it has 572
been shown that O2 concentration can be significantly depleted under the ice due to 573
incomplete equilibration with atmosphere (Gordon et al., 1984), providing a possible 574
19
explanation for the lack of relationships between δ74/70Ge and AOU at WAP off slope and 575
Burdwood Bank. 576
577
4.3. Germanium isotope fractionation by sponges 578
In a preliminary study, Rouxel et al. (2006) reported heavy Ge isotope compositions 579
relative to bulk oceanic-continental crust for opal sponge spicules obtained from live 580
specimens growing on the seafloor in North East Pacific, with δ74/70Ge values ranging from 581
1.56 to 2.60 ‰ (recalculated relative to NIST 3120a). The new Ge isotope analysis of 582
sponges from the Southern Ocean showed a similar, albeit smaller range from 1.79 to 2.45‰. 583
Combining these results with δ74/70Ge values of overlying seawater, we determined a Ge 584
isotope fractionation factor 74/70Geopal-SW of -0.87 ± 0.37 ‰ (2SD, n = 12) during Ge uptake 585
by sponges. Although no clear relationships could be derived between δ74/70Ge, water depth 586
and oceanographic parameters (e.g. nutrient, temperature-salinity and AOU) or sponge 587
species, these results confirm earlier assumptions that sponges fractionate Ge isotopes during 588
biomineralization, and discriminate against heavy Ge isotopes, as already observed for Si 589
isotopes (De La Rocha, 2003; Hendry and Robinson, 2012). 590
Sponges are considered to have a low affinity for silicic acid (Reincke and Barthel, 591
1997) and the inefficient silicon uptake mechanism has been suggested to explain their 592
preferential enrichment in light Si isotopes (De La Rocha, 2003). More recently, Hendry et al. 593
(2010) determined δ30Si values of modern deep-sea sponge spicules and showed that they 594
vary with ambient seawater Si concentrations. The fractionation factor 30Siopal-SW ranged 595
from ca. -2.5 to -5.5 ‰ and showed a positive relationship with Si, which has been attributed 596
to growth rate effects (Wille et al., 2010; Hendry and Robinson, 2012). However, no 597
relationships between δ74/70Ge and δ30Si, 30Siopal-SW, nor Si concentrations could be 598
identified (Fig. 8), suggesting a significant decoupling between Ge and Si isotopes during 599
sponge biomineralization. 600
Biosilicification in sponges is controlled by two enzymes: silicatein, which promotes 601
condensation reactions, and silicase, which dissolves silica (Muller et al., 2007). Although it 602
is still unclear which pathways or reactions during the biosilicification process result in Si 603
isotopic fractionation, our results show that Ge incorporation in sponges likely proceeds via a 604
different pathways than Si. The non-linear relationship between Si isotope fractionation and 605
silicon concentration has been modeled assuming that the fractionation occurs in several 606
20
steps: firstly as the Si is transported into the cell, secondly as the Si is polymerized, and 607
thirdly as Si is lost from the cell (Wille et al., 2010; Hendry and Robinson, 2012). This model 608
indicates that Si isotope fractionation associated with uptake transport is constant whereas 609
fractionation during spicule formation increases as a function of external Si concentration. 610
Using this model, we propose that the lack of correlation between 74/70Geopal-SW and 611
30Siopal-SW may suggest that Ge isotopes are fractionated solely during the uptake step (i.e. 612
which is also associated with constant Si isotope fractionation). Silicification of large spicules 613
occurs extracellularly in association with an organic matrix and is controlled by protein 614
interactions (Schröder et al., 2008). It is therefore likely that the apparent 74/70Geopal-SW of -615
0.87 ‰ result from the interaction of Ge(OH)4 with organic compounds, possibly through the 616
formation of 6-coordinated Ge bearing organic complexes which may be enriched in light 617
isotopes by up to 4 ‰ at 25 °C relative to Ge(OH)4 (Li et al., 2009). 618
Measurements of Ge/Si ratios in sponge opal range from 0.11 to 0.30 (μmol/mol), 619
which is significantly lower than the seawater Ge/Si ratio of 0.76 μmol/mol. In a previous 620
study, Ellwood et al. (2006) reported an even larger range of Ge/Si ratios, between about 621
0.075 to 0.380 μmol/mol, in sponge opal collected from a range of depths and locations. A 622
correlation between Ge/Sisp in sponge opal and Ge concentration in seawater was also 623
reported, suggesting that either Ge/Sisp is solely dependent on the Ge concentration of the 624
surrounding seawater and is independent of the Si concentration of that seawater, or that 625
Ge/Sisp is the product of strong Ge/Si fractionation during both Ge and Si uptake from the 626
seawater surrounding the sponge (Ellwood et al., 2006). Our results are broadly consistent, 627
but further suggest that Ge/Sisp is not solely a function of Ge concentration in seawater, since 628
several samples deviate from the relationship reported by Ellwood et al. (2006) (Fig. 8). 629
While Ge/Si and Ge isotope ratios in sponge opal do not appear to be species dependent (Fig. 630
8), sponges from the same area and the same species (e.g. sample DR13-47 and DR16-47) 631
yielded contrasting δ74/70Ge and Ge/Si values, suggesting that vital effects between or within 632
species may be significant in controlling both Ge isotope fractionation and Ge/Si ratios. 633
Although additional work is required, it seems likely that the same mechanisms 634
leading to the discrimination of Ge against Si during biomineralization are also responsible 635
for the fractionation of Ge isotopes. This hypothesis is supported by the fact that diatoms, 636
which are known to produce subtle Ge/Si fractionation in surface waters (Sutton et al., 2010), 637
also generate very limited Ge isotope fractionation. In contrast, marine sponges, which are 638
characterized by Ge/Si values considerably lower than seawater, showed the largest Ge 639
21
isotope fractionation factors. This general model is also consistent with Si isotope 640
systematics, i.e. sponges show larger degree of Si isotope fractionation than diatoms (De La 641
Rocha et al., 1997; Wille et al., 2010). 642
643
4.4. A preliminary estimate of Ge isotope composition of seawater and implications for the 644
global Ge budget 645
646
Results for the deep Pacific Ocean off Hawaii and deep Atlantic off Bermuda (BATS 647
station) > 1000 m water depths show nearly identical δ74/70Ge of 3.19 ± 0.31 ‰ (2SD, n = 9) 648
and 2.93 ± 0.10 ‰ (2SD, n = 2). Vertical distributions of Ge concentrations and isotope 649
compositions in the Southern Ocean for water depths > 1300 m yielded an average δ74/70Ge 650
value of 3.13 ± 0.2 5‰ (2SD, n = 14). These observations suggest that Ge isotope 651
composition is relatively homogeneous in deep seawater and is not modified significantly 652
through global thermohaline circulation and the biogenic uptake of dissolved silica. Hence, 653
even with this relatively limited dataset, it is possible to determine a global deep seawater 654
composition of approximately δ74/70Ge = 3.14 ± 0.38 ‰ (2SD, n = 27). 655
Mantoura (2006) investigated the Ge/Si and δ74/70Ge records of diatom opal from Late 656
Quaternary sediments and found no difference between average glacial and average 657
interglacial δ74/70Ge opal values. The average δ74/70Geopal value over the period 68 to 178 ka 658
(S. Atlantic, ODP site 1094) was determined to be 3.35 ± 0.29 ‰ (2SD, n = 29). Given that 659
potential glacial-interglacial changes in δ74/70Geopal are barely outside the analytical error, 660
despite large changes in growth conditions, these initial results are fully consistent with our 661
finding that diatom opal does not fractionate significantly Ge isotopes nor Ge/Si and thus 662
might provide a potential paleoceanographic archive of secular Ge isotope variations in 663
seawater. 664
Overall, our study supports the hypothesis that sedimentary diatomaceous sediments 665
are potentially good archives for marine Ge biogeochemical cycling in the past. This new 666
paleoceanographic tool could be applied to understand changes in hydrothermal versus 667
continental Ge sources or Ge sinks over the past, considering the contrasting Ge isotope 668
composition of hydrothermal vent fluids and Ge sinks related to Ge sequestration in Fe-rich 669
sediments (see Escoube et al., 2015). The use of Ge isotopes seems also particularly relevant 670
as a complementary tool for Si isotopes, especially if different water masses carry their own 671
22
δ74/70Ge signatures that are decoupled from their δ30Si compositions. In this case, Ge isotopes 672
could provide additional information about the source of the water mass (and its potential 673
interaction with shelf environments), while Si isotopes would add additional information on 674
the operation of the biological pump. Surface seawater conditions are recorded in diatoms, 675
meaning that diatomaceous opal δ74/70Ge may trace nutrient sources (e.g. shelf input) and 676
their effect on primary productivity, while sponges provide information on deeper water (e.g. 677
hydrothermal input) and long-term oceanic circulation. Additional study of Ge isotope 678
systematics in coastal waters and rivers is now required to address the importance of 679
continental run-off and silicate weathering, as well as anthropogenic input (e.g. coal 680
combustion), in the marine biogeochemical cycling of Ge. 681
682
5. Conclusion 683
Prior to this study and the recent study of Baronas et al. (2017), our knowledge of Ge 684
isotope systematics in seawater was limited by the analytical difficulties to precisely measure 685
Ge isotope composition in sub-nanomolar amounts of Ge in seawater. Our newly developed 686
method offers the following advantages 1) utilization of a double-spike which permits 687
correction of potential Ge isotope mass fractionation in the case of incomplete recovery, 2) 688
sufficient sensitivity using hydride-generation system to measure Ge in seawater at very low 689
concentrations (e.g. surface waters), 3) a preconcentration technique using co-precipitation 690
with Fe-oxyhydroxides which can be set up on a research cruise, allowing the rapid 691
separation of Ge from large volumes of seawater. Additional developments are still required 692
to consistently achieve quantitative recovery (i.e. 100 % yield) of Ge from large seawater 693
volume. Potential blank contamination should also be kept at the minimum (i.e. below 1pM 694
equivalent) in order to improve the measurement of the most analytically challenging surface 695
seawater, especially from nutrient-depleted regions where significant Ge/Si fractionation is 696
expected. In this case, Ge isotope systematics may provide an important new proxy to 697
investigate nutrient limitation for biological productivity and their sources in surface 698
seawater, both of which resulting in contrasting trends in 30Si and Ge/Si ratios. 699
The first survey of Ge isotope systematics in seawater from the Pacific, Atlantic and 700
Southern Oceans indicates: 701
[1] Deep sea waters (<1000 m) are relatively homogeneous for the three Oceans with a 702
δ74/70Ge of 3.14 ± 0.38 ‰ (2SD, n = 27). This value is consistent with previous estimates of 703
23
δ74/70Ge values of seawater using biogenic opal (Mantoura, 2006; Escoube et al., 2015) and 704
recently reported by Baronas et al., (2017). 705
[2] δ74/70Ge profiles in the Southern Ocean show significant enrichment in heavy isotopes in 706
surface waters, while a minimum in δ74/70Ge is observed at the depth of maximum 707
remineralization. A combination of two different mechanisms can explain these profiles. The 708
first process may be driven by biology, namely the fractionation of Ge isotopes by siliceous 709
phytoplankton. Fractionation factors seawater-diatom during biological uptake into organic 710
matter were calculated with a Rayleigh distillation model that leads to values of 1.0007 (Sars) 711
and 1.0003 (WAP). Due to the strong affinity of Ge for organic matter, it is expected that the 712
light Ge isotopes may be incorporated in the soft tissues, leading to isotopically heavier 713
surface seawater compared to deeper seawater. Conversely, the remineralization of the 714
settling particles may be responsible for a decrease of δ74/70Ge values with depth 715
corresponding to AOU maximum. The second process is driven by physical mixing of water 716
masses. Although δ74/70Ge values are more homogeneous than δ30Si between water masses, 717
significant variations can still be attributed to water masses having contrasting Ge isotope 718
signatures. Deep water masses forming close to the shelf are potentially lighter due to an 719
input of isotopically light lithogenic Ge. Because of the relatively limited number of sampling 720
depths and stations considered in this study, a distinction between these different mechanisms 721
remains difficult at this point. Future study should therefore be aimed at testing the relative 722
importance of internal cycling and source effects in controlling Ge isotope compositions in 723
seawater. 724
[3] The δ74/70Ge of sponges and co-located seawater allowed us to determine a Ge isotope 725
fractionation factor of -0.87 ± 0.37 ‰ (2SD, n = 12) during Ge uptake by sponges. Hence, 726
similarly to Si isotopes, sponges discriminate against heavy Ge isotopes during 727
biomineralization, suggesting that Ge isotopes could serve as an interesting biogeochemical 728
tracer when used in conjunction with Ge/Si and Si isotope systematics. In particular, the 729
apparent lack of correlation between Ge isotope compositions and Si (or Ge) concentrations 730
contrasts strongly with Si isotopes, allowing to use coupled δ74/70Ge and δ30Si signatures in 731
sponges to reconstruct a paleoceanographic record of both silicic acid supply and utilization 732
(δ30Si based proxy) and sources (δ74/70Ge based proxy) in seawater. 733
Finally, the apparent lack of Ge isotope and Ge/Si fractionation during diatom growth 734
remains an area of open research, given that significant fractionation is expected by analogy 735
with the widely investigated Si isotope systematics (De La Rocha et al., 1997; Sutton et al., 736
24
2013). Since the extent of potential biological Ge isotope fractionation in surface seawater is 737
strongly model dependent, combined field studies at higher resolution profile and 738
experimental studies under conditions relevant to the ocean are now required to better 739
understand the biological imprint on the global Ge cycle. 740
741
25
Acknowledgements: 742
Support for Rouxel was provided by LabexMer ANR-10-LABX-19-01, Europole Mer and 743
FP7 (#247837) grants. International mobility was provided to Guillermic by the LabexMer 744
ANR-10-LABX-19-01 and the Royal Society (Hendry grant #UF120084). Jill Sutton is 745
thanked for her advice. Emmanuel Ponzevera (IFREMER) and Yoan Germain (IFREMER) 746
are thanked for their technical support, and Rosalind Rickaby (Univ. Oxford) is thanked for 747
the generous use of laboratory space. Brian Glazer, Gabrielle Weiss, Angelos Hannides, 748
Kristen Fogaren (Univ. Hawaii), and Isabelle Baconnais (Univ. Brest) are thanked for their 749
support during cruise FK140626 aboard R/V Falkor. Southern Ocean water and sponge 750
sample collection was funded by the National Science Foundation (OPP ANT grants 751
#0944474 and #0902957; PIs Robinson and Waller). Samples from Loihi Seamount were 752
collected as part of a project supported by the Schmidt Ocean Institute. We thank the crews 753
of the R/V Nathaniel B. Palmer, R/V Kilo Moana, and R/V Falkor for assistance with 754
deployments and sample collection during the cruises. We thank Jotautas Baronas, Michael 755
Ellwood, AE Silke Severmann and one anonymous reviewer for their constructive reviews 756
that improved the quality of this paper. 757
758
26
References 759
Baronas, J.J., Hammond, D.E., Berelson, W.M., McManus, J. and Severmann, S. (2016) 760
Germanium-silicon fractionation in a river-influenced continental margin: The Northern Gulf 761
of Mexico. Geochim. Cosmochim. Acta 178, 124-142. 762
Baronas, J.J., Hammond, D.E., McManus, J., Wheat, C.G. and Siebert, C. (2017) A Global Ge 763
Isotopic Budget. Geochim. Cosmochim. Acta 203, 265-283. 764
Belissont, R., Boiron, M.C., Luais, B. and Cathelineau, M. (2014) LA-ICP-MS analyses of 765
minor and trace elements and bulk Ge isotopes in zoned Ge-rich sphalerites from the Noailhac 766
- Saint-Salvy deposit (France): Insights into incorporation mechanisms and ore deposition 767
processes. Geochim. Cosmochim. Acta 126, 518-540. 768
Bennett, S.A., Hansman, R.L., Sessions, A.L., Nakamura, K. and Edwards, K.J. (2011) 769
Tracing iron-fueled microbial carbon production within the hydrothermal plume at the Loihi 770
seamount. Geochim. Cosmochim. Acta 75, 5526–5539. 771
Boyle, E.A., John, S., Abouchami, W., Adkins, J.F., Echegoyen-Sanz, Y., Ellwood, M., 772
Flegal, A.R., Fornace, K., Gallon, C., Galer, S., Gault-Ringold, M., Lacan, F., Radic, A., 773
Rehkämper, M., Rouxel, O., Sohrin, Y., Stirling, C., Thompson, C., Vance, D., Xue, Z.C. and 774
Zhao, Y. (2012) GEOTRACES IC1 (BATS) contamination-prone trace element isotopes Cd, 775
Fe, Pb, Zn, Cu, and Mo intercalibration. Limnol Oceanogr-Meth 10, 653-665. 776
Cao, Z.M., Frank, M. and Dai, M.H. (2015) Dissolved silicon isotopic compositions in the 777
East China Sea: Water mass mixing vs. biological fractionation. Limnol. Oceanogr. 60, 1619-778
1633. 779
Crosta, X., Romero, O., Armand, L.K. and Pichon, J.J. (2005) The biogeography of major 780
diatom taxa in Southern Ocean sediments: 2. Open ocean related species. Palaeogeography 781
Palaeoclimatology Palaeoecology 223, 66-92. 782
De La Rocha, C., Brzezinski, M.A. and De Niro, M.J. (1997) Fractionation of silicon isotopes 783
by marine diatoms during biogenic silica formation. Geochim. Cosmochim. Acta 61, 5051-784
5056. 785
De La Rocha, C. (2003) Silicon isotope fractionation by marine sponges and the 786
reconstruction of the silicon isotope composition of ancient deep water. Geology 31, 423-426. 787
de Souza, G.F., Slater, R.D., Dunne, J.P. and Sarmiento, J.L. (2014) Deconvolving the 788
controls on the deep ocean's silicon stable isotope distribution. Earth. Planet. Sci. Lett. 398, 789
66-76. 790
Dulaiova, H., Ardelan, M.V., Henderson, P.B. and Charette, M.A. (2009) Shelf-derived iron 791
inputs drive biological productivity in the southern Drake Passage. Global Biogeochem. 792
Cycles 23. 793
Edwards, K.J., Glazer, B.T., Rouxel, O.J., Bach, W., Emerson, D., Davis, R.E., Toner, B.M., 794
Chan, C.S., Tebo, B.M., Staudigel, H. and Moyer, C.L. (2011) Ultra-diffuse hydrothermal 795
venting supports Fe-oxidizing bacteria and massive umber deposition at 5000 m off Hawaii. 796
Isme Journal 5, 1748-1758. 797
27
Ellwood, M.J. and Maher, W.A. (2003) Germanium cycling in the waters across a frontal 798
zone: the Chatham Rise, New Zealand. Mar. Chem. 80, 145-159. 799
Ellwood, M.J., Kelly, M., Maher, W.A. and De Deckker, P. (2006) Germanium incorporation 800
into sponge spicules: Development of a proxy for reconstructing inorganic germanium and 801
silicon concentrations in seawater. Earth. Planet. Sci. Lett. 243, 749-759. 802
Escoube, R., Rouxel, O.J., Luais, B., Ponzevera, E. and Donard, O.F.X. (2012) An 803
Intercomparison Study of the Germanium Isotope Composition of Geological Reference 804
Materials. Geostand. Geoanal. Res. 36, 149-159. 805
Escoube, R., Rouxel, O., Edwards, K., Glazer, B. and Donard, O. (2015) Coupled Ge/Si and 806
Ge isotope ratios as geochemical tracers of seafloor hydrothermal systems: case studies at 807
Loihi Seamount and East Pacific Rise 9°50'N. Geochim. Cosmochim. Acta 167, 93-112. 808
Fripiat, F., Cavagna, A.J., Dehairs, F., Speich, S., Andre, L. and Cardinal, D. (2011) Silicon 809
pool dynamics and biogenic silica export in the Southern Ocean inferred from Si-isotopes. 810
Ocean Sci. 7, 533-547. 811
Froelich, P.N. and Andreae, M.O. (1981) The marine geochemistry of germanium - 812
Ekasilicon. Science 213, 205-207. 813
Froelich, P.N., Hambrick, G.A., Andreae, M.O., Mortlock, R.A. and Edmond, J.M. (1985a) 814
The geochemistry of inorganic germanium in natural waters. Journal of Geophysical 815
Research-Oceans 90, 1133-1141. 816
Froelich, P.N., Hambrick, G.A., Kaul, L.W., Byrd, J.T. and Lecointe, O. (1985b) 817
Geochemical behavior of inorganic germanium in an unperturbed estuary. Geochim. 818
Cosmochim. Acta 49, 519-524. 819
Froelich, P.N., Mortlock, R.A. and Shemesh, A. (1989) Inorganic germanium and silica in the 820
Indian Ocean: Biological fractionation during (Ge/Si)OPAL formation. Global Biogeochem. 821
Cycles, 3, 79–88. 822
Gordon, A.L., Chen, C.T.A. and Metcalf, W.G. (1984) Winter mixed layer entrainment of 823
Weddell Deep Water. Journal of Geophysical Research-Oceans 89, 637-640. 824
Grasse, P., Ehlert, C. and Frank, M. (2013) The influence of water mass mixing on the 825
dissolved Si isotope composition in the Eastern Equatorial Pacific. Earth. Planet. Sci. Lett. 826
380, 60-71. 827
Hambrick, G.A., Froelich, P.N., Andreae, M.O. and Lewis, B.L. (1984) Determination of 828
methylgermanium species in natural waters by graphite furnace atomic absorption 829
spectrometry with hydride generation. Anal Chem 56, 421-424. 830
Hammond, D.E., McManus, J., Berelson, W.M., Meredith, C., Klinkhammer, G.P. and Coale, 831
K.H. (2000) Diagenetic fractionation of Ge and Si in reducing sediments: The missing Ge 832
sink and a possible mechanism to cause glacial/interglacial variations in oceanic Ge/Si. 833
Geochim. Cosmochim. Acta 64, 2453-2465. 834
28
Hendry, K.R., Georg, R.B., Rickaby, R.E.M., Robinson, L.F. and Halliday, A.N. (2010) Deep 835
ocean nutrients during the Last Glacial Maximum deduced from sponge silicon isotopic 836
compositions. Earth. Planet. Sci. Lett. 292, 290-300. 837
Hendry, K.R. and Robinson, L.F. (2012) The relationship between silicon isotope 838
fractionation in sponges and silicic acid concentration: Modern and core-top studies of 839
biogenic opal. Geochim. Cosmochim. Acta 81, 1-12. 840
Hendry, K.R. and Andersen, M.B. (2013) The zinc isotopic composition of siliceous marine 841
sponges: Investigating nature's sediment traps. Chem. Geol. 354, 33-41. 842
James, R.H., Green, D.R.H., Stock, M.J., Alker, B.J., Banerjee, N.R., Cole, C., German, C.R., 843
Huvenne, V.A.I., Powell, A.M. and Connelly, D.P. (2014) Composition of hydrothermal 844
fluids and mineralogy of associated chimney material on the East Scotia Ridge back-arc 845
spreading centre. Geochim. Cosmochim. Acta 139, 47-71. 846
John, S.G. and Adkins, J. (2012) The vertical distribution of iron stable isotopes in the North 847
Atlantic near Bermuda. Global Biogeochem. Cycles 26. 848
Kaya, M. and Volkan, M. (2011) Germanium determination by flame atomic absorption 849
spectrometry: An increased vapor pressure-chloride generation system. Talanta 84, 122-126. 850
King, S.L., Froelich, P.N. and Jahnke, R.A. (2000) Early diagenesis of germanium in 851
sediments of the Antartic South Atlantic: In search of the missing Ge sink. Geochim. 852
Cosmochim. Acta 64, 1375-1390. 853
Klinkhammer, G.P., Chin, C.S., Keller, R.A., Dahlmann, A., Sahling, H., Sarthou, G., 854
Petersen, S. and Smith, F. (2001) Discovery of new hydrothermal vent sites in Bransfield 855
Strait, Antarctica. Earth. Planet. Sci. Lett. 193, 395-407. 856
Klunder, M.B., Laan, P., De Baar, H.J.W., Middag, R., Neven, I. and Van Ooijen, J. (2014) 857
Dissolved Fe across the Weddell Sea and Drake Passage: impact of DFe on nutrient uptake. 858
Biogeosciences 11, 651-669. 859
Kurtz, A.C., Derry, L.A. and Chadwick, O.A. (2002) Germanium-silicon fractionation in the 860
weathering environment. Geochim. Cosmochim. Acta 66, 1525-1537. 861
Kurtz, A.C., Lugolobi, F. and Salvucci, G. (2011) Germanium-silicon as a flow path tracer: 862
Application to the Rio Icacos watershed. Water Resour. Res. 47. 863
Lewis, B.L., Froelich, P.N. and Andreae, M.O. (1985) Methylgermanium in natural waters. 864
Nature 313, 303-305. 865
Lewis, B.L., Andreae, M.O. and Froelich, P.N. (1989) Sources and sinks of methylgermanium 866
in natural waters. Mar. Chem. 27, 179-200. 867
Li, X.F., Zhao, H., Tang, M. and Liu, Y. (2009) Theoretical prediction for several important 868
equilibrium Ge isotope fractionation factors and geological implications. Earth. Planet. Sci. 869
Lett. 287, 1-11. 870
Luais, B. (2012) Germanium chemistry and MC-ICPMS isotopic measurements of Fe-Ni, Zn 871
alloys and silicate matrices: Insights into deep Earth processes. Chem. Geol. 334, 295-311. 872

29
Mantoura, S. (2006) Development and Application of Opal Based Paleoceanographic Proxies, 873
Univ. Cambridge. University of Cambridge, Cambridge, p. 218. 874
Martinez, C.E. and McBride, M.B. (1998) Coprecipitates of Cd, Cu, Pb and Zn in iron oxides: 875
Solid phase transformation and metal solubility after aging and thermal treatment. Clays Clay 876
Miner. 46, 537-545. 877
McManus, J., Hammond, D.E., Cummins, K., Klinkhammer, G.P. and Berelson, W.M. (2003) 878
Diagenetic Ge-Si fractionation in continental margin environments: Further evidence for a 879
nonopal sink. Geochim. Cosmochim. Acta 67, 4545-4557. 880
Meredith, M.P., Woodworth, P.L., Chereskin, T.K., Marshall, D.P., Allison, L.C., Bigg, G.R., 881
Donohue, K., Heywood, K.J., Hughes, C.W., Hibbert, A., Hogg, A.M., Johnson, H.L., Jullion, 882
L., King, B.A., Leach, H., Lenn, Y.D., Maqueda, M.A.M., Munday, D.R., Garabato, A.C.N., 883
Provost, C., Sallee, J.B. and Sprintall, J. (2011) Sustained monitoring of the Southern Ocean 884
at Drake Passage: Past achievements and future priorities. Rev. Geophys. 49. 885
Mortlock, R.A. and Froelich, P.N. (1987) Continental weathering of germanium: Ge/Si in the 886
global discharge. Geochim. Cosmochim. Acta 51, 2075-2082. 887
Mortlock, R.A., Froelich, P.N., Feely, R.A., Massoth, G.J., Butterfield, D.A. and Lupton, J.E. 888
(1993) Silica and germanium in Pacific Ocean hydrothermal vents and plumes. Earth. Planet. 889
Sci. Lett. 119, 365-378. 890
Muller, W.E.G., Li, J.H., Schroder, H.C., Qiao, L. and Wang, X.H. (2007) The unique 891
skeleton of siliceous sponges (Porifera; Hexactinellida and Demospongiae) that evolved first 892
from the Urmetazoa during the Proterozoic: a review. Biogeosciences 4, 219-232. 893
Murnane, R.J. and Stallard, R.F. (1988) Germanium/silicon fractionation during biogenic opal 894
formation. Paleoceanography 3, 461-469. 895
Nelson, D.M., Treguer, P., Brzezinski, M.A., Leynaert, A. and Queguiner, B. (1995) 896
Production and dissolution of biogenic silica in the ocean: Revised global estimates, 897
comparison with regional data and relationship to biogenic sedimentation. Global 898
Biogeochem. Cycles 9, 359-372. 899
Olbers, D., Gouretski, V.V., Seiß, G., Schröter, J., 1992. Southern Ocean Atlas (ODV). 900
Orsi, A.H., Whitworth, T. and Nowlin, W.D. (1995) On the meridional extent and fronts of 901
the Antarctic Circumpolar Current. Deep-Sea Research Part I-Oceanographic Research 902
Papers 42, 641-673. 903
Orsi, A.H., Johnson, G.C. and Bullister, J.L. (1999) Circulation, mixing, and production of 904
Antarctic Bottom Water. Prog. Oceanogr. 43, 55-109. 905
Pokrovski, G.S. and Schott, J. (1998) Experimental study of the complexation of silicon and 906
germanium with aqueous organic species: Implications for germanium and silicon transport 907
and Ge/Si ratio in natural waters. Geochim. Cosmochim. Acta 62, 3413-3428. 908
Pokrovsky, O.S., Pokrovski, G.S., Schott, J. and Galy, A. (2006) Experimental study of 909
germanium adsorption on goethite and germanium coprecipitation with iron hydroxide: X-ray 910
30
absorption fine structure and macroscopic characterization. Geochim. Cosmochim. Acta 70, 911
3325–3341. 912
Pollard, R.T., Lucas, M.I. and Read, J.F. (2002) Physical controls on biogeochemical zonation 913
in the Southern Ocean. Deep-Sea Research II 49, 3289–3305. 914
Qi, H.W., Rouxel, O., Hu, R.Z., Bi, X.W. and Wen, H.J. (2011) Germanium isotopic 915
systematics in Ge-rich coal from the Lincang Ge deposit, Yunnan, Southwestern China. 916
Chem. Geol. 286, 252-265. 917
Raven, K.P., Jain, A. and Loeppert, R.H. (1998) Arsenite and arsenate adsorption on 918
ferrihydrite: Kinetics, equilibrium, and adsorption envelopes. Environ. Sci. Technol. 32, 344-919
349. 920
Reincke, T. and Barthel, D. (1997) Silica uptake kinetics of Halichondria panicea in Kiel 921
Bight. Mar. Biol. 129, 591-593. 922
Reynolds, B.C., Frank, M. and Halliday, A.N. (2006) Silicon isotope fractionation during 923
nutrient utilization in the North Pacific. Earth. Planet. Sci. Lett. 244, 431–443. 924
Rouxel, O., Galy, A. and Elderfield, H. (2006) Germanium isotopic variations in igneous 925
rocks and marine sediments. Geochim. Cosmochim. Acta 70, 3387-3400. 926
Robinson, L., (2015). Uncalibrated Hydrographic Data acquired with a CTD in the Drake 927
Passage during the Nathaniel B. Palmer expedition NBP1103 (2011). Integrated Earth Data 928
Applications (IEDA). doi: http://dx.doi.org/10.1594/IEDA/317657. 929
Sarmiento, J.L., Gruber, N., Brzezinski, M.A. and Dunne, J.P. (2004) High-latitude controls 930
of thermocline nutrients and low latitude biological productivity. Nature 427, 56-60. 931
Sarthou, G., Baker, A.R., Blain, S., Achterberg, E.P., Boye, M., Bowie, A.R., Croot, P., Laan, 932
P., de Baar, H.J.W., Jickells, T.D. and Worsfold, P.J. (2003) Atmospheric iron deposition and 933
sea-surface dissolved iron concentrations in the eastern Atlantic Ocean. Deep-Sea Research 934
Part I-Oceanographic Research Papers 50, 1339-1352. 935
Schlitzer, R., Ocean Data View, https://odv.awi.de, 2016. 936
Schröder, H.C., Wang, X.H., Tremel, W., Ushijima, H. and Muller, W.E.G. (2008) 937
Biofabrication of biosilica-glass by living organisms. Natural Product Reports 25, 455-474. 938
Siebert, C., Nagler, T.F. and Kramers, J.D. (2001) Determination of molybdenum isotope 939
fractionation by double-spike multicollector inductively coupled plasma mass spectrometry. 940
Geochem Geophy Geosy 2, art. no.-2000GC000124. 941
Siebert, C., Ross, A. and McManus, J. (2006) Germanium isotope measurements of high-942
temperature geothermal fluids using double-spike hydride generation MC-ICP-MS. Geochim. 943
Cosmochim. Acta 70, 3986-3995. 944
Siebert, C., Hammond, D.E., Ross, A. and McManus, J. (2011) Germanium isotope 945
measurements of high-temperature geothermal fluids using double-spike hydride generation 946
MC-ICP-MS (vol 70, pg 3986, 2006). Geochim. Cosmochim. Acta 75, 6267-6269. 947
31
Sudre, J., Garcon, V., Provost, C., Sennechael, N., Huhn, O. and Lacombe, M. (2011) Short-948
term variations of deep water masses in Drake Passage revealed by a multiparametric analysis 949
of the ANT-XXIII/3 bottle data. Deep-Sea Research Part Ii-Topical Studies in Oceanography 950
58, 2592-2612. 951
Sutton, J., Ellwood, M.J., Maher, W.A. and Croot, P.L. (2010) Oceanic distribution of 952
inorganic germanium relative to silicon: Germanium discrimination by diatoms. Global 953
Biogeochem. Cycles 24. 954
Sutton, J.N., Varela, D.E., Brzezinski, M.A. and Beucher, C.P. (2013) Species-dependent 955
silicon isotope fractionation by marine diatoms. Geochim. Cosmochim. Acta 104, 300-309. 956
Treguer, P.J. and De La Rocha, C.L. (2013) The World Ocean Silica Cycle, in: Carlson, C.A., 957
Giovannoni, S.J. (Eds.), Annual Review of Marine Science, Vol 5, pp. 477-501. 958
Well, R., Roether, W. and Stevens, D.P. (2003) An additional deep-water mass in Drake 959
Passage as revealed by He-3 data. Deep-Sea Research Part I-Oceanographic Research 960
Papers 50, 1079-1098. 961
Wheat, C.G. and McManus, J. (2008) Germanium in mid-ocean ridge flank hydrothermal 962
fluids. Geochem Geophy Geosy 9. 963
Wille, M., Sutton, J., Ellwood, M.J., Sambridge, M., Maher, W., Eggins, S. and Kelly, M. 964
(2010) Silicon isotopic fractionation in marine sponges: A new model for understanding 965
silicon isotopic variations in sponges. Earth. Planet. Sci. Lett. 292, 281-289. 966
967
968
969
32
Figure captions 970
Figure 1: Map of the Southern Ocean and Drake Passage showing the location of 971
hydrographic stations investigated for Ge concentration and isotope composition: Sars, WAP 972
and Burdwood Bank. Location of deep sea sponges are also represented (see map caption). 973
The locations of water mass fronts are from Orsi et al. (2015). The map was produced using 974
Ocean Data view (Shlitzer, 2016). 975
976
Figure 2: Recovery yield of Ge by co-precipitation with Fe-oxyhydroxide as a function of pH 977
and amount of Fe added (in mg) in seawater matrix. Experiments performed using filtered 978
surface seawater from the Bay of Brest, with a total volume of 4 L for each experiments. 979
Yield was determined by the amount of double-spike recovered and is therefore independent 980
of blank and initial Ge present in the sample. 981
982
Figure 3: Ge concentration (squares) (a) and Ge isotope composition (squares) (b) of synthetic 983
seawater samples obtained by doping surface coastal seawater (from Bay of Brest) with 984
various amount of Ge standard SRM 3120a. The extrapolated 74/70Ge value (circle) 985
determined by the relationship in (b) is estimated to be 2.55 ± 0.41 ‰ (2SE), 986
undistinguishable from duplicate measurement of un-doped "Bay of Brest" internal standards 987
(triangles). Error bars show precision at 2SE and are often smaller than the datapoint symbol. 988
989
Figure 4: Vertical profiles of Ge isotope composition (74/70Ge), Ge concentration (in pM), 990
Ge/Si ratios (mol/mol) and apparent oxygen utilization (AOU) at station Sars, Southern 991
Ocean. Dashed lines indicate the limits between the water masses, Antarctic Intermediate 992
water (AAIW), Upper Circumpolar Deep Water (UCDW) and Low Circumpolar Deep Water 993
(LCDW). 994
995
Figure 5: Vertical profiles of Ge isotope composition (74/70Ge), Ge concentration (in pM), 996
Ge/Si ratios (mol/mol) and apparent oxygen utilization (AOU) at station WAP, Southern 997
Ocean. Dashed lines indicate the limits between the water masses, AAIW, UCDW, LCDW 998
and Antarctic Bottom Water (AABW). 999
1000
33
Figure 6: Vertical profiles of Ge isotope composition (74/70Ge), Ge concentration (in pM), 1001
Ge/Si ratios (mol/mol) and apparent oxygen utilization (AOU) at station Burdwood Bank, 1002
Southern Ocean. Dashed lines indicate the limits between the water masses, AAIW, UCDW, 1003
LCDW and AABW. 1004
1005
1006
Figure 7: Relationship between dissolved Ge and Si concentrations at all three stations. The 1007
regression line (solid thin line) is calculated from the data reported in Table 1 and 2 and is 1008
defined by Ge = 0.775 ± 0.04 * Si + 3.6 ± 3.4, r2 = 0.94. The thick dashed line corresponds to 1009
the regression line determined by Sutton et al. (2010) using a global seawater dataset and is 1010
defined by Ge = 0.760 ± 0.004 * Si + 1.27 ± 0.24, r2 = 0.993). 1011
1012
Figure 8: Ge isotope composition of deep sea sponges against (a) Si isotope composition (data 1013
from Hendry et al., 2010) and (b) Ge/Si ratios. The relationships between Ge/Si ratios and Ge 1014
concentration in overlying seawater is also shown (c) and compared to previously reported 1015
correlation line from Ellwood et al. (2006) defined as Ge/Si = 0.0031 (± 0.0002) * Ge + 1016
0.0818 (± 0.0078). 1017
1018
Figure 9: Salinity, temperature and oxygen profiles using CTD data from Robinson (2015). 1019
Thick black line represents CTD profile at WAP station, thick grey line represents CTD 1020
profile at Sars station and thin black line represents CTD profile at Burdwood Bank station. 1021
Markers correspond to discrete CTD values of seawater samples selected for Ge concentration 1022
and isotope composition (circles for WAP station, squares for SARS station and triangle for 1023
Burdwood Bank station). (a) Temperature-Salinity diagram of the three Southern Ocean 1024
stations studied covering the range of water depths sampled for Ge analysis. See text for the 1025
definition of water masses. (b) Vertical profiles of dissolved oxygen concentrations (mL/L) 1026
at the three stations. (c) Vertical profiles of salinity (psu) at the three stations. 1027
1028
Figure 10: δ74/70Ge vs Ge concentrations for the two stations (Sars, WAP) where surface 1029
seawater (< 1000m) was sampled. Water samples at depths greater than 1300m at station Sars 1030
are also shown for comparison. Solid line represents a Rayleigh fractionation model with 1031
initial 74/70Ge = 2.4 ‰ and liquid-solid = 1.0006, the best fit for the upper 1000m water column 1032
34
at station Sars. Dash line represents a Rayleigh fractionation model with initial 74/70Ge = 3.1 1033
‰ and liquid-solid = 1.0003, the best fit for the upper 1000m water column at station WAP and 1034
passing through the surface seawater of station Sars. 1035
1036
1037
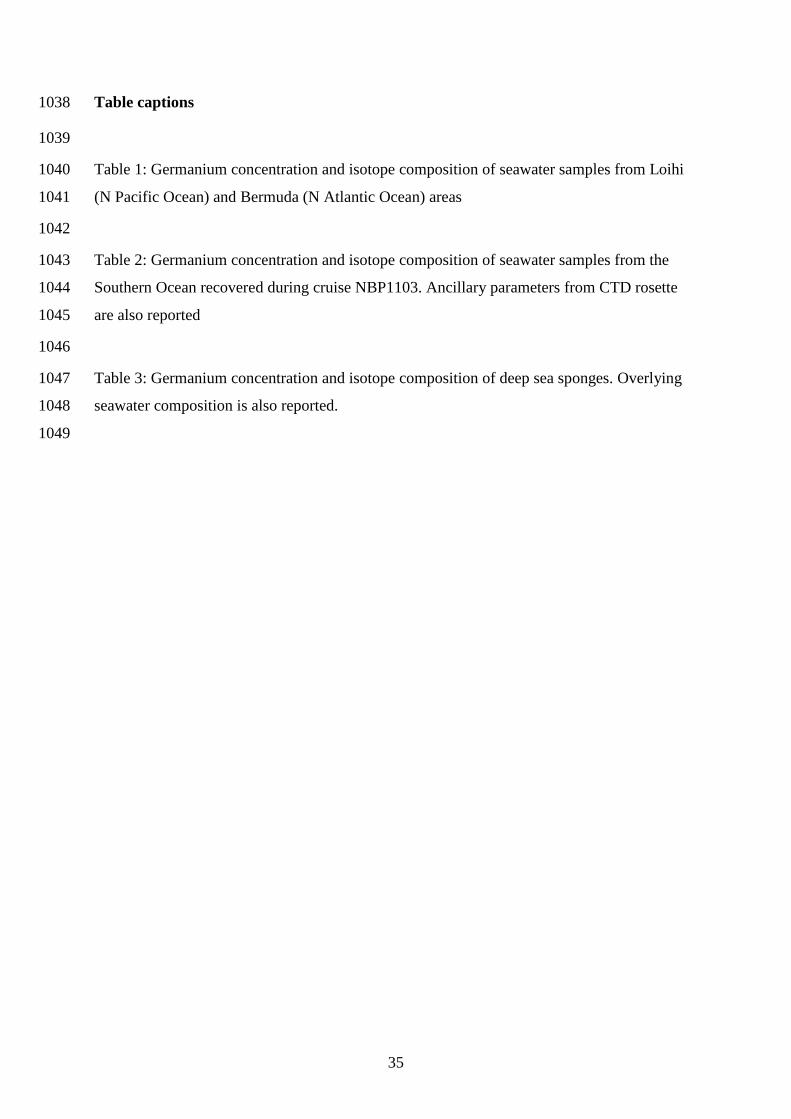
35
Table captions 1038
1039
Table 1: Germanium concentration and isotope composition of seawater samples from Loihi 1040
(N Pacific Ocean) and Bermuda (N Atlantic Ocean) areas 1041
1042
Table 2: Germanium concentration and isotope composition of seawater samples from the 1043
Southern Ocean recovered during cruise NBP1103. Ancillary parameters from CTD rosette 1044
are also reported 1045
1046
Table 3: Germanium concentration and isotope composition of deep sea sponges. Overlying 1047
seawater composition is also reported. 1048
1049
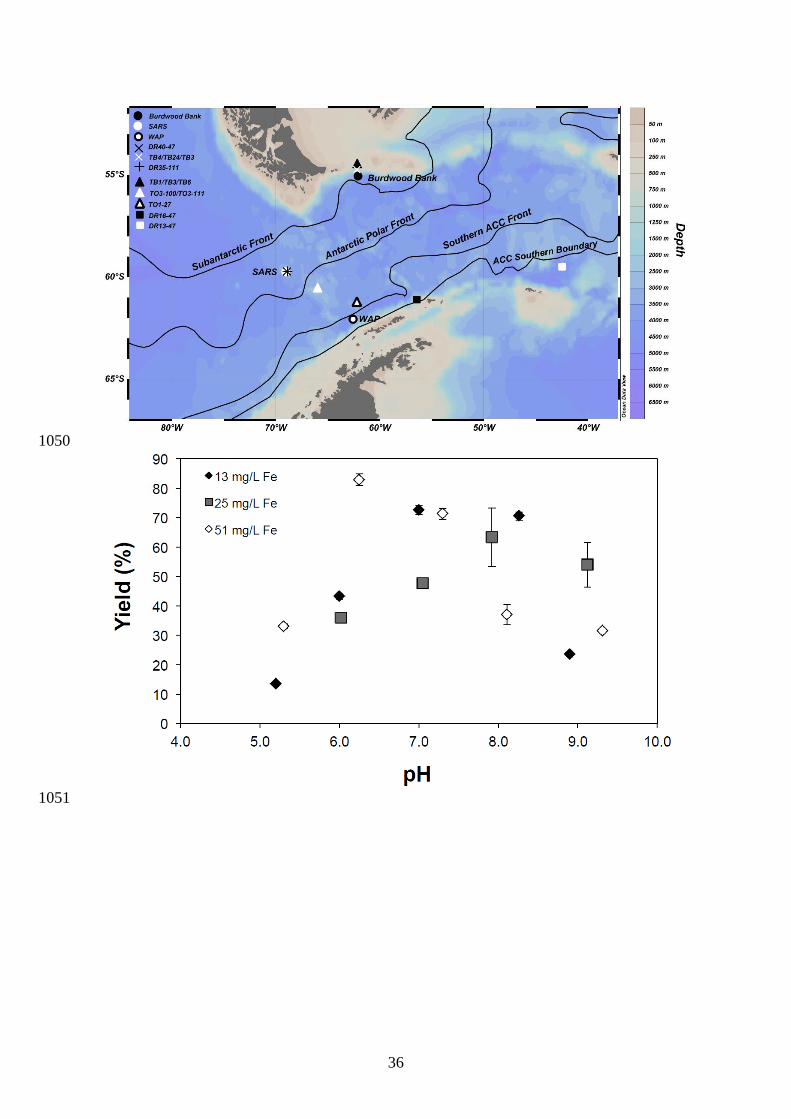
36
1050
1051
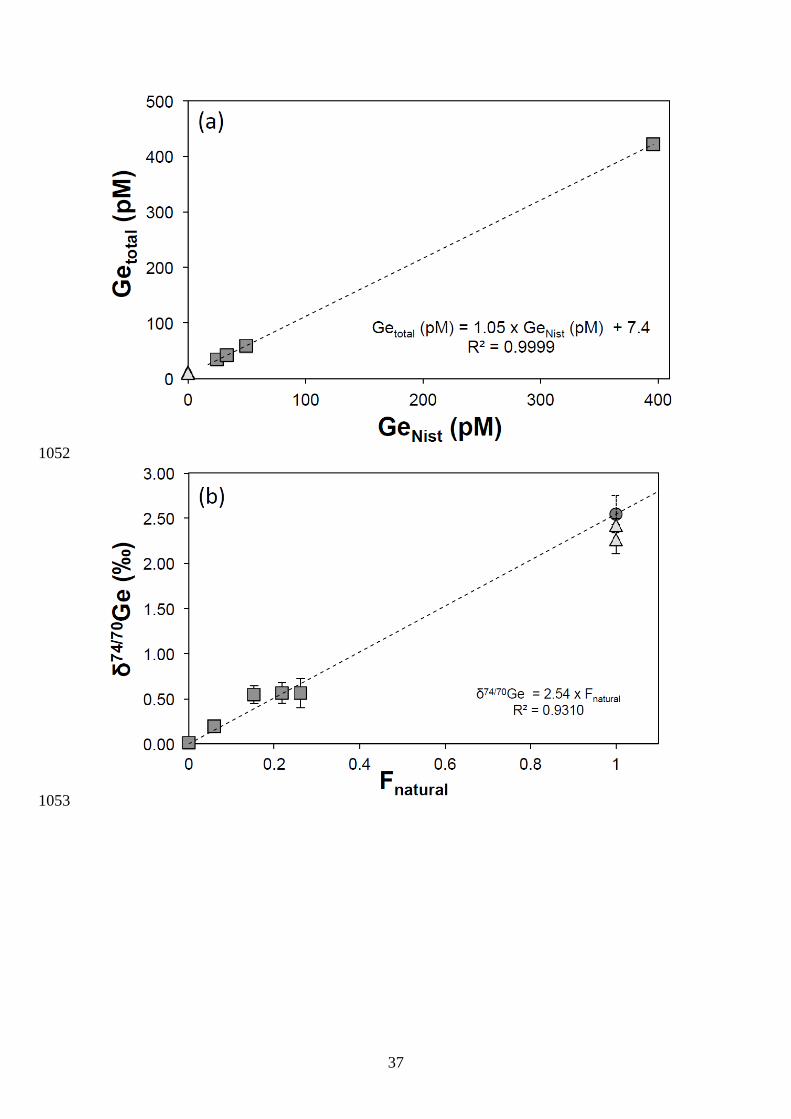
37
1052
1053
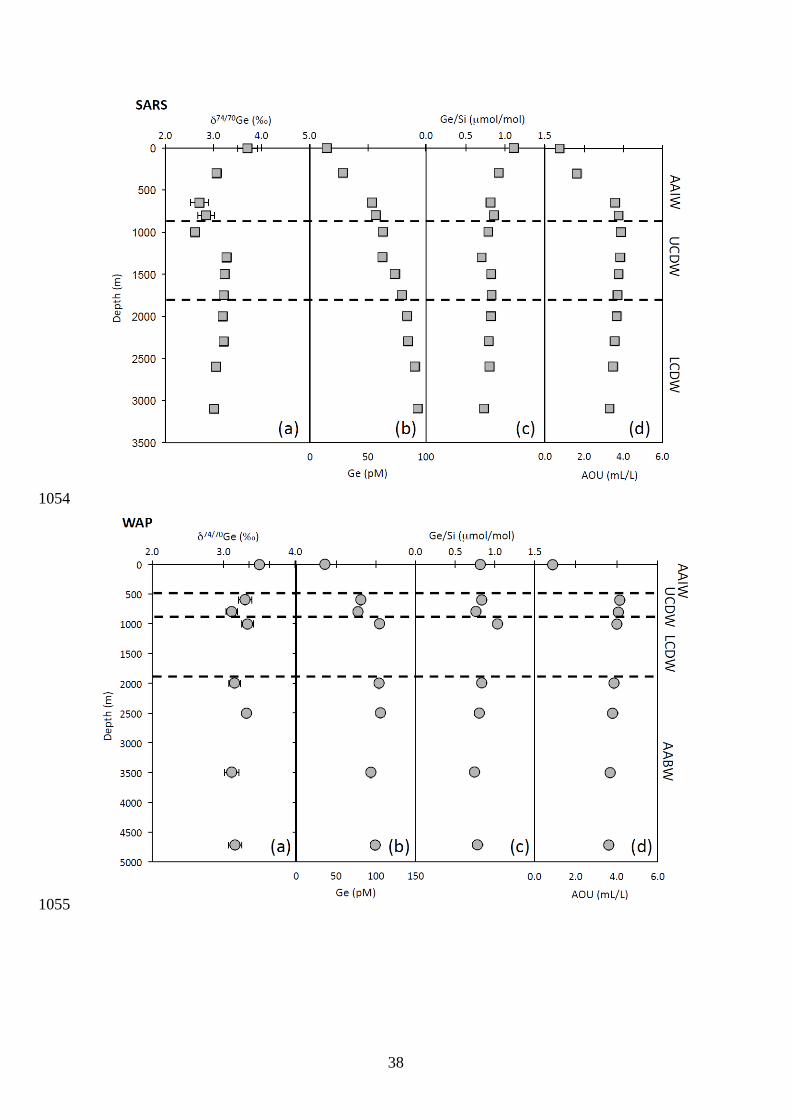
38
1054
1055
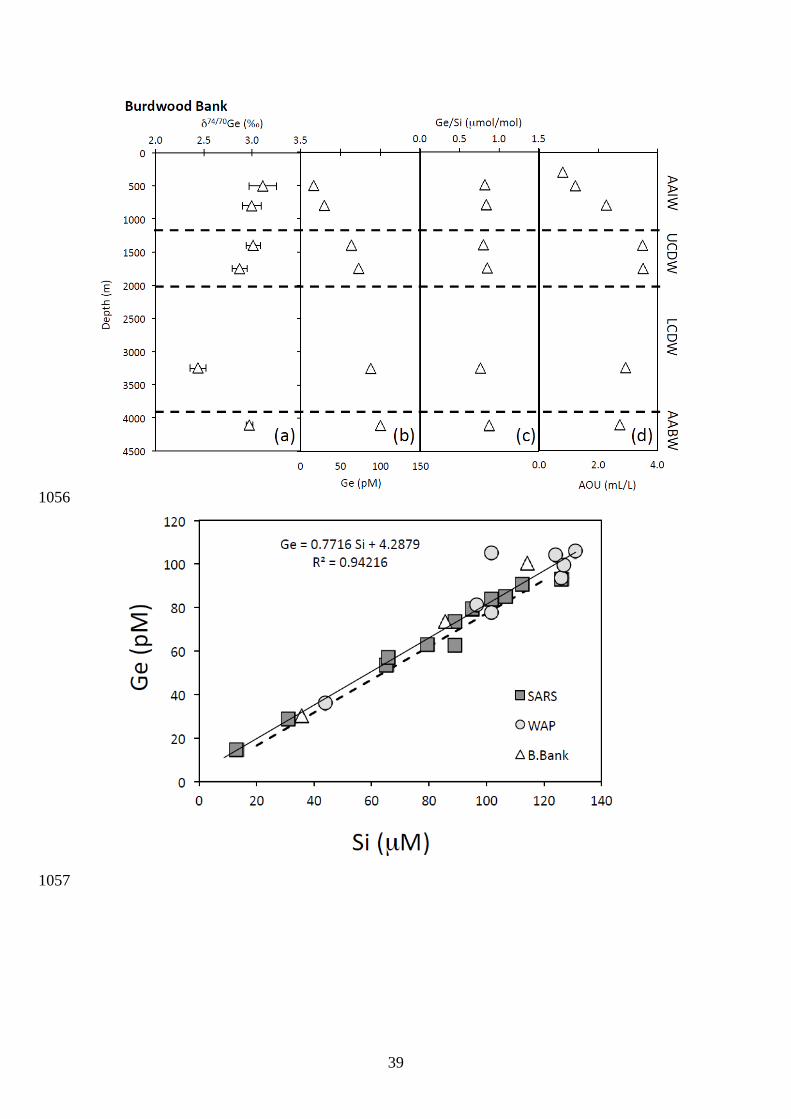
39
1056
1057
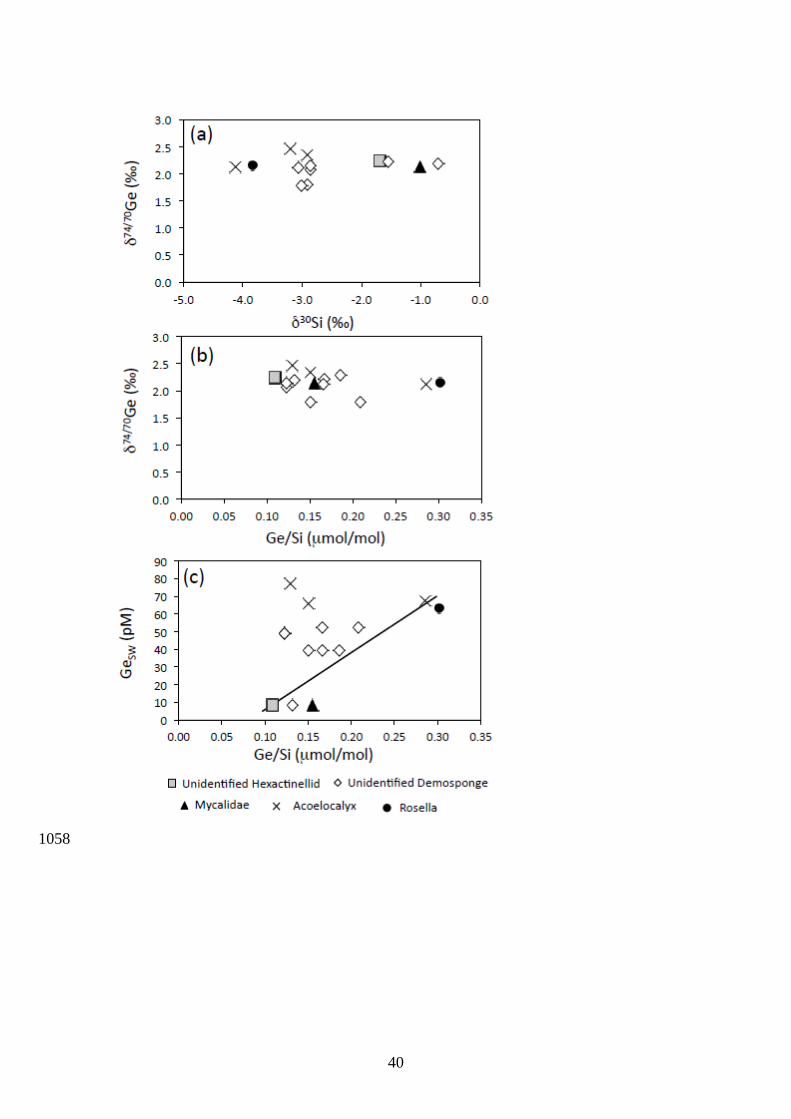
40
1058
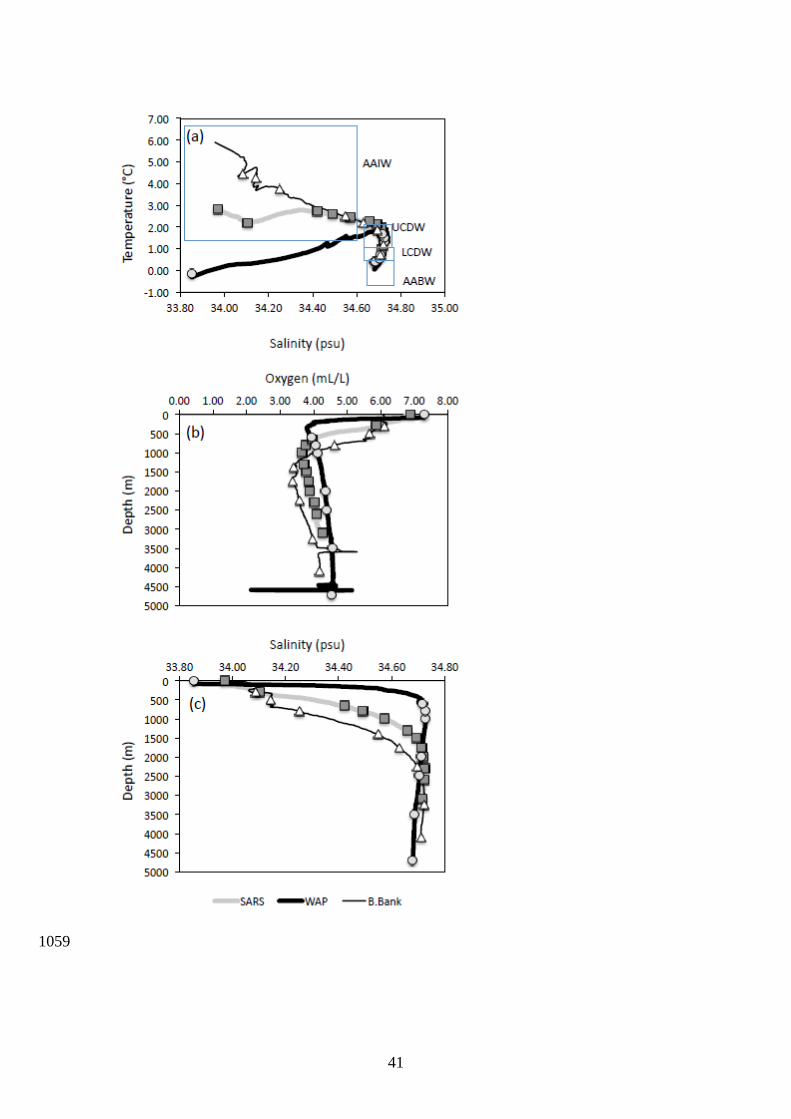
41
1059
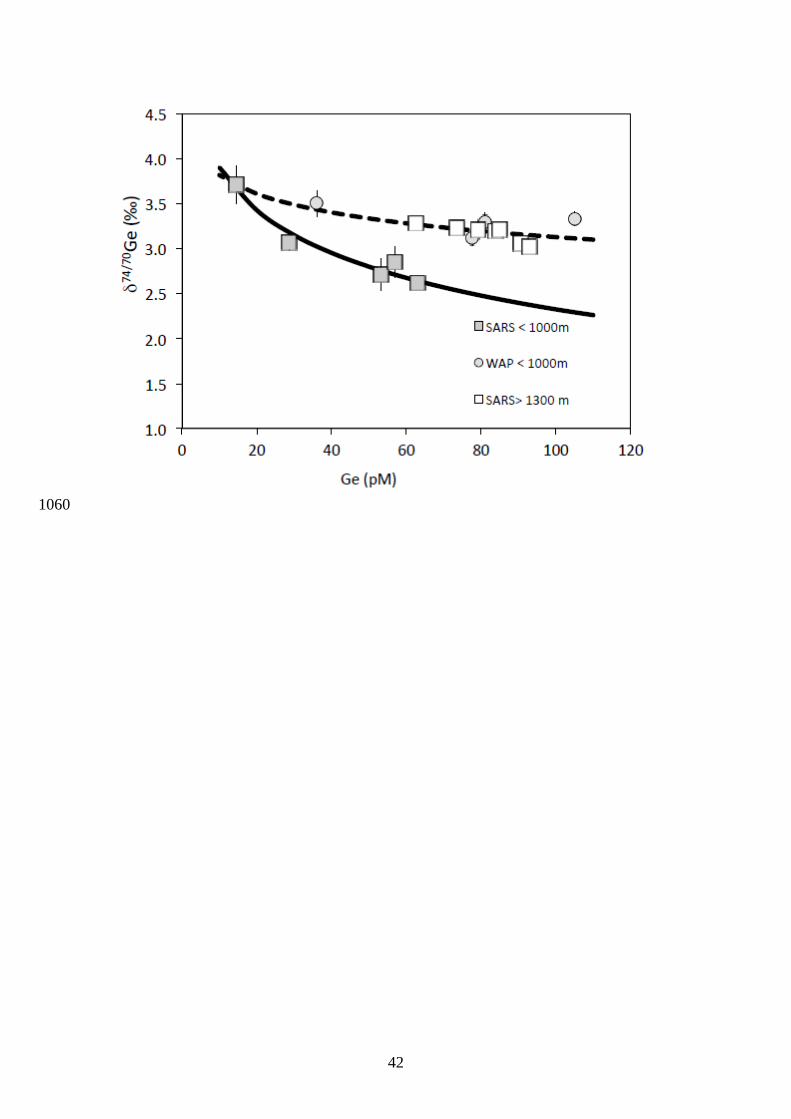
42
1060