Embed Size (px)
Citation preview
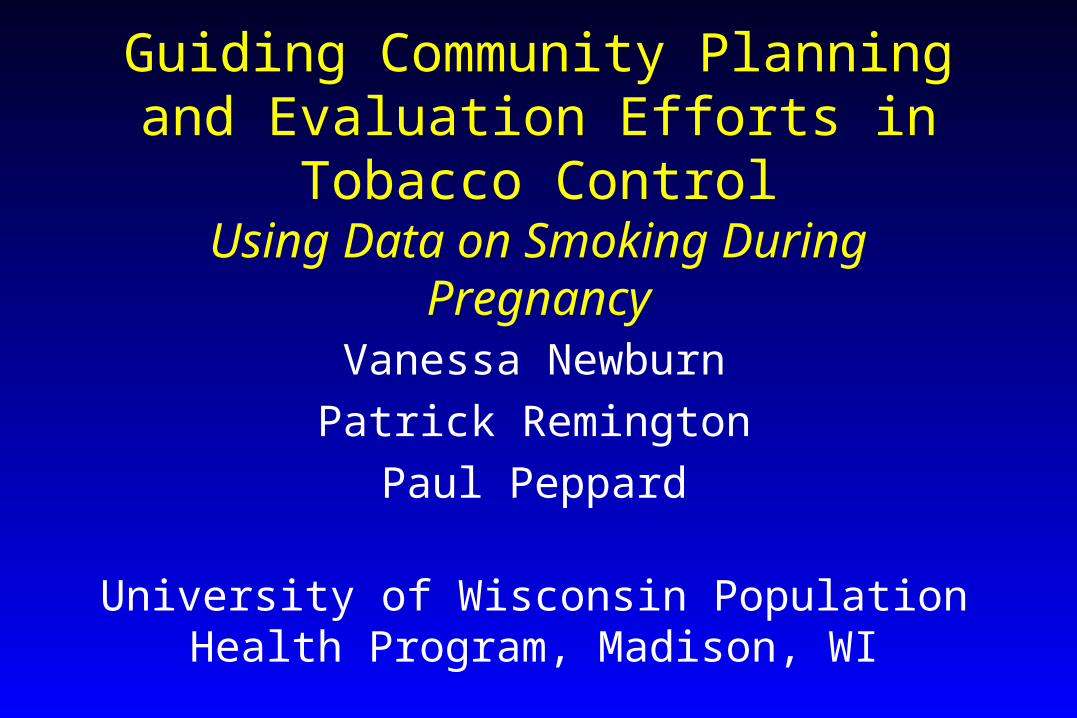
Guiding Community Planning and Evaluation Efforts in Tobacco Control
Using Data on Smoking During Pregnancy
Vanessa Newburn
Patrick Remington
Paul Peppard
University of Wisconsin Population Health Program, Madison, WI
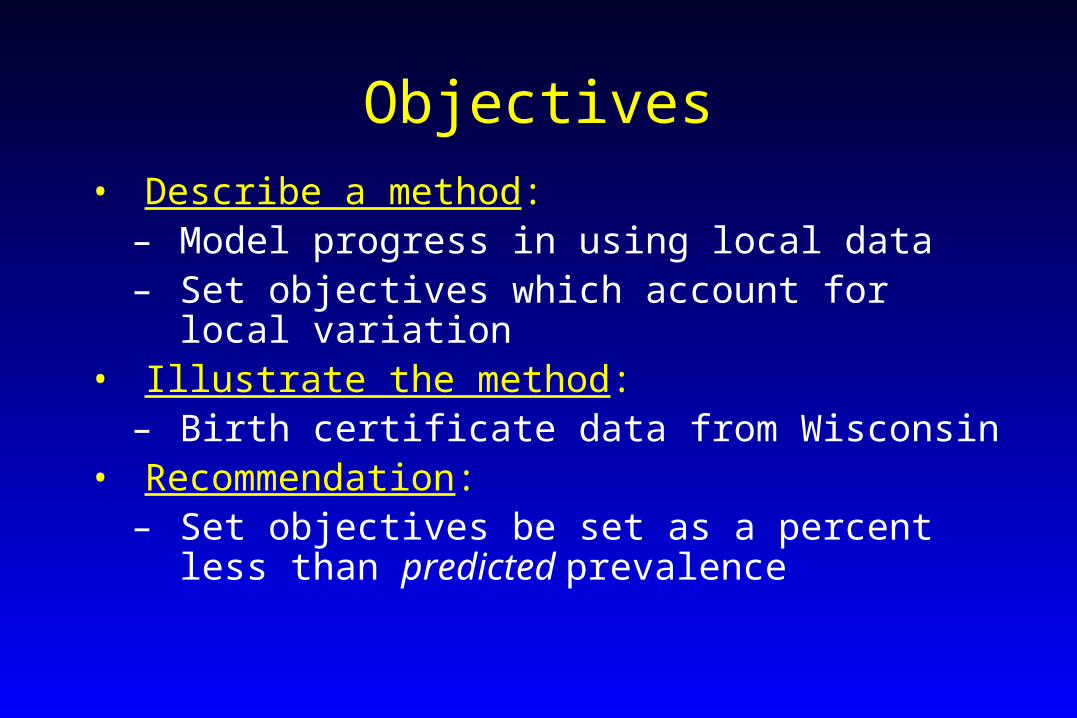
Objectives• Describe a method:
– Model progress in using local data– Set objectives which account for local variation
• Illustrate the method:– Birth certificate data from Wisconsin
• Recommendation:– Set objectives be set as a percent less than
predicted prevalence
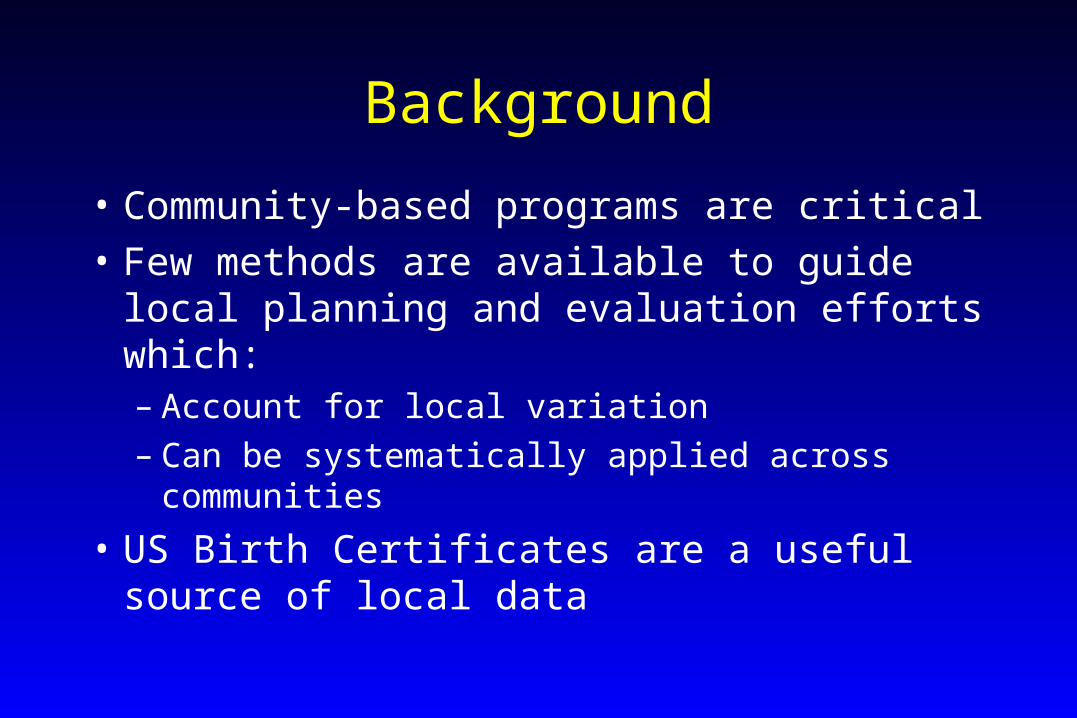
Background
• Community-based programs are critical
• Few methods are available to guide local planning and evaluation efforts which:– Account for local variation– Can be systematically applied across
communities
• US Birth Certificates are a useful source of local data
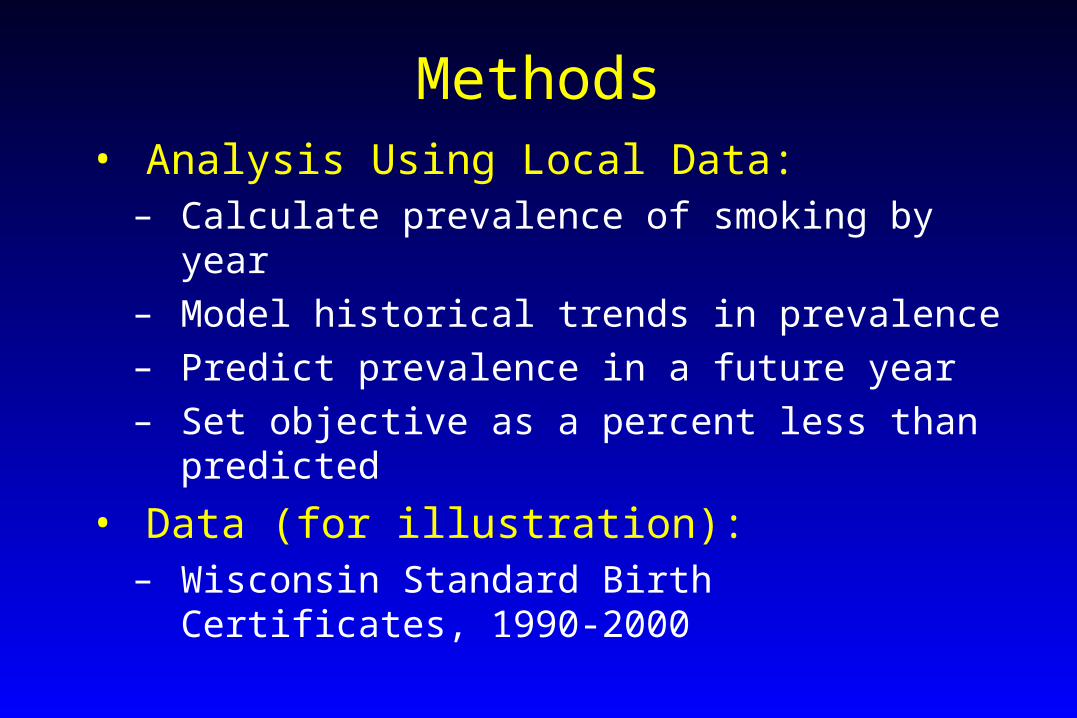
Methods• Analysis Using Local Data:
– Calculate prevalence of smoking by year
– Model historical trends in prevalence
– Predict prevalence in a future year
– Set objective as a percent less than predicted
• Data (for illustration): – Wisconsin Standard Birth Certificates,
1990-2000
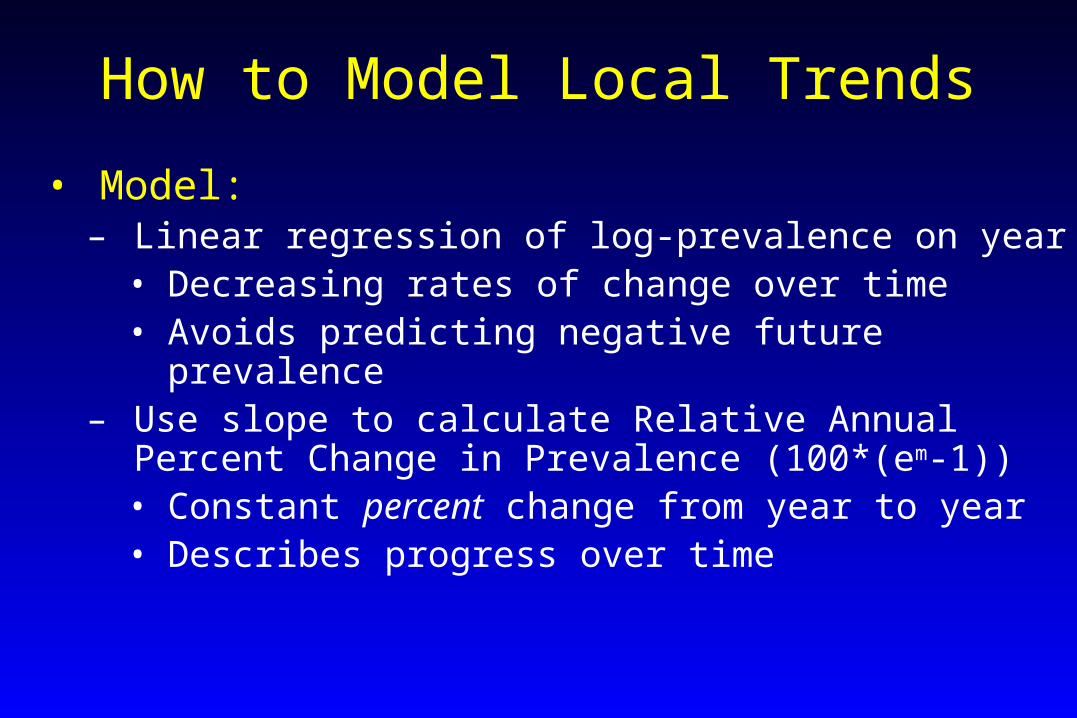
How to Model Local Trends
• Model:– Linear regression of log-prevalence on year
• Decreasing rates of change over time• Avoids predicting negative future prevalence
– Use slope to calculate Relative Annual Percent Change in Prevalence (100*(em-1))• Constant percent change from year to year • Describes progress over time
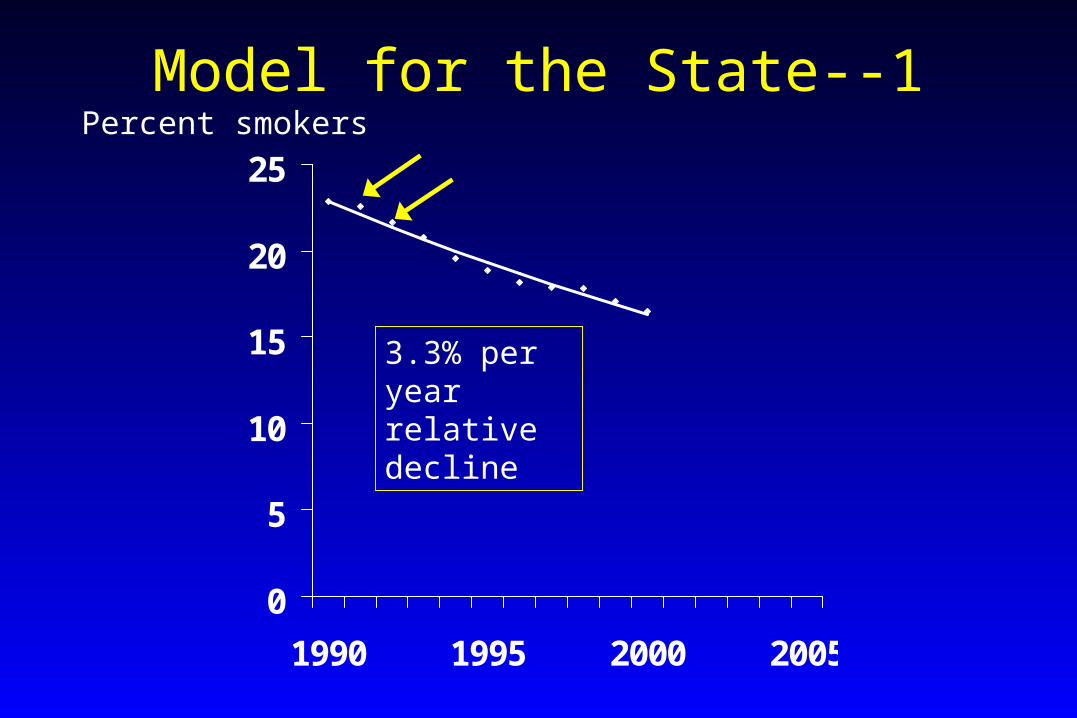
Model for the State--1
0
5
10
15
20
25
1990 1995 2000 2005
Percent smokers
3.3% per year relative decline
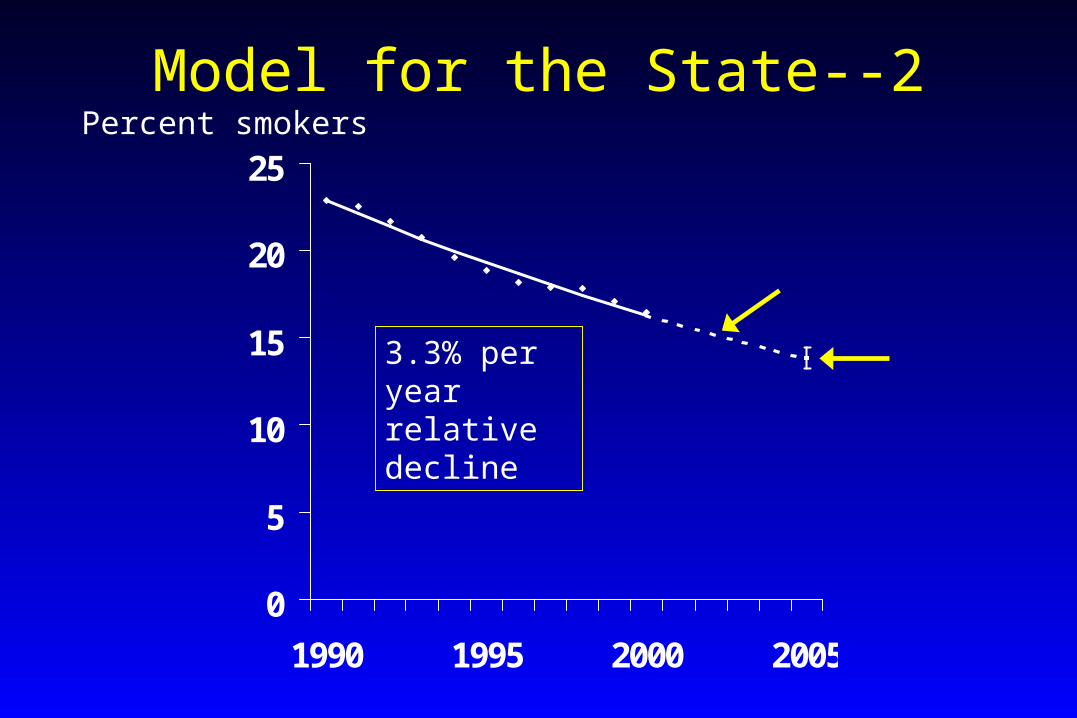
Model for the State--2
0
5
10
15
20
25
1990 1995 2000 2005
Percent smokers
3.3% per year relative decline
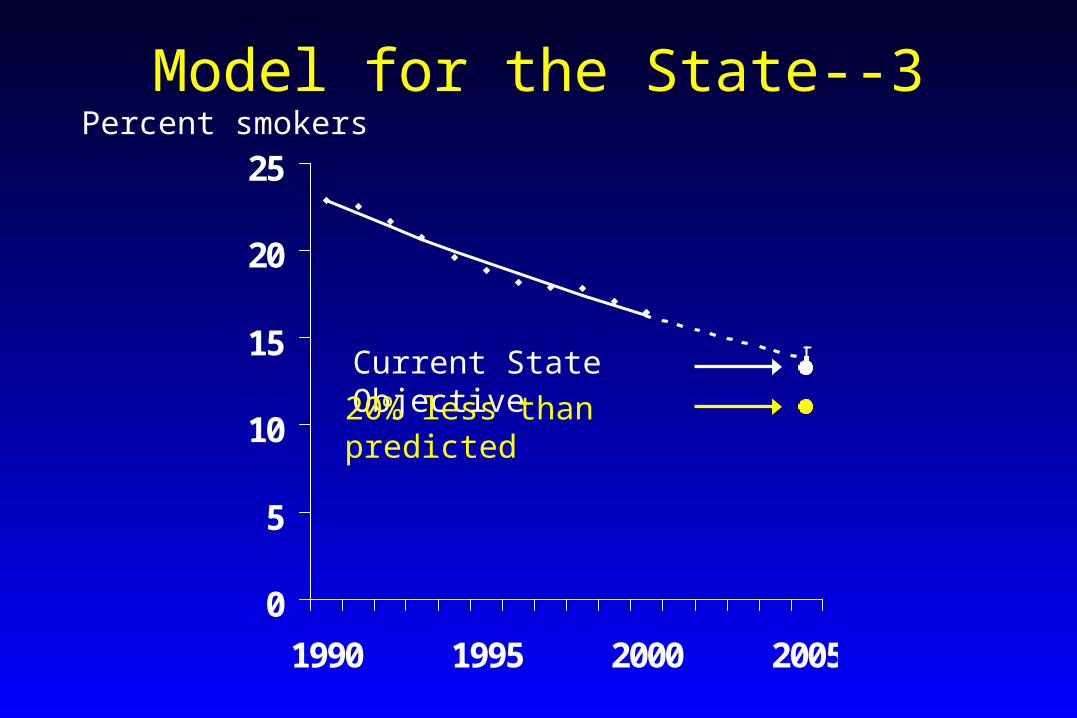
Model for the State--3
0
5
10
15
20
25
1990 1995 2000 2005
Percent smokers
Current State Objective
20% less than predicted
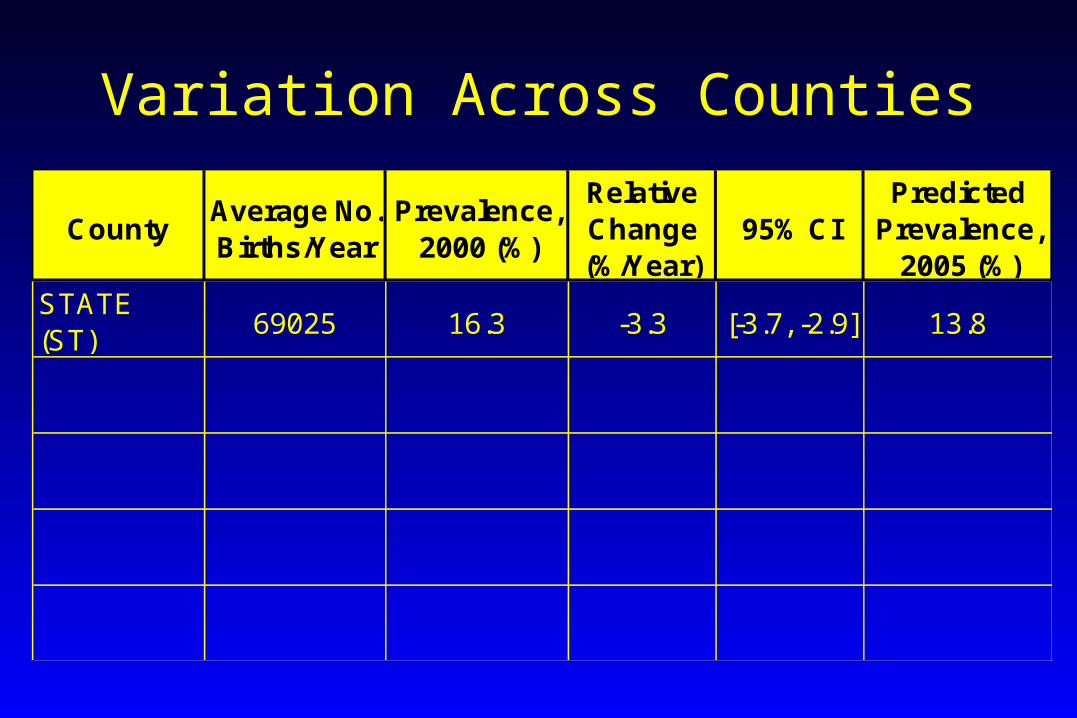
Variation Across Counties
CountyAverage No. Births/Year
Prevalence, 2000 (%)
Relative Change (%/Year)
95% CIPredicted
Prevalence, 2005 (%)
STATE (ST)
69025 16.3 -3.3 [-3.7, -2.9] 13.8
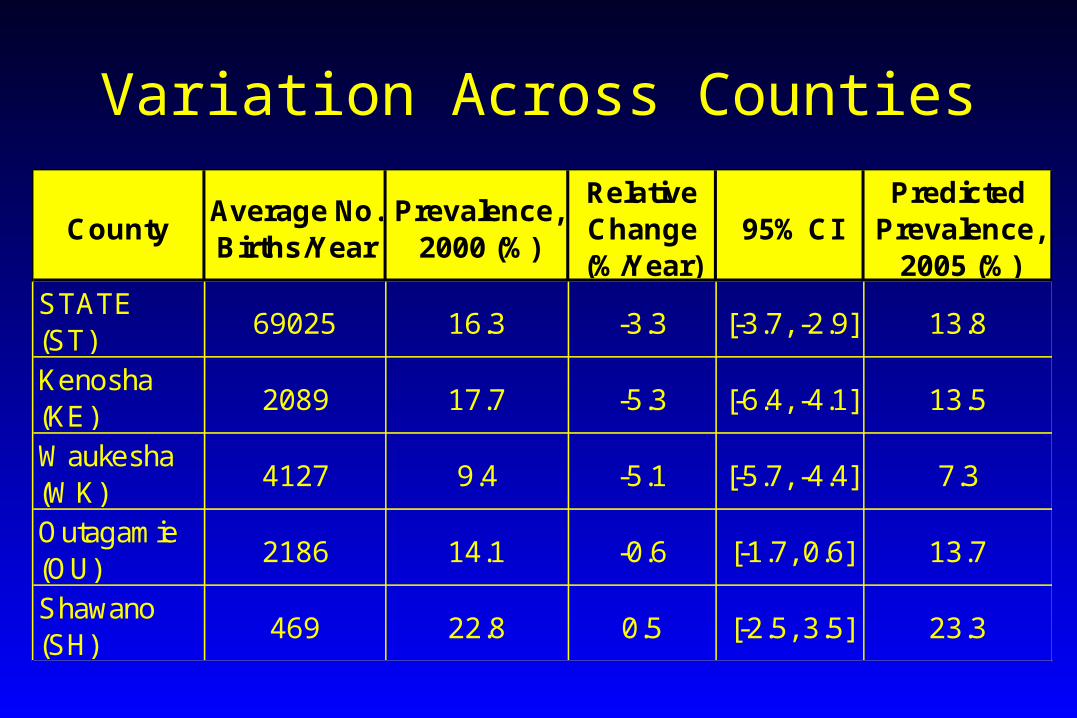
Variation Across Counties
CountyAverage No. Births/Year
Prevalence, 2000 (%)
Relative Change (%/Year)
95% CIPredicted
Prevalence, 2005 (%)
STATE (ST)
69025 16.3 -3.3 [-3.7, -2.9] 13.8
Kenosha (KE)
2089 17.7 -5.3 [-6.4, -4.1] 13.5
Waukesha (WK)
4127 9.4 -5.1 [-5.7, -4.4] 7.3
Outagamie (OU)
2186 14.1 -0.6 [-1.7, 0.6] 13.7
Shawano (SH)
469 22.8 0.5 [-2.5, 3.5] 23.3
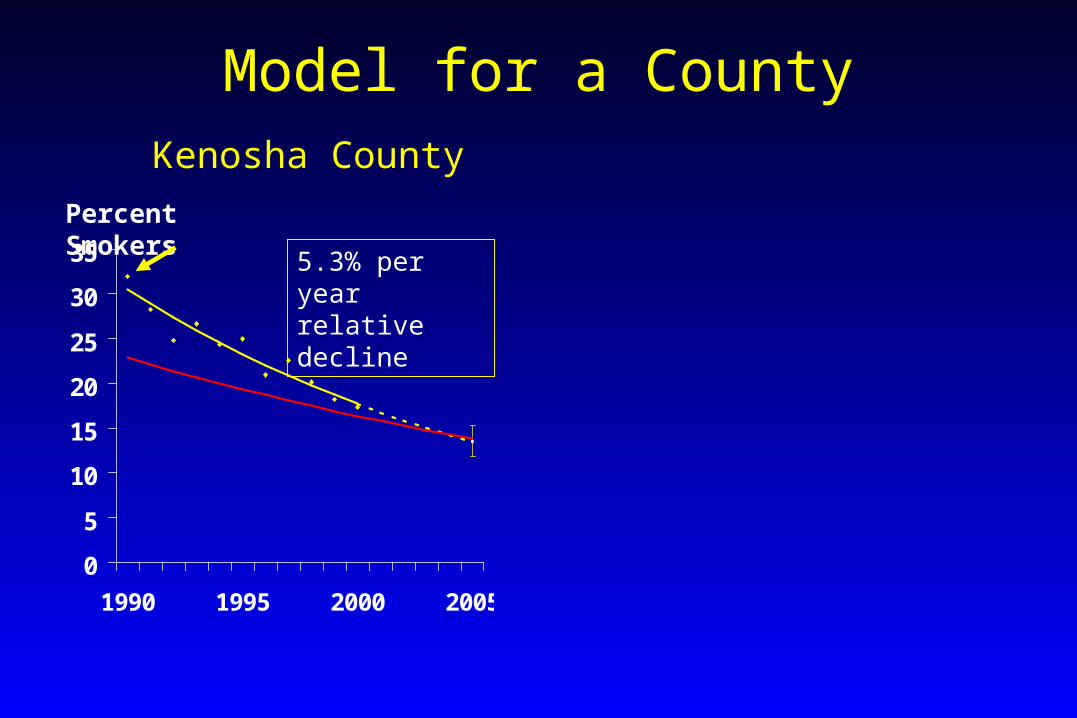
Model for a County
0
5
10
15
20
25
30
35
1990 1995 2000 2005
Kenosha County
Percent Smokers
5.3% per year relative decline
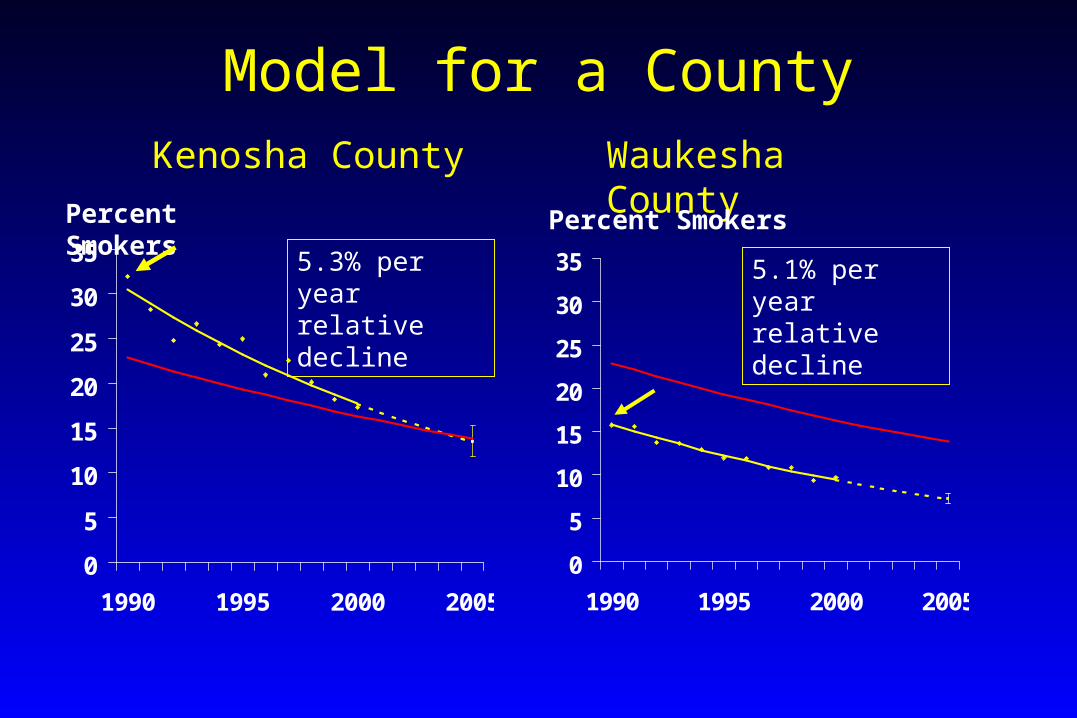
Model for a County
0
5
10
15
20
25
30
35
1990 1995 2000 2005
Kenosha County
0
5
10
15
20
25
30
35
1990 1995 2000 2005
Waukesha County
Percent SmokersPercent Smokers
5.3% per year relative decline
5.1% per year relative decline
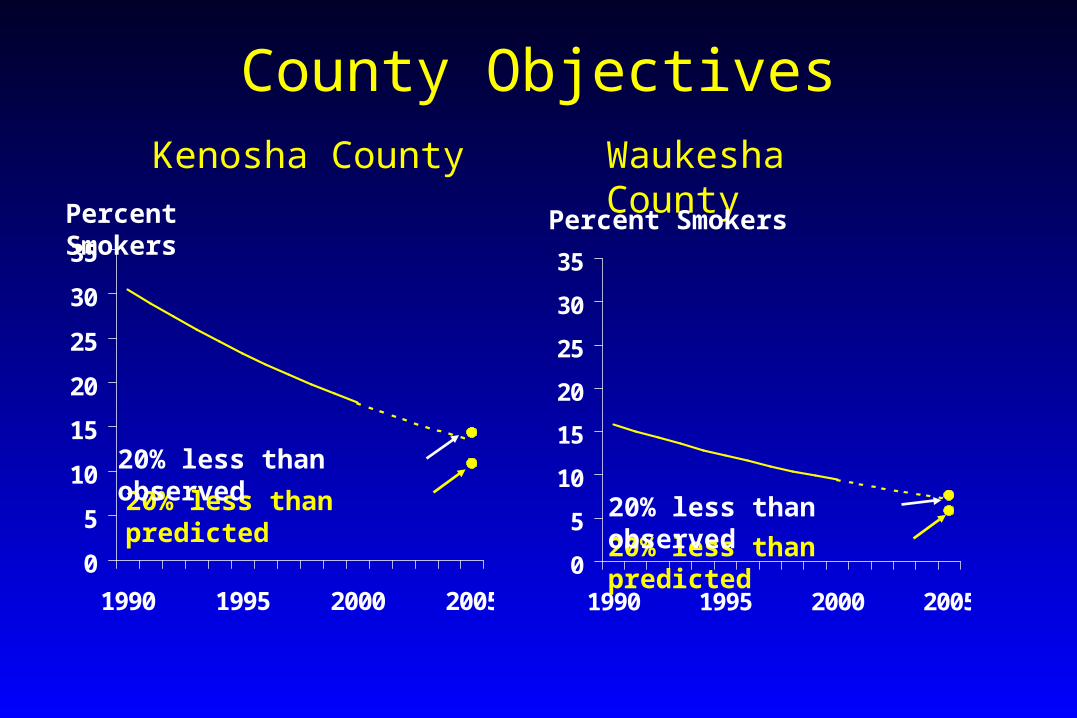
County Objectives
0
5
10
15
20
25
30
35
1990 1995 2000 2005
Kenosha County
0
5
10
15
20
25
30
35
1990 1995 2000 2005
Waukesha County
Percent SmokersPercent Smokers
20% less than predicted
20% less than predicted
20% less than observed
20% less than observed
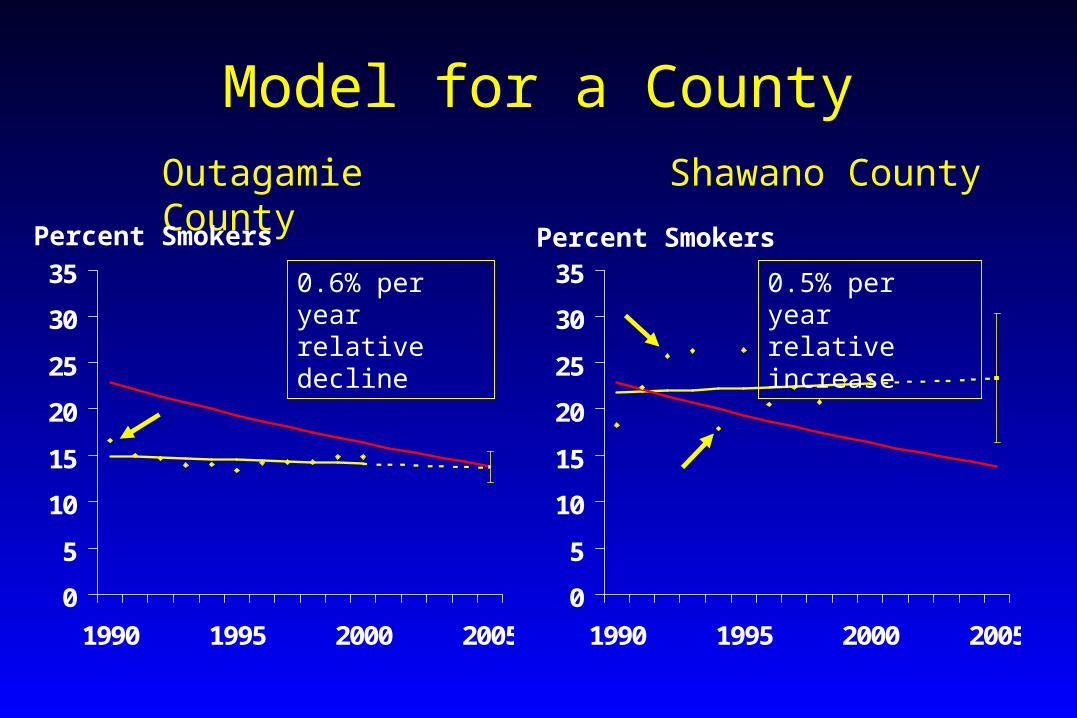
Model for a County
0
5
10
15
20
25
30
35
1990 1995 2000 2005
Percent Smokers
Shawano County
0
5
10
15
20
25
30
35
1990 1995 2000 2005
Outagamie County
Percent Smokers
0.5% per year relative increase
0.6% per year relative decline
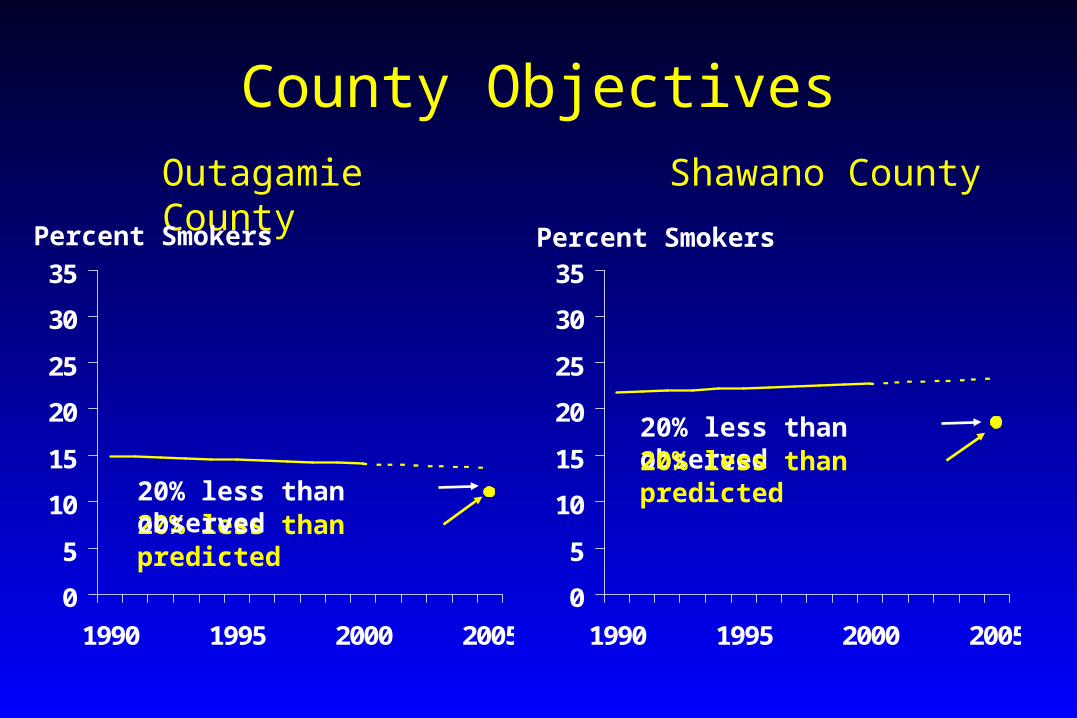
County Objectives
0
5
10
15
20
25
30
35
1990 1995 2000 2005
Percent Smokers
Shawano County
0
5
10
15
20
25
30
35
1990 1995 2000 2005
Outagamie County
Percent Smokers
20% less than predicted20% less than observed
20% less than observed20% less than predicted
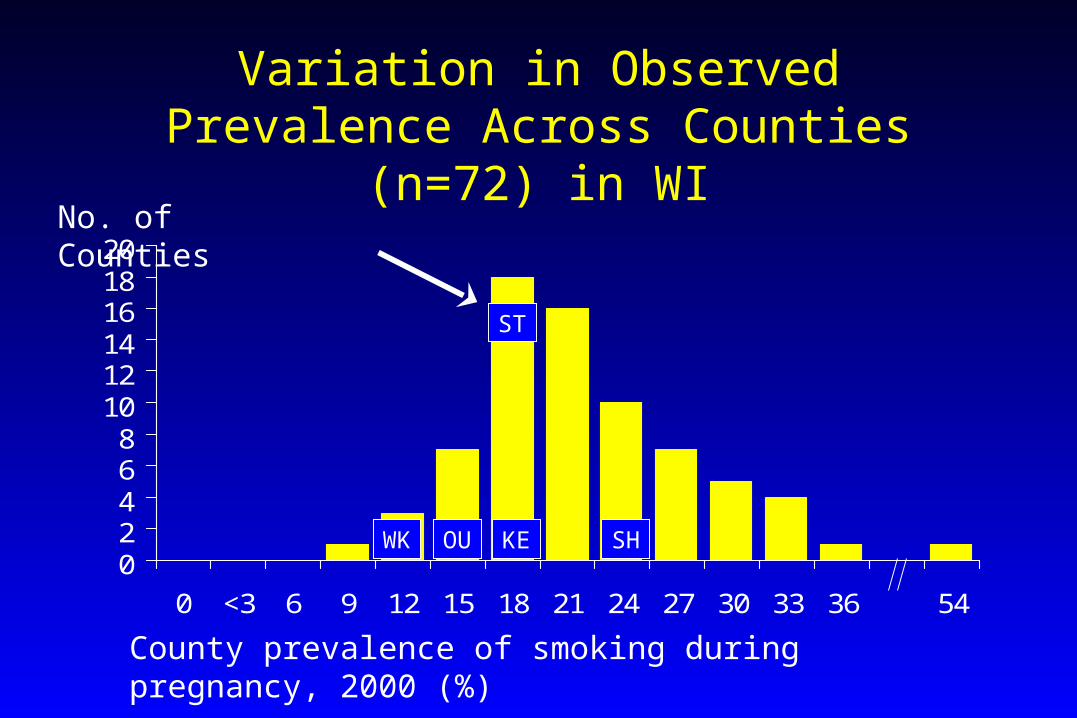
Variation in Observed Prevalence Across Counties (n=72) in WI
02468101214161820
0 <3 6 9 12 15 18 21 24 27 30 33 36 54
WK KE SH
ST
OU
County prevalence of smoking during pregnancy, 2000 (%)
No. of Counties
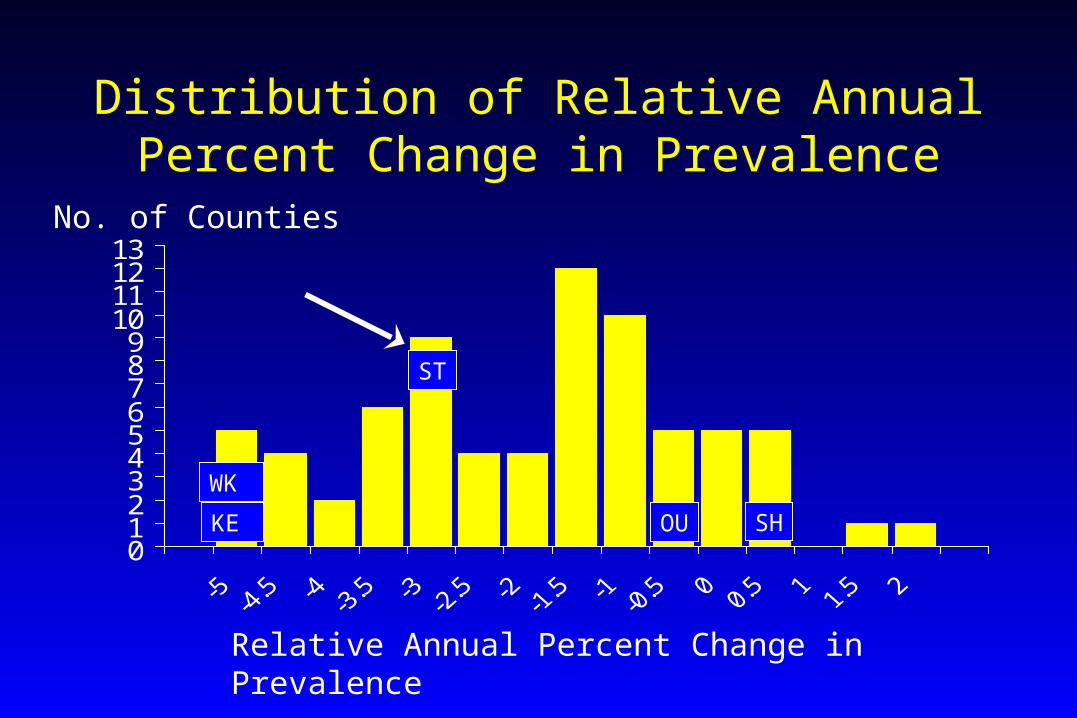
Distribution of Relative Annual Percent Change in Prevalence
012345678910111213
ST
KE
WK
OU SH
No. of Counties
Relative Annual Percent Change in Prevalence
Limitations of Birth Certificates
• Collects data on smoking in most but not all states
• Data on women whose pregnancies result in live birth
• Underestimates prevalence (self-report bias)
• Link with overall smoking prevalence still being made
Application to Evaluation
• Within Communities:– Reflect on past progress– Set challenging objectives– Evaluate the impact of new efforts
• Across Communities:– Comparisons can be made if data is
consistent across jurisdictions
Summary of Results
• Substantial local variation exists:– Prevalence– Rates of change in prevalence– Local objectives should reflect variation
• Current methods for setting objectives are inadequate at the local level:– In WI, ¼ of counties & the State are
expected to meet 20% less than observed rate (2000)
Recommendations
• Use local data to model local trends – Data: birth certificates– Analysis: linear regression models of trends
in prevalence – Predict future prevalence
• Set objectives as a percent less than predicted
Acknowledgments
• Wisconsin Department of Health and Family Services– Kate Kvale, Randy Glysch
• Monitoring and Evaluation Program– Ann Christiansen, David Ahrens
• Wisconsin Tobacco Control Board• Funding: Agency for Healthcare Research
and Quality grant 5 T32 HS00083
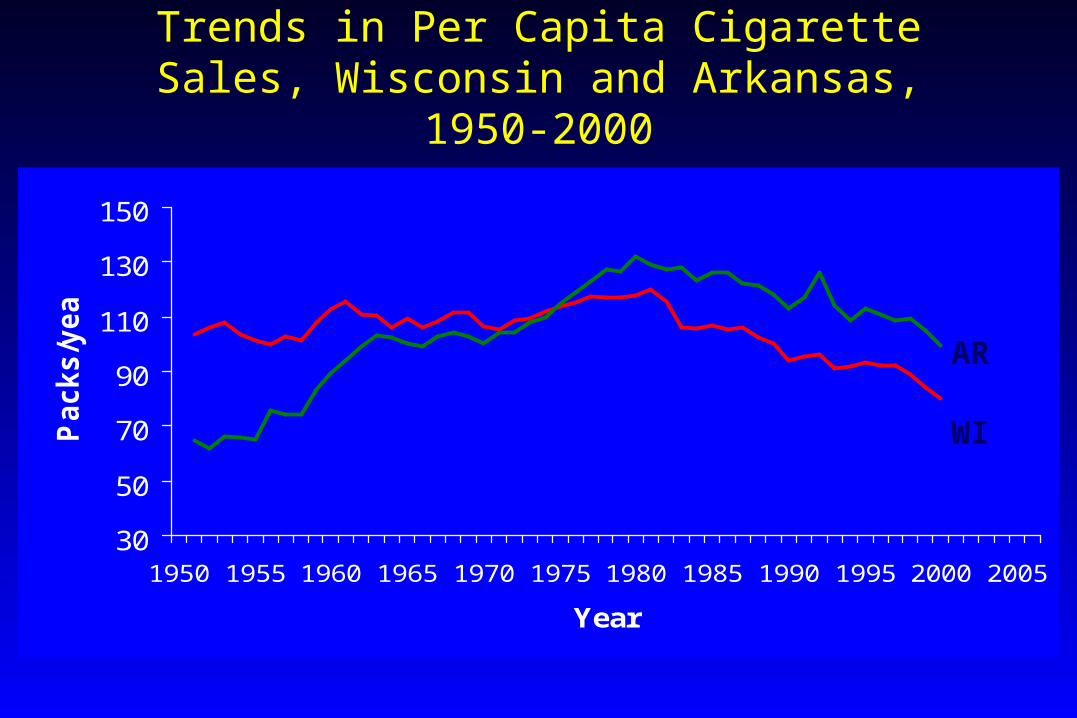
Trends in Per Capita Cigarette Sales, Wisconsin and Arkansas, 1950-2000
30
50
70
90
110
130
150
1950 1955 1960 1965 1970 1975 1980 1985 1990 1995 2000 2005
Year
Packs/y
ear
AR
WI
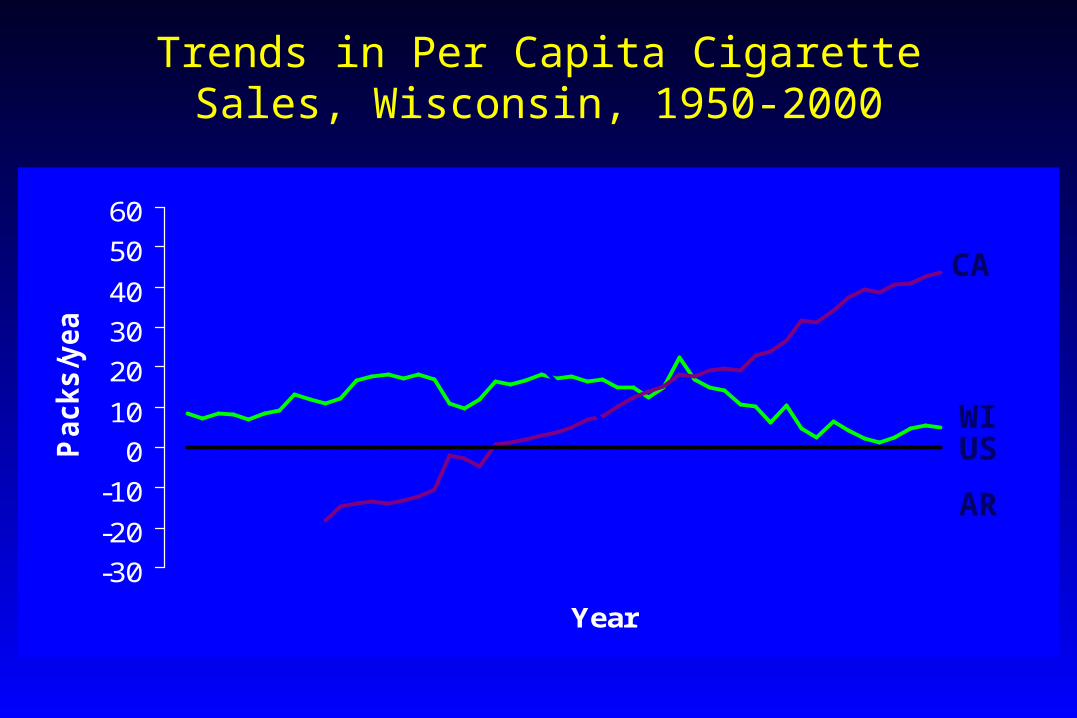
Trends in Per Capita Cigarette Sales, Wisconsin, 1950-2000
-30
-20
-10
0
10
20
30
40
50
60
Year
Packs/y
ear
CA
WI
AR
US

Trailer slide
• 24 slides x 1 set = 24 total slides
• Erich Mussak (265-9931)
• 1 set out of 1 in order
• Monitoring and Evaluation Program (WTCB)